Article

Machining Center Opportunistic Maintenance Strategy Using Improved Average Rank Method for Subsystem Reliability Modeling

1
Key Laboratory of CNC Equipment Reliability of Ministry of Education, Jilin University, Changchun 130022, China
2
School of Mechanical and Aerospace Engineering, Jilin University, Changchun 130022, China
3
College of Communication Engineering, Jilin University, Changchun 130022, China
*
Author to whom correspondence should be addressed.
Appl. Sci. 2025, 15(12), 6944; https://doi.org/10.3390/app15126944
Submission received: 2 May 2025 / Revised: 6 June 2025 / Accepted: 17 June 2025 / Published: 19 June 2025

Abstract

:
Machining centers are complex systems that consist of multiple subsystems. When maintaining these subsystems, considering opportunistic maintenance can prevent frequent shutdowns during the machining process and reduce costs. This paper proposes an opportunistic maintenance strategy for machining centers. Firstly, the reliability of the machining center subsystem was modeled, which serves as the basis for determining when to repair a subsystem. In this process, an improved average rank method was employed, which considers the time correlation of subsystem failures and can achieve better model-fitting results. In the opportunistic maintenance strategy, imperfect maintenance is considered. Additionally, the strategy includes direct maintenance costs, downtime costs, failure risk costs, and penalty costs for incomplete utilization of subsystems. The opportunistic maintenance threshold helps determine whether other subsystems need to be repaired during this maintenance opportunity. The optimization objective is to minimize the total cost within the specified operating time. By modeling the reliability of subsystems using the failure data collected from five machining centers, the opportunistic maintenance strategy can reduce downtime by 10 times, preventive downtime by 29%, and cost by 7%. The results indicate that for machining centers or other complex systems, the opportunistic maintenance strategy mentioned in this article can lead to good results.

1. Introduction

Machining centers are complex systems with several subsystems, so considering opportunistic maintenance when repairing subsystems may avoid frequent downtime during processing and save costs. Accurately evaluating subsystem reliability is essential for rational maintenance strategy development.
Some scholars have studied the reliability modeling of machining center subsystems. Li et al. [1] proposed a probability prediction method for the key subsystems of machining centers. Their research focused on the conditional probability of failure for each key subsystem in the next failure event. However, their study did not consider the time correlation of subsystem failures. Based on the analysis of failure data and the assumption that the failure time follows the Weibull distribution, Yan et al. [2] researched the distribution and reliability functions of each subsystem. The failure data used in their study were large samples. Liu et al. [3] evaluated the reliability of the machining center subsystems and calculated the system MTBF based on the MTBF of the subsystems. In addition to the machining centers, some researchers are concerned about the reliability evaluation of the subsystems. Gu et al. [4] applied the Pagerank algorithm to analyze the failure correlation of CNC lathe subsystems and optimize the impact of each subsystem, establishing a reliability model for CNC lathe subsystems. Liu et al. [5] modeled the CNC grinding machine subsystem by different distributions, and the reliability of the CNC grinding machine was evaluated through Monte Carlo simulation. Parkash and Tewari [6] analyzed the performance of the subsystems of the SPVC line subsystem using the Markov method under the assumption of exponential distribution. Han et al. [7] modeled the reliability of repairable subsystems within the framework of competing and complementary risks under the assumption of exponential distribution. Pandey [8] evaluated the reliability of dragline subsystems. Shouman et al. [9] calculated the subsystem reliability of the Reactor Protection System using the Support Vector Regression (SVR) method. Zhao et al. [10] represented Man, Machines, Materials, Management, and Environment (4M1E) as subsystems in complex chemical production processes and similarly employed the SVR method to evaluate the reliability of these aspects. Nuryanto et al. [11] evaluated the performance of the NPK fertilizer production line subsystems through indicators such as reliability, availability, maintainability, and dependability. There is relatively little research on subsystem reliability modeling, especially in machining center subsystems, and there is no reasonable consideration of the time correlation between subsystems. This paper proposes an improved average rank method to model subsystem reliability, which considers the downtime of the studied subsystem caused by other subsystem failures as censored data. Compared to the average rank method in the previous study [12], it considers not only the order of censored data but also their positions [13]. Overall, the improved average rank method takes into account the time correlation between subsystems and is suitable for situations where the failure data of the machining center are a small sample. It can integrate the failure information of the entire machine and improve modeling accuracy.
After rational modeling of the subsystems, this article emphasizes how to arrange reasonable maintenance plans to help save costs and improve equipment availability. Opportunistic maintenance serves as an effective strategy by utilizing the downtime of one subsystem to conduct maintenance on other subsystems that are nearly due for maintenance. Shi et al. [14] proposed a risk-based opportunistic maintenance approach for multi-station manufacturing systems that considers the machine performance–workpiece quality co-effect. The feasibility and correctness are verified through a seal manufacturing system. Li et al. [15] established the joint optimization model of imperfect opportunistic maintenance based on dynamic time window and spare parts inventory. The effectiveness and superiority of the proposed method is demonstrated through a numerical example. Dinh et al. [16] considered both economic and structural dependencies when conducting opportunistic maintenance, and the first opportunistic maintenance threshold e R o is defined to determine whether the component needs maintenance from the perspective of economic dependency. At the same time, the second opportunistic maintenance threshold s R o is defined to determine whether components on the disassembly path need to be maintained through this opportunity. This threshold and opportunistic maintenance are considered from the perspective of structural dependency. The degradation of components is considered a gamma process, and disassembly can cause an impact on the components, resulting in a degradation increment. Wu et al. [17] proposed an imperfect maintenance–opportunistic maintenance strategy and applied it to CNC lathe, using the decreasing service life factor and increasing failure rate factor to update the unit failure rate after maintenance. Xu B. and Xu S. [18] considered the opportunistic maintenance strategy for power equipment. The article assumed that the deterioration of the power equipment transmission bay is a homogeneous Markov process. The expected costs were calculated based on this, and as the optimization objective, the optimal inspection rate was obtained. The case study in the article demonstrates that using the proposed opportunistic maintenance can save costs and improve availability. Li et al. [19] optimizes the opportunistic maintenance strategy for multi-unit systems, considering the heterogeneity of unit-level maintenance strategies and the imperfect nature of preventive maintenance. An optimization model for preventive opportunistic maintenance strategies is established, along with a Monte Carlo simulation-based optimization algorithm, offering a novel approach for maintenance strategy formulation of complex electromechanical equipment. The effectiveness and superiority of the proposed model in reducing maintenance costs are demonstrated through a case study on a CNC gear grinding machine. Zhao et al. [20] proposed an opportunistic maintenance strategy for a two-unit series system. The life distribution of component B follows an exponential distribution. Component A has a self-healing mechanism, and impact can cause its state to degrade. The failure of component B will create opportunities for component A to repair. The comparison between the strategy of using only preventive maintenance in the article proves that using opportunistic maintenance can save costs. Cheng et al. [21] studied the opportunistic maintenance of the catenary system of high-speed railways, with a focus on selecting proper reliability margins. Su and Wu [22] started with the actual maintenance of offshore wind farms, considering the impact of wind speed on maintenance accessibility. Based on the traditional failure rate model, the wind turbine state is determined by the effective age. For opportunistic maintenance, event-based opportunistic maintenance generated by environmental impacts, failure-based opportunistic maintenance, and age-based opportunistic maintenance are included. All three types of opportunistic maintenance contribute to cost reduction. Xie et al. [23] also studied the opportunistic maintenance strategy for offshore wind turbines and demonstrated the effectiveness of opportunistic maintenance. The above literature and other studies not mentioned have demonstrated the usefulness of opportunistic maintenance policies. This article aims to study the opportunistic maintenance strategy of machining centers in order to improve their availability, avoid frequent failures in the production process, and reduce operating costs.
After a failure occurs, it incurs not only downtime costs but also failure risk costs, such as losses caused by failure to complete production tasks on time, equipment damage, or more serious personnel injuries. Some scholars develop maintenance policies from a failure risk perspective. Zheng et al. [24] proposed a preventive maintenance policy pertaining to the corrosion conditions and future risks. A random risk assessment model was established by considering the failure probability with respect to the random corrosion depth and failure consequence with respect to the random corrosion length. Li et al. [25] optimize the maintenance frequency during the life cycle of steel bridges to minimize risk costs. Masud et al. [26] arranged maintenance strategies for sewage pumping station subsystems based on risk ranking. Shafiee et al. [27] considered the impact of failure risk when setting strategy selection criteria and developing maintenance alternatives. Xiong et al. [28] regarded the operation and maintenance departments of electric multiple units as two sides of the game, and regarded failure risk and maintenance costs as two mutually constraining factors, with the reliability threshold of preventive maintenance as the bargaining object. Lou et al. [29] proposed a risk-based maintenance schedule and unit commitment coordination model, with the optimization objective of minimizing the sum of maintenance costs, generation costs, and risk costs. Considering risk costs can effectively control operational risks and significantly improve reliability, it is more reasonable to consider risk costs when arranging a maintenance strategy, which can better ensure operation and improve reliability.
In summary, this article focuses on the reasonable modeling of the reliability of the machining center subsystems, considering opportunistic maintenance in maintenance scheduling, and taking risk costs into account. This article attempts to use the improved average rank method to model the machining center subsystems and then consider the opportunistic maintenance strategy of the entire machine based on the optimal maintenance time arrangement for each subsystem. The remaining part of this article is arranged as follows. Section 2 models the reliability of the machining center subsystems using the improved average rank method. Section 3 includes the arrangement of subsystem maintenance plans and the designation of opportunistic maintenance strategy, and provides the solution process for the optimization model of the maintenance strategy. Section 4 provides a numerical example. Section 5 provides the conclusions.

2. Reliability Evaluation for Machine Center Subsystems Using the Improved Average Rank Method

When a subsystem fails during the operation of a machining center, the entire machine will shut down, which will result in censored time for all other subsystems. The use of the improved average rank method can effectively model censored time. Considering the time correlation, the overall reliability of subsystem modeling can be improved.
The average rank method has been used in previous studies to calculate empirical distribution functions [12]. Its purpose is to correct the rank of failure data when the collected data contain censored data. The progress of the improved average rank method lies in that it not only considers the sorting position of the censored data but also considers the specific time of the censored data and the interval length between adjacent failure data. For the improved average rank method, the rank increment is calculated based on the above information [13]. Therefore, the reliability estimation outcome will be more accurate compared to the average rank method.
The steps of the improved average rank method for reliability evaluation are as follows:
Step 1:
Use the average rank method to obtain the empirical distribution function.
Step 2:
Carry out parameter estimation and obtain the preliminary model.
Step 3:
Use the improved average rank method to obtain new rank increments and updated parameters, and obtain the revised model.

2.1. Average Rank Method

If there are N pieces of adjacent failure time interval and censored time, sort them from small to large, and the order j = 1 , 2 , , N . Simultaneously sort the failure time interval data among them; if there are n pieces of failure time interval data, then the failure time order i = 1 , 2 , , n , and the failure time interval is expressed as t i . The equation of rank increment is as follows:
Δ A i = A i A i 1 = N + 1 A i 1 N j + 2
where A i is the adjusted rank.
Calculate the adjusted rank in sequence. Based on the obtained average rank, substitute it into Equation (2) to calculate the sample empirical distribution function:
F t i = A i A 0 N + N 0
when A 0 = 0.3 , N 0 = 0.4 , the equation is called the approximate median rank formula, which is applicable to situations involving small sample Weibull distribution modeling.

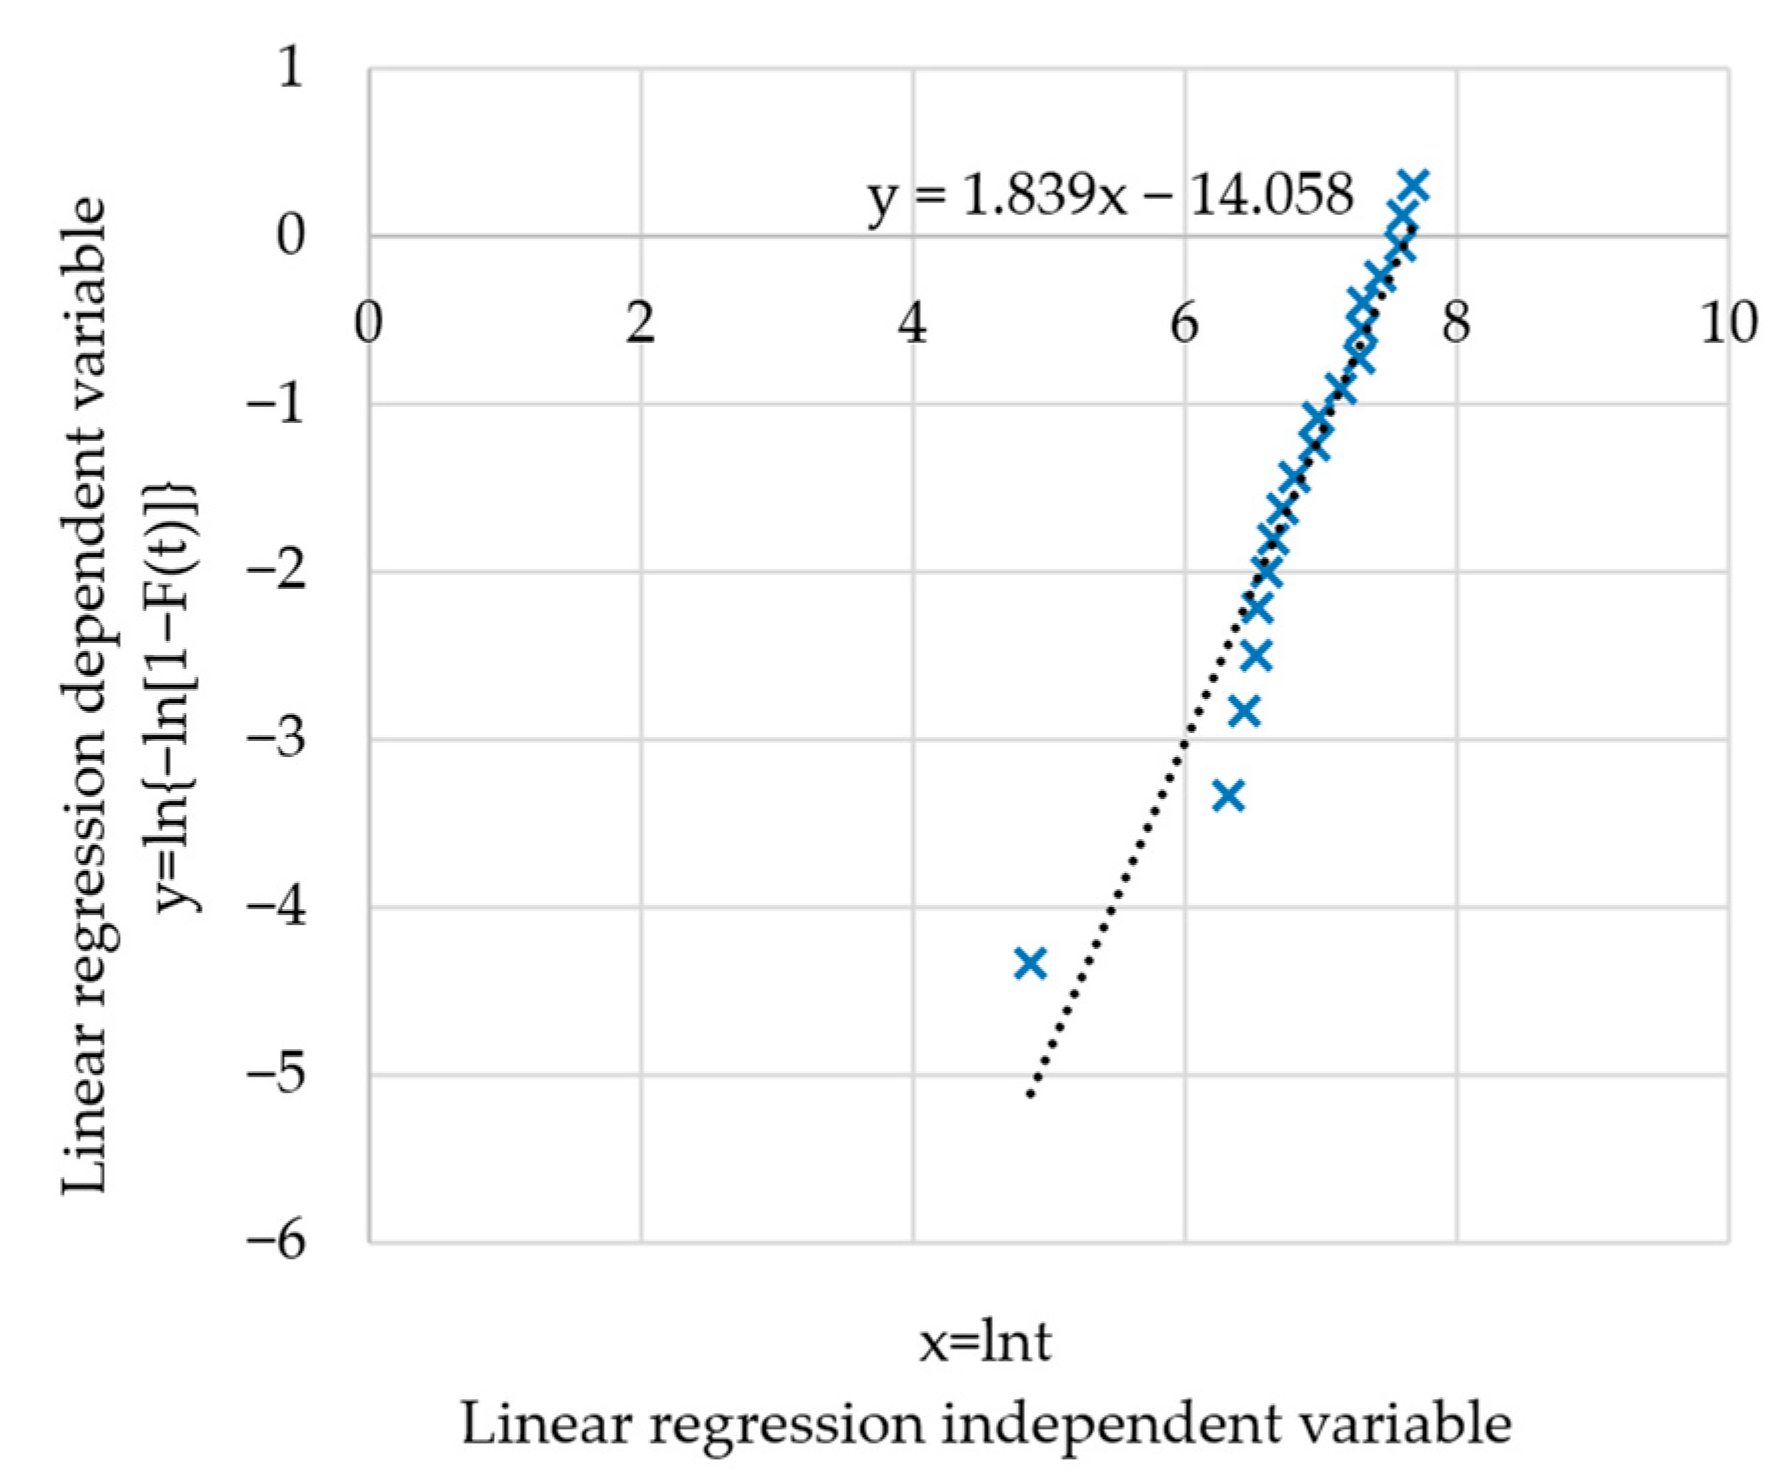
2.2. Reliability Model and Parameter Estimation for Machining Centers

For machining centers, it is often assumed that their failure time follows Weibull distribution. The Weibull distribution has a concise expression, which facilitates subsequent maintenance-related calculations. However, before making such an assumption, validation is required, such as the correlation coefficient and K-S test validation mentioned in Section 4 of this paper. The cumulative distribution function, failure probability density function, reliability function, and failure rate function of the Weibull distribution are shown as follows:
F t = 1 exp t / η β
f t = β t β 1 η β exp t / η β
R t = 1 F t = exp t / η β
λ t = β η t η β 1
After obtaining the empirical distribution function through Equation (2), and bringing it and the failure interval time t i into Equation (3), the Weibull distribution parameter estimation can be obtained by using the least square method.
The left side of Equation (3) is changed to 1 F ( t ) and two logarithmic operations are performed on both ends of the equation to obtain:
ln ln 1 F t = β ln t β ln η
Let y = ln ln 1 F t ,   x = ln t ,   A = β ln η ,   B = β , then
y = A + B x
According to the least square method, the estimated point estimation value of A and B is:
B ^ = i = 1 n x i y i n x y ¯ i = 1 n x i 2 n x ¯ 2 A ^ = y ¯ B ^ x ¯
where x ¯ = i = 1 n x i / n ;   y ¯ = i = 1 n y i / n , and n is the number of samples.
Thus, the parameters of the Weibull distribution can be determined by:
η ^ = e x p A ^ B ^ β ^ = B ^

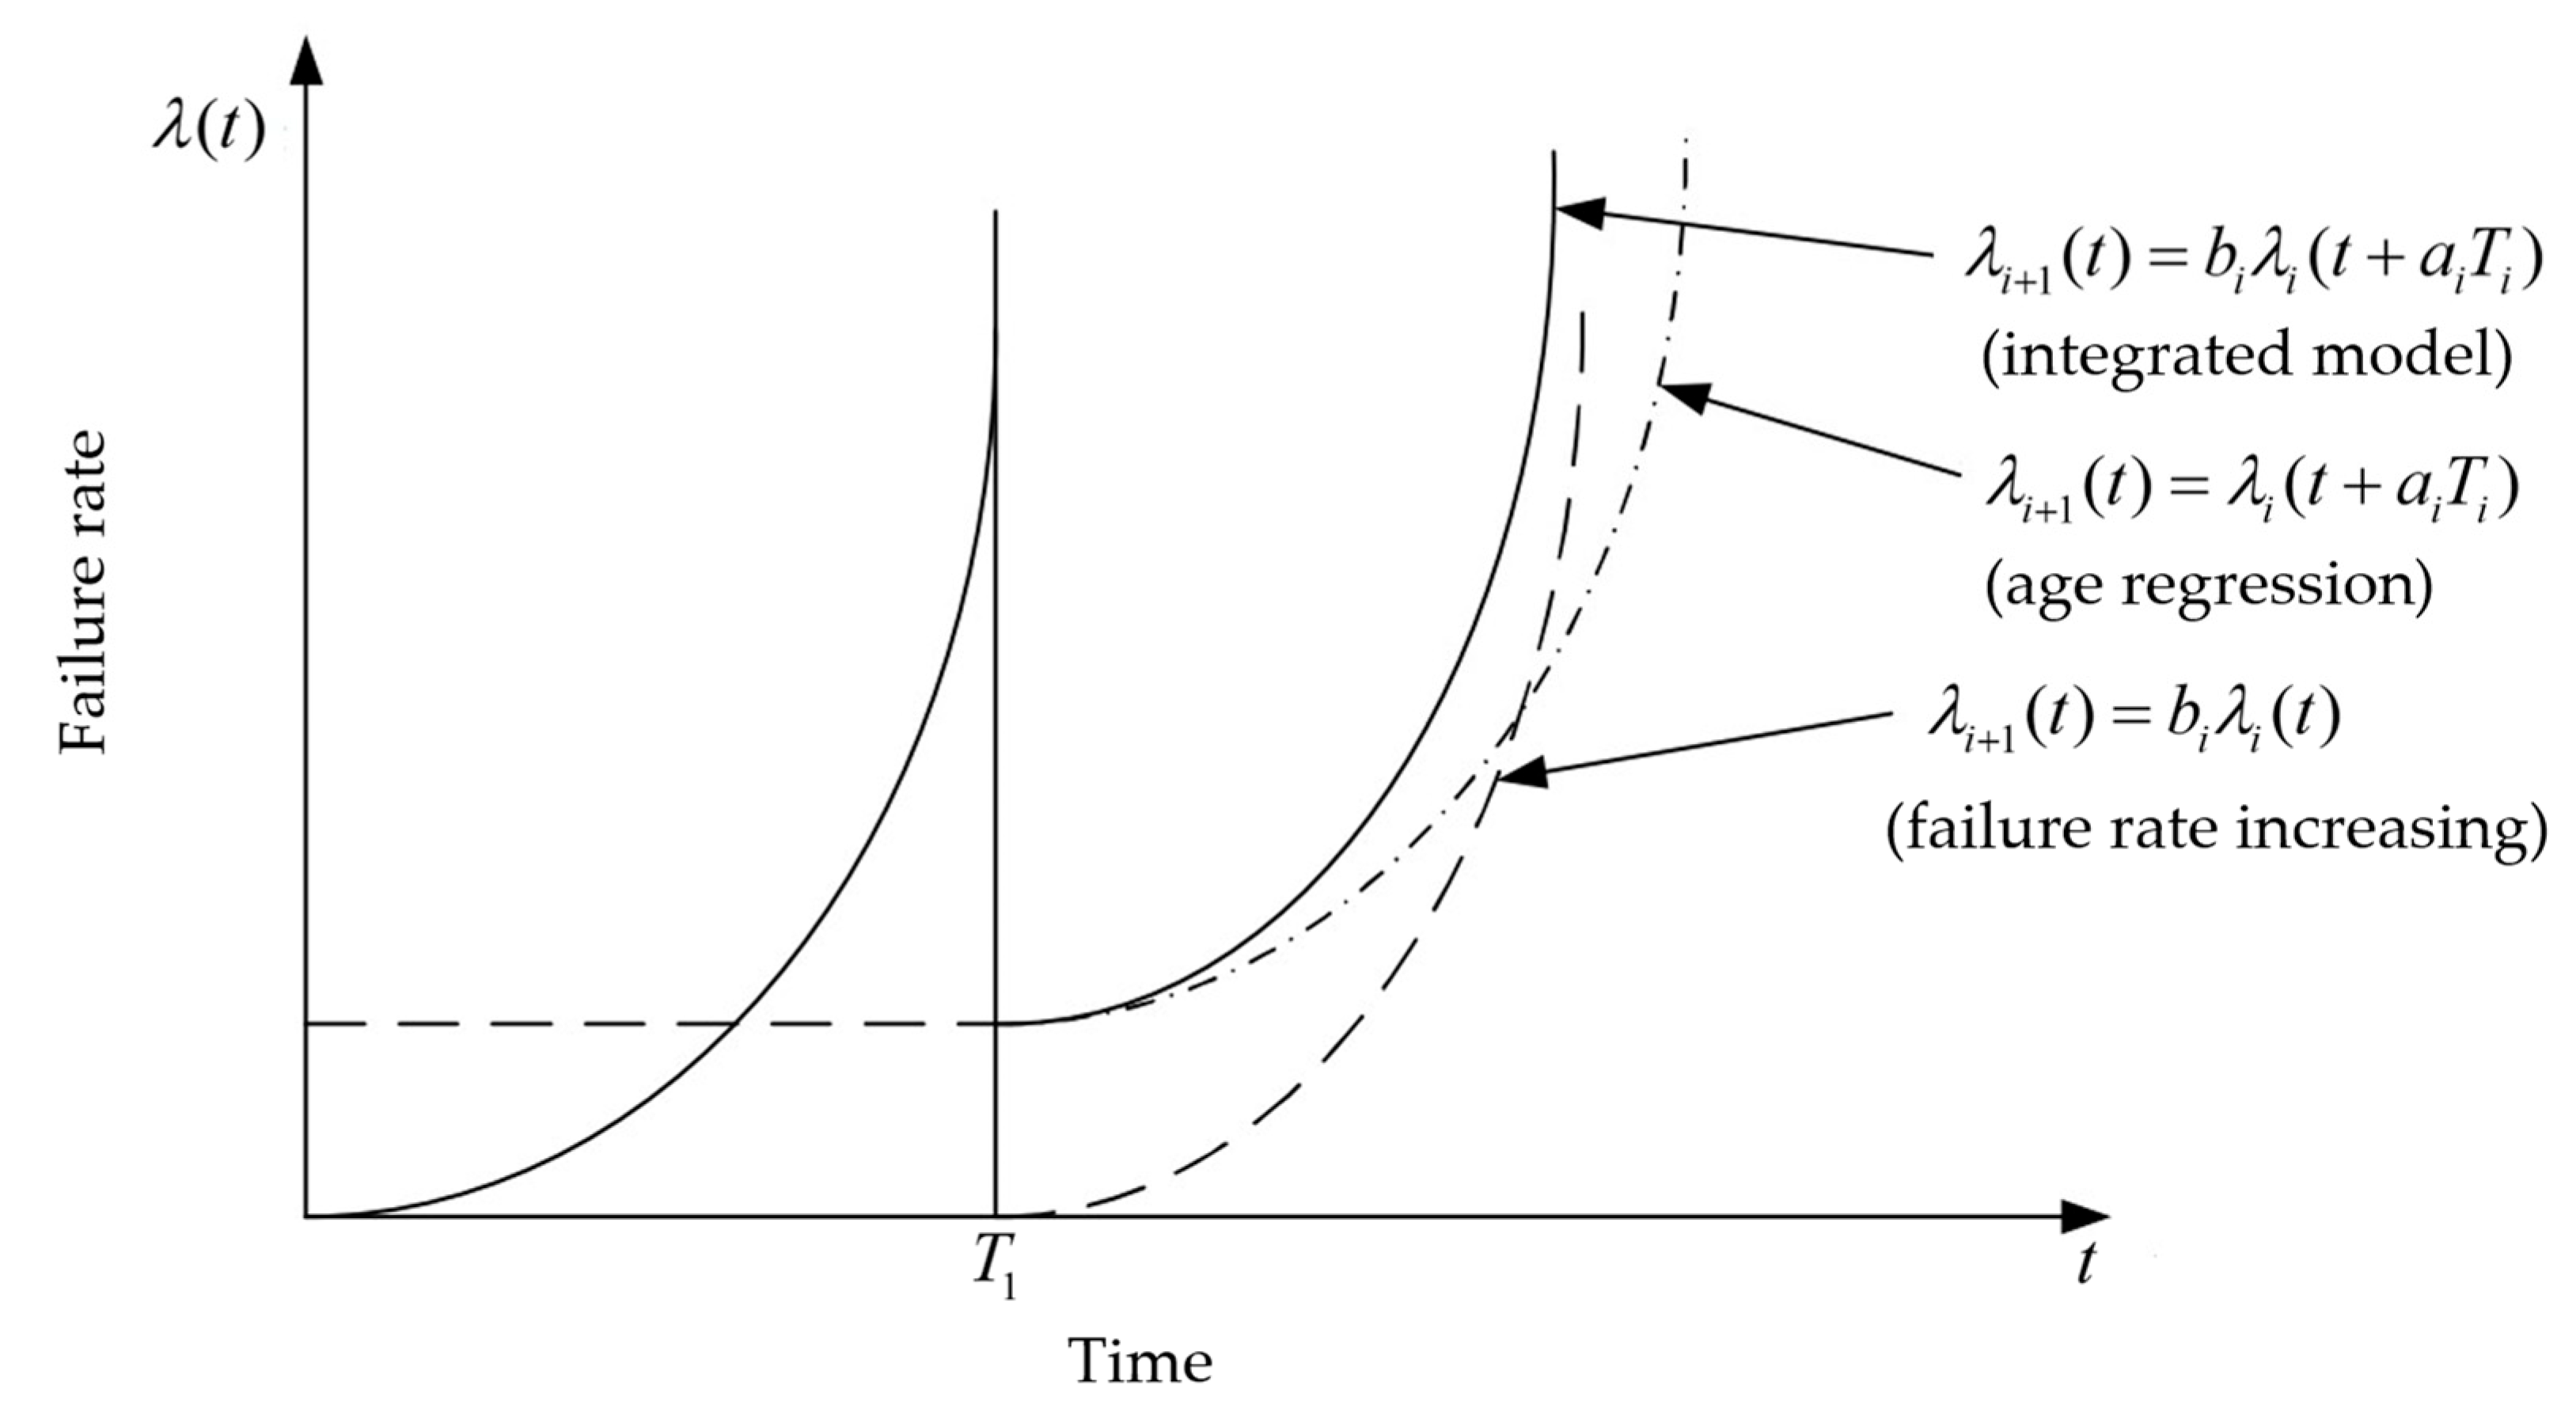
2.3. Improved Average Rank Method

Assuming t j is the censored time, according to the conditional probability formula, the probability I j , i that the equipment does not fail at the censored time t j but does fail during t i 1 , t i i > j is:
I j , i = t i 1 t i f t d t 1 F t j = R t i 1 R t i R t j
At the same time, I j , i is the rank increment for interval t i 1 , t i , which is contributed to by the censored time t j .
If there are M i pieces of censored time data before t i , the rank increment for failure time t i can be expressed by:
I i = j = 1 M i I j , i
Thus, the rank of failure time t i is:
A i = A i 1 + 1 + I i
The updated empirical distribution function expression is:
F t i = A i A 0 N + N 0
where A 0 = 0.3 , N 0 = 0.4 for small sample Weibull distribution modeling.
Perform least squares estimation again based on the updated empirical distribution function to obtain the updated Weibull distribution model parameters.

3. Maintenance Strategy

Opportunistic maintenance refers to maintaining other subsystems that meet the conditions when there is a shutdown due to maintenance of a certain subsystem, which can save resources and improve system availability. To arrange opportunistic maintenance, the first step is to schedule the maintenance time of the subsystem. Therefore, in this section, we will first provide the method for developing the maintenance plan of the subsystem, and then provide the method for arranging opportunistic maintenance.

3.1. Subsystem Maintenance Planning

The maintenance strategy proposed in this paper includes minimal maintenance, preventive maintenance, and preventive replacement. When a subsystem failure occurs, minimal maintenance is carried out, with the maintenance effect being as bad as before, i.e., the same level of reliability as before the maintenance. When the reliability of the subsystem reaches a predetermined limit, preventive maintenance is carried out. This article assumes that the subsystem state after preventive maintenance is between before maintenance and brand new. Due to the deterioration in the health status of the system after multiple maintenances, preventive replacement of the subsystem will be carried out after a certain number of preventive maintenances, with the effect of being repaired as new.
This article uses the age regression factor and failure rate increasing factor to describe the change in failure rate after preventive maintenance of the subsystem.
The failure rate change after one maintenance is:
λ i + 1 ( t ) = b i λ i ( t + a i T i )
where λ i ( t ) is the failure rate function for the i th maintenance cycle, and a i and b i represent the age regression factor and failure rate increasing factor for the i th maintenance cycle, respectively. T i is the length of the i th maintenance cycle, i.e., the maintenance interval. 0 < a i < 1 influences the age after maintenance, which will return to a certain age before the maintenance, and b i > 1 indicates the change in the steepness of the failure rate function after maintenance. This means the failure rate will increase faster and subsystems will fail more quickly. The failure rate evolution model is shown in Figure 1.
When arranging maintenance plans for subsystems, the reliability threshold R h and number of maintenance cycles N are used as decision variables, and the cost rate is minimized as the optimization objective. When the reliability of the subsystem reaches the reliability threshold, it is determined whether to perform preventive maintenance or replacement based on the ordinal number of maintenance cycles in which the subsystem is located. When the subsystem is in the N th maintenance cycle, preventive replacement will be carried out, and preventive maintenance will be carried out in the previous N 1 cycle.
The length of each maintenance cycle can be determined by the reliability threshold. Firstly, the relationship between the reliability function R ( t ) and the failure rate function λ ( t ) is:
R ( t ) = exp [ 0 t λ ( t ) d t ]
Therefore,
R h = exp [ 0 T 1 λ 1 ( t ) d t ] = = exp [ 0 T i λ i ( t ) d t ]
0 T i λ i ( t ) d t is the number of failures within T i time, and it can also be represented by ln R h .
Maintenance costs include minimum maintenance costs, preventive maintenance costs, preventive replacement costs, downtime loss costs, and failure risk costs.
The minimum maintenance cost C m is the product of the single minimum maintenance cost C s m and the number of maintenances performed.
C m = C s m i = 1 N 0 T i λ i ( t ) d t = N · C s m · ( ln R h )
As the number of preventive maintenances increases, the cost of preventive maintenance will increase. This article assumes that there is a positive linear increment with increasing maintenance time. The cost of the i th preventive maintenance is:
C p m i = C f + i C v
where C f is the fixed cost for preventive maintenance, and C v indicates the fluctuating cost.
C r represents the cost of preventive replacement for subsystems. The maintenance and replacement cost within the cycle is:
C p = ( i = 1 N 1 C p m i ) + C r
The downtime loss costs are the product of the downtime cost per unit time and the total downtime. Downtime includes minimum maintenance time, preventive maintenance time, and preventive replacement time. Preventive maintenance time will also increase as the number of maintenances increases.
The equation for downtime loss costs is:
C d = [ t c m · N · ( ln R h ) + i = 1 N 1 t p m i + t r ] · c d
where c d is the downtime cost per unit time, t c m is the minimum maintenance average time, t p m i is the time for the i th preventive maintenance, and t r is the time for the preventive replacement.
Preventive maintenance time is similar to preventive costs. As the number of maintenances increases, the maintenance time increases. The time for the i th preventive maintenance is:
t p m i = t f + i t v
where t f is the fixed maintenance time for preventive maintenance, and t v indicates the fluctuating maintenance time.
The failure of machining centers may also cause safety accidents or personal and property losses, which will be called failure risk costs. The equation for calculating failure risk costs is:
C r i s k = c r i s k · i = 1 N 0 T i λ i ( t ) d t = c r i s k · N · ( ln R h )
where c r i s k is the risk costs of a single failure.
Therefore, the total cost C t o t a l of a subsystem in the whole maintenance cycle, that is, from the time the subsystem starts running until the preventive replacement is complete, when the system is considered to be back to its initial state, can be obtained as:
C t o t a l = C m + C p + C d + C r i s k
The total time of the whole maintenance cycle is:
T t o t a l = i = 1 N T i + t r + i = 1 N 1 t p m i + N · ( ln R h ) · t c m
Lastly, the maintenance cost rate per unit time function of subsystems within the maintenance cycle can be expressed as:
C ( N , R h ) = C t o t a l T t o t a l
By minimizing the maintenance cost rate by optimizing N , R h , the maintenance plan of subsystems can be obtained. Maintenance intervals can be calculated by Equation (17).

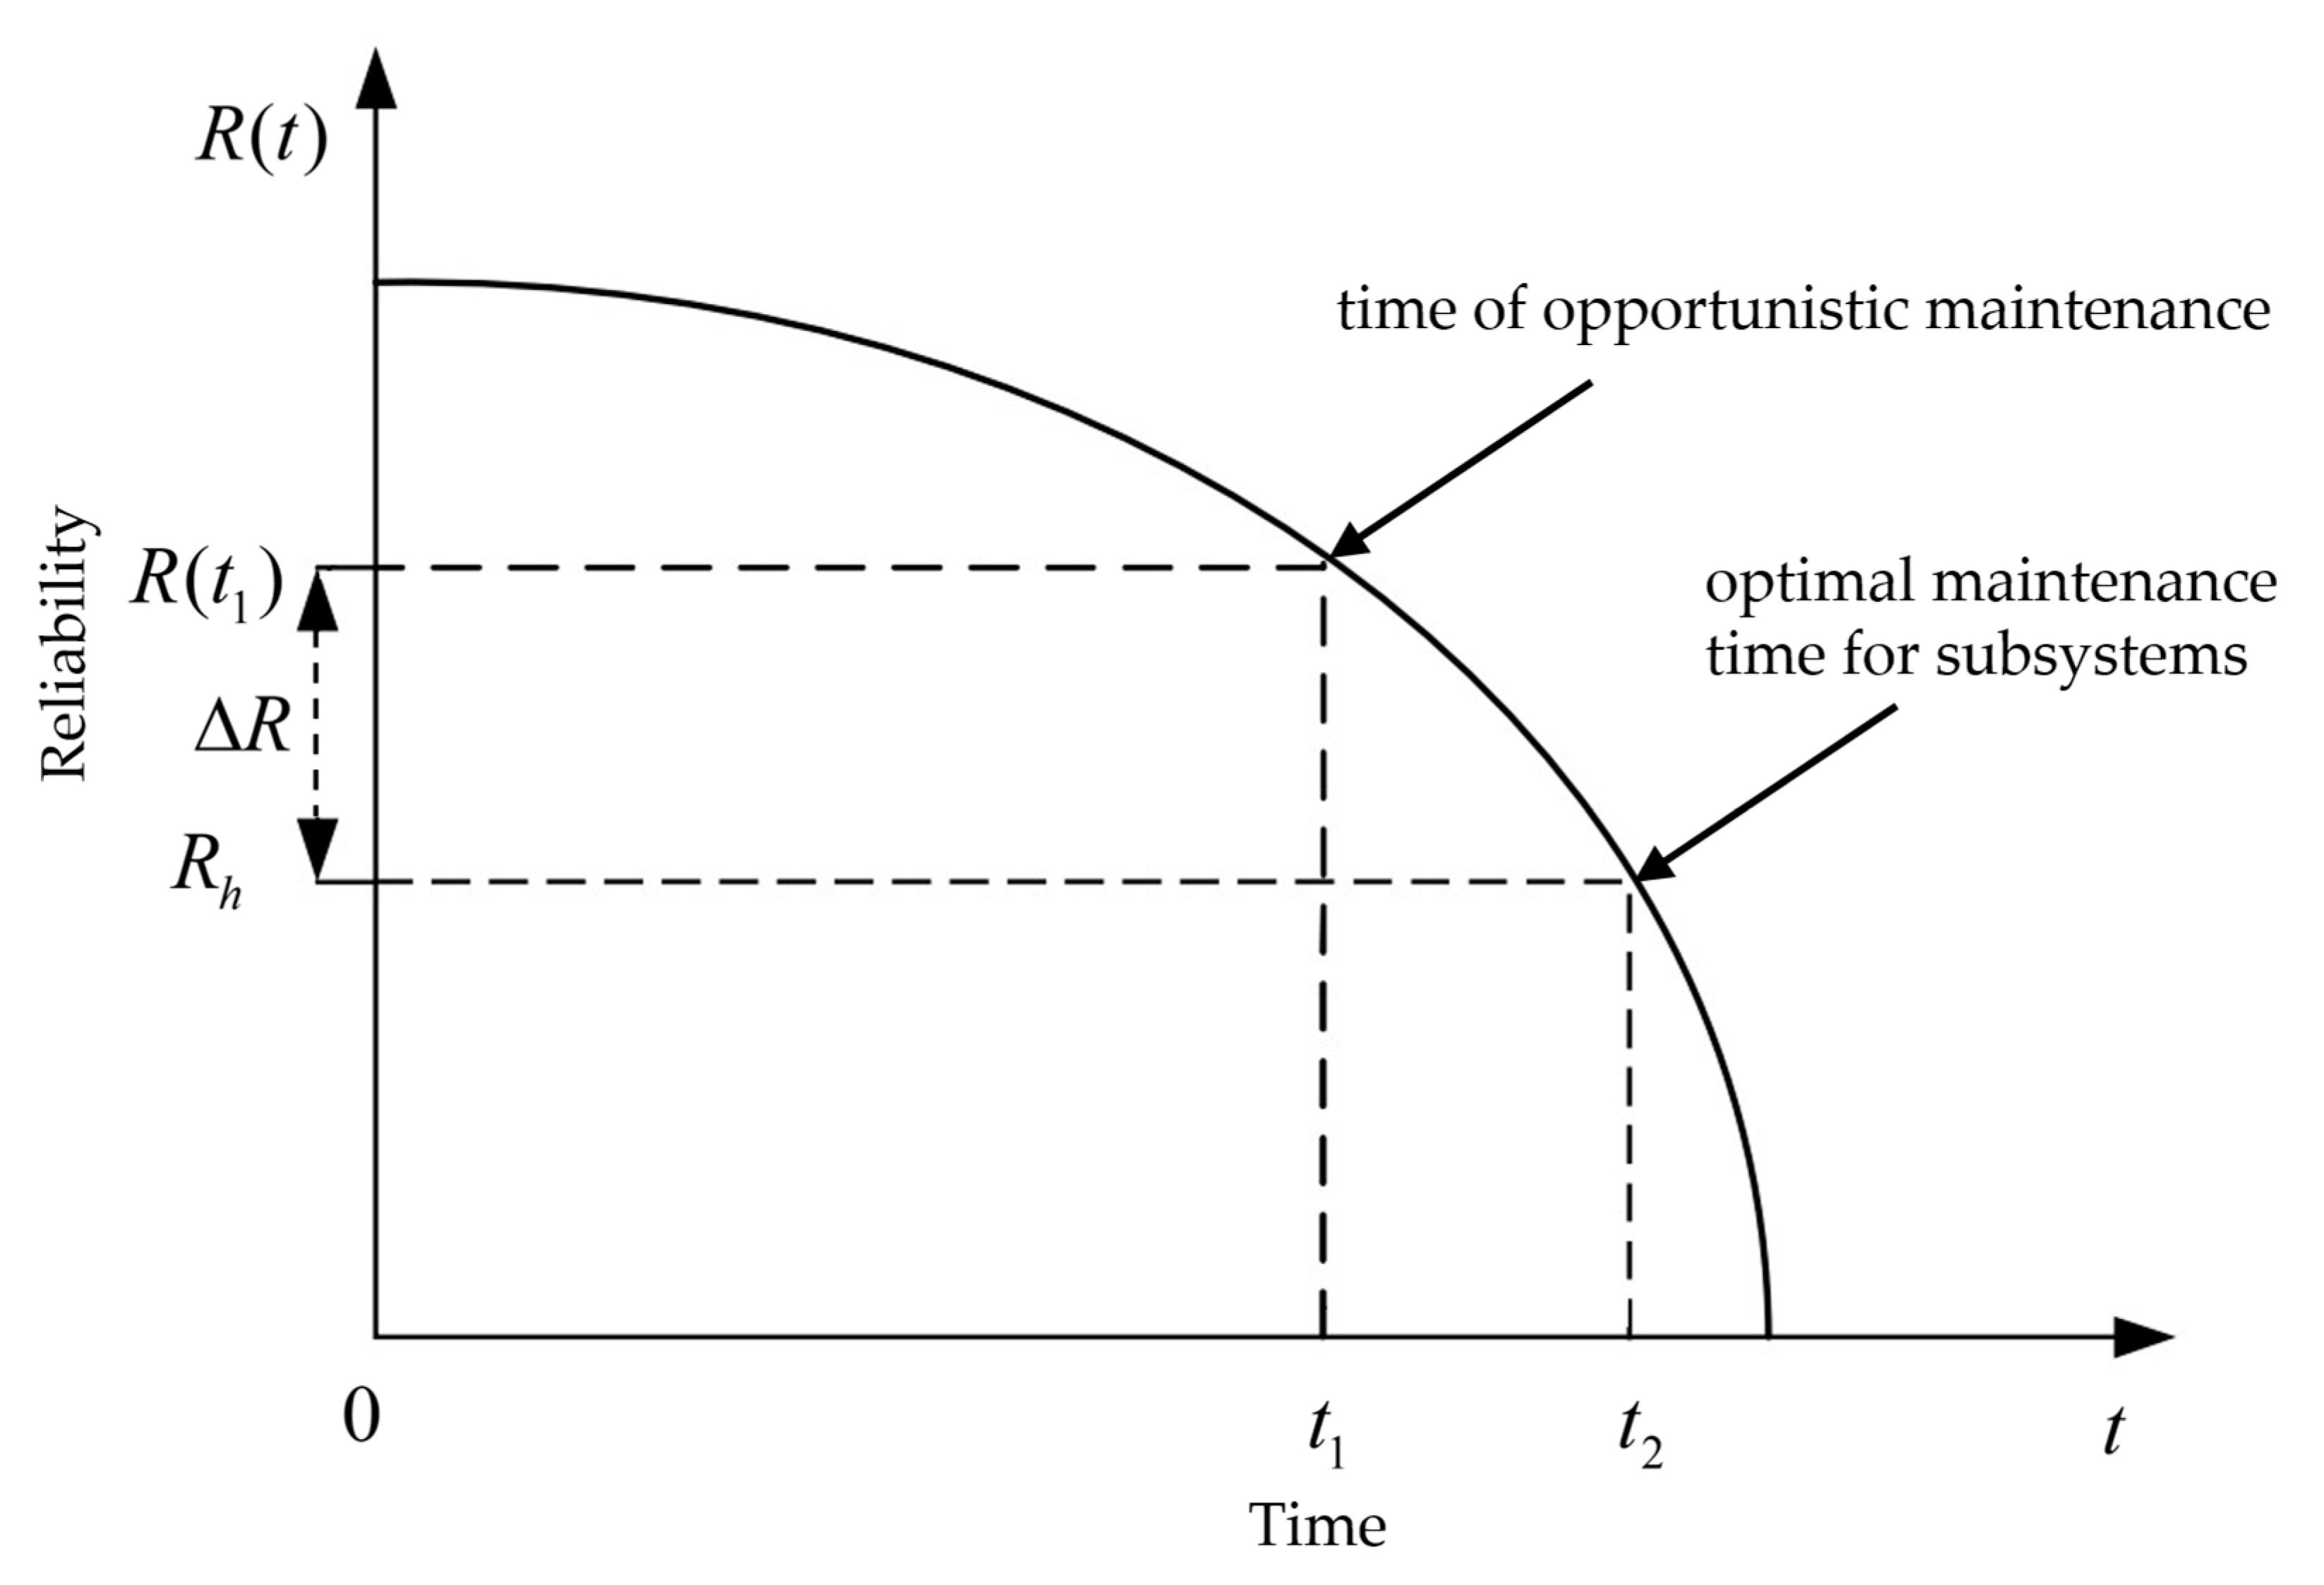
3.2. Opportunistic Maintenance

From the perspective of only arranging a maintenance plan for subsystems, this will lead to frequent downtime of the machining center. Considering the maintenance time of the subsystems comprehensively, using the maintenance downtime to carry out maintenance of other subsystems that are about to implement preventive maintenance will reduce the downtime of the machining center, improve availability, and reduce costs. Therefore, based on the contents in Section 3.1, this section considers opportunistic maintenance, introduces the threshold value of opportunistic maintenance Δ R to judge whether each subsystem carries out preventive opportunistic maintenance or replacement in the maintenance window, establishes the preventive opportunistic maintenance model of machining centers based on the minimum total cost rate, and develops the overall maintenance strategy of machining centers. The schematic diagram of the opportunistic maintenance strategy is shown in Figure 2.
According to Section 3.1, when the reliability of the subsystems reaches R h , preventive maintenance or replacement is carried out on the subsystems. At this time, a maintenance window will be generated, and an opportunistic maintenance threshold Δ R will be used to determine whether to perform opportunistic maintenance or replacement on the other subsystems. Assuming a subsystem has a running time of t , the corresponding reliability is R ( t ) , and if R ( t ) > R h + Δ R , the system will continue to operate without implementing preventive maintenance or replacement. If R h < R ( t ) < R h + Δ R , opportunistic maintenance or replacement is performed based on the number of times the subsystem has been maintained. When the system reliability R ( t ) reaches the preventive maintenance threshold R h , as described in the previous Section 3.1, preventive maintenance or replacement of the subsystem is carried out. Through the above content, the maintenance actions for the subsystems can be determined based on the reliability of the subsystem at any time.
Next, we need to establish an opportunistic maintenance model to determine the maintenance cost rate of the entire machining center after adopting opportunistic maintenance. By minimizing the cost rate, we can obtain appropriate opportunistic maintenance thresholds as the basis for maintenance decisions.
Due to the different maintenance cycle lengths of subsystems, the maintenance cycle of the machining center can be very long. Therefore, when calculating the cost rate of the machine center, this article calculates the finite time cost rate within a suitable time interval. The total cost generated within the finite time of the machining center can be divided into four categories, mainly including direct maintenance costs, downtime loss costs, failure risk costs, and penalty costs caused by incomplete utilization of reliability.
The direct maintenance costs of the machining center include the minimum maintenance costs caused by sudden failures, preventive maintenance, and replacement costs.
Assuming the number of shutdowns caused by preventive maintenance and replacement in the finite operation time interval [ 0 , T ] of subsystem k is m k = n r k N k + q k , where n r k is the number of preventive replacements for the subsystem k , N k is the number of maintenance cycles of the subsystem k , and q k is the number of preventive maintenances to subsystem k after the last preventive replacement. The operating time of subsystem k in each preventive maintenance cycle is T j k ( j = 1 , 2 , · · · , m k ) . The minimum maintenance costs for subsystem k between [ 0 , T ] is:
C m k = C s m k j = 1 m k 0 T j k λ i k ( t ) d t + 0 T j = 1 m k T j k λ q k + 1 k ( t ) d t
where C s m k is the minimum maintenance cost for subsystem k , λ i k ( t ) is the failure rate function of subsystem k in the i th maintenance cycle, i is the remainder of j divided by N k , and i = j j N k N k , a indicates rounding down a .
The preventive maintenance is set, and the replacement cost incurred by subsystem k in the j th maintenance cycle is:
C p j k = C p i k O ( j , k ) = 1 C r k O ( j , k ) = 2
where C p i k is the preventive maintenance cost for the i th ( i = 1 , 2 , · · · , N k ) maintenance cycle of subsystem k , and C r k is the preventive replacement cost for subsystem k . O ( j , k ) = 1 if the j th maintenance cycle of subsystem k ends with preventive maintenance, whereas O ( j , k ) = 2 means the maintenance cycle ends with preventive replacement.
In summary, the direct maintenance cost for subsystem k between [ 0 , T ] is:
C z k = C m k + j = 1 m k C p j k
Then, the direct maintenance cost generated by the machining center between [ 0 , T ] is:
C z = k = 1 s C z k
The downtime loss costs of a machining center in finite time consist of the loss costs caused by sudden failure downtime and the loss costs caused by preventive maintenance or replacement downtime.
Shutdown time caused by sudden failure of subsystem k in [ 0 , T ] is:
T f d k = t c m k j = 1 m k 0 T j k λ i k ( t ) d t + 0 T j = 1 m k T j k λ q k + 1 k ( t ) d t
The downtime loss cost caused by sudden failures of the machining center in [ 0 , T ] is:
C f d = c d T f d = c d k = 1 s T f d k
Assuming that the machining center has experienced N shutdowns caused by preventive maintenance or replacement between [ 0 , T ] , for the n th shutdown, it is assumed that there is a total of s d subsystems undergoing preventive maintenance–replacement or opportunistic maintenance–replacement during this period. For different subsystems, these maintenance or replacement activities are parallel, so the downtime of the n th shutdown is the maximum value of these times.
t d n = max 1 k s d ( t p i k , t r k )
where t p i k is the preventive maintenance time for the subsystem k in the i th maintenance cycle, and t r k is the preventive replacement time for the subsystem k .
Therefore, the total downtime loss cost caused by preventive maintenance and replacement in [ 0 , T ] of the machining center is:
C p d = c d T p d = c d n = 1 N t d n
Therefore, the total downtime loss cost of the machining center is:
C d = C f d + C p d
The failure risk cost in [ 0 , T ] of subsystem k is;
C k r i s k = c k r i s k j = 1 m k 0 T j k λ i k ( t ) d t + 0 T j = 1 m k T j k λ q k + 1 k ( t ) d t
The failure risk cost of the machining center is;
C r i s k = k = 1 s C k r i s k
When conducting opportunistic maintenance on subsystem k , it has not yet reached its reliability threshold R h k . Therefore, opportunistic maintenance will incur penalty costs due to the waste of the remaining life of the subsystem.
Therefore, the penalty cost C c k for subsystem k due to opportunistic maintenance is:
C c k = j = 1 m k R j k R h k · V k
where R j k is the corresponding reliability of subsystem k at the end of the j th maintenance cycle. V k represents the unit reliability life costs of subsystem k .
The penalty cost of the machining center is:
C c = k = 1 s C c k
Based on the various costs of the machining center mentioned above, the total cost C generated within the finite time interval [ 0 ,   T ] is:
C = C z + C d + C r i s k + C c
Since the cost rate is calculated within a fixed time interval, the cost rate can be minimized by optimizing the decision variable opportunistic maintenance threshold Δ R k ( k = 1 , 2 , · · · , s ) to minimize the costs. Therefore, the opportunistic preventive maintenance model based on reliability with the optimal total cost for the machining center in the finite operating time [ 0 ,   T ] is:
min C ( Δ R ) = C z + C d + C r i s k + C c s . t . ln ( R h k + Δ R k ) 0 T i k λ i k ( t ) d t ln R h k 0 Δ R k 1 R h k
where Δ R = Δ R 1 , Δ R 2 , · · · , Δ R s .
The definitions of various symbols appearing in the opportunistic maintenance model are summarized as follows:
  • Δ R is the opportunistic maintenance threshold;
  • R h is the preventive maintenance threshold of the subsystem;
  • m k is the number of shutdowns in the finite operation time of subsystem k ;
  • n r k is the number of preventive replacements of subsystem k ;
  • N k is the number of maintenance cycles of subsystem k ;
  • q k is the number of preventive maintenances after the last replacement of subsystem k ;
  • T j k is the operating time of subsystem k in each preventive maintenance cycle, j = 1 , 2 , · · · , m k ;
  • λ i k ( t ) is the failure rate function of subsystem k in the i th maintenance cycle, i = j j N k N k ;
  • C m k is the minimum maintenance cost for subsystem k in the finite operation time;
  • C s m k is the minimum maintenance cost of subsystem k ;
  • C p j k is the preventive cost of subsystem k in j th cycle;
  • C p i k is the preventive maintenance cost for the i th maintenance cycle of subsystem k ( i = 1 , 2 , · · · , N k , meaning that i will be counted from the beginning after each replacement);
  • C r k is the preventive replacement cost of subsystem k ;
  • O ( j , k ) is the indicator, with 1 for the j th maintenance cycle of subsystem k ending with preventive maintenance, and 2 for the j th maintenance cycle of subsystem k ending with preventive replacement;
  • C z k is the direct maintenance cost for subsystem k in the finite operation time;
  • C z is the direct maintenance cost generated by the machining center in the finite operation time;
  • T f d k is the shutdown time caused by sudden failure of subsystem k in the finite operation time;
  • C f d is the downtime loss cost caused by sudden failures of the machining center in the finite operation time;
  • t d n is the downtime of the n th shutdown;
  • C p d is the total downtime loss cost caused by preventive maintenance and replacement of the machining center in the finite operation time;
  • C d is the total downtime loss cost of the machining center;
  • C k r i s k is the failure risk cost of subsystem k in the finite operation time;
  • C r i s k is the failure risk cost of the machining center in the finite operation time;
  • C c k is the penalty cost for subsystem k due to opportunistic maintenance in the finite operation time;
  • C c is the penalty cost of the machining center in the finite operation time.

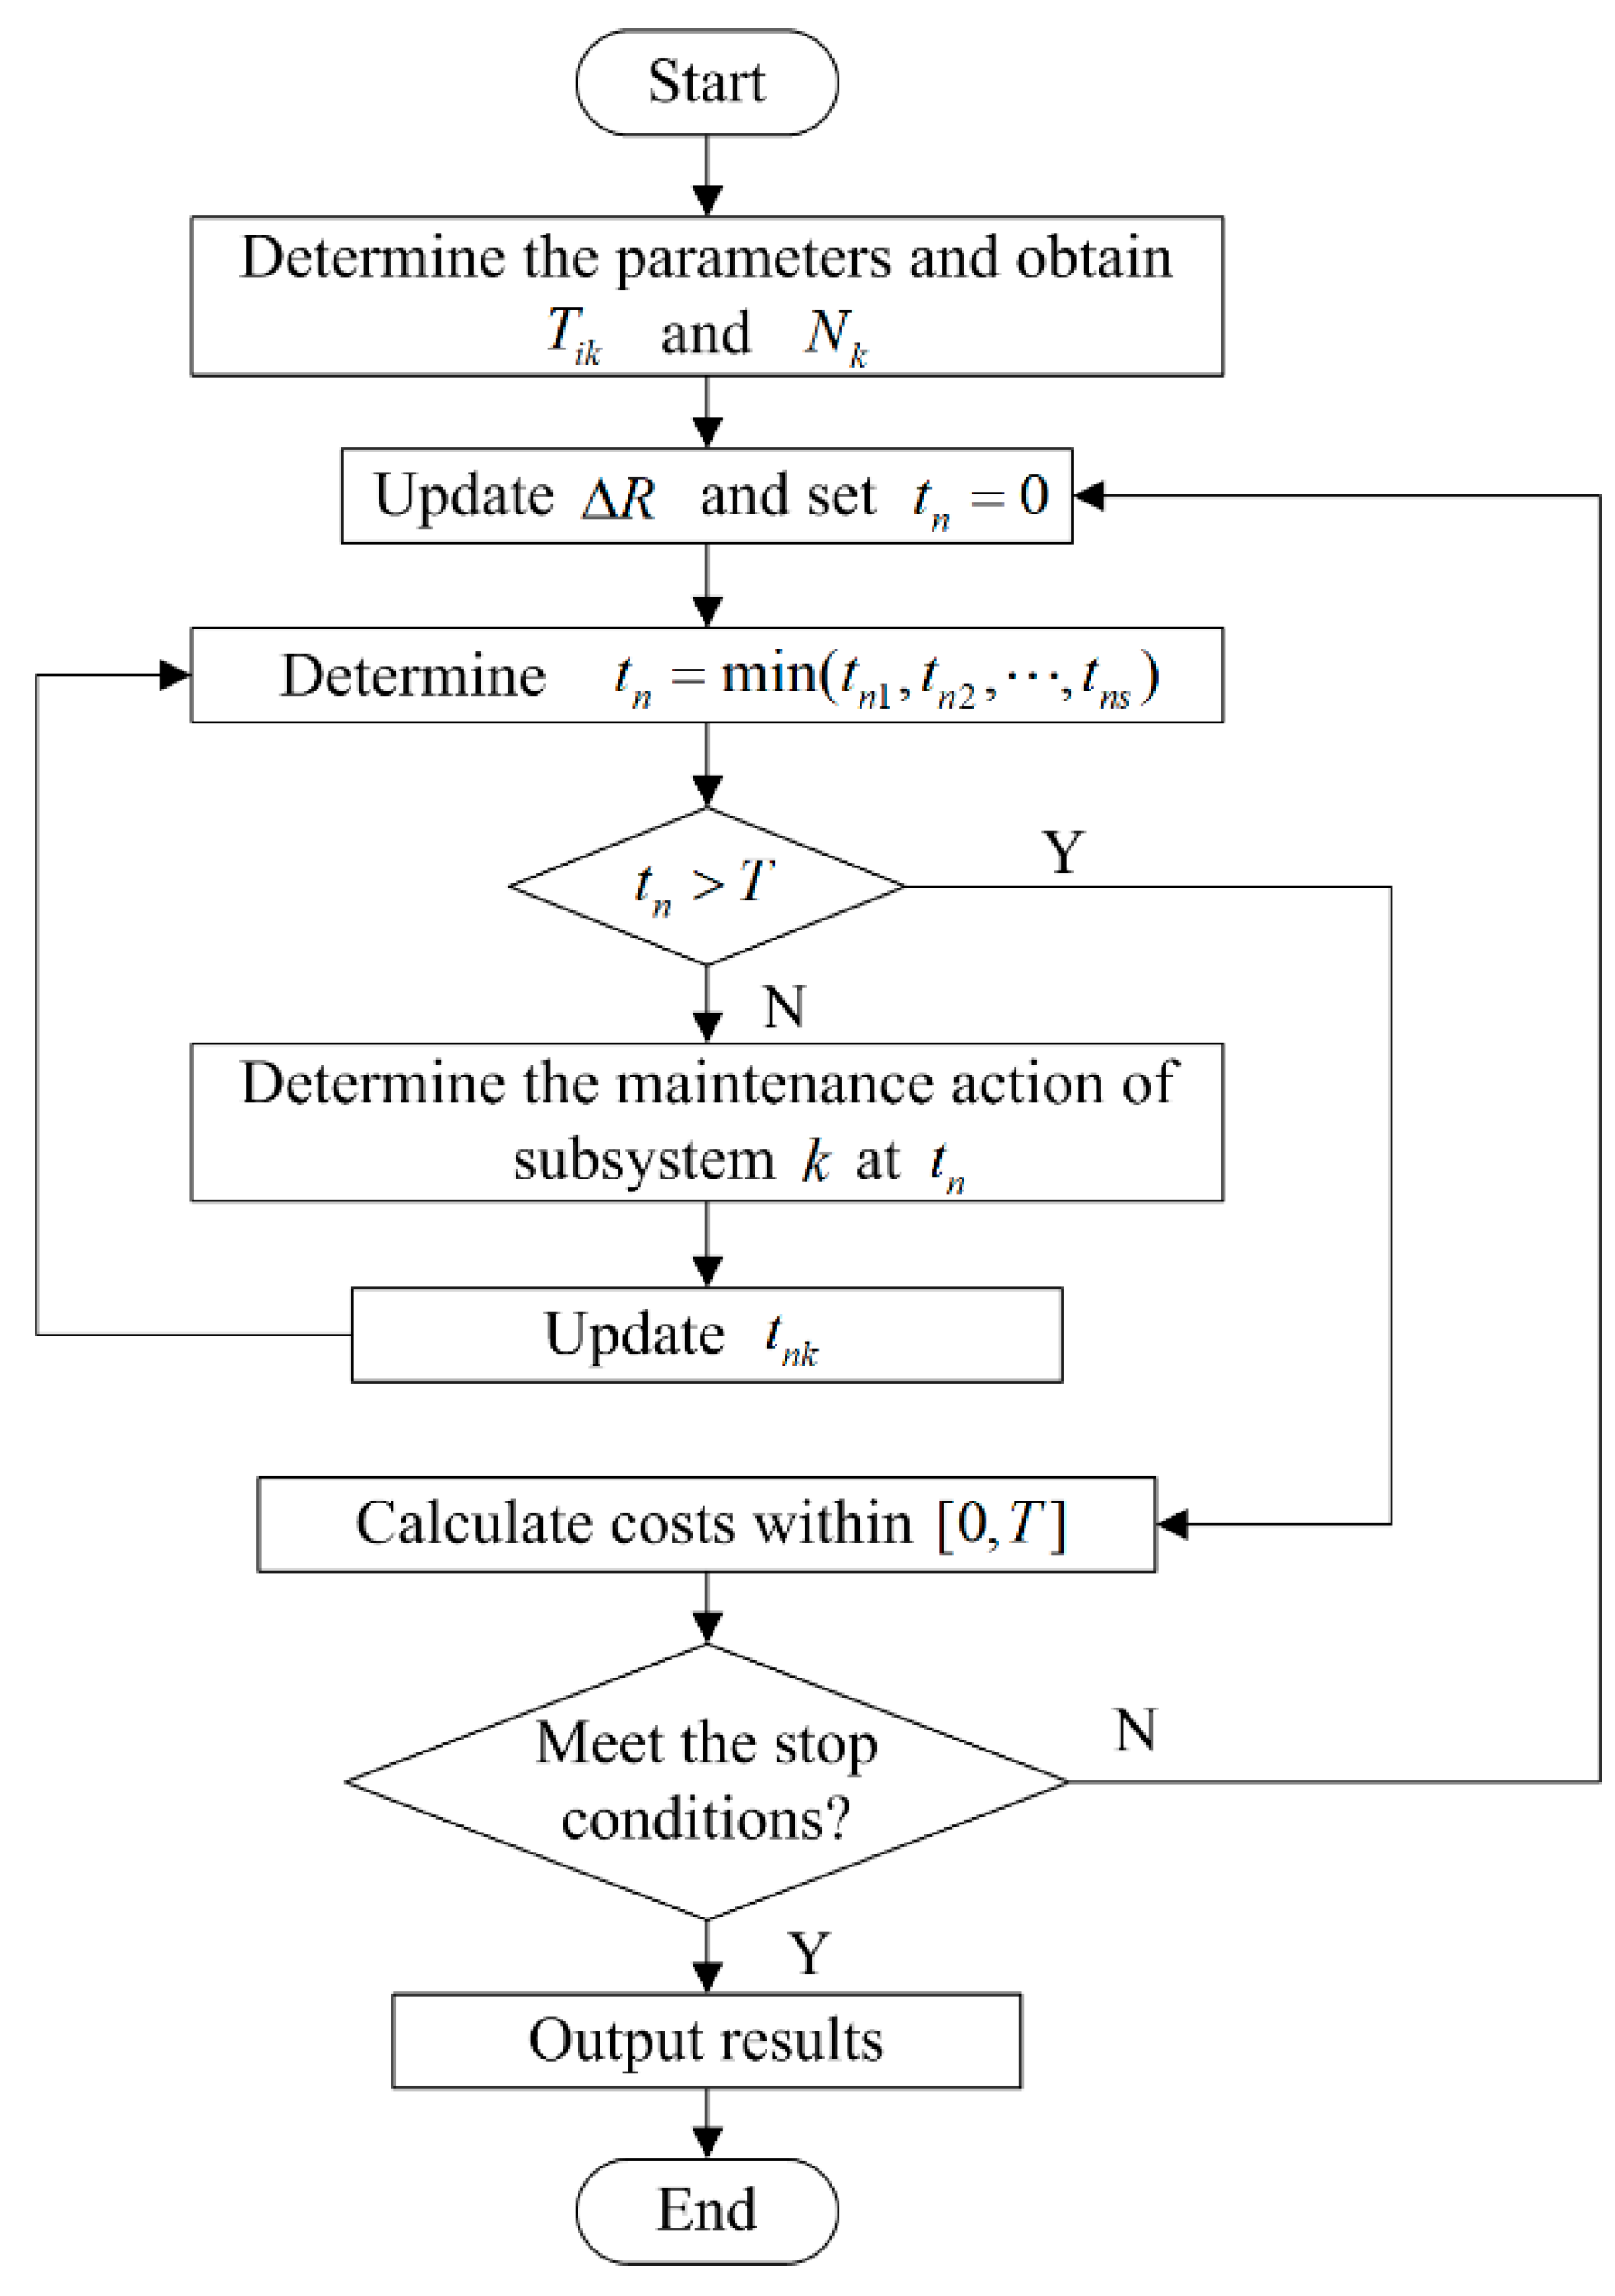
3.3. Solution of Opportunistic Maintenance Model

The steps to solve the opportunistic maintenance model are as follows:
Step 1:
Determine the values of all parameters in the model.
Step 2:
Optimize the maintenance plan of the subsystems of the machining center to obtain the optimal maintenance interval T i k and number of maintenance cycles N k for the subsystems.
Step 3:
Determine and record the time t n = min ( t n 1 , t n 2 , · · · , t n s ) of the n th shutdown for preventive maintenance or replacement of the machining center. When n = 1 , t 11 = T 11 , t 12 = T 12 , · · · , t 1 s = T 1 s .
Step 4:
Determine the maintenance action of subsystem k at t n . When R k ( t ) > R h k + Δ R k , the subsystem does not require preventive maintenance or replacement action at t n ; when R h k < R k ( t ) < R h k + Δ R k , i k < N k at the same time and opportunistic maintenance will be performed on subsystem k , where i k is the maintenance cycle number of subsystem k at t n . The maintenance cycle i k is increased by 1 after preventive maintenance; when R h k < R k ( t ) < R h k + Δ R k , i k = N k at the same time and an opportunistic preventive replacement will be performed for the subsystem k . Then, i k = 1 , and maintenance cycle counting will be restarted.
Step 5:
Solve the corresponding time t n + 1 of the ( n + 1 ) th shutdown for preventive maintenance or replacement of the machining center. t n + 1 = min ( t ( n + 1 ) 1 , t ( n + 1 ) 2 , · · · , t ( n + 1 ) s ) , where
t ( n + 1 ) k = t n k + t d n t n k + t d n + T i k k O ( t n , k ) = 0 O ( t n , k ) = 1 , 2
O ( t n , k ) = 0 indicates that subsystem k did not undergo preventive maintenance or replacement at t n , O ( t n , k ) = 1 indicates that subsystem k performed preventive maintenance at t n , and O ( t n , k ) = 2 indicates that subsystem k performed preventive replacement at t n .
Step 6:
Repeat Step 3–Step 5 until t n > T .
Step 7:
Calculate costs within [ 0 ,   T ] . Continuously update Δ R to minimize costs and record the best Δ R .
The solution process of the maintenance model is shown in Figure 3.

4. Numerical Example

A total of 58 failure data points are collected from five machining centers. Symbols of the subsystem are shown in Table 1. The failure interval time is sorted from smallest to largest, and the results are shown in Table 2.
The improved average rank method is used to obtain the model parameters. Taking the hydraulic subsystem as an example, the calculation process is as follows.
Firstly, the average rank method is used to calculate the empirical distribution function, and the results are shown in Table 3.
The model parameters are calculated using the least square equations in Section 2.2. The results are B ^ = 1.839 , A ^ = 14.058 , β ^ = 1.839 , and η ^ = 2092.333 . The results are shown in Figure 4. The rank increment is updated using the improved average rank method; afterward, the updated empirical distribution function and the updated parameters are obtained. The calculation results of the rank increment are shown in Table 4. The updated parameters are β ^ = 1.771 , A ^ = 13.602 , B ^ = 1.771 , and η ^ = 2161.748 . The results are shown in Figure 5.
Using linear correlation coefficients for model fit testing, the formula for calculating the linear correlation coefficient is:
ρ ^ = i = 1 n x i y i n x y ¯ i = 1 n x i 2 n x ¯ 2 i = 1 n y i 2 n y ¯ 2
The linear correlation coefficient using the average rank method ρ 1 ^ is 0.958, and the linear correlation coefficient using the improved average rank method ρ 2 ^ is 0.975. When the significance factor α = 0.01 , the critical value of the linear correlation coefficient ρ 0 ^ is 0.575. ρ 2 ^ > ρ 1 ^ > ρ 0 ^ ; therefore, it is concluded that the effect of linear regression is significant, and using the improved average rank method for regression fitting has better results than using the average rank method.
We also use the K-S test method to examine the goodness of fit. The calculation method for the test statistic D n is as follows:
D n = sup < x < + F n x F 0 x = max d i
where
d i = F n t i F 0 t i
F n x is the empirical distribution function, and F 0 x is the function value under the assumed distribution.
When D n D n , α , the original hypothesis is accepted and it is assumed that it follows the assumed distribution. When significance level α = 0.1 , D n , α = 0.272 . When using the average rank method, D n 1 = 0.091 . When using the improved average rank method, D n 2 = 0.056 . D n 2 < D n 1 < D n , α ; therefore, it is believed that the distribution conforms to the hypothesis and the improved average rank method is more effective in fitting.
There is only one fault in the automatic tool changer and servo subsystem, so it is assumed that they obey negative exponential distribution. The final results of parameter estimation for the other machining center subsystems are shown in Table 5. The reliability functions of these subsystems are shown in Figure 6.
The shape parameters of the electrical subsystem and cooling subsystem are less than 1, so only the minimum maintenance is carried out in the event of a failure. This strategy is also applied to the automatic tool changer and servo subsystem. These four subsystems are not included in the following text when calculating costs.
A total of six subsystems will participate in the development of the maintenance strategy mentioned above, and their cost parameters are shown in Table 6. Based on experience [30,31], the age regression factor and the failure rate growth factor are a i = i / ( 5 i + 7 ) , b i = ( 12 i + 1 ) / ( 11 i + 1 ) .
According to Section 3.1, the results of the single subsystem maintenance strategy arrangement are shown in Table 7. The optimal maintenance cycle for the hydraulic subsystem, auxiliary subsystem, feed subsystem, and lubrication subsystem is 4, and the optimal maintenance cycle for the numerical control subsystem and main transmission subsystem is 5.
Next, the opportunistic maintenance of the entire machining center is considered. The finite operating time is selected as 6000 h. Using the particleswarm function in MATLAB R2016a to solve the model, the minimum cost is obtained as C = 100899 , which corresponds to the opportunistic maintenance threshold Δ R = 0.03 , 0.037 , 0.038 , 0.032 , 0.033 , 0.057 . The maintenance plan for the machining center subsystems within a limited amount of time is shown in Table 8 and Figure 7. The numbers in the table indicate the maintenance method: 0 indicates no maintenance activities, 1 indicates preventive maintenance activities, 2 indicates preventive replacement activities, 3 indicates opportunistic maintenance activities, and 4 indicates opportunistic replacement activities. A total of 16 shutdowns are carried out; meanwhile, the total preventive downtime is 49 h.
When the machining center adopts a strategy of not considering opportunistic maintenance, the cost incurred in a finite time domain is 108,257. A total of 26 preventive shutdown activities are conducted, including 21 preventive maintenance and 5 preventive replacements. The total preventive downtime is 69 h. Adopting opportunistic maintenance can reduce downtime by 10 times, reduce costs by 7%, and reduce preventive downtime by 29% in this example. The comparison between the two policies is shown in Table 9.
The opportunity maintenance strategy described in this article can generate a clear maintenance schedule and determine which maintenance actions to take at specific time points, including preventive maintenance, preventive replacement, opportunistic maintenance, and opportunistic replacement. Due to the opportunistic maintenance strategy utilizing downtime to repair other subsystems that are about to require preventive maintenance, it can significantly reduce the number of preventive shutdowns, decrease downtime, and achieve the goal of reducing costs and improving system reliability.

5. Conclusions

This article studies the opportunistic maintenance strategy of machining centers. The innovative improved average rank method was used to model the reliability of subsystems, and its good fitting ability was demonstrated through correlation coefficients and K-S tests. Based on this, the maintenance strategy of subsystems is optimized to obtain the optimal maintenance interval time and optimal maintenance time. During this process, maintenance is considered imperfect. Then, based on the obtained subsystem maintenance schedule, the opportunistic maintenance strategy is arranged for the entire machine, and the possibility of utilizing subsystem maintenance opportunities to repair other subsystems is considered. According to the proposed solution process, the final maintenance schedule for the machining center’s entire machine within the set operating time is obtained. Compared to the strategy that only considers the optimal subsystem, adopting the opportunistic maintenance strategy has the benefits of avoiding frequent shutdowns, and reducing maintenance costs and downtime. In the example mentioned in this article, adopting opportunistic maintenance can reduce downtime by 10 times, reduce costs by 7%, and reduce preventive downtime by 29%.
Although the article demonstrates that opportunistic maintenance has certain advantages under model assumptions and numerical levels, in practical applications, it is more necessary to flexibly apply the thought of opportunistic maintenance and choose the calculation method of the costs within a finite time interval according to the actual situation as a standard to select a reasonable and economical maintenance schedule. In the actual process of arranging maintenance, the first step is to model and verify the reliability of the subsystem based on the collected data and determine the reliability threshold that needs maintenance according to costs and reliability indicators. Then, the maintenance schedule is determined for the subsystem. Finally, opportunistic maintenance for the entire machine should be considered and the threshold for opportunistic maintenance should be determined to achieve the goal of rational utilization of downtime and cost savings.
The conclusion drawn from this article is based on the specific model assumptions, parameter settings, and data scale. Further discussion is needed, such as the impact of the assumptions of other reliability models, different cost parameters, and the superiority of opportunistic maintenance strategies for complex systems containing more subsystems. In addition, the application of more advanced maintenance strategies may further improve efficiency.

Author Contributions

Conceptualization, Y.Z. and M.S.; methodology, Y.Z. and M.S.; software, M.S.; validation, M.S.; formal analysis, M.S.; investigation, Y.Z.; resources, Y.Z.; data curation, Y.Z. and M.S.; writing—original draft preparation, M.S.; writing—review and editing, M.S. and F.H.; visualization, M.S.; project administration, Y.Z. and W.W.; funding acquisition, Y.Z. All authors have read and agreed to the published version of the manuscript.

Funding

This research was funded by the National Science and Technology Major Project of the Ministry of Science and Technology of China (grant no. 2015ZX04003002); Jilin Province Science and Technology Development Plan Project (grant no. 20190302104GX).

Institutional Review Board Statement

Not applicable.

Informed Consent Statement

Not applicable.

Data Availability Statement

The original contributions presented in this study are included in the article. Further inquiries can be directed to the corresponding author.

Conflicts of Interest

The authors have no relevant financial or non-financial interests to disclose.

References

  1. Li, X.B.; Yang, Z.J.; Cheng, D.B.; Liu, J.X.; Cai, Z.G.; Liu, Y.Z. A New Probability Prediction Method for Key Subsystems of Machining Center. Appl. Mech. Mater. 2013, 411–414, 1809–1814. [Google Scholar] [CrossRef]
  2. Yan, Y.T.; Sun, Z.L.; Ren, X.; Yang, Q. Real-Time Reliability Analysis and Optimal Distribution of the Reliability on Five-Axis Machining Center. Appl. Mech. Mater. 2011, 84–85, 552–556. [Google Scholar] [CrossRef]
  3. Liu, Y.-J.; Fan, J.-W.; Li, Y. Reliability evaluation method and algorithm for electromechanical product. J. Cent. South. Univ. 2014, 21, 3753–3761. [Google Scholar] [CrossRef]
  4. Gu, D.; Guo, J.; Han, W.; Gao, S.; Zhao, X.; Xu, Z. Reliability modeling for failure correlations to a CNC lathe subsystem based on Pagerank Algorithm. Qual. Eng. 2023, 36, 336–349. [Google Scholar] [CrossRef]
  5. Liu, Y.; Peng, H.; Yang, Y. Reliability Modeling and Evaluation Method of CNC Grinding Machine Tool. Appl. Sci. 2018, 9, 14. [Google Scholar] [CrossRef]
  6. Parkash, S.; Tewari, P. Performability analysis for the SPVC line system of leaf spring production plant using probabilistic approach. J. Qual. Maint. Eng. 2024, 30, 508–520. [Google Scholar] [CrossRef]
  7. Han, D.; Brownlow, J.D.; Thompson, J.; Brooks, R.G. Bayesian estimation of the mean time between failures of subsystems with different causes using interval-censored system maintenance data. Qual. Reliab. Eng. Int. 2024, 40, 3867–3887. [Google Scholar] [CrossRef]
  8. Pandey, P.; Mukhopadhyay, A.K.; Chattopadhyaya, S. Reliability analysis and failure rate evaluation for critical subsystems of the dragline. J. Braz. Soc. Mech. Sci. Eng. 2018, 40, 50. [Google Scholar] [CrossRef]
  9. Shouman, M.A.; Saber, A.S.; Shaat, M.K.; El-Sayed, A.; Torkey, H. A Hybrid Machine Learning Model for Reliability Evaluation of the Reactor Protection System. Alex. Eng. J. 2022, 61, 6797–6809. [Google Scholar] [CrossRef]
  10. Zhao, F.; Wu, J.; Zhao, Y.; Ji, X.; Zhou, L.; Sun, Z. A machine learning methodology for reliability evaluation of complex chemical production systems. RSC Adv. 2020, 10, 20374–20384. [Google Scholar] [CrossRef]
  11. Nuryanto, R.; Nurcahyo, R.; Farizal, F. Using Failure And Repair Data For Performance Evaluation of NPK Fertilizer Production Line. In Proceedings of the IEEE 7th International Conference on Industrial Engineering and Applications (ICIEA), Bangkok, Thailand, 16–21 April 2020; pp. 404–408. [Google Scholar]
  12. Meng, S.; Shen, G.; Zhang, Y.; Sun, S.; Song, Q. Application of the average rank time method in parameter estimation for fixed-time censoring experiment. In Proceedings of the International Conference on Mechatronics Engineering and Computing Technology (ICMECT), Shanghai, China, 9–10 April 2014; pp. 4146–4150. [Google Scholar]
  13. Chen, Y.; Li, S.; Zhang, L.; Liu, Y.; Dai, Z. Reliability evaluation of protective device based on improved average rank order method. Power Syst. Prot. Control. 2020, 48, 165–171. [Google Scholar] [CrossRef]
  14. Shi, R.; He, Y.; Lin, Q.; Lu, J. Operational risk-based opportunistic maintenance approach for multi-station manufacturing systems considering machine performance–workpiece quality co-effect. Reliab. Eng. Syst. Saf. 2025, 262, 111191. [Google Scholar] [CrossRef]
  15. Li, X.; Jiang, S.; Chen, B.; Chen, F.; An, Y.; Ran, Y.; Zhang, G. Joint optimization of imperfect preventive opportunistic maintenance and spare parts inventory for multi-unit systems considering spare parts reuse. Reliab. Eng. Syst. Saf. 2025, 261, 111162. [Google Scholar] [CrossRef]
  16. Dinh, D.-H.; Do, P.; Iung, B. Multi-level opportunistic predictive maintenance for multi-component systems with economic dependence and assembly/disassembly impacts. Reliab. Eng. Syst. Saf. 2022, 217, 108055. [Google Scholar] [CrossRef]
  17. Wu, Y.; Yang, Z.; Wang, J.; Chen, X.; Hu, W. Optimizing opportunistic preventive maintenance strategy for multi-unit system of CNC lathe. J. Mech. Sci. Technol. 2022, 36, 145–155. [Google Scholar] [CrossRef]
  18. Xu, B.; Xu, S.; Zhang, Q.; Zhang, Y. Maintenance Scheduling of Transmission Bays Considering Selective Opportunistic Maintenance Strategy. In Proceedings of the 3rd IEEE International Conference on Green Energy and Applications (ICGEA), Taiyuan, China, 16–18 March 2019; pp. 40–44. [Google Scholar]
  19. Li, X.; Ran, Y.; Chen, B.; Chen, F.; Cai, Y.; Zhang, G. Opportunistic maintenance strategy optimization considering imperfect maintenance under hybrid unit-level maintenance strategy. Comput. Ind. Eng. 2023, 185, 109624. [Google Scholar] [CrossRef]
  20. Zhao, X.; Huang, X.; Sun, J. Reliability modeling and maintenance optimization for the two-unit system with preset self-repairing mechanism. Proc. Inst. Mech. Eng. Part O J. Risk Reliab. 2019, 234, 221–234. [Google Scholar] [CrossRef]
  21. Cheng, H.; Cao, Y.; Wang, J.; Zhang, W.; Zeng, H. A preventive, opportunistic maintenance strategy for the catenary system of high-speed railways based on reliability. Proc. Inst. Mech. Eng. Part F J. Rail Rapid Transit 2019, 234, 1149–1155. [Google Scholar] [CrossRef]
  22. Su, C.; Wu, L. Opportunistic maintenance optimisation for offshore wind farm with considering random wind speed. Int. J. Prod. Res. 2023, 62, 1862–1878. [Google Scholar] [CrossRef]
  23. Xie, L.; Rui, X.; Li, S.; Hu, X. An opportunistic maintenance strategy for offshore wind turbine based on accessibility evaluation. Wind. Eng. 2019, 44, 455–468. [Google Scholar] [CrossRef]
  24. Zheng, Y.; Dong, Z.; Zhang, X.; Shi, H. Random risk assessment model and risk-based maintenance decisions for natural gas pipelines. J. Loss Prev. Process. Ind. 2025, 95, 105591. [Google Scholar] [CrossRef]
  25. Li, L.; Mahmoodian, M.; Khaloo, A.; Sun, Z. Risk-Cost Optimized Maintenance Strategy for Steel Bridge Subjected to Deterioration. Sustainability 2021, 14, 436. [Google Scholar] [CrossRef]
  26. Masud, M.F.; Chattopadhyay, G.; Gunawan, I. Development of a Risk-Based Maintenance (RBM) Strategy for Sewerage Pumping Station Network. In Proceedings of the IEEE International Conference on Industrial Engineering and Engineering Management (IEEM), Macao, 15–18 December 2019; pp. 455–458. [Google Scholar]
  27. Shafiee, M.; Labib, A.; Maiti, J.; Starr, A. Maintenance strategy selection for multi-component systems using a combined analytic network process and cost-risk criticality model. Proc. Inst. Mech. Eng. Part O J. Risk Reliab. 2019, 233, 89–104. [Google Scholar] [CrossRef]
  28. Xiong, L.; Wang, H.; Jiang, Z. Tristage Bargaining Dynamic Game-Based Preventive Maintenance for Electric Multiple Unit. Math. Probl. Eng. 2020, 2020, 3832123. [Google Scholar] [CrossRef]
  29. Lou, X.; Feng, C.; Chen, W.; Guo, C. Risk-Based Coordination of Maintenance Scheduling and Unit Commitment in Power Systems. IEEE Access 2020, 8, 58788–58799. [Google Scholar] [CrossRef]
  30. Xu, B.; Wang, Z.; Luo, W.; Ma, T.; Huang, H.; Garg, A. A Research on the Combined Maintenance Strategy for Production Line Equipment Based on Mixed Failure Rate. Math. Probl. Eng. 2021, 2021, 8856279. [Google Scholar] [CrossRef]
  31. Ali, B.M.; Al-Musawi, T.J.; Mohammed, A.; Fakhruldeen, H.F.; Hanoon, T.M.; Khurramov, A.; Khalaf, D.H.; Algburi, S. Sustainable strategies for preventive maintenance and replacement in photovoltaic power systems: Enhancing reliability, efficiency, and system economy. Unconv. Resour. 2025, 6, 100170. [Google Scholar] [CrossRef]
Figure 1. Failure rate evolution model (failure rate change after one maintenance).
Applsci 15 06944 g001
Figure 2. Opportunistic maintenance threshold Δ R .
Applsci 15 06944 g002
Figure 3. Solution process of the maintenance model.
Applsci 15 06944 g003
Figure 4. Average rank method results.
Applsci 15 06944 g004
Figure 5. Improved average rank method results.
Applsci 15 06944 g005
Figure 6. Reliability functions of machining center subsystems.
Applsci 15 06944 g006
Figure 7. Maintenance schedule.
Applsci 15 06944 g007
Table 1. Symbols for the subsystem.
SubsystemSymbol
Main transmission subsystemT
Feed subsystemF
Hydraulic subsystemH
Lubricating subsystemL
Numerical control subsystemNC
Electrical subsystemE
Cooling subsystemC
Auxiliary subsystemA
Automatic tool changerATC
Servo subsystemS
Table 2. Time between failure (TBF) of all machining center subsystems.
j TBF/hSub-
System
j TBF/hSub-
System
j TBF/hSub-
System
11.53E21730.3NC411103.12NC
219.18S22734.14H421129.21T
356.77C23735.67F431139.95NC
492.82E24742.58T441267.29H
5129.64H25772.49H451377.75F
6331.01ATC26790.52E461378.52A
7366.68C27794.74L471451.4H
8380.49T28808.55E481472.49H
9403.51C29827.73H491488.22H
10421.15C30846.14F501544.99F
11459.89E31864.55F511693.81H
12477.92A32864.93C521877.15NC
13515.12F33882.96E531950.79H
14551.56H34882.96L541986.85H
15610.63C35901.37H552151.01H
16623.67H36932.82E562206.25E
17625.21C37991.89C572650.79T
18680.44H381029.48C582717.15L
19680.44F391043.29H
20684.27H401067.45H
Table 3. The results of the empirical distribution function obtained by the average rank method.
j i t i A i F ( t i )
51129.641.0730.013
142551.562.3320.035
163623.673.6200.057
184680.444.9380.079
205684.276.2900.103
226734.147.6770.126
257772.499.1440.151
298827.7310.7520.179
359901.3712.6820.212
39101043.2914.8870.250
40111067.4517.0930.288
44121267.2919.7120.332
47131451.4022.7340.384
48141472.4925.7560.436
49151488.2228.7790.488
51161693.8132.1370.545
53171950.7935.9740.611
54181986.8539.8120.677
55192151.0143.6490.742
Table 4. The results obtained by the improved average rank method.
j i t i Δ A i A i F ( t i )
51129.640.0241.0240.012
142551.560.9532.9770.046
163623.670.2694.2450.068
184680.440.2455.4900.089
205684.270.0186.5080.106
226734.140.2627.7700.128
257772.490.2379.0060.149
298827.730.41710.4230.173
359901.370.73212.1560.203
39101043.291.68214.8380.249
40111067.450.29516.1330.271
44121267.292.81819.9510.336
47131451.42.87023.8210.403
48141472.490.32825.1480.425
49151488.220.24426.3930.447
51161693.813.28130.6730.520
53171950.794.08035.7540.607
54181986.850.54337.2970.634
55192151.010.58538.8820.661
Table 5. Parameter estimation of the reliability model for the machining center subsystems.
Subsystem
Symbol
η ^ β ^
T3826.0951.875
F2168.1422.6717
H2161.7481.7714
L2816.6452.6985
NC2672.4292.9124
E271,521.50.3857
C6254.3790.9874
A5647.7641.6973
Table 6. Cost parameters of machining center subsystems.
Cost ParametersHAFNCTL
C s m 5508504054501425180
C f 380380380380380380
C v 302555653530
C r 10,50063753050680015,5003500
t c m 3.123.856.942.792.343
t r 687475
t f 1.2672.5331.520.951.91.9
t v 0.10.1670.220.16250.1750.15
c d 200200200200200200
c r i s k 8170401011,044712612,4045926
V k 15,00013,50016,00015,50015,60014,000
Table 7. Optimal maintenance arrangement for subsystems.
Subsystem
Symbols
N R h T 1 T 2 T 3 T 4 T 5
H40.6091455.0091236.0571049.594896.7964
A40.4974574.1193890.0573314.5182843.579
F40.921851.3723726.153607.5688505.635
NC50.8541428.0521218.1951019.239848.0675707.4946
T50.722113.0551793.6461517.0951289.7051105.025
L40.8551417.0861208.9691011.509841.5174
Table 8. Machining center maintenance schedule.
Time/hHAFNCTL
851001000
1417300301
1579001000
2113003010
2621002303
2655100000
3479001003
3647000100
3706100000
3909000010
4208001004
4497030100
4605200000
4820001000
5207004200
5428000013
Table 9. Comparison between the two policies.
StrategyOptimal Maintenance Strategy for SubsystemsOpportunistic Maintenance
Cost108,257100,899
Number of preventive shutdowns2616
Preventive downtime69 h49 h
Disclaimer/Publisher’s Note: The statements, opinions and data contained in all publications are solely those of the individual author(s) and contributor(s) and not of MDPI and/or the editor(s). MDPI and/or the editor(s) disclaim responsibility for any injury to people or property resulting from any ideas, methods, instructions or products referred to in the content.

