1. Introduction
A system’s general performance as a result of its availability, dependability, and quality is known as its effectiveness [
1]. System effectiveness and resilience issues related to equipment failure caused by deterioration due to usage and environmental factors can have disastrous results, leading to costly consequences, such as injuries, deaths, asset destruction, and reputational losses [
2].
One way of enhancing system performance is maintenance, which lies at the intersection of a system’s effectiveness and resilience. The purpose of maintenance is to reduce deterioration and increase the accessibility of functional systems. Cleaning, fixing, and replacing are all forms of maintenance. Depending on the industrial sector (between 10% and 40% for the atomic energy industry and between 9% and 20% for the chipper industry in Estonia), maintenance costs represent a significant portion of the total cost of the items produced [
3]. Therefore, an efficient maintenance plan must be created in order to reduce system downtime and operating expenses, involving the monitoring, control, and maintenance of equipment and machinery in industrial environments (essential activities) to optimize the operation of a plant and avoid unnecessary failures, problems, or losses.
Traditional corrective maintenance techniques are designed to fix defects when a fault is detected, and preventive maintenance (PvM) techniques, intended to reduce failures through planned control based on past lifetime data, are well-known strategies. PvM typically forecasts when a system will fail, giving rise to approaches such as the block replacement policy and the age replacement policy [
4]. These maintenance techniques are being swapped for more effective ones, such as predictive maintenance (PdM), which allows the monitoring and control of equipment [
5,
6].
The potential for data-driven decision-making has increased in the past 10 years due to the proliferation of sensors and tracking devices caused by the advent of the Industry 4.0 paradigm (I4.0), particularly in industrial contexts [
7]. Thanks to the implementation of cutting-edge techniques enabled by I4.0 technologies [
8], sensors can be incorporated into different parts of industrial plants through Internet of Things (IoT) technology. Continuous monitoring techniques are capable of obtaining and transmitting real-time information on the state of equipment and machines. Such data processes allow the implementation of PdM techniques. Machine learning (ML) algorithms are becoming the preferred approach to developing new predictive maintenance techniques [
9,
10]. This type of maintenance strategy can automatically diagnose a machine’s state, detect anomalies, and evaluate its useful life [
11,
12]. This technique also assists in
Making accurate reports on the current status of equipment;
Designing control panels for monitoring equipment;
Improving responsiveness to process anomalies;
Implementing automatic alarms in case of abnormal behavior.
The widespread availability of degradation data provoked a series of recent studies on PdM (part of condition-based maintenance (CBM)), which has been found to be more effective than traditional PvM procedures [
4,
13,
14]. Data-based models enable the training of algorithms capable of analyzing real-time data and making increasingly accurate predictions.
The information provided by sensors is discontinuous and irregular. Therefore, the critical challenge of data processing and cleaning, as well as dealing with irregular data sampling, pattern detection, resampling to achieve a homogeneous frequency, and creating appropriate data structures for use in ML, must be overcome in the modeling process. The type of ML algorithm used varies depending on the requirements and the information to be predicted [
15].
Prescriptive maintenance (PsM) expands on PdM by prescribing a course of action (recommending operating and maintenance decisions to prevent future equipment degradation and failure) based on historical and incoming real-time data. Data-driven PsM scheduling and production optimization cross multiple study domains, including process system engineering and process safety [
16,
17,
18,
19]. In PdM studies, it is critical to rely on real data from factory processes in order to control operations much more efficiently and predict evolution over time [
15].
There are often limitations in most of the research work performed when PsM and PdM are considered:
As highlighted by [
20], “most of the existing methods possess an asset-centric view, i.e., they focus in their evaluation analyses on the asset itself rather than incorporating adjacent processes within the involved stakeholders.”
Machine learning techniques are also limited by the fact that they always rely on Remaining Useful Life (RUL) predictions, which do not account for uncertainty in the deterioration trajectory [
14,
21].
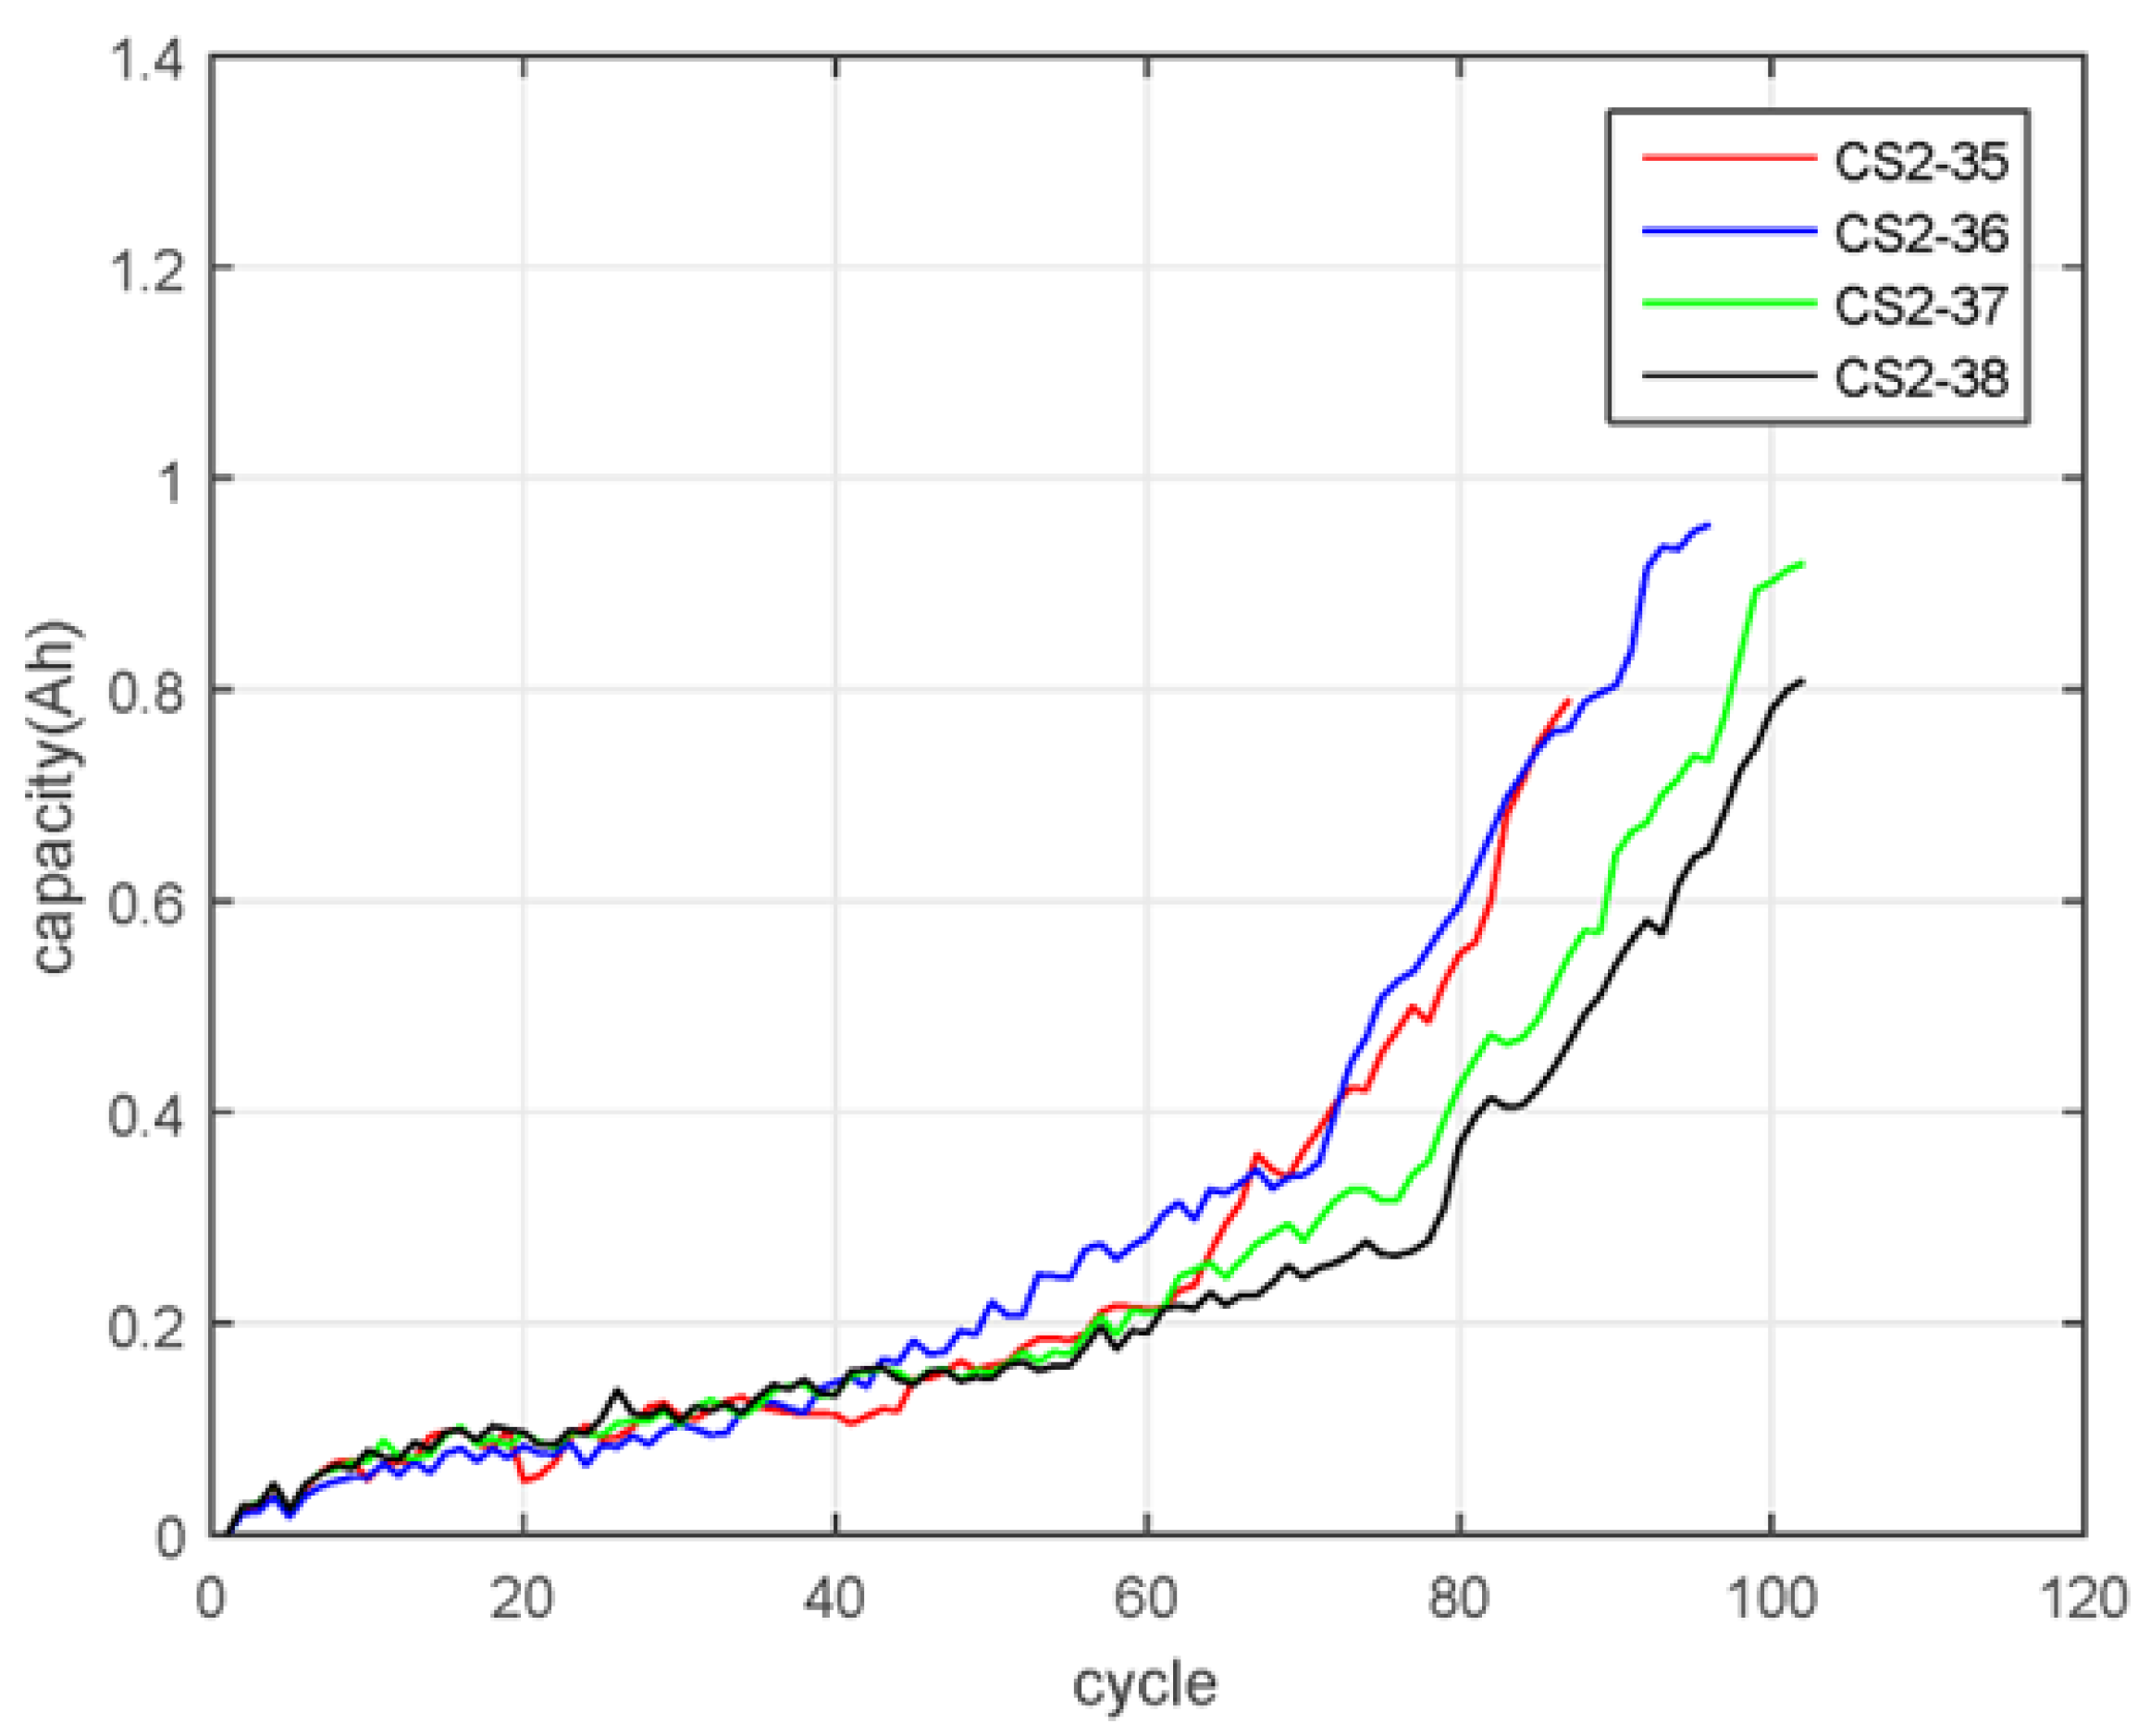
Another significant limitation of PdM, CBM, and PsM data-driven approaches is that most of their identification methods rely on collected and labeled data used for training, which are scarce [
22]. Therefore, the implicit prognosis is to assume there is a constant degradation rate, which is not always true, as discussed in Chen et al. [
21] for lithium-ion batteries and depicted in
Figure 1. Such variable degradation rates are rather frequent, and they challenge the overall deployment of such solutions.
Although machine learning techniques are widely used, they tend to accumulate errors, and longer prediction durations result in more accumulated errors because of different degradation rates and other effects. Therefore, the process of creating deep learning (DL) models is not as automatic as often believed [
23].
The main objectives of this work were to (1) address these last two shortcomings by providing a framework for advanced monitoring that can integrate self-guided decisions about ML model replacement and (2) continuously track system performance. In this way, the different alternative actions linked to PsM can be assessed in a more consistent way as different sets of sequential actions under uncertainty. Markov Decision Processes (MDPs) provide a powerful analytical framework for such settings and are frequently used to represent these problems, and Reinforcement Learning (RL) is a promising tool for completing PsM analysis [
7].
The focus of this study was not on performing PsM itself, which can be very case-specific, nor promoting any advanced ML methods, although some of them were used, but on providing a robust context for employing the RL method. To address this aim, we needed to evaluate ML algorithms’ ability to model the parameters and variables pertaining to an industrial environment as well as continuously monitor the models’ performance and consider the uncertainty involved in predictions, depending on the established time window. To demonstrate the value of the proposed framework, a relevant industrial context was adopted; critically, this application does not imply a lack of generalization.
This study differs from previous ones by introducing a self-guided, cloud-based monitoring framework that not only uses established machine learning methods but also incorporates an automated, scalable approach for continuous model monitoring, updating, and deployment. Unlike traditional prescriptive maintenance solutions, which often lack mechanisms for lifecycle management and sustainability of deployed models, our proposal integrates a Development and Operations (DevOps)-compatible architecture to autonomously handle model retraining and deployment based on real-time performance indicators.
Furthermore, this work introduces the concept of trustworthiness monitoring as an integral part of the prescriptive maintenance framework. This capacity enables organizations to quantify and act upon the uncertainty and accuracy degradation of predictive models over time, addressing a critical but often overlooked limitation in current industrial applications. The proposed framework not only enhances decision making by integrating reinforcement learning (RL) for optimal intervention strategies but also ensures that predictive models remain reliable and accurate through self-supervised retraining workflows.
Therefore, in connection with this aim, several research questions were formulated.
- RQ1:
Is it reasonable to use different models to increase the reliability of predictions of process variables? In this case, can the different models play different roles depending on the uncertainty for different time horizons?
- RQ2:
Is there a way to deploy created ML models in a less resource-demanding context with appropriate update capabilities (with respect to the DevOps perspective)?
- RQ3:
Can the global accuracy of the prediction system be tracked continuously? Is it useful in this regard?
This paper is organized as follows:
Section 2 provides a summary of previous articles related to our research.
Section 3 shows an industrial case adopted as a data source to develop this study and the methodology followed.
Section 4 describes the proposed framework and the tools used to achieve the research objectives.
Section 5 presents the results obtained in the selected use case and the performance of the different models under consideration. These results are highlighted, discussed, and compared by answering the research questions presented.
Section 6 presents the conclusions, limitations, and possible future research directions drawn from this study.
2. State of the Art
The remarkable rate at which new technologies have been developed over the past few years has substantially impacted the new industrial landscape, giving way to what is called “Industry 4.0” (I4.0) in 2011 [
24]. Industry 4.0 involves technologies such as Cyber–Physical Systems (CPSs), the Internet Of Things (IoT), cloud computing technology, and big data and advanced analysis techniques [
25].
Within the scope of Industry 4.0, the increase in information provided by advancements such as the Internet of Things (IoT) and the Industrial Internet of Things (IIoT) has facilitated the improvement in factory monitoring and maintenance systems, resulting in the development of new techniques that use the massive quantity of data obtained during the operation process to make decisions that help reduce costs [
2,
23,
26]. Some authors have pointed out that sensors will include “enterprise information systems” that will use big data techniques in the future [
25]. Large-scale data collection allows for the creation of data-based models that make much more accurate predictions and allow processes to be managed more efficiently. Data-based algorithms are designed to characterize machinery using mathematical models that provide information on a process, and they are also designed to forecast new parameters of interest by monitoring a system [
19,
27]. Data-driven models apply machine learning, soft computing, and statistical theory and can achieve high accuracy in less time than other approaches [
28]. Therefore, their use for predictive maintenance is becoming increasingly relevant, especially with respect to multidimensional data [
10,
19,
29,
30]. The authors of [
9] provide a classification of methods for predictive maintenance and describe their advantages and disadvantages.
The authors of [
31] published an interesting review of techniques useful for the diagnosis of rotating-machinery faults, serving as a valuable source of knowledge. Detecting bearing failures and evaluating motor efficiency are two of the most relevant aspects of predictive maintenance for this type of system [
32]. In this field, some researchers have used the analysis of vibration values under real operating conditions to predict bearing failures [
33]. As a result, relationships between bearing state and vibration frequency have been identified, making this approach an effective technique for PdM [
34]. More recently, artificial intelligence and machine learning techniques were used to create models of data-driven motor pumping systems and roller systems [
10,
35,
36,
37,
38]. Furthermore, recent studies [
39,
40] suggest that long- and short-term memory (LSTM) together with recurrent neural networks (RNNs) can better establish long- and short-term dependence in a dataset. This suggestion is assessed in our case study in order to gauge behavior.
Despite the fundamental engineering principles involved in failure analysis theories and how the corresponding technology enables the monitoring of interesting variables, the focus is still on the proposed frameworks, as they become critical for successful implementation in practical applications.
An interesting framework dealing with PsM was designed by the authors of [
41]; they propose incorporating a knowledge maintenance base that contains different stored models. The recommendation system comes from an aggregator of different sources, such as probabilistic measures, similarities based on process variable distances, textual analysis, and other sources. However, the implementation of such a framework seems rather problem-dependent, and the feedback to the learning-based models is indicated but not clearly depicted.
The proposal presented in [
42,
43] includes a diagnostic system driven by the configurations of a rule-based knowledge system. Such sets of controls help to identify errors in prediction and provide feedback addressing such errors. Although suggestive, this rule-based system lacks automation capabilities because it requires strong support from a central office. Additionally, continuous supervision and action-taking processes were not explicitly considered.
The authors of [
14] provided a proposal for a more integrative perspective between all the functions involved, including the operational and logistic dimensions. The authors sought to determine the expected benefit that the technological maturity endowed would provide for airline operations and developed suitable maintenance strategies that incorporate newly acquired insights. They proposed a discrete event simulation framework that uses established parameters to describe the performance of a condition-monitoring technology and subsequently develops a suitable prescriptive maintenance strategy. Although their focus was on combined effects, considering the mobility of assets and interventions, predictive components were considered without uncertainty, and no specific continuous assessment was provided.
An interesting contribution was presented in [
44], because although the authors’ main focus was the prescriptive algorithm and its performance when describing the system-modeling step, they emphasized that data-driven algorithms can be used to estimate the probability or duration of failure or categorize systems based on the severity of their usage [
44]. However, they noted that the accuracy of such models is dependent on the quality and availability of data and that knowledge of distinct failure modes and stress variables is required to use them successfully. In our opinion, this is a critical aspect that, when not properly addressed, will hinder the PsM approach. Another significant contribution was made by [
45], who avoided the real-time optimization problem.
Another interesting contribution related to PsM frameworks is Esa and Muhammad [
46], wherein the authors propose a conceptual framework and show the complexity of system–function relationships, starting from the parts, components, subsystems, and systems linked to specific functions and their interrelations. They emphasize how, in their case, a probabilistic perspective helps rank the associated risks of the components and guide the estimation of RUL [
14,
47]. This information was used to optimally plan the maintenance and requirements of Just-in-Time spares before they failed. The authors claimed that this approach accounts for downtime, demand for spares, lead time, and budget allocation. Although integrated strategies such as Structural Health Monitoring (SHM) are suggested, the authors recognize that in-service equipment performance can be monitored online and that the performance prediction process is the foundation of life cycle management (LCM) and a critical element of PdM techniques in terms of helping to determine the condition of in-service equipment [
48]. Again, the impact of the accuracy of the prediction of its probabilistic parameters is recognized. They propose increasing future efforts to quantify these crucial parameters.
Regarding the side of RL applied to PsM, it is worth mentioning a contribution wherein the authors propose that the sequential optimization process can help overcome the classical limitation known as the Markov property [
49,
50], which states that the future can be determined only from the present state, which encapsulates all the necessary information from the past [
7]. The authors also relax the hypothesis of an accurate representation of the environment in which the agent acts by enabling noisy observations from different sensors, providing a belief regarding the status of the asset rather than its deterministic value.
After a detailed analysis of the proposed PsM frameworks, both for mobile and grounded industrial assets, it becomes clear how online monitoring of variables linked to functional characteristics is a unanimously accepted approach, but no methods of increasing these approaches’ reliability over time have been provided. Normally, these frameworks are considered operating blocks, always providing accurate signals, but some authors have recognized that this characteristic is a source of weakness. However, no constructive solution has been given, which seems to be a significant gap.
In fact, several authors have recognized that degradation models are needed not just because of a single effect but because a different number of degradation processes, depending on the part, component, subsystem, or system under consideration, must be considered, making the manual operation of these frameworks even more difficult without the assistance of some automation tools [
51]. Therefore, in our opinion, we require a new methodological framework [
52] that can address the surveillance of data-driven prediction performance models and frame appropriate actions when required, but before addressing the effective implementation of PsM. Such a solution will also help answer the formulated research questions.
While traditional predictive maintenance approaches often focus on specific ML algorithms, our work emphasizes the orchestration of a self-guided framework that integrates various components for autonomous decision-making. This focus aligns with emerging paradigms such as digital twins [
53], which facilitate real-time system modeling, and continual learning [
54], which enables models to adapt over time. Furthermore, the principles of AutoML and ModelOps [
55], underscore the importance of automating the ML lifecycle, from model selection to deployment. Our framework also resonates with the concept of Agentic AI, wherein systems can make decisions autonomously, without human intervention. By integrating these elements, our approach offers a comprehensive solution that advances the current state of predictive maintenance.
3. Materials and Methods
The data used in this investigation are real and representative of the problem addressed. They were provided by a large petrochemical company located in the south of Spain. They were collected from an industrial pumping system, where two pairs of pump motor assemblies were placed in parallel and measured by sensors located in the most significant parts of the pumping system (see
Figure 2).
The information obtained through sensors in Industry 4.0 varies depending on the characteristics of the equipment to be monitored and phenomena of interest. In the case of motor pumping systems, there are several parameters of interest, as highlighted by Sunal et al. [
56], who summarized and reviewed the latest research on machine learning-based pump condition monitoring and fault diagnosis as well as the causes of failures. There are many more causes of pump motor assembly failure, and they can be classified into several types [
10]:
Hydraulic failures: cavitation, pressure pulsation, and thrusts.
Mechanical failures: bearing/seal failure, vibrations, and lubrication.
Thermal degradation: motor bearings and sealing failure.
Other failures: flow and current.
The pump and electric motor assembly are connected through a shaft that transmits power. The figure above shows the features measured and their values at the time of measurement. Processing the case study data revealed that the whole pumping system consists of 105,688 data samples, with 52,851 data samples for pump motor assembly NCP1A and 52,837 samples for assembly NCP1B. The relevant variables identified by operational personnel include characteristics that were measured and classified into seven categories:
Vibration (mm/s): This variable was measured at nine different points in the pump motor assembly. Variable names: VPNDE, HPNDE, AXIAL, VPDE, HPDE, VMDE, HMDE, VMNDE, and HMNDE.
Temperature of the motor winding (°C): This feature was measured in each of the three phases of the motor. Variable names: TEMP.FASE U, TEMP.FASE V, and TEMP.FASE W.
Flow temperature (°C): This variable was derived from the fluid that enters the two pumps. Therefore, it has the same value for both pumps. Variable name: TEMP.IMP.
Intensity of the motor (A): This parameter was derived from the electrical current that feeds the motor. Variable name: INTENSITY.
Pressure (): This parameter was measured at two different points: when the fluid enters the pump (suction pressure) and when the fluid leaves the pump (impulse pressure). Variable names: Suction PRESS.ASP and Impulse PRESS.IMP.
Flow (): This feature corresponds to the flow value that leaves both pumps after the parallel distribution. Variable name: FLOW.
Temperature of the motor bearing (ºC): This is the target variable and was measured on both electric motor bearings, one coupled to the pump and the other on the free side of the motor. Variable names: Pump bearing—TEMP.MOTOR; free bearing—TEMP.FREE.
Regarding the methodology used, because of the ambition of this research, i.e., seeking to achieve sustainable predictions of asset behavior over larger periods than those considered for short-term prediction purposes, we decided to first elaborate the framework for orchestrating and accommodating the required operations and tools.
Then, the framework was applied to the use case, with particular attention paid to the potential constraints or limitations for its general applicability. The general applicability of the proposed system is influenced by several domain-specific and technical factors, which we have carefully considered in its design and evaluation. One key limitation is its dependence on sensor quality and coverage: the effectiveness of predictive models is strongly tied to the availability of relevant, high-resolution data streams. In industrial settings where legacy equipment lacks sensorization or environmental noise is high, model performance can degrade. Another constraint is the shift in the data distribution between operational environments; models trained in one facility or a given piece of equipment may not generalize well to others due to differing loads, usage patterns, or maintenance policies. Finally, the orchestration of self-guided monitoring and decision-making requires a certain level of digital maturity and IT infrastructure, such as integration with SCADA, edge-computing resources, and cybersecurity safeguards, which may not be uniformly available in all Industry 4.0 deployments.
Formally, such a methodology is known as Design Science Research (DSR) [
57]. DSR is a problem-solving methodology that focuses on creating and evaluating artifacts (such as frameworks) to address specific problems [
58]. DSR is a research paradigm that holds significant promise in bridging the gap between relevance and rigor in information systems (IS) research. By focusing on the creation of practical artifacts and the formulation of design theories, DSR brings both practical applicability and scientific robustness to research. Positioned at the intersection of technical research, practical implementation, and business utilization and concerning the study of IS from natural, social, and behavioral scientific perspectives, DSR is an important research approach, as evident from the increasing calls for greater emphasis on it [
59].
In this research, the framework is oriented towards prescriptive design knowledge that is guided by theory. The approach taken is centered on the “context of discovery” rather than the context of justification, allowing consideration of the fundamental forms of reasoning from this particular perspective [
60].
4. Framework Proposal
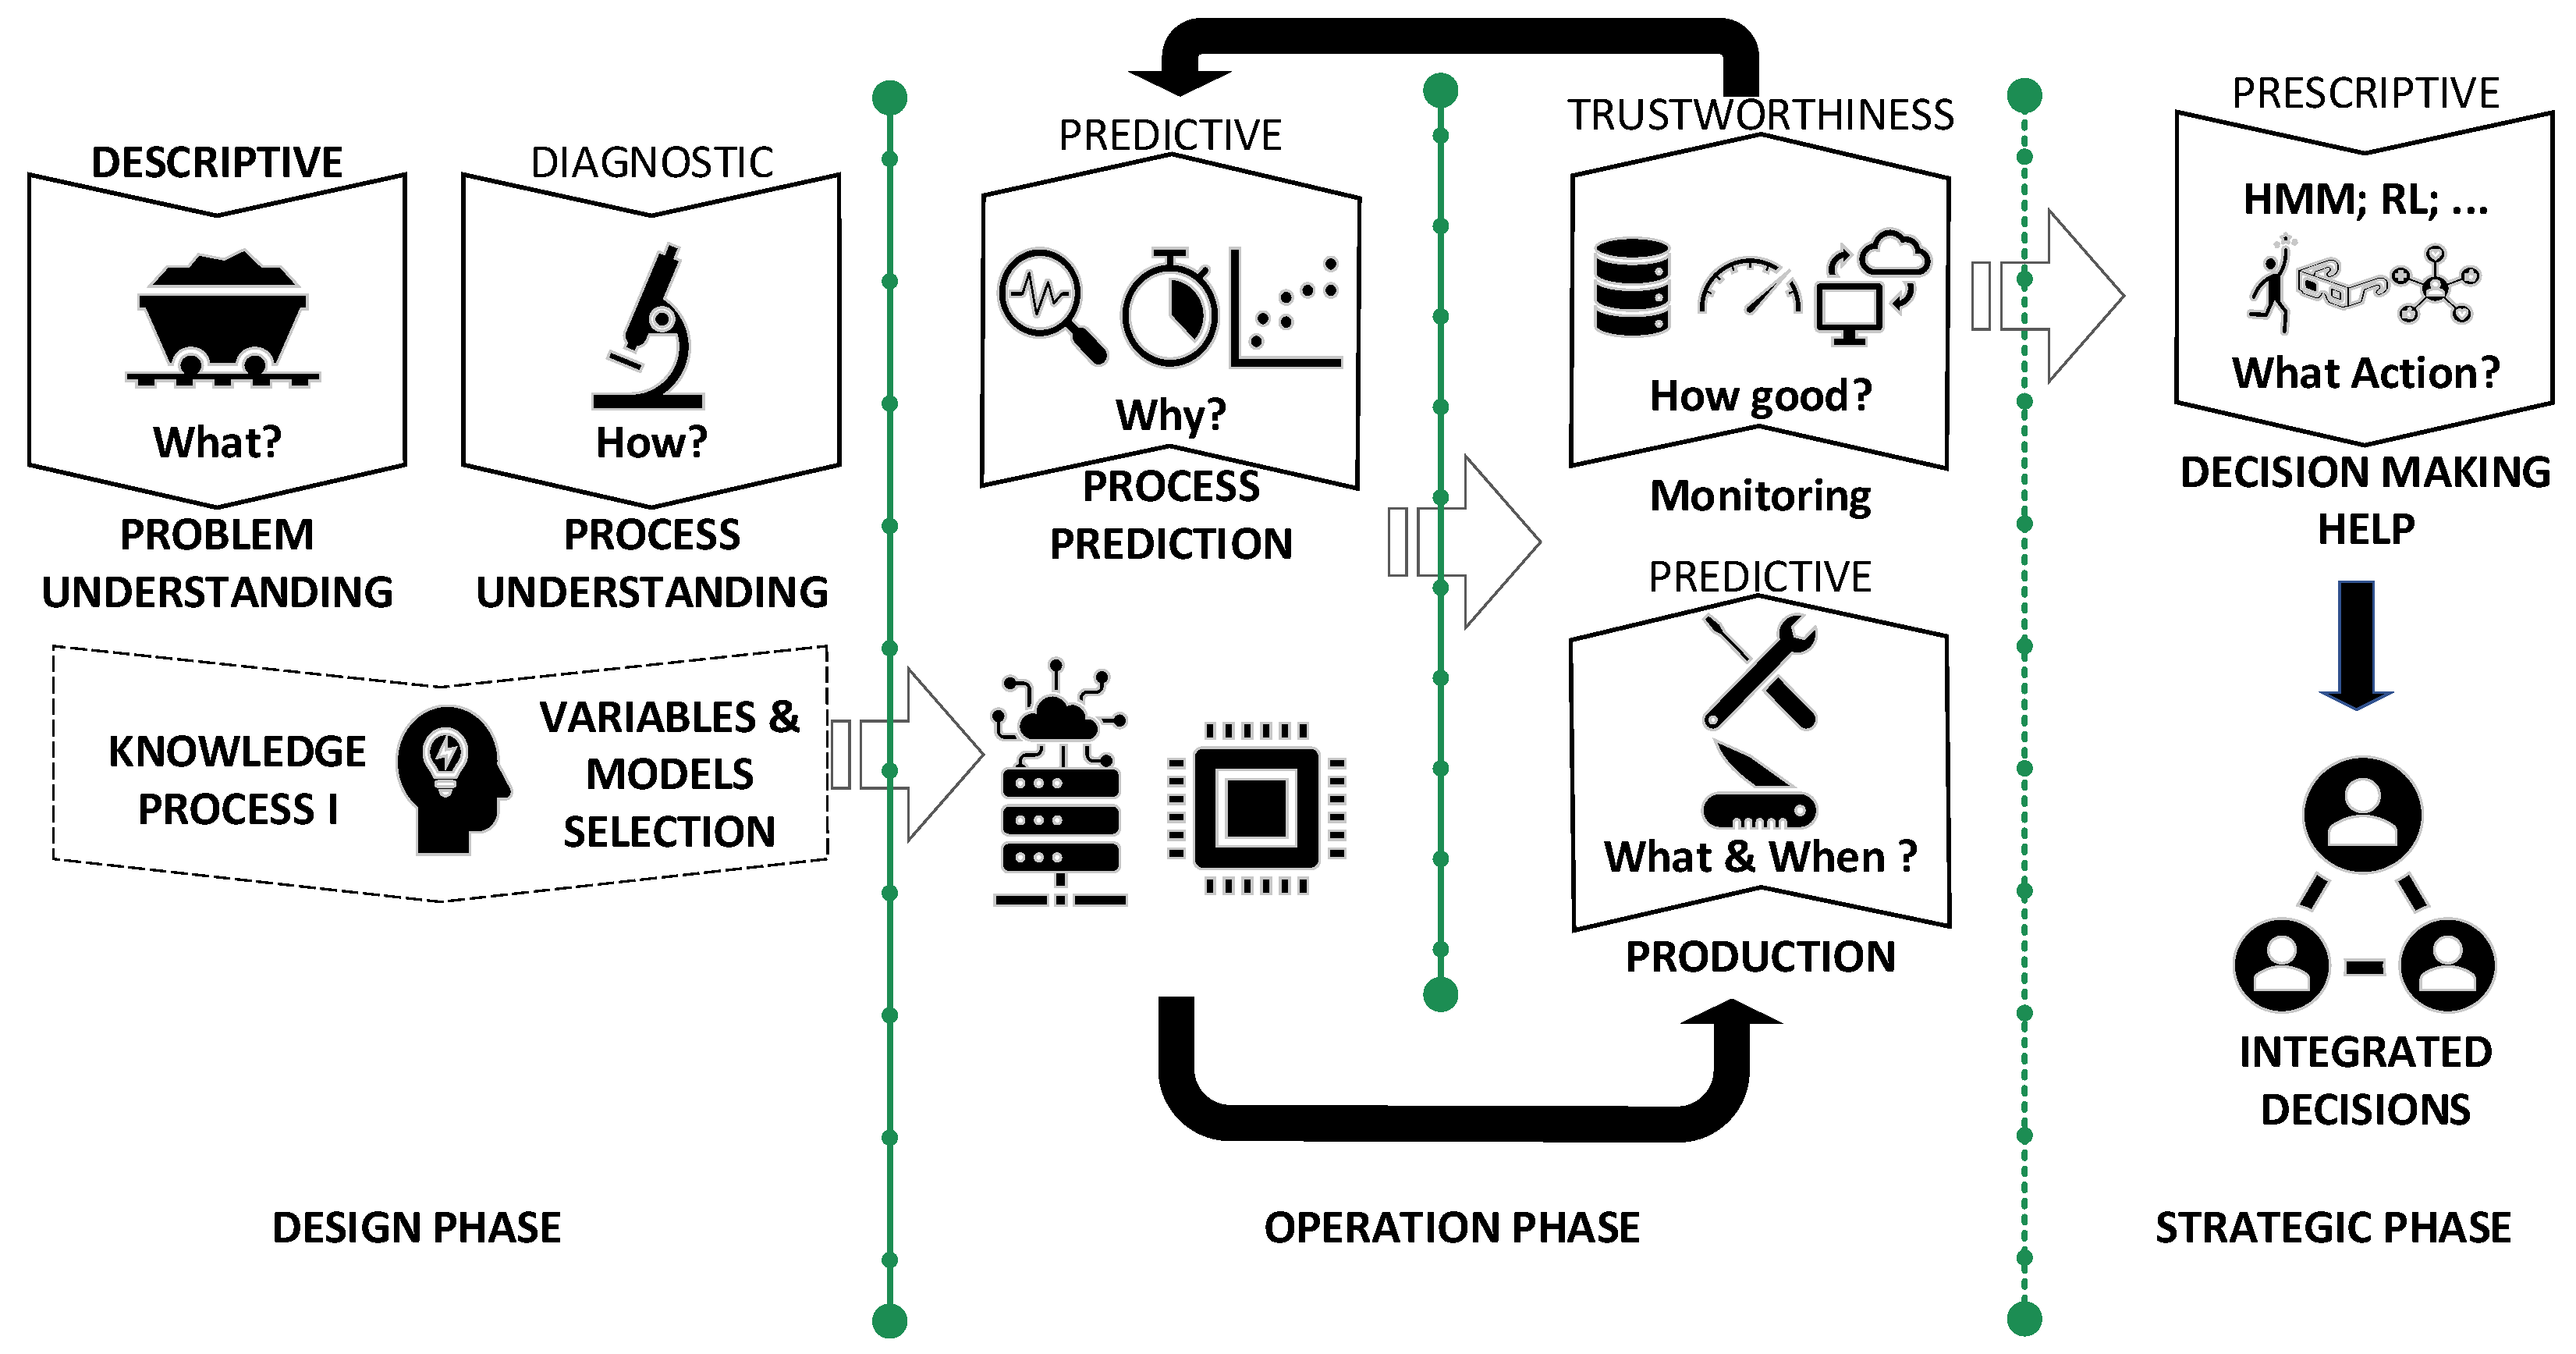
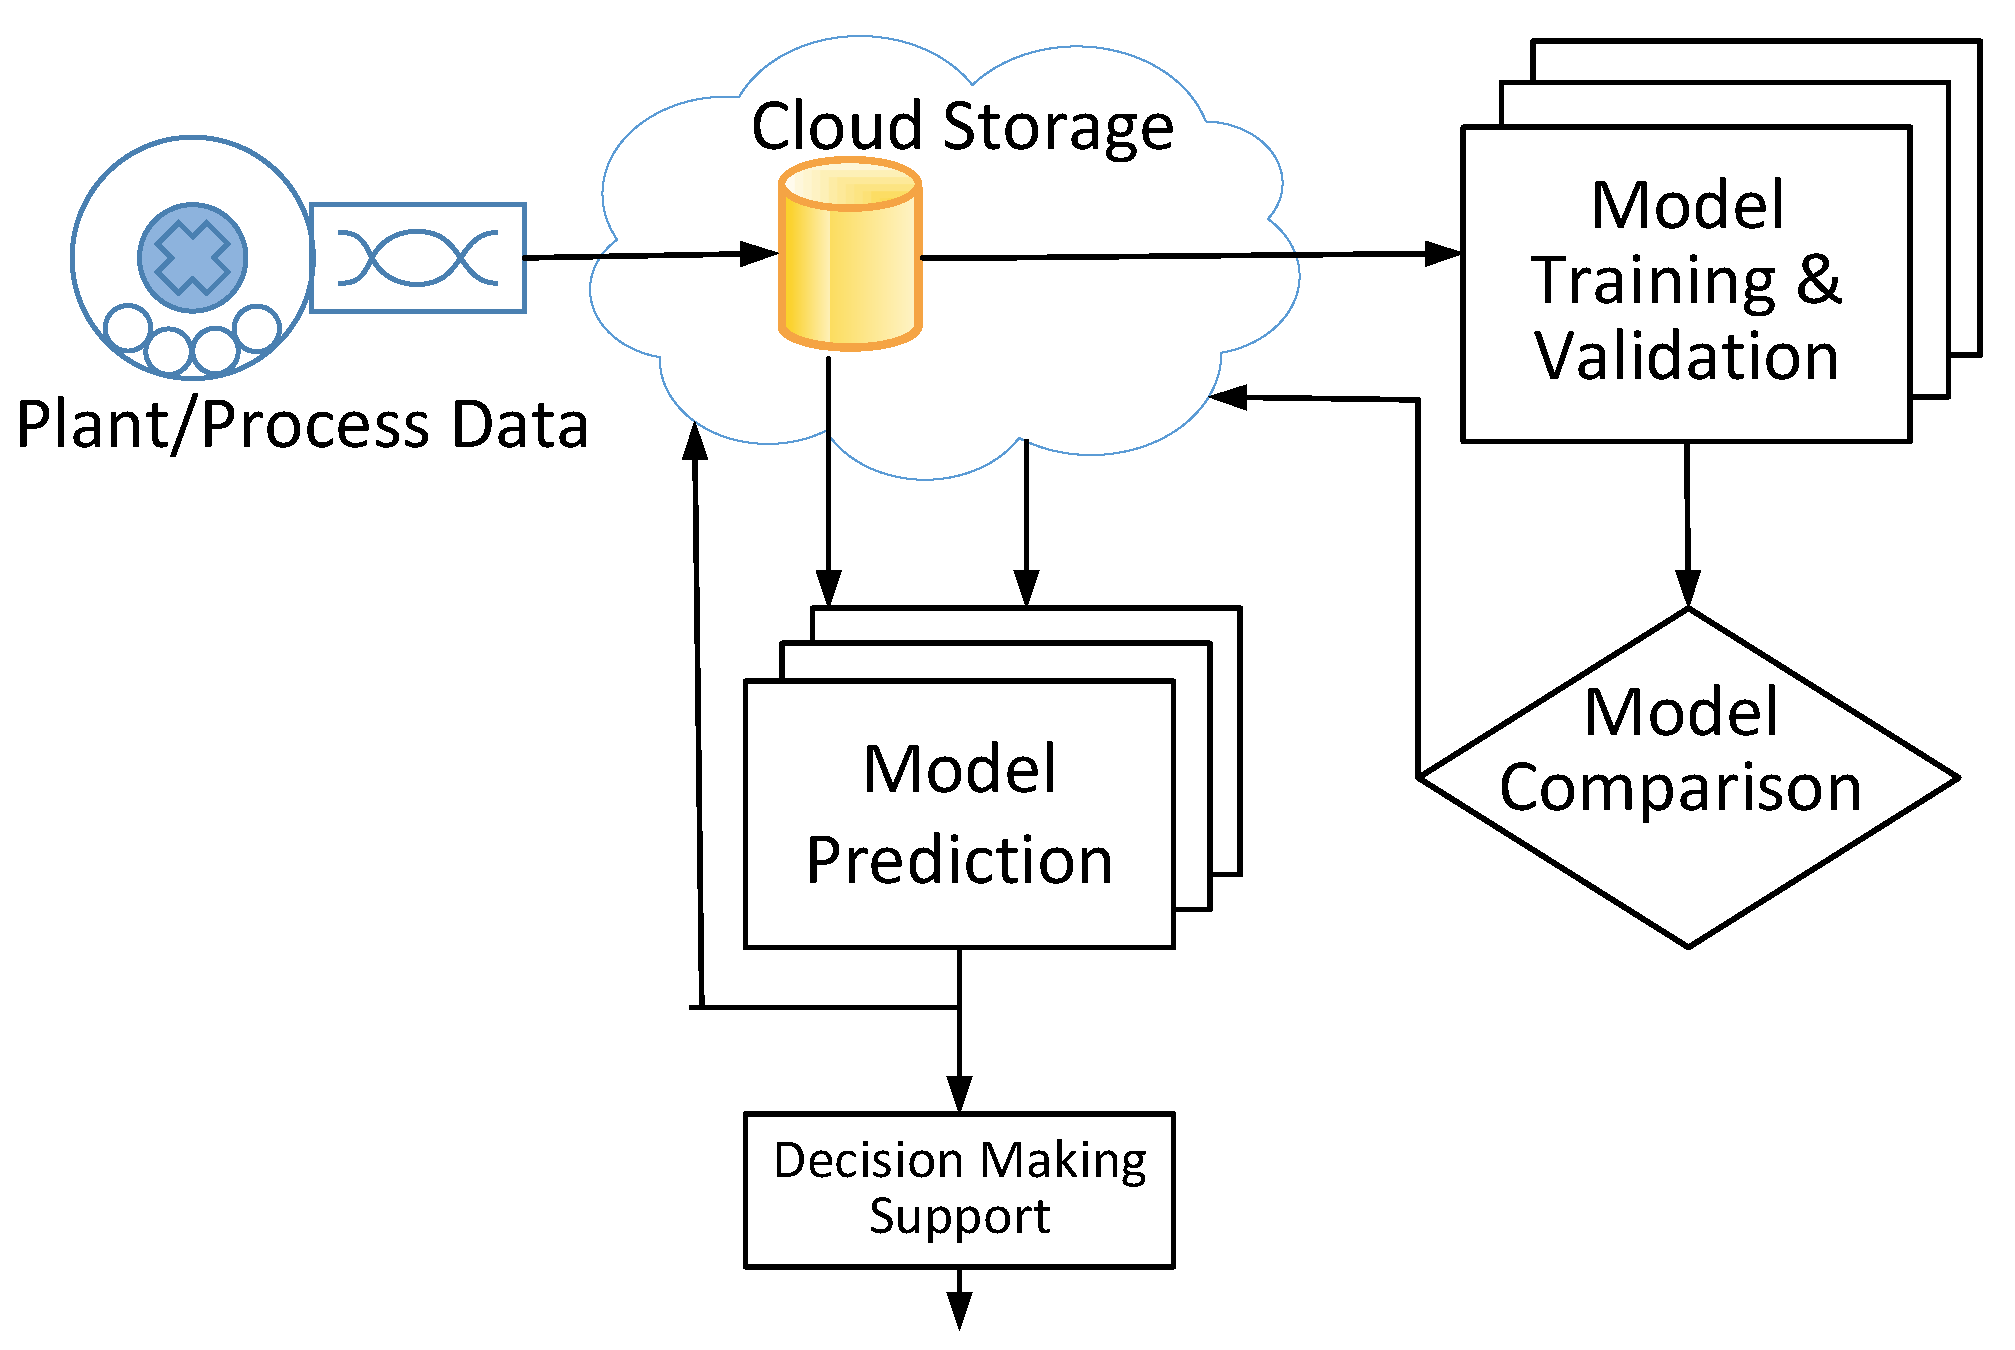
The framework proposed is designed to systematically organize sustainability considerations while minimizing the need for human maintenance of its components. It serves as a helpful tool in the PsM decision-making process when the status of assets must be considered. The framework can be divided into four main blocks with interconnected interactions between them over time.
The first block is related to understanding the problem, which requires analyzing the available data, variables, and potential models.
The second block concerns finding suitable structures of models, helping to estimate the relevant parameters for the decision-making process in PdM but also determine the uncertainty levels and stability against the model’s hyperparameters.
The third block is devoted to the continuous monitoring of the performance of the set of models selected as predictors over time. The use of production data and random tests is promoted as a systematic way of measuring deviations and acquiring continuous measurements of the set of models in use. Based on the process proposed, the individual models in the active set could require retraining and replacement. In this work, we propose an automatic process that accounts for performance and keeps it above the decided threshold.
Finally, the last block is designed to implement the RL to evaluate the different intervention alternatives and aid in decision-making.
The proposed framework is visually represented in
Figure 3.
Pay attention to the first block in terms of tools and data; it starts with the raw data that are prepared and gathered according to the labeled data structure of supervised learning. Therefore, “data collection and preparation” require the generation of a data-driven model to form the data into structures for the supervised language. This process requires multiple pre-tasks, including importing data, filtering outliers/error values, modifying the measurement frequency, and creating datasets for the global model based on the resampling of time series [
61].
Once all the information has been collected in a single dataset for the entire system, it is necessary to analyze the relationship between the features in the set. We adopted the approach presented in [
62] to establish the semantics of and relationship between signals.
Model selection is an important consideration for this particular block. In the current scenario, we are faced with a regression problem, and it is necessary to explore various techniques. The versatility of this component allows for adaptation based on existing knowledge of the problem, ensuring that it does not hinder generalization capabilities. Therefore, “possible predictive models needed to be identified” because of the great diversity of ML algorithms (classification models, regression, time series, etc.), and the models that could achieve the best performance in modeling the variables of interest were selected. Best performance is understood in a problem-specific context, and it is evaluated using appropriate statistical or operational metrics, such as accuracy, precision, recall, and F1-score for classification or mean squared error (MSE), mean absolute error (MAE), and R² for regression tasks. Rather than predefining a single modeling strategy, this framework supports a modular and adaptive selection process, where candidate models are evaluated through techniques such as cross-validation, grid searches, or Bayesian optimization, depending on the deployment constraints and domain knowledge. This approach ensures that the model chosen provides both high predictive accuracy and computational efficiency, without compromising generalization. The design of this framework allows practitioners to incorporate domain-specific constraints, such as interpretability, latency, or scalability, as part of the model evaluation criteria.
According to [
63], there are four different types of machine learning systems: supervised learning, unsupervised learning, semi-supervised learning, and reinforcement learning. There are a wide range of models using supervised learning structures. Some of the most recognized are linear regression, decision trees, random forests, and neural networks. Consequently, supervised learning can be subdivided into two different tasks (classification and regression), depending on what type of data must be predicted [
64].
In addition, the step related to “establishing accuracy assessment metrics” is required. The selection of the most appropriate metric for the models depends on the type of problem, but it is always necessary to evaluate the metric’s performance.
The second block involves several steps, such as the “development of the predictive model”. Once the data are prepared and the predictive models have been selected, they need to be trained using ML algorithms that perform the learning process based on the measured data. “Model comparison” is also required because the selected ML models are trained based on the measured data. As a result, the most accurate models are identified. For this process, threefold cross-validation techniques are used throughout the training set [
61]. Given the limited size of the available dataset, the adopted three-fold cross-validation strategy ensures a more reliable and unbiased assessment of model performance. This approach allows us to maximize the use of available data for both training and testing, mitigating the risk of overfitting that might occur with a simple train–test split. Each model is trained and evaluated in three different data partitions, ensuring that all samples are used for both training and validation.
The prediction capabilities for the adopted set of models are frequently assessed through a validation dataset. However, to obtain a stronger impression of the generalization capabilities of the models, an analysis of results with unseen data is considered relevant. It is necessary to test models with new data that have not been included in the training process to estimate the modeling capacity of the selected algorithms. Using metrics that allow one to estimate the difference between the predicted and measured values in a real environment, the ability of the algorithm to adapt to reality can be evaluated.
Finally, and importantly, a sensitivity analysis of the different variables that make up the system was carried out to estimate the weight and importance of each one. As a result, the variables with the greatest influence were identified.
Based on the performance achieved, the process designer can establish the acceptable precision threshold for the time window of interest for the particular process they are configuring.
To ensure the models used within a cloud-oriented workflow manager are reliable, configuration is necessary in order to perform trustworthiness checks. Deviations can be measured by implementing a workflow that collects estimates from each model over a specified time window and compares them with current measurements. If these deviations consistently exhibit bias over the course of several hours, the corresponding model must be retrained, which can be handled using another workflow in charge of preparing the training, validation, and test data as well as executing the cross-validation process and storing the new models, when acceptable. Once retraining is completed, the new model replaces the previous one, and the entire process continues seamlessly.
By following this procedure, an organization’s data scientists can gain insights into the dynamic behavior of an asset over the lifespan of models for specific variables. This insight can greatly contribute to improving the monitoring strategy for an asset and developing a deeper understanding of its behavior. Now, when a reliable prediction based on massive data models for asset behavior is in use, strategies for PsM can be analyzed.
In general, there are two common approaches to achieving this: applying optimization techniques to predicted values or utilizing simulation techniques to derive the best decisions directly from the data. Therefore, in a formal sense, prescriptive analytics comprises two fundamental components. The first component involves framing a decision problem, while the second component pertains to utilizing noisy observations from the environment, which only offer an incomplete indication of the true state of a system. The objective of prescriptive analytics is to use the available data to recommend the optimal decision, considering the limitations imposed by the noisy observations.
PsM techniques are good examples of sequential decision problems under uncertainty, implying that the overall outcome depends on a sequence of decisions. MDPs provide a powerful analytical framework for such settings and are often used to represent these problems [
65]. An MDP framework has the following key components:
A graphical representation of the MDP model can be seen in
Figure 4. According to this scheme and depending on the specific decision-making process in question, the policy to be enforced needs to be established, and the RL optimization agent will explore the relevant set of state sequences depending on the environment.
In the context of RL, the environment plays a crucial role, as it represents a model of the world where an agent operates. The environment is responsible for specifying the state space. In addition, it controls the consequences of actions, including state transitions and rewards, and relays this information to the agent. In typical baseline environments, state transitions and rewards are often assumed to be independent of external factors such as strain or weather conditions. However, real-world applications often require the incorporation of these effects. In maintenance management, the environment plays a critical role as an information hub, integrating data from the condition-monitoring system, which captures the natural degradation of the system. This is precisely where the set of models developed and maintained using the framework proposed in this paper becomes valuable.
This set of models can help account for the environment by improving the estimation of rewards for a range of exploratory actions that the agent needs to explore. Although these actions are determined based on the policy adopted and the current status of an asset, the predicted behavior estimated by the set of models is crucial to determining the reward associated with each action. In order to identify the optimal action, it is crucial to establish the returns, which represent the rewards received by the agent in each state. In this regard, the horizon method, which exclusively emphasizes short-term or long-term rewards, is not preferred. Instead, a variable called the “discount factor (
)” is introduced [
66]. This factor determines the weight given to immediate rewards when it is closer to zero, while values closer to one prioritize long-term rewards. Therefore, the discounted infinite-horizon method plays a vital role in determining the best action by appropriately balancing short-term and long-term rewards. Therefore, considering the reward of the current state and the discounted reward value of the next state brings us to the Bellman equation [
67].
Furthermore, the reward the environment provides to the agent serves as a proxy for the true cost incurred, but it is subject to uncertainty until the asset is actually maintained.
The comprehensive approach provided by the proposed framework can provide recommendations for actions in the decision-making process, and, even better, it can be explained based on the policy imposed and the rewards for the different actions. The proposed framework was intentionally kept agnostic in terms of the implementation platform, allowing different alternatives to be acceptable. However, good principles have been identified in [
68]. In this way, managers can better support their decisions.
5. Results
This section will present the details of the application of the framework introduced in the selected industrial case.
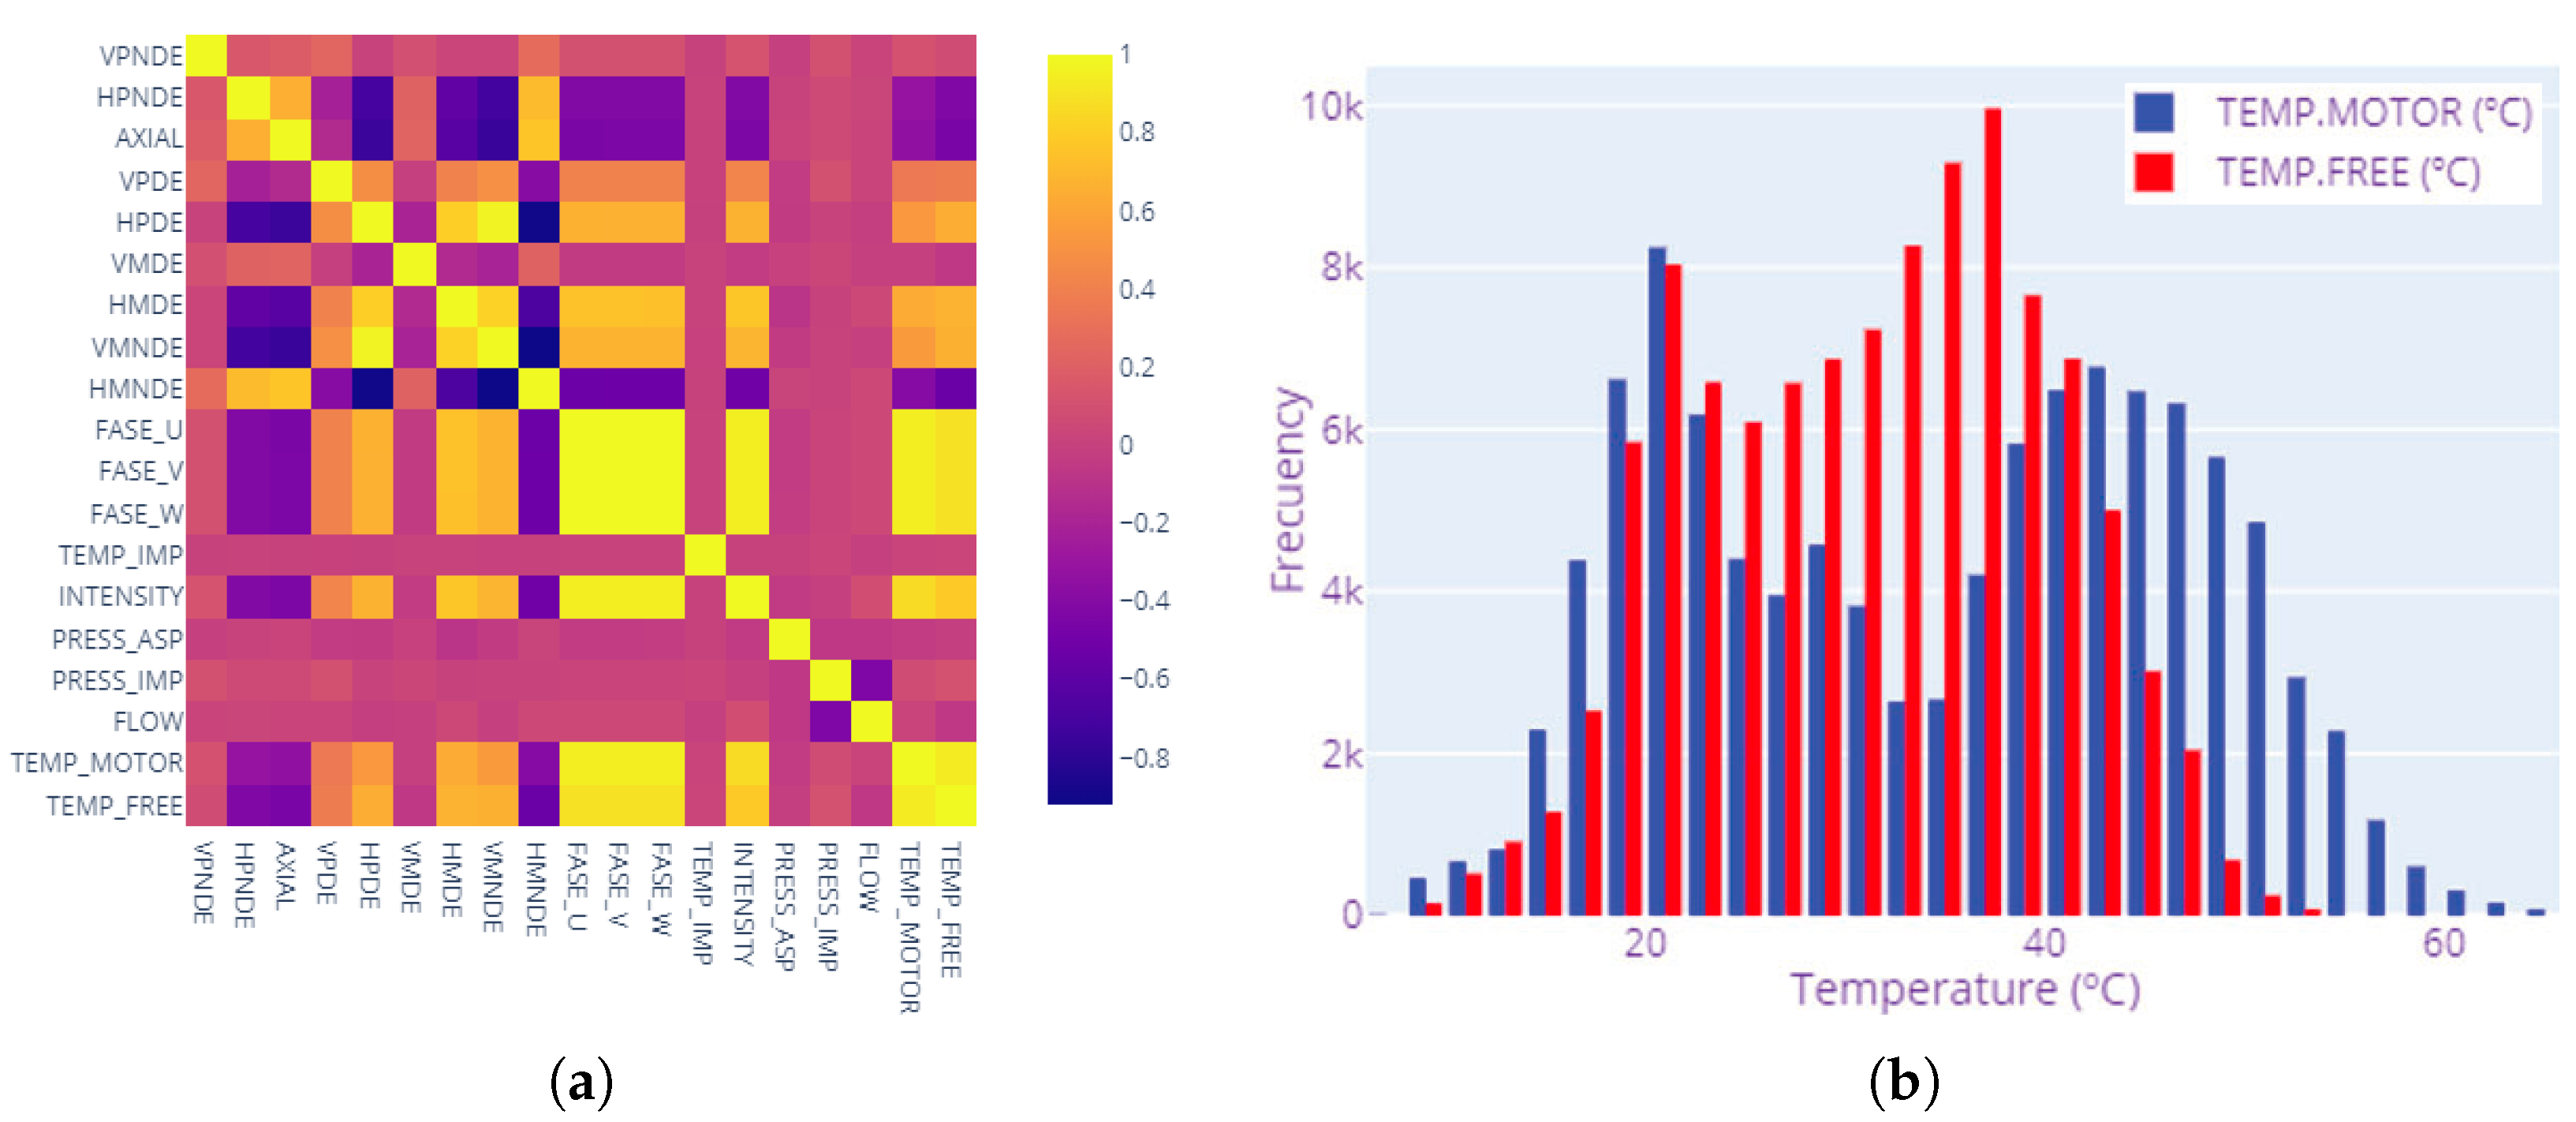
In the first block, a variable analysis was performed. In this case, the results of the correlation analysis show that two groups of variables with high correlation indices could be differentiated. The first group corresponds to the vibration features that present significant interdependence between them but very little correlation with the rest of the variables. The temperature values integrate the second group, with a significant correlation index. However, other features, such as flow or pressure, show a lower dependency on the rest of the features.
The poor correlation detected between vibration and temperature can be explained by the mechanisms that physically govern these parameters. Vibration signals are primarily reflections of mechanical defects such as shaft imbalance, bearing wear, or misalignment caused by friction and mechanical stress in the long term. However, temperature measurements tend to reflect thermal load and pump and motor efficiency under operating conditions, which may vary with process demand or cooling system efficiency. Since mechanical degradation and thermal load can increase individually, especially in earlier stages of failure, their poor statistical correlation is to be expected. Furthermore, temperature fluctuations may cause delays in vibration abnormalities because of heat transfer time delays or effective thermal conduction. This delimitation confirms the clustering observed in the correlation analysis and justifies the need for multi-sensor monitoring schemes.
For bearing temperature, the graph indicates a high correlation with multiple variables. The Pearson correlation coefficient between motor winding temperature and bearing temperature in
Figure 5a is 0.83. In fact, the correlation with intensity is also relevant, with a Pearson correlation of 0.79 (see
Figure 5a).
Furthermore,
Figure 5b presents a histogram of the temperature variables targeted, providing a visual understanding of their distribution. This analysis is critical to assess the presence of data imbalances or extreme values that could affect the predictive modeling process. This visualization supports the identification of relevant pre-processing steps to ensure that the models are trained on representative and unbiased datasets.
Then, the next step in the first block is the selection of models. In this case, our objective is to predict the evolution of numerical variables. This is a supervised regression-type problem. Regression modeling using supervised techniques requires preparing two datasets, corresponding to the input and output variables, with the output variables being the temperature of the pump motor assembly (two variables). These datasets must also be divided into training and testing sets: the primary purpose of the former is to enable the learning process, while the test set will be used to measure the accuracy of the entire algorithm with respect to unseen data. Since a non-stratified cross-validation strategy was adopted, the sizes of the training and test populations were already fixed. In addition, future data must never be used to make predictions of past events, so the sets were not be shuffled at any time [
61].
Once the relationship between the input and target variables is known, the next step is to select the features necessary for the development of the model. In accordance with [
69], to reduce the degrees of freedom of the algorithm, which reduces the number of unnecessary features, regularization models such as Lasso, ElasticNet, and Ridge were considered. These models help to reduce overfitting and the complexity of the model. In addition, multicolinearity analysis was applied.
The next block deals with the construction of the models. Once the training and test sets have been generated, the training data set is ready to be applied in the model to make predictions. It is also important to note that model analysis was performed on the global pumping system, which includes data from both NCP1A and NCP1B pumps. Models of each individual system were also generated to establish differences.
The next block concerns the assessment of the models. Although there are different model performance measures, an excellent way to measure a model’s performance and compare its accuracy with that of different models is by using the Mean Square Error (MSE) [
64]. Therefore, the model that develops a lower MSE after training in the training set is the one with greater accuracy.
A model performance summary is presented in
Table 1, showing that the accuracy of the regularized models is better than that of the simple linear model. This fact may imply that this model tends to overfit the data. Concerning non-linear models, both the decision tree and random forest models performed much better than the K-nearest neighbor algorithm. In particular, random forest has the highest prediction among the nonlinear models [
70]. Although the MSE value for the random forest algorithm is very similar to that of the regularized ElasticNet algorithm, the latter has a significantly lower standard deviation of the MSE values. Therefore, we selected ElasticNet for prediction [
71].
Since the random forest method is nothing more than a bagging ensemble method, other ensemble methods perform similarly, as presented in
Table 2.
Models with better results were optimized using the Scikit-Learn library. The optimization process consisted of selecting the best hyperparameters for the model adopted with respect to the entire training dataset for the pumping system by using a grid search. Two hyperparameters were optimized for the ElasticNet model. The first represents the degree of regularization. The higher the value of , the greater the penalty for the weighted terms and the greater the degree of regularization. The second parameter refers to the type of regularization, denoted as regularization (Lasso) when its value is 1, and regularization (Ridge) when its value is 0. The MSE value was reduced, and the optimized value for both hyperparameters was found to be 0.5, producing an MSE value of 17.14 for the NCP1A pump. The benefits of the NCP1B pump are slightly short of the target, with an MSE of 20.22.
All the experiments were conducted on a Linux workstation equipped with 32 GB of system RAM and an NVIDIA Quadro GPU with 24 GB of VRAM. Implementation was carried out in Python 3.10, employing deep learning models that use CUDA version 12.4 for GPU acceleration. The average training time in cross-validation folds was approximately 5 min and 17 s, with a standard deviation of 1 min and 23 s. This demonstrates the computational feasibility of the framework for near-real-time adaptation or retraining scenarios, especially in industrial environments where hardware acceleration is available.
Regarding research question RQ1 posed in
Section 1, after the analysis was carried out, it became evident that multiple models can be involved in estimating the desired parameter. This includes ensemble techniques, such as bagging approaches, as a notable example. To improve the robustness of temperature prediction, a greedy ensemble learning approach that integrates the outputs of several base regression models was used. The integration mechanism is a weighted average, where the weights are determined through a greedy selection process based on validation performance. Specifically, models are ranked by their individual performance in regard to a holdout validation set, and weights are assigned proportionally to the inverse MSE, ensuring that models with better generalization contribute more to the final prediction. In this use case, cooperation between the Lasso, ElasticNet, and RandomForest models was employed, and the final performance is summarized in
Table 3.
All the previous information refers to the global model, which contains the data from both pump motor assemblies. To allow comparison with the precision of the overall model and establish if there were significant differences in pump characterization, individual datasets and training and test sets were created, increasing in size from 5% to 20% to respect the classic ratio of 80/20. For consistency in comparison, the same type of model (ElasticNet) was used; a summary of the results is presented in
Table 4.
After analyzing the regression models, we tested an evaluation step of the model by using a neural network algorithm. Such algorithms, like regression models, and their operation are based on a layered architecture.
Although newer deep learning models such as Transformers have demonstrated outstanding performance in complex time-series-forecasting tasks, their effectiveness typically depends on the availability of large datasets and highly correlated and richly structured features. In this case, the dataset was limited both by size and the degree of inter-feature correlation, as the measured variables are highly individualized and related directly to the physical constraints of the process. Therefore, more suitable models, such as LSTM, with relatively smaller datasets were used to uncover temporal relationships. Similarly, reinforcement learning was used, not to introduce new algorithmic innovations but to leverage its proven strength in optimizing sequential decision making under uncertainty in the proposed framework.
It is important to note that the greatest contribution of this effort does not lie in presenting new machine learning models or architectures but rather in the development of a strong, scalable, and self-driving infrastructure independent of the specific modeling approach used. This infrastructure can process and coordinate the lifecycle of any predictive model, whether statistical, ML-based, or even Transformer-based models, keeping their real-time performance-tracking and adaptive retraining abilities in place to cater to changing industrial demands.
In particular, analysis was conducted using Recurrent Neural Networks (RNNs), characterized by their ability to use past data to make predictions. In the RNN algorithms, a long short-term memory (LSTM) cell was used. Were were able to reserve entries for long-term and short-term learning within the memory for storing past data. The created model involves a first layer with 19 neurons (1 per feature), with an input size equal to the number of previous measurements used for each prediction (5) and 19 variables for each measurement. A dropout regularization that switches off 5% of neurons was also included to avoid overfitting problems. Finally, a dense layer was included to allow connection to the output of the neural network. The Adam optimizer, the most widely applied of its kind, was used to compile the neural network model. During compilation, the learning and optimization processes were conducted following the same criteria used in the regression models. The learning process was performed for each epoch, and the validation error was calculated. This process was repeated until the validation loss assumed a stable value, as presented in
Figure 6a.
The model results for the test set are as follows: MSE, 1.749; R-squared, 0.984; RMSE, 1.314; and MAE, 0.937. These results show that the selected model makes predictions with a high coefficient of determination. The MSE value is lower than the results obtained during the validation process, and the RMSE and MAE present similar values. In addition to these four metrics, the accuracy of the predictions was also graphically evaluated by comparing the models’ results with the measured values for the two target variables: the bearing temperatures on the pump side (TEMP.MOTOR) (see
Figure 6b) and the free side (TEMP.FREE). These results show a prediction quality much higher than that of the pure regression models.
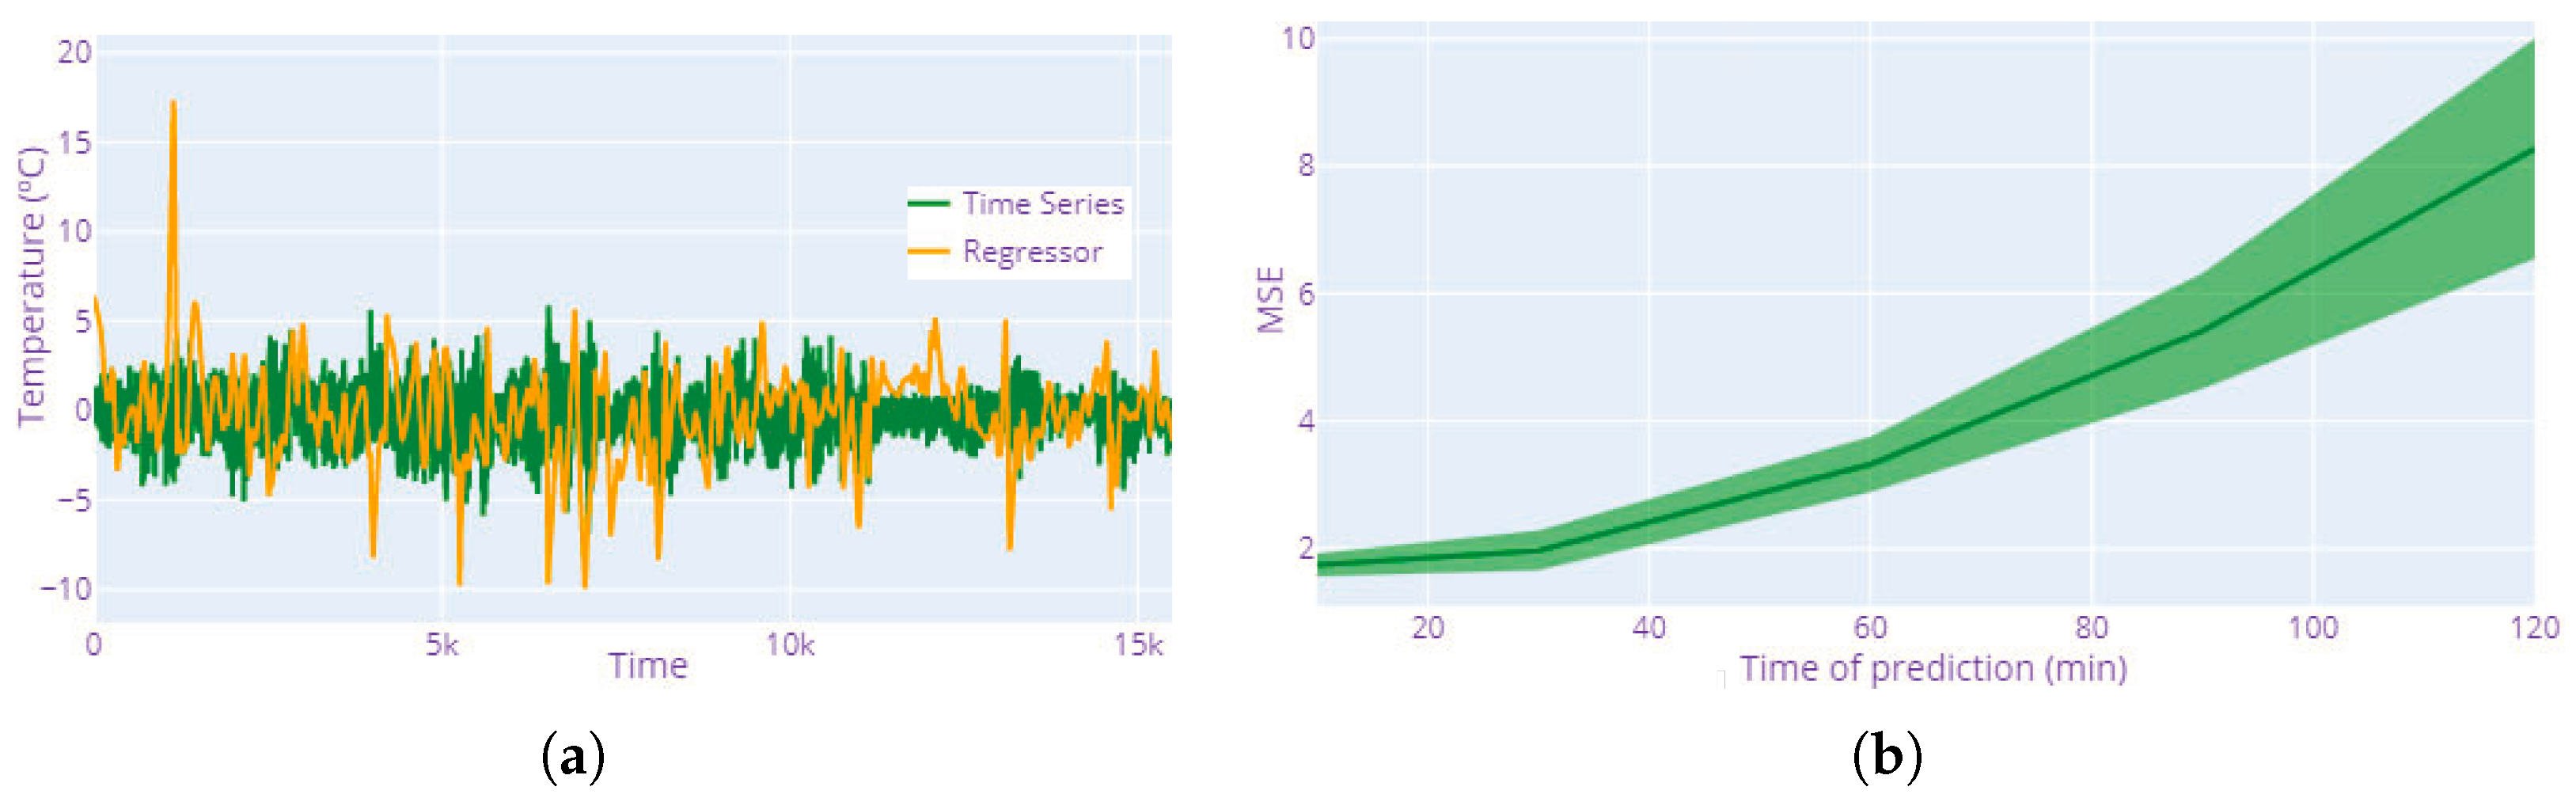
The residual values of the LSTM predictions tend to lie much closer to zero than the results of the regression model (see
Figure 7a), indicating that the distance between the actual value and the value predicted by the model is much smaller in the case of a neural network. However, one must consider that both models work differently. While the regression model seeks to obtain the value of a feature through correlation with the rest of the variables, the LSTM neural network receives as an input the values of the five previous measurements to predict the temperature value in the next time step. It is also important to note that bearing temperature predictions were made for the value over the next 10 min. However, it is possible to train the neural network to estimate bearing temperature values for longer time intervals (see
Figure 7b).
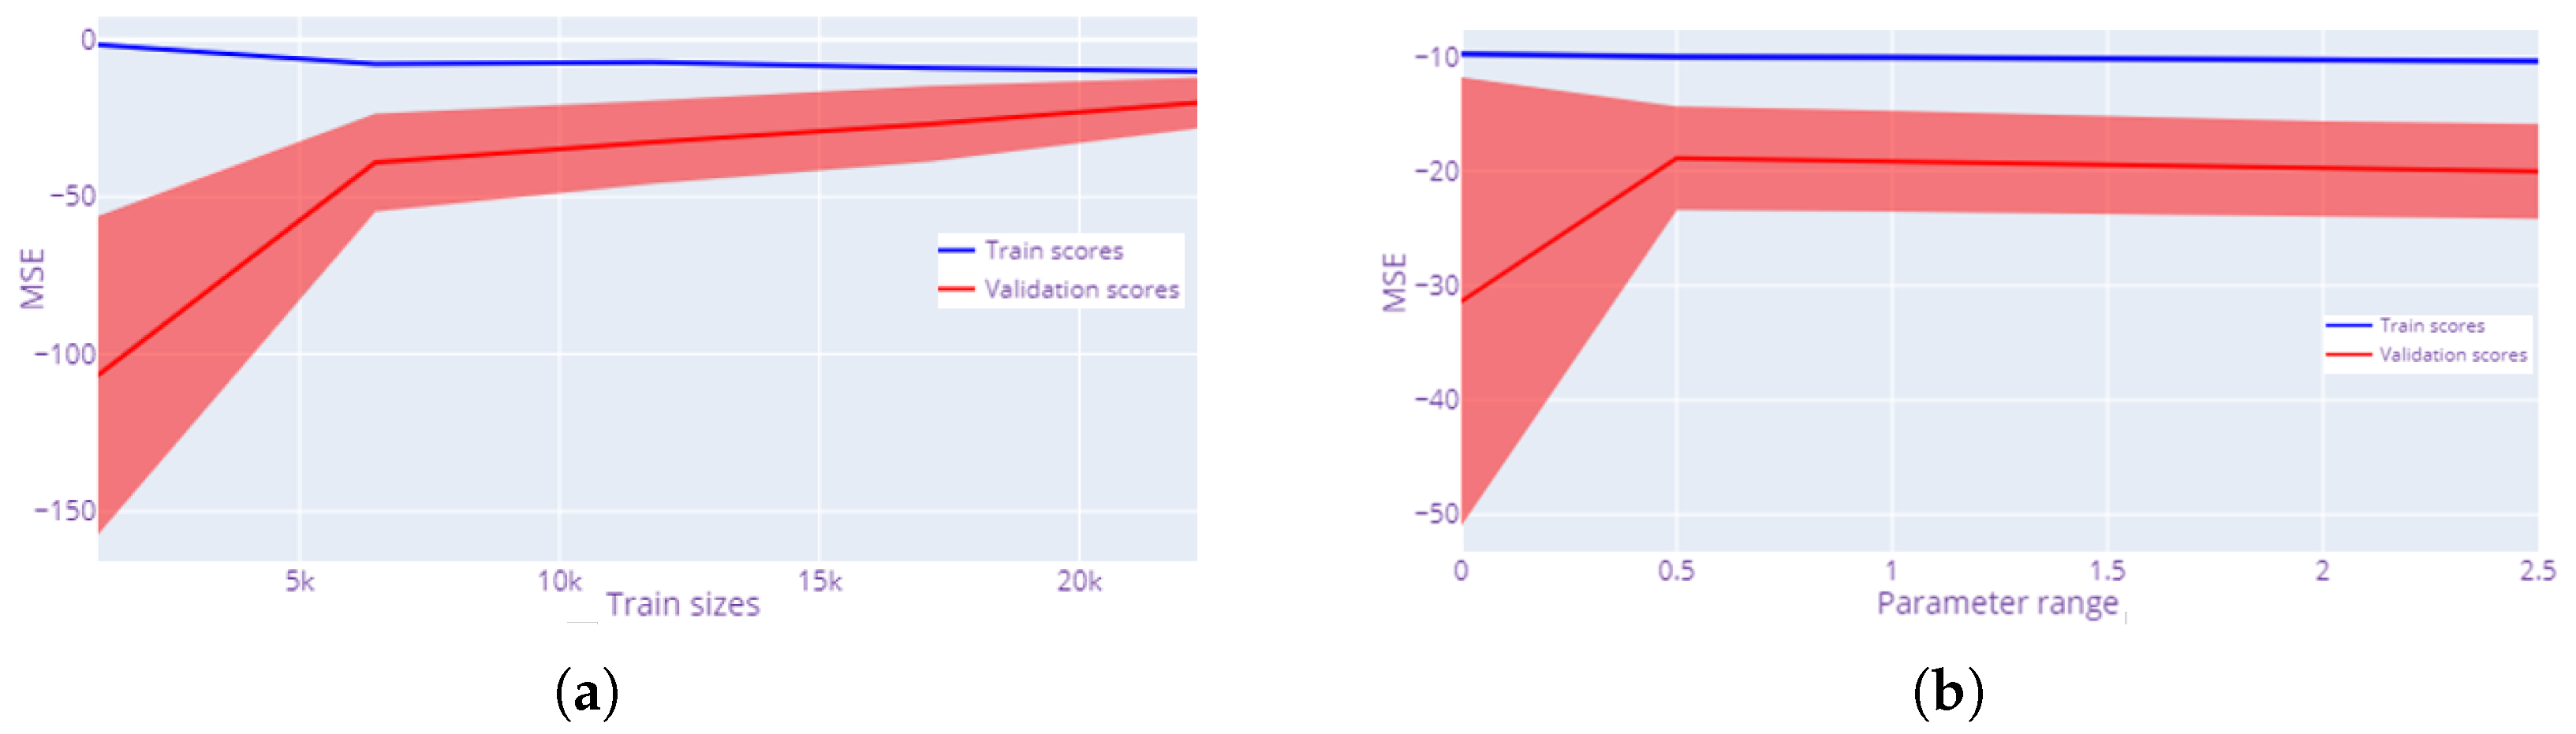
Learning curves are among the most widely used tools for evaluating the performance of regression models. learning curves show how a model ’generalizes’ for unseen data [
72,
73,
74]. The performance pertaining to the learning curve in
Figure 8a shows that the increase in the number of data points improves the model’s learning process with respect to the validation set. The MSE of the validation set reduced not only with the increase in training size but also its standard deviation. Therefore, the learning curve shows the importance of the data points with respect to improving accuracy. It is also important to note that, in our case, from 6k data points onward, the MSE value becomes much more stable.
Validation curves are beneficial for addressing under- and overfitting [
64]. Here, instead of calculating the scores of the validation and training sets for different training set sizes (learning curves), the value of both scores is obtained from the variation in a model parameter. In
Figure 8b, the ElasticNet model parameter
is analyzed. The results confirm that the absolute value of the MSE for the validation set reaches the efficient value when
. In fact, the MSE value for the training set does not show appreciable variations. Consequently, there are two clearly differentiated trends in the graph. For alpha values less than 0.5, the effect of the penalty is low, so the model cannot generalize correctly. In other words, overfitting occurs. However, the accuracy of the model slowly decreases for values greater than 0.5 because the penalty is too large and under-fitting occurs. The optimal value of the model is the one for which both phenomena are minimized.
The work performed up to this point provides a good understanding of the models’ behavior regarding time horizons as well as hyperparameter settings, enabling data scientists to suggest the appropriate configuration.
The findings confirm that even with conventional models such as LSTM and generic RL algorithms, the self-directed framework proposed in this paper can perform with better prediction accuracy and robust prescriptive maintenance plans. They show how the proposed framework can be easily adapted and reveal its cross-domain applicability, which, regardless of any modeling paradigm selected by the practitioners, will assist in facilitating anything they may have decided to implement. As more comprehensive datasets become available and newer sensor technologies provide more robust feature spaces, this system will be able to accommodate more elaborate models, e.g., Transformers, which do not require any structural changes. This quality ensures long-term usability and scalability, further adding to the industrial applicability of the suggested solution.
However, this approach is static and limited to the observed dataset, but our goal is to employ them in the future, wherein degradation rates can change and the region of state space where the process is located can evolve.
To address this issue, we propose implementing a cloud-based workflow technology able to manage the continuous measurement of deviations per type of model and, based on these deviations, handle the retraining of the model. The proposed framework pushes toward IT/OT convergence through the capabilities provided by cloud technologies (see
Figure 9), and it further complements the proposal found in [
75].
Consider continuous data ingestion from a plant or processes concerning cloud-oriented structures. We employed a test configuration using Telegram/Influxdb technology [
76], but Kafka [
77] or even PI solutions [
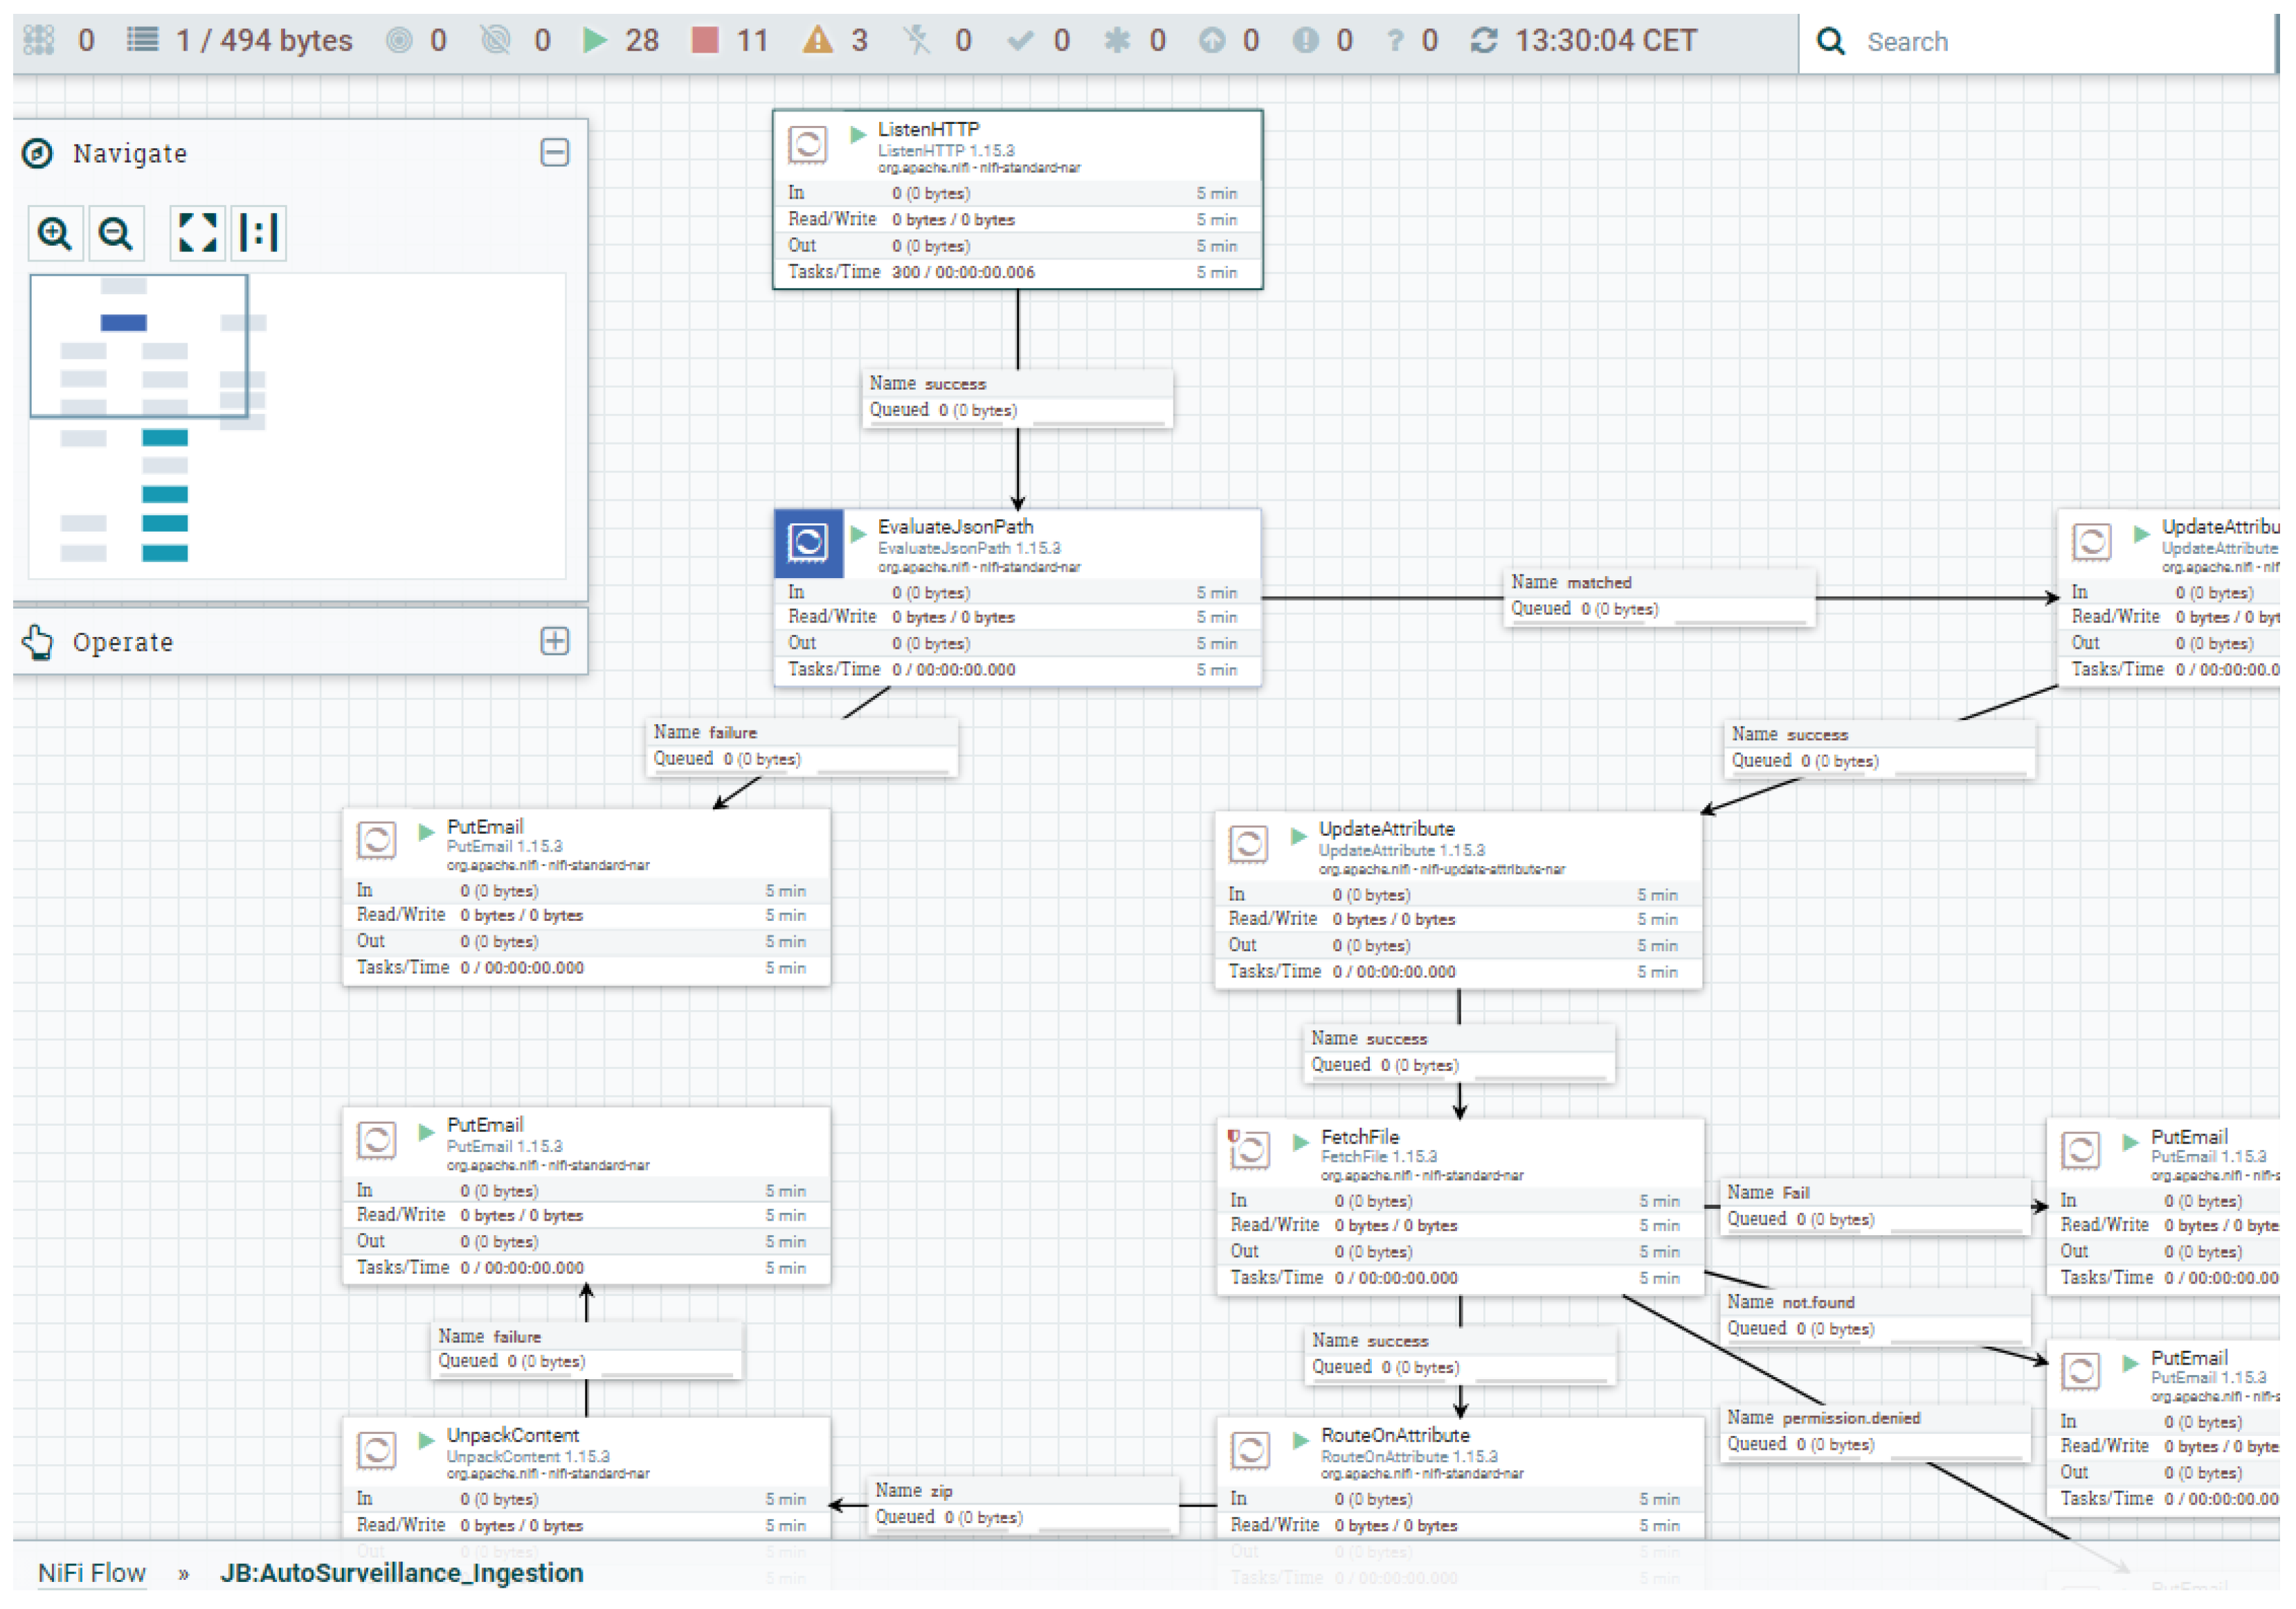
78], among others, could also be used. NiFi technology, as a workflow management tool, is used to orchestrate all required operations with sufficient flexibility, mainly due to its scalability (see
Figure 10) [
79]. However, other alternatives, such as airflow™ or dagster™, among others, can also be used. In this way, not only are remotely driven ingestion procedures allowed, but also others can accept batch processing by uploading the collected data from systems such as IBA to a Minio server [
80] and then establishing the appropriate transformations (ETL operations) to feed the data into the time series database.
From the time-series-oriented database and the model’s repository stored in the cloud, time-scheduled predictions for the adopted models (or ensembles) were launched using NiFi workflows, in our case, every five minutes. In fact, we recorded not only individual model predictions but also an aggregated one (using greedy ensemble integration). The prediction for bearing temperature behavior during the next 60 min, made using the ensemble model, could be used for supporting decision-making processes (when the prediction exceeds a threshold, details are sent to different stakeholders, including people responsible for maintenance).
The described approach effectively addresses the Ops requirements, but to incorporate the Dev side, additional NiFi workflows were established. These workflows enable continuous monitoring of model performance, wherein the measured data are read one hour later to calculate and record the actual performance of the models.
The proposed framework provides a solution to research question 2 (RQ2), as it outlines a systematic approach to deploying machine learning models with self-supporting capabilities. This approach enables continuous monitoring and updating of models with minimal human intervention, effectively answering the research question.
Another workflow, scheduled hourly, determines whether retraining is required for model families when systematic bias is detected. The criteria for determining bias are established based on control chart theory or when deviations exceeding 1.5 times the accepted accuracy are observed across the majority of samples in the recent period. In this application, a tolerance of 5 °C was adopted.
When a newly created cross-validated model demonstrates performance superior to that for the existing set of parameters, the workflow replaces the old model in the repository and archives the previous one. This requires the storage of individual model predictions since these workflows facilitate continuous performance assessment, and new process data can contribute to ongoing updates of the models.
Additional workflows are responsible for conducting the performance life-cycle assessment, including evaluating the number of models available for active consideration and monitoring the frequency and effectiveness of the retraining processes.
These workflows, responsible for maintaining updated models and conducting a comprehensive performance assessment, play a crucial role in advancing the optimal selection of actions (strategies) for the decision-making process.
The RL technique becomes helpful in this particular schema due to the presence of an environment that allows for the exploration of the rewards associated with various actions to be taken at the asset level. The policy defines the set of actions, and the agent systematically proposes them based on anticipated degradation, which is closely connected to the evolution of the variable estimated by the ensemble models continuously updated by the framework.
The results obtained validate the potential of the proposed framework in improving predictive and prescriptive maintenance outcomes compared to the static solutions dominant in the literature. Unlike models suffering performance degradation over time due to concept drift and a lack of retraining mechanisms, our framework continuously tracks prediction errors and initiates automatic retraining processes, ensuring the relevance and accuracy of models.
This autonomous mechanism has been shown to lead to significant improvements in maintaining high predictive accuracy over extended operating periods, as validated through the case study in a real industrial environment. In addition, the integration of RL into decision-making, along with new ensembles of models, has shown how maintenance policies can be dynamically optimized, leading to tangible operational benefits, such as reduced unplanned downtime and resource optimization.
6. Discussion and Conclusions
In this study, we propose a novel technological framework that takes the application of machine learning technologies in predictive and prescriptive maintenance to another level by integrating a self-managed, cloud-enabled monitoring platform. This framework is novel in the sense that it has the capability to automatically oversee the entire predictive model lifecycle through the integration of continuous performance monitoring, automatic retraining workflows, and seamless redeployment without human intervention. This level of automation and autonomy addresses central limitations in the current literature, wherein most contributions focus solely on maximizing predictive accuracy or propose maintenance approaches independently of the sustainability and long-term validity of the models implemented.
Our solution also exceeds the state of the art by incorporating DevOps-oriented practices within industrial maintenance processes, enabling a structured model governance and lifecycle management strategy, thereby ensuring that predictive models remain accurate and valid over time despite operational variability and evolving degradation patterns. Such an approach is particularly valuable in industrial environments where concept drift and model accuracy degradation are significant concerns for the reliability of predictive maintenance systems.
Importantly, the contribution of this work lies not in the use of a specific machine learning approach but in the development of a robust and flexible methodological framework that is independent of the underlying predictive models. Although long short-term memory (LSTM) networks and Reinforcement Learning (RL) were utilized due to the nature of the available dataset and the personalized nature of the physical variables being tracked, this system is designed to be capable of accommodating more advanced modeling techniques as they are made available. In particular, while Transformer-based models have shown a lot of promise in other domains, their application here is hindered by both the limited quantity of data and the highly technical nature of the predictive features. However, the framework described herein provides the architectural foundations required to include such models when appropriate datasets are created.
The results concerning the learning curves show the importance of the quantity of data obtained in increasing the accuracy of this model, especially with respect to the initial data used during the learning process. These initial data allowed for a large reduction in the validation MSE value. However, the validation curve shows the importance of optimizing the regularization parameters for the ElasticNet model, showing the tendency to overfit when the model is not optimized.
In this study, we explore the capabilities of different types of models to make predictions of behavior for industrial assets considering the sensitivity of the hyperparameters and the time window ahead for these predictions. According to the findings, and from the perspective of their industrial application, some models can estimate behaviors for the operation of assets regarding the interesting variables, not only regarding accuracy but also uncertainty levels when predictions are considered. In fact, different models can contribute differently to these goals.
This paper also provides a reference framework for enabling the integration of such models into industrial practice. Traditionally, this approach requires model deployment and technical implementation steps [
81]. However, in most cases, the proposals do not consider the general perspective of technical integration, monitoring, and updating. Instead, these concerns are addressed case by case.
Due to the increase in the usage of IoT already discussed in the Industry 4.0 context, an accelerated convergence between Information Technology (IT) and Operational Technologies (OTs) has emerged [
82,
83]. IT and OT are converging in terms of their functionalities, leading to the Industrial IoT through the realization of Cyber–Physical System-of-Systems (CPSoS), where DevOps (Development and Operations) and security-enhanced DevSecOps methodologies enable flexible, reliable, and timely completion of related processes [
84].
Finally, this paper contributes to the industrial deployment of the proposed models by promoting a reference framework and a convenient set of tools, reducing the model maintenance efforts that are frequently required from a practical point of view. In the context of Industry 4.0, the proposed monitoring and prediction system can be practically deployed within smart manufacturing environments by leveraging edge computing, industrial IoT platforms, and standardized communication protocols. Sensor data from critical components, such as bearings, pumps, or motors, can be collected using embedded devices or industrial gateways and transmitted in real time through MQTT or OPC-UA protocols. The data pre-processing and predictive modeling stages can be deployed either at the edge for low-latency decisions or in a centralized cloud-based infrastructure for deeper analytics. Integration with existing SCADA or MES platforms enables seamless visualization and operational interfacing. Furthermore, the modular design of the system supports scalable deployment across different machines or plants, and its outputs (fault indicators, remaining-useful-life estimates, etc.) can be fed into reinforcement learning agents or rule-based decision systems to automate prescriptive maintenance actions. This alignment with industry 4.0 principles: interoperability, real-time analytics, and adaptive control positions the system as a practical and forward-compatible solution for predictive and prescriptive maintenance in modern industrial settings.
After being positively addressed with the RQs, it is possible to emphasize that ML models are capable of predicting system values quite accurately, which is relevant not just for asset maintenance but other areas as well. However, one must consider that the accuracy of predictions is closely dependent on time, with predictions being much more accurate for values closer in time. As noted above, one of the most sensitive factors of pumping systems is the state of the bearings. From the temperature modeling using the case study data, it would be possible to incorporate alarms indicating when the temperature of bearings exceeds threshold values because the LSTM time series model can predict temperatures far in the future.
The data measured in the pumping system case correspond to information on the functioning of the machine in question under operating conditions. However, other types of information can be collected, wherein ML techniques can be helpful for PdM activities. Similarly, the proposed reference framework can become useful for other areas, such as quality monitoring at the asset level, because of the flexibility of the framework and the tools used to allow such expansion.
Some researchers have employed data on failures, maintenance needs, or singularities to use classification algorithms that detect and classify a problem. However, this paper does not consider this case because we have not yet collected enough data to express degradation or sudden failures in the asset components, but this topic will be addressed in the future, particularly by using cyclic spectral analysis [
85] and with the help of the proposed framework.
In conclusion, this work makes a significant contribution to the field by offering a scalable, sustainable, and operationally viable solution for predictive maintenance that ensures the long-term effectiveness of deployed models. By addressing the critical need for automated model updating and continuous performance assessment, this research provides a solid foundation for future advancements in industrial predictive maintenance and supports the broader objective of achieving truly autonomous and intelligent maintenance systems.
Although a considerable number of physical variables were measured in this study, not all of them demonstrate a significant contribution to the accurate estimation of bearing temperature. This observation suggests the need for future research efforts to focus on systematically identifying and eliminating variables that do not enhance predictive performance, thereby reducing model complexity and optimizing data processing requirements. In parallel, we also recognize that the current dataset is limited in terms of feature diversity and richness. To address this limitation, future work will expand the sensing system to include additional modalities that can enhance condition monitoring accuracy. Specifically, we will integrate vibration spectrum sensors capable of capturing high-resolution frequency domain data. These signals will be analyzed using Fast Fourier Transform (FFT) techniques to extract frequency-based features indicative of early-stage mechanical faults. In addition, there is interest in exploring multimodal data fusion strategies that combine temperature, time-domain vibration, and frequency-domain features to improve prediction accuracy. This expansion will be designed to ensure complete compatibility with our existing data acquisition and machine learning pipeline, allowing seamless integration and evaluation within the current framework.
Moreover, an expansion of the dataset through extended data collection campaigns and the integration of new sensor modalities would not only improve the representativeness and quality of the available information but also enable a robust comparative analysis with more advanced modeling approaches. In particular, such efforts would facilitate the evaluation of state-of-the-art architectures, including Transformer-based models, which require larger and more comprehensive datasets to fully exploit their modeling capabilities. Although the present work focuses on frameworks that are effective under limited data availability conditions, future research will aim to explore the potential advantages offered by these modern deep learning architectures when supported by richer datasets, further validating the versatility of the proposed framework and ensuring its applicability to increasingly complex predictive maintenance scenarios.
A relevant area for future work is incorporating explicit cost models that account for both operational disturbances and the infrastructure costs of data collection, storage, and processing.


