Article

Parametric Investigation of Oblique Incidence Angle Effects in Near-Fault P Waves on Dynamic Response of Concrete Dam

1
College of Civil Engineering and Architecture, Dalian University, Dalian 116622, China
2
National Marine Environmental Monitoring Center, Dalian 116023, China
3
State Key Laboratory of Coastal and Offshore Engineering, Dalian University of Technology, Dalian 116024, China
*
Author to whom correspondence should be addressed.
Appl. Sci. 2025, 15(12), 6853; https://doi.org/10.3390/app15126853
Submission received: 24 May 2025 / Revised: 15 June 2025 / Accepted: 16 June 2025 / Published: 18 June 2025

Abstract

:
Using numerical simulations, this study investigated the seismic response of concrete dams when subjected to near-fault obliquely incident P waves. For comparison, several near-fault pulse-like movements with different motion parameters were selected and decomposed into non-pulse residual components. A seismic input procedure for P wave oblique incidence was developed and verified based on the viscous-spring artificial boundary theory. A finite element model of a concrete dam system was used for nonlinear time history analyses. The damage and displacement responses were analyzed under pulse-like and non-pulse motions with incident angles varying from −90° to 90°. The response differences induced by the pulse characteristics incident direction were examined. The relationship between the seismic parameters and response indices was also determined to obtain the optimal seismic parameter describing the variation under different incident conditions. Moreover, the coupled effect of the pulse feature and oblique incidence on the dynamic response and seismic behavior was examined. Finally, a nonlinear three-dimensional predictive model was proposed based on the optimal seismic parameter Sa(T1) and incident angle, exhibiting high correlation and accuracy. The results demonstrated that incident angles between 60° and 75° (with higher spectral acceleration values) intensified the dam damage and vibration when subjected to the oblique near-fault P waves, a crucial discovery for improving the seismic design and safety measure of concrete dams located in regions prone to near-fault seismic hazards.

1. Introduction

Concrete dams are crucial components of large-scale water conservancy projects, playing a pivotal role in national infrastructure and broader economy by facilitating the generation of sustainable, clean hydroelectric power. Most of the dams in China are located in the western region, prone to frequent and intense earthquakes. Spanning enormous distances, these dams are vulnerable to disruption from nearby fault ground motion. Previous studies [1,2,3,4] have highlighted the potential for near-fault (NF) ground motion to damage structures, including concrete dams, tunnels, and steel buildings. Moreover, the collapse of a concrete dam would be a severe infrastructure disaster, potentially leading to catastrophic damage and substantial property loss. Consequently, comprehensive research into the seismic performance of concrete dams located in NF regions has become increasingly important.
NF ground motion exhibits distinct characteristics compared to standard earthquakes, notably in its long-period velocity pulses and high energy resulting from forward-directivity and fling step effects [5]. Such pulse components can lead to considerable cumulative damage to nearby structures [6]. Recent studies [7,8,9] have examined the dynamic response of various structures to NF earthquakes, discussing potential factors influencing the seismic responses. For instance, Sun et al. [10] investigated the seismic response of concrete rockfill dams under pulse-like (PL), non-pulse (NP), and far-fault earthquake excitations using finite element analysis. Their study employed wavelet multi-scale decomposition technology to simulate artificial NF earthquakes and compared response results with actual earthquake records, highlighting the necessity of considering PL earthquake characteristics in rockfill dam design assessments. Wu et al. [11] quantitatively assessed the influence of PL motion on the seismic behavior of earth dams prone to liquefaction-induced damage. Their results indicated that PL motions increased the liquefaction potential and post-event damage compared to standard motions, with the effects being dependent on the seismic duration and energy. Daei et al. [12] quantified the effects of PL motion on frame buildings of varying heights and conducted a detailed evaluation of their seismic performance.
Furthermore, seismic parameters including the pulse period (Tp) and the ratio of peak ground velocity (PGV) to peak ground acceleration (PGA)—known as PGV/PGA—were employed to describe the pulse characteristics of PL motion in [13,14], as they exhibited a remarkable effect on the seismic response of structures [15,16]. Xu et al. [17] explored the natural self-similarity within seismic characteristics and the dynamic performance of a concrete gravity dam under decomposed NF motion, highlighting the significance of seismic design for concrete dams, particularly focusing on the intensity and pulse parameters. Yazdani and Alembagheri [18] examined the feasibility of estimating response using an equivalent pulse rather than PL motion. They investigated the impact of dominant seismic parameters on the seismic response of dam–reservoir systems. Mashhadi et al. [19] investigated the influence of pulse and high-frequency components in NF motion on the seismic vulnerabilities of steel frames. They also evaluated the impact of the Tp to fundamental period (T1) ratio—that is, Tp/T1—by categorizing ground motion into four groups with different Tp/T1 ratios. Fragility curves were then employed to assess seismic behavior across different damage states. These studies compared the numerical results between the PL and NP motion, or NF and far-fault motion for various structures under vertical incident conditions. However, the traditional assumption of vertical seismic input generally led to a degree of underestimation of nonlinear dynamic response in structures. Moreover, the influence of oblique incidence on the nonlinear dynamic response of concrete dams has yet to be thoroughly examined.
Because of the small source distance, the NF ground motion is obliquely incident at a certain angle to the dam foundation. To avoid dam damage at the most unfavorable incident angle, researchers have analyzed the responses of tunnels [20], concrete dams [21,22,23,24], underground powerhouse structures [25], and liquid tanks [26] to any ground motion incident angles. All the aforementioned studies determined and verified the seismic input model of oblique incidence, discussing the impact of SV or P waves under oblique incidence. The results highlighted the potential underestimation of the seismic responses of concrete structures in the absence of oblique incidence considerations. Consequently, our previous study investigated the dynamic behavior of gravity dams when subjected to NF SV waves at various incident angles. Xu et al. [27] proposed a seismic performance analysis framework based on the oblique incidence theory, addressing the significance of considering incident angles and seismic characteristics in assessing the performance of concrete dams in NF zones. Extensive research has been conducted on the effects of oblique P waves on structural responses. For example, Sun et al. [28] investigated the seismic response and damage behavior of hydraulic arched tunnels under oblique incident P waves. They indicated that the angle of incidence of the P waves affected the displacement and damage severity of tunnel structures enormously. Zhu et al. [29] explored the effect of PL motion on the seismic response of tunnels using the theory of oblique incident waves. Comparisons among the NF, far-fault, and artificial ground motion revealed a considerable increase in tunnel internal forces owing to velocity pulses, highlighting the need to incorporate oblique incidence into the seismic design of tunnels. Song et al. [30] proposed an innovative method for examining the influence of oblique incidence angles on NF ground motion. Their findings indicated a higher level of structural damage under PL motion than under NP motion. The PGV/PGA indicator was a key factor in determining the seismic response, particularly at larger incident angles. Wang and Chi [31] developed a program for a seismic wave input method under obliquely NF P waves at any angle. The results indicated that the incident angle of the P wave affected dam response enormously, with the maximum failure angle evident at 60°. However, to the best of our knowledge, few studies have quantitatively investigated and compared the seismic performance of dams under PL and NP earthquakes with oblique P wave incidence to identify the main factors influencing the response under different motion scenarios. The effect of the pulse characteristics, seismology parameters, incident angle, and direction have not been considered simultaneously.
The main purpose of this study is to investigate the seismic dynamic response of concrete dams under NF ground motion with obliquely incident P waves while systematically considering the influence of seismic characteristics and incident angles on the dam behavior. Figure 1 shows a flowchart depicting the primary framework this study. Section 2 introduces the seismic input theory of obliquely incident P waves based on the viscous-spring artificial boundary, with accuracy and precision validated through a typical example in a semi-infinite elastic medium. Section 3 details the development of the concrete gravity dam system using finite element model, including information on constitutive models, geometric dimensions, material properties, and applied loads. Following this, a succession of nonlinear dynamic time analyses is carried out by means of various NF motion scenarios, encompassing PL and NP motion at 13 different incident angles. A discussion on the variation of damage and displacement based on incident angles is presented in Section 4. Section 5 delves into the disparities in dynamic responses when individually considering the effects of pulse characteristics and incident direction. Finally, we determine the optimal seismic parameters and simultaneously consider the coupled effects of the pulse and oblique incidence. In conclusion, compared with previous studies focused on SV waves or vertical incidence, our findings further quantify the influence of pulse characteristics and seismic intensity through newly proposed indices. In addition, we highlight the distribution of dynamic responses under varying incident angles and strong pulse effects. We propose a response prediction model to assess the seismic demands under arbitrary obliquely incident P waves, which enhances existing approaches by incorporating both spectral acceleration and incident angle, thereby enabling more robust response estimations under arbitrary near-fault seismic excitations.

2. Fundamental Theory of Obliquely Incident P Waves

2.1. Viscous-Spring Artificial Boundary

The viscous-spring artificial boundary can be used to replicate the impact of an infinite foundation on the near-field area. This method models the elastic recovery capacity of semi-infinite media beyond the artificial boundary and mitigates drift instability [32]. Moreover, it offers precise calculations for structural responses, as evidenced by its use and validation in numerous studies of concrete dams [33,34,35]. Using this method, the spring-damping system is uniformly and parallelly distributed within each artificial boundary. The equations for the spring stiffness and damping coefficients in both the normal and tangential directions can be calculated as follows:
K n = α n G r A , C n = ρ c p A ,
K t = α t G r A , C t = ρ c s A ,
where K, C, and α denote the spring stiffnesses, damping coefficients, and correction factor, respectively. Subscript n and t denote the normal and tangential directions, respectively. cp and cs denote the velocities of the compression and shear waves in the media, respectively. G and ρ denote the shear modulus and density of the medium, respectively. Additionally, r and A denote the distance from the wave source and the average area of all units around a specific node, respectively.

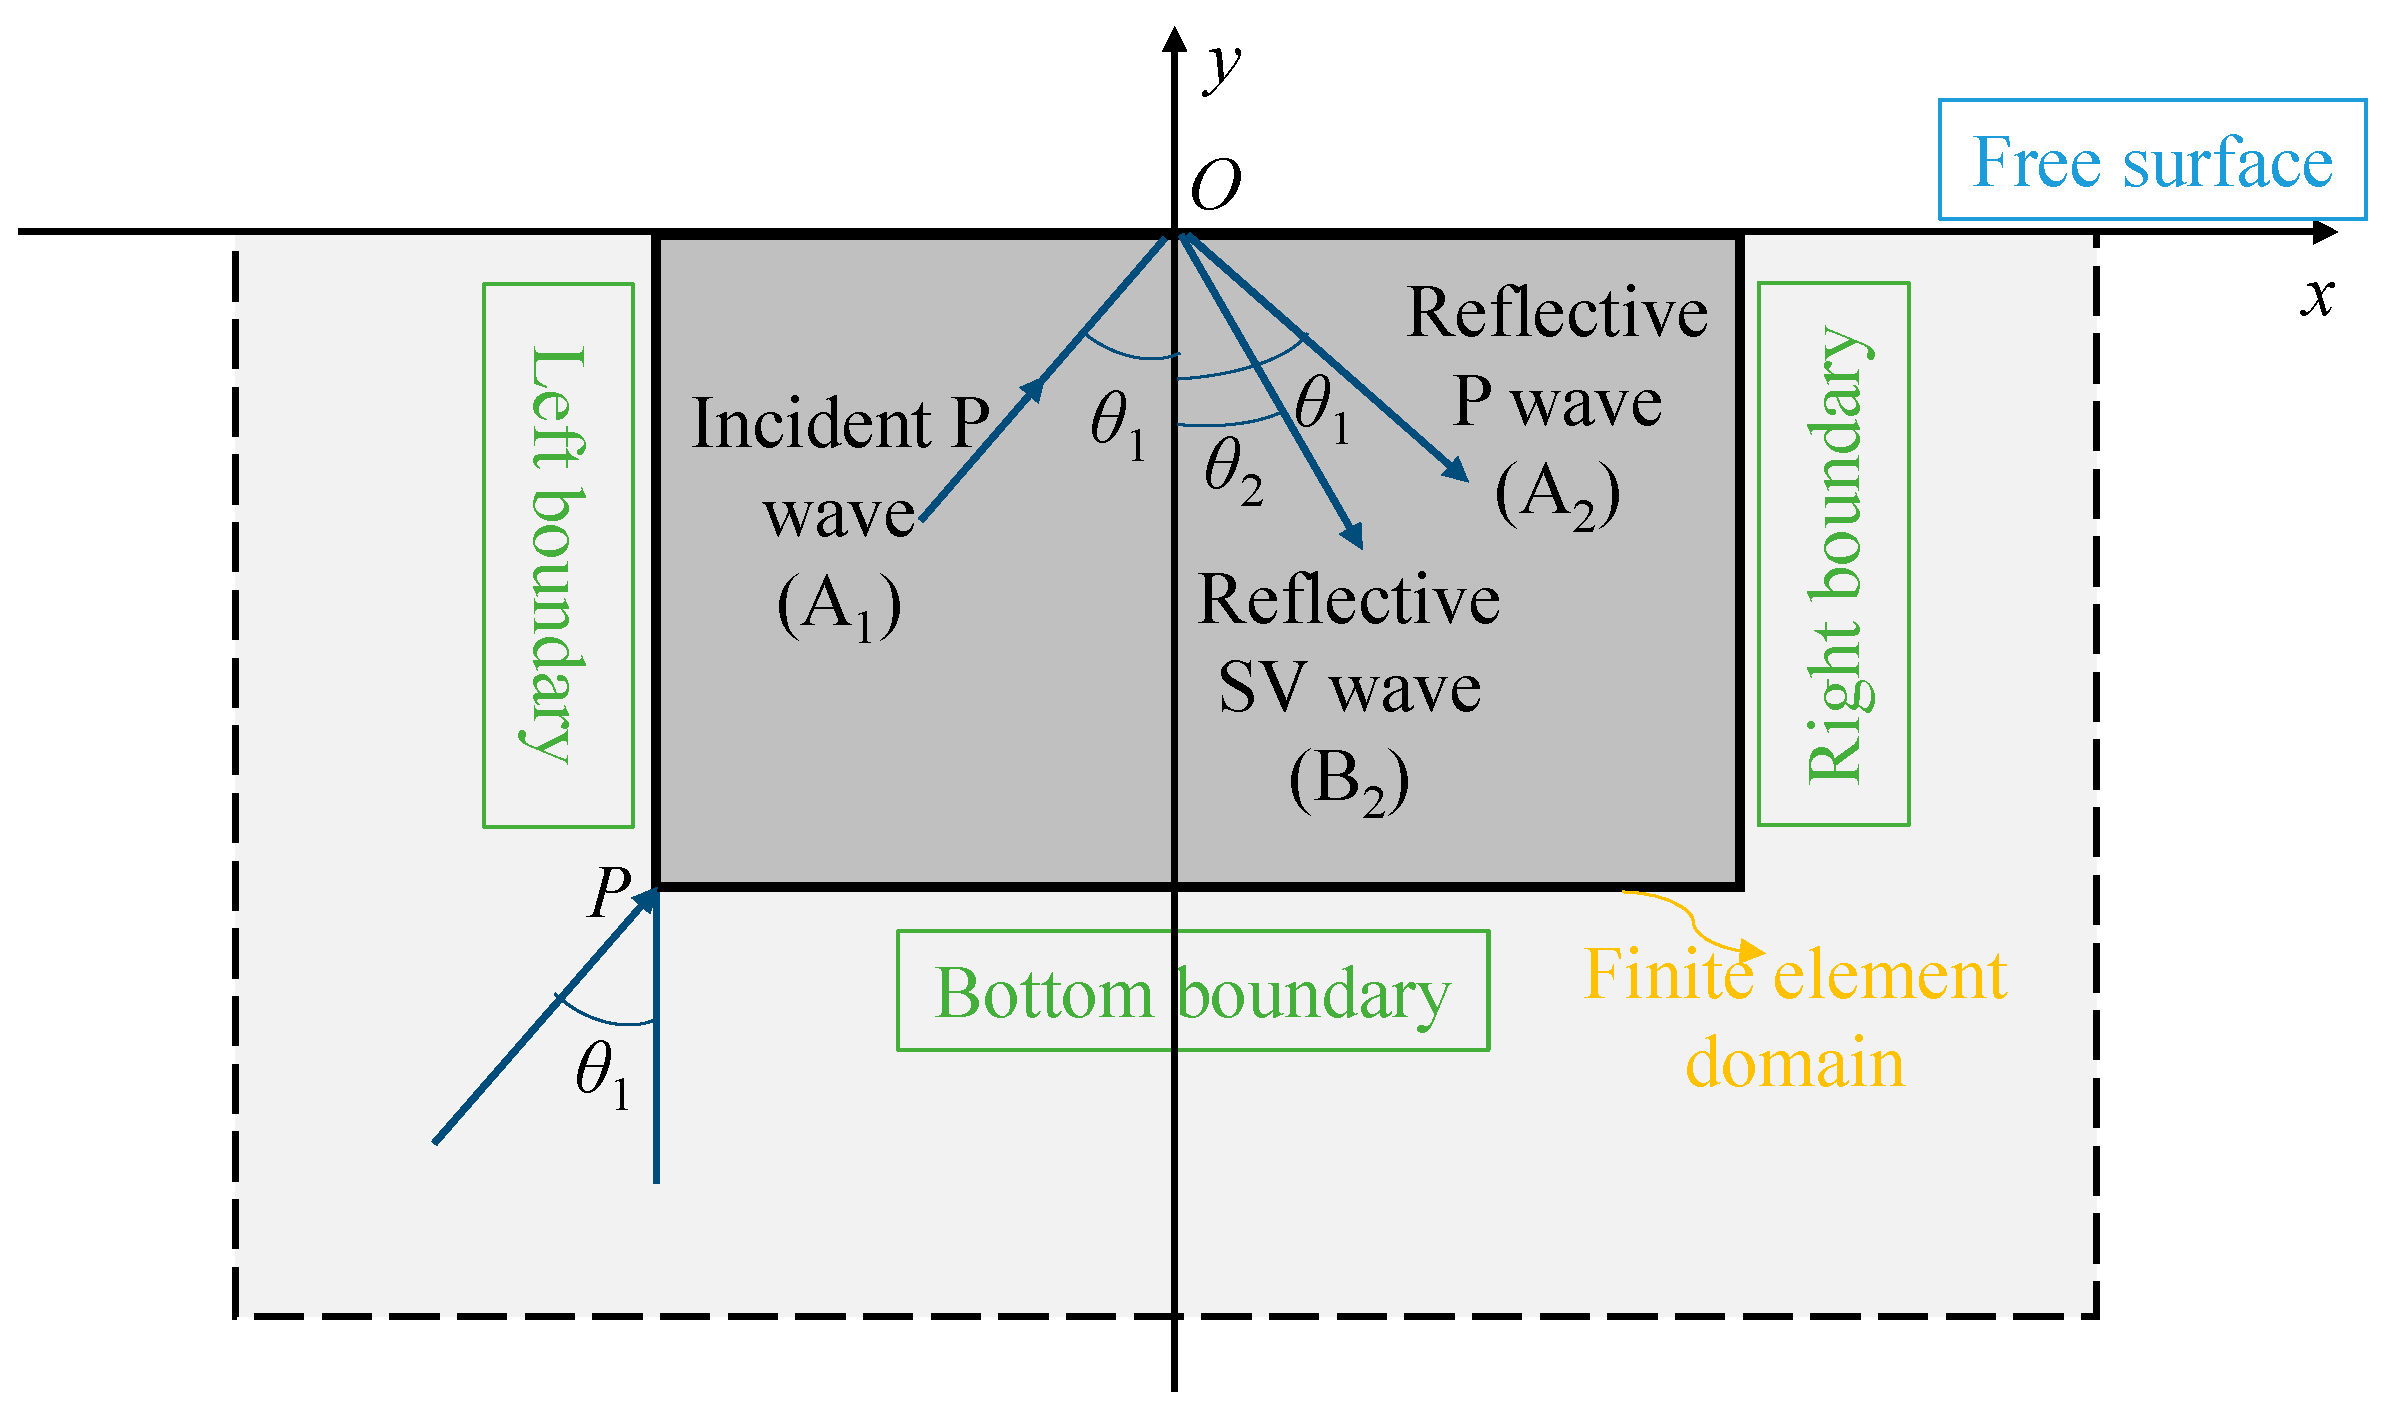
2.2. Equivalent Forces Input Method for P Waves

The wave program for semi-infinite space, employed to compute the equivalent forces of P waves under oblique incidence, can be compiled using the spring-damping artificial boundary. The equivalent forces on node l (Fl) can be determined using the input displacement and velocity time histories, as detailed in studies by Liu et al. [32] and Huang et al. [36], expressed as
F l = K l u l + C l u ˙ l + σ l n A l ,
where ul and u ˙ l denote the displacement and velocity terms of the incident wave field, respectively, σl denotes the stress vector of the free field, Kl and Cl denote parameter matrices that can be expanded into different forms in the x and y directions for each boundary, and n denotes the cosine vector of the outer normal of each boundary surface (which depends on the node boundary).
For different boundaries, each physical quantity (including the spring and damping matrices) can be substituted into Equation (3), the stress term can be derived based on the force at each boundary, and subsequently, the equivalent forces in the x and y direction (Fx, Fy) can be presented as below:
F x b ( t , x , y ) = K t u x + C t u ˙ x ( τ x y p i + τ x y p r + τ x y s v r ) A l F y b ( t , x , y ) = K n u y + C n u ˙ y ( σ y p i + σ y p r + σ y s v r ) A l f o r b o t t o m b o u n d a r y ,
F x l ( t , x , y ) = K n u x + C n u ˙ x ( σ x p i + σ x p r + σ x s v r ) A l F y l ( t , x , y ) = K t u y + C t u ˙ y ( τ x y p i + τ x y p r + τ x y s v r ) A l f o r l e f t b o u n d a r y ,
F x r ( t , x , y ) = K n u x + C n u ˙ x + ( σ x p i + σ x p r + σ x s v r ) A l F y r ( t , x , y ) = K t u y + C t u ˙ y + ( τ x y p i + τ x y p r + τ x y s v r ) A l f o r r i g h t b o u n d a r y ,
According to the theory of oblique incidence of P waves, each term in Equation (3) can be obtained using the structural information, material properties, and input time history. A diagram presenting the oblique incidence of a P wave in a two-dimensional semi-infinite medium is shown in Figure 2. As shown, when the P wave is incident at an angle of θ1, the free surface produces the reflected P wave (A2) and the reflected SV wave (B2). Moreover, the amplification coefficients under the reflected P wave and SV wave (a1, a2) and the angle between the reflected SV wave and the y-axis (θ2) can be expressed as follows:
θ 2 = arcsin ( c s sin ( θ 1 ) / c p ) ,
a 1 = c s 2 sin 2 θ 1 sin 2 θ 2 c p 2 cos 2 2 θ 2 c s 2 sin 2 θ 1 sin 2 θ 2 + c p 2 cos 2 2 θ 2 a 2 = 2 c s c p sin 2 θ 1 cos 2 θ 2 c s 2 sin 2 θ 1 sin 2 θ 2 + c p 2 cos 2 2 θ 2 .
Based on the boundary nodes and element information of the finite element model, along with the material properties, the time delay, A, r, and wave velocity can be calculated. The input time history information can then be used to solve the displacement, velocity, and stress vectors when the P waves oblique incidence, expressed as follows:
Δ t 1 = ( l x sin θ 1 + l y cos θ 1 ) / c p Δ t 2 = ( l x sin θ 1 + l y cos θ 1 + 2 ( L y l y ) cos θ 1 ) / c p Δ t 3 = ( l x sin θ 1 + l y cos θ 1 + cos ( θ 1 + θ 2 ) ( L y l y ) / cos θ 2 ) / c p + ( L y l y ) / ( c s cos θ 2 ) ,
u x = φ p i ( t Δ t 1 ) sin θ 1 + a 1 φ p r ( t Δ t 2 ) sin θ 1 + a 2 φ s v r ( t Δ t 3 ) cos θ 2 u y = φ p i ( t Δ t 1 ) cos θ 1 a 1 φ p r ( t Δ t 2 ) cos θ 1 + a 2 φ s v r ( t Δ t 3 ) sin θ 2 ,
σ x p i = λ + 2 G sin 2 θ 1 / c p ϕ p i σ y p i = λ + 2 G cos 2 θ 1 / c p ϕ p i τ x y p i = G sin 2 θ 1 / c p ϕ p i ,
σ x p r = a 1 λ + 2 G sin 2 θ 1 / c p ϕ p r σ y p r = a 1 λ + 2 G cos 2 θ 1 / c p ϕ p r τ x y p r = a 1 G sin 2 θ 1 / c p ϕ p r ,
σ x s v r = a 2 ρ c s sin 2 θ 2 ϕ s v r σ y s v r = a 2 ρ c s sin 2 θ 2 ϕ s v r τ x y s v r = a 2 ρ c s cos 2 θ 2 ϕ s v r .
Finally, the equivalent force on each boundary node under the oblique incidence of P waves can be calculated by substituting the viscous-spring artificial boundary coefficients and displacement, velocity, and stress terms into Equations (4)–(6). This equivalent force can then be integrated into each node of the finite element model to calculate the response results.

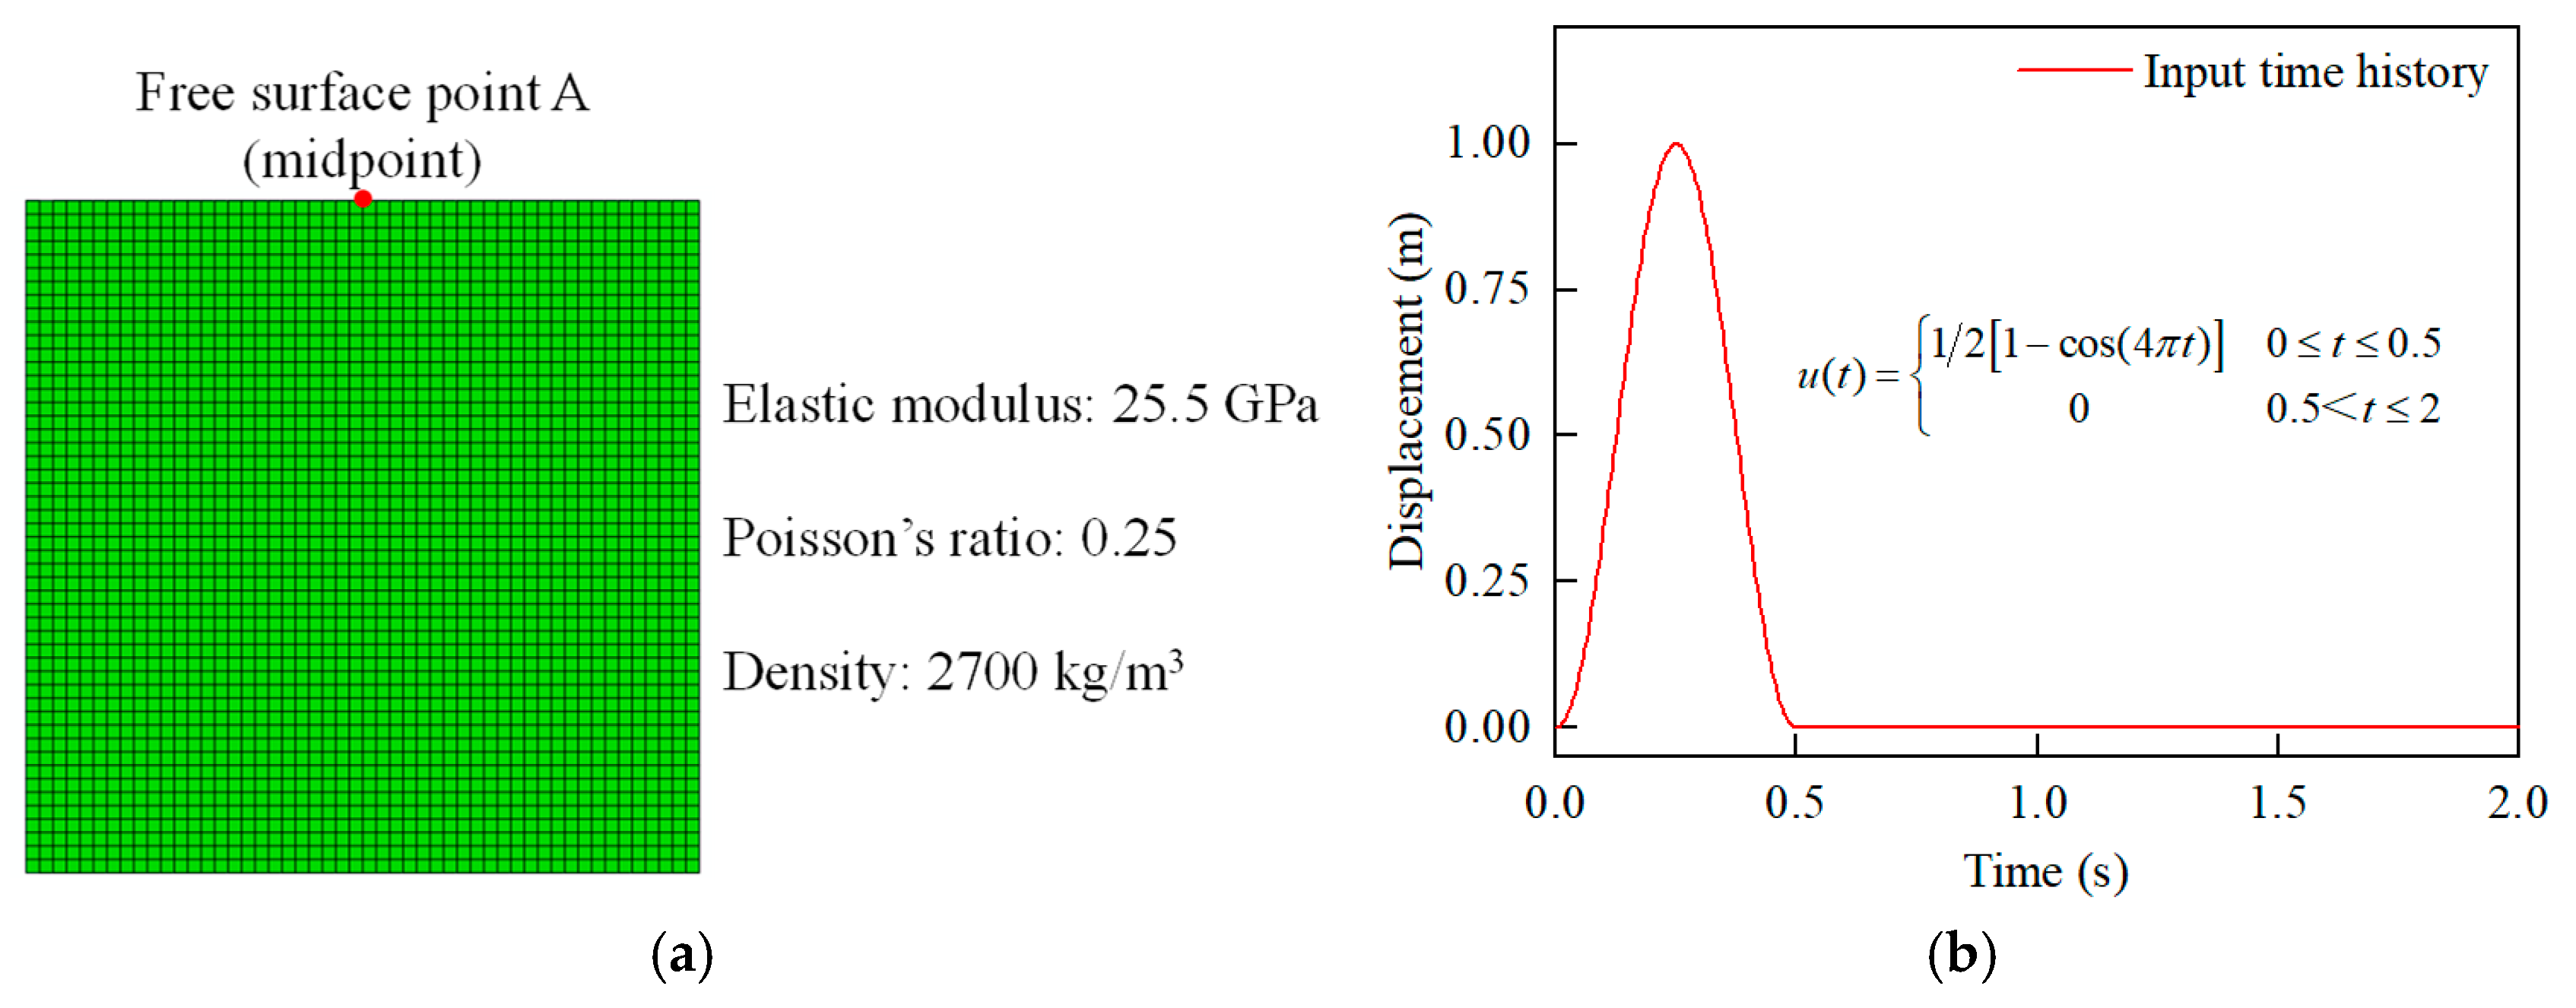
2.3. Verification of the Seismic Oblique Incidence Theory

A two-dimensional homogeneous semi-infinite space model can be adopted to verify the accuracy and effectiveness of the established model. In this study, the length and width were set to 1000 m, divided into a 20 m grid size, as shown in Figure 3a. The material properties of this model are also provided herein. The midpoint A on the free surface was used as the monitoring point to compare the numerical and theoretical solutions. The time history of input displacement at the base of the free field is shown in Figure 3b, along with the input time history equation. The total time and time intervals were 2 and 0.005 s, respectively.
Figure 4 presents the displacement time history of the free surface at point A when the P wave is obliquely incident (at incident angles of 0°, 15°, 30°, and 65°), as well as a comparison between the numerical and theoretical solutions in both the horizontal and vertical directions. Moreover, the peak values of the numerical and theoretical solutions (written as Unum and Uthe) are also appropriately labeled. The numerical solution is consistent with the theoretical solution, with the maximum value of the relative error being less than 0.05%. The results show that the proposed model exhibits high accuracy and precision and could be used in numerical simulations of a concrete dam system.

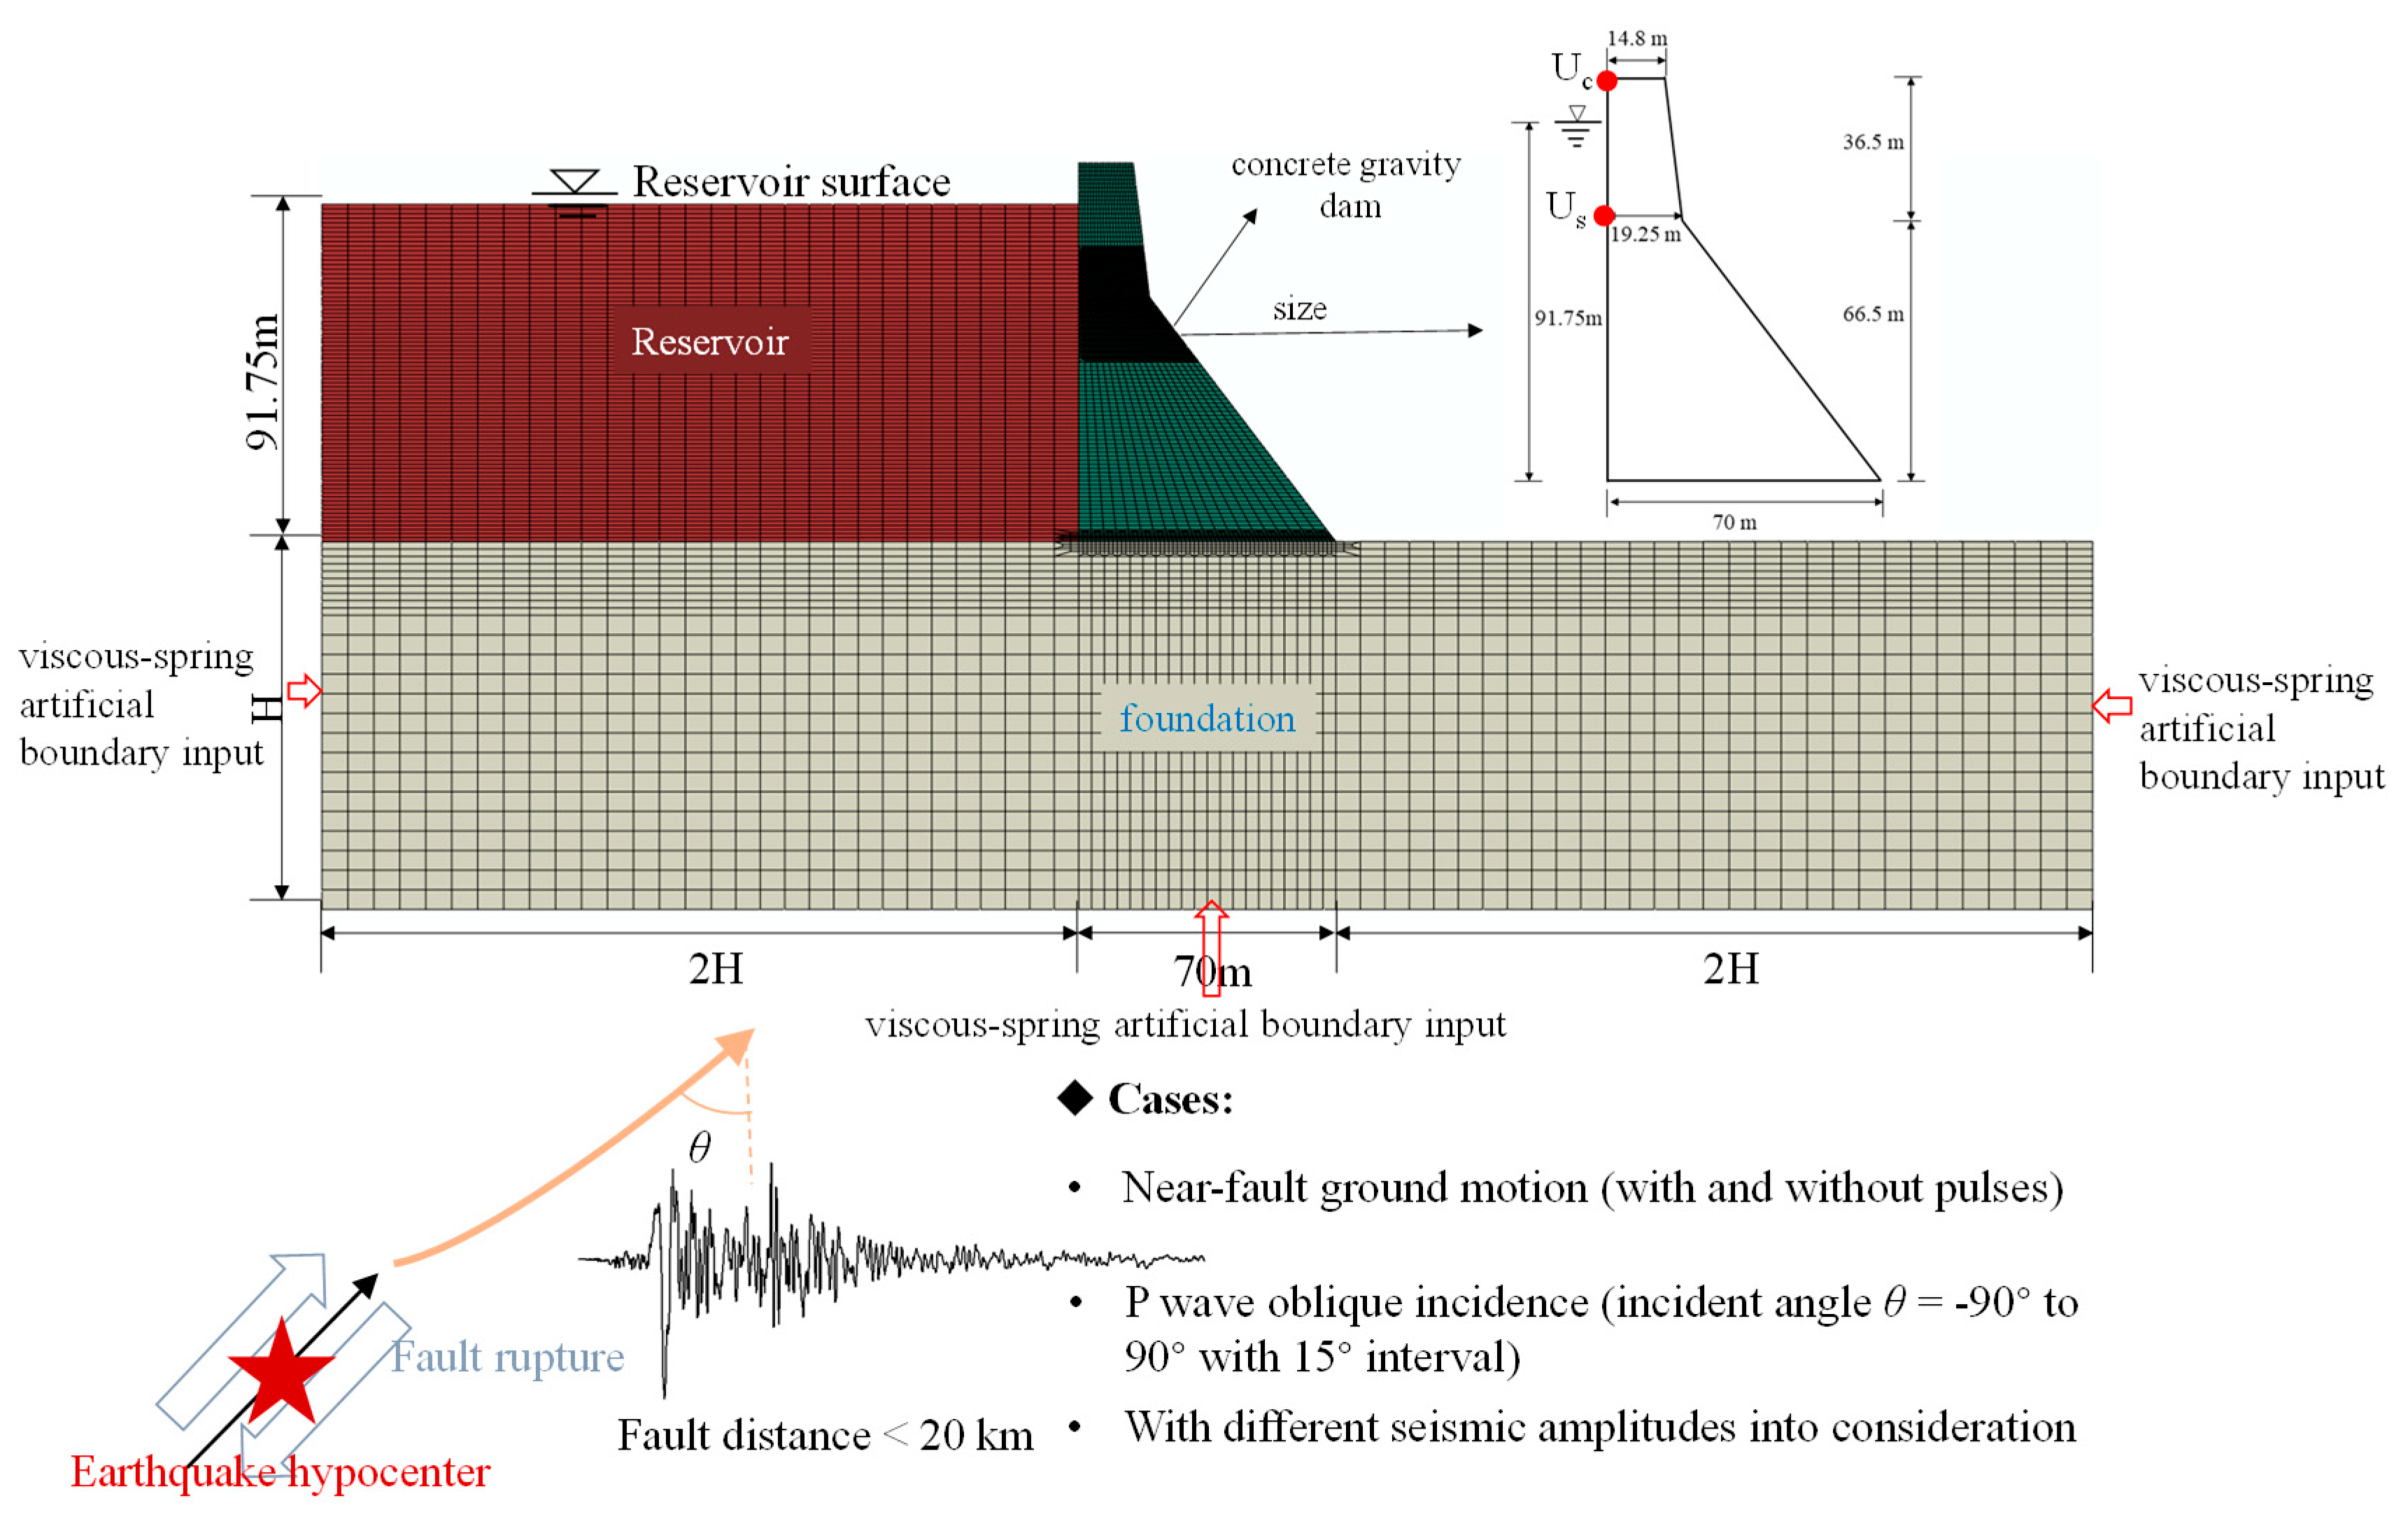
3. Finite Element Model of a Concrete Gravity System

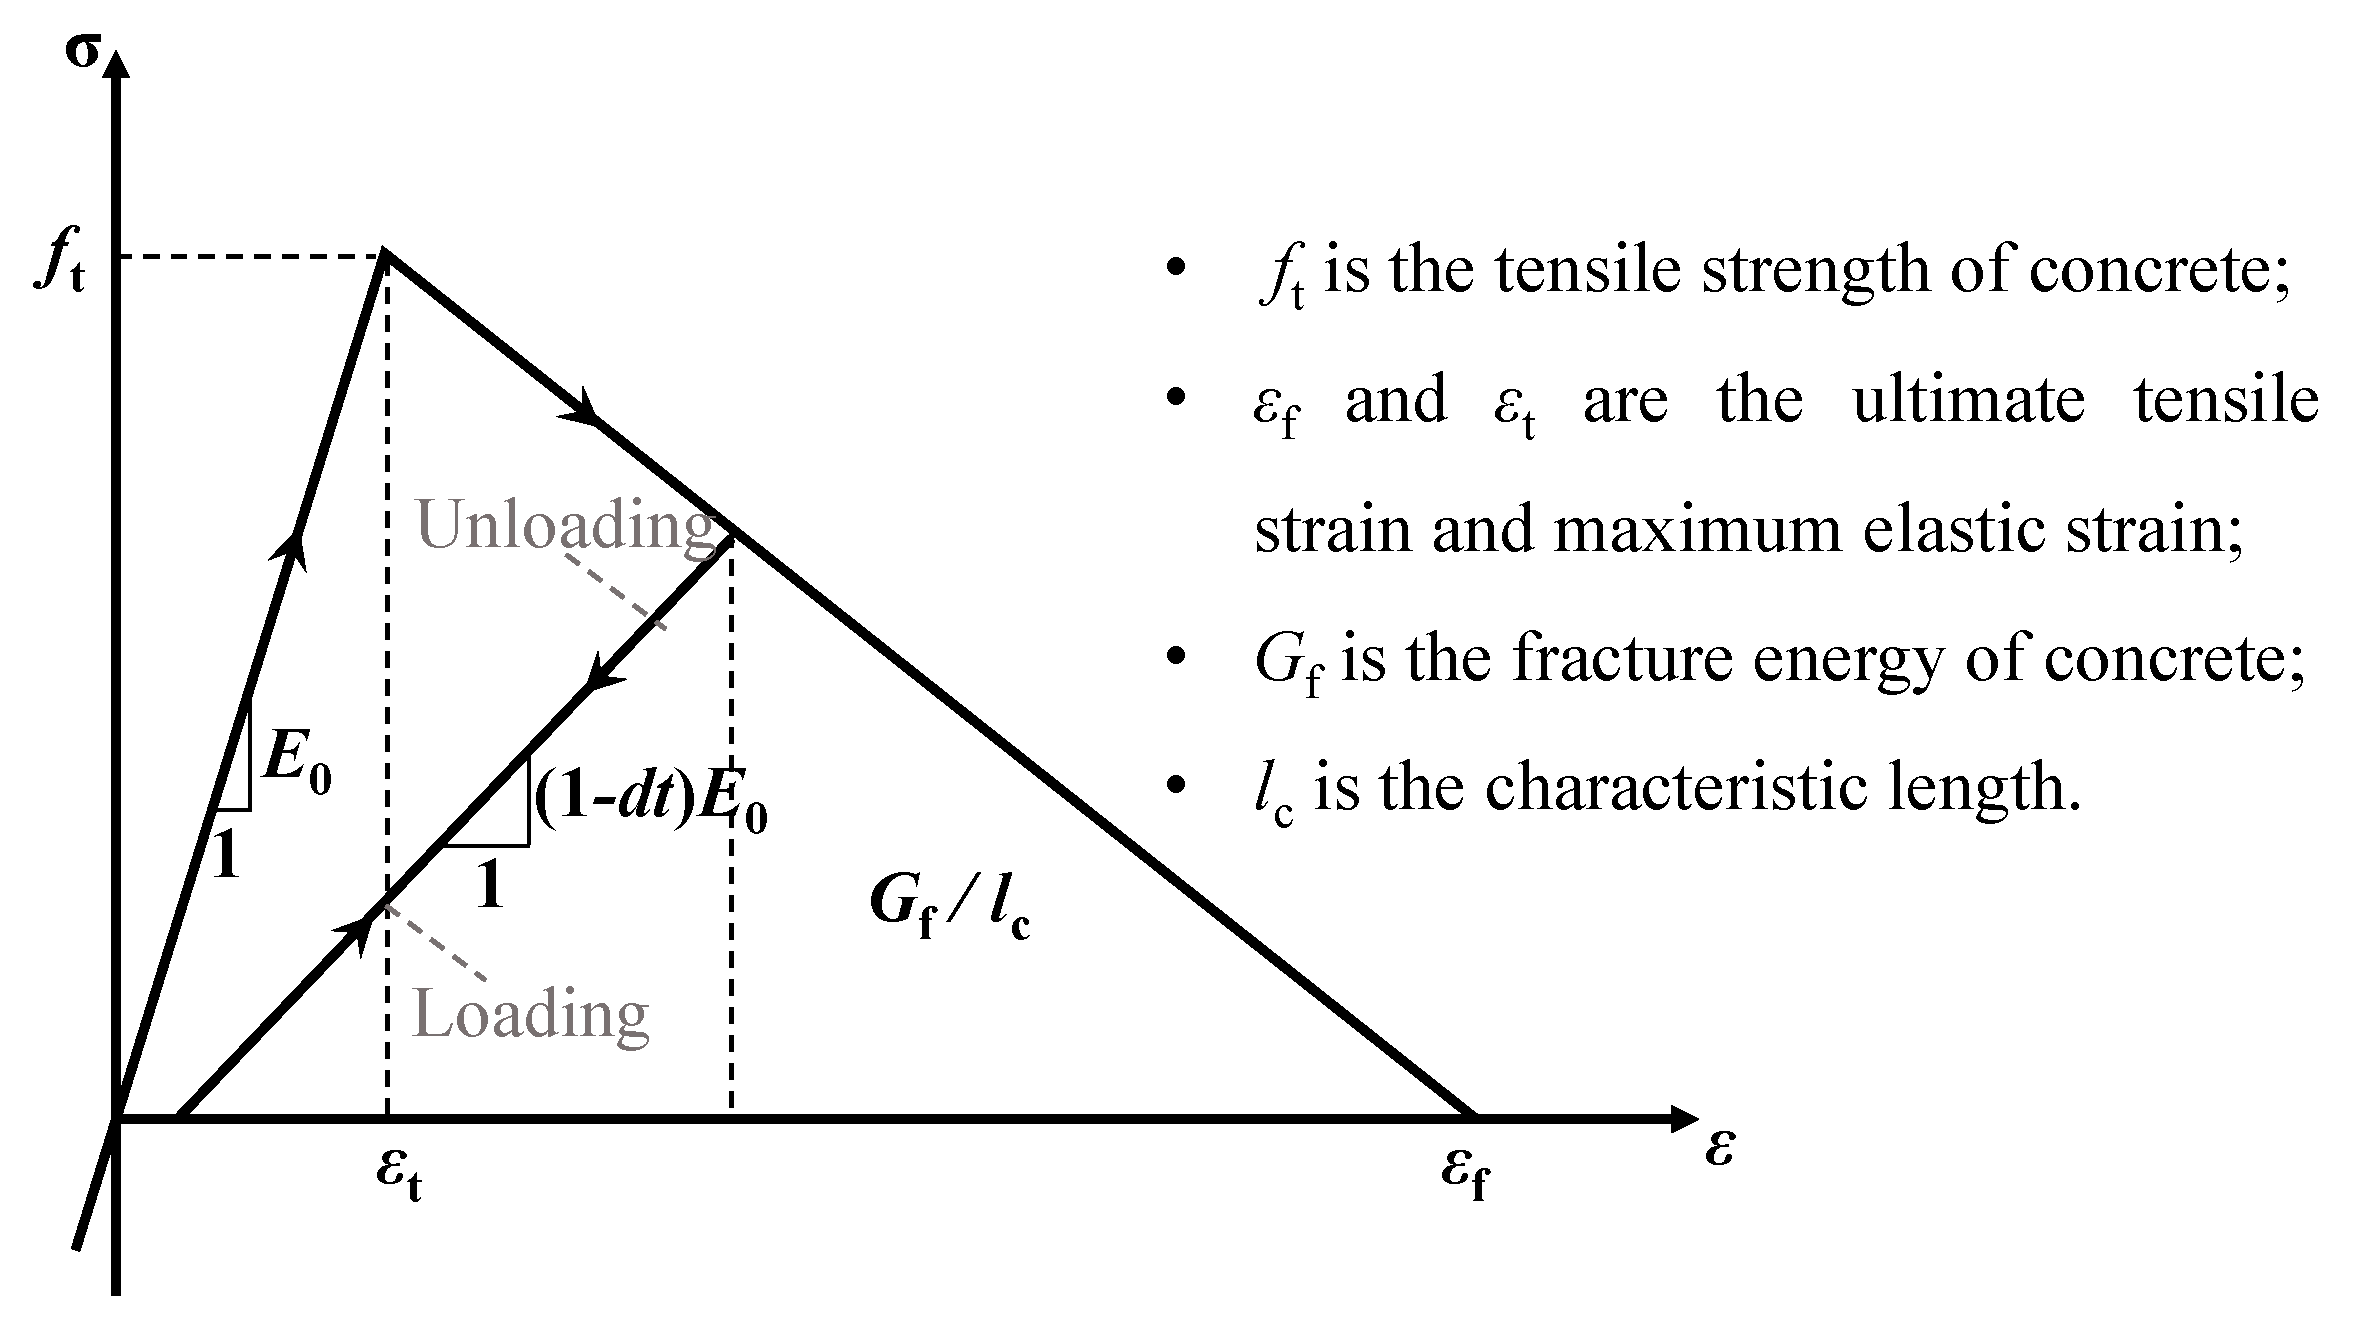
3.1. Constitutive Model of Concrete Damaged Plasticity (CDP)

Following previous studies [17,27,37], the concrete damaged plasticity (CDP) model put forward by Lee and Fenves [38,39] can be used to model the nonlinear damage behavior of concrete. Because the tensile strength of concrete is less than its compressive strength, tensile damage can significantly affect the seismic performance of concrete structures [40,41,42]. The constitutive behavior of concrete is shown in Figure 5, based on the assumption of concrete tensile damage. Additionally, the physical meaning of the main parameters in the CDP model is provided, where E0 denotes the initial elastic modulus, and dt denotes the tensile damage factor, which is employed to assess the degree of tensile damage of the concrete, and ranges from 0 (does not produce tensile failure) to 1 (wholly destroyed and failed). The elastic modulus E degenerates with the variable dt, which can be expressed by the following equation E = 1 d t E 0 .

3.2. Finite Element Model

The Koyna concrete gravity dam is a well-known case of catastrophic failure when subjected to strong earthquake action. It has been widely employed to examine the failure mechanism of various gravity dams under seismic waves [1,7,8,43]. In this study, the detrimental impact of NF PL motion on the seismic performance of structures was examined using a typical engineering case to analyze and highlight the response characteristics of the dam further. The finite element model of a concrete gravity dam–reservoir–foundation system is depicted in Figure 6, with two-dimensional four-node plane strain elements being used to mesh the dam. The finite element mesh consists of 11,372 nodes and 11,132 quadrilateral elements. Specifically, 6422 elements are assigned to the dam body, 2296 to the foundation, and 2414 to the reservoir domain. This mesh configuration ensures adequate resolution for reliable numerical analysis. As shown, the maximum height of the dam is 103 m, and the widths of the top and bottom of the dam are 14.8 m and 70 m, respectively. The abrupt slope point occurs on the downstream face at a dam height of 66.5 m and horizontal length of 19.25 m. Due to penetrating cracks in practice, the dam neck and dam heel portions can be refined to reflect the damage variation trends better and meet the calculation accuracy requirements. Additionally, the concrete dam expands to twice the dam height upstream and downstream of the foundation. Considering the radiation-damping effect, the reservoir water is consistent with the foundation’s length.

3.3. Main Material Properties

The material properties of the concrete dam system (including concrete, foundation rock, and reservoir portions) are given in Table 1. The tensile and compressive strengths were 2.9 MPa and 24.1 MPa, respectively. The CDP model shown in Figure 5 was utilized to describe the nonlinear damage behavior of the concrete, where the fracture energy was 200 N/m, based on previous studies [41,44]. Other specific model parameters can be found in previous studies [17,27,37]. Here, the Lagrangian finite element method was employed to illustrate the fluid–solid coupling, the corresponding theory and formula of which can be found in the literature [1]. The natural period of the dam structure was approximately 0.4 s. The Rayleigh damping method [45] (with a 5% damping ratio) is generally used to study the seismic performance of gravity dam structures. Finally, the proportional damping coefficients of the mass and stiffness were derived from the natural frequencies of the first-order and second-order modes in references [43,46]. The natural frequencies corresponding to the first several vibration modes have been thoroughly reported in our previous publication [17].

3.4. Applied Static and Dynamic Loads

The applied static loads included the self-weight as well as hydrostatic pressure, and the level of still water was 91.75 m. The dynamic loads considered the hydrodynamic pressure and the NF motion input. During the numerical analysis of the dam structure, the input acceleration time history of the ground motion was transformed into equivalent forces on each boundary node in accordance with the viscous-spring artificial boundary theory introduced in Section 2. As shown in Figure 7, the seismic input cases compared the NF, PL, and NP motions. Additionally, the P wave obliquely incident angles were −90° to 90° at 15° intervals, and a total of 13 types of incident angles were included. Many authors [43,47] have demonstrated the importance of considering the incident direction. In particular, in this study, the incident angle ranged from −90° to −15°, representing the negative incident angle to explore the vibration characteristics of an asymmetric concrete dam under NF motion with asymmetric pulse characteristics.

4. Seismic Dynamic Response Analysis Under Oblique P Near-Fault Motion with Different Incident Angles

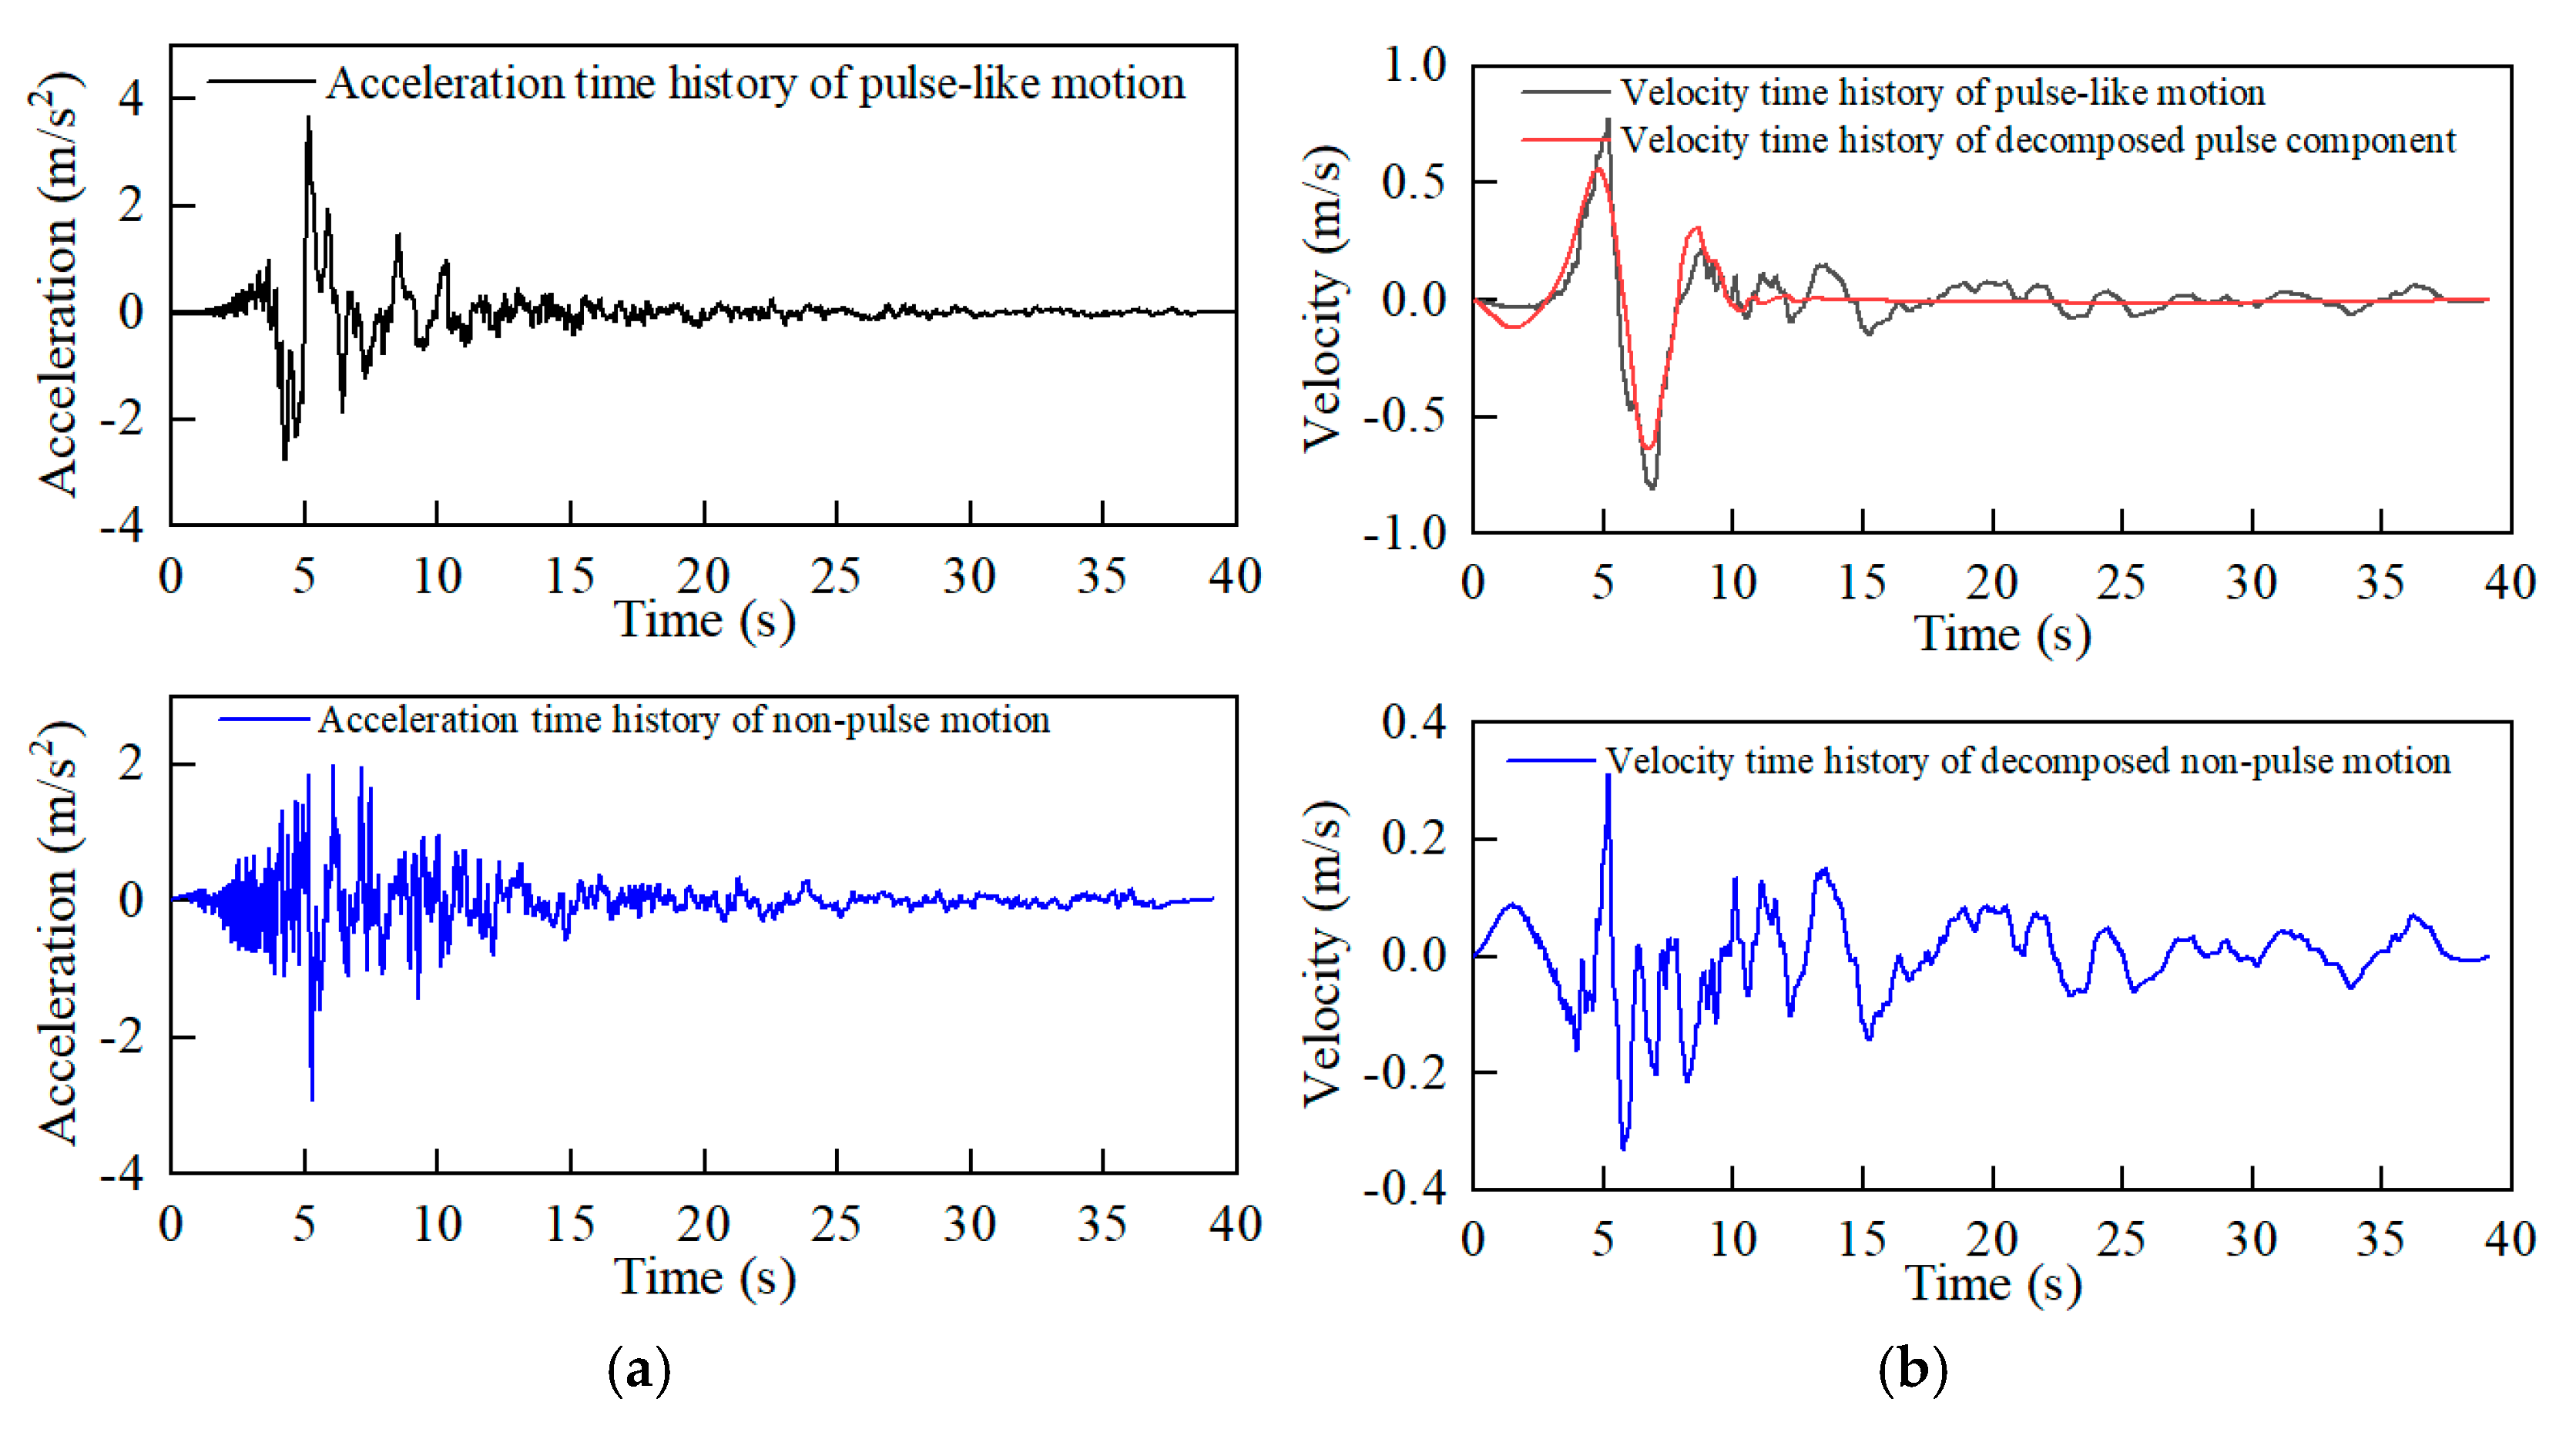
4.1. Seismic Input Conditions of Near-Fault Ground Motion

According to the literature [48,49], the NF region has shown that the distance to the rupture fault does not exceed a range of 20 km. Consequently, the NF PL motion was picked from the Pacific Earthquake Engineering Research (PEER) Center [50]. The criteria were restricted based on our investigation [17,27]: the moment magnitude was within the 5.5–8.0 range, and the PGA and PGV were larger than 0.1 g and 30 cm/s, respectively. To obtain non-pulse motions with similar seismic characteristics for comparative analysis, we decomposed the recorded orthogonal horizontal ground motions into high-frequency non-pulse (residual) components using the method proposed by Shahi and Baker [51]. This approach employs continuous wavelet transform to identify the direction of strong-velocity pulses in multicomponent ground motions. The decomposition enables the isolation of directionally dominant strong-velocity pulses from other complex motion patterns, thereby facilitating a more focused analysis of structural response. The pulse characteristic was identified by means of the pulse indicator put forward by Baker [52] and Shahi and Baker [51] to determine whether it was PL motion. Moreover, we ensured that the pulse parameters (including Tp and PGV/PGA) and seismology parameters exhibited certain differences for different seismic records.
To satisfy the abovementioned guidelines, six NF ground motions with different characteristics were selected, the seismic input scenarios of which are shown in Figure 6. To explore the influence of the P wave oblique incidence of NF motion on the dynamic response in detail, the pulse characteristics, incident angle, and different seismological parameters were simultaneously considered. The seismic amplitude of each selected PL motion was adjusted to 0.3 g and then 0.6 g to consider the seismic intensity features. Consequently, six groups of NF PL ground motions were decomposed into residual NP components for comparison, which were extracted using the continuous wavelet transform procedure introduced, and the implementation and validation are also presented in a previous study [17]. The pulse and residual component extraction results were compared with those of other studies, indicating that the proposed model exhibited good accuracy. In summary, 13 incident angles and 2 seismic amplitudes were applied for each motion (including the PL and NP components). Fifty-two suits of nonlinear dynamic time-history simulations were adopted in the numerical analysis to determine the influence of oblique P waves on the seismic behavior of gravity dams.

4.2. Comparison of Damage Behavior Under PL and NP Motion

The degree of damage and its distribution were employed to evaluate the damage behavior of the concrete dams. The damage volume ratio (DVR) response was proposed to assess the degree of damage of a concrete gravity dam, and the DVR index was defined as follows [42,45]:
DVR = e v e d t d v e / e v e d v e ,
where dt and ve denote the tensile damage factor and volume of each element.
The scatter and mean values of the DVR response under NF motion with obliquely incident P waves are plotted in Figure 8, along with a comparison between the numerical results under PL and NP motion. It is evident that the damage response results under different ground motion exhibits a certain discreteness, and the discreteness from ±30° to ±75° is considerably greater than that of other incident angles. The maximum average DVR responses are 0.092 and 0.083 for PL and NP motion, respectively. Compared with vertically incident or SV wave analyses [1,17,22,24], this study shows that obliquely P incident waves lead to significantly damage responses, especially at incident angles of 60°. Additionally, the variation in DVR response with incident angle is similar for different peak values. In particular, among the 13 incident angles used, the maximum difference between the PL and NP motion appears at incident angles of ±45° to ±75°.
Figure 9 shows the damage distribution and profile of a gravity dam under a typical scenario of NF motion with obliquely incident P waves. The damage patterns show that most damage is concentrated in the neck and heel of the dam. At an incident angle of 15°, there is minor damage in the dam heel and neck regions. With the increasing incident angle, the damage severity worsens, and the distribution gradually spreads. The neck portion extends from the downstream to the upstream surface at an angle of approximately 45° from the vertical surface. For incident angles ranging from 60 to 75°, the damage at the dam heel spans approximately half the width of the dam bottom, the dam neck incurs complete damage, and the dam body suffers severe damage. Considering the impact of the pulse characteristics and incident direction, in almost all seismic scenarios, the damage degree under PL motion is higher than that under NP motion, and a positive incidence results in considerably more damage than a negative oblique incidence at the same incident angle. A comparison of the results across all groups reveals that different ground motion groups exhibit a certain discreteness, indicating that the seismic randomness and pulse characteristics affect the damage behavior of the dam body.

4.3. Comparison of Displacement Response Under PL and NP Motion

The relative displacement of the midpoint of the dam crest was employed as another vital index for assessing the seismic performance of concrete dams. The relationship between the incident angle and the displacement response under NF seismic waves with different peak amplitudes was determined using a series of numerical analyses, as shown in Figure 10. Here, the scatter displacement response of each seismic wave also exhibits a certain degree of discreteness; however, the discreteness is relatively smaller than that of the DVR, there being almost no difference in the displacements with and without pulse motion at a 0.3 g peak value. The maximum displacement values are 0.0781 and 0.0675 under two NF motions at 0.6 g amplitude, and the corresponding incident angle is −60°. Compared with previous studies on obliquely incident SV waves or vertical wave incidence [1,17,22,24], our results demonstrate that obliquely incident P waves produce distinct response patterns and amplification trends. This indicates that P and SV waves influence dam behavior through different dynamic mechanisms, underscoring the importance of considering P wave effects in seismic analysis.

5. Difference Analysis

5.1. Difference Analysis Considering the Effect of Pulse Characteristic

Difference analyses were conducted between the responses of the PL and NP motion and the positive and negative incident directions. The definition of the seismic response ratio (RatioEDP) for exploring the differences between different types of NF motion can be expressed as follows:
Ratio EDP = EDP pulse - like EDP non - pulse , EDP = DVR or U c ,
where EDPpulse-like and EDPnon-pulse denote the engineering demand parameter (EDP) under PL and NP motion, respectively. The EDP represents the seismic response of the dam, such as DVR or Uc response, based on the numerical results presented in Section 4.
The damage or displacement response ratio of each ground motion can be determined using Equation (15), and the average value of RatioEDP for each incident angle can be calculated. Figure 11 shows the variation of the average RatioEDP value with the incident angle ranging from −75° to 75°. The results show that the RatioEDP value exceeds one, except for the DVR response under NF motion, suggesting that the dynamic response under PL motion is larger than that under NP motion. From a seismic amplitude perspective, it is evident that the response ratio at the 0.6 g peak is greater than that at 0.3 g, demonstrating that strong earthquakes can further stimulate the effect of the pulse characteristics. The maximum response ratio reaches 1.5 and 1.33 at angles of −45° and −60° for the DVR and displacement indices, respectively, indicating that owing to the upstream and downstream asymmetry of the dam body as well as pulse effect, the maximum response difference more likely occurs during negative oblique incidence. Although the average response ratio reaches its peak at certain negative incidence angles, this primarily indicates the relative amplification between the dynamic responses under pulse-like and non-pulse motions, rather than representing the absolute response or damage level. In contrast, positive incidence angles tend to induce larger absolute structural responses and more severe cumulative damage, as demonstrated in Figure 8, Figure 9 and Figure 10. The results demonstrate the impact of negative oblique incidence for PL ground motion, which results in destructive damage to or vibration of the gravity dam.

5.2. Difference Analysis Considering the Effect of the Incident Direction

The difference in responses between the positive and negative incident angles can be described by the proposed DiffEDP, which can be calculated by subtracting two physical quantities as follows:
Diff EDP = EDP positive EDP negative , EDP = DVR or U c ,
where EDPpositive and EDPnegative denote the EDP under NF motion in the positive and negative incident directions, respectively. DiffEDP can be rewritten as DiffDVR or DiffUc for DVR and displacement indices.
Figure 12 shows the variation in the average DiffEDP value with five incident angles for four seismic cases, including two types of motion and two seismic amplitudes. As shown in Figure 12a, the two types of NF ground motions have similar DVR differences at different seismic intensities, indicating that the pulse characteristics have little effect on the damage response in arbitrary incident directions. The response difference caused by the incident direction is almost negligible for the peak of the 0.3 g ground motion. The maximum DiffDVR values are 0.0425 and 0.0398 under 0.6 g PL and NP motion with an incident angle of 45°, respectively.
As shown in Figure 12b, a larger seismic amplitude can lead to a difference in the displacement response at each incident angle. The DiffUc index decreases with an increase in the incident angle under 0.3 g NF motion, suggesting that the response difference caused by the positive and negative directions increases considerably when the incident angle is 15° owing to the upstream and downstream asymmetry of the dam body. For a motion amplitude of 0.6 g, the PL motion DiffUc value is greater than that of the NP motion before 45° oblique incidence. After the 45° oblique incidence, the displacement response difference of the NP motion at positive and negative incident angles increases considerably as the incident angle increases. It is much larger than the PL motion. The results show that the incident direction and pulse characteristics considerably influence the structural response under strong NF motion.

6. Parametric Study

6.1. Discussion on Effects of Seismic Parameters

In this section, considering the numerical results under NP motion with positive incident angles, the impact of the seismic intensity and pulse parameters on the damage and displacement response is discussed to determine the optimal characterization parameters at different incident angles. Figure 13 shows the fitting line between seismology parameters (including the peak value and duration) of NF motion and the dynamic response of concrete dams for incident angles of 15°, 30°, 45°, 60°, and 75°. Because the PGA was adjusted to 0.6 g, the numerical results show some discreteness and the corresponding R2 has a moderate correlation with the seismic input at various incident angles. Additionally, the composite parameter (Ic) exhibits the highest correlation coefficient with the dynamic responses under different incident angles by combining all seismic indices related to the seismic peak and duration. Moreover, it should be noted that the seismic parameters PGV and Ic have a greater fitting slope, affecting the dynamic response of such concrete dams enormously. Specifically, the dynamic response increases with the incident angle, reaching its peak at 60° or 75°, consistent with the trend of the average response results shown in Figure 8. However, the R2 value between the pulse parameters and duration (including the PGV/PGA, Tp, and T90) and structural responses is small. The fitting results show that the dynamic response of the concrete dam exhibits a good correlation with the seismic intensity parameters.
Figure 14 shows the relationship between the seismic parameters related to the acceleration, velocity time history, and dynamic response under the five incident-angle conditions. It is evident from the fitting lines that the response indices correlate well with the seismic intensity parameters, with R2 almost exceeding 0.6. Between the incident angles of 15° and 45°, the slope of the fitting line for damage and displacement responses increases relatively steadily. However, as the angle increases from 45° to 75°, the growth rate of the fitting line gradually decelerates until it reaches its maximum value. Additionally, compared to the displacement response, the DVR response is more sensitive to the incident angle. Combining all the numerical results, the spectral acceleration Sa(T1) has a high correlation with the response indices and can be employed as the optimal seismic parameter for subsequent analysis.

6.2. Discussion on Coupled Effects of the Pulse Feature and Oblique Incidence

The influence of intensity parameters on the dynamic response of the structure under different incident angles is investigated as above, and the optimal index is selected for further exploration. Then, the coupled effect of the pulse characteristics and oblique incidence can be discussed based on the selected optimal seismic parameter Sa(T1). Figure 15 shows the fitting line between Sa(T1) and DVR under PL and NP motion at different incident angles and directions. The R2 values at different incident angles exceed 0.7. The fitting line results under various working conditions also exhibit a certain degree of change with increased incident angle. In particular, the response results under oblique PL motion are considerably greater than those under NP motion. When the incident angle ranges from 30° to 45°, the pulse characteristics have no major influence on the seismic response. As the angle increases, the influence of the pulse characteristics gradually appears, causing the difference between the response fitting lines with and without the PL ground motion to widen gradually. Finally, the fitting slopes under the four working conditions are almost equidistantly reduced—that is, the order of the response values is PL in the positive and negative directions and NP in the positive and negative directions.
The fitting slopes and intercepts are shown in Figure 15f. The analysis shows that the discrete data points adhere closely to the polynomial fitting model, indicating a high level of correlation. Nearly all scattered points align with the fitted curves. As the incident angle increases, the fitting slope increases, accompanied by a decrease in the intercept. The linear increase in the fitting results for the negative angles is particularly noteworthy. Conversely, the growth trend for positive incidences gradually slows with incremental changes in the incident angle.
Figure 16 shows the relationship between the seismic parameter Sa(T1) and displacement index under the four working conditions, with the slope and intercept of the fitting line also being provided. Consistent with the above results, Sa(T1) is proportional to the displacement response under various earthquake input conditions. When the incident angle exceeds 60°, the incident direction has little effect on the displacement response under PL motion. The slope and intercept variation trends are similar to those of the dam structure damage response. Moreover, the growth trend of the fitting slope is faster under PL motion, which indicates that the displacement response is more sensitive to PL motion.

6.3. The Three-Dimensional Prediction Surfaces

Based on previous studies, the relationship between the seismic parameters and response can be described as a linear fit, with the fitting slope and intercept subject to a quadratic polynomial fitting based on the incident angle. Thus, taking the incident angle and seismic parameters into account, to assess the dynamic response of dams when NF motion is obliquely incident, the three-dimensional (3D) prediction surface of dynamic response can be expressed as follows:
E D P = ( a θ 2 + b θ + c ) S a ( T 1 ) + d θ 2 + e θ + f
where a, b, c, d, e, and f denote the coefficients fitted to the 3D prediction model, and θ denotes the absolute value of the incident angle.
The proposed predictive model highlights the coupled effects of the incident angle and spectral acceleration of the NF motion based on a study of the influencing factors. Figure 17 and Figure 18 show the 3D predictive surfaces of the DVR and displacement response based on the incident angle and seismic parameters for the four seismic conditions, respectively. The fitting results show that the R2 values of all earthquake input cases are greater than 0.85, indicating that the proposed prediction model meets the accuracy requirements. Moreover, the 3D curve shows that with an increase in spectral acceleration, the response indicators exhibit a rapid growth trend. Additionally, the 3D fitting surface of the DVR index has a narrow and sharp peak value under negative oblique incidence compared with that in the positive incident direction.
Compared to studies relevant to SV oblique wave or vertical incidence [1,17,22,24], this work systematically investigates the relationship among incident angle, ground motion intensity parameters, and structural response indices. This analysis underscores the distinct characteristics of dam seismic response under oblique wave incidence, highlighting the necessity of explicitly incorporating wave polarization and incident direction within seismic assessment frameworks. Table 2 lists the six fitted coefficients for the damage and displacement responses under different motion groups in the 3D prediction model. The most critical incident angle can be determined based on the seismological parameters and prediction surfaces, resulting in the identification of the maximum seismic response. These numerical results clarify the seismic response patterns and reveal the failure mechanisms of the dam body under oblique P wave incidence, providing solid evidence for the practical engineering of concrete dams in proximity to fault regions.

7. Conclusions

This study investigated the seismic dynamic response of concrete dams under NF obliquely incident P waves using finite element numerical simulations. Nonlinear time-history analyses were conducted on a typical concrete gravity dam. Various seismic input scenarios were considered, including PL and NP motion under 13 different incident angles and 2 peak ground acceleration conditions. By examining the combined effects of the pulse characteristics, incident angle and direction, and seismic intensity, the damage and displacement responses clarified the seismic behavior and failure mechanism of concrete gravity dams under obliquely incident P waves. Additionally, a nonlinear 3D predictive model was proposed to evaluate the seismic response of concrete dams. The findings of this study offer insights into dynamic response predictions for arbitrary NF earthquake input, underscoring the importance of considering the seismological characteristics and oblique incidence on the seismic performance of concrete dams in regions susceptible to NF seismic activity. The conclusions can be summarized as follows:
(1)
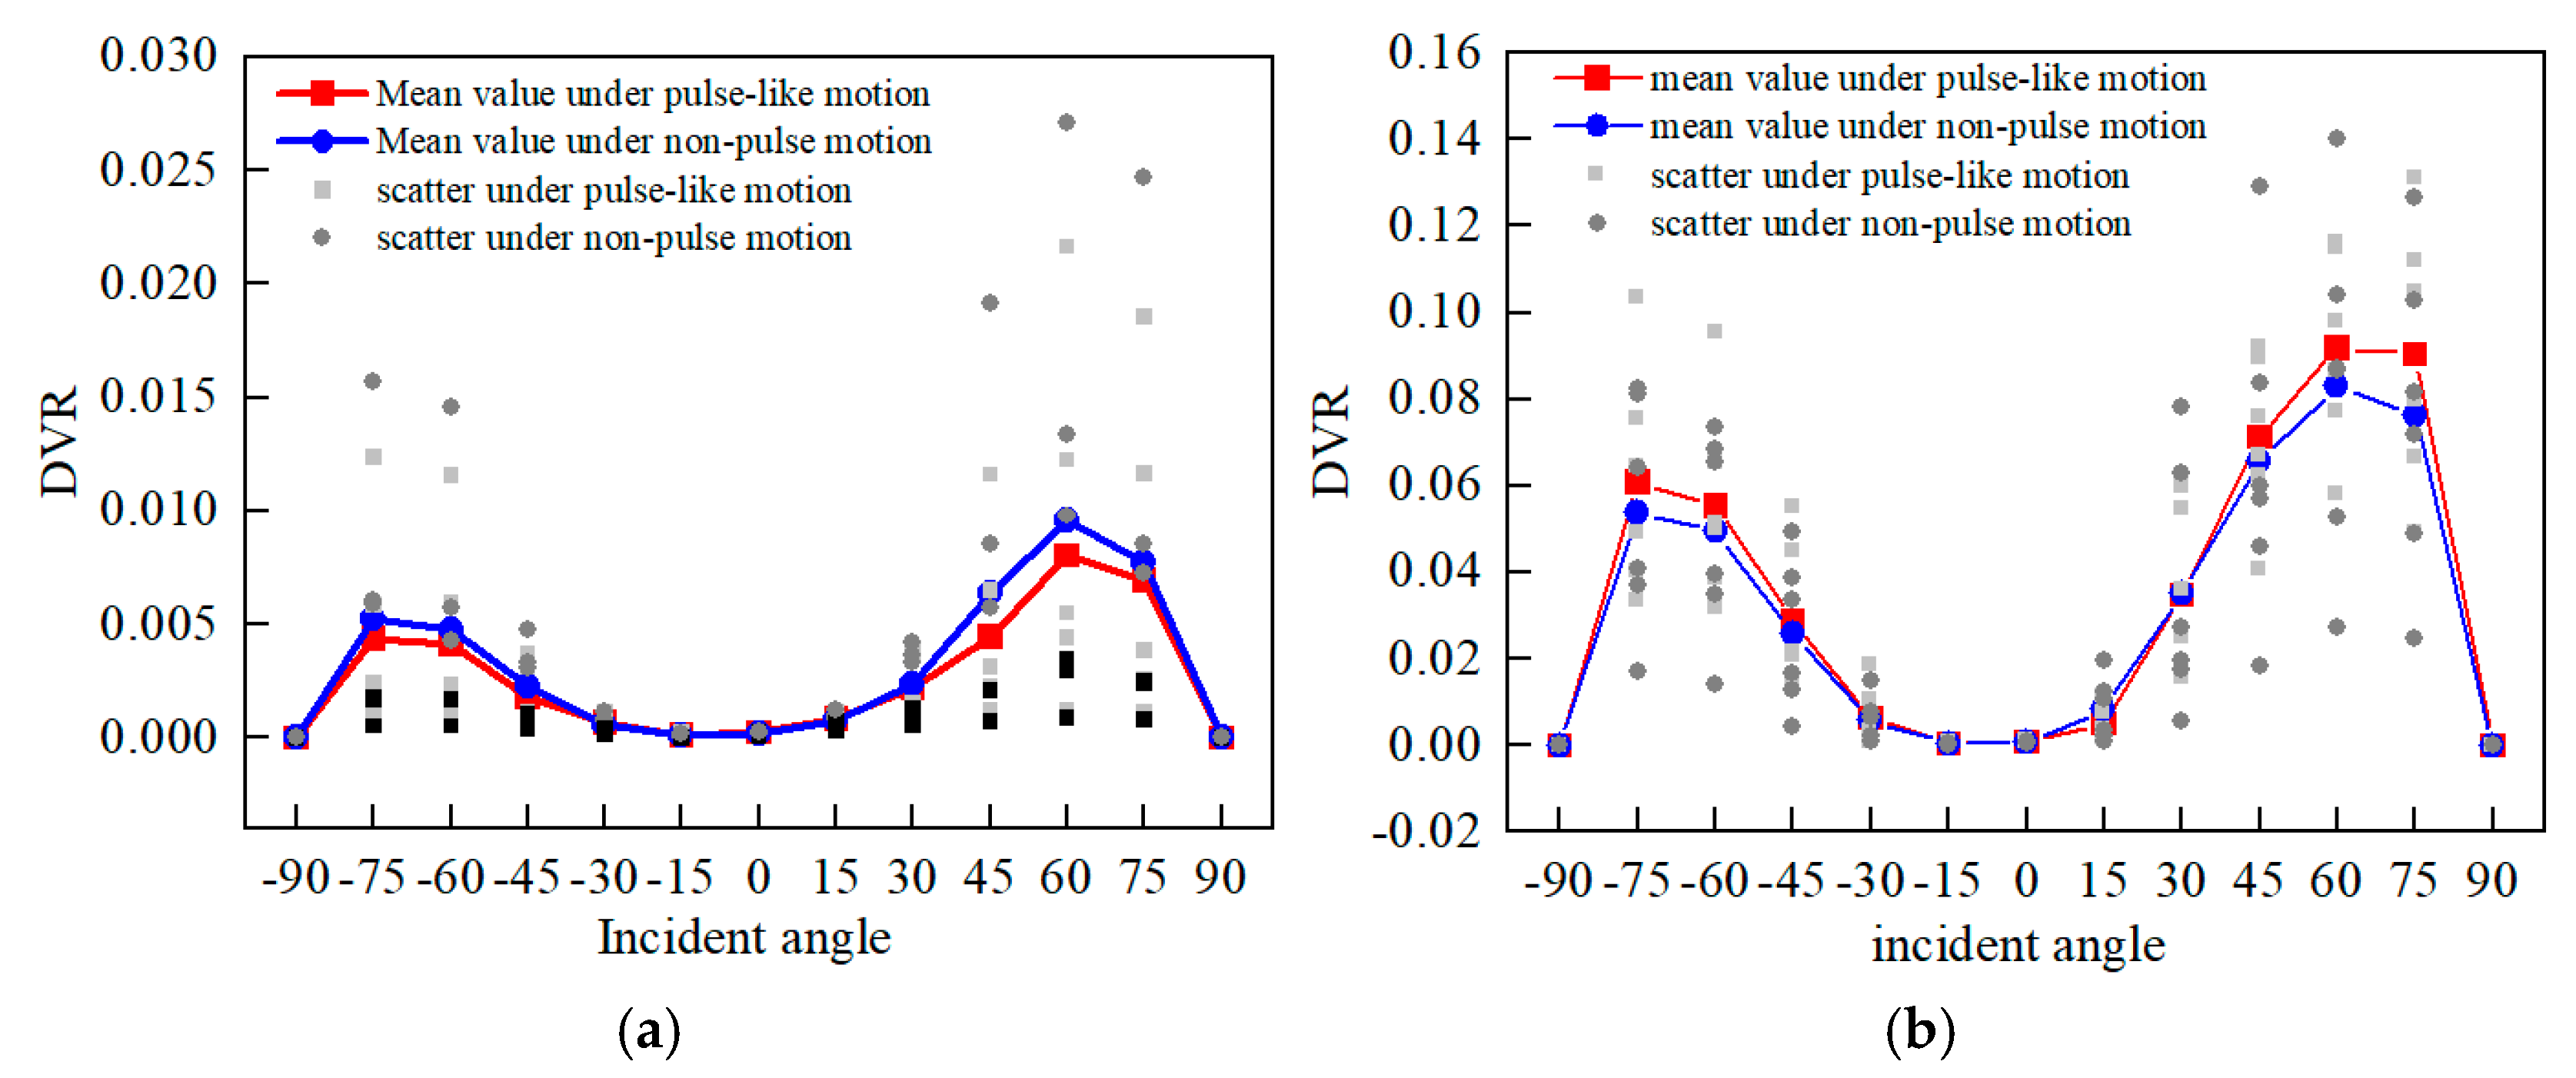
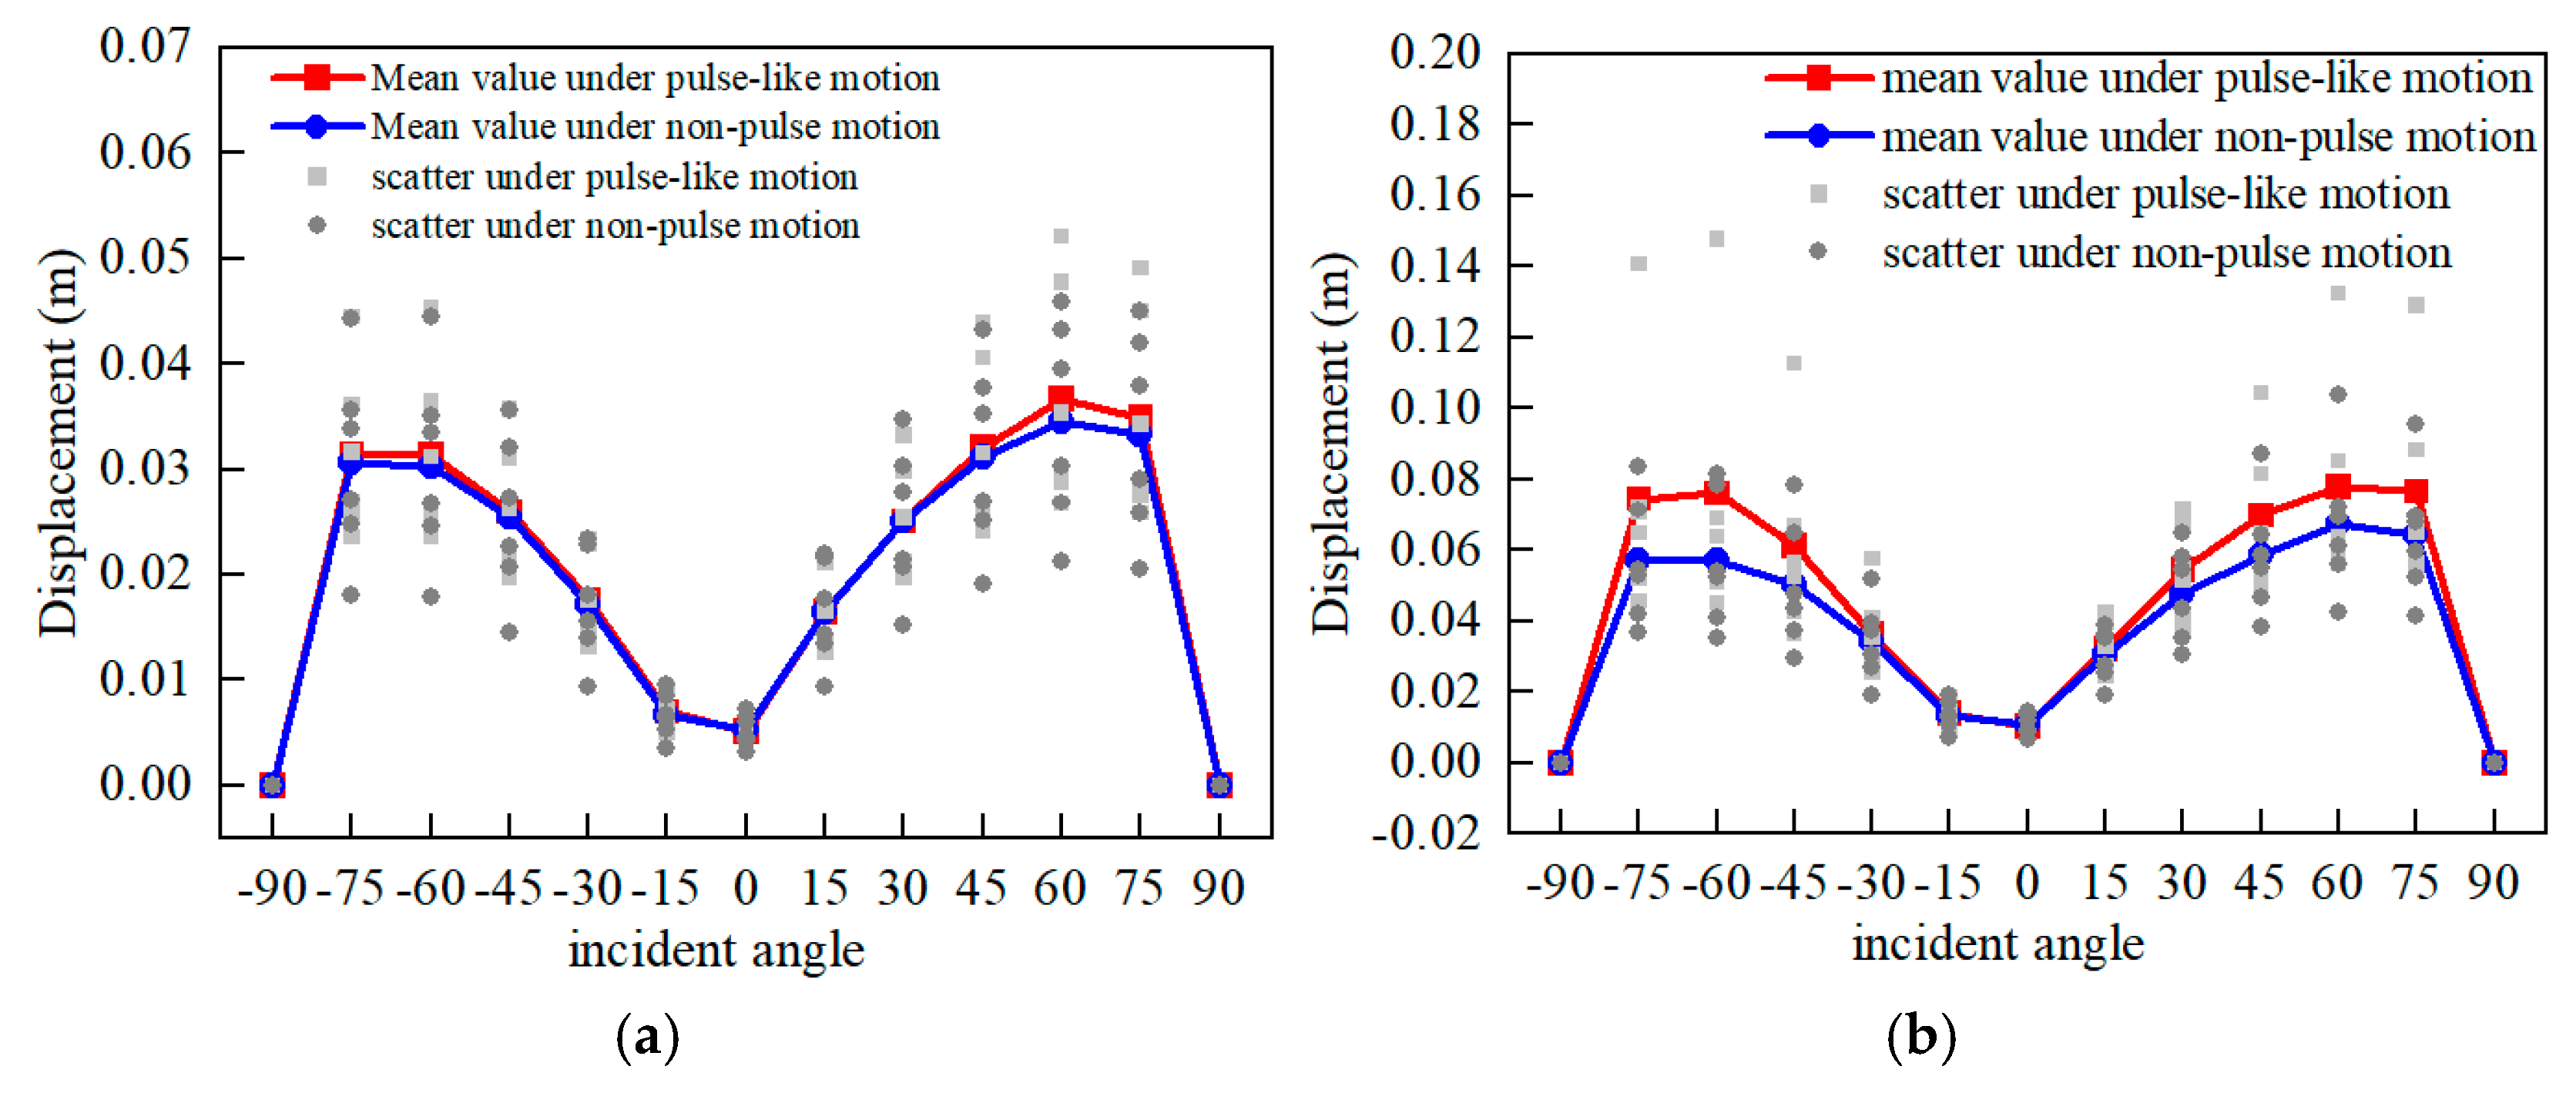
The numerical results demonstrated that the oblique incidence angle of the P waves significantly influenced the damage to and displacement of the dam. As the incident angle of the P waves increased, the average response also increased, reaching a peak at approximately 60° with a slightly smaller average response at 75°. The damage response value for positive incidence was considerably greater than that for negative oblique incidence. In contrast, the displacement response results exhibited greater symmetry in the positive and negative incidence directions. Moreover, PL motion could cause heightened levels of dynamic response and potential damage compared to NP motion.
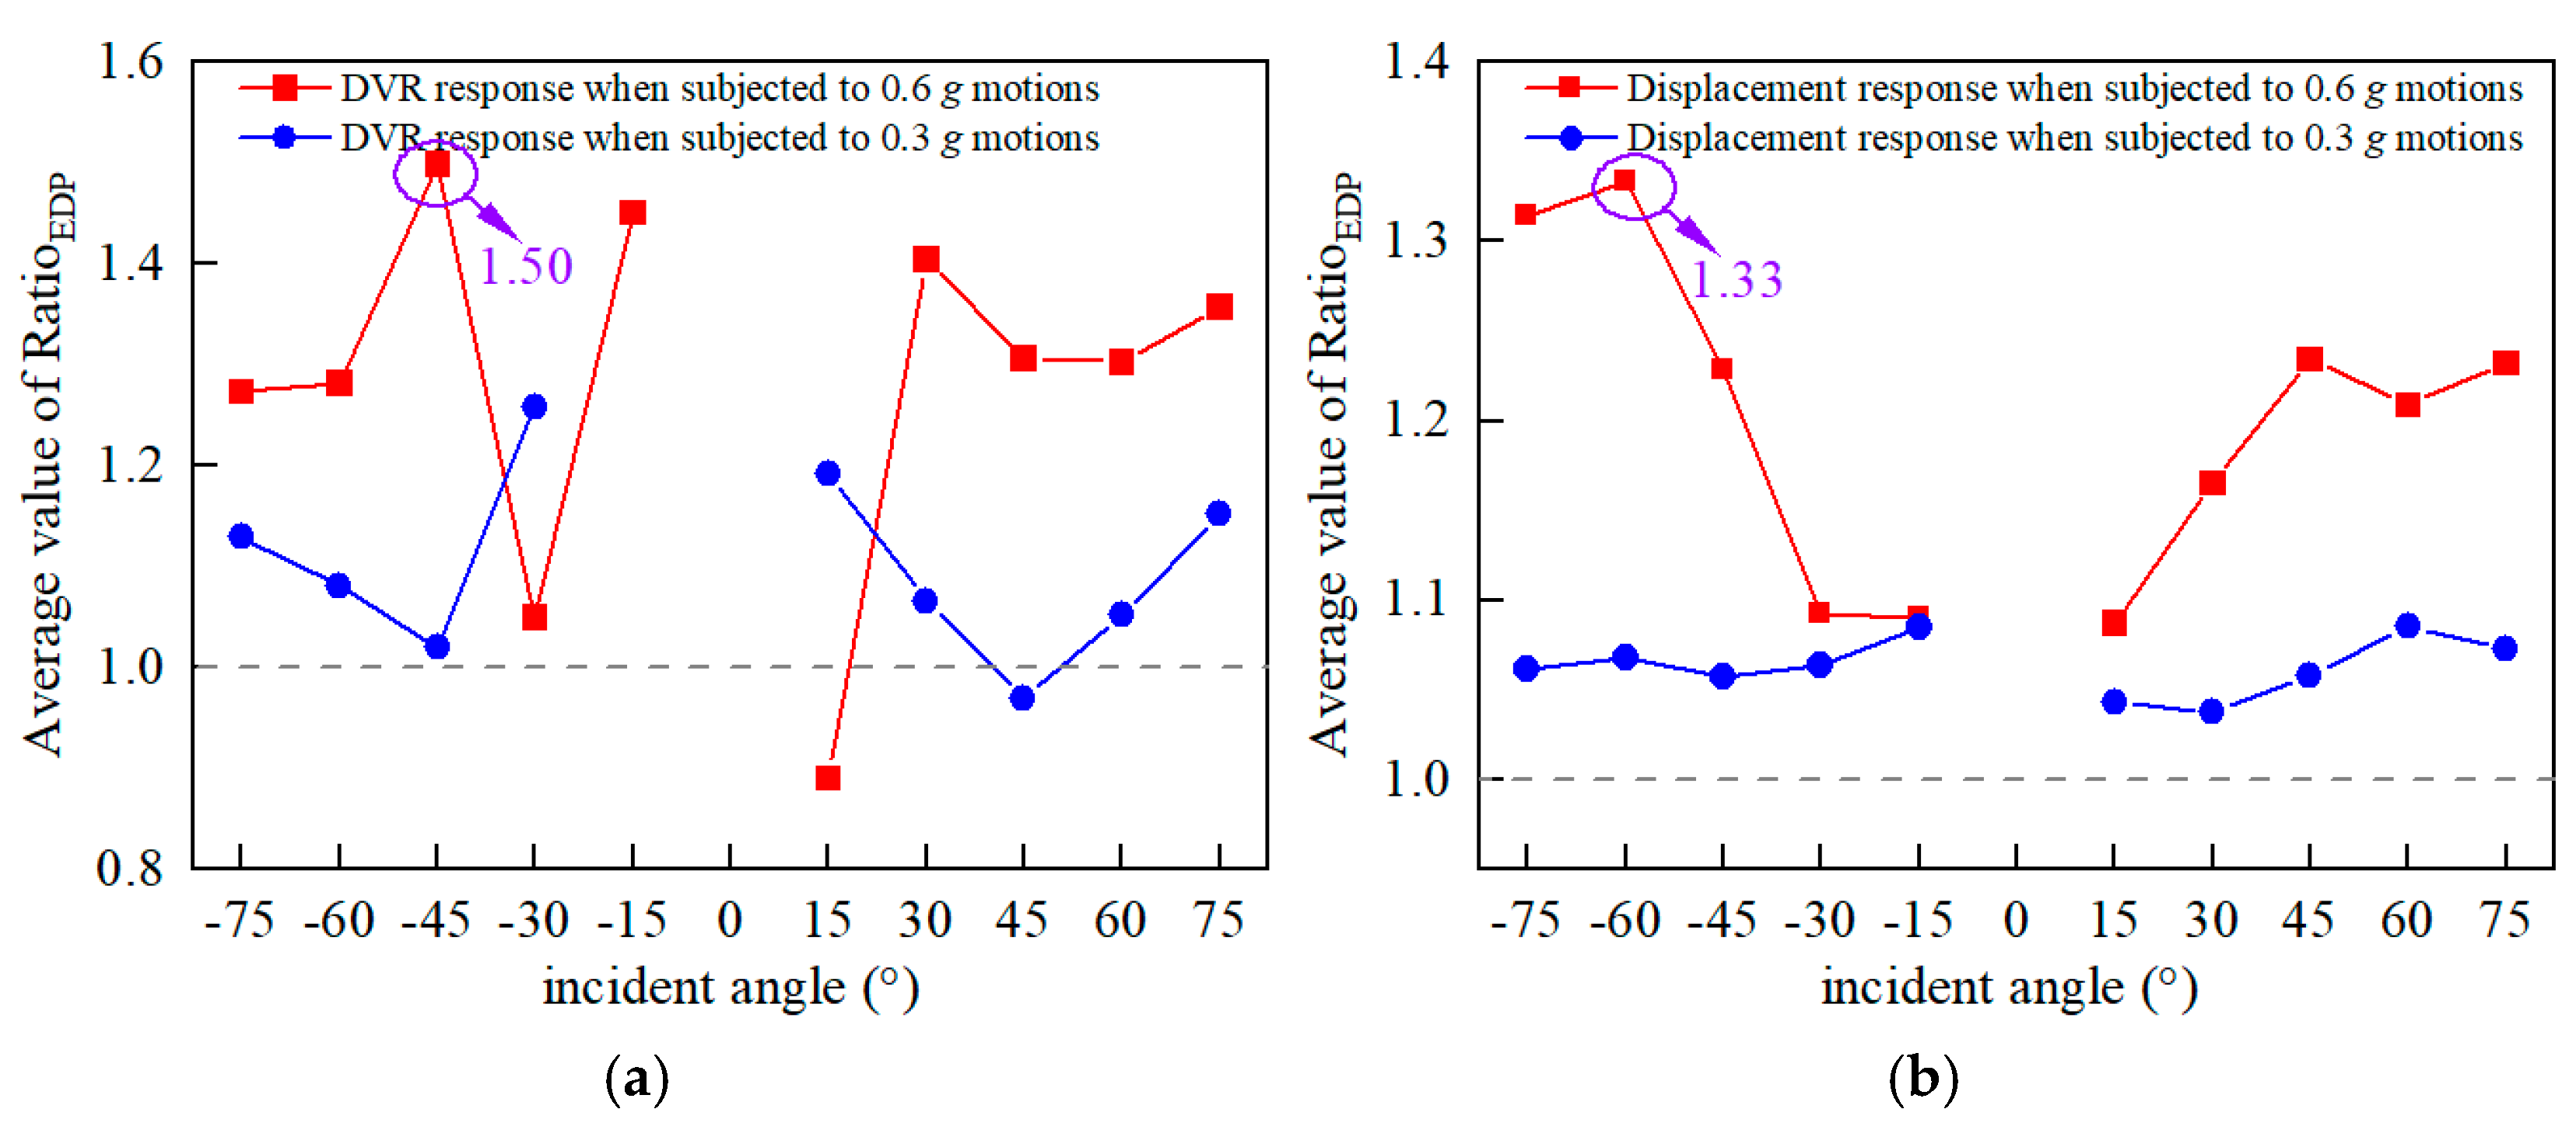
(2)
The RatioEDP index assessed discrepancies in the response induced by the pulse characteristics. Owing to the upstream and downstream asymmetry of the dam body, the PL ground motion tended to exhibit considerably higher response values under negative oblique incidence. In the presence of strong earthquakes 0.6 g, the variation in the response between the PL and NP ground motions was more pronounced, with the maximum ratio increasing by up to 1.5 times, indicating that strong earthquakes further excite the effect of pulse components on the dam structure.
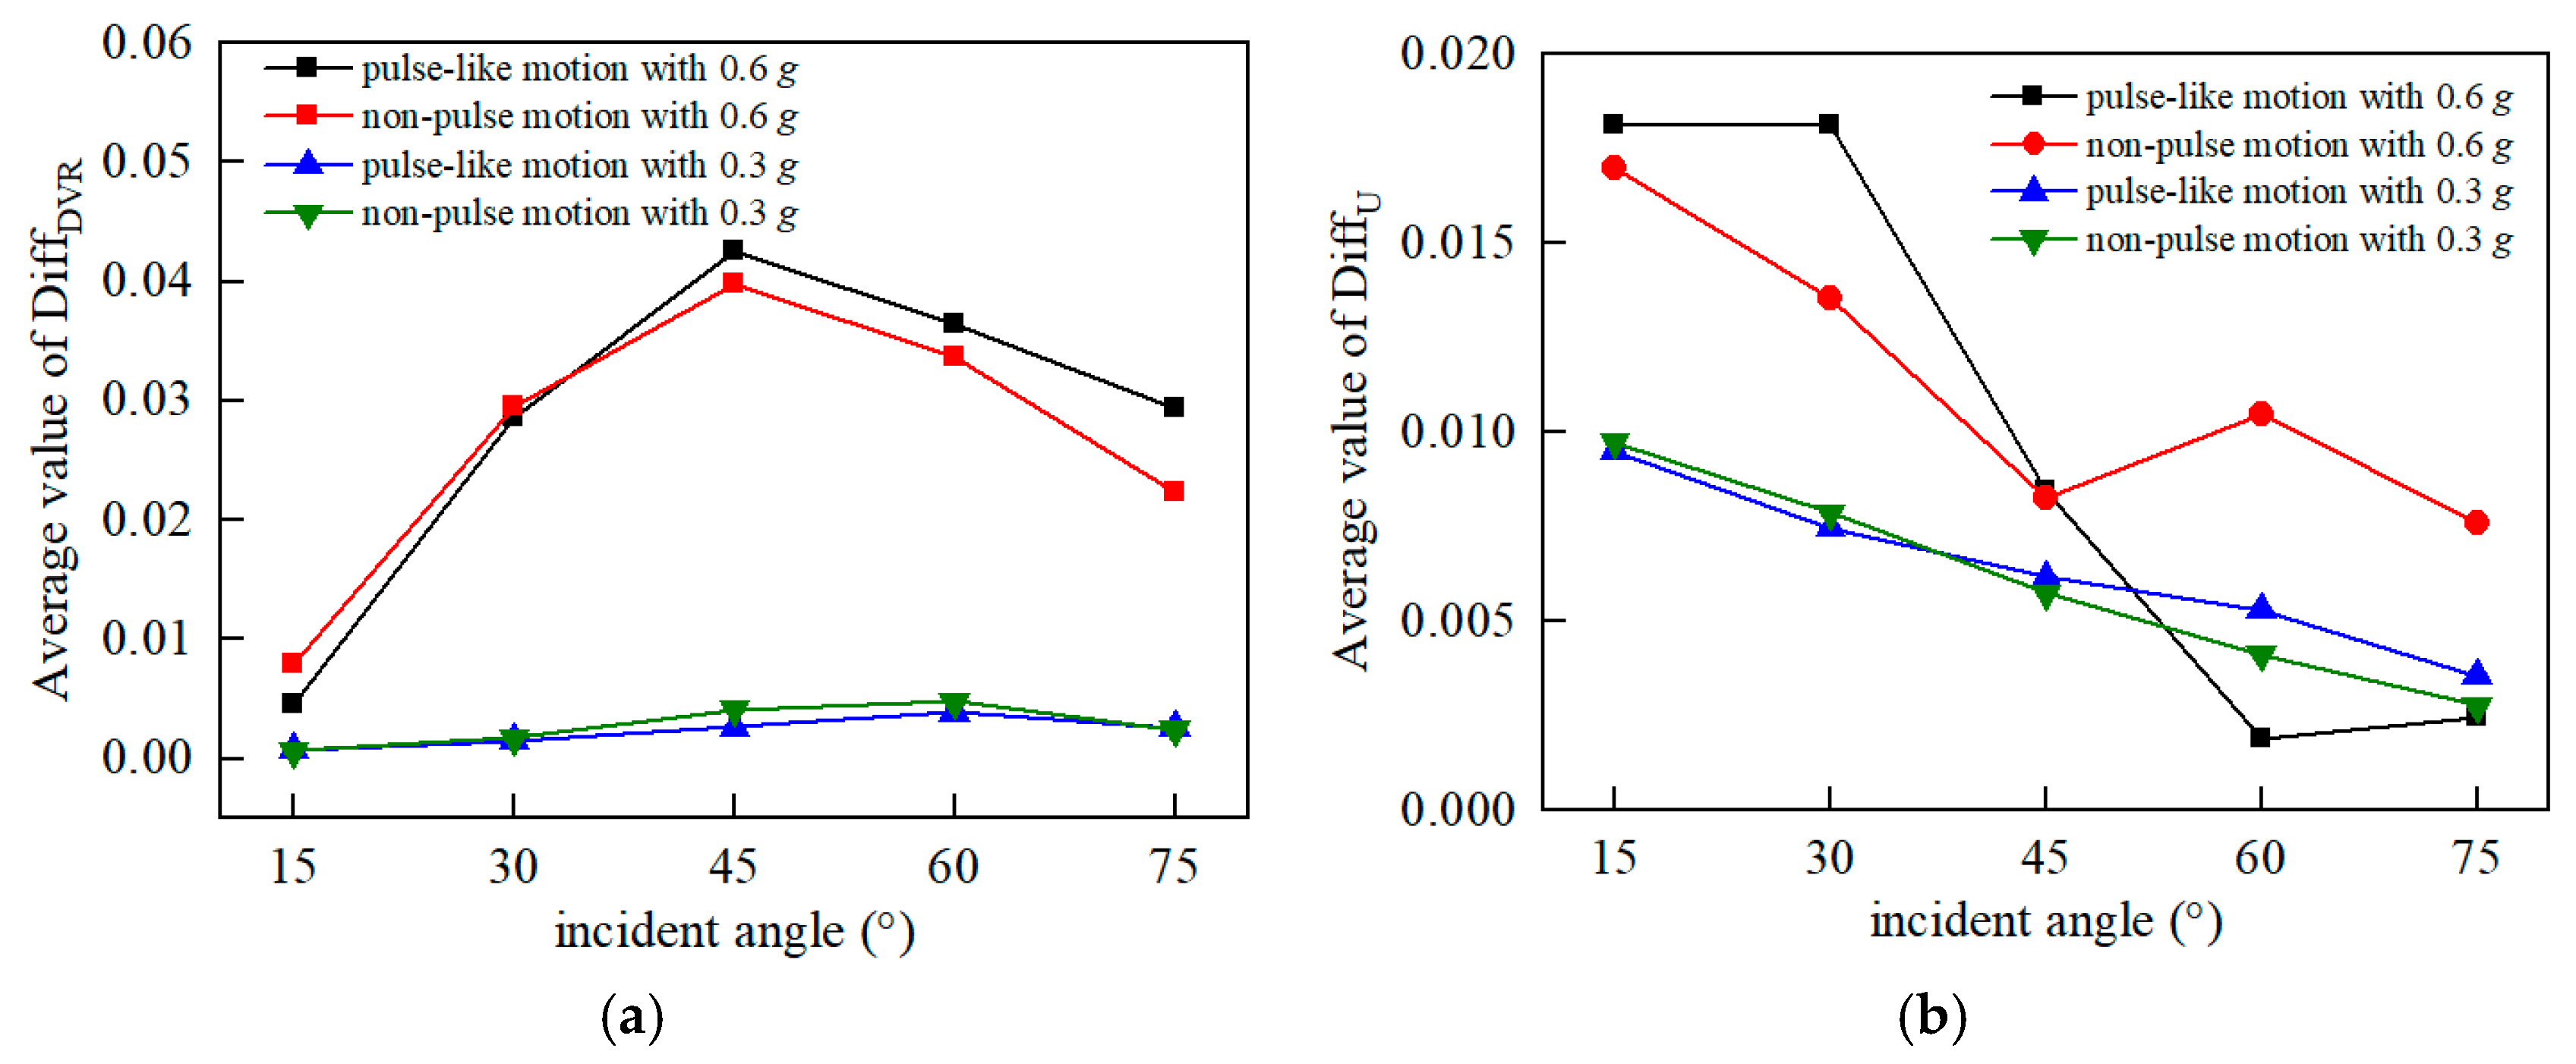
(3)
The influence of the incident direction on the dynamic response was determined using the proposed DiffEDP index. The differences in the damage response caused by positive and negative incidents were nearly identical under NF earthquakes with or without pulse characteristics. Furthermore, the response difference was considerably larger when the PGA was at 0.6 g as opposed to when it was at 0.3 g, with the damage response difference reaching its maximum value at an incident angle of 45°. Regarding displacement response, variations in DiffUc were evident under PL and NP ground motion at 0.6 g, with the maximum value being reached at an incident angle of 15°.
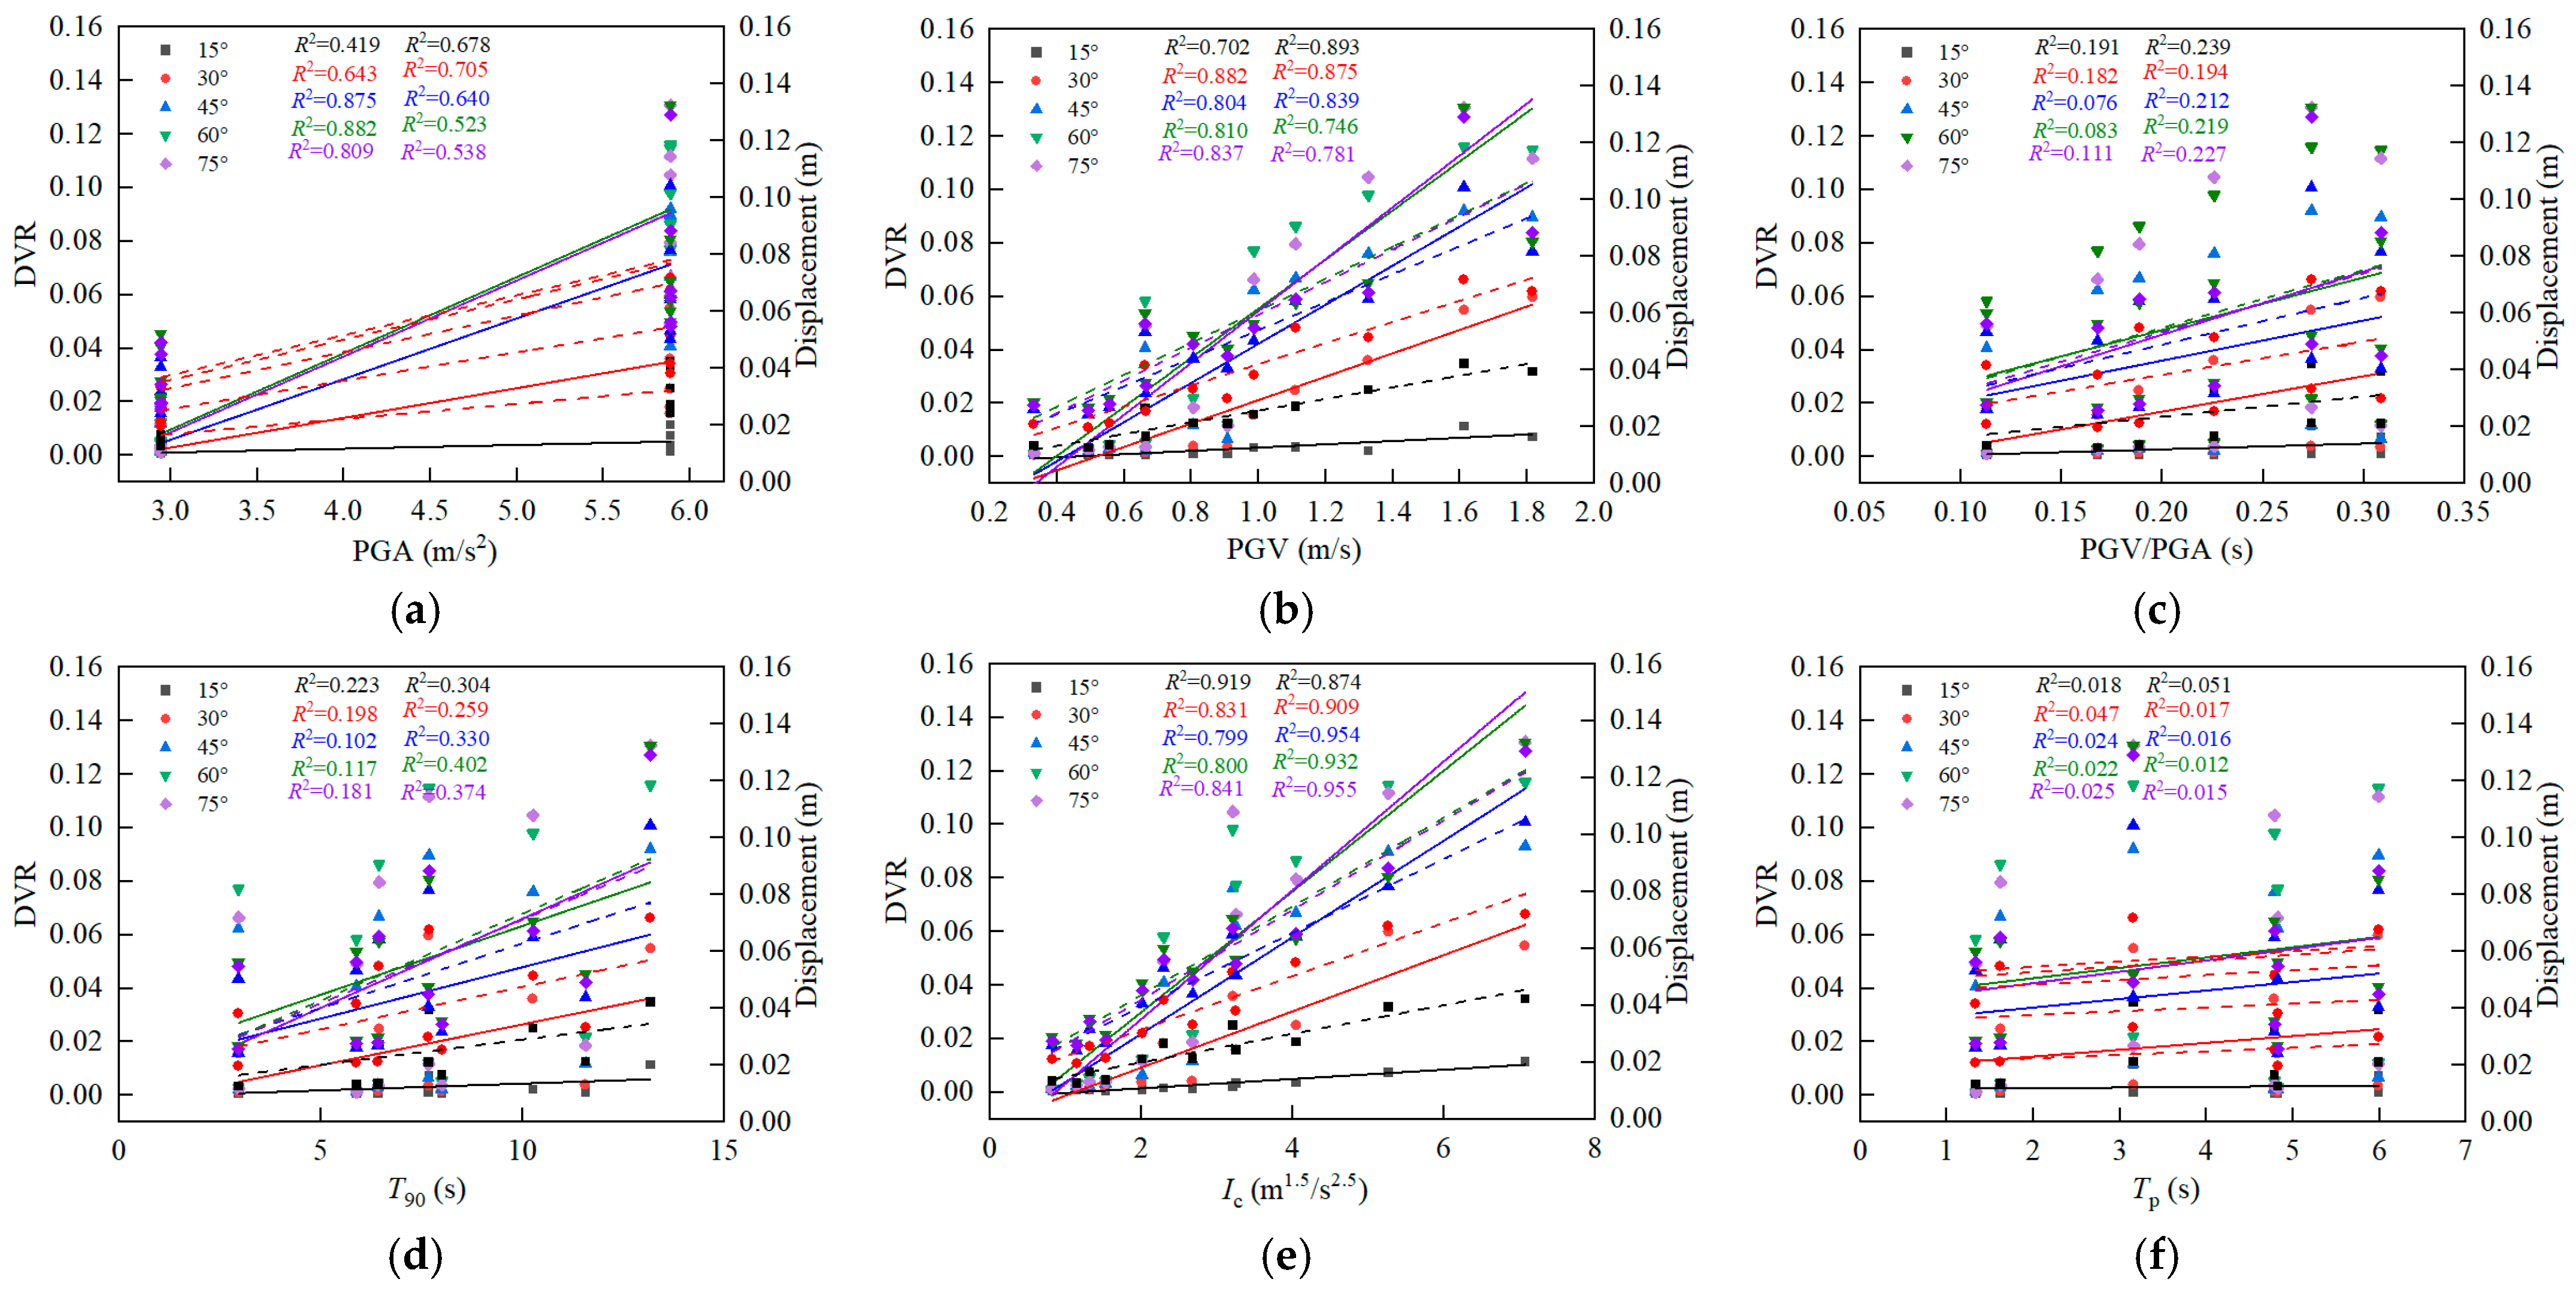
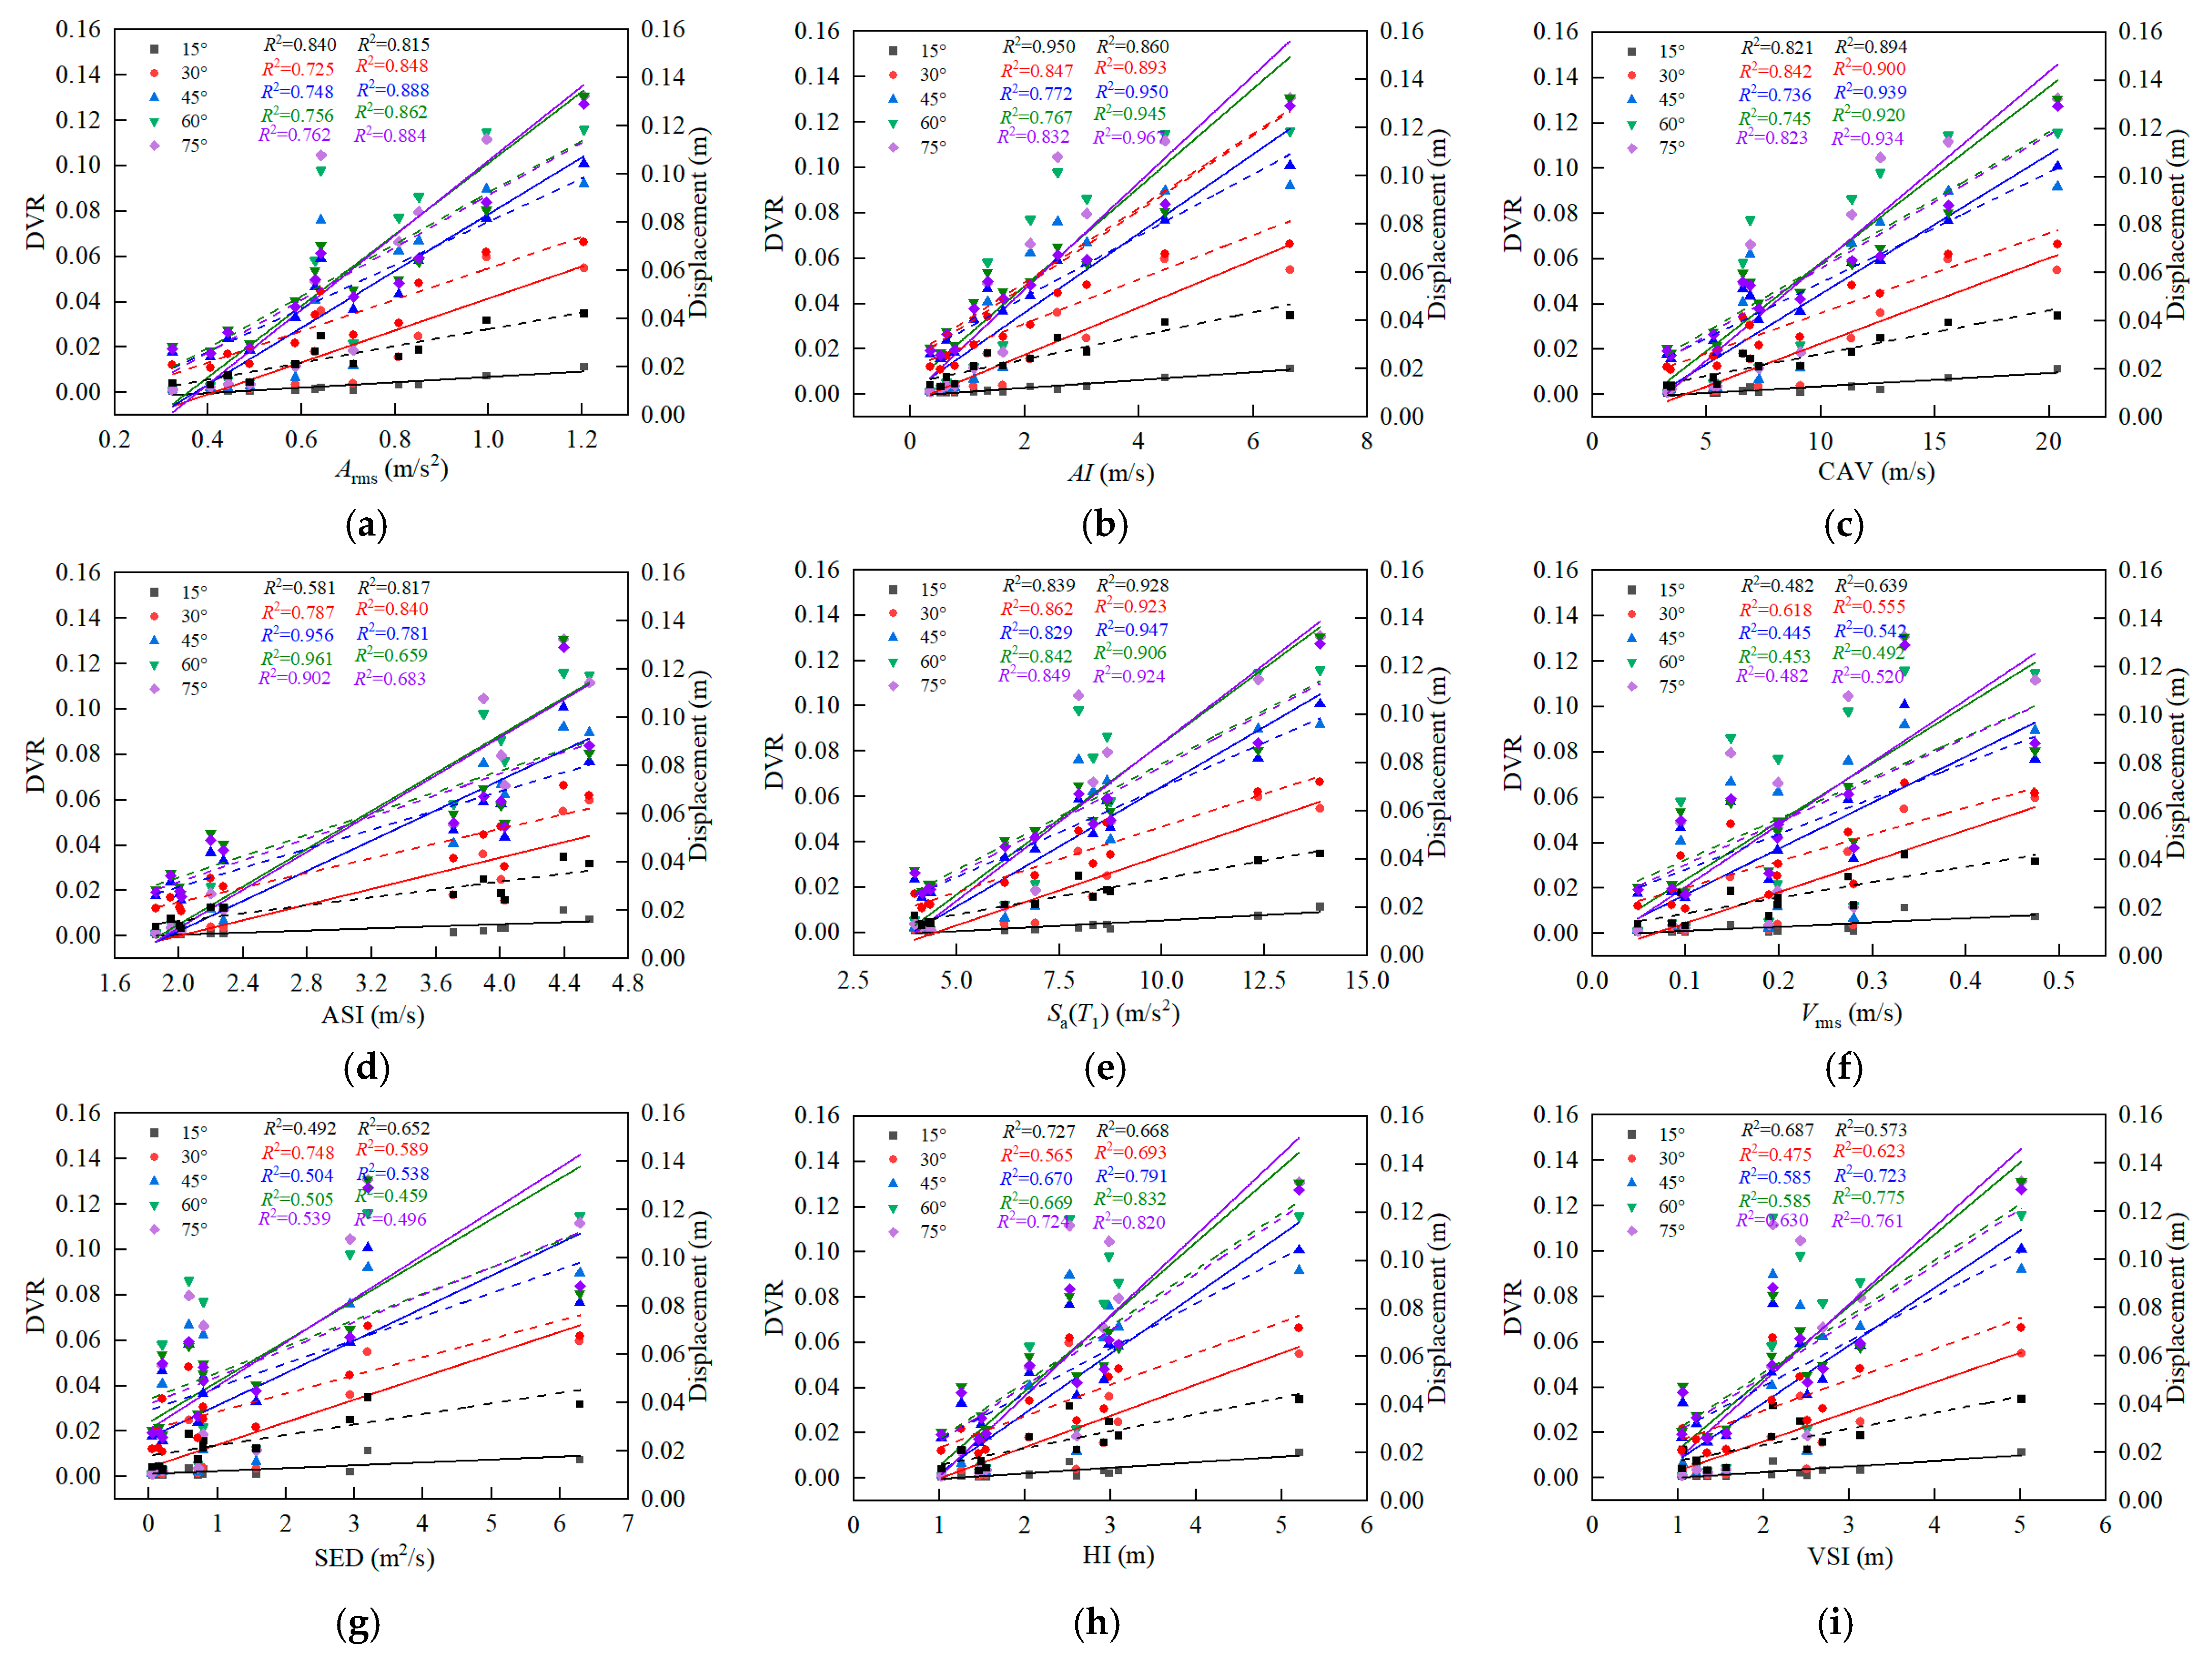
(4)
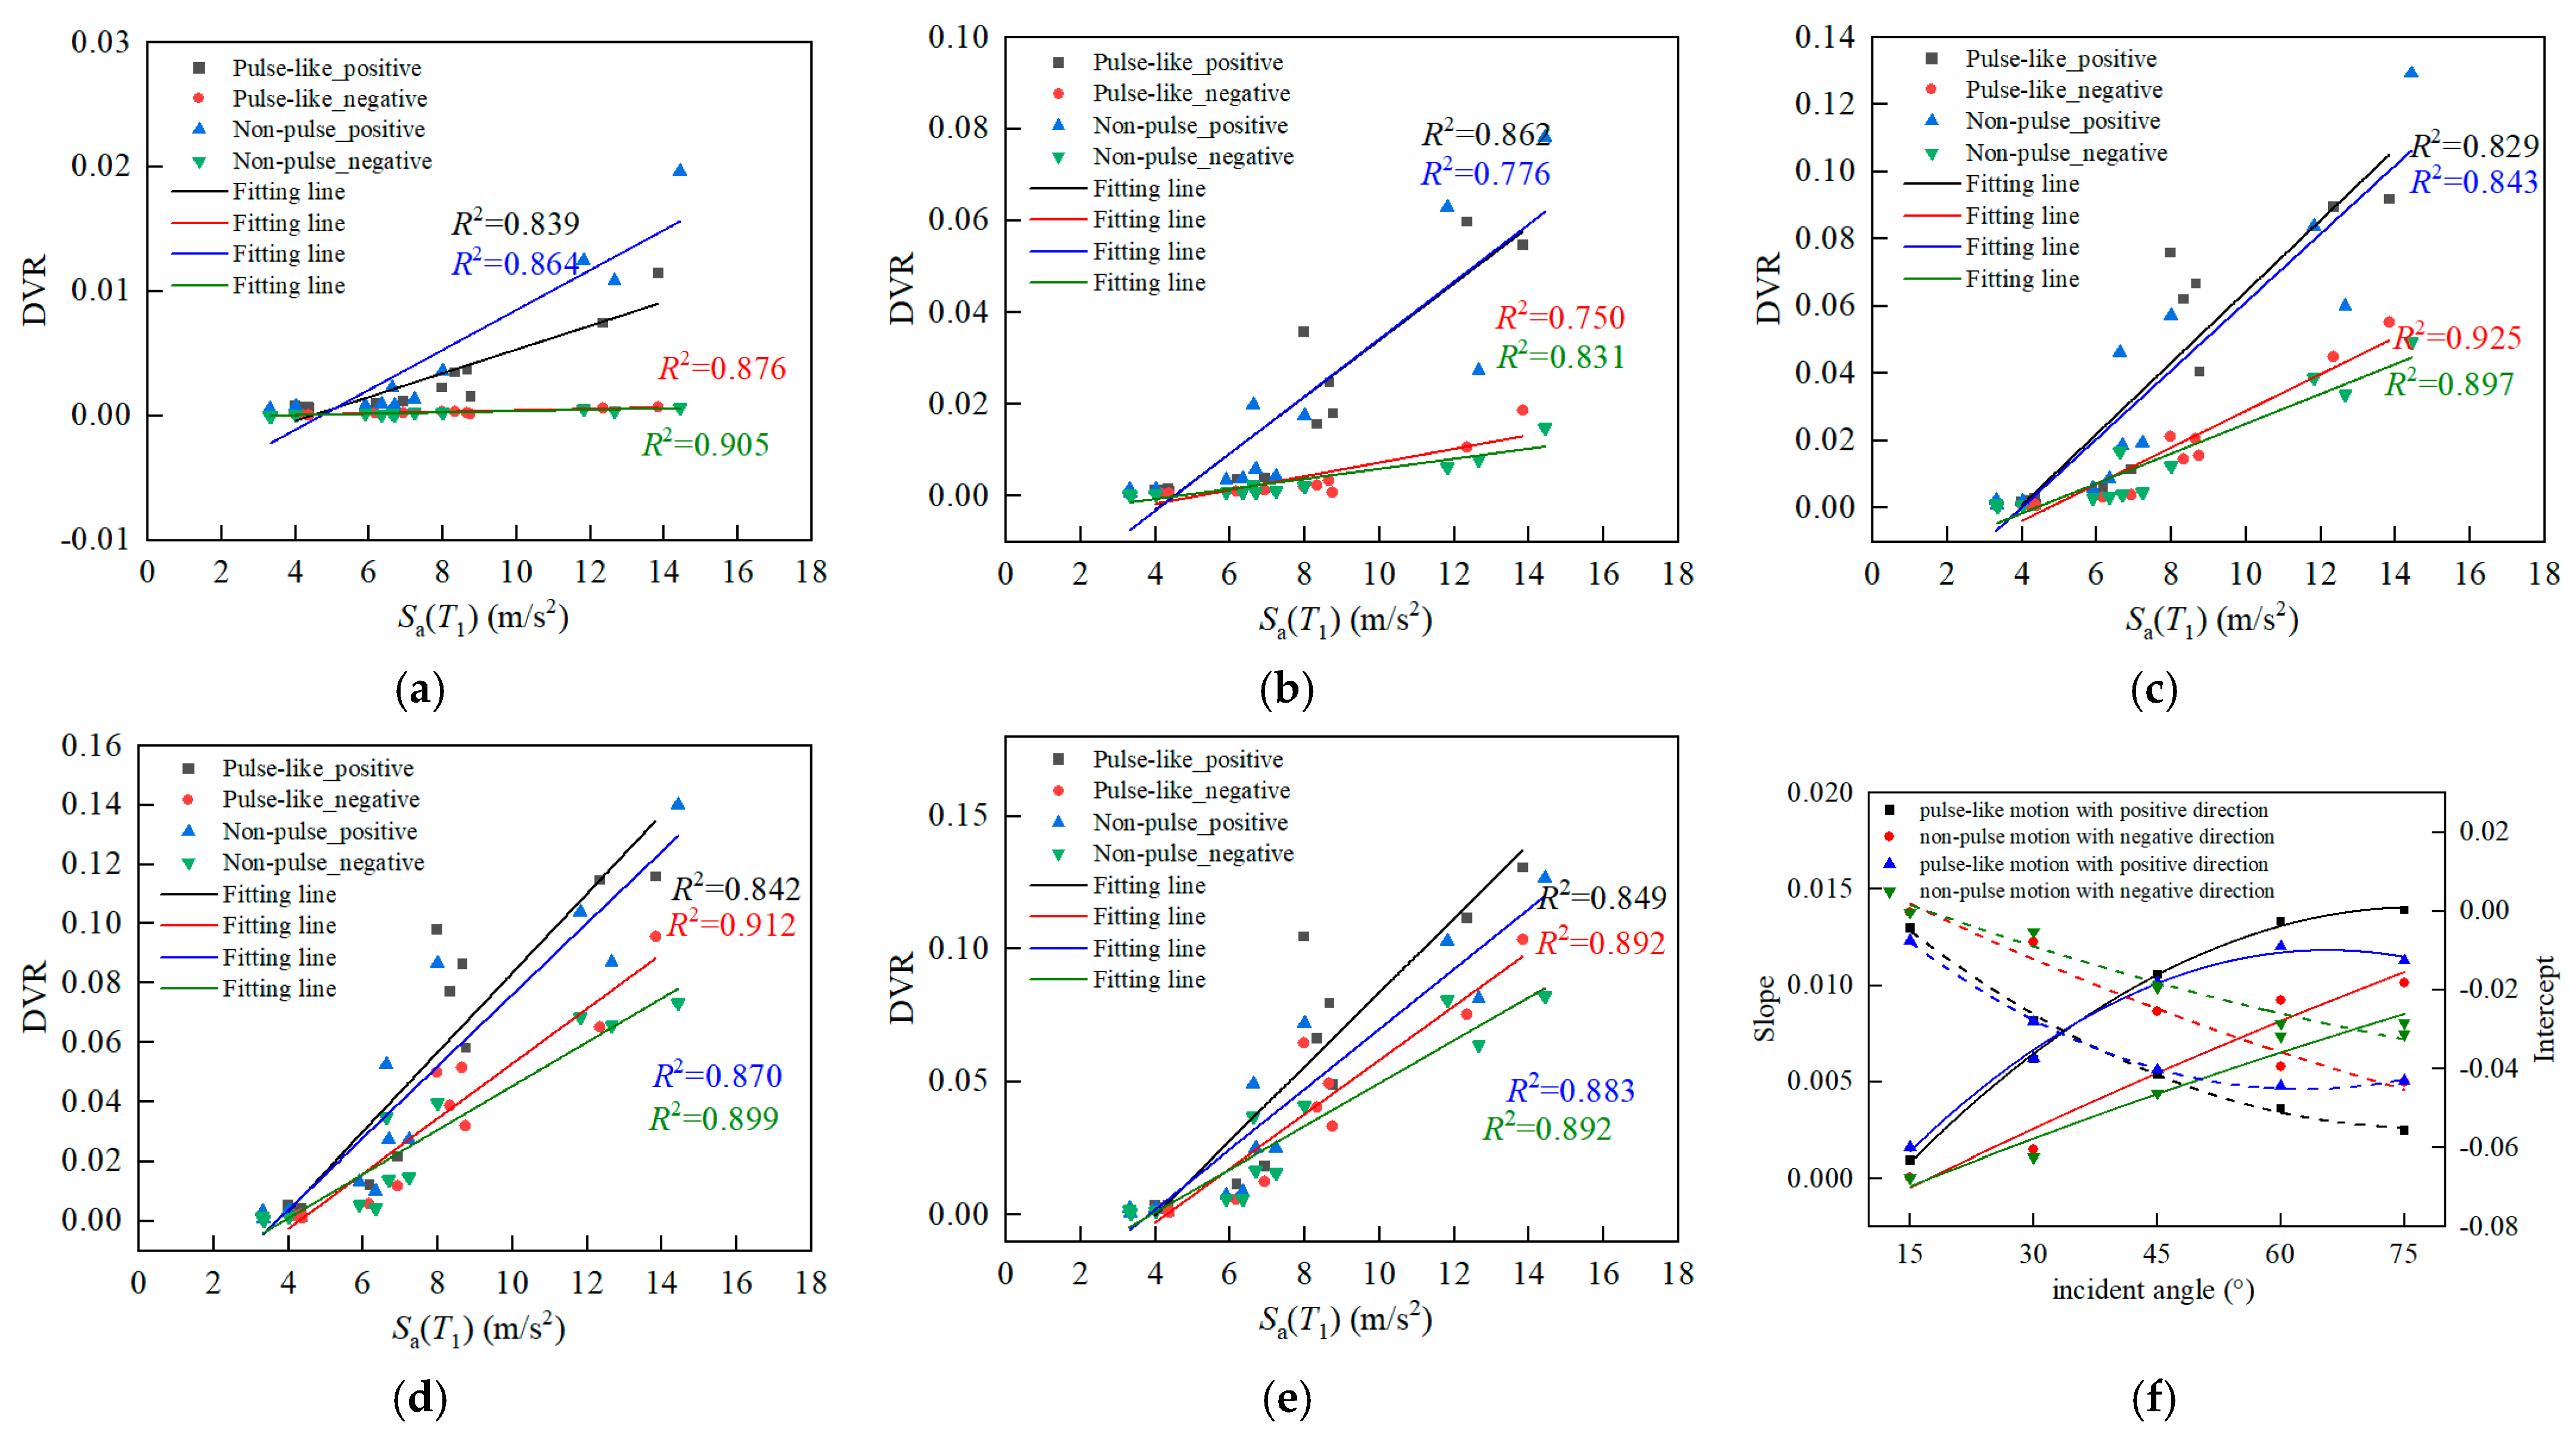
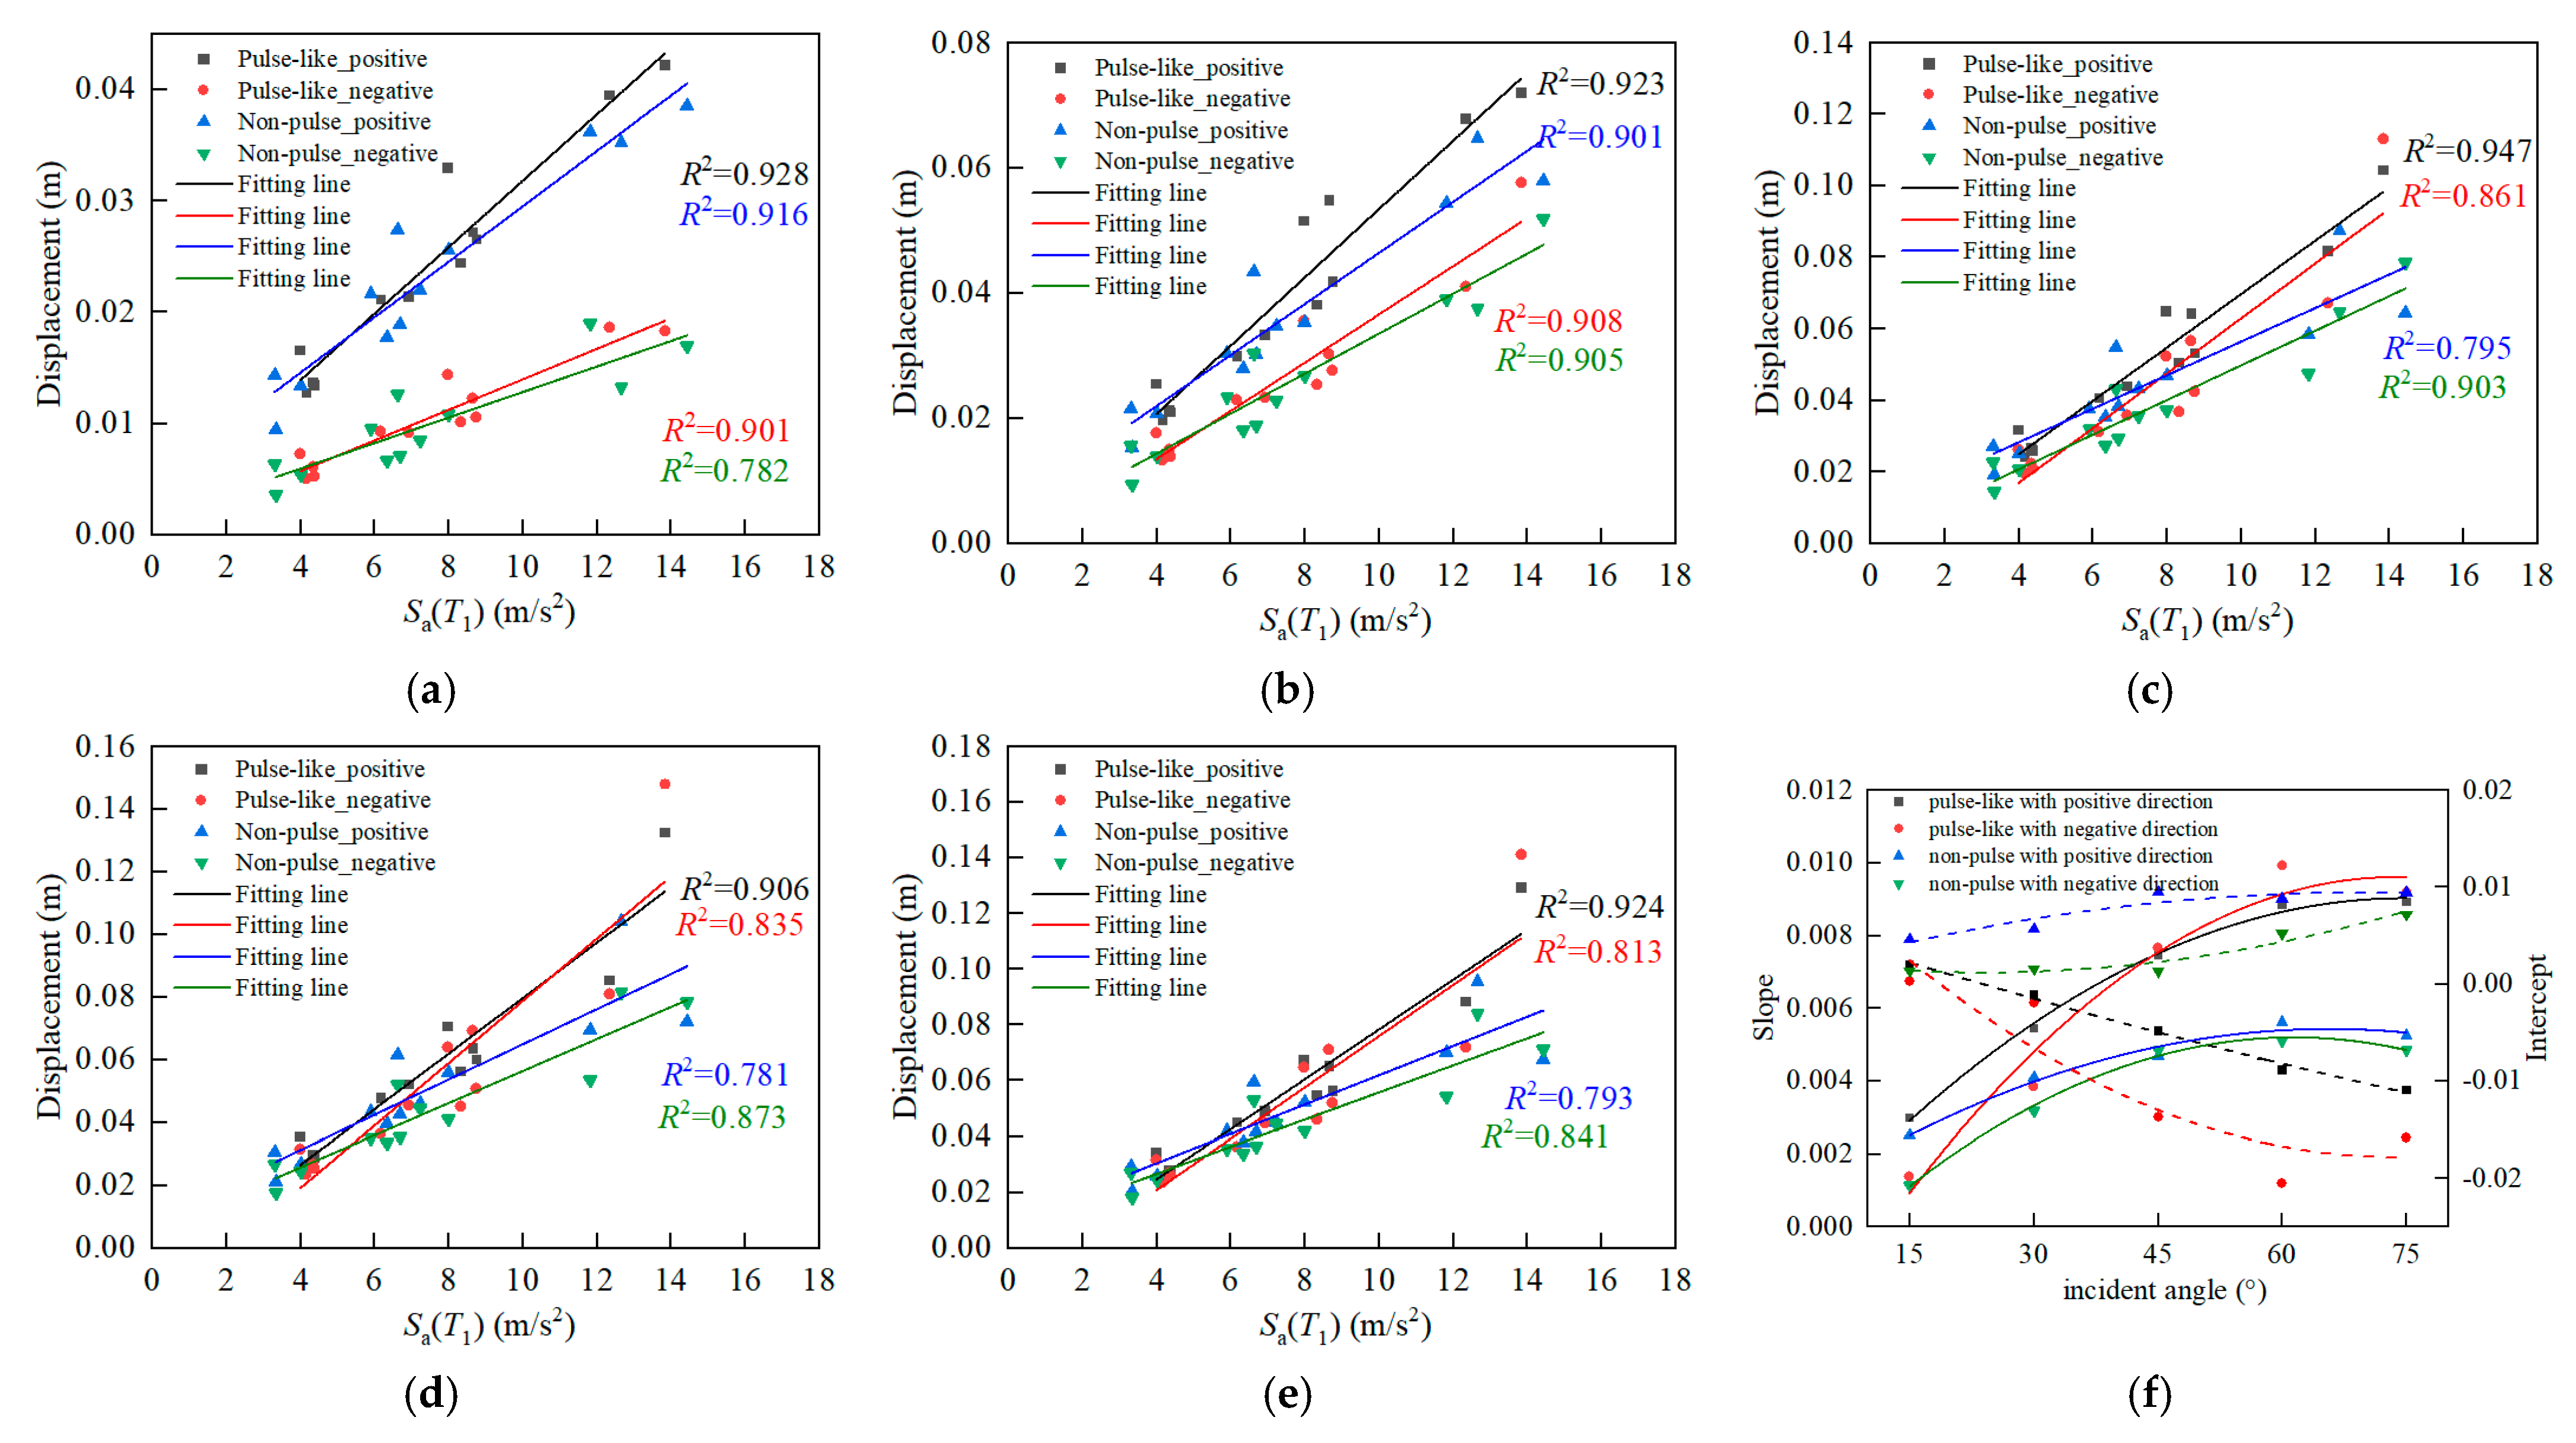
The optimal seismic parameter Sa(T1) was determined by analyzing the effect of the seismic intensity and pulse parameters on the dynamic response. The coupled effects of the pulse characteristics and oblique direction were examined by establishing the relationship between Sa(T1) and the dynamic response at various angles. As the incident angle was varied, the fitting results exhibited variations under different working conditions. The slope and intercept of the fitting line exhibited a quadratic polynomial relationship with the incident angle. In particular, the slope of the fitting line increased steadily with the incident angle, with the growth rate eventually leveling off.
(5)
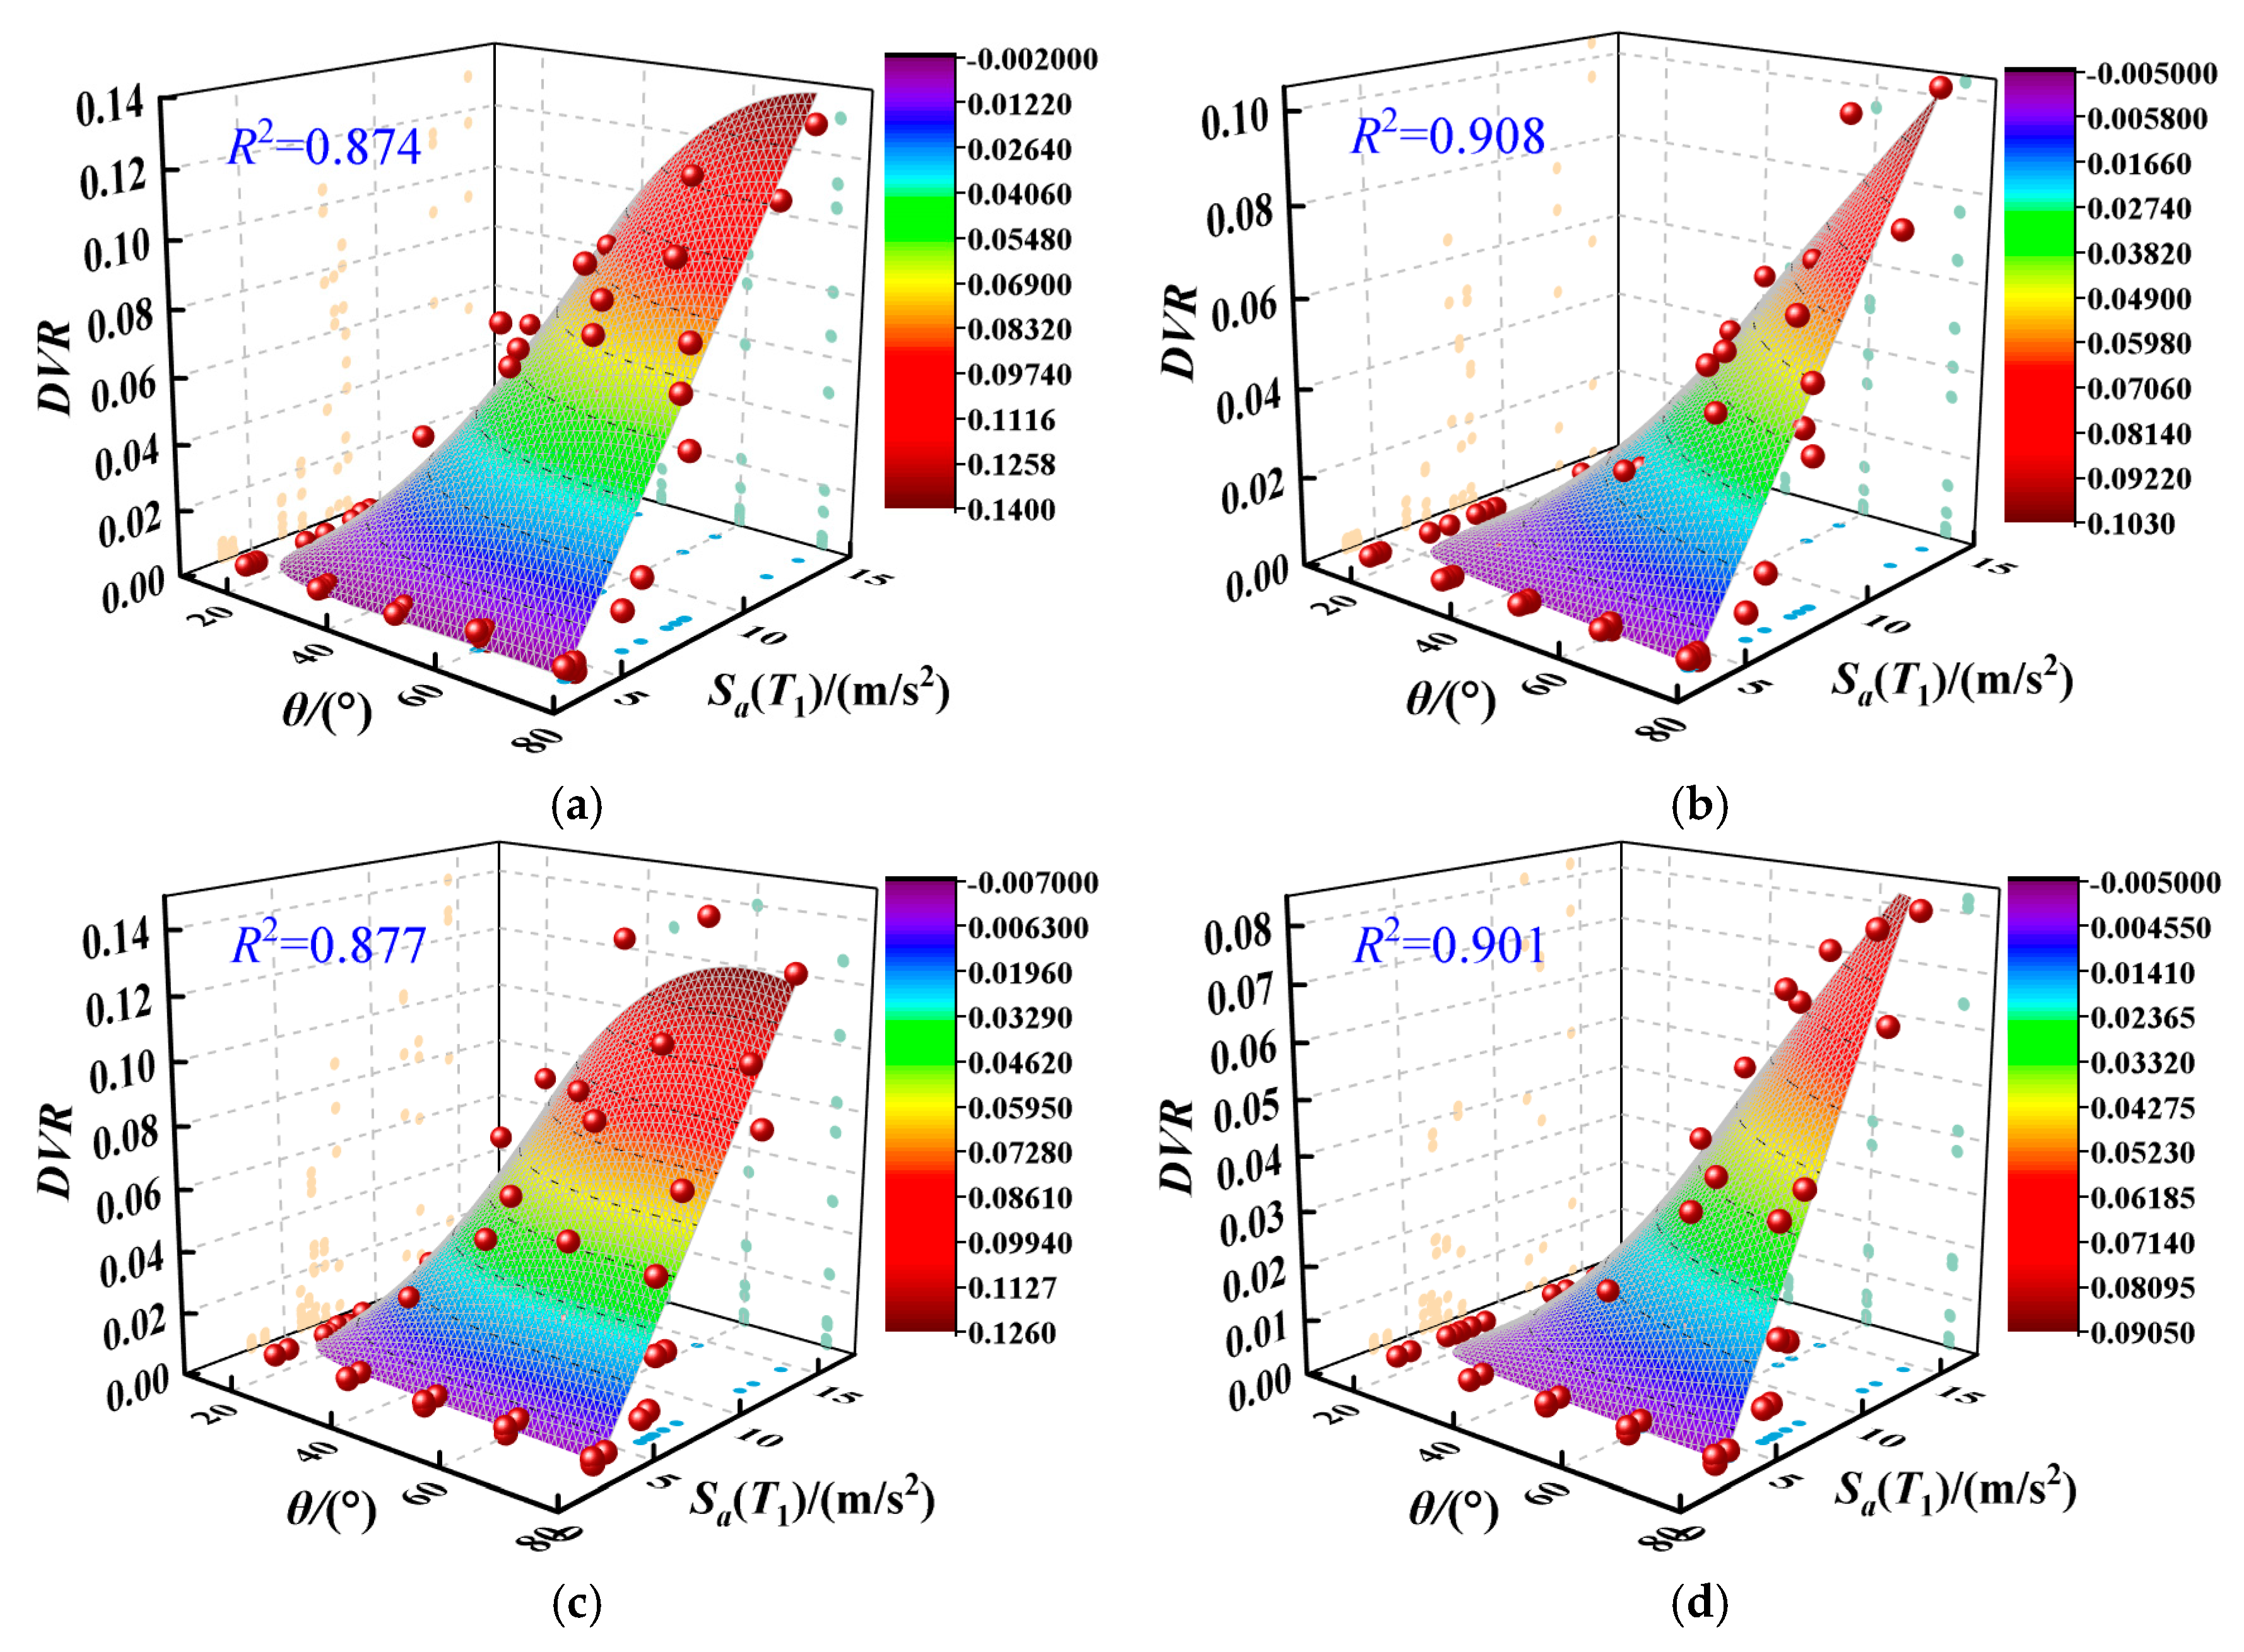
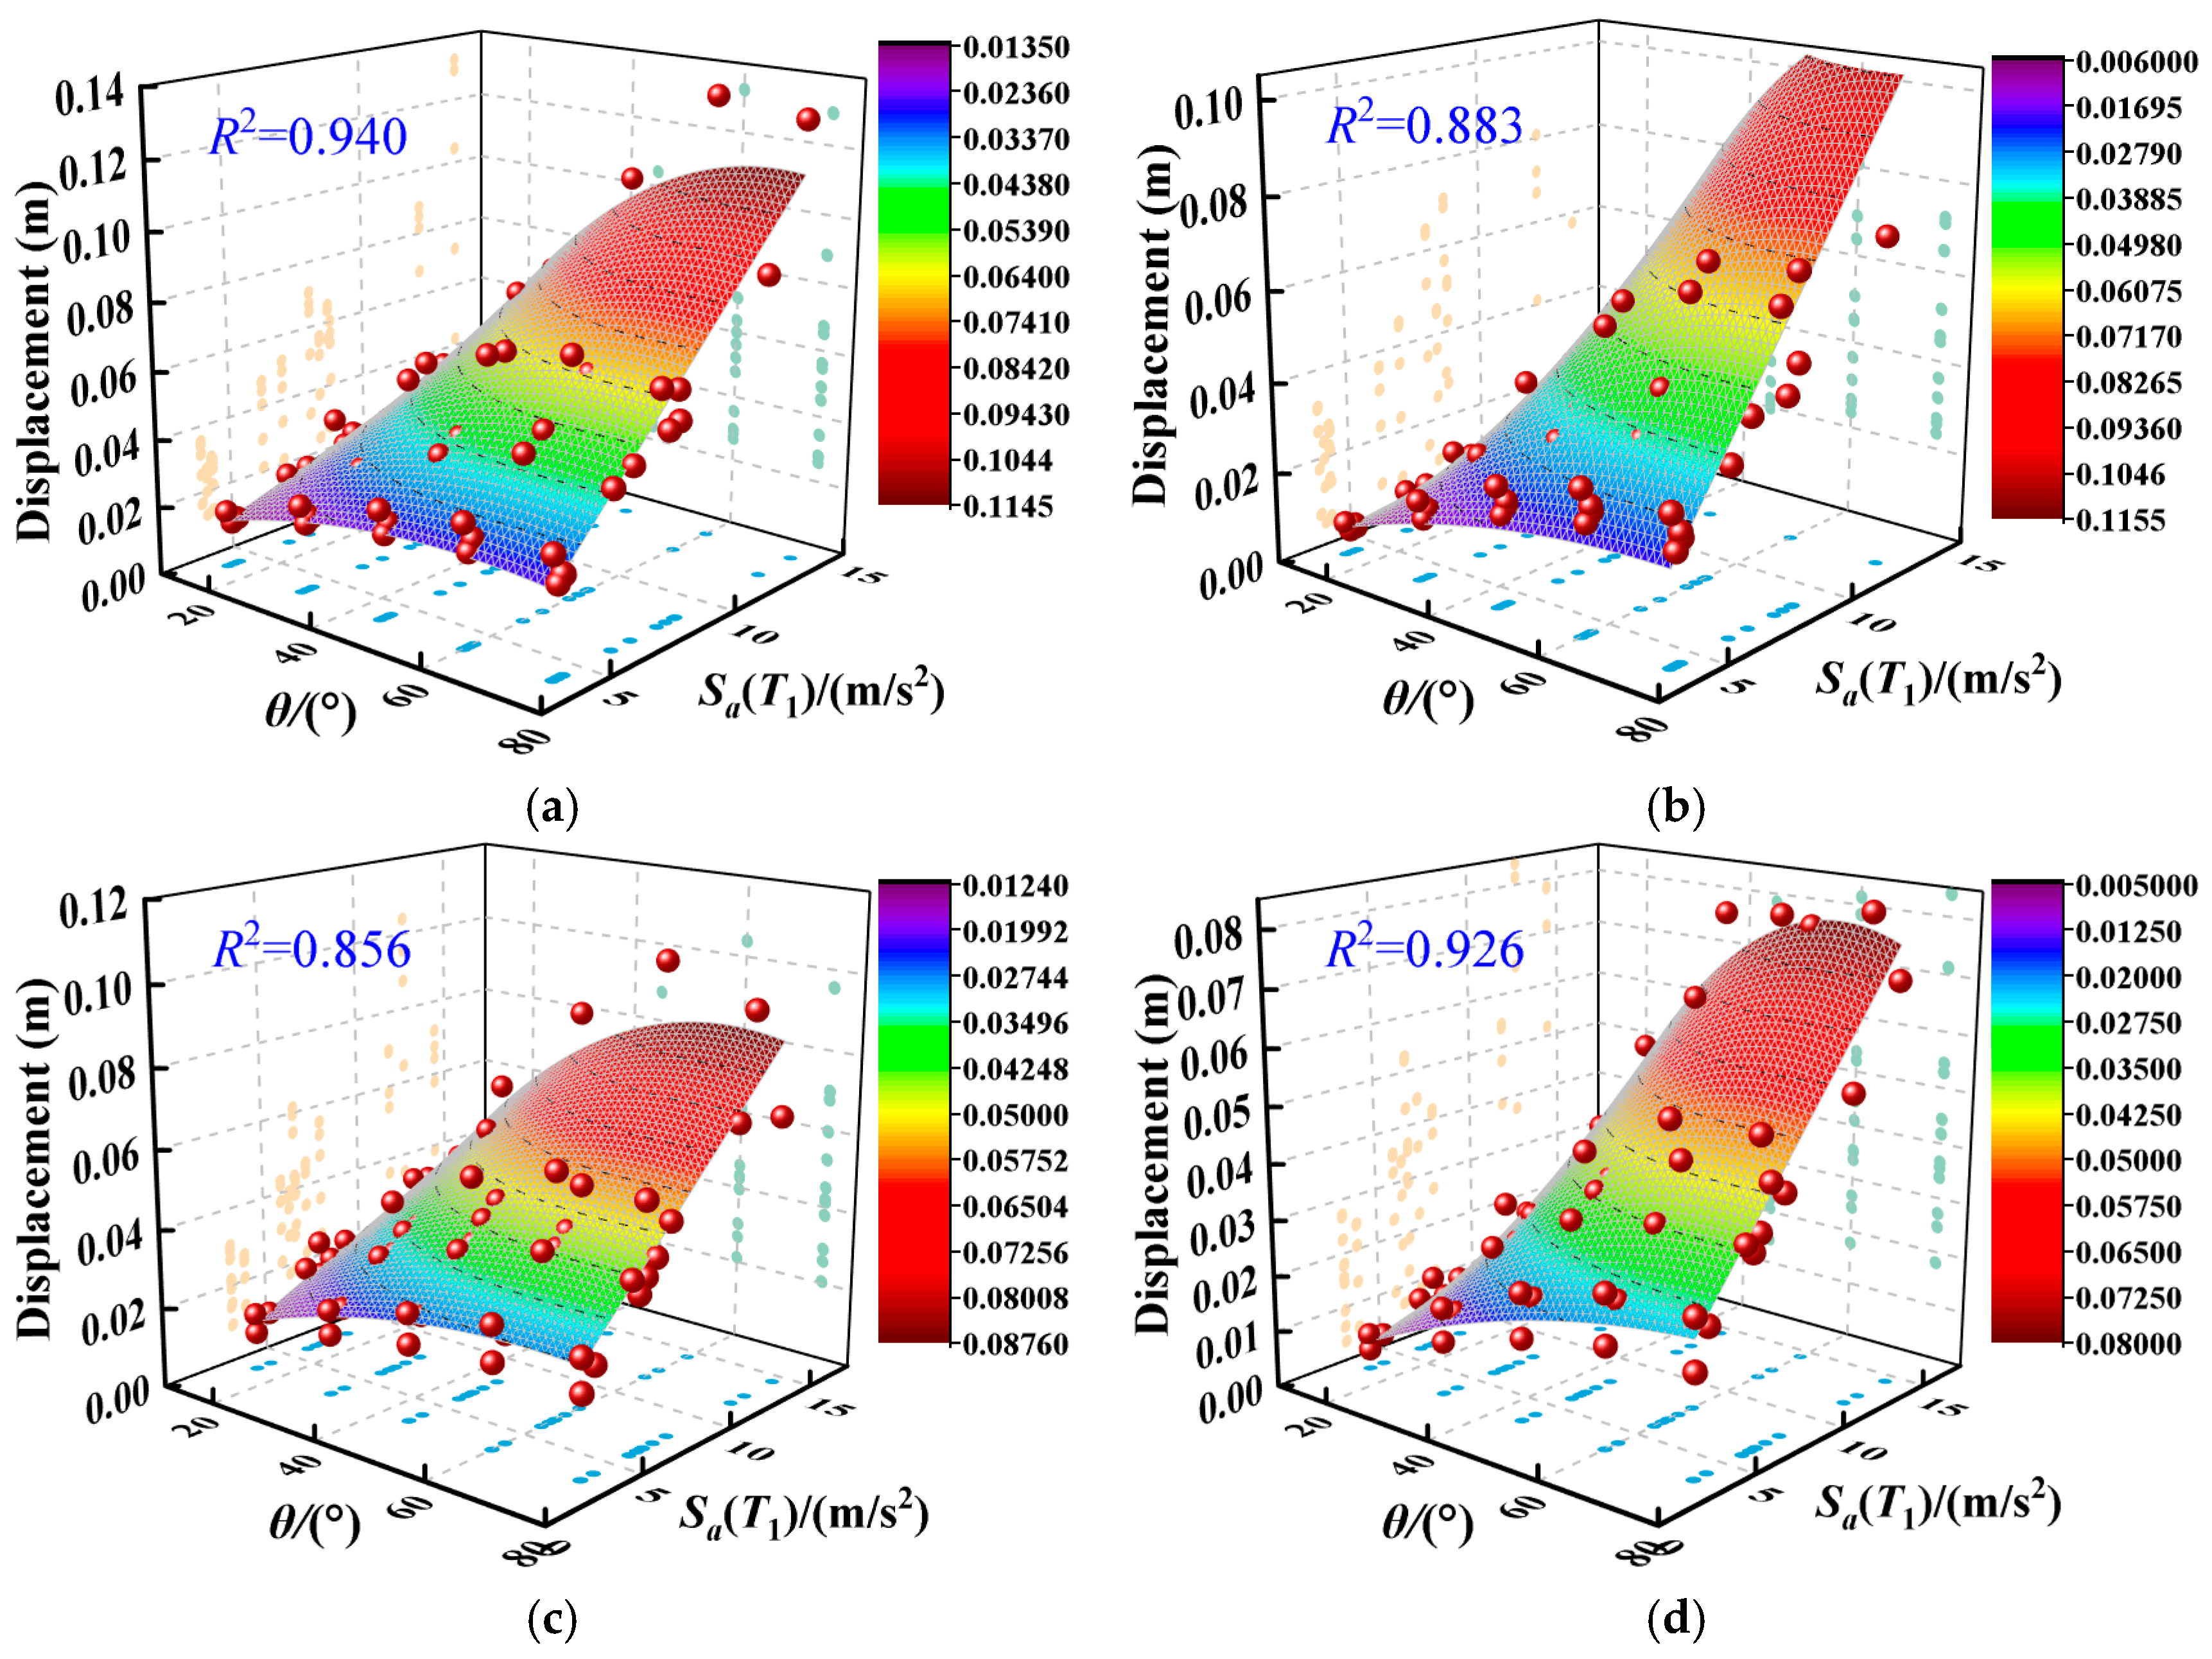
A multivariate nonlinear prediction model was proposed to assess the dynamic response of concrete gravity dams based on the optimal seismic parameter Sa(T1) and incident angle. The 3D prediction surface clearly showed that the response value also increased as the spectral acceleration value increased. The predictive results demonstrated a high level of accuracy compared to the numerical results, allowing for the effective prediction of the seismic demand on concrete gravity dams under arbitrary NF P wave oblique incidence, which is crucial for considering oblique P wave effects in the seismic design and assessment of concrete dams.
In this study, we investigated the seismic dynamic responses of the Koyna concrete gravity dam under obliquely incident NF P waves. It should be noted that the generalizability of the present findings is limited, as they have not yet been extensively validated across the full spectrum of near-fault ground motions or a variety of concrete gravity dam geometries. Further research is required to determine whether the observed response characteristics remain consistent under different seismic inputs and structural configurations. In addition, the impact of other types of seismic waves and seismic motion characteristics on concrete dams should be considered. Further research should explore the influence of obliquely incident SV and P waves on the seismic performance of concrete dams. A broader range of overall and local response indicators should be considered when assessing the seismic resilience of concrete dams. Moving forward, detailed stress analyses will be incorporated to enhance the completeness and practical relevance of the structural dynamic response evaluation. Moreover, the proposed predictive model requires further validation and verification to ensure its applicability across various types of gravity dams.

Author Contributions

S.X. was involved in conceptualization, methodology, investigation, data curation, software, validation, formal analysis, funding acquisition, writing—original draft. J.L. was involved in supervision, funding acquisition, writing—original draft, writing—review and editing. Q.X. was involved in writing—review and editing. All authors have read and agreed to the published version of the manuscript.

Funding

This study was supported by the Science and Technology Innovation Foundation of Dalian (Grant number 2024RQ026), the Open Fund Project of Key Laboratory for Prediction & Control on Complicated Structure System of the Education Department of Liaoning Province (Grant number DLSZD2023[003]), and the Open Fund of State Key Laboratory of Coastal and Offshore Engineering (Grant number LP2414).

Institutional Review Board Statement

Not applicable.

Informed Consent Statement

Not applicable.

Data Availability Statement

The original contributions presented in this study are included in the article; further inquiries can be directed to the corresponding author.

Conflicts of Interest

The authors declare no conflicts of interest.

References

  1. Zhang, S.; Wang, G. Effects of near-fault and far-fault ground motions on nonlinear dynamic response and seismic damage of concrete gravity dams. Soil Dyn. Earthq. Eng. 2013, 53, 217–229. [Google Scholar] [CrossRef]
  2. Sun, B.; Zhang, S.; Deng, M.; Wang, C. Inelastic dynamic response and fragility analysis of arched hydraulic tunnels under as-recorded far-fault and near-fault ground motions. Soil Dyn. Earthq. Eng. 2020, 132, 106070. [Google Scholar] [CrossRef]
  3. Hu, Y.; Jiang, L.; Ye, J.; Zhang, X.; Jiang, L. Seismic responses and damage assessment of a mid-rise cold-formed steel building under far-fault and near-fault ground motions. Thin-Walled Struct. 2021, 163, 107690. [Google Scholar] [CrossRef]
  4. Xu, S.; Liu, J.; Yin, X.; Xu, Q. Seismic performance analysis of concrete dams considering the coupled effects of wavelet asymmetry and incident direction under near-fault ground motions. Eng. Struct. 2025, 327, 119670. [Google Scholar] [CrossRef]
  5. Gorai, S.; Maity, D. Seismic fragility assessment of concrete gravity dams under near source synthetic ground motions. Struct. Infrastruct. Eng. 2023, 21, 281–301. [Google Scholar] [CrossRef]
  6. Bigdeli, A.; Akbari, H.; Alembagheri, M.; Haghgou, H.; Matinfar, M. Influence of near-field ground motions and their equivalent pulses on nonlinear seismic response of intake-outlet towers and predicting based on artificial neural networks. Structures 2023, 52, 1051–1070. [Google Scholar] [CrossRef]
  7. Zhai, Y.; Zhang, L.; Cui, B.; Zhang, H.; Ma, T. Evolution criteria of overall damage of concrete gravity dam body and foundation under near-fault ground motion. Structures 2022, 43, 594–605. [Google Scholar] [CrossRef]
  8. Gorai, S.; Maity, D. Numerical investigation on seismic behaviour of aged concrete gravity dams to near source and far source ground motions. Nat. Hazards 2021, 105, 943–966. [Google Scholar] [CrossRef]
  9. Aghamolaei, M.; Azizkandi, A.S.; Baziar, M.H.; Ghavami, S. Performance-based analysis of cantilever retaining walls subjected to near-fault ground shakings. Comput. Geotech. 2021, 130, 103924. [Google Scholar] [CrossRef]
  10. Sun, B.; Deng, M.; Zhang, S.; Wang, C.; Cui, W.; Du, M.; Lai, Y. The effect of near-fault earthquakes and wavelet-generated artificial near-fault earthquakes on the seismic behavior of rockfill dams. Structures 2023, 58, 105342. [Google Scholar] [CrossRef]
  11. Wu, Q.; Li, D.-Q.; Liu, Y.; Du, W. Seismic performance of earth dams founded on liquefiable soil layer subjected to near-fault pulse-like ground motions. Soil Dyn. Earthq. Eng. 2021, 143, 106623. [Google Scholar] [CrossRef]
  12. Daei, A.; Poursha, M.; Zarrin, M. Seismic performance evaluation of code-compliant RC moment-resisting frame buildings subjected to near-fault pulse-like and non-pulse-like ground motions. J. Earthq. Eng. 2022, 26, 5058–5085. [Google Scholar] [CrossRef]
  13. Loh, C.H.; Wan, S.; Liao, W.I. Effects of hysteretic model on seismic demands: Consideration of near-fault ground motions. Struct. Des. Tall Build. 2002, 11, 155–169. [Google Scholar] [CrossRef]
  14. Mavroeidis, G.P.; Dong, G.; Papageorgiou, A.S. Near-fault ground motions, and the response of elastic and inelastic single-degree-of-freedom (SDOF) systems. Earthq. Eng. Struct. Dyn. 2004, 33, 1023–1049. [Google Scholar] [CrossRef]
  15. Zou, D.; Han, H.; Liu, J.; Yang, D.; Kong, X. Seismic failure analysis for a high concrete face rockfill dam subjected to near-fault pulse-like ground motions. Soil Dyn. Earthq. Eng. 2017, 98, 235–243. [Google Scholar] [CrossRef]
  16. Li, L.-X.; Li, C.; Hao, H. Seismic performance of post-tensioned self-centering concrete frames under near-fault pulse-like ground motions. Eng. Struct. 2023, 277, 115480. [Google Scholar] [CrossRef]
  17. Xu, Q.; Xu, S.; Chen, J.; Li, J. Dimensionless analysis of pulse-like effects on the seismic behavior of a dam based on wavelet-decomposed near-fault ground motions. Structures 2021, 33, 2003–2018. [Google Scholar] [CrossRef]
  18. Yazdani, Y.; Alembagheri, M. Nonlinear seismic response of a gravity dam under near-fault ground motions and equivalent pulses. Soil Dyn. Earthq. Eng. 2017, 92, 621–632. [Google Scholar] [CrossRef]
  19. Mashhadi, S.; Homaei, F.; Asadi, A.; Tajammolian, H. Fragility analysis of steel MRFs: Effects of frequency-content components of near-fault pulse-like ground motions and setbacks. Structures 2021, 33, 3655–3666. [Google Scholar] [CrossRef]
  20. Sun, B.; Deng, M.; Zhang, S.; Cui, W.; Wang, C.; Yu, L.; Cao, K. Inelastic dynamic analysis and damage assessment of a hydraulic arched tunnel under near-fault SV waves with arbitrary incoming angles. Tunnel. Undergr. Space Technol. 2020, 104, 103523. [Google Scholar] [CrossRef]
  21. Chen, D.; Pan, Z.; Zhao, Y. Seismic damage characteristics of high arch dams under oblique incidence of SV waves. Eng. Fail. Anal. 2023, 152, 107445. [Google Scholar] [CrossRef]
  22. Li, C.; Song, Z.; Wang, F.; Liu, Y. Analysis of the seismic response and failure evaluation of the slabs of asphalt concrete-faced rockfill dams under SV-Waves with arbitrary angles. Comput. Geotech. 2024, 168, 106125. [Google Scholar] [CrossRef]
  23. Zhang, T.; Xu, Q.; Chen, J.; Wang, Y.; Li, J. Analysis framework for the seismic performance of a concrete high-arch dam considering the incident direction and oblique incident angle of near-fault SV-waves. Soil Dyn. Earthq. Eng. 2023, 173, 108119. [Google Scholar] [CrossRef]
  24. Zhang, J.; Li, M.; Han, S. Seismic analysis of gravity dam–layered foundation system subjected to earthquakes with arbitrary incident angles. Int. J. Geomech. 2022, 22, 04021279. [Google Scholar] [CrossRef]
  25. Wang, X.; Chen, J.; Xiao, M. Seismic responses of an underground powerhouse structure subjected to oblique incidence SV and P waves. Soil Dyn. Earthq. Eng. 2019, 119, 130–143. [Google Scholar] [CrossRef]
  26. Bi, Z.; Zhang, L.; He, X.; Zhai, Y. Effect of oblique incidence angle and frequency content of P and SV waves on the dynamic behavior of liquid tanks. Soil Dyn. Earthq. Eng. 2023, 171, 107929. [Google Scholar] [CrossRef]
  27. Xu, S.; Xu, Q.; Chen, J.; Li, J. Seismic performance analysis of gravity dam system under arbitrary oblique incidence of near-fault SV ground motions. Int. J. Geomech. 2022, 22, 04022240. [Google Scholar] [CrossRef]
  28. Sun, B.; Zhang, S.; Cui, W.; Deng, M.; Wang, C. Nonlinear dynamic response and damage analysis of hydraulic arched tunnels subjected to P waves with arbitrary incoming angles. Comput. Geotech. 2020, 118, 103358. [Google Scholar] [CrossRef]
  29. Zhu, J.; Li, X.; Liang, J.; Kontoe, S.; He, Q.; Chen, S. Effects of pulse-like ground motions on tunnels in saturated poroelastic soil for obliquely incident seismic waves. Soil Dyn. Earthq. Eng. 2023, 173, 108100. [Google Scholar] [CrossRef]
  30. Song, Z.; Wang, F.; Li, Y.; Liu, Y. Nonlinear seismic responses of the powerhouse of a hydropower station under near-fault plane P-wave oblique incidence. Eng. Struct. 2019, 199, 109613. [Google Scholar] [CrossRef]
  31. Wang, M.; Chi, S. Dynamic response analysis of high earth-rockfill dam subjected to P wave with arbitrary incoming angles. Soil Dyn. Earthq. Eng. 2022, 157, 107260. [Google Scholar] [CrossRef]
  32. Liu, J.B.; Du, Y.X.; Du, X.L.; Wang, Z.Y.; Wu, J. 3D viscous-spring artificial boundary in time domain. Earthq. Eng. Struct. Dyn. 2006, 5, 93–102. [Google Scholar] [CrossRef]
  33. Pan, J. Seismic damage behavior of gravity dams under the effect of concrete inhomogeneity. J. Earthq. Eng. 2021, 25, 1438–1458. [Google Scholar] [CrossRef]
  34. Chen, D.; Hou, C.; Wang, F. Influences on the seismic response of the gravity dam-foundation-reservoir system with different boundary and input models. Shock Vibrat. 2021, 2021, 6660145. [Google Scholar] [CrossRef]
  35. Wang, J.T.; Zhang, M.X.; Jin, A.Y.; Zhang, C.H. Seismic fragility of arch dams based on damage analysis. Soil Dyn. Earthq. Eng. 2018, 109, 58–68. [Google Scholar] [CrossRef]
  36. Huang, J.Q.; Du, X.L.; Jin, L.; Zhao, M. Impact of incident angles of P waves on the dynamic responses of long lined tunnels. Earthq. Eng. Struct. Dyn. 2016, 45, 2435–2454. [Google Scholar] [CrossRef]
  37. Xu, S.; Xu, Q.; Chen, J.; Li, J. Improved endurance time analysis for seismic responses of concrete dam under near-fault pulse-like ground motions. Eng. Struct. 2022, 270, 114912. [Google Scholar] [CrossRef]
  38. Lee, J.; Fenves, G.L. Plastic-damage model for cyclic loading of concrete structures. J. Eng. Mech. 1998, 124, 892–900. [Google Scholar] [CrossRef]
  39. Lee, J.; Fenves, G.L. A plastic-damage concrete model for earthquake analysis of dams. Earthq. Eng. Struct. Dyn. 1998, 27, 937–956. [Google Scholar] [CrossRef]
  40. Wang, J.; Jin, A.; Du, X.; Wu, M. Scatter of dynamic response and damage of an arch dam subjected to artificial earthquake accelerograms. Soil Dyn. Earthq. Eng. 2016, 87, 93–100. [Google Scholar] [CrossRef]
  41. Calayir, Y.; Karaton, M. A continuum damage concrete model for earthquake analysis of concrete gravity dam-reservoir systems. Soil Dyn. Earthq. Eng. 2005, 25, 857–869. [Google Scholar] [CrossRef]
  42. Alembagheri, M.; Ghaemian, M. Damage assessment of a concrete arch dam through nonlinear incremental dynamic analysis. Soil Dyn. Earthq. Eng. 2013, 44, 127–137. [Google Scholar] [CrossRef]
  43. Wang, G.; Wang, Y.; Lu, W.; Yan, P.; Chen, M. Earthquake direction effects on seismic performance of concrete gravity dams to mainshock–aftershock sequences. J. Earthq. Eng. 2018, 24, 1134–1155. [Google Scholar] [CrossRef]
  44. Hariri-Ardebili, M.A.; Seyedkolbadi, S.M.; Kianoush, M.R. FEM-based parametric analysis of a typical gravity dam considering input excitation mechanism. Soil Dyn. Earthq. Eng. 2016, 84, 22–43. [Google Scholar] [CrossRef]
  45. Yazdani, Y.; Alembagheri, M. Seismic vulnerability of gravity dams in near-fault areas. Soil Dyn. Earthq. Eng. 2017, 102, 15–24. [Google Scholar] [CrossRef]
  46. Wang, G.; Wang, Y.; Lu, W.; Yan, P.; Zhou, W.; Chen, M. A general definition of integrated strong motion duration and its effect on seismic demands of concrete gravity dams. Eng. Struct. 2016, 125, 481–493. [Google Scholar] [CrossRef]
  47. Zhou, C.-G.; Zou, D.-G.; Yu, X. Influence of seismic wave type and incident direction on the dynamic response of tall concrete-faced rockfill dams. Earthq. Sci. 2022, 35, 343–354. [Google Scholar] [CrossRef]
  48. Mavroeidis, G.P.; Papageorgiou, A.S. A mathematical representation of near-fault ground motions. Bull. Seismol. Soc. Amer. 2003, 93, 1099–1131. [Google Scholar] [CrossRef]
  49. Bray, J.D.; Rodriguezmarek, A. Characterization of forward-directivity ground motions in the near-fault region. Soil Dyn. Earthq. Eng. 2004, 24, 815–828. [Google Scholar] [CrossRef]
  50. PEER. Pacific Earthquake Engineering Research Center, PEER Strong Motion Database; University of California: Berkeley, CA, USA. Available online: http://ngawest2.berkeley.edu (accessed on 15 June 2025).
  51. Shahi, S.K.; Baker, J.W. An efficient algorithm to identify strong-velocity pulses in multicomponent ground motions. Bull. Seismol. Soc. Amer. 2014, 104, 2456–2466. [Google Scholar] [CrossRef]
  52. Baker, J.W. Quantitative classification of near-fault ground motions using wavelet analysis. Bull. Seismol. Soc. Am. 2007, 97, 1486–1501. [Google Scholar] [CrossRef]
Figure 1. Main flowchart of this study.
Applsci 15 06853 g001
Figure 2. Schematic of oblique P wave in semi-infinite medium.
Applsci 15 06853 g002
Figure 3. Finite element model in the free-field and input displacement time history of the model base: (a) model; (b) input displacement time history.
Applsci 15 06853 g003
Figure 4. Comparison between the numerical and theoretical solutions at four incident angles: (a) 0°; (b) 15°; (c) 30°; (d) 65°.
Applsci 15 06853 g004
Figure 5. Illustration of the CDP model.
Applsci 15 06853 g005
Figure 6. Finite element model of concrete gravity dam system.
Applsci 15 06853 g006
Figure 7. PL motion and decomposed NP component for one selected earthquake: (a) acceleration time history; (b) velocity time history.
Applsci 15 06853 g007
Figure 8. Mean value of damage response under NF motion with oblique P waves: (a) 0.3 g; (b) 0.6 g.
Applsci 15 06853 g008
Figure 9. Damage profile of the concrete dam under NF motion with oblique P waves.
Applsci 15 06853 g009
Figure 10. Mean value of displacement response under NF motion with oblique P waves: (a) 0.3 g; (b) 0.6 g.
Applsci 15 06853 g010
Figure 11. Responses ratio for different seismic oblique incidences: (a) DVR response ratio; (b) displacement response ratio.
Applsci 15 06853 g011
Figure 12. Difference in dynamic response for different seismic cases: (a) difference in DVR response; (b) difference in displacement response.
Applsci 15 06853 g012
Figure 13. Relationship between the seismic parameters (related to the peak value and duration) and dam dynamic responses: (a) PGA; (b) PGV; (c) PGV/PGA; (d) T90; (e) Ic; (f) Tp.
Applsci 15 06853 g013
Figure 14. Relationship between the seismic parameters (related to acceleration and velocity time history) and dam dynamic responses: (a) Arms; (b) AI; (c) CAV; (d) ASI; (e) Sa(T1); (f) Vrms; (g) SED; (h) HI; (i) VSI.
Applsci 15 06853 g014
Figure 15. Fitting line of the spectral acceleration and DVR under NF motion with varying incident angles and directions: (a) 15°; (b) 30°; (c) 45°; (d) 60°; (e) 75°; (f) The variation trend of the fitting slope.
Applsci 15 06853 g015
Figure 16. Fitting line of spectral acceleration and displacement under NF motion with varying incident angles and directions: (a) 15°; (b) 30°; (c) 45°; (d) 60°; (e) 75°; (f) The variation trend of the fitting slope.
Applsci 15 06853 g016
Figure 17. Three-dimensionally fitted surfaces of the DVR response by incident angle and seismic parameter for four seismic conditions: (a) NF pulse-like motion with positive direction; (b) NF pulse-like motion with negative direction; (c) NF non-pulse motion with positive direction; (d) NF non-pulse motion with negative direction.
Applsci 15 06853 g017
Figure 18. Three-dimensionally fitted surfaces of the displacement response by incident angle and seismic parameter for four seismic conditions: (a) NF pulse-like motion with positive direction; (b) NF pulse-like motion with negative direction; (c) NF non-pulse motion with positive direction; (d) NF non-pulse motion with negative direction.
Applsci 15 06853 g018
Table 1. Material properties of concrete gravity dam system.
Material ParametersElastic Modulus (GPa)Bulk Modulus (GPa)Density (kg/m3)Poisson’s Ratio
Concrete31-26430.2
Foundation rock21.6-20000.2
Reservoir water-2.071000-
Table 2. Fitted coefficients in the 3D prediction model.
5DVR ResponseDisplacement Response
Coefficientsabcdefabcdef
PL (+)−3.46 × 10−65.32 × 10−4−0.00641.30 × 10−5−0.0020.022−1.71 × 10−62.56 × 10−4−5.50 × 10−45.49 × 10−7−2.74 × 10−40.00619
PL (−)−3.74 × 10−72.20 × 10−4−0.003693.50 × 10−6−0.00110.0177−2.54 × 10−63.73 × 10−4−0.00415.92 × 10−6−8.71 × 10−40.0142
NP (+)−4.07 × 10−65.34 × 10−4−0.005691.65 × 10−5−0.00210.0195−1.14 × 10−61.50 × 10−45.12 × 10⁻⁴−1.72 × 10−62.40 × 10−40.00107
NP (−)−3.47 × 10−71.80 × 10−4−0.003042.95 × 10−6−8.35 × 10−40.0134−1.90 × 10−62.34 × 10−4−0.00202.43 × 10−6−1.15 × 10−40.00254
Note: (+) and (−) denote positive and negative incident directions, respectively.
Disclaimer/Publisher’s Note: The statements, opinions and data contained in all publications are solely those of the individual author(s) and contributor(s) and not of MDPI and/or the editor(s). MDPI and/or the editor(s) disclaim responsibility for any injury to people or property resulting from any ideas, methods, instructions or products referred to in the content.

