Article

Vibration Localization in Cyclic Mistuned Structure and Its Application to Low-Frequency Broadband Vibration Control of Pipelines

1
Institute of Noise and Vibration, Naval University of Engineering, Wuhan 430033, China
2
Marine Design and Research Institute of China, Shanghai 200011, China
*
Author to whom correspondence should be addressed.
Appl. Sci. 2025, 15(12), 6852; https://doi.org/10.3390/app15126852
Submission received: 28 May 2025 / Revised: 13 June 2025 / Accepted: 15 June 2025 / Published: 18 June 2025

Abstract

:
This paper proposes a pipeline vibration control method based on the vibration localization energy dissipation principle of cyclic mistuned structure (CMS). The influence of the frequency mistuning strength and coupling strength of the resonant units on vibration localization characteristics is studied using perturbation analysis. Subsequently, numerical simulations are conducted to verify the theoretical results. Theoretical and numerical results indicate that setting an appropriate mistuning strength and minimizing the coupling strength are conducive to achieving broadband vibration reduction. On this basis, a pipeline-oriented CMS is proposed. It achieves low-frequency broadband vibration control of pipelines by regulating the frequency mistuning strength of the resonant units located in the annular hierarchical honeycomb structure. Finally, tests are conducted to verify the vibration reduction performance of the CMS. Following the installation of the CMS, the frequency response function (FRF) amplitude of the pipeline steadily decreases over a wide frequency band. The excitation test results indicate that the CMS reduced the acceleration amplitude of the pipeline by 34.7 dB at 82.5 Hz, 16.0 dB at 90 Hz, and 19.8 dB in the broadband vibration level between 70 Hz and 120 Hz.

1. Introduction

Pipelines play a crucial role in various fields, including marine engineering, mechanical engineering, civil engineering, aerospace, and petrochemicals [1,2]. They are frequently utilized to transport fluids such as lubricating oil, high-pressure steam, or seawater. The coupled effects of external excitations and internal fluid flow induce complex, low-frequency vibration characteristics in pipelines. Excessive pipeline vibrations may lead to machine shutdown, fatigue failure, fluid leakage, and even catastrophic explosion [3,4].
Traditional approaches such as elastic supports [5], dampers [6,7,8], and constrained damping materials [9] demonstrate satisfactory high-frequency vibration suppression, but their effectiveness diminishes significantly at lower frequencies. Active control is a common low-frequency vibration reduction technology. Blocka et al. [10] installed two electromagnetic active absorbers on a pipeline that use inertial mass reciprocating motion to obtain control force and can control the multi-directional vibration line spectrum of the pipeline. Zhang et al. [11] explored the application of macro-fiber composites (MFCs) in the active control of pipelines. The design methods of Linear-Quadratic Regulator (LQR) controller and Proportional Integral Derivative (PID) controller were introduced, respectively, and the experiments were carried out to verify the effectiveness of the active control. Zhang et al. [12] proposed a PI-LQR active controller by integrating the PID and LQR active control methods. Compared with the classical proportional control method, the PI-LQR active controller could reduce the pipeline vibration by 0.29 dB on average and 2.00 dB at maximum.
Compared with active control, passive control offers the advantages of low cost and simple structure. A dynamic vibration absorber (DVA) can control the vibration line spectrum at a specific frequency, but it struggles to adapt to frequency shifts. By installing multiple absorbers on the structure to form multiple dynamic vibration absorbers (MDVAs), the vibration reduction frequency band can be effectively broadened. Yang et al. [13] used an optimization program to calculate the optimal design variables of each vibration absorber in the MDVA, achieving satisfactory control of the multi-order vibration line spectrum of the pipeline. Kwag et al. [14] presented a method for the optimal design of the MDVA based on frequency response function (FRF) analysis, which can better reflect the modal coupling effect between the absorber and the pipeline when designing the absorber parameters. Compared with commonly used optimization methods, the newly proposed method can further enhance the vibration reduction effect of the MDVA. However, existing MDVAs typically feature large-sized and heavy absorbers, which restricts the installation of sufficient absorbers in the limited space of the pipeline. Meanwhile, mutual interference between absorbers may also lead to overall vibration reduction performance being lower than expected [15]. Therefore, it is necessary to design MDVAs with higher integration and optimize the parameters of each vibration absorber, placing high demands on the structural design and parameter control of MDVAs.
Metamaterials are artificial periodic composite structures capable of modifying the propagation properties of elastic waves in a medium and controlling elastic wave transmission [16,17,18,19,20]. It is widely acknowledged that there are two fundamental bandgap formation mechanisms for metamaterials, i.e., Bragg scattering and localized resonance. Among them, metamaterials based on the local resonance mechanism are more likely to generate low-frequency bandgaps [21]. Nateghi et al. [22] periodically arranged the resonant units in both the axial and circumferential directions of the pipeline, resulting in a significant bandgap effect and a substantial reduction in pipeline vibration within the bandgap. To broaden the bandgap of the local resonance metamaterial, Wen et al. [23] designed a beam-sheet resonant unit based on the configuration of a cantilever beam absorber. By flexibly designing the beam parameters, the local resonant beam can achieve the widest possible Bragg band gap and local resonant band gap, with the two types of bandgaps being close to each other to form a coupled ultra-wide bandgap. Yao et al. [24] proposed a theoretical model for studying the propagation of bending waves in locally resonant cylindrical shells. The periodic gradient array technology was employed to effectively splice the bandgap of each resonant unit, thereby expanding the bandgap range.
When mistuning occurs in the periodic structural parameters, vibration localization arises under certain conditions. During this time, the vibration wave propagates more readily in the local region and less readily in other parts [25,26]. Corral et al. [27] suppressed blade chattering by artificially attaching small masses to the tip of the blade disk. Bai et al. [28] intentionally introduced mistuning to the blade disk to reduce the vibration problem due to machining errors and wear, which effectively enhanced the stability of the disk and reduced the output response. Some scholars consider the periodically mistuned structures as a type of mistuned metamaterials [29]. Zhao et al. [30] proposed a metamaterial plate that integrates mistuned T-type resonators and investigated the effects of mistuning parameters on the mode localization of the T-type resonators. The research findings indicate that by designing appropriate mistuning parameters, the metamaterial plate can generate coupled wide bandgaps and double bandgaps, which is beneficial for broadband and multi-frequency vibration control of engineering structures.
The excellent low-frequency broadband vibration reduction performance of the periodic mistuned structure demonstrates its potential application value in pipeline vibration control. The introduction of mistuned parameters produces a vibration localization effect, resulting in mode localization and eigenvalue splitting of the structure. Mode localization causes vibrations to protrude in certain resonant units, thus confining energy within these units and facilitating its dissipation, which is essentially similar to the mechanism of action of DVAs. Eigenvalue splitting leads to a broadband continuous distribution of resonant frequencies, effectively expanding the vibration reduction frequency band. A cyclic structure is a special form of periodic structure. A cyclic mistuned structure (CMS) is formed by periodically installing resonant units in the circumferential direction of the pipeline with the aim to improve space utilization efficiency.
This paper analyzes the influence of the frequency mistuning strength and coupling strength of the resonant units on the vibration localization characteristics of the CMS. Based on this, a pipeline-oriented CMS is proposed, which can achieve low-frequency broadband vibration control of pipelines by adjusting the frequency mistuning strength of the resonant units within the structure. The organization of each section is as follows: Section 2 derives the expressions for the eigenvectors and eigenvalues of the CMS using the parameter perturbation method. Section 3 investigates the parameter effects of mode localization and eigenvalue splitting of the CMS based on the theoretical model, then summarizes the effects of the frequency mistuning strength and coupling strength of the resonant units on the vibration reduction performance of the CMS. Section 4 establishes a numerical model to validate the parameter effects on the vibration localization characteristics. Section 5 proposes a pipeline-oriented CMS, and then conducts the FRF test and excitation test of the pipeline to verify its low-frequency broadband vibration reduction capability. Some conclusions are given in Section 6.

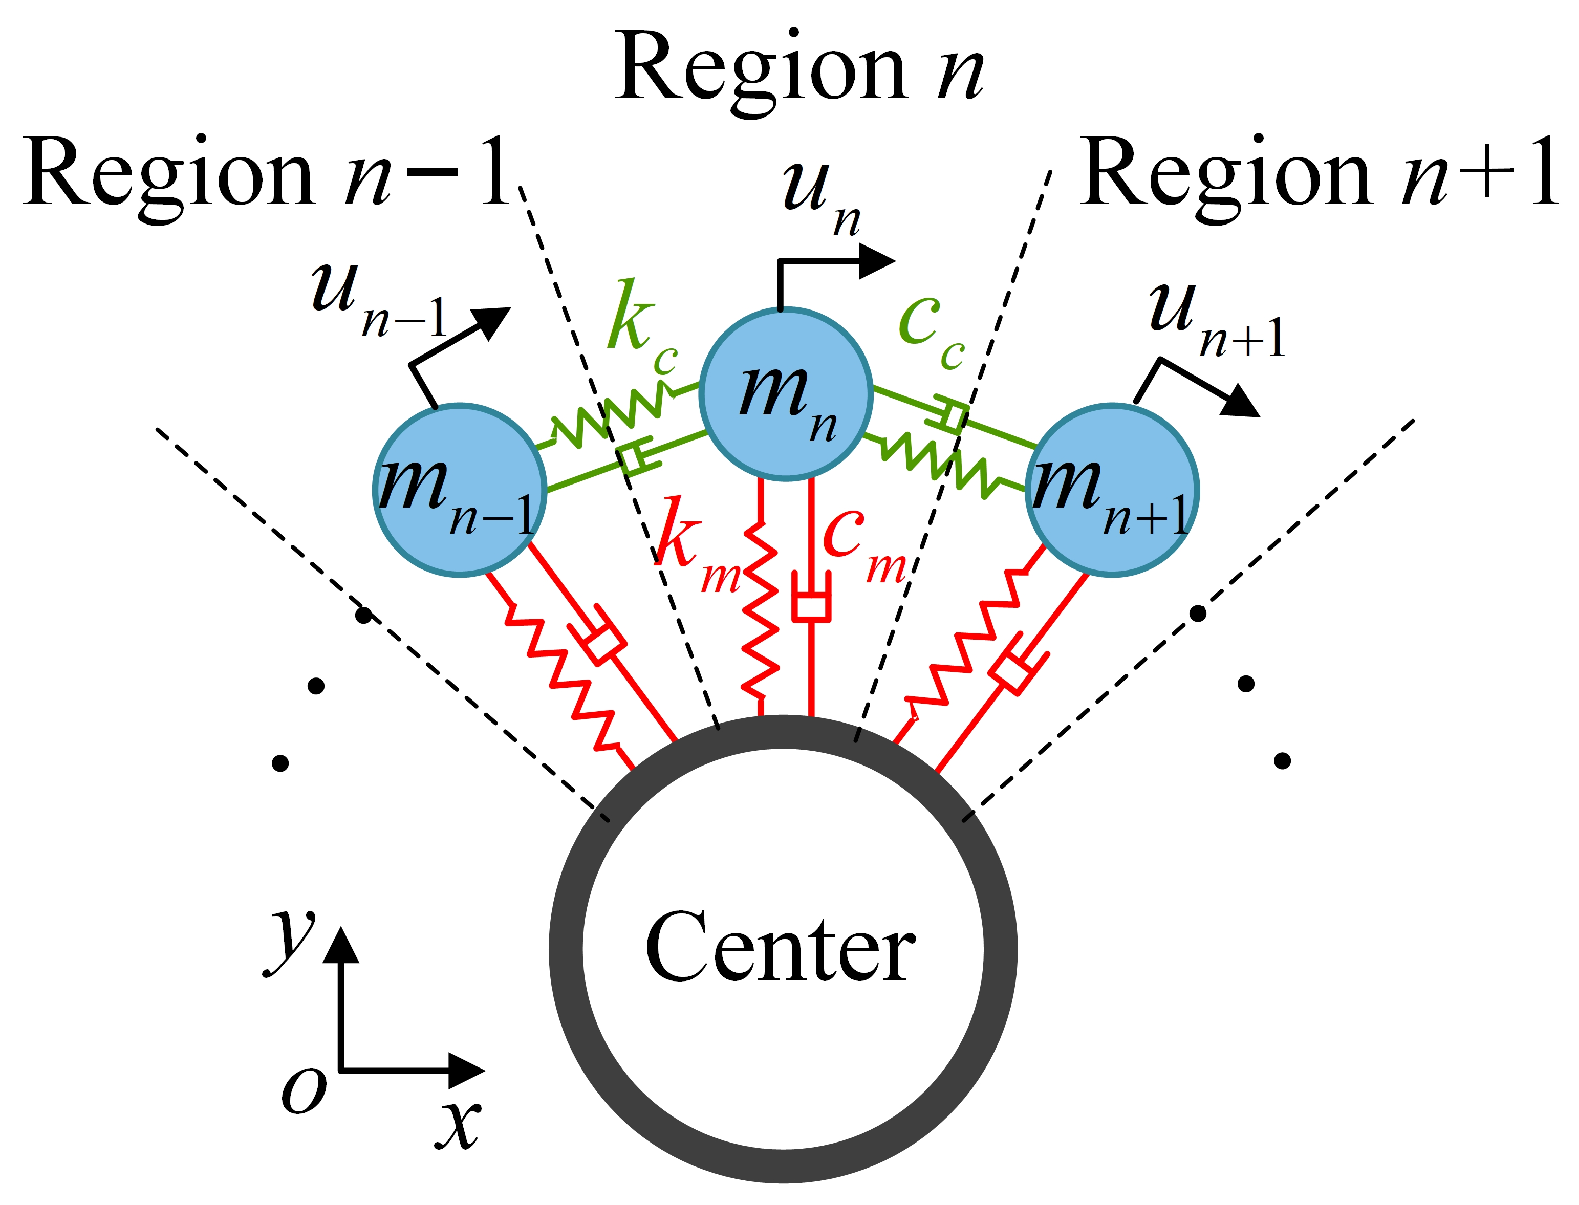
2. Perturbation Analysis of the CMS

A spring-oscillators model with a cyclic distribution is established. The oscillators are connected to the center ring through main springs, and coupling springs are set up between adjacent oscillators, as illustrated in Figure 1. Assuming that the oscillator moves solely in one direction within the x-o-y plane, the model can be regarded as a single-degree-of-freedom model. When multiple degrees of freedom are considered, it can be further extended based on the single-degree-of-freedom model [31].
Assuming that the direction of the main spring stiffness and damping is perpendicular to the spring tension direction, let  k m  and  c m  be the stiffness and damping coefficient of the main spring, respectively. The direction of the coupling spring stiffness and damping is along the spring tension direction, let  k c  and  c c  be the stiffness and damping coefficient of the coupling spring, respectively. Let N be the total number of the resonant units and n be the serial number of the resonant units, with n = 1, 2, 3, …, N. Let the displacement of the n-th resonant unit be  u n . For the periodic cyclic structure, there are  u 0 u N  and  u N + 1 u 1 . Define  ω m n = k m / m n  and  ω c n = k c / m n  as the main frequency and the coupled frequency of the n-th resonant unit when the structure is mistuned, respectively, where  m n  is the mass of the n-th resonant unit. Define  ω m = k m / m ¯  and  ω c = k c / m ¯  as the standard main frequency and standard coupled frequency of the n-th resonant unit when the structure is tuned, respectively, where  m ¯  is the average mass of all resonant units. The main frequency mistuning can be defined as  Δ f m n = ω m n 2 ω m 2 / ω m 2 ; the coupled frequency mistuning can be defined as  Δ f c n = ω c n 2 ω c 2 / ω c 2 ; the coupling strength can be defined as  R 2 = ω c 2 / ω m 2 .
The frequency mistuning strength can be calculated as follows:
ε = 1 N 1 n = 1 N Δ f n Δ f ¯ 2
where  Δ f ¯ = n = 1 N Δ f n / N  is the average frequency mistuning.
The model is partitioned into distinct regions according to different spring oscillators, and the n-th region is analyzed. The motion state and coupling relationship of the resonant unit are simplified, so the motion differential equation for the n-th resonant unit can be approximately formulated as [31]:
m n u ¨ n + k m u n + k c 2 u n u n 1 u n + 1 + c m u ˙ n + c c 2 u ˙ n u ˙ n 1 u ˙ n + 1 = 0
Assuming the oscillators undergo simple harmonic motion with an angular frequency  ω , when the structure is undamped, Equation (2) can be rewritten as follows:
ω 2 U n + ω m n 2 U n + 2 ω c n 2 U n ω c n 2 U n 1 ω c n 2 U n + 1 = 0
where  U n  is the complex amplitude of the n-th resonant unit.
Equation (3) is rewritten as
1 + Δ f m n + 2 1 + Δ f c n R 2 λ U n 1 + Δ f c n R 2 U n 1 1 + Δ f c n R 2 U n + 1 = 0
Simplify Equation (4) as
A λ I U = 0
where  λ = ω 2 / ω m 2 , I is the unit matrix,  U  is the displacement vector, and the expression for matrix A is given by
A = A 11 1 + Δ f c 1 R 2 0 1 + Δ f c 1 R 2 1 + Δ f c 2 R 2 A 22 1 + Δ f c 2 R 2 0 1 + Δ f c N R 2 0 1 + Δ f c N R 2 A N N
where  A n n = 1 + Δ f m n + 2 1 + Δ f c n R 2   n = 1 ,   2 ,   ,   N  is the element on the main diagonal.
When the structure is mistuned, the matrix A is decomposed into a base system matrix  A 0  and a perturbation matrix  Δ A 1 :
A = A 0 + Δ A 1
For a weakly coupled structure (where the coupling strength is less than the mistuning strength), the components associated with the coupling strength are considered as small perturbations. Consequently, each matrix in Equation (7) can be individually expressed as follows:
A 0 = 1 + Δ f m 1 0 0 0 1 + Δ f m 2 0 0 0 1 + Δ f m N
Δ A 1 = 2 1 + Δ f c 1 R 2 1 + Δ f c 1 R 2 0 1 + Δ f c 1 R 2 1 + Δ f c 2 R 2 2 1 + Δ f c 2 R 2 1 + Δ f c 2 R 2 0 1 + Δ f c N R 2 0 1 + Δ f c N R 2 2 1 + Δ f c N R 2
When the structure is tuned ( Δ f m n = Δ f c n = 0 ), the eigenvectors are expressed as follows [32]:
U n c = 1 ,   cos α n ,   ,   cos N 1 α n t ,   n = 1 ,   2 ,   ,   N 2 + 1 U n s = 0 ,   sin α n ,   ,   sin N 1 α n t ,   n = 2 ,   3 ,   ,   N 2
where  α k = 2 π k 1 / N .
The eigenvalues are
λ n = 1 + 2 R 2 1 cos 2 π n 1 N   ,   n = 1 ,   2 ,   ,   N 2 + 1
When N is an even number, except for the cases where n = 1 or n N / 2 + 1 , double eigenvalues occur; when N is an odd number, the range of n extends to  N + 1 / 2 , and there is only one simple eigenvalue for n = 1.
Representing the eigenvectors as unperturbed eigenvectors and multi-order perturbed eigenvectors,
U n = δ 0 U n + δ 1 U n + δ 2 U n
Similarly, the expression for the eigenvalues can be expressed as
λ n = δ 0 λ n + δ 1 λ n + δ 2 λ n
When there is an absence of coupling between the resonant units, the unperturbed eigenvectors and eigenvalues in Equations (12) and (13) are as follows:
δ 0 U n = 0 ,   ,   1 n t h ,   ,   0 t ,   n = 1 ,   2 ,   ,   N
δ 0 λ n = 1 + Δ f m n ,   n = 1 ,   2 ,   ,   N
The first-order perturbation eigenvectors and eigenvalues can be derived as follows [31,33]:
δ 1 U n n 1 = 1 + Δ f c n 1 R 2 δ 0 λ n δ 0 λ n 1 ,   n = 2 ,   ,   N δ 1 U n n + 1 = 1 + Δ f c n + 1 R 2 δ 0 λ n δ 0 λ n + 1 ,   n = 1 ,   ,   N 1 δ 1 U n other = 0
δ 1 λ n = 2 1 + Δ f c n R 2
It is crucial to note that certain eigenvectors need to be transformed according to the periodic cyclic condition. For instance,  δ 1 U 1 0 = 1 + Δ f c N R 2 δ 0 λ 1 δ 0 λ N  and  δ 1 U N N + 1 = 1 + Δ f c 1 R 2 δ 0 λ N δ 0 λ 1 .
Similarly, the second-order perturbation eigenvectors and eigenvalues can be derived as follows [31,33]:
δ 2 U n n 2 = 1 + Δ f c n 2 2 R 4 δ 0 λ n δ 0 λ n 1 δ 0 λ n δ 0 λ n 2 , n = 3 ,   ,   N   δ 2 U n n 1 = 0 , n = 2 ,   ,   N   δ 2 U n n = 1 + Δ f c n 2 R 4 2 1 δ 0 λ n δ 0 λ n 1 2 + 1 δ 0 λ n δ 0 λ n + 1 2 , n = 1 ,   ,   N δ 2 U n n + 1 = 0 , n = 1 ,   ,   N 1 δ 2 U n n + 2 = 1 + Δ f c n + 2 2 R 4 δ 0 λ n δ 0 λ n + 1 δ 0 λ n δ 0 λ n + 2 , n = 1 ,   ,   N 2 δ 2 U n other = 0  
δ 2 λ n = 1 + Δ f c n 2 R 4 1 δ 0 λ n δ 0 λ n 1 + 1 δ 0 λ n δ 0 λ n + 1
In general, higher-order perturbation analysis provides greater accuracy but also leads to an increased computational burden. For the problem of strong vibration localization analyzed in our study, the second-order perturbation method is deemed sufficient, and thus it is employed.

3. Vibration Localization Characteristics and Their Influence Factors

The frequency mistuning strength and coupling strength of the resonant units significantly influence the vibration localization characteristics of the CMS. Analyzing the effects of different mistuning and coupling strengths on mode localization and eigenvalue splitting can provide theoretical guidance for the parameter design of the pipeline-oriented CMS.

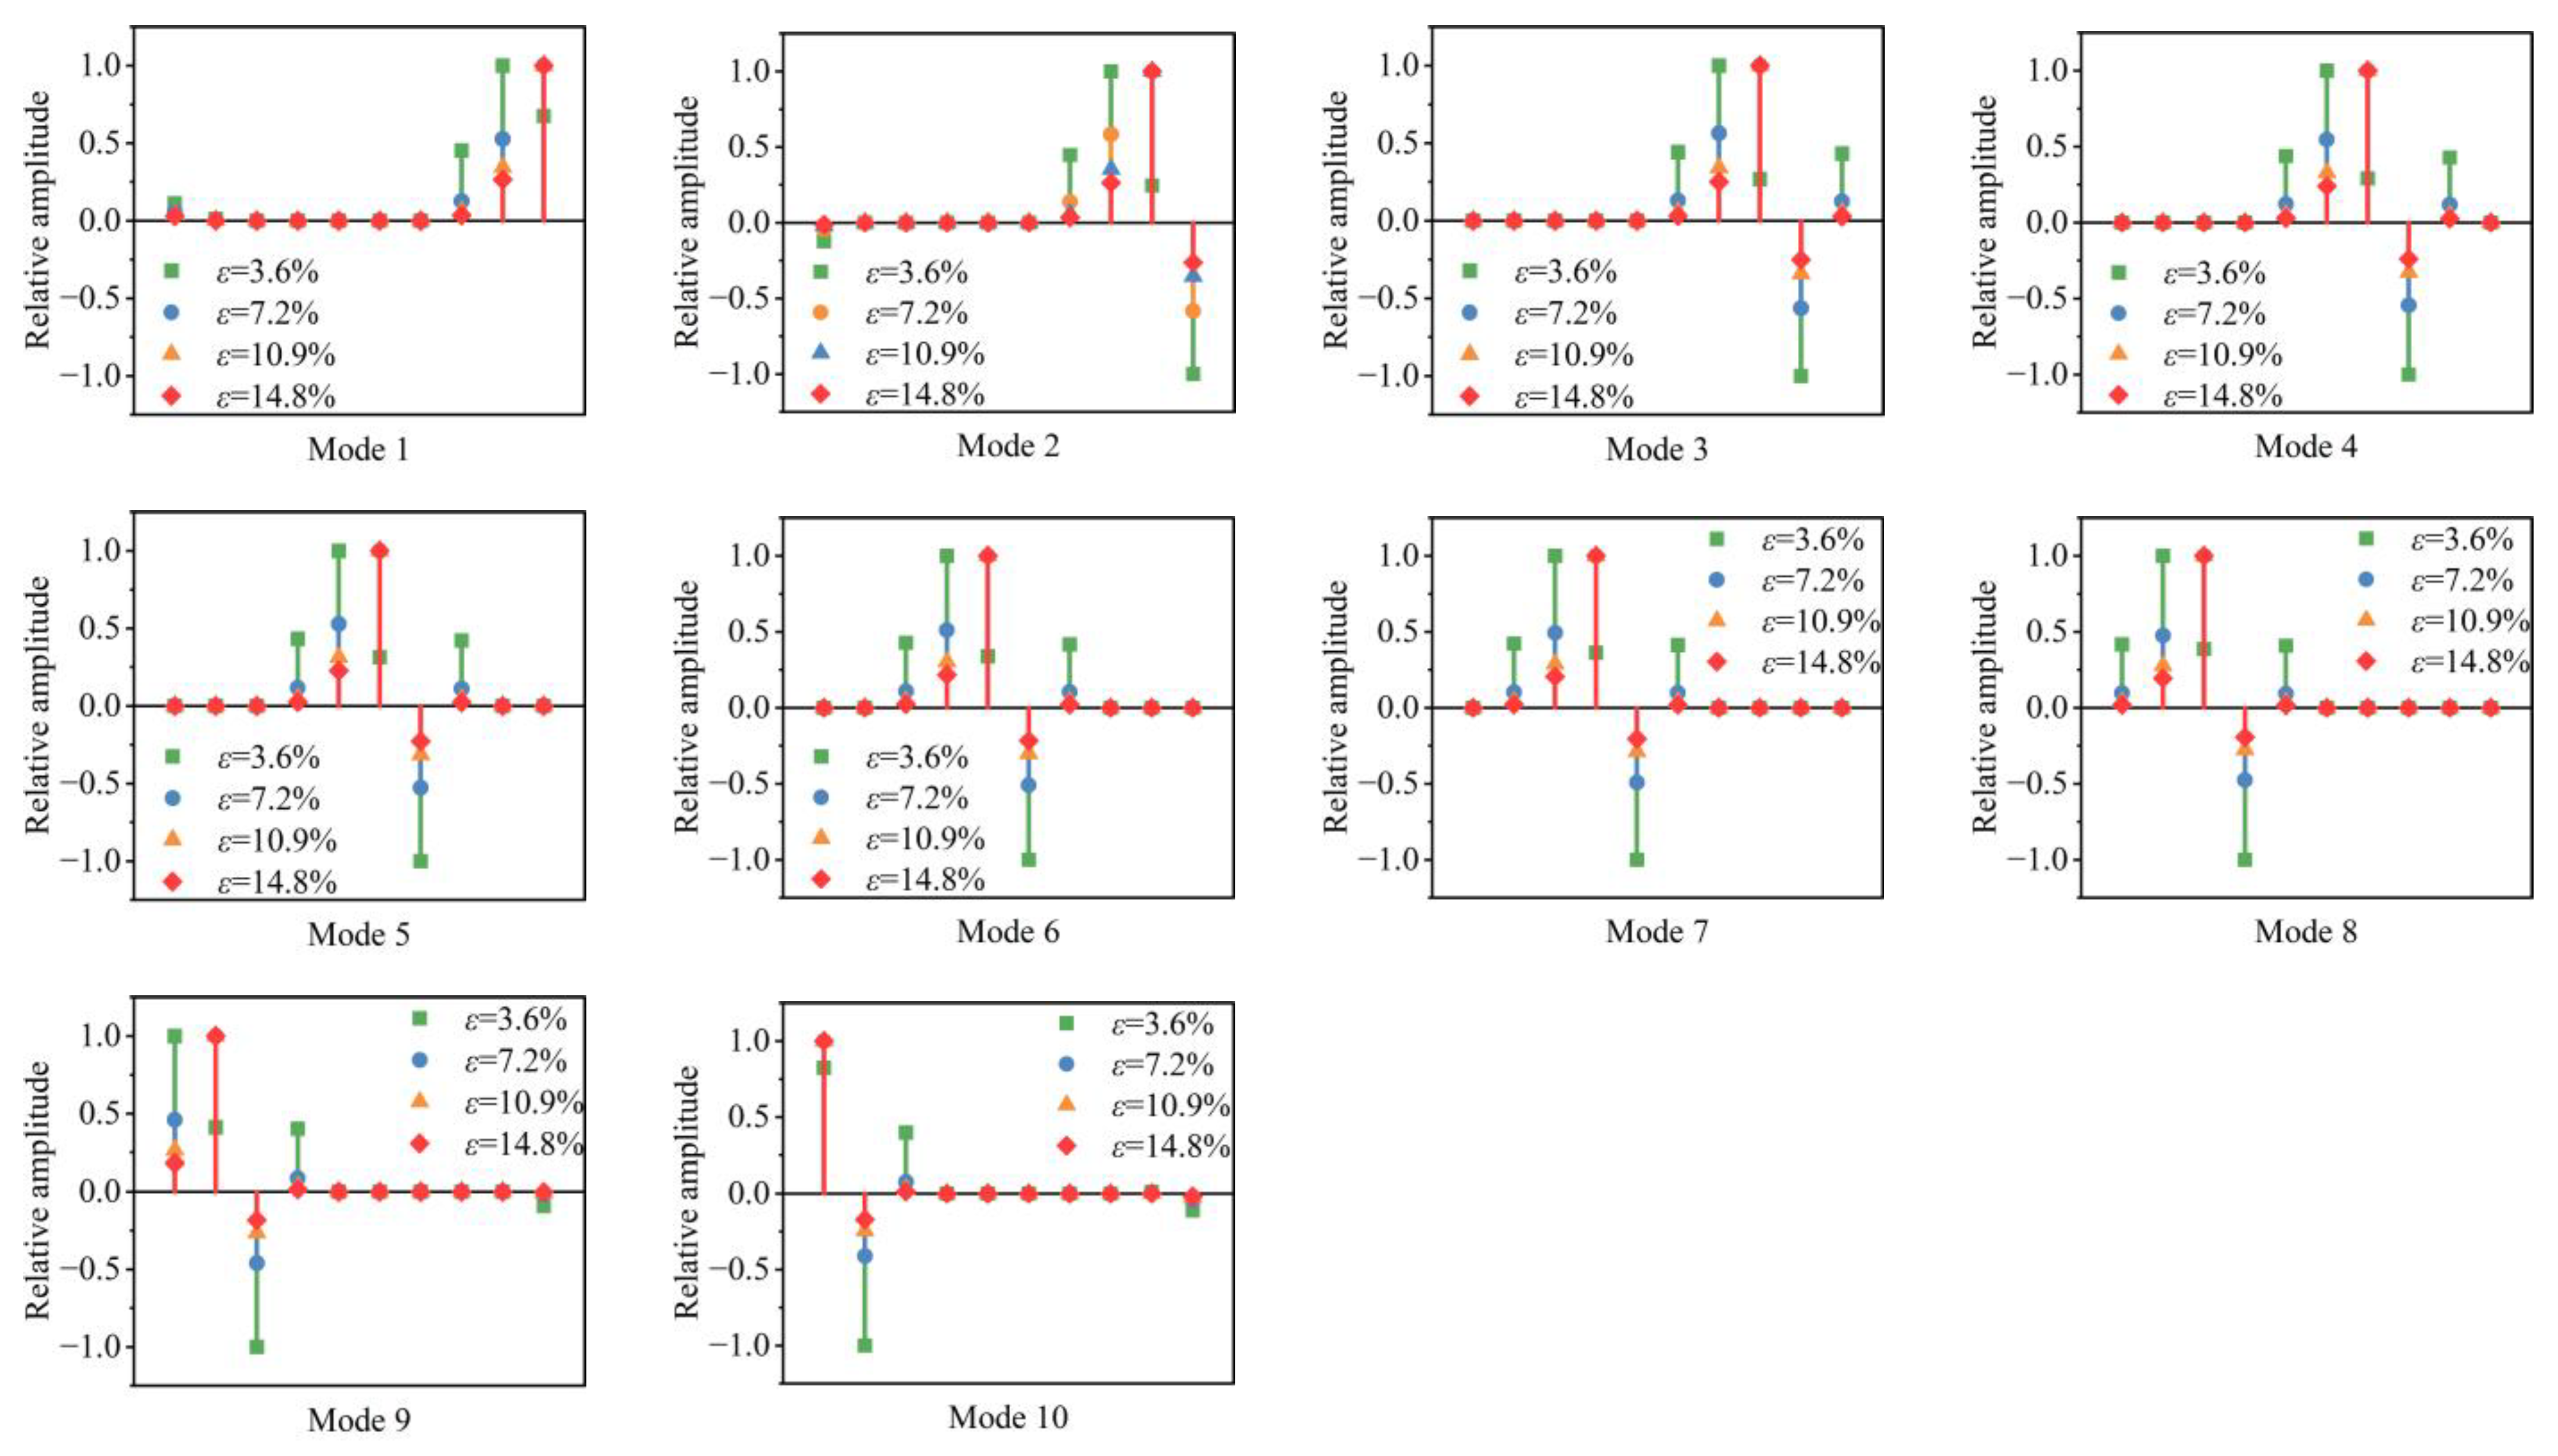
3.1. Mode Localization

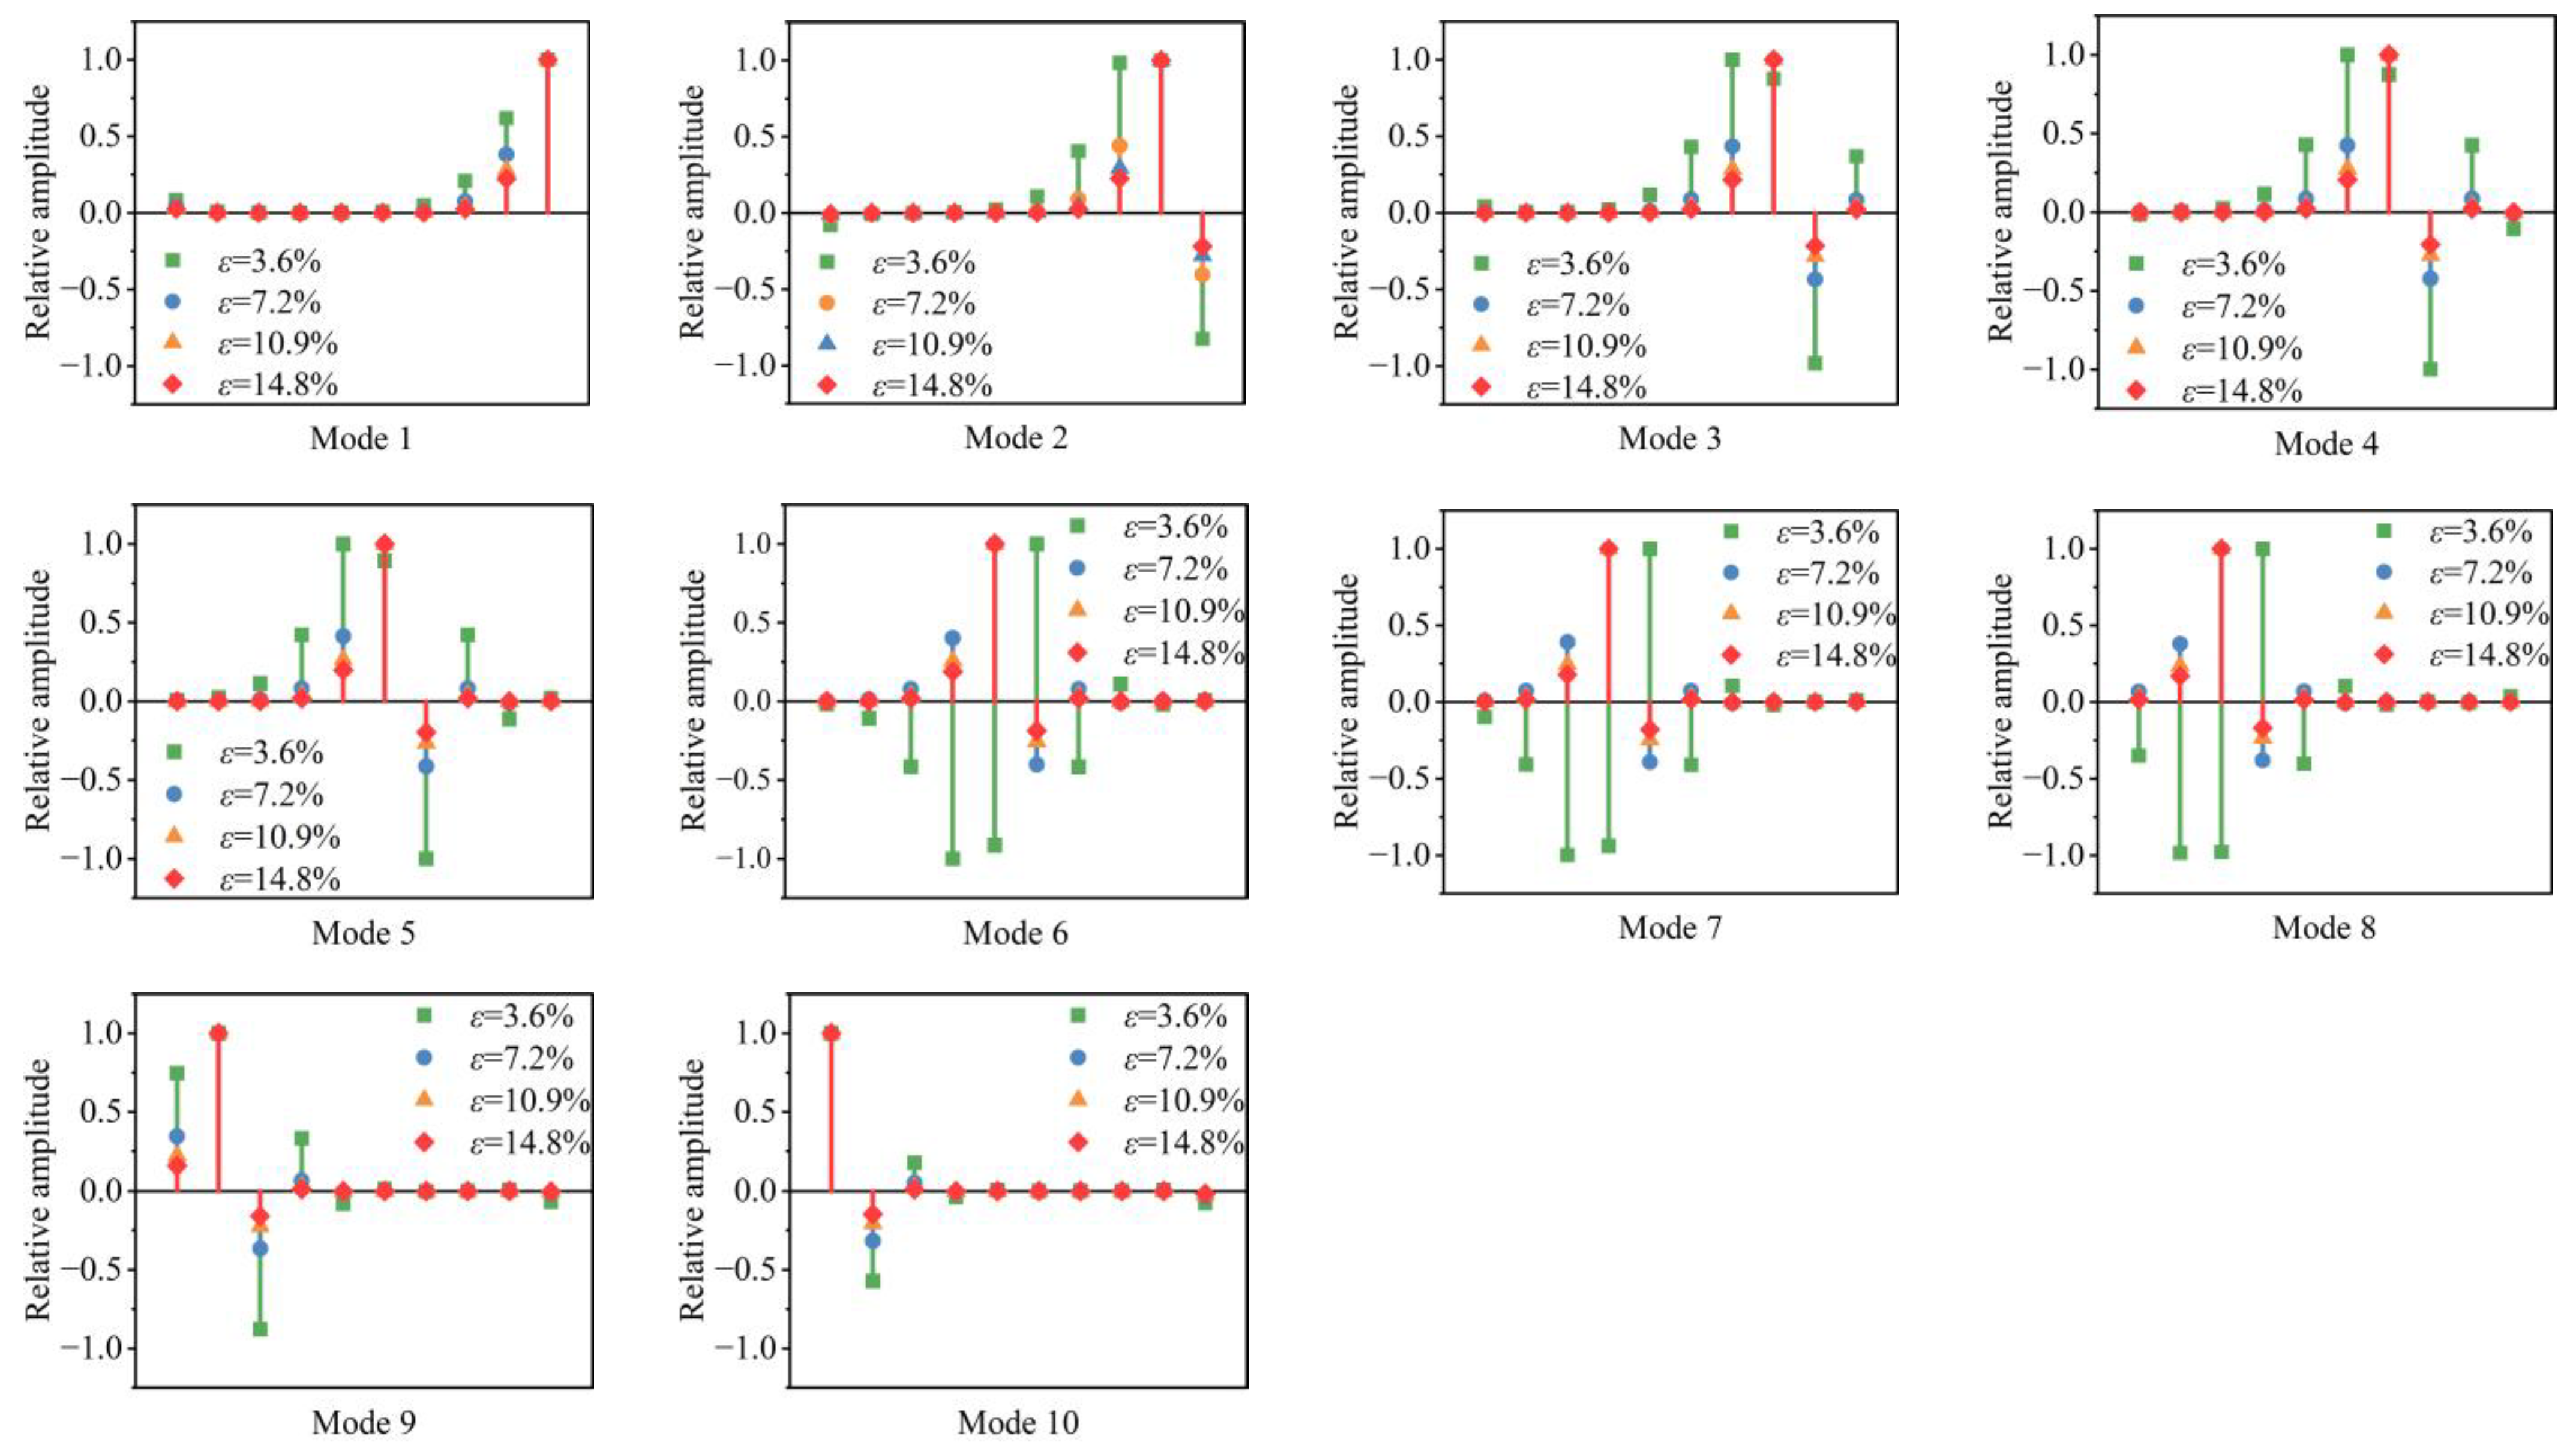
3.1.1. Mode Shapes Under Different Mistuning Strengths

Let the number of resonant units be N= 10, with each resonant unit having a mass  m n  = 17 g. The coupling relation between the units is denoted as R= 0.1. The mode shapes are depicted in Figure 2. It is evident that the cyclic tuned structure (CTS) does not display a mode localization phenomenon. Instead, the modes across all orders exhibit a relatively regular and uniform distribution throughout the entire structure.
To analyze the influence of the mistuning strength on the mode shapes, the masses of the resonant units are assigned based on the parameters outlined in Table 1. In all four cases, the average mass of the resonant units remains constant at 17 g. The mass intervals between the resonant units are 0.2 g, 0.4 g, 0.6 g, and 0.8 g, respectively. The corresponding calculated mistuning strengths  ε  are 3.6%, 7.2%, 10.9%, and 14.8%. A weak coupling condition is maintained between the resonant units, with the coupling coefficient R = 0.1.
The mode shapes of the cyclic structure under different mistuning strengths are shown in Figure 3. It is clear that the weakly coupled CMS suffers from mode localization. For each order of the vibration mode, there are resonant units with prominent amplitudes, which have a perturbing effect on the adjacent units. When the mistuning strength is relatively small, the mode localization of the CMS is weak, and the mode shapes of each order are characterized by multiple resonant units undergoing intense vibrations simultaneously. As the mistuning strength increases, the mode localization becomes more pronounced, and the mode shapes of each order are manifested by the violent vibration of a single resonant unit.

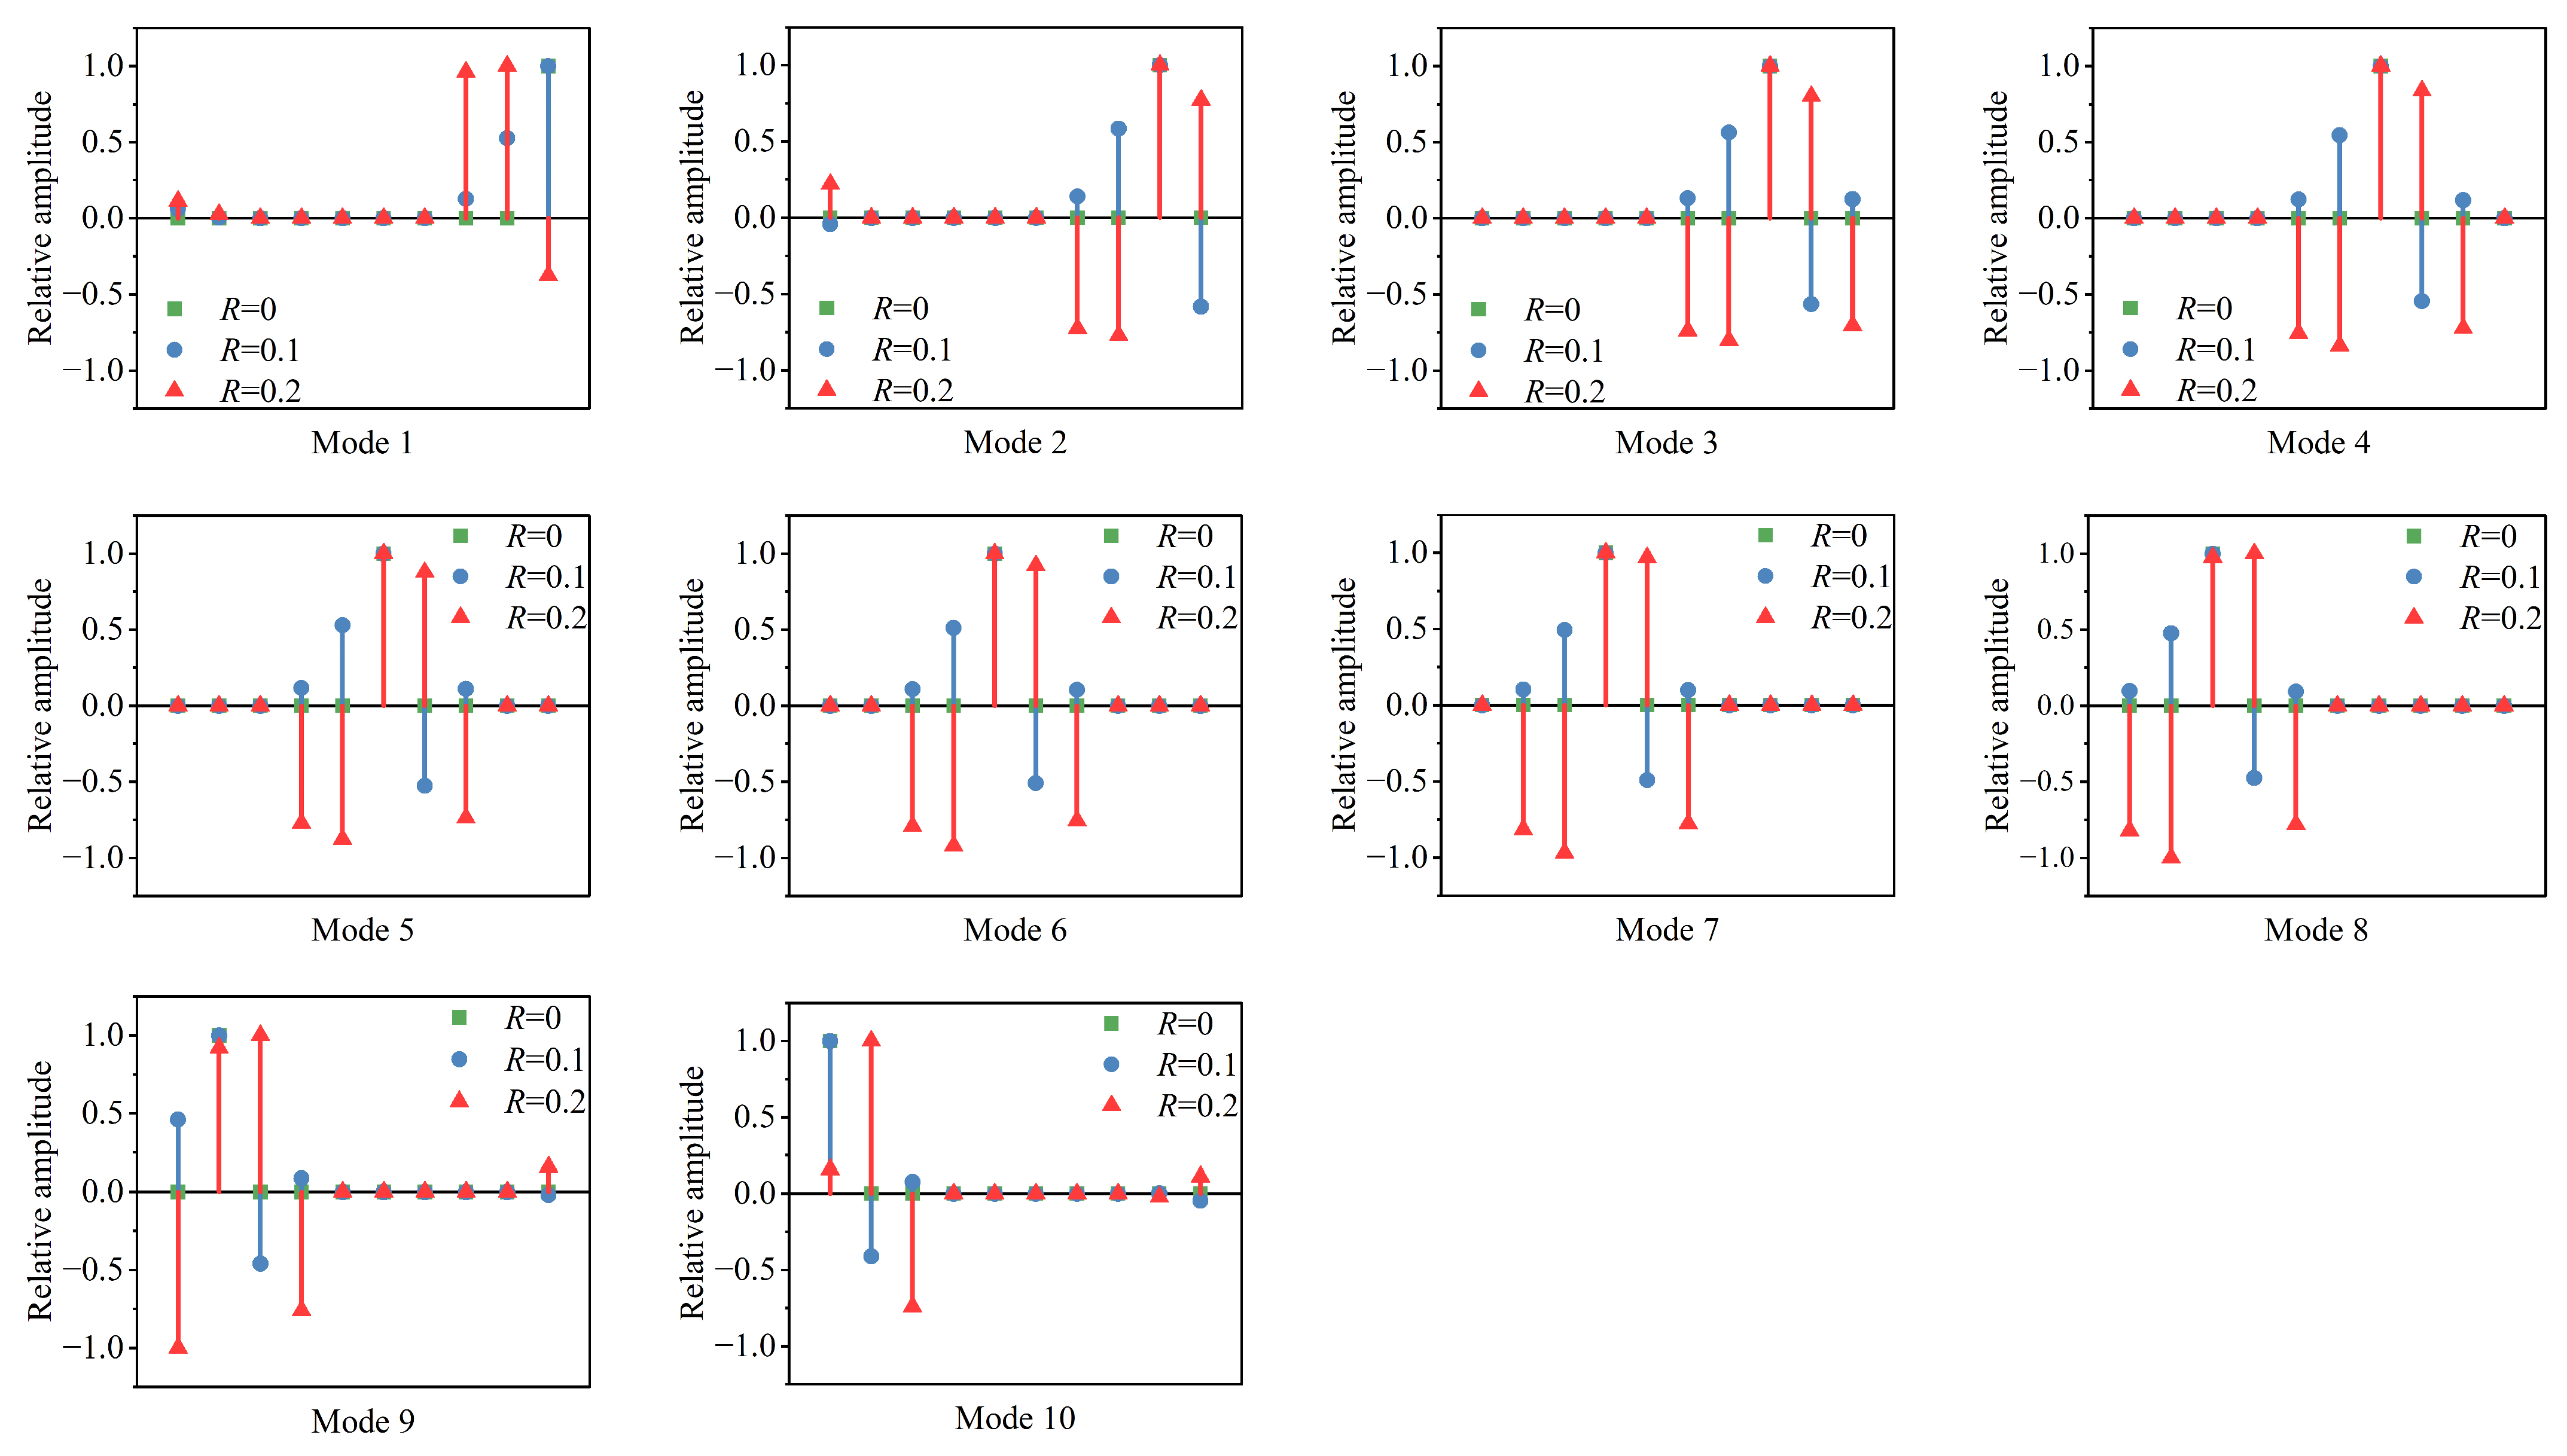
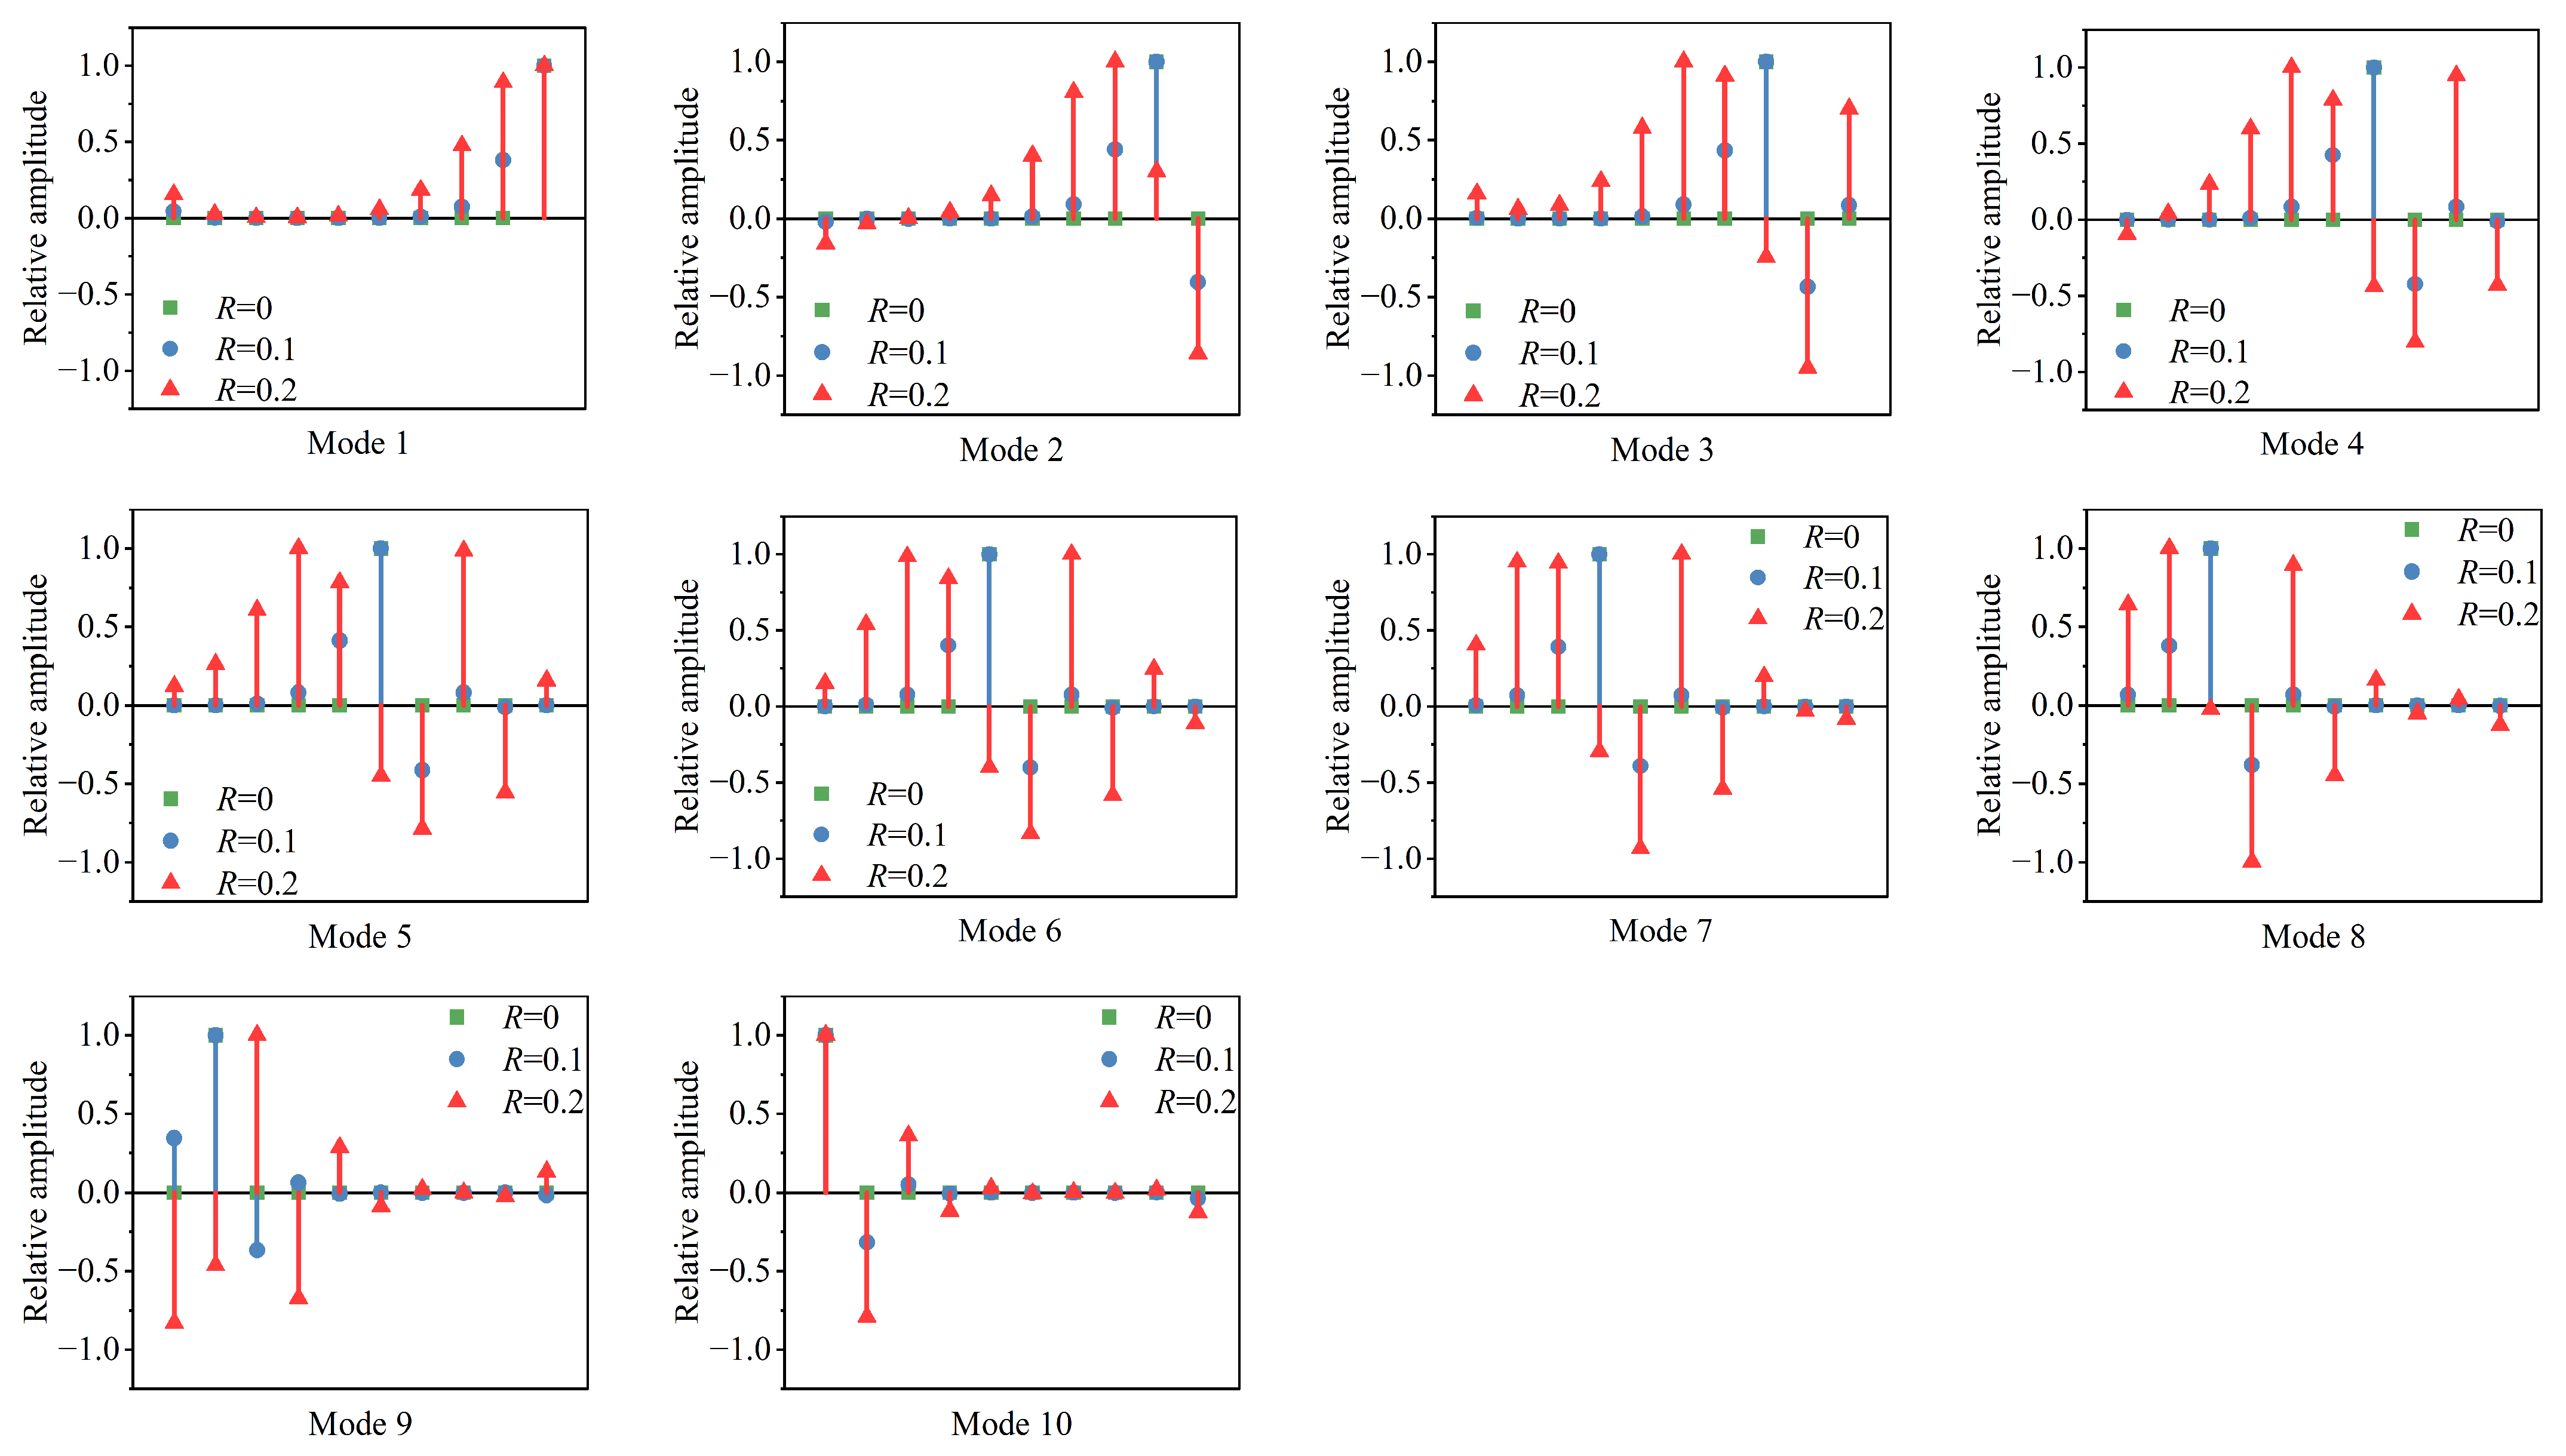
3.1.2. Modal Shapes Under Different Coupling Strengths

According to the parameters of the E2 example in Table 1, the masses of the resonant units are assigned, and the mode shapes of the CMS are calculated for coupling coefficients R = 0, R = 0.1, and R = 0.2. The results are shown in Figure 4. It can be seen that when there is no coupling between the units, the mode shapes of all orders are manifested as prominent vibration of a single resonant unit, which produces a strong mode localization. As the coupling strength increases, the mode localization diminishes, and the mode shapes of each order gradually transition to multiple resonant units vibrating simultaneously.

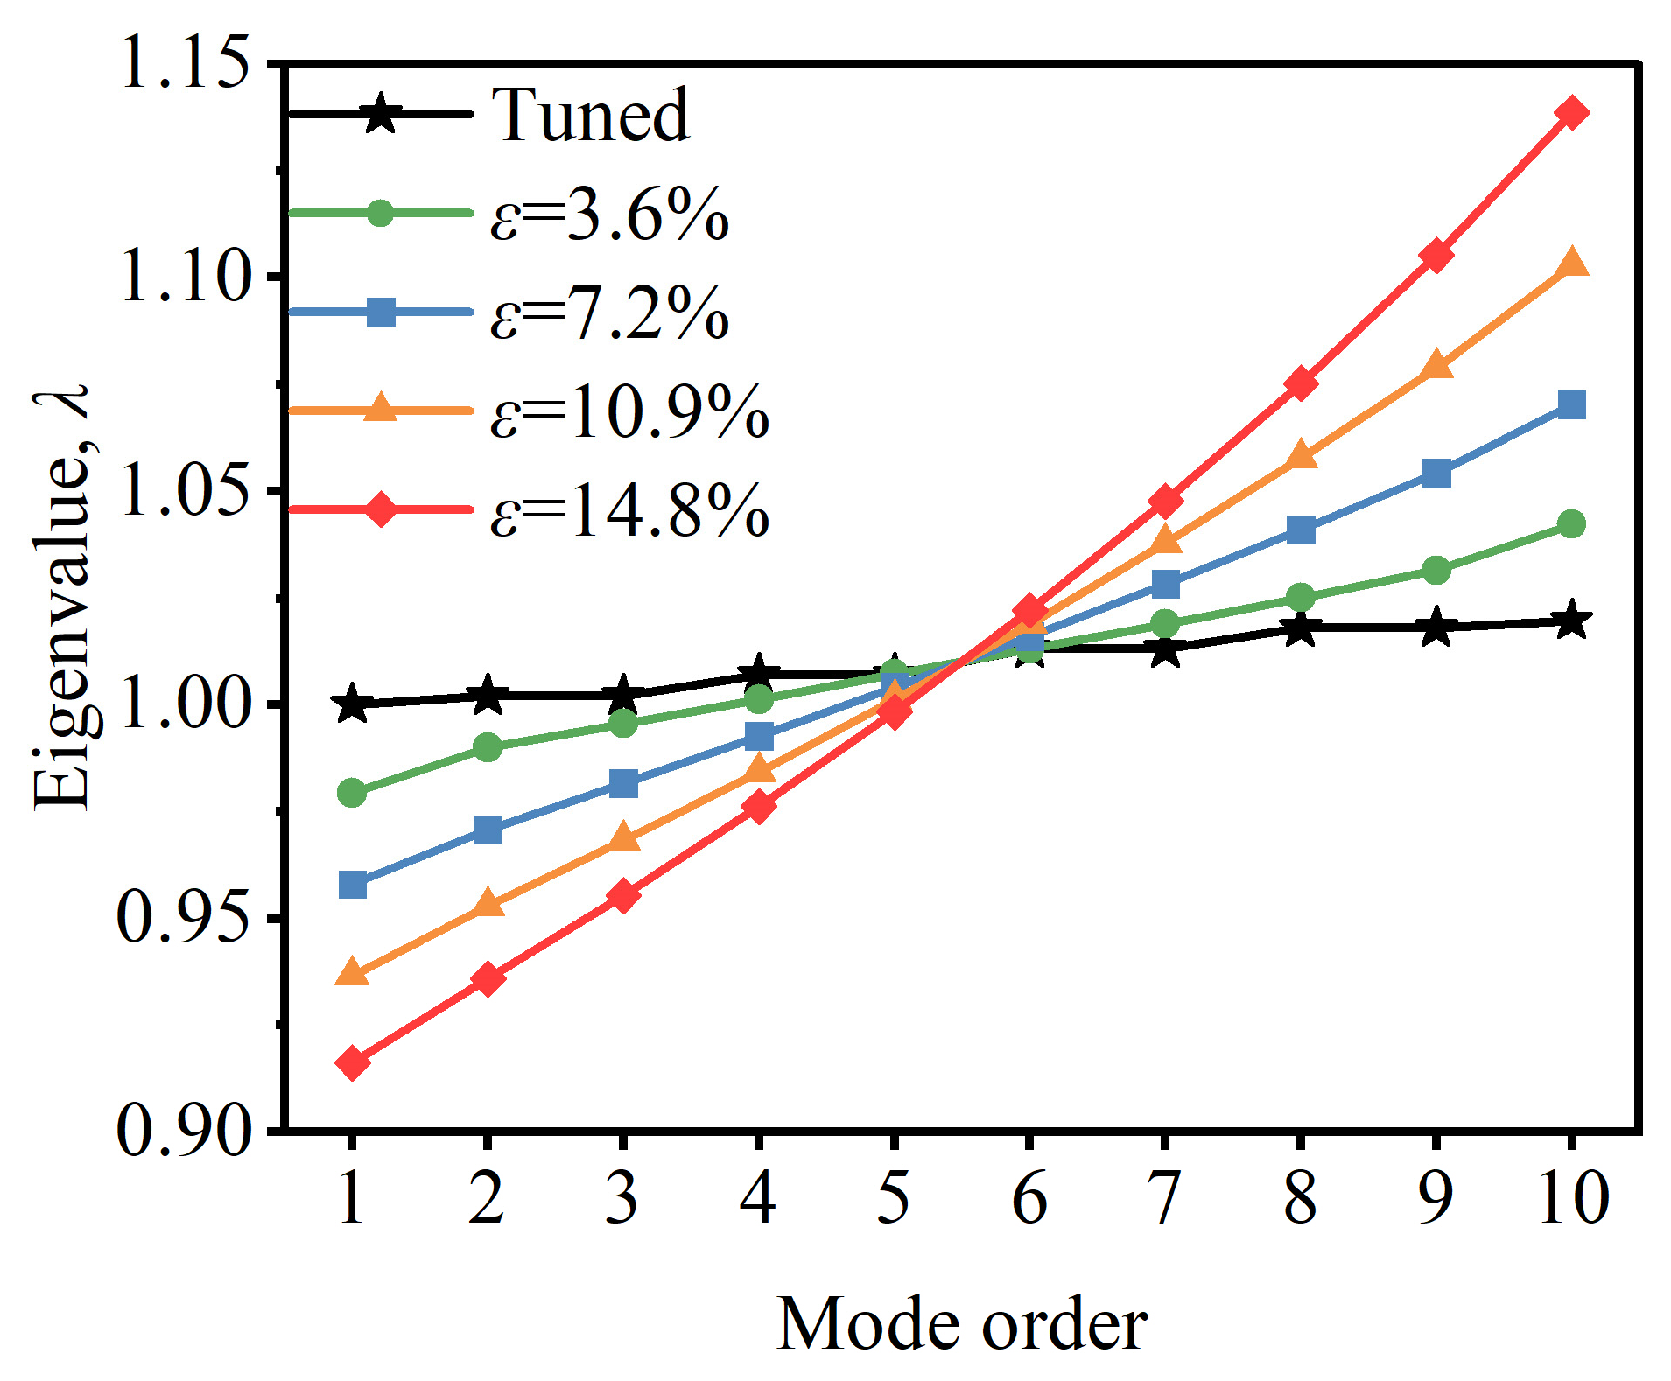
3.2. Eigenvalue Splitting

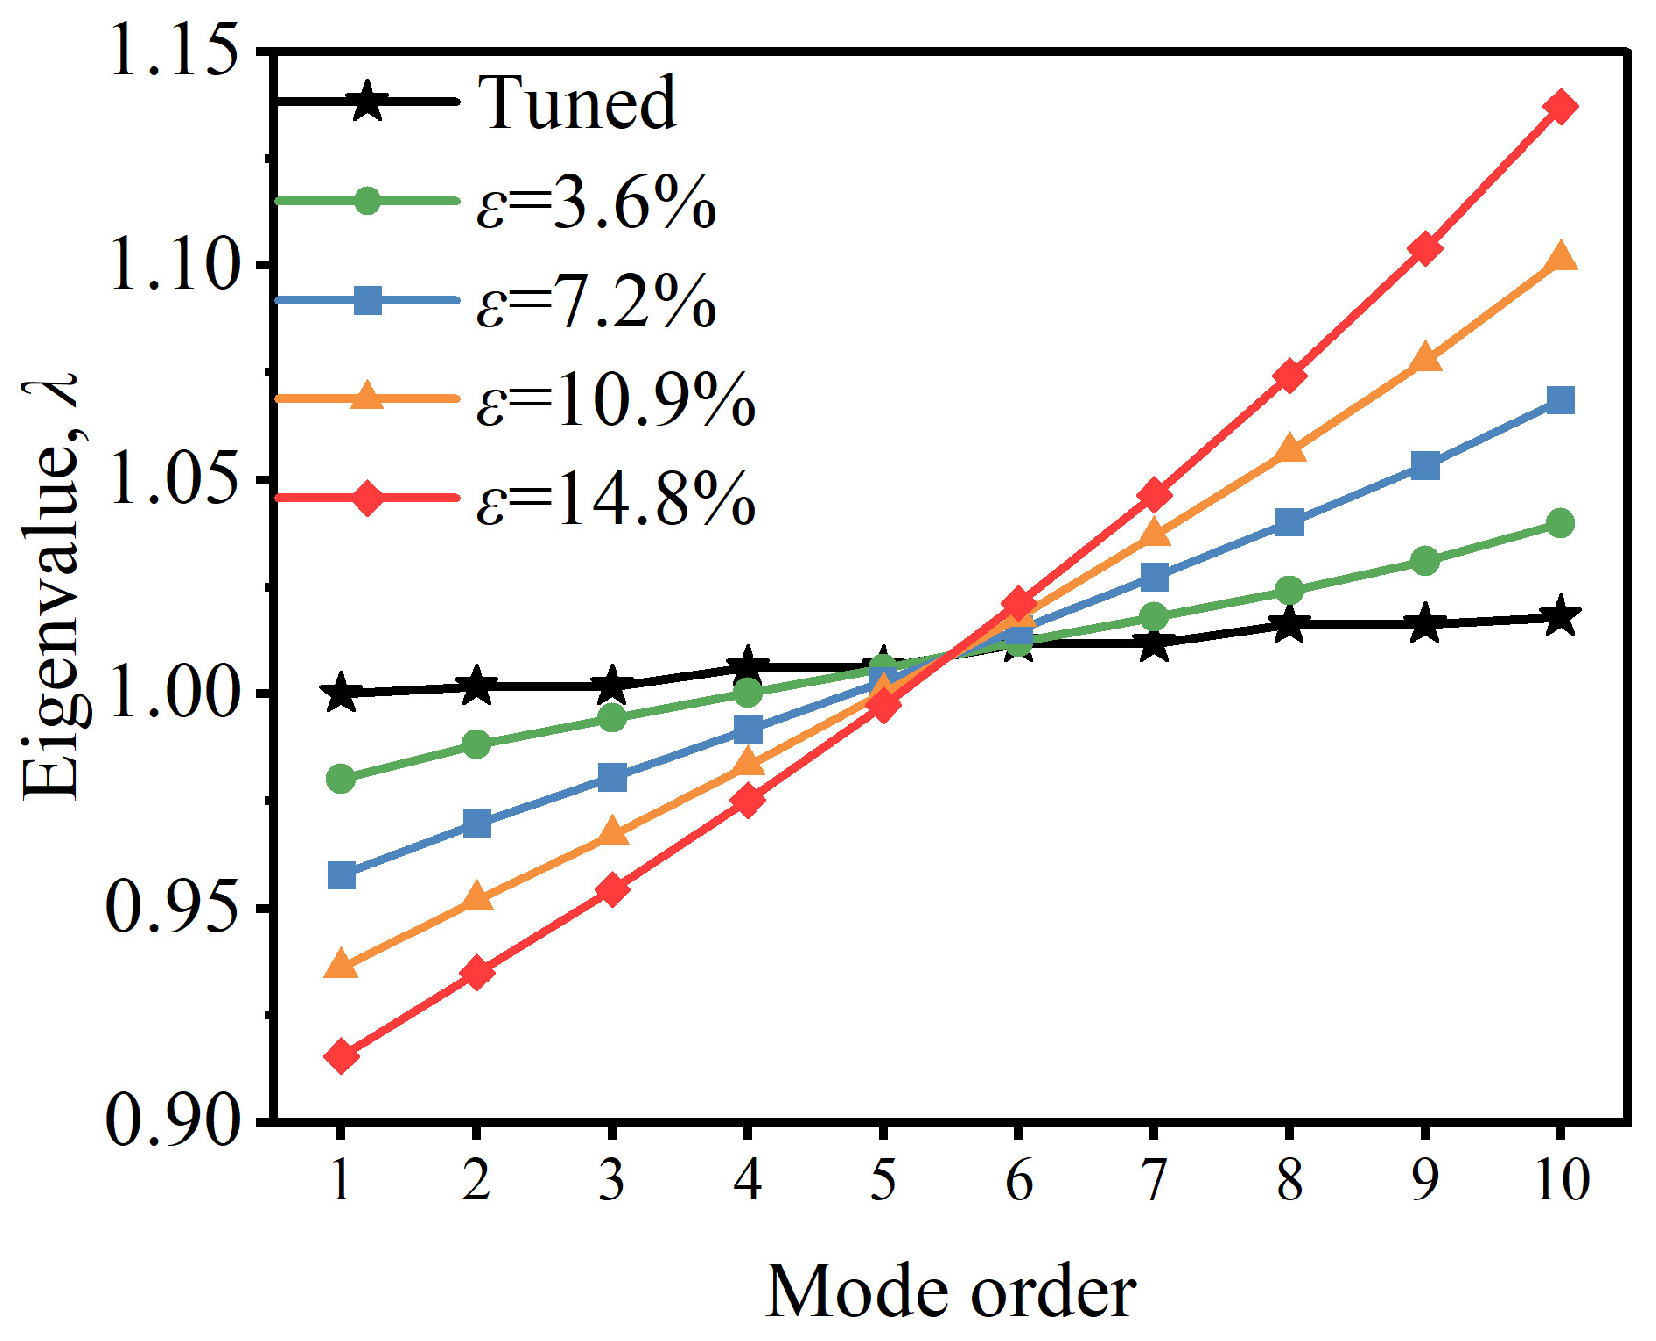
3.2.1. Eigenvalues Under Different Mistuning Strengths

Maintaining the coupling coefficient R = 0.1 between the resonant units, the eigenvalues are calculated under the four different mistuning strengths specified in Table 1. Additionally, for enhanced comparison, the eigenvalues in the tuned state are also computed simultaneously. The results are shown in Figure 5. It can be observed that in the tuned state, the eigenvalues of the resonant units are in close proximity, with multiple repeated eigenvalues present. As the mistuning strength increases, the structure demonstrates eigenvalue splitting phenomena. The resonant frequencies of the units expand to a wide frequency range, which is beneficial for broadening the vibration reduction frequency band of the CMS. But the resonant frequency interval between the resonant units also enlarges, resulting in the ineffective connection of the vibration reduction frequency bands of the resonant units, thereby reducing the vibration reduction performance stability. Therefore, it is necessary to choose an appropriate mistuning strength, which can enable the CMS to achieve good broadband vibration reduction performance while also ensuring the stability of vibration reduction performance.

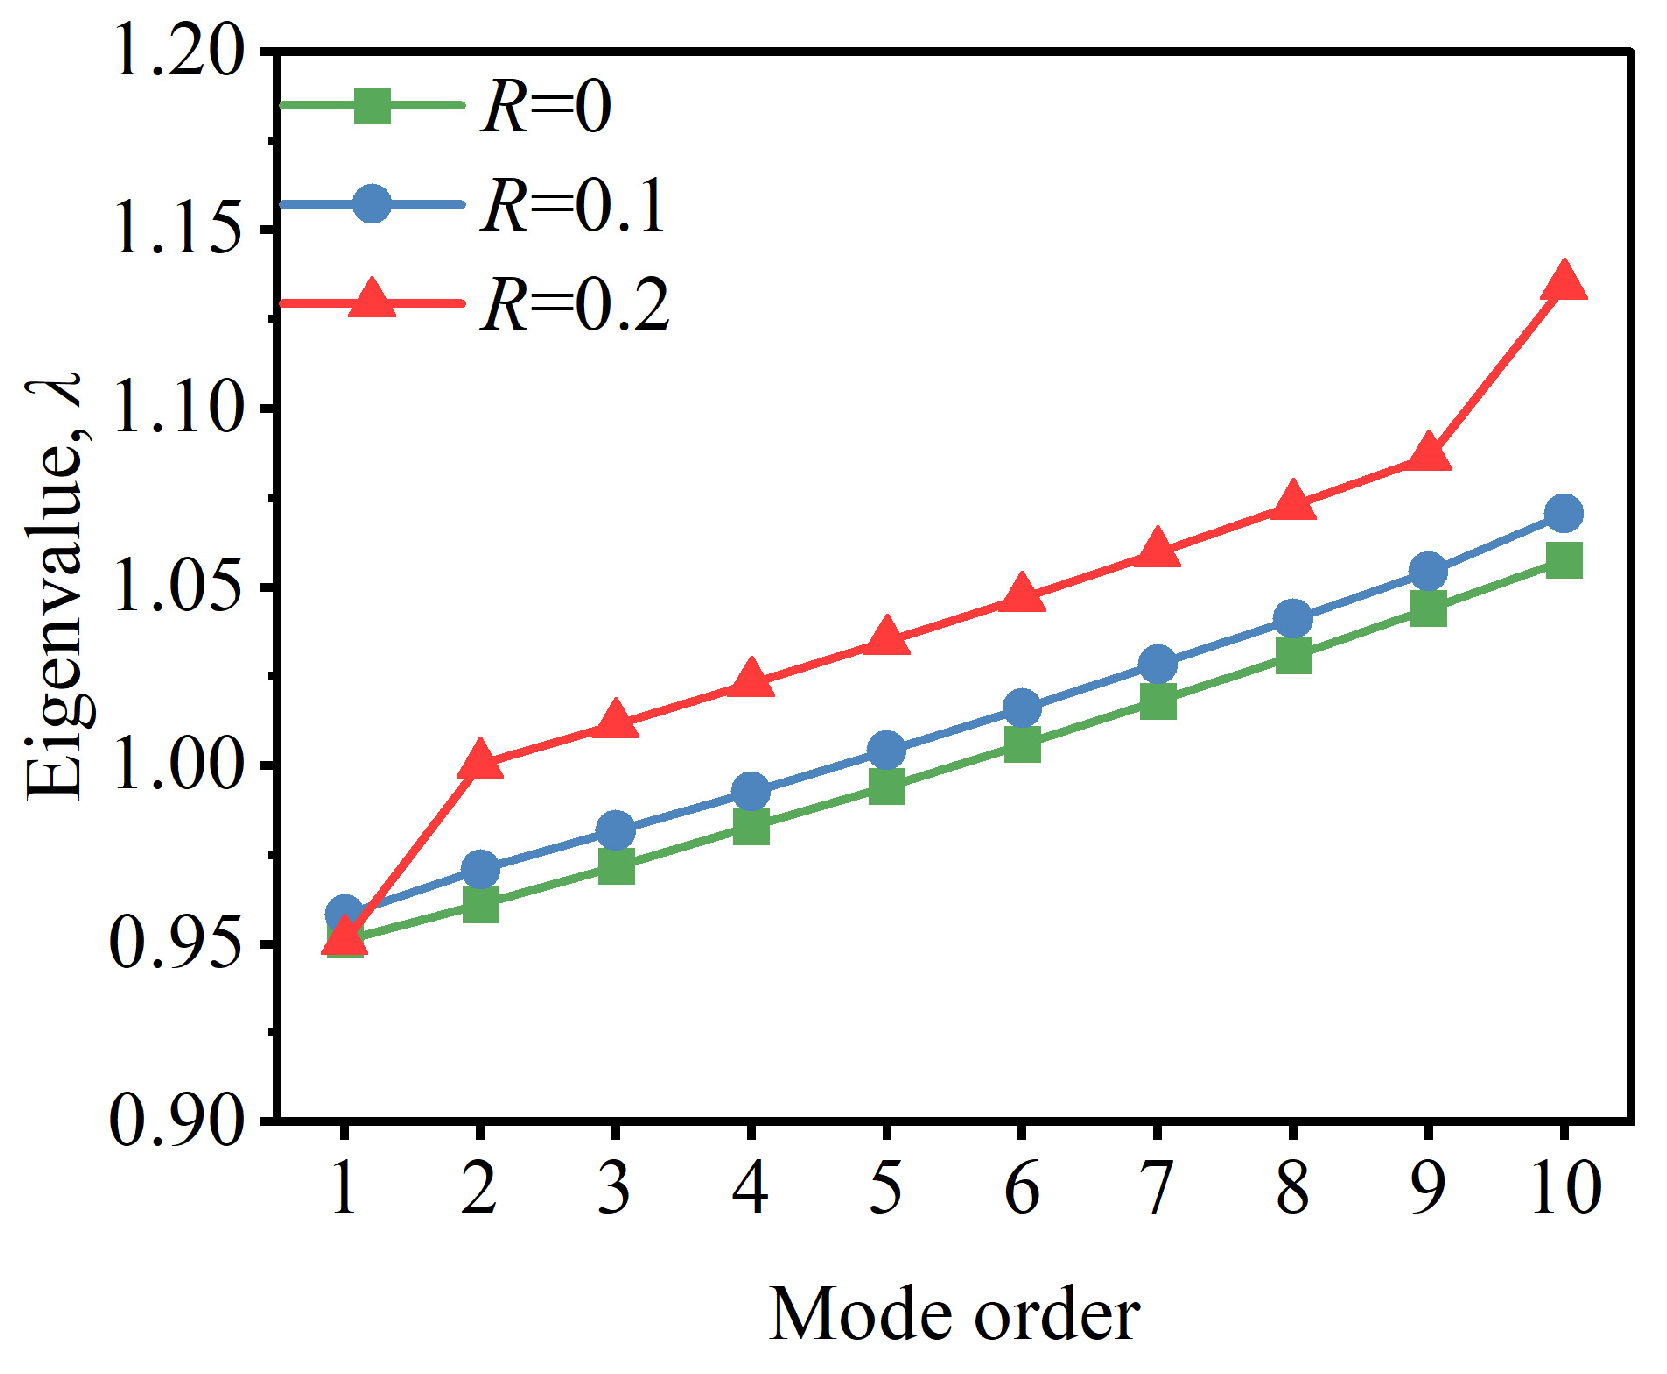
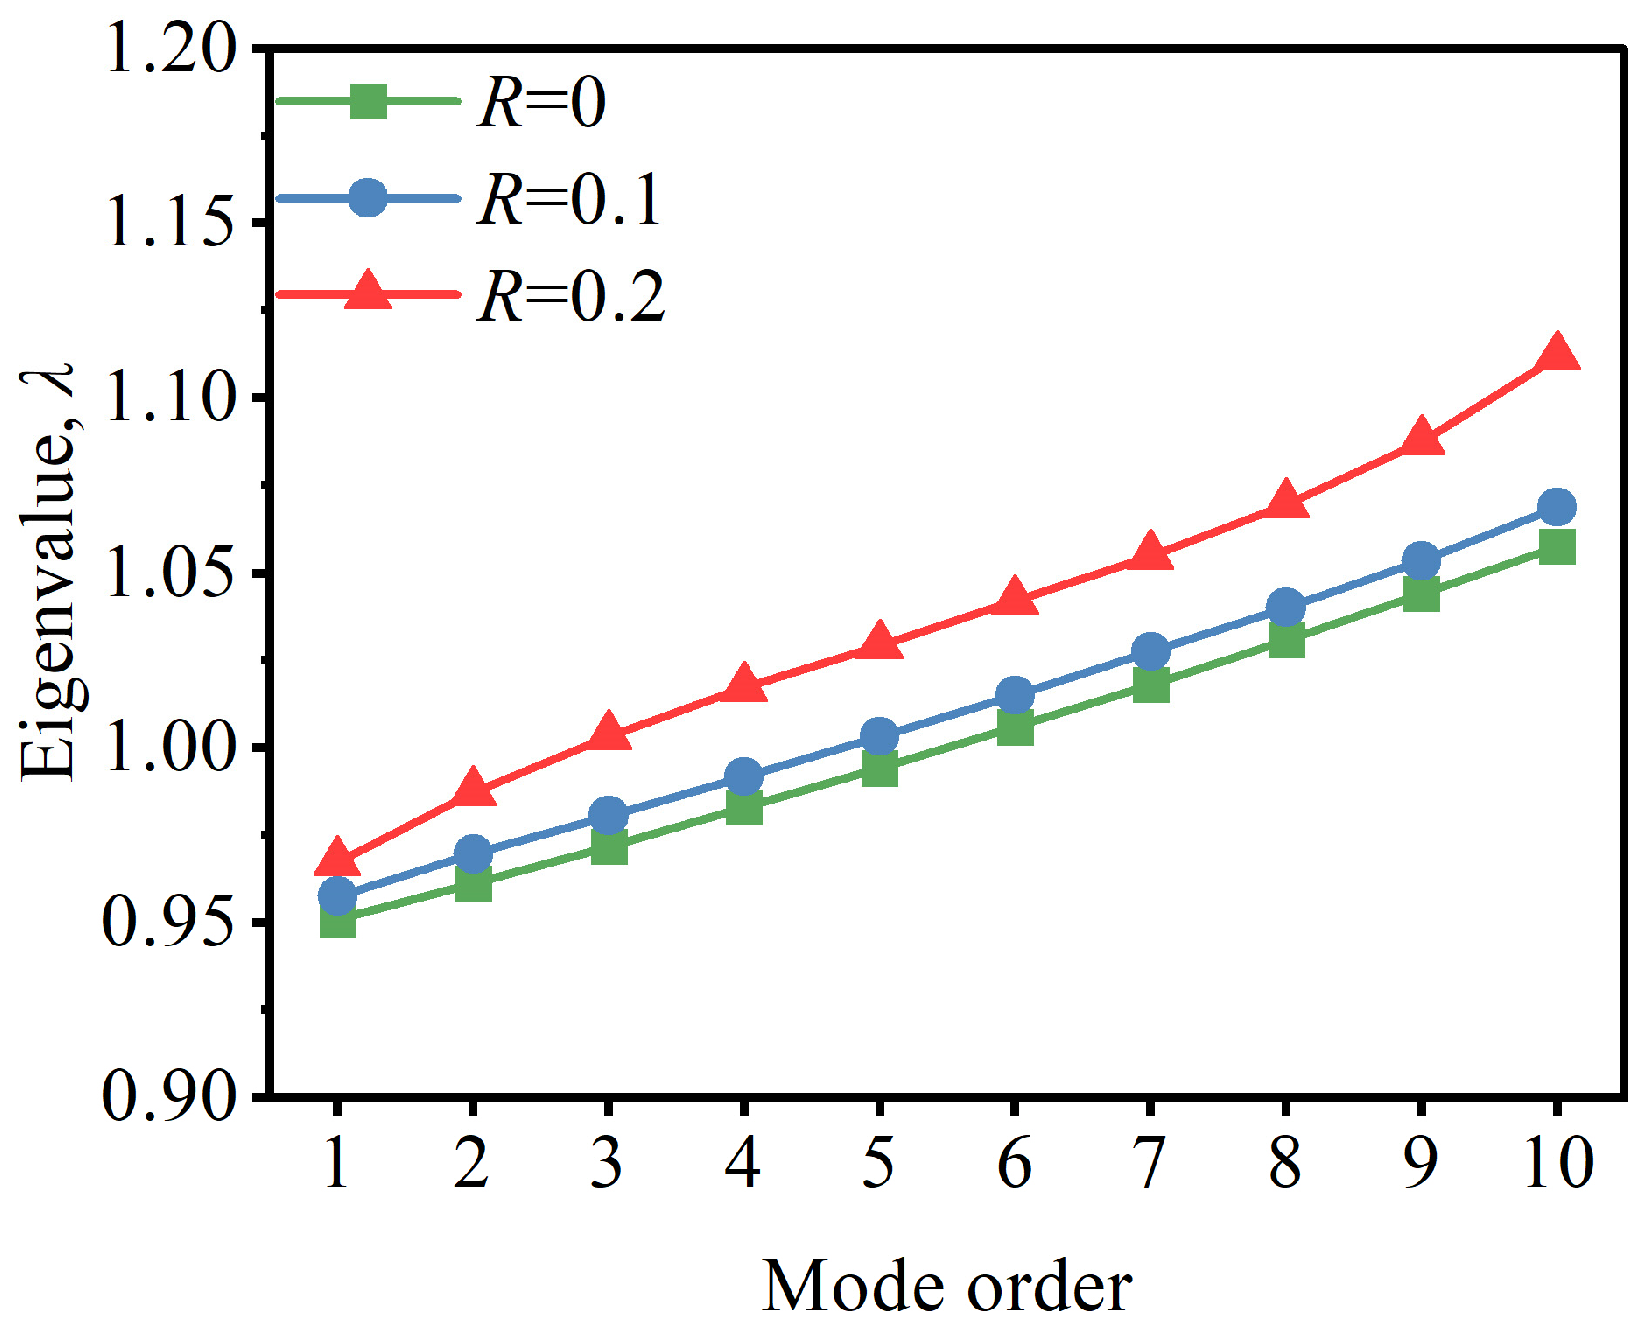
3.2.2. Eigenvalues Under Different Coupling Strengths

The masses of the resonant units are assigned based on the E2 example, and the eigenvalues of the CMS are calculated for coupling coefficients R = 0, R = 0.1, and R = 0.2. The results are shown in Figure 6.
It can be seen that the eigenvalues of the CMS increase overall as the coupling strength rises. When the coupling strength is relatively small (R < 0.2), the relative intervals of the eigenvalues of each resonant unit are less affected by the coupling strength; when the coupling strength continues to increase (R = 0.2), the eigenvalues of the minimum and maximum order modes of the CMS undergo an abrupt change. This is because as R increases, the influence of the coupling strength on the second-order perturbation of the eigenvalues is enhanced, particularly for the resonant units with the smallest and largest eigenvalues. This abrupt change in eigenvalues broadens the distribution range of the eigenvalues, but it causes the resonant frequencies of certain resonant units to deviate from those of other units. As a result, the number of the resonant units that can be effectively utilized is reduced, which in turn affects the overall vibration reduction performance. Therefore, it is advisable to minimize the coupling strength between resonant units as much as possible.

4. Numerical Analysis of Vibration Localization Characteristics

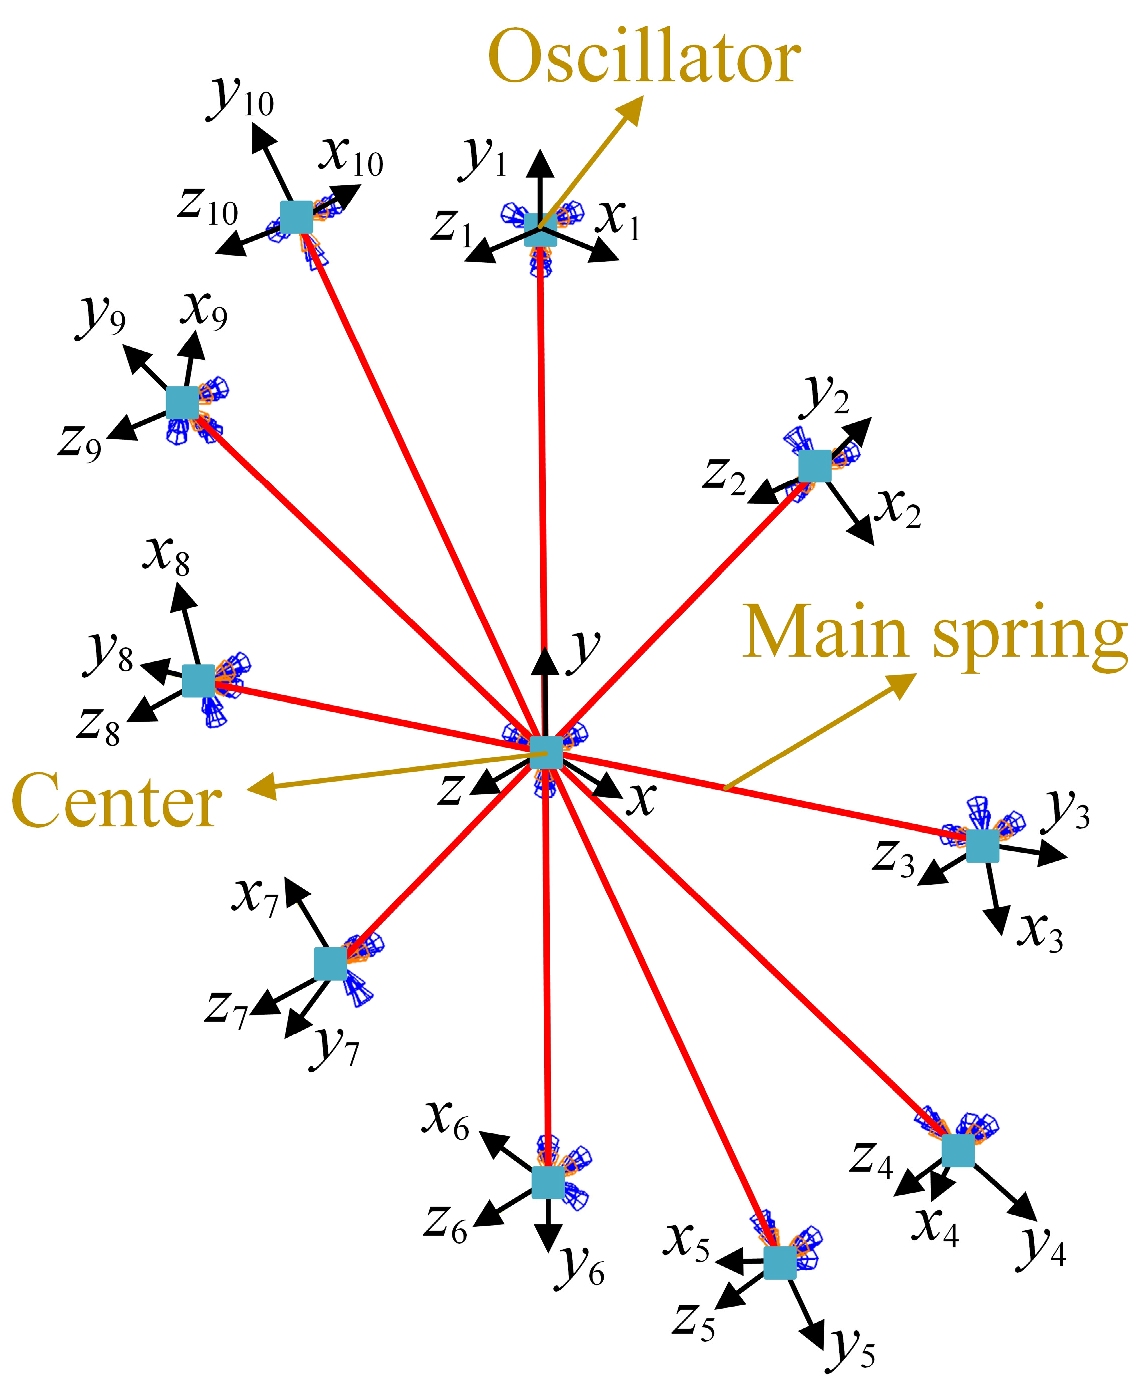
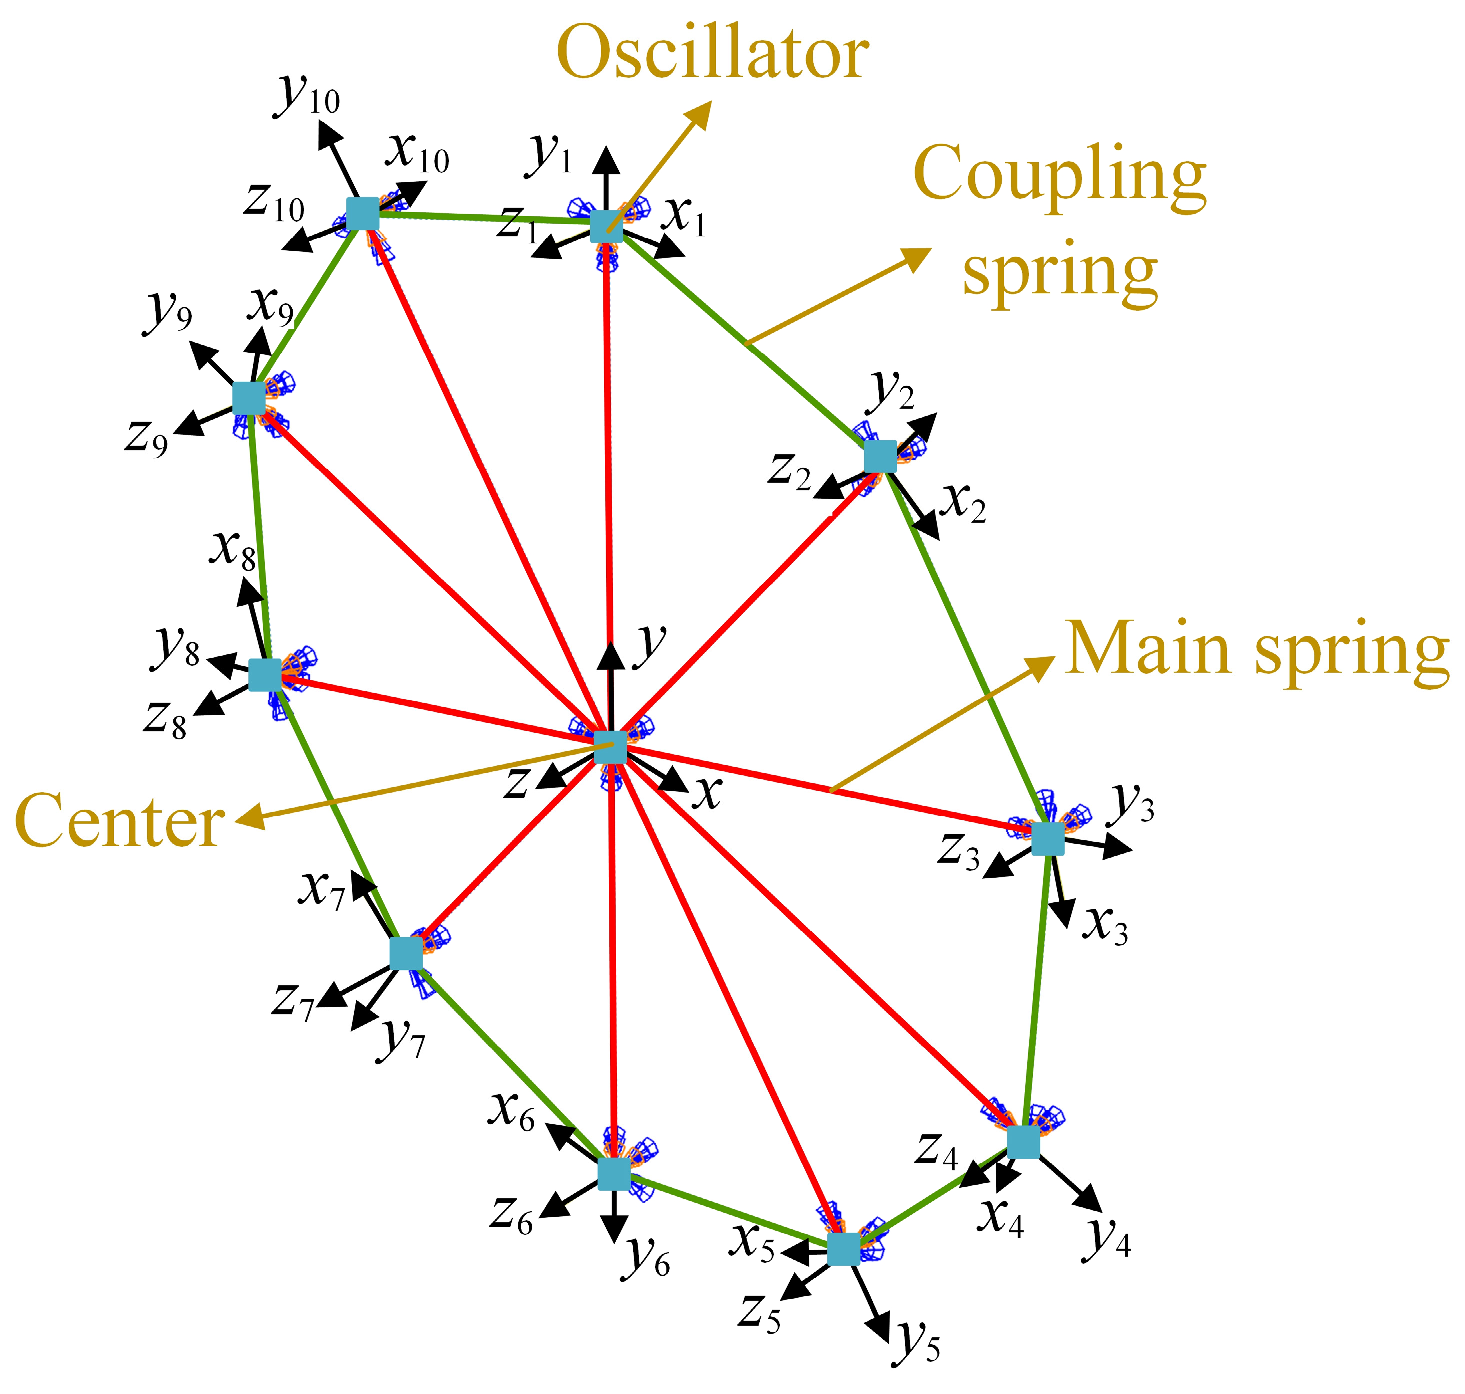
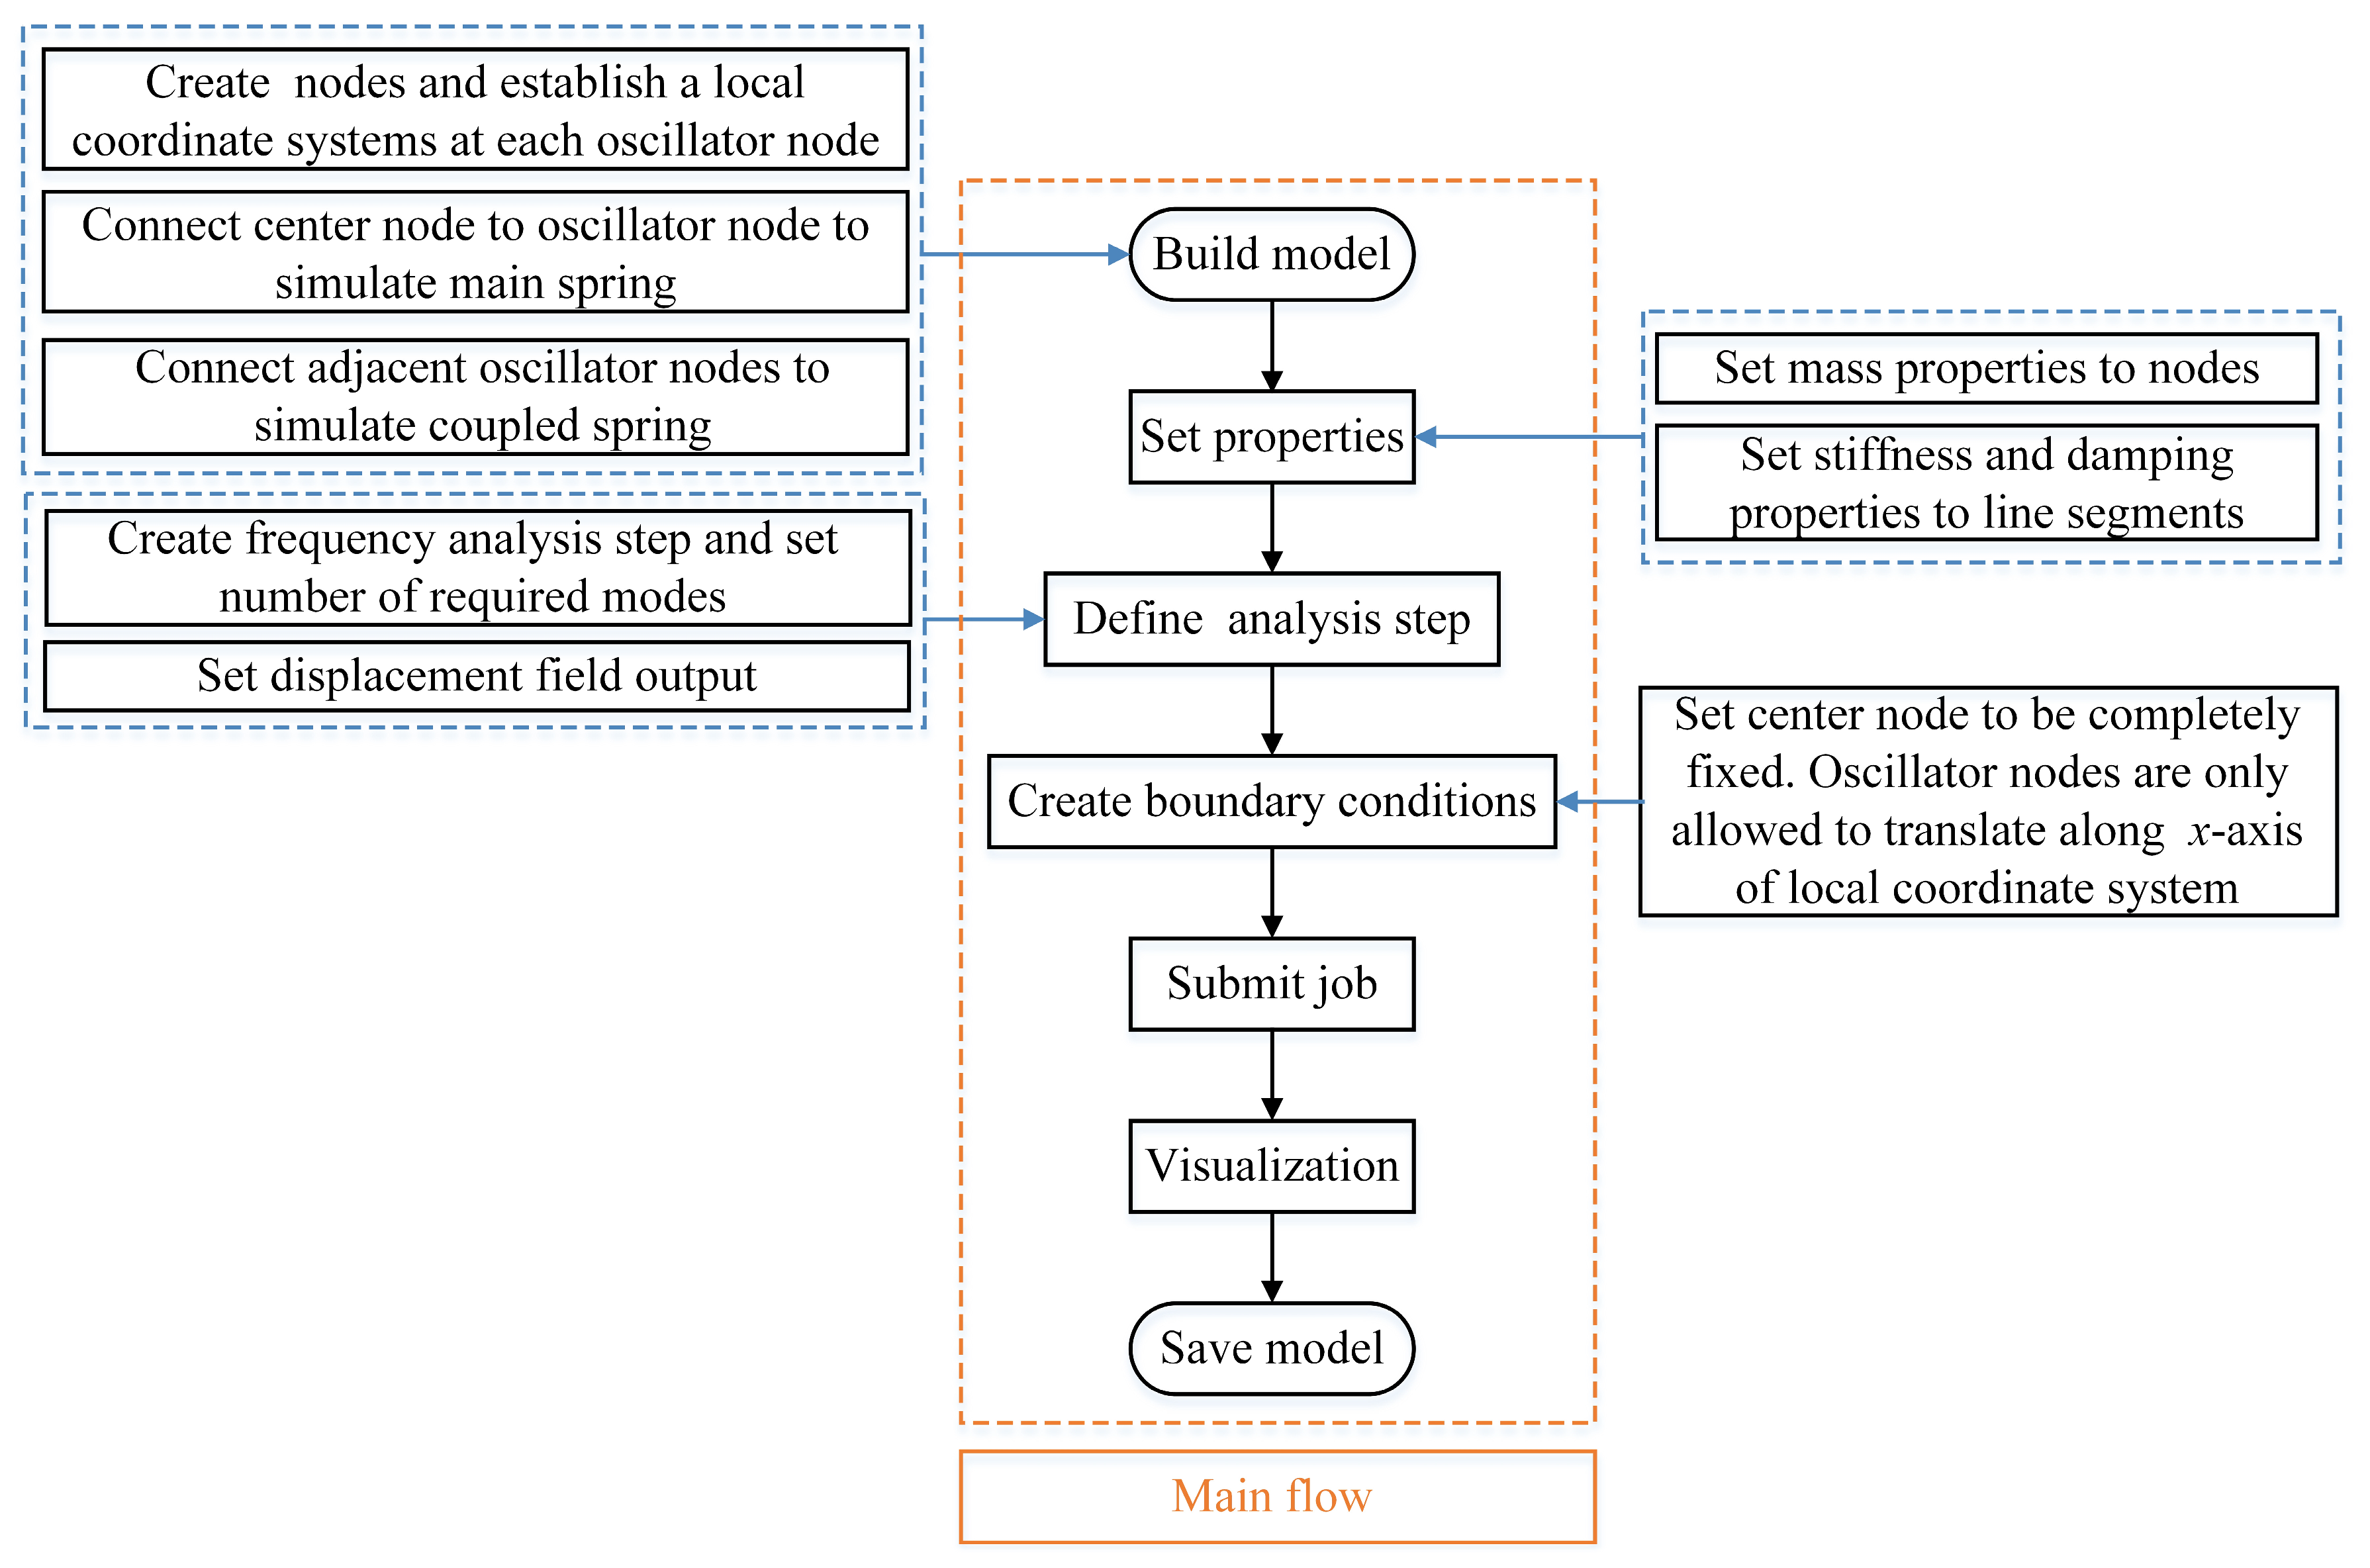
4.1. Numerical Model

The theoretical model simplifies the motion state and coupling relationship of the resonant unit. To obtain more accurate calculation results, a numerical model is established to verify the parameter influence of the vibration localization characteristics of the CMS. A discrete periodic cyclic spring-oscillators model is constructed in ABAQUS 6.14 software. The model comprises 10 spring oscillators with a 36° rotation angle difference between adjacent units. Nodes are used to simulate both the oscillators and the center point, connecting nodes to form line segments to simulate the springs. Mass properties are assigned to the nodes; stiffness and damping properties are assigned to the line segments.
The main coordinate system is established at the center mass node, and the local coordinate systems are established at the oscillator nodes. In the local coordinate system, the y-axis is aligned with the direction of the main spring’s length, and the x-axis and z-axis are oriented orthogonally, perpendicular to the y-axis. The stiffness and damping of the main spring act solely in the x-axis direction of the local coordinate system, whereas those of the coupling spring act solely in the direction of the spring’s length. In terms of the setting of the boundary conditions, the node of the center mass is completely fixed. The oscillator is permitted to translate only along the x-axis direction of its local coordinate system, with several other degrees of freedom restricted. Figure 7 and Figure 8 depict the cases of the resonant unit without coupling and with coupling, respectively.
The numerical analysis process can be represented by a flowchart as shown in Figure 9.

4.2. Numerical Results

4.2.1. Validation of Mode Localization

The node masses of the oscillators and the center are set to 17 g and 165 g, respectively. The stiffnesses of the main and coupling springs are set to  3.6 × 10 3  N/m and 36 N/m, respectively; the coupling relationship between the oscillators can be calculated as R = 0.1. In order to be consistent with the parameters of the theoretical model, ignore the damping coefficient of the springs. The numerical results of the mode shapes of the CTS are presented in Figure 10.
Comparing the numerical and theoretical results of the mode shapes, it can be found that the 1st to 5th and 10th order modes of the CTS are basically the same under the two calculation methods. The physical properties of the 6th to 9th modes are consistent, with the difference being that the amplitude distribution of the modes manifests as different combinations of oscillators. This phenomenon may be attributed to the fact that the serial numbers and positions of the oscillators in the numerical model are constant, and the software sorts the eigenvalues based on an internal algorithm to identify the corresponding mode shapes, whereas the serial numbers of the oscillators in the theoretical model are arbitrary, and their rotations will not affect the physical properties of the structure.
The numerical results of the mode shapes under different mistuning strengths are shown in Figure 11. It can be found that when the mistuning strengths are 7.2%, 10.9%, and 14.8%, the mode shapes of the cyclic structure of each order are basically consistent under both calculation methods. However, when the mistuning strength is 3.6%, a discernible deviation exists between the numerical and theoretical results, which is due to the fact that the vibration localization of the cyclic structure is weakened. When the mistuning strength is small, the influence of the coupling strength on the mode shapes becomes more pronounced, thereby amplifying the error introduced by the simplified coupling relationship in the theoretical model.
The main spring stiffness is set to  3.6 × 10 3  N/m, and the coupling spring stiffness is set to be 0 N/m, 36 N/m, and 144 N/m, which corresponds to R = 0, R = 0.1, and R = 0.2, respectively. The mode shapes of the CMS are calculated for different coupling strengths, as shown in Figure 12. It can be seen that as the coupling strength increases, the mode localization decreases. When R = 0 and R = 0.1, the coupling strength is significantly smaller than the mistuning strength. Consequently, the error stemming from the simplified coupling relationship in the theoretical model becomes negligible, and the numerical results closely resemble the theoretical results. When R = 0.2, the influence of the coupling strength becomes more pronounced, leading to a discernible deviation between the numerical and theoretical results.

4.2.2. Validation of Eigenvalue Splitting

The numerical results of the eigenvalues under different mistuning strengths and coupling strengths are shown in Figure 13 and Figure 14, respectively. It can be observed that the numerical results align closely with the theoretical results.
In summary, the numerical results of the vibration localization characteristics of the CMS are basically close to the theoretical results. Notably, when the mistuning strength is large or the coupling intensity is small, the calculation results obtained from the theoretical model exhibit greater accuracy. Meanwhile, theoretical and numerical results indicate that setting an appropriate mistuning strength and minimizing the coupling strength are conducive to achieving broadband vibration reduction. These considerations should be taken into account when designing a pipeline-oriented CMS.

5. Test Validation

Both theoretical and numerical results indicate that the CMS has the potential for broadband vibration reduction. Based on the previous analysis, this section designs a pipeline-oriented CMS and fabricates the samples. Subsequently, a pipeline test bench is built to conduct the FRF test and excitation test to verify the low-frequency broadband vibration reduction performance of the CMS.

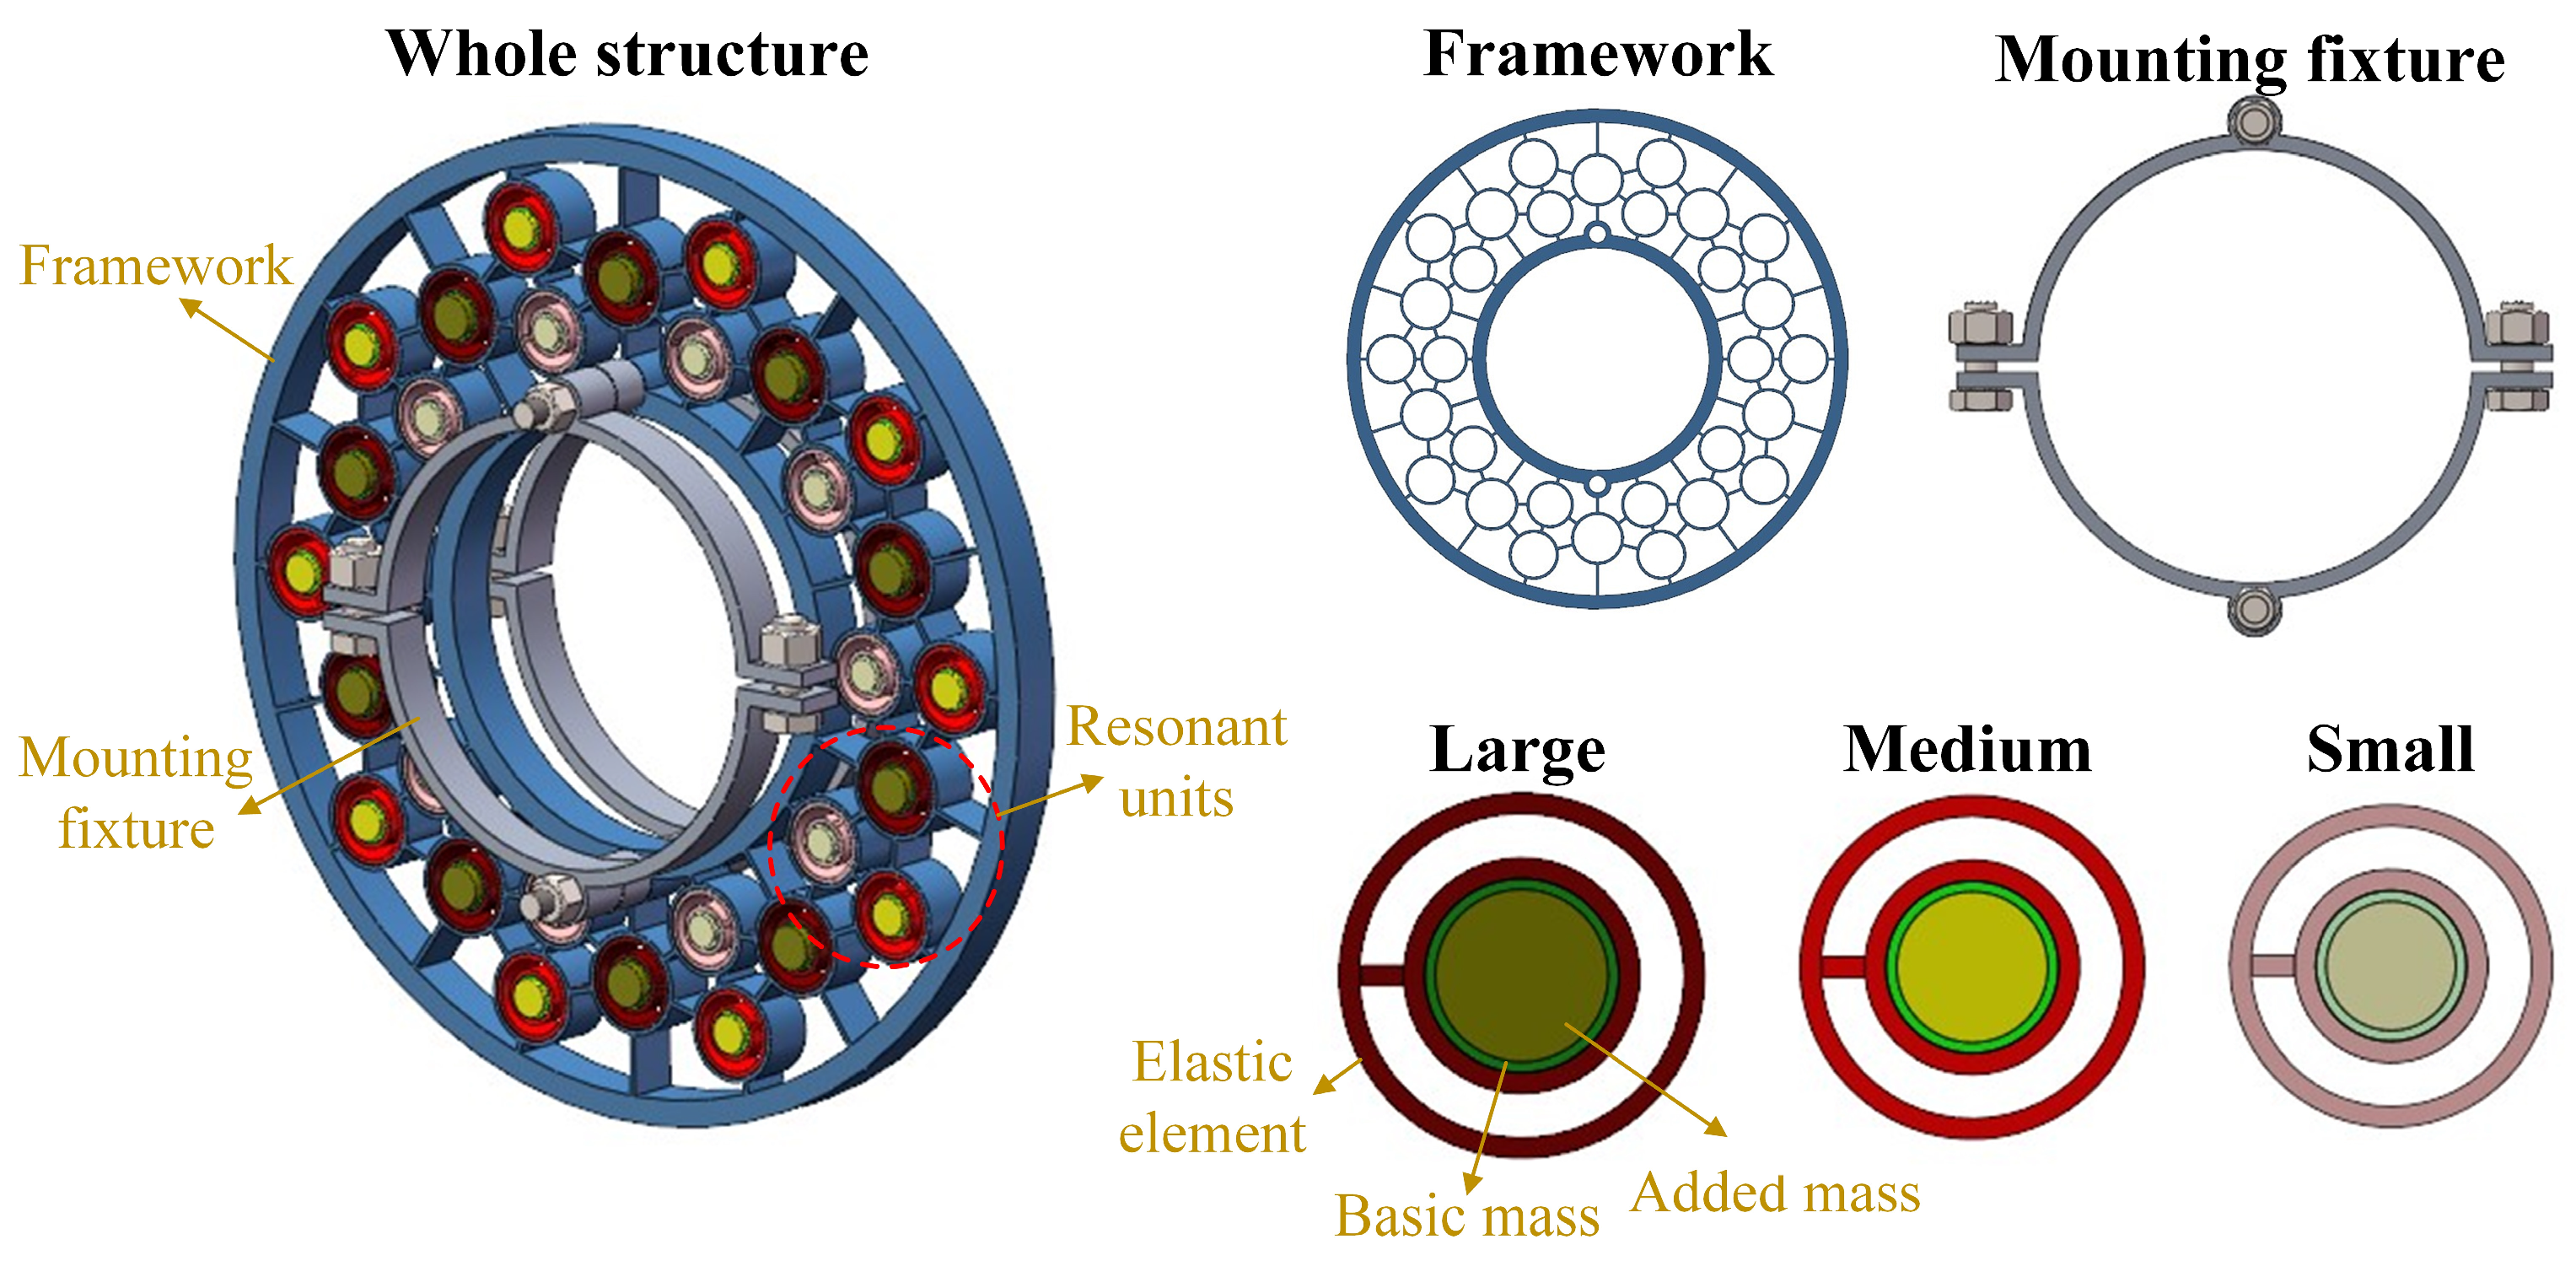
5.1. Model of Pipeline-Oriented CMS

The pipeline-oriented CMS model, as shown in Figure 15, is proposed. This structure consists of a framework, resonant units, and a mounting fixture.
The framework is a circular hierarchical honeycomb structure with three layers of circular holes processed. The inner diameters of the circular holes in each layer differ, and based on these size differences, the circular holes can be categorized into three types: large, medium, and small. The resonant unit consists of an elastic unit, a basic mass, and an added mass. The elastic element is a double-ring structure, with the inner and outer ring connected by the connecting beam serving to provide stiffness. The outer diameter of the outer ring matches the inner diameter of the circular hole, thus enabling the resonant unit to be firmly embedded in the framework. Based on the size of the elastic elements, the resonant units can also be divided into three types: large, medium, and small. The basic mass is a cylindrical structure, with the diameter of its bottom circle matching the inner diameter of the inner ring of the elastic element, thereby enabling the basic mass to be firmly embedded in the elastic element. By setting the geometric and material parameters of the elastic element and the basic mass, the resonant frequency of the resonant unit can be preliminarily determined. By attaching the added mass to the basic mass to introduce mistuning parameters, the frequency adjustment can be achieved.
Here we will describe the core parameters of the pipeline-oriented CMS to facilitate readers’ understanding. The inner diameter of the circular hole in the framework is denoted as  R 1 , the outer diameter of the elastic element’s outer ring as  r 1 , the inner diameter of the inner ring as  r 2 , and the thickness as H. The length, width, and height of the connecting beam are denoted as  h 1 h 2 , and  h 3 , respectively. The diameter of the bottom circle of the basic mass is denoted as  r 3 , and its height is equal to the thickness of the elastic element. The values of the above parameters are shown in Table 2.
In terms of material parameter selection, aluminum alloy is chosen for the framework, tungsten for the basic mass, iron for the additional mass, and resin for the elastic element. The Young’s modulus of the resin is 2.5 GPa, and the density is 1100 kg m−3. The complete geometric and material parameters can be found in our previous work [34], which also established a numerical model based on the above parameters to conduct mode analysis and verify the good vibration localization effect of the pipeline-oriented CMS.

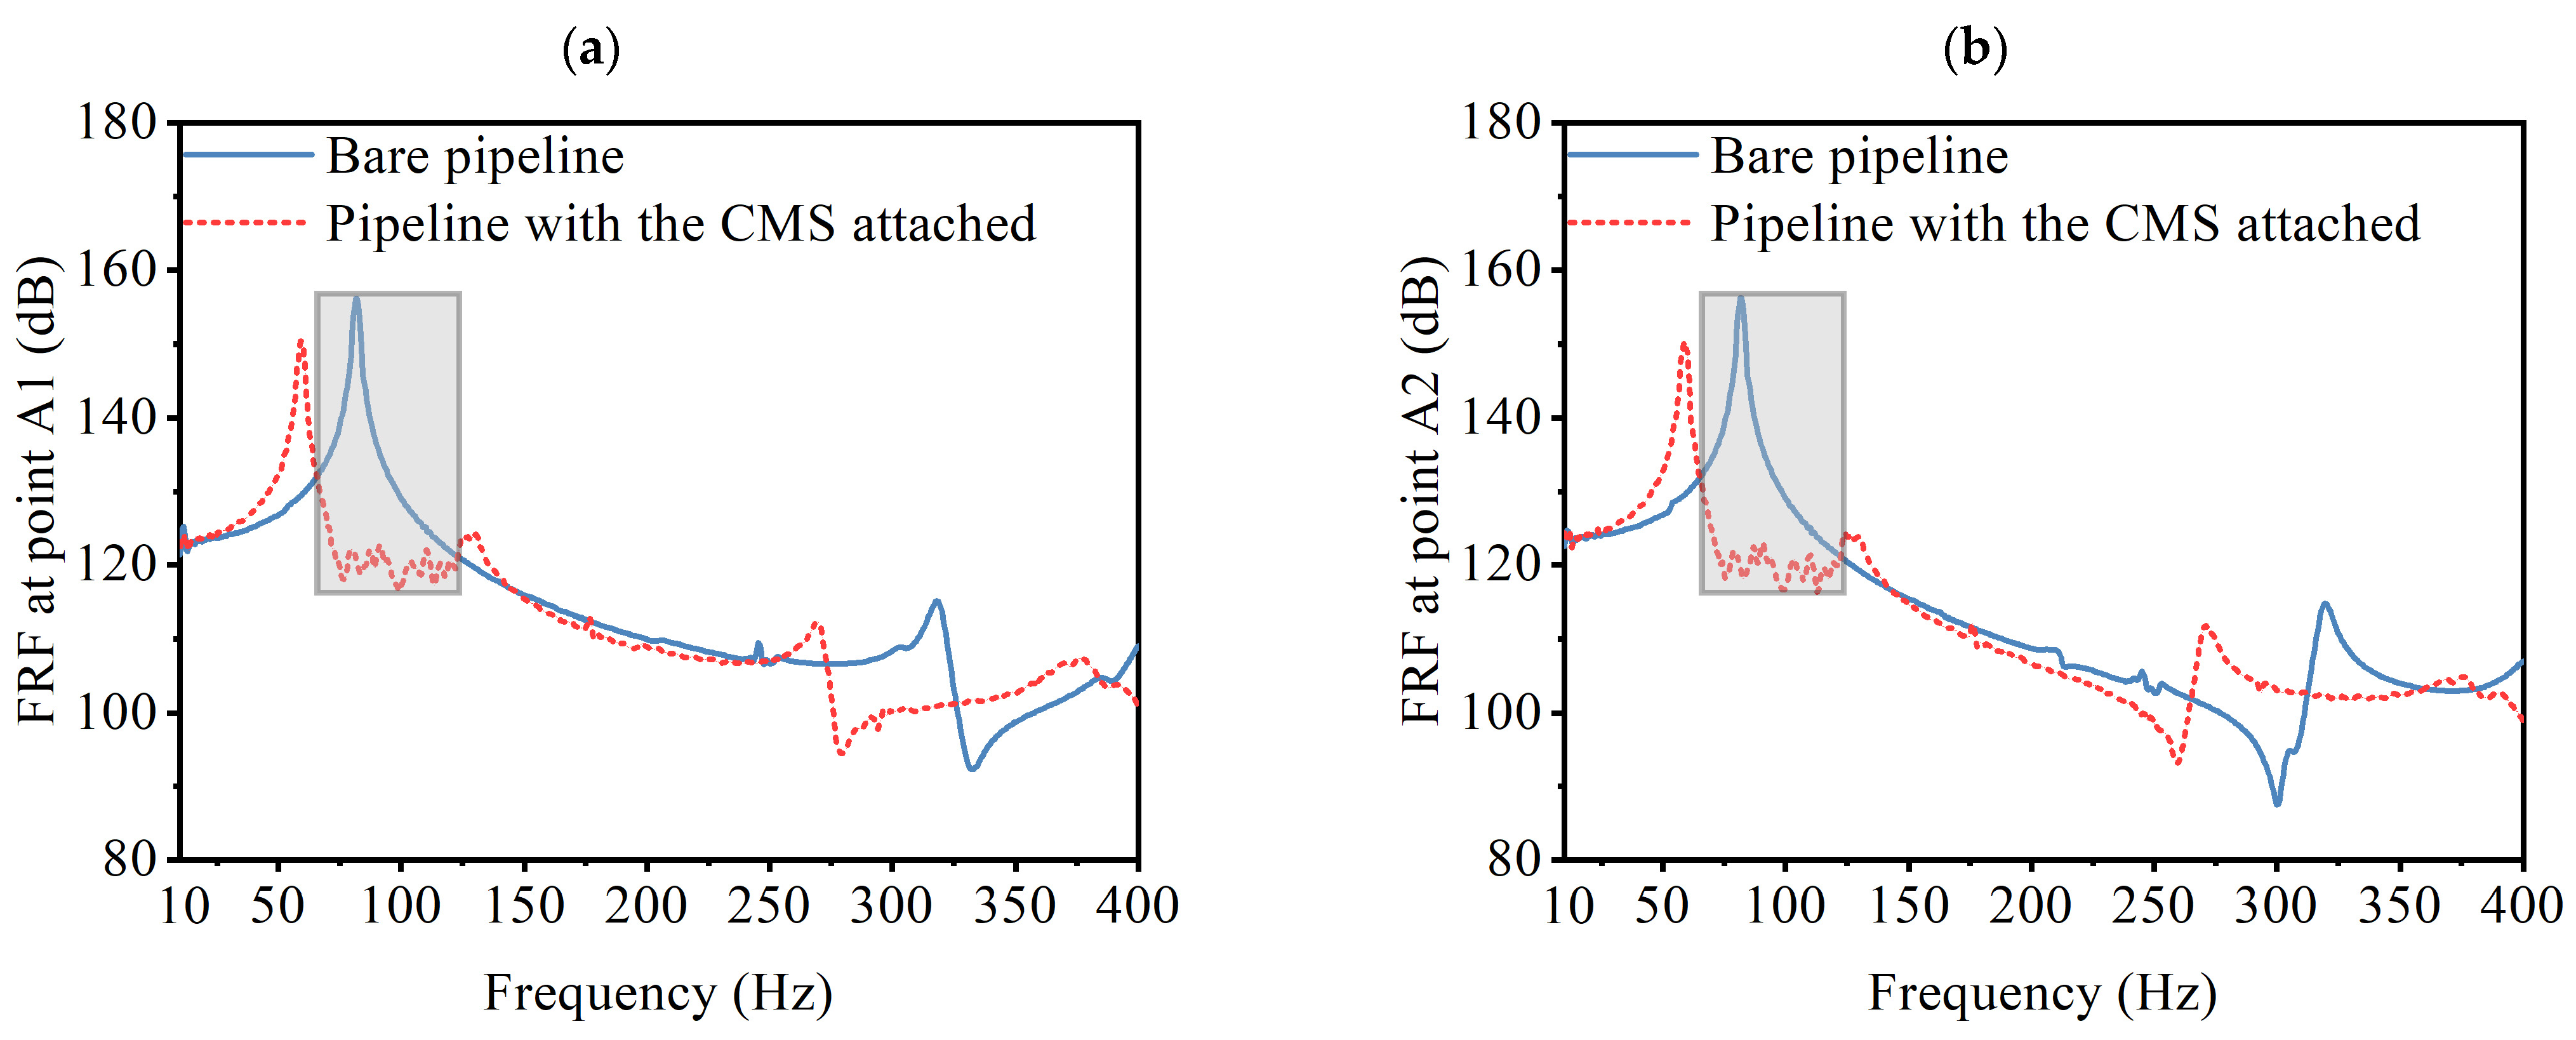
5.2. FRF Test of Pipeline

The pipeline test bench, as depicted in Figure 16a, is fabricated with an outer diameter of 80 mm, a wall thickness of 3 mm, and a length of 1500 mm, constructed from aluminum and possessing a total mass of 2950 g.
Acceleration sensors are positioned at 450 mm from each end of the pipeline (marked as points A1 and A2), while a shaker is mounted at the midpoint of the pipeline (marked as point A3) through an elastic cord. The elastic cord is secured to the portal frame, which in turn is firmly anchored to the ground by means of pressing blocks. The shaker is connected to a force sensor through a screw stem, and the force sensor is fixed to the pipeline. Install one CMS at 300 mm, 600 mm, 900 mm, and 1200 mm along the pipeline, respectively. Figure 16b shows the sample of the CMS. Figure 16c shows the large added mass; the medium and small added masses have similar structures but different sizes, corresponding to the resonant units of different sizes.
The basic mass and added mass of each resonant unit are shown in Table 3, with the values derived from our prior research endeavors. We have demonstrated on a shorter pipeline that the frequency mistuning strength of the resonant units is appropriate under this mass configuration [34]. The mass of the resonant unit for each CMS is about 368.5 g, and the mass of the framework is about 165 g. The total mass of the pipeline and the four frameworks is calculated to be 3610 g, with the total mass of all resonant units constituting 40.8% of this value.
When installing the CMS on the pipeline, additional impedance is introduced, which leads to a decrease in the FRF of the pipeline. Therefore, by measuring the FRF of the pipeline to reflect the impedance of the CMS, the vibration reduction capability of the CMS can be effectively characterized. The FRF test is carried out using an impact hammer, which offers the advantages of simple operation, ease of testing, and flexible excitation position. The frequency analysis range is set to 10–400 Hz, with a frequency resolution of 0.5 Hz. The FRF of the pipeline at points A1 and A2 under vertical impact excitation at point A3 is shown in Figure 17.
It can be seen that the pipeline exhibits a peak at approximately 82 Hz, which corresponds to the vertical bending mode peak. When the CMS is attached, the frequency response characteristics of the original pipeline are altered, resulting in the mode peak shifting toward a lower frequency. We can also see that the FRF of the pipeline is significantly reduced in the frequency range of 65.0–123.5 Hz upon installation of the CMS compared with the bare pipe. The CMS demonstrates a substantial impedance effect, confirming its potential for low-frequency broadband vibration reduction.

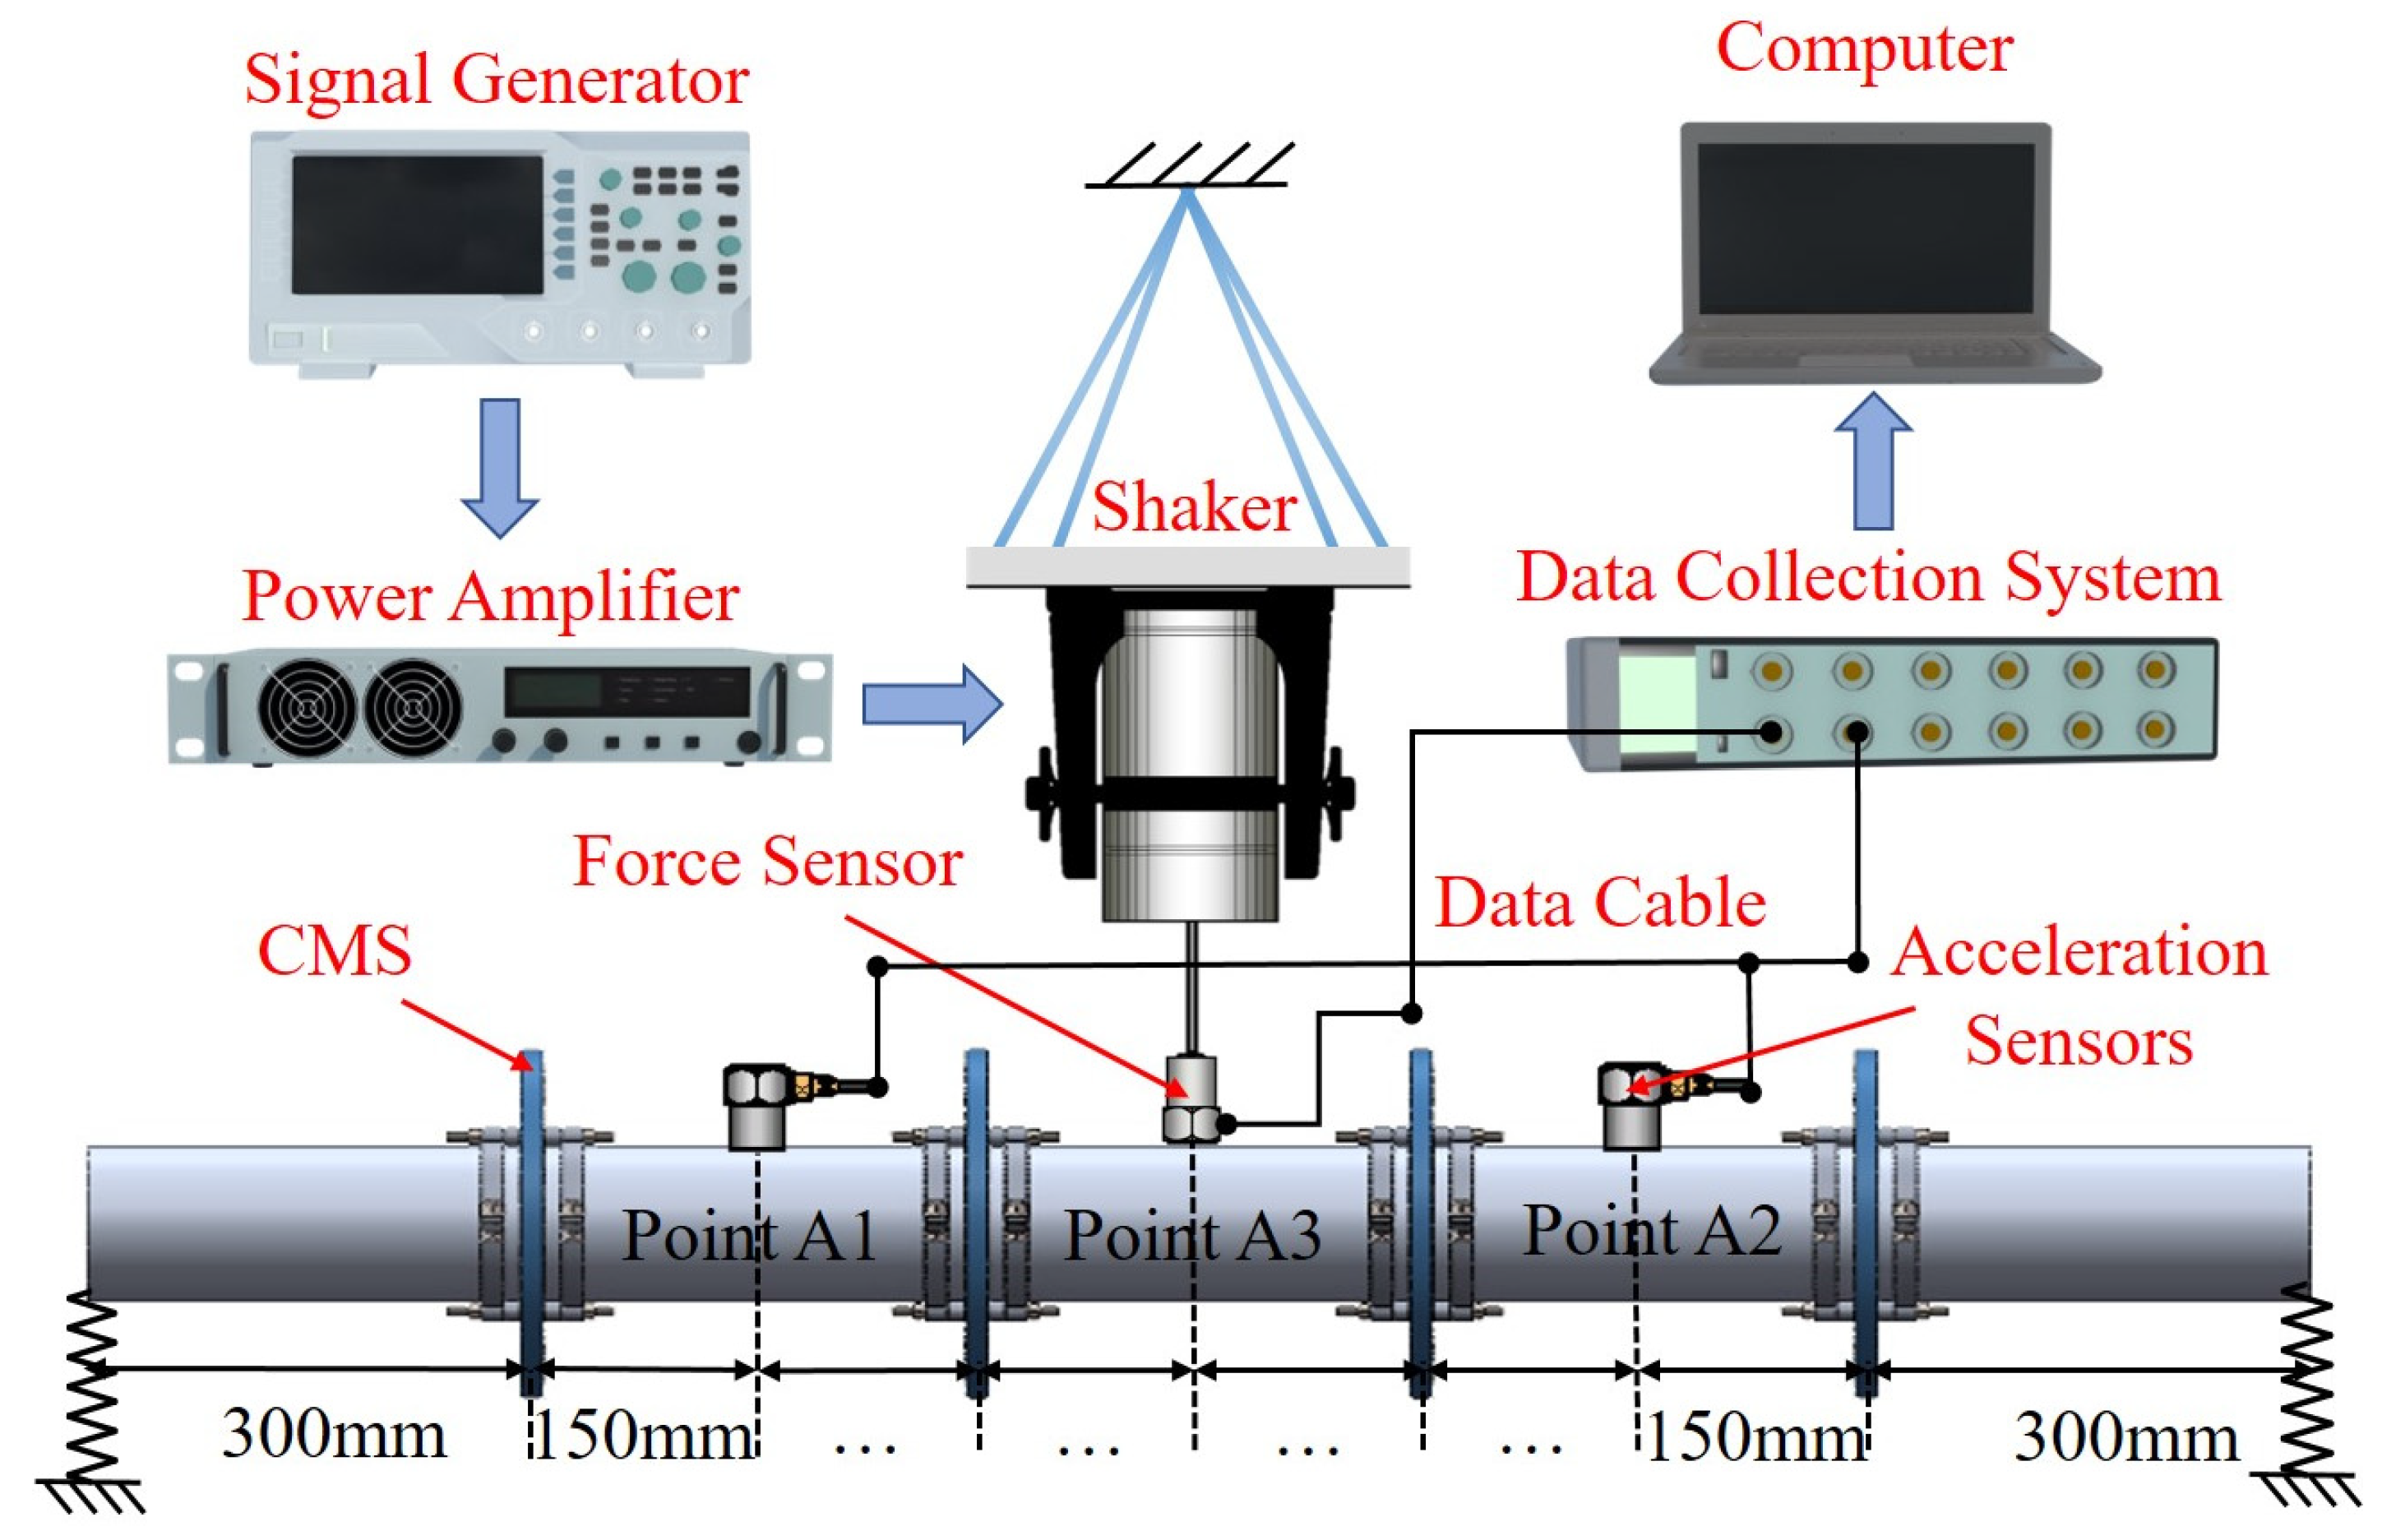
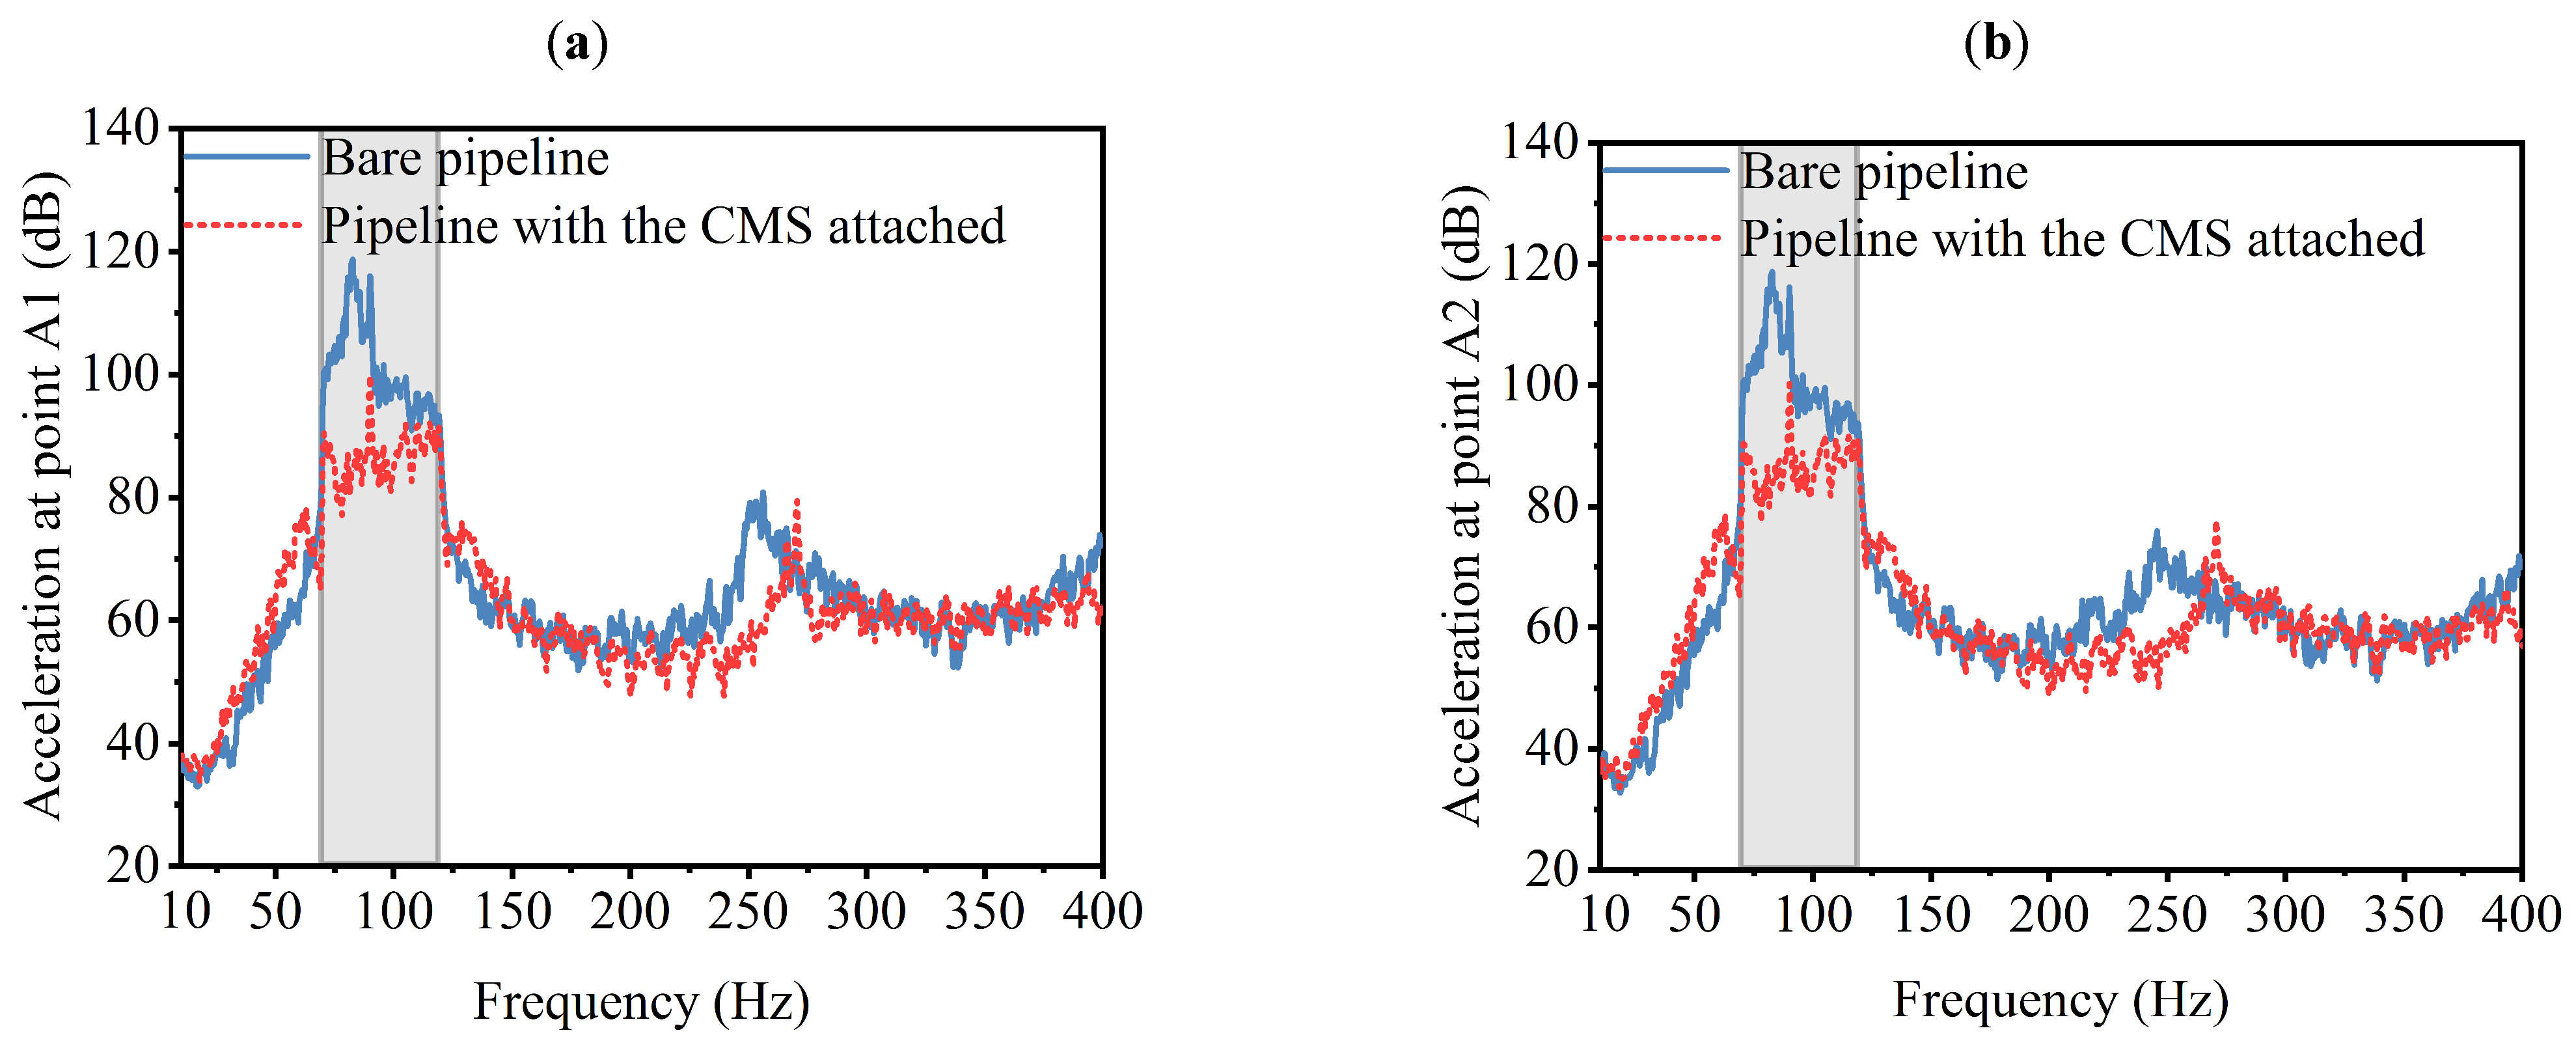
5.3. Excitation Test of Pipeline

To clearly illustrate the outstanding vibration reduction performance of the CMS, an excitation test is carried out on the pipeline. The test flow chart is shown in Figure 18. A signal generator is used to produce the excitation signal, which is then amplified by a power amplifier and transmitted to an electrodynamic shaker. The shaker applies controlled vertical excitation to the midpoint of the pipeline. The dynamic response is acquired by a data acquisition system, which records both the acceleration signals from appropriately positioned sensors and the input force signal. All acquired data are then processed and subsequently analyzed using specialized data analysis software on a computer to extract relevant vibration characteristics.
Establishing excitation conditions with limited white noise superimposed on harmonic excitation can simulate the excitation characteristics of actual pipelines to a certain extent. The harmonic excitation is set with an amplitude of 5.0 N, a frequency of 90 Hz, and a phase angle of 0°. The white noise frequency band ranges from a lower limit of 70 Hz to an upper limit of 120 Hz, with an excitation power spectral density of 1.0 N2/(Hz). Generate normalized complex excitation signals in MATLAB 2020a and input them into the signal generator to drive the shaker to apply vertical excitation to the midpoint of the pipeline. The acceleration responses of the pipeline before and after installing the CMS are shown in Figure 19.
It is evident that under the applied excitation, the bare pipeline produces significant vibrations in the broadband range of 70–120 Hz. At the same time, two prominent vibration line spectra also appear. The line spectrum at 82.5 Hz is caused by the mode resonance of the pipeline, while the line spectrum at 90 Hz is caused by harmonic excitation. After installing the CMS, the broadband acceleration response and multi-frequency line spectrum of the pipeline are significantly reduced.
Calculate the average acceleration at two measurement points and the broadband vibration level. It is crucial to note that data at 90 Hz should be excluded when calculating the broadband vibration level to avoid prominent vibration line spectra having a significant impact. The results indicate that compared with the bare pipeline, the installation of the CMS reduced the acceleration amplitude of the pipeline by 34.7 dB at 82.5 Hz, 16.0 dB at 90 Hz, and 19.8 dB in the broadband vibration level across the 70 Hz to 120 Hz range.

6. Conclusions

In this paper, the vibration localization characteristics of the CMS are investigated by using perturbation analysis. The parameter influence on mode localization and eigenvalue splitting is analyzed, and the influence of the frequency mistuning strength and coupling strength on the vibration reduction performance is summarized. Subsequently, a numerical model is established to validate the theoretical results. The research outcomes indicate that an increase in mistuning strength enhances mode localization and eigenvalue splitting of the CMS. Setting an appropriate mistuning strength is beneficial to broaden the resonant frequency range. An increase in coupling strength will reduce mode localization and lead to an overall elevation of the eigenvalues. When the coupling strength is large, it is not conducive for the CMS to achieve stable broadband vibration reduction performance. Therefore, it is advisable to minimize the coupling strength between resonant units as much as possible.
A pipeline-oriented CMS is proposed, which mainly consists of a framework, resonant units, and a mounting fixture. The framework features a ring-shaped hierarchical honeycomb structure, which can embed three different types of resonant units and has the advantages of small installation size, high integration, and rich frequency regulation characteristics. The FRF test results show that when appropriate mistuning parameters are introduced, the FRF of the pipeline steadily decreases in the broadband range. The excitation test results show that compared with the bare pipeline, the installation of the CMS reduces the acceleration amplitude of the pipeline by 34.7 dB at 82.5 Hz, 16.0 dB at 90 Hz, and 19.8 dB in the broadband vibration level across the 70 Hz to 120 Hz range. The pipeline-oriented CMS exhibits favorable low-frequency broadband vibration reduction capability.

Author Contributions

L.Y.: Conceptualization, data curation, visualization, writing—original draft. W.X.: Conceptualization, investigation, writing—review and editing. J.Z.: Software, writing—review and editing. S.L.: Conceptualization, methodology, writing—review and editing. L.X.: Writing—review and editing. All authors have read and agreed to the published version of the manuscript.

Funding

The authors are grateful for the Independent Research Project of the High-Level Scientific and Technological Innovation Talent Program (Number: 202417F010).

Data Availability Statement

The data that support the findings of this study are available from the corresponding author upon reasonable request.

Conflicts of Interest

The authors declare that they have no conflicts of interest.

Nomenclature

Abbreviation Δ f m n Main frequency mistuning
CMSCyclic mistuned structure Δ f c n Coupled frequency mistuning
FRFFrequency response function R 2 Coupling strength
MFCsMacro-fiber composites ε Frequency mistuning strength
LQRLinear-Quadratic Regulator Δ f ¯ Average frequency mistuning
PIDProportional Integral Derivative ω Circular frequency of the excitation
DVADynamic vibration absorber U n Complex amplitude of the n-th resonant unit
MDVAsMultiple dynamic vibration absorbers λ Dimensionless eigenvalue
CTSCyclic tuned structureIUnit matrix
Main Symbol Explanation U Displacement vector
k m Stiffness of the main springACoefficient matrix
c m Damping coefficient of the main spring A 0 Base system matrix
k c Stiffness of the coupling spring Δ A 1 Perturbation matrix
c c Damping coefficient of the coupling spring U n Eigenvector of the n-th resonant unit
NTotal number of the resonant units λ n Dimensionless eigenvalue of the n-th resonant unit
nSerial number of the resonant unit δ 0 U n Unperturbed eigenvector of the n-th resonant unit
u n Displacement of the n-th resonant unit δ 0 λ n Unperturbed eigenvalue of the n-th resonant unit
ω m n Main frequency of the n-th resonant unit when the structure is mistuned δ 1 U n First-order perturbation eigenvector of the n-th resonant unit
ω c n Coupled frequency of the n-th resonant unit when the structure is mistuned δ 1 λ n First-order perturbation eigenvalue of the n-th resonant unit
m n Mass of the n-th resonant unit δ 2 U n Second-order perturbation eigenvector of the n-th resonant unit
ω m Standard main frequency of the n-th resonant unit when the structure is tuned δ 2 λ n Second-order perturbation eigenvalue of the n-th resonant unit
ω c Standard coupled frequency of the n-th resonant unit when the structure is tuned

References

  1. Liang, X.; Zha, X.; Jiang, X.; Wang, L.; Leng, J.; Cao, Z. Semi-analytical solution for dynamic behavior of a fluid-conveying pipe with different boundary conditions. Ocean Eng. 2018, 163, 183–190. [Google Scholar] [CrossRef]
  2. Païdoussis, M.P. Pipes conveying fluid: A fertile dynamics problem. J. Fluids Struct. 2022, 114, 103664. [Google Scholar] [CrossRef]
  3. Ding, H.; Ji, J.; Chen, L. Nonlinear vibration isolation for fluid-conveying pipes using quasi-zero stiffness characteristics. Mech. Syst. Signal. Process 2019, 121, 675–688. [Google Scholar] [CrossRef]
  4. Ji, W.; Sun, W.; Ma, H.; Li, J. Dynamic modeling and analysis of fluid-delivering cracked pipeline considering breathing effect. Int. J. Mech. Sci. 2024, 264, 108805. [Google Scholar] [CrossRef]
  5. Gao, P.; Li, J.; Zhai, J.; Tao, Y.; Han, Q. A novel optimization layout method for clamps in a pipeline system. Appl. Sci. 2020, 10, 390. [Google Scholar] [CrossRef]
  6. Cho, S.G.; Furuya, O.; Kurabayashi, H. Enhancement of seismic resilience of piping systems in nuclear power plants using steel coil damper. Nucl. Eng. Des. 2019, 350, 147–157. [Google Scholar] [CrossRef]
  7. Wang, B.; Wang, H.; He, Z.; Liu, D.; Pan, P. Test and analysis of multi-cavity particle damper for vertical vibration control of pipeline structures. Eng. Struct. 2023, 281, 115744. [Google Scholar] [CrossRef]
  8. Wen, Z.; Wang, J.; Yang, S.; Jiang, H.; Wang, J.; Chen, X.; Chen, K.; Zhu, W.; Wu, C. Study on the vibration characteristics of flexible dampers in finite single-coupled pipelines. Ocean Eng. 2025, 325, 120802. [Google Scholar] [CrossRef]
  9. Bi, K.; Hao, H. Numerical simulation on the effectiveness of using viscoelastic materials to mitigate seismic induced vibrations of above-ground pipelines. Eng. Struct. 2016, 123, 1–14. [Google Scholar] [CrossRef]
  10. Blocka, C.; Engelhardta, J.; Henkela, F.O. Active control of vibrations in piping systems. In Proceedings of the 20th International Conference on Structural Mechanics in Reactor Technology (SMiRT 20), Espoo, Finland, 9–14 August 2009. [Google Scholar]
  11. Zhang, Y.; Sun, W.; Zhang, H.; Du, D.; Xu, K. Active vibration control of fluid-conveying pipelines: Theoretical and experimental studies. Int. J. Mech. Sci. 2024, 270, 109106. [Google Scholar] [CrossRef]
  12. Zhang, S.; Liu, L.; Zhang, X.; Zhou, Y.; Yang, Q. Active vibration control for ship pipeline system based on PI-LQR state feedback. Ocean Eng. 2024, 310, 118559. [Google Scholar] [CrossRef]
  13. Yang, F.; Esmailzadeh, E.; Sedaghati, R. Optimal vibration control of beam-type structures using multiple-tuned-mass-dampers. Proc. Inst. Mech. Eng. Part K J. Multi-Body Dyn. 2009, 224, 191–202. [Google Scholar] [CrossRef]
  14. Kwag, S.; Kwak, J.; Lee, H.; Oh, J.; Koo, G.-H. Enhancement in the Seismic Performance of a Nuclear Piping System using Multiple Tuned Mass Dampers. Energies 2019, 12, 2077. [Google Scholar] [CrossRef]
  15. Wang, X.; Pang, Y.; Wu, J.H.; Ma, F. A broadband metamaterial damper design based on synergetic coupling among multi-cells. Appl. Acoust. 2023, 206, 109303. [Google Scholar] [CrossRef]
  16. Huang, Y.; Li, J.; Chen, W.; Bao, R. Tunable bandgaps in soft phononic plates with spring-mass-like resonators. Int. J. Mech. Sci. 2019, 151, 300–313. [Google Scholar] [CrossRef]
  17. Jiang, W.; Yin, M.; Liao, Q.; Xie, L.; Yin, G. Three-dimensional single-phase elastic metamaterial for low-frequency and broadband vibration mitigation. Int. J. Mech. Sci. 2021, 190, 106023. [Google Scholar] [CrossRef]
  18. Shen, M.; Yang, J.; Yang, D.; Yang, X.; Qian, Y. Vibration control in bolted joints with locally resonant metamaterials. Int. J. Mech. Sci. 2025, 287, 109999. [Google Scholar] [CrossRef]
  19. Pires, F.A.; Boukadia, R.F.; Wandel, M.; Thomas, C.; Deckers, E.; Desmet, W.; Claeys, C. Novel resonator concept for improved performance of locally resonant based metamaterials. Thin-Walled Struct. 2025, 209, 112866. [Google Scholar] [CrossRef]
  20. Gomes, C.B.F.; dos Santos, M.C.P.; Araújo, B.C.C.; Pereira, F.N.; Nobrega, E.D.; Dos Santos, J.M.C.; Miranda, E.J.P., Jr.; Sinatora, A. Wave and vibration attenuation in graded elastic metamaterial beams with local resonators. Int. J. Mech. Sci. 2025, 293, 110125. [Google Scholar] [CrossRef]
  21. Poggetto, V.F.D.; Serpa, A.L. Elastic wave band gaps in a three-dimensional periodic metamaterial using the plane wave expansion method. Int. J. Mech. Sci. 2020, 184, 105841. [Google Scholar] [CrossRef]
  22. Nateghi, A.; Sangiuliano, L.; Claeys, C.; Deckers, E.; Pluymers, B.; Desmet, W. Design and experimental validation of a metamaterial solution for improved noise and vibration behavior of pipes. J. Sound Vib. 2019, 455, 96–117. [Google Scholar] [CrossRef]
  23. Wen, J.; Wang, G.; Wen, X.; Xiao, Y. Theoretical and experimental study of locally resonant and bragg band gaps in flexural beams carrying periodic arrays of beam-like resonators. J. Vib. Acoust. 2013, 135, 041006. [Google Scholar] [CrossRef]
  24. Yao, D.; Xiong, M.; Luo, J.; Yao, L. Flexural wave mitigation in metamaterial cylindrical curved shells with periodic graded arrays of multi-resonator. Mech. Syst. Signal Process. 2022, 168, 108721. [Google Scholar] [CrossRef]
  25. Liu, Z.; Liu, W.; Gao, W.; Cheng, X. Advances of research on mode localization in mistuned cyclically periodic structures. Appl. Mech. Mater. 2013, 405–408, 3198–3203. [Google Scholar] [CrossRef]
  26. Wang, J.; Li, Q.; Zhu, Z. Vibratory localization of mistuned bladed disk assemblies—A review. Adv. Mech. 2000, 30, 517–528. [Google Scholar]
  27. Corral, R.; Khemiri, O.; Martel, C. Design of mistuning patterns to control the vibration amplitude of unstable rotor blades. Aerosp. Sci. Technol. 2018, 80, 20–28. [Google Scholar] [CrossRef]
  28. Bai, B.; Xiang, L.; Li, X. Probabilistic analysis-based vibration characteristics of intentionally mistuned blisk. Probabilistic Eng. Mech. 2022, 67, 103195. [Google Scholar] [CrossRef]
  29. Li, F.; Wang, Y. Study on wave localization in disordered periodic layered piezoelectric composite structures. Int. J. Solids Struct. 2005, 42, 6457–6474. [Google Scholar] [CrossRef]
  30. Zhao, T.; Yang, Z.; Xu, Y.; Tian, W. Mode localization in metastructure with T-type resonators for broadband vibration suppression. Eng. Struct. 2022, 268, 114775. [Google Scholar] [CrossRef]
  31. Wei, S.T.; Pierre, C. Localization phenomena in mistuned assemblies with cyclic symmetry part I: Free vibrations. J. Vib. Acoust. 1988, 110, 429–438. [Google Scholar] [CrossRef]
  32. Bendiksen, O.O. Mode localization phenomena in large space structures. AIAA J. 1987, 25, 1241–1248. [Google Scholar] [CrossRef]
  33. Pierre, C.; Dowell, E.H. Localization of vibrations by structural irregularity. J. Sound Vib. 1987, 114, 549–564. [Google Scholar] [CrossRef]
  34. Yin, L.; Xu, W.; Fu, J.; Cheng, G. Multi-directional broadband vibration control of marine pipe systems using mistuned cyclic symmetric structure as dynamic vibration absorbers. Ocean Eng. 2025, 320, 120272. [Google Scholar] [CrossRef]
Figure 1. Spring-oscillators model with a cyclic distribution.
Applsci 15 06852 g001
Figure 2. Mode shapes of the CTS.
Applsci 15 06852 g002
Figure 3. Mode shapes for different mistuning strengths.
Applsci 15 06852 g003
Figure 4. Mode shapes for different coupling strengths.
Applsci 15 06852 g004
Figure 5. Eigenvalues for different mistuning strengths.
Applsci 15 06852 g005
Figure 6. Eigenvalues for different coupling strengths.
Applsci 15 06852 g006
Figure 7. Numerical model of uncoupled spring oscillators.
Applsci 15 06852 g007
Figure 8. Numerical model of coupled spring oscillators.
Applsci 15 06852 g008
Figure 9. Numerical analysis flowchart.
Applsci 15 06852 g009
Figure 10. Numerical results of mode shapes of the CTS.
Applsci 15 06852 g010
Figure 11. Numerical results of mode shapes for different mistuning strengths.
Applsci 15 06852 g011
Figure 12. Numerical results of mode shapes for different coupling strengths.
Applsci 15 06852 g012
Figure 13. Numerical results of eigenvalues for different mistuning strengths.
Applsci 15 06852 g013
Figure 14. Numerical results of eigenvalues for different coupling strengths.
Applsci 15 06852 g014
Figure 15. Structural model of the pipeline-oriented CMS.
Applsci 15 06852 g015
Figure 16. Pipeline test bench and CMS sample. (a) Pipeline test bench. (b) CMS sample. (c) Large added mass.
Applsci 15 06852 g016
Figure 17. Test results of the FRF of the pipeline. (a) Point A1. (b) Point A2.
Applsci 15 06852 g017
Figure 18. Flow chart of the excitation test.
Applsci 15 06852 g018
Figure 19. Acceleration response of the pipeline under complex excitation. (a) Point A1. (b) Point A2.
Applsci 15 06852 g019
Table 1. Different mistuning strengths of the resonant units.
ExampleRange (g)Interval (g)Mistuning Strength  ε  (%)
E116.1~17.90.23.6
E215.2~18.80.47.2
E314.3~19.70.610.9
E413.4~20.60.814.8
Table 2. The core parameters of the pipeline-oriented CMS.
Parameters R 1 r 1 r 2 r 3 h 1 h 2 h 3 H
Value (mm)Large8.58.54.54.522.4110
Medium884422110
Small7.57.53.53.521.6110
Table 3. Mass setting of the resonant units.
Type of Resonant UnitBasic Mass (g)Added Mass (g)
Large12.22.0 (3); 4.0 (3); 6.0 (2); 8.0 (2)
Medium9.70.6 (3); 1.8 (3); 3.0 (2); 4.2 (2)
Small7.40 (4); 0.88 (3); 1.76 (3)
The number of the resonant units at a given added mass is in italics.
Disclaimer/Publisher’s Note: The statements, opinions and data contained in all publications are solely those of the individual author(s) and contributor(s) and not of MDPI and/or the editor(s). MDPI and/or the editor(s) disclaim responsibility for any injury to people or property resulting from any ideas, methods, instructions or products referred to in the content.

