Article

Identification of Torsional Fatigue Properties of Titanium Alloy Turned Surfaces and Their Distribution Characteristics

School of Mechanical and Power Engineering, Harbin University of Science and Technology, West Campus, Harbin 150080, China
*
Author to whom correspondence should be addressed.
Appl. Sci. 2025, 15(12), 6767; https://doi.org/10.3390/app15126767
Submission received: 21 May 2025 / Revised: 12 June 2025 / Accepted: 13 June 2025 / Published: 16 June 2025
(This article belongs to the Section Mechanical Engineering)

Abstract

:
The intricate and dynamic cutting behavior observed in titanium alloy turning leads to non-uniform surface and subsurface properties in the workpiece, impacting torsional strength and fatigue life. A transient pose model, founded on the configuration of a turning tool, is developed to elucidate the evolution of the transition surface during transient turning. Through finite element simulation, the plastic deformation, residual stress, and work hardening rate of the machined surface and subsurface of a titanium alloy are quantitatively examined. The torsional strength and fatigue life calculation method is developed based on initial performance parameters derived from the finite element model. This method enables the correlation identification between surface morphology characteristics, surface and subsurface performance parameters, and fatigue properties. Surface morphology, scanning electron microscopy (SEM), and energy-dispersive X-ray spectroscopy (EDS) are employed to quantitatively analyze the surface features and elemental composition of the titanium alloy turning surface, unveiling their influence on torsional fatigue properties. The findings demonstrate the efficacy of the proposed models and methodologies in identifying the torsional fatigue properties and their distribution patterns of titanium alloy turning surfaces.

1. Introduction

TC6 has emerged as a primary material for aero-engine hubs owing to its exceptional corrosion and fatigue resistance, high specific strength, and favorable ductility. The operational reliability, particularly the fatigue performance, of the hub is significantly impacted by the quality of the machined surface. During the high-efficiency turning of titanium alloys, the non-linear contact dynamics at the cutting interface, the intricate multi-field coupling in the cutting deformation zone, and the instantaneous state parameters of the machined surface layer undergo variations due to time-varying factors such as process system vibrations, tool degradation, and cutting load fluctuations induced by sawtooth chips. These variations contribute to the ambiguity and uncertainty in the distribution characteristics of the machined surface’s morphology, microstructure, residual stress layer, hardening layer, and plastic strain layer of titanium alloys. Detecting the uneven distribution and potential damage of the machined surface of titanium alloys poses challenges, directly impacting the assessment of the torsional fatigue resistance of the machined surface of titanium alloys.
Most of the research on titanium alloy turning surfaces focus on the influence of a single process parameter on a certain index of surface integrity or improving surface properties through a post-treatment process. However, there is still a lack of systematic research on the identification and regulation of the spatial heterogeneity of surface integrity parameters induced by dynamic factors and their potential damage. Most of the existing evaluation systems are based on a macro-average index, which makes it difficult to reveal the correlation between local parameter fluctuation and fatigue crack initiation and propagation. In addition, the existing models still have some limitations on the dynamic evolution of surface integrity parameter distribution under complex conditions such as variable parameter cutting. Zhou et al. [1] showed that radial vibration has a stronger degradation effect on surface morphology than axial and tangential vibration in the turning process because it directly changes the thickness of the cutting layer and the instantaneous cutting amount of the tool, resulting in increased surface waviness and periodic grooves. Wang et al. [2] found that cutting fluid penetration and lubricating film formation can reduce tool-workpiece interface friction and weaken the negative effect of vibration on surface morphology, but vibration can still induce subsurface microstructure evolution through periodic load fluctuations. Tepla T et al. [3] studied a machine learning-based selection method for medical biocompatible titanium alloys. This method can effectively reduce the time, material, and labor costs required for the study of titanium alloy properties and is suitable for material screening of biocompatible medical devices. Pimenov et al. [4] discuss advances in research to improve surface integrity in aluminum alloy machining by improving cutting parameters, tool materials, and coolant application. Singh [5] reveals the correlation between surface integrity and machining parameters in thin structure machining through experiments. Guo et al. [6] revealed the surface quality control mechanism of high-speed grinding aluminum/silicon carbide composites. Chen et al. [7] investigated the effects of cutting parameters and cooling strategies on the machined surface integrity of Ti-6Al-4V. Li et al. [8] further demonstrated the critical role of milling stability on surface integrity and fatigue properties.
In that aspect of the influence of cut parameters on the fatigue resistance of titanium alloy machined surface, Yang Shenliang, Li Xun et al. [9] took Ti-6Al-4V titanium alloy as experimental material, based on the single variable control strategy, and used the research method of combining the circumferential milling process with the durability evaluation of the specimen, systematically exploring the correlation mechanism between the multi-dimensional characteristics of machined surface and the fatigue resistance of materials by cutting parameter optimization. Shen Haolun et al. [10] studied the effect of feed rate on fatigue life in titanium alloy machining. By changing the feed rate, titanium alloy (Ti-6Al-4V) was machined with a single-factor Scheme, and the morphological characteristics of the machined surface under different feed rate conditions were observed. High-cycle fatigue tests were carried out for samples machined with different feed rates, and the effect of feed rates on high-cycle fatigue life was discussed. Zhao Wenshuo et al. [11] found that in FGH96 superalloy turning, the fatigue life of the tool wear VB ≤ 0.15 mm decreased slightly, and it decreased sharply after exceeding it, so it was necessary to control the wear amount. Jiang [12] pointed out that in turning, increasing the thickness of the TiAlN coating can reduce the surface tensile residual stress and improve the low-cycle fatigue life. The 3 μm coating can increase the life linearly by 15.6%. Comparing turning with grinding, Wan [13] found that the surface compressive residual stress, microhardness, and fatigue life of finish turning samples were higher than those of grinding samples. Lai et al. [14] study of TC17 titanium alloy shows that feed rate has the greatest effect on surface residual compressive stress and roughness, the former improves fatigue life, and the latter linearly decreases it. Dan [15] further reveals that feed has the most significant effect on fatigue life in TC17 turning, and cracks mostly originate from the surface, so it is necessary to optimize turning parameters to improve surface integrity. Wang [16] found that large tip radius, sharp cutting edge, and low feed speed can make polycrystalline copper amorphous and lattice transformation in diamond turning and obtain an ultra-smooth and ultra-hard surface. Imran [17] found that the surface quality of low carbon steel can be improved with the increase in cutting speed, deteriorated with the increase in feed rate and cutting depth, and the surface quality is the worst in the late stage of tool wear. Gaurav [18] pointed out that the tool flank wear and cutting speed increase will reduce the EN31 steel hard turning subsurface stress distribution compressibility, residual stress, and tool wear, where white layer thickness is highly correlated. Xia et al. [19,20] pointed out that residual stress is caused by surface thermal gradient or plastic deformation difference, which directly affects the service performance of materials. Liu et al. [21] found that the non-uniform distribution of surface integrity significantly accelerates stress corrosion cracking initiation. Yue et al. [22] further showed that the dynamic state parameters, such as residual stress and strain in the surface layer/subsurface layer, showed significant variability in multiple cutting strategies.
In essence, both national and international researchers have conducted comprehensive investigations on the surface integrity and fatigue characteristics of titanium alloy turning surfaces. These studies have focused on regulating processing parameters and examining the effects of vibration and interface conditions, thereby establishing a groundwork for assessing the fatigue properties of such surfaces. Nevertheless, ensuring the precise identification of fatigue properties for titanium alloy turning surfaces proves challenging due to intricate factors like surface morphology and the non-uniform distribution of subsurface property parameters. Hence, there is a critical need to explore the spatial distribution of surface integrity parameters and their impact on fatigue performance under dynamic circumstances.
This study presents a refined model of titanium alloy turning surface topography, which is developed through adjustments informed by experimental outcomes. Utilizing finite element simulation data, the spatial distribution of subsurface performance parameters is delineated. By integrating the revised machined surface morphology and the computed subsurface performance parameters, a torsional finite element model of a titanium alloy workpiece with initial performance parameters is constructed. This model aims to elucidate the torsional strength and fatigue life of the titanium alloy workpiece across various conditions. The investigation delves into the response characteristics and distribution profiles of torsional fatigue properties of the titanium alloy by manipulating cutting parameters, followed by experimental validation.

2. Characterization of Surface Structure and Properties of Titanium Alloy Turning Operations

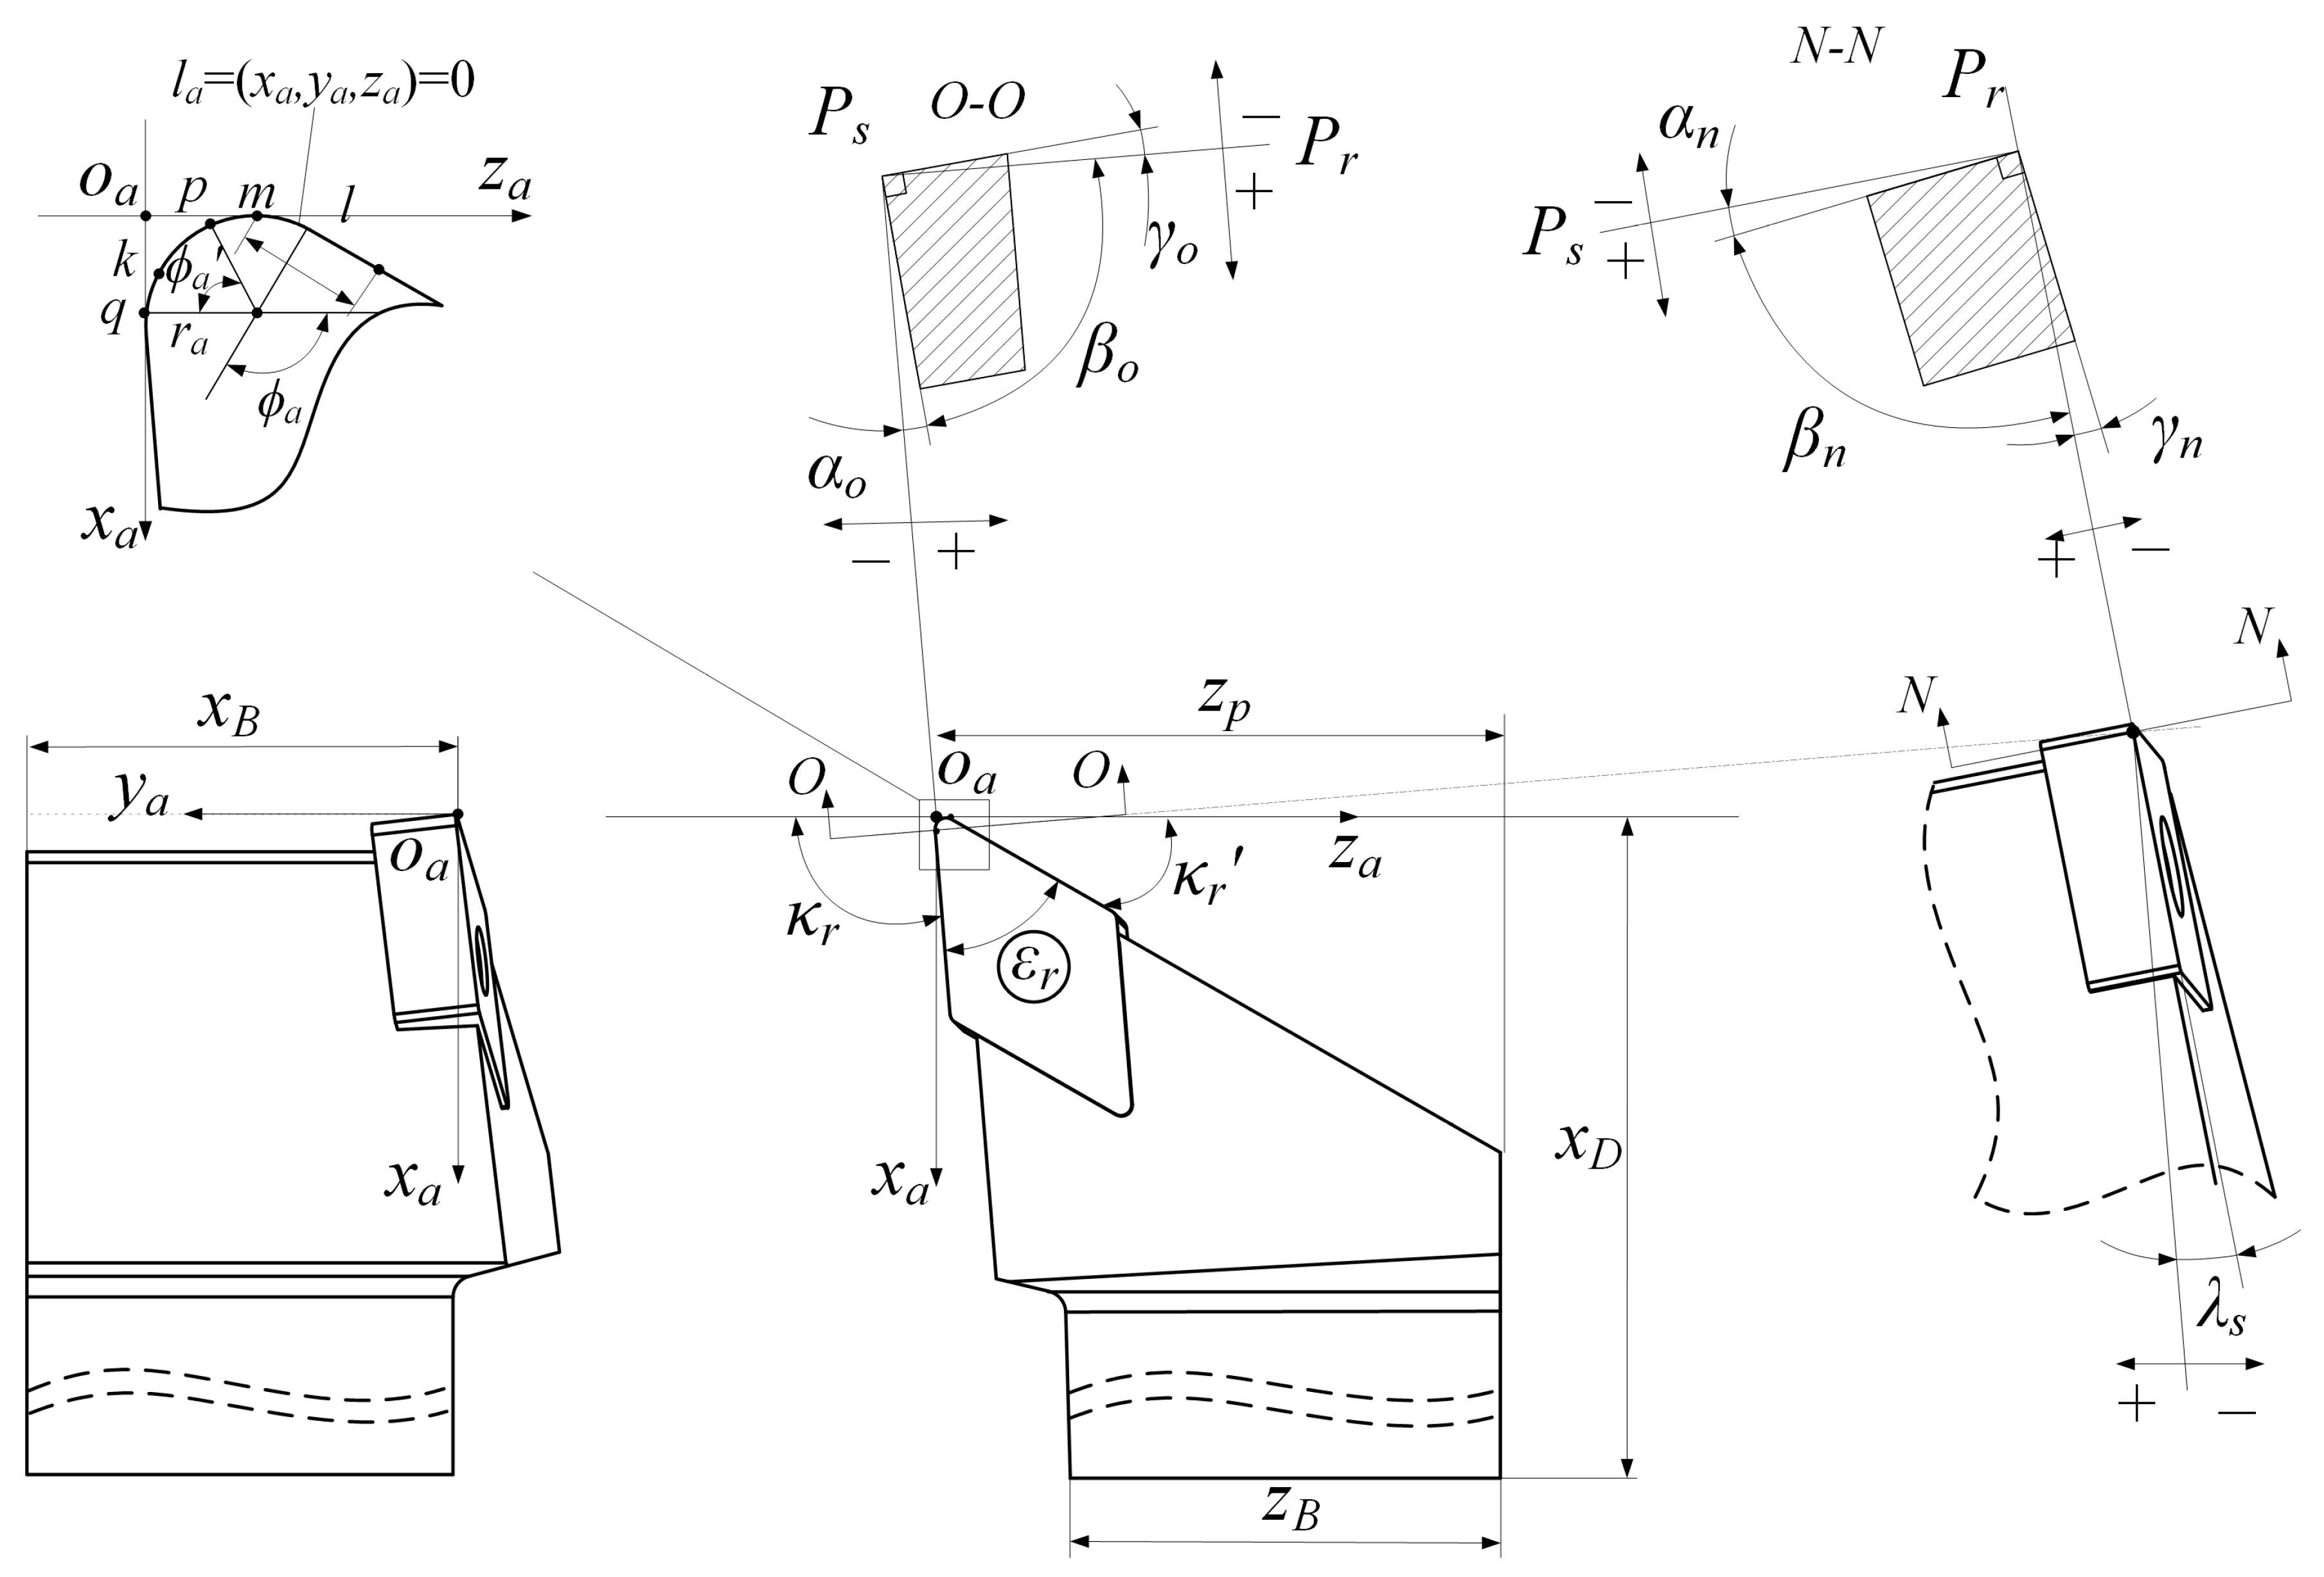
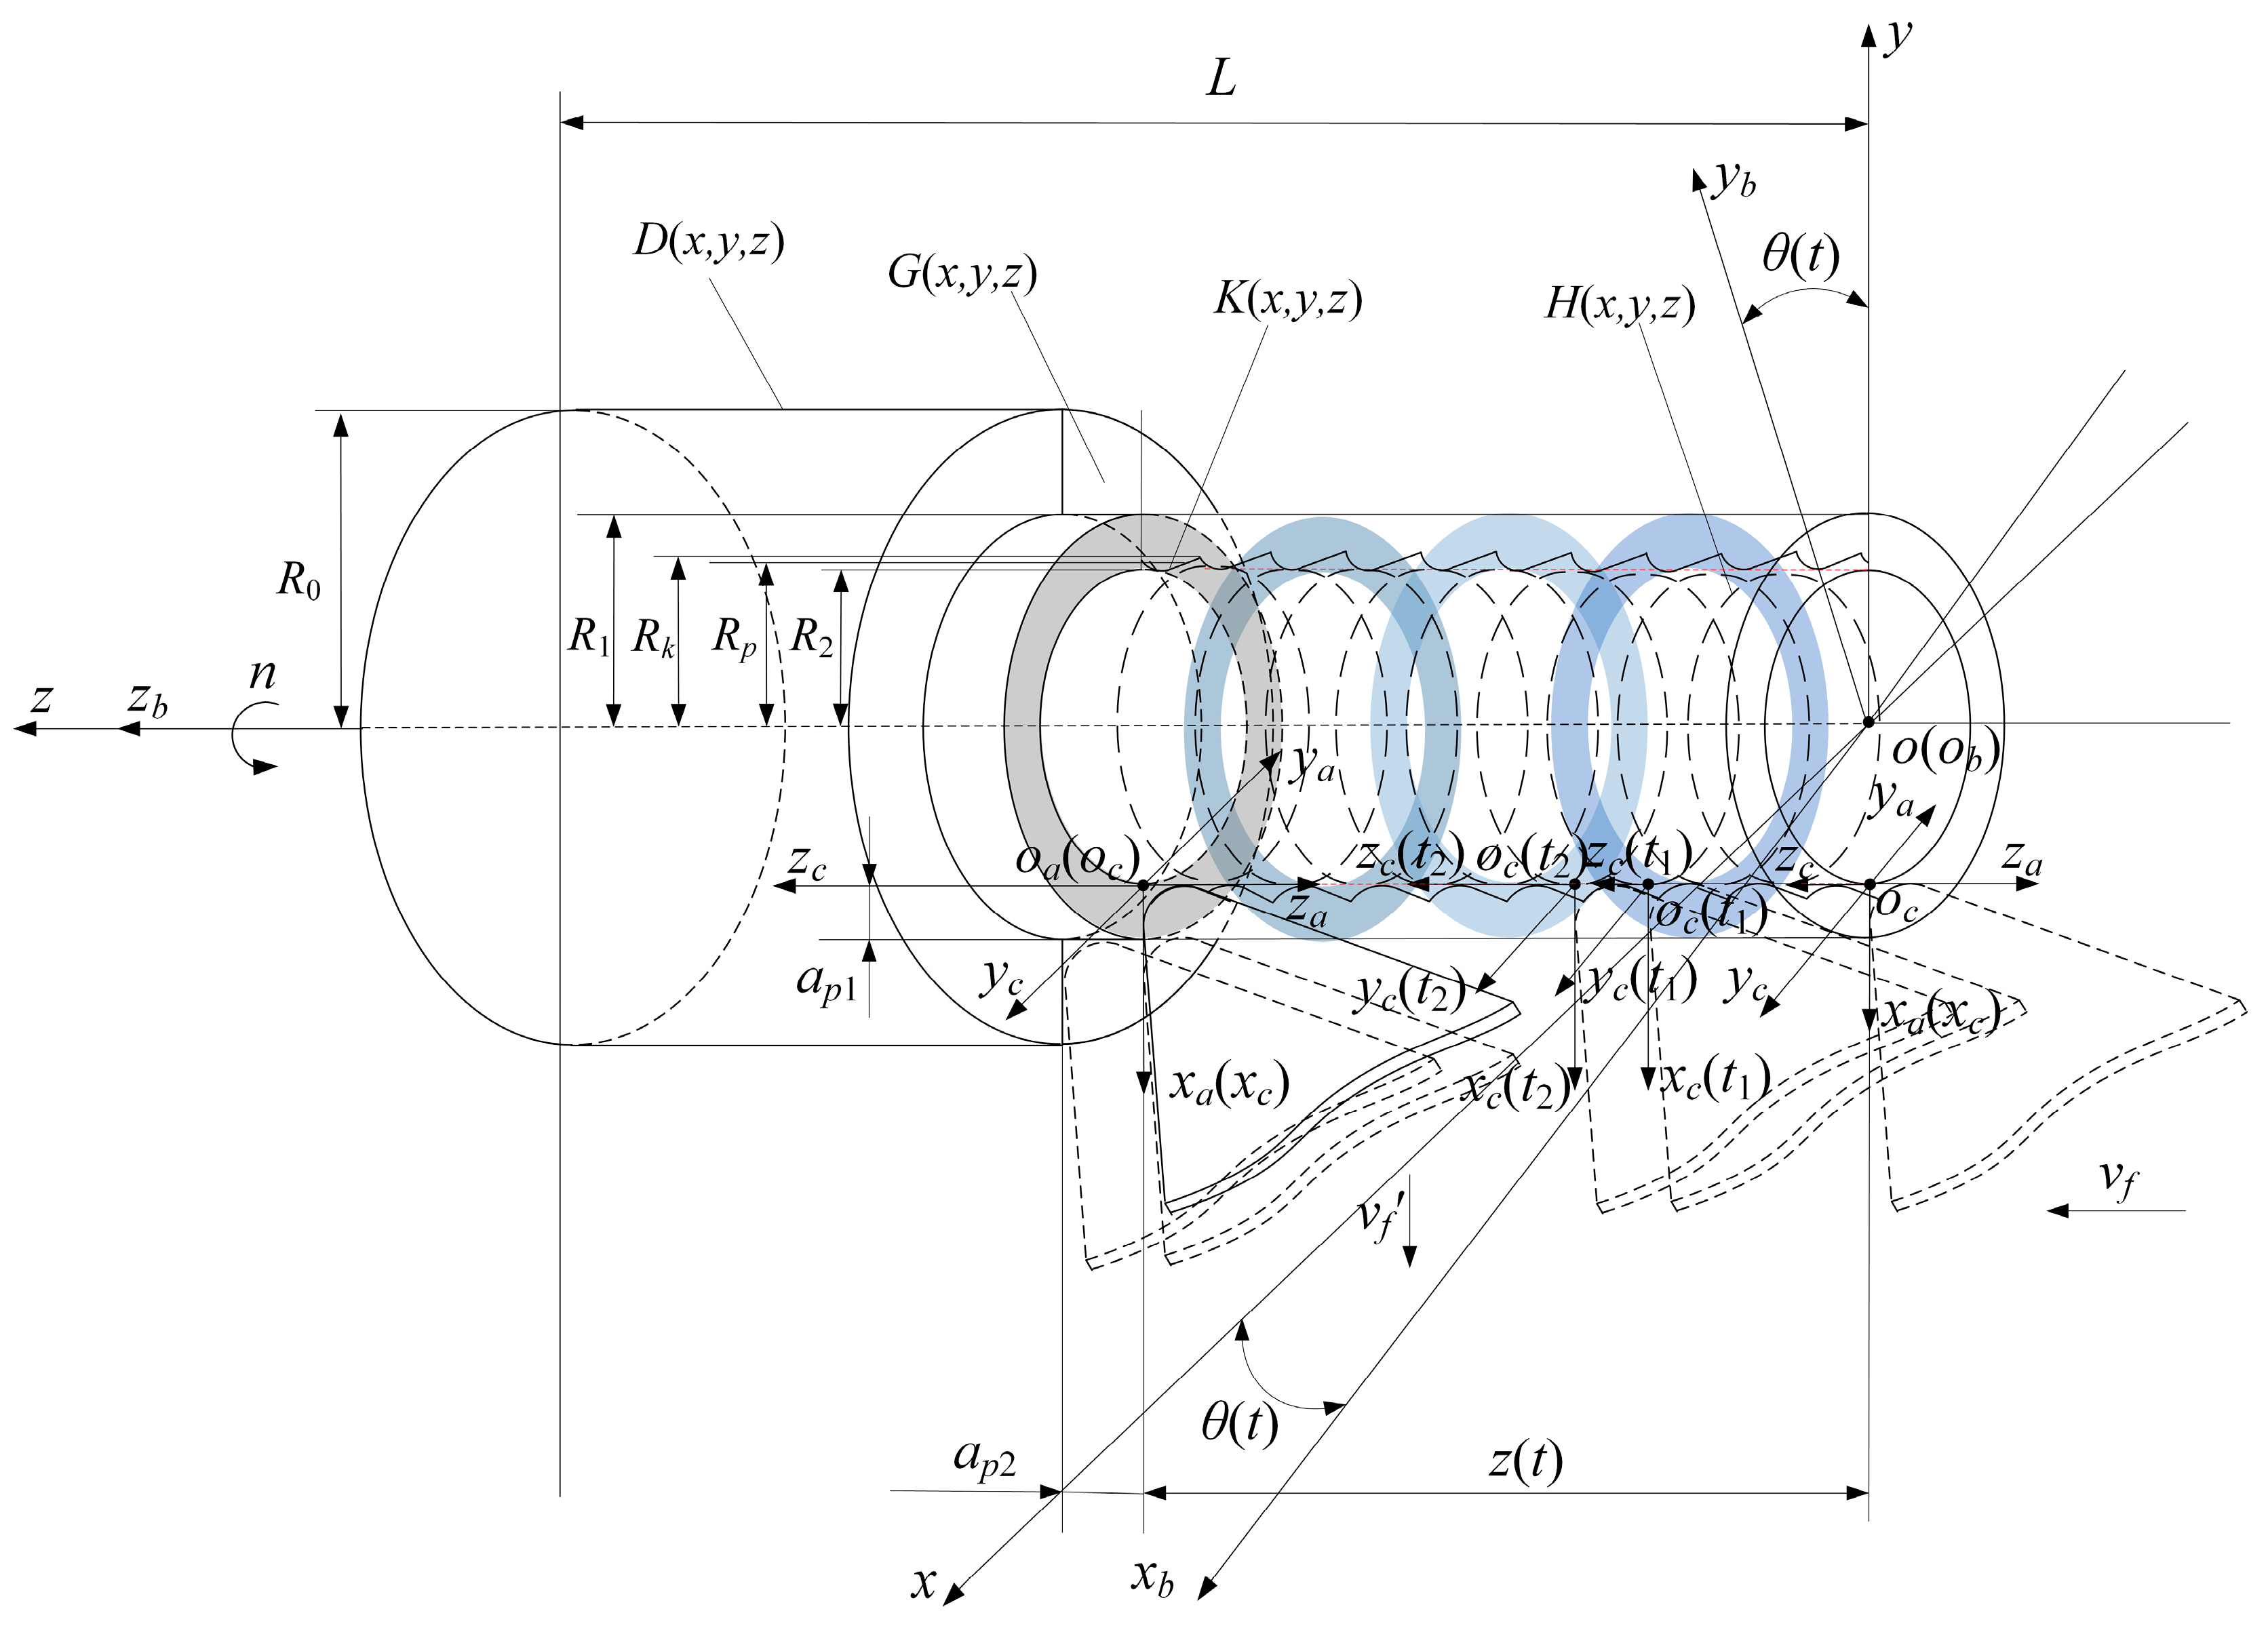
2.1. Turning Tool Structure and Instantaneous Cutting Position

In order to reveal the instantaneous dynamic characteristics of the cutting edge during the turning process, the structure of the turning tool and its cutting edge are characterized by geometric modeling, and the corresponding coordinate system is established, as shown in Figure 1.
The tool coordinate system, designated as oa-xayaza in Figure 1, was established through the following geometric definitions: The origin oa coincides with the intersection of the cutting edge’s apex plane and the radial maximum overhang projection. The za-axis extends along the line connecting oa to the cutting edge apex, while the xa-axis aligns with the radial overhang direction. The ya-axis completes the right-handed Cartesian frame. Key geometric parameters include: q (cutting edge left boundary), m (upper boundary), p (arbitrary edge point), l (edge segment length), ϕa (transition arc angle), ϕa’ (angular offset from tool nose center), and la (edge profile equation). Dimensional parameters comprise zB (shank length), xD (tool height), xB (shank width), and ra (nose radius). The tool geometry is characterized by seven fundamental angles: principal cutting edge angle (κr), auxiliary cutting edge angle (κr), tool included angle (εr), inclination angle (λs), radial components (rake γn, clearance αn, wedge βn), and axial components (rake γ0, clearance α0, wedge β0).
As can be seen from Figure 1, the main cutting edge is solved by solving the equation in the lathe coordinate system, as follows:
L a 1 ( x a , y a , z a ) = x a = r a + l sin κ r y a = sin κ r r a 1 cos ϕ a + l sin λ s z a = l cos κ r
The tip arc of the transition section of the cutting edge is solved by solving the equation in the tool tooth coordinate system, as follows:
L a 2 ( x a , y a , z a ) = x a = r a 1 sin ϕ a y a = l sin λ s z a = r a 1 cos ϕ a
The sub-cutting edge is solved by solving the equations in the tool tooth coordinate system, as follows:
L a 3 ( x a , y a , z a ) = x a = r a 1 cos κ r + l sin κ r y a = cos κ r r a 1 sin ϕ a + l cos λ s z a = r a 1 + sin κ r + l cos κ r
The cutting edge is solved by solving the equations in the tool tooth coordinate system, as follows:
L a ( x a , y a , z a ) = L a 1 ( x a , y a , z a ) L a 2 ( x a , y a , z a ) L a 3 ( x a , y a , z a )
In order to reveal the relative motion relationship between the workpiece and the tool and to control the formation process of the machined surface, the tool, the workpiece, and the relative motions of the tool coordinate system, the cutting coordinate system, the workpiece coordinate system, and the reference coordinate system are characterized as shown in Figure 2. The dynamic cutting process variables of the turning tool are explained as shown in Table 1.
In Figure 2, o-xyz is the reference coordinate system, which is a fixed coordinate system, ob-xbybzb is the workpiece coordinate system, the origin ob of this coordinate system is the center point of the workpiece end face, xb-axis is the direction of depth of cut, zb-axis is the direction of feed rate, and yb-axis is established according to the Cartesian coordinate system; oc-xcyczc is cutting coordinate system, where the coordinate origin oc is the intersection of the plane where the lowest point of the cutting tool tooth is located and the projection of the maximum radial extension point of the cutting tool tooth; the line between the coordinate origin and the lowest point of the cutting tool tooth is used as the direction of the zc-axis, and the line between the coordinate origin and the maximum radial extension point of the cutting tool tooth is used as the direction of the xc-axis. The yc-axis was determined according to the principle of the Cartesian coordinate system; the origin oc of the cutting coordinate system coincides with the origin oa of the tool coordinate system, the xc-axis coincides with the xa-axis, the ya-axis is in the opposite direction to the yc-axis, and the za-axis is in the opposite direction to the zc-axis; L is the length of the workpiece, R0 is the radius of the big end of the workpiece, R1 is the radius of the small end of the workpiece, Rk is the distance from the axis of the highest point of the machined surface, Rp is the distance of point p from the axis, Rm is the distance from the axis of the lowest point of the machined surface, vf is the cylindrical turning tool feed rate, vf is the face turning tool feed rate, ap1 is the depth of cylindrical turning, ap2 is the end face turning depth, n is the Spindle speed, θ(t) is the angle of rotation of the workpiece coordinate system relative to the initial position during cutting, z(t) is the feed distance of the turning tool in the direction of the feed rate during cutting, D(x,y,z) is the surface to be machined, and G(x,y,z) is the machining transition surfaces, K(x,y,z) is the machined surfaces.
According to Figure 2, the trajectory equation of the cutting coordinate system origin oc in the machine coordinate system can be expressed as follows:
L c ( x c ( t ) , y c ( t ) , z c ( t ) ) = Φ 0 0 0 0 1 T
where the transformation matrix Φ0 is T2T1M1. T2 is the translation matrix of the tool to the reference coordinate system; T1 is the rotation matrix of the tool coordinate system to the cutting coordinate system; M1 is the rotation matrix of the workpiece coordinate system to the reference coordinate system.
The transient dynamic characteristics of the cutting edge in the turning process can be revealed by using the above lathe tool structure and transient cutting pose.

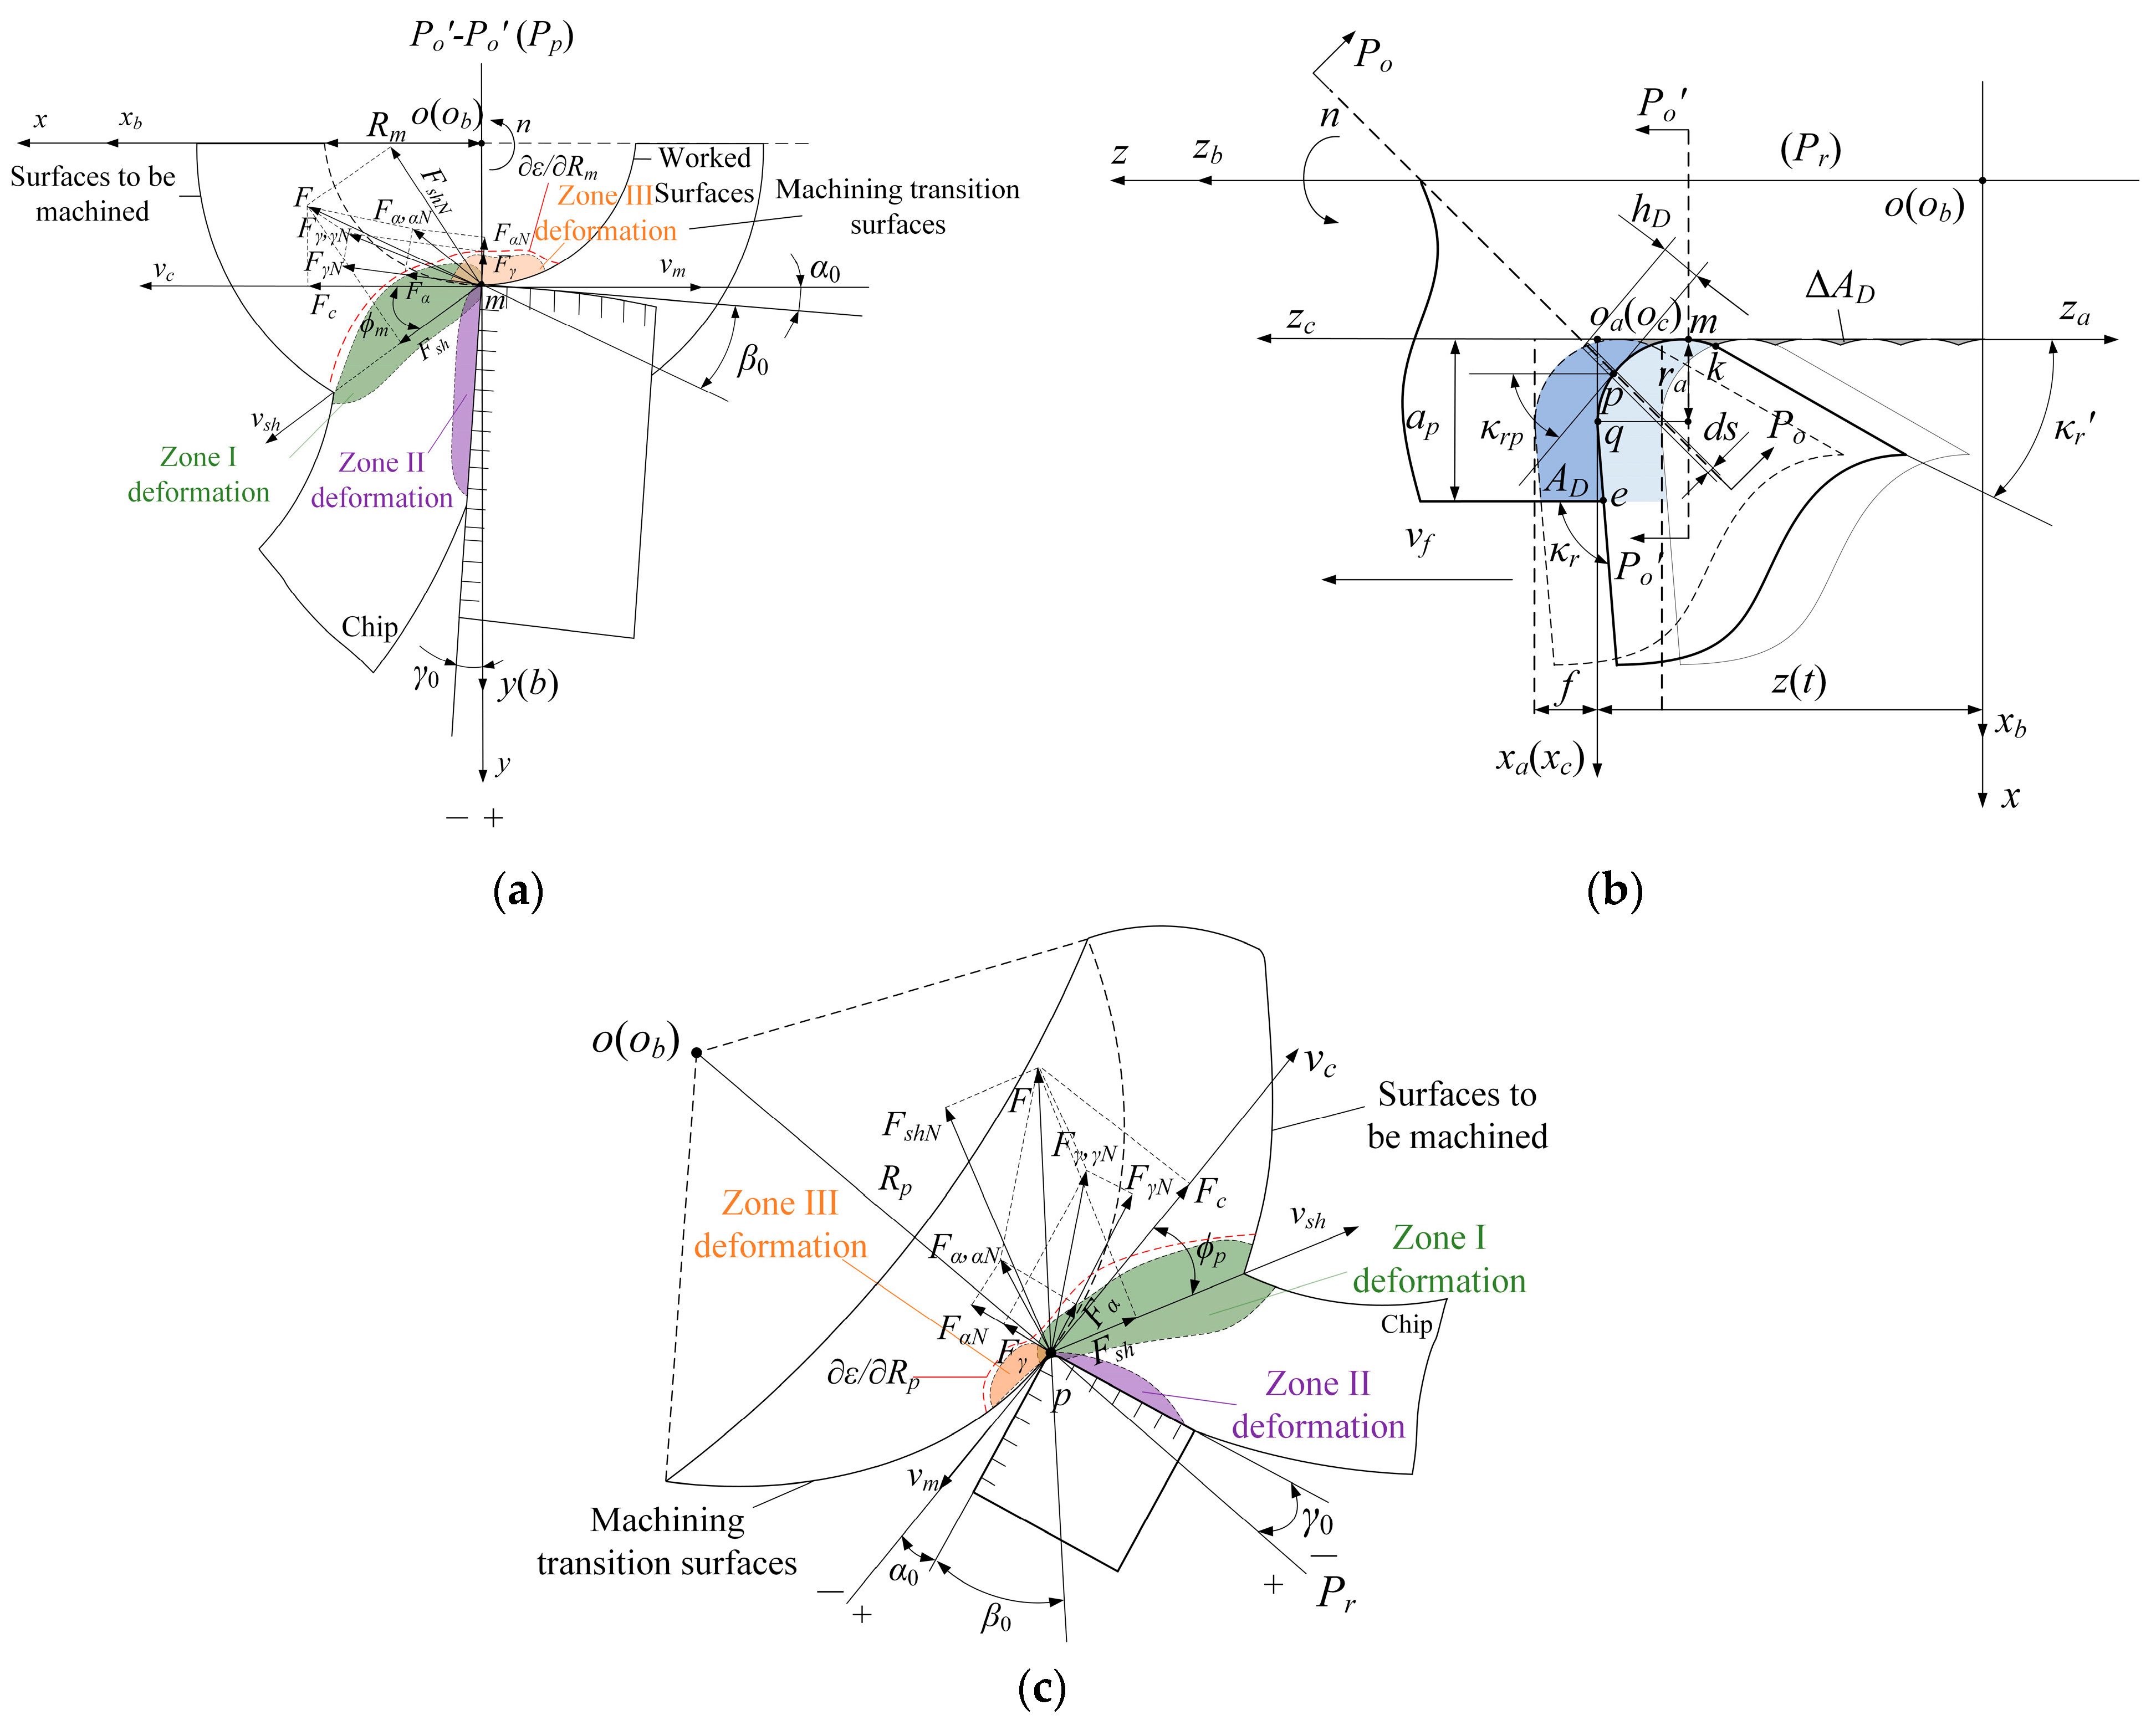
2.2. Transient Cutting Layer and Mechanical Behavior

To elucidate the cutting layer and its mechanical response during the turning of titanium alloy, we characterize the instantaneous force and cutting layer at the point where the lowest workpiece surface point and the tool’s transition arc segment make contact with the workpiece, as depicted in Figure 3.
In Figure 3, point m is the highest point on the cutting edge, point p is an arbitrary point on the transition arc of the cutting edge, γ0 is the front angle of the tool, α0 is the back angle of the tool, β0 is the friction angle on the front face, ϕp is the shear angle of point p, f is the feed per revolution, κrp is the instantaneous main deflection angle of point p, hD is the thickness of the cutting layer, ds is the instantaneous micrometer width of the cutting layer of point p, AD is the actual cutting layer area, ΔAD is the cutting residual area, Rm is the radius of gyration at point m, Rp is the radius of gyration at point p, vc is the cutting speed, Fc is the main cutting force, vm is the friction speed, Fγ is the friction force on the front blade surface, FγN is the normal force of the friction force on the front blade surface, Fα is the friction force on the rear blade surface, FαN is the normal force of the friction force on the rear blade surface, vsh is the shear speed, Fsh is the shear force, FshN is the shear force in the normal force, F is the combined force of front and rear tool face friction and its normal force, the combined force of shear force and its normal force, and the combined force of main cutting force and feed force.
The instantaneous cutting layer thickness solution for any point p is shown in Equation (6).
h D = f sin κ r p cos λ s
The cutting layer area AD solution is shown in Equation (7).
A D = e m h D ( x , y , z ) d s cos λ s
From Figure 3, Equations (6) and (7), τ denotes the shear stress on the shear surface, and the solution of each force at point p is shown in Equations (8)–(11).
F s h = τ A D sin ϕ p
F s h = F cos ϕ p + β 0 γ 0
F = F s h cos ϕ p + β 0 γ 0 = τ A D sin ϕ p cos ϕ p + β 0 γ 0
F c = F cos β 0 γ 0 = τ A D cos β 0 γ 0 sin ϕ p cos ϕ p + β 0 γ 0
According to the cutting layer and its mechanical behavior in the turning process, the instantaneous force on any point of the cutting edge and the instantaneous dynamic change characteristics of the cutting layer can be revealed.

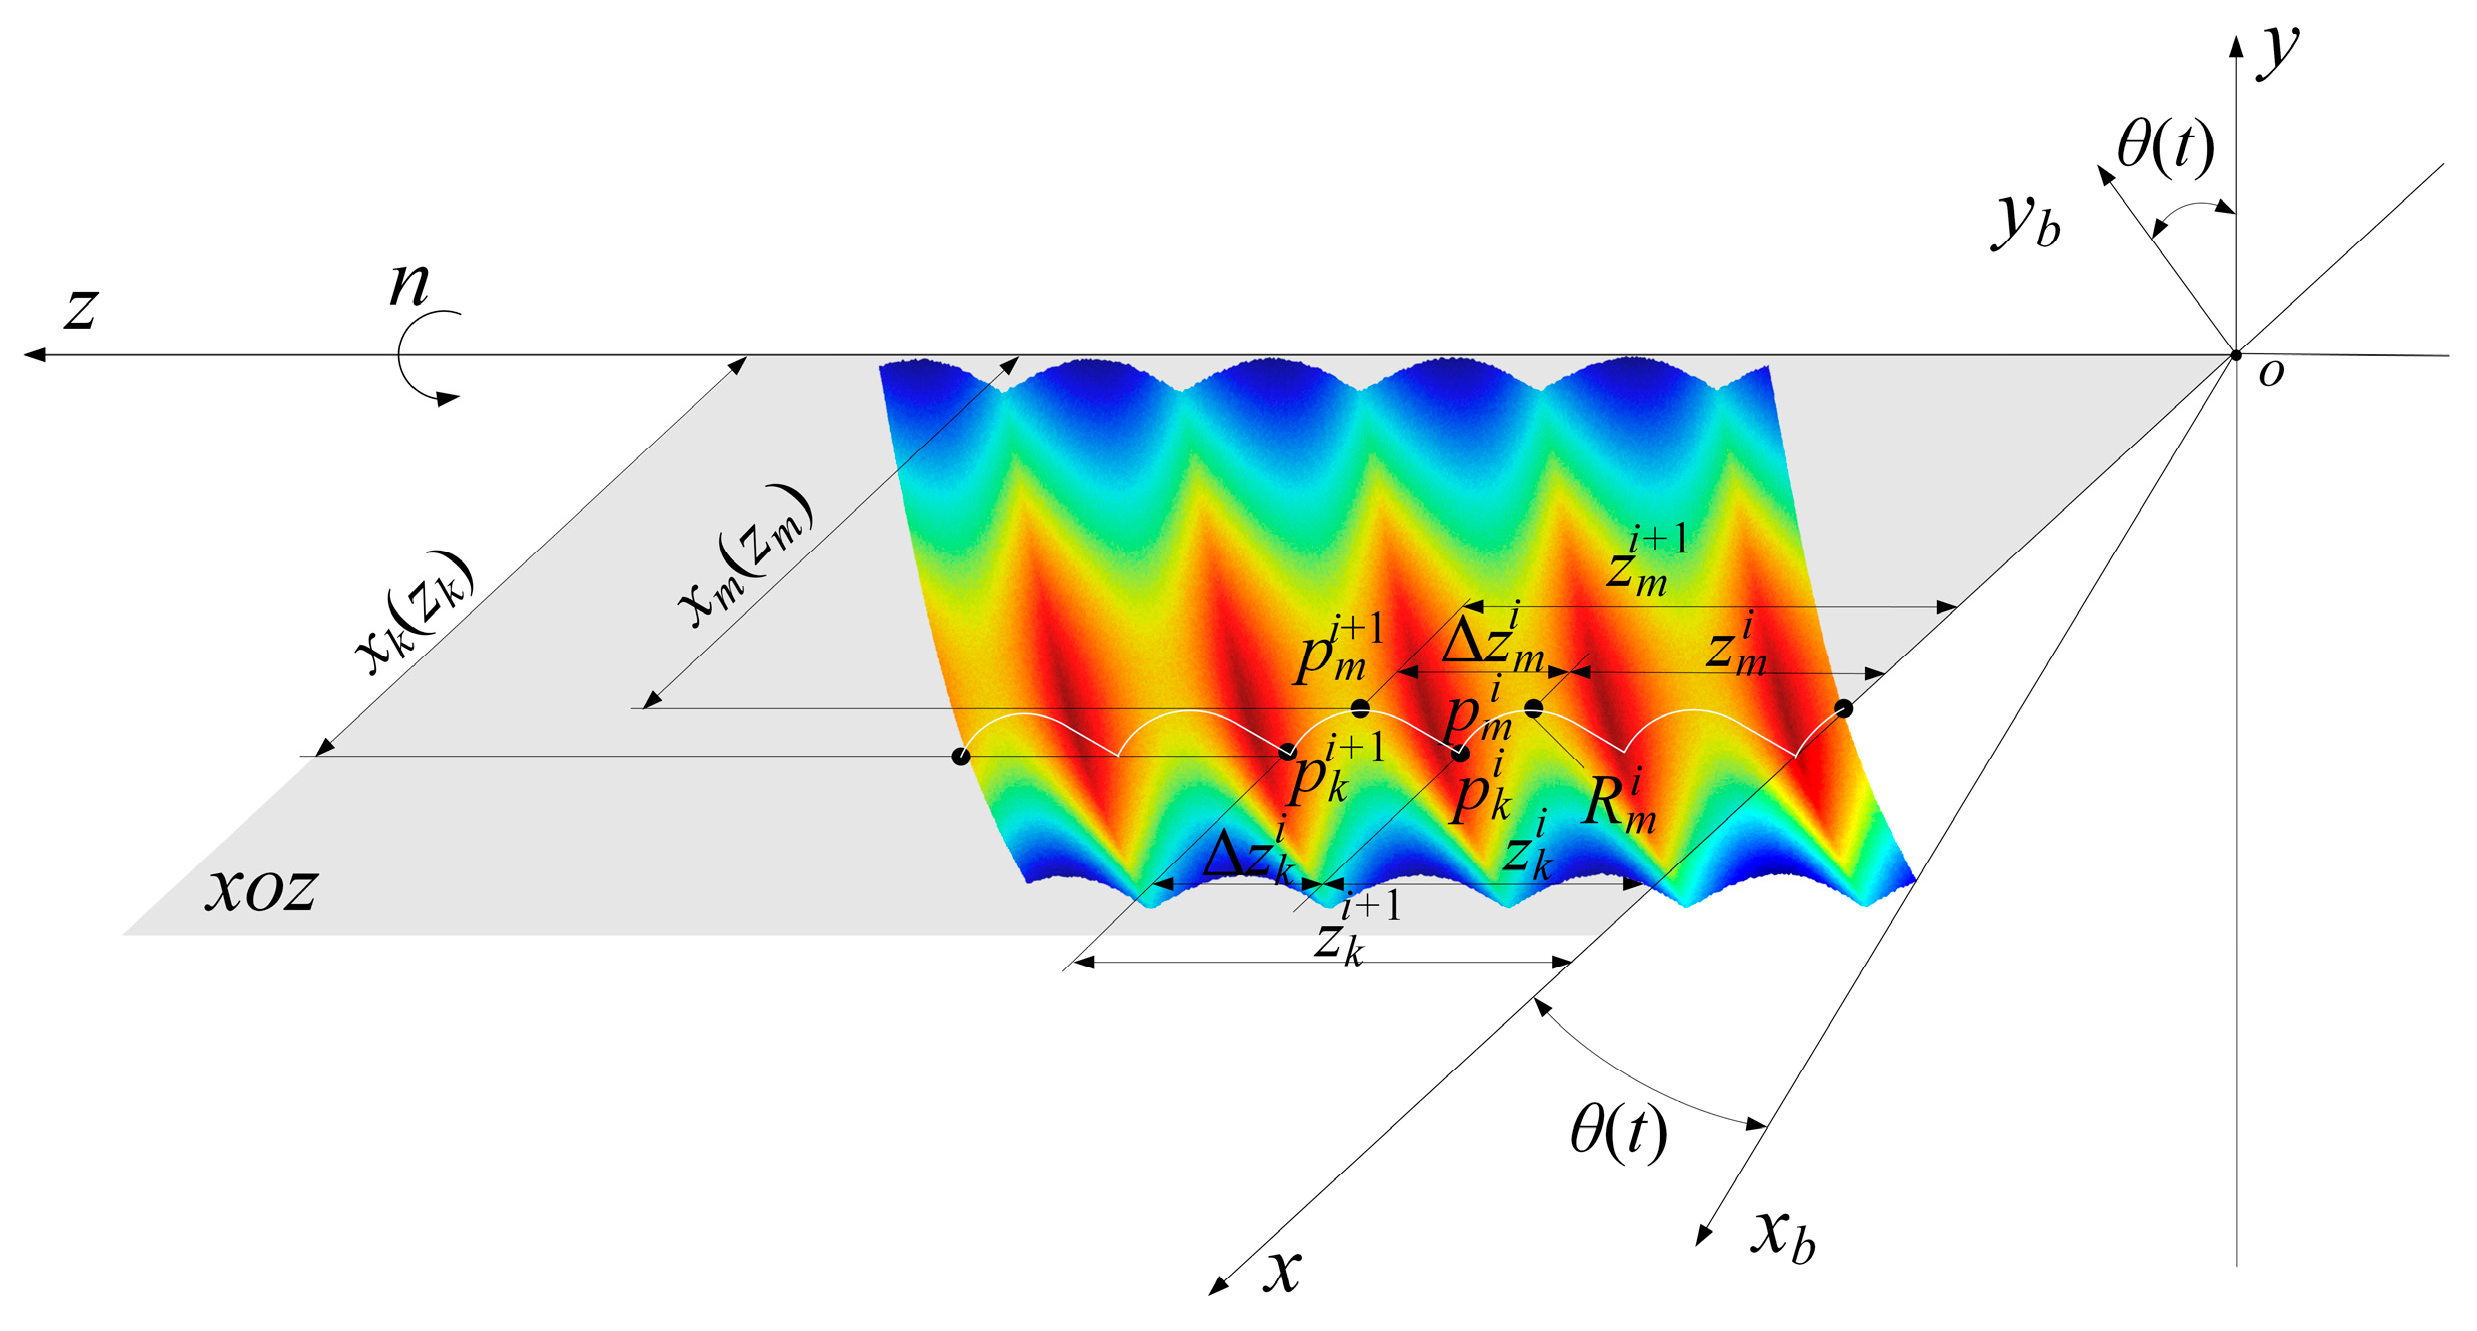
2.3. Surface Morphology Solution Method for Turning Machining

Without taking into account the cutting edge loss and the rear face of the machining of the transition surface of the extrusion effect of the premise, the final machined contour of the workpiece is essentially derived from the superimposed effect of the cutting edge trajectory of the two adjacent cutting cycles. The cutting edge in the previous cutting cycle generated the transition surface at the same time. The subsequent cycle will be partially eliminated through the material removal of the surface formed in the previous cycle and the formation of a new transition surface. The two cycles of the cutting edge trajectory intersection area constitute the cyclical height of the residual.
The turning machining transition surface solution is shown in Equations (12)–(15).
H x , y , z = H a 1 x , y , z H a 2 x , y , z H a 3 x , y , z
H a 1 x , y , z = x y z 1 = Φ 0 L a 1 = T 2 T 1 M 1 r a + l sin κ r sin κ r r a 1 cos ϕ a + l sin λ s l cos κ r 1
H a 2 x , y , z = x y z 1 = Φ 0 L a 2 = T 2 T 1 M 1 r t 1 sin ϕ a l sin λ s r a 1 cos ϕ a 1
H a 3 x , y , z = x y z 1 = Φ 0 L a 3 = T 2 T 1 M 1 r a 1 cos κ r + l sin κ r cos κ r r a 1 sin ϕ a + l cos λ s r a 1 + sin κ r + l cos κ r 1
where Ha1 is the machining transition surface formed by the main cutting edge, Ha2 is the machining transition surface formed by the transition arc, and Ha3 is the machining transition surface formed by the secondary cutting edge.
ts denotes the initial moment of cutting for each revolution of the workpiece, and te denotes the end moment of cutting for each revolution of the workpiece. The equation of the machined transition surface formed when the workpiece rotates i weeks is as follows:
G i ( x , y , z ) = H ( x , y , z ) = x ( t i ) y ( t i ) z ( t i ) 1 T t s i t i t e i
The machined transition surface formed when the workpiece is rotated i + 1 weeks and intersects with the machined transition surface formed by the previous rotary turning is denoted as follows:
G i + 1 ( x , y , z ) = H ( x , y , z ) = x ( t i + 1 ) y ( t i + 1 ) z ( t i + 1 ) 1 T G i ( x , y , z ) t s i + 1 t i + 1 t e i + 1
The machined transition surface formed when the workpiece is rotated i + 2 weeks and the machined transition surface formed with the previous turning forms the final turned surface can be expressed as follows:
G i + 2 ( x , y , z ) = H ( x , y , z ) = x ( t i + 2 ) y ( t i + 2 ) z ( t i + 2 ) 1 T G i + 1 ( x , y , z ) t s i + 2 t i + 2 t e i + 2
Based on the above model, MATLAB 2022 software was used for simulation and calculation to simulate the surface morphology of the turning surface, resulting in the turning surface morphology shown in Figure 4.
Intercepting the intersection line between the current cutting position and the xoz plane, the characteristic points pki and pmi are solved as shown in Equations (19) and (20):
p k i x k i , y k i , z k i = H c 2 x t i , 0 , z t i H c 3 x t i + 1 , 0 , z t i + 1 K x , y , z = 0 t = t i + 1
p m i x m i , y m i , z m i = H c 2 x t i + 1 , 0 , 0 K x , y , z = 0 t = t i + 1
During the turning process, the property parameters of the subsurface layer of titanium alloys are constantly changing. During the machining process of turning titanium alloys, the characterization coefficients of the subsurface layer are important indicators for evaluating the material properties, which mainly include plastic strain, residual stress, and rate of work hardening. These three characteristic parameters not only characterize the deformation and stress state of the material during machining but also have a major influence on the fatigue life of the material. Plastic strain is the irreversible deformation of the material during the loading process. The plastic strain generated in titanium alloys during turning improves the fatigue resistance, but an excessively high level will lead to fatigue cracks and reduced fatigue life. Residual stresses are internal stresses due to uneven deformation that remains after the removal of external loads. Appropriate residual stresses improve fatigue strength, but uneven distribution causes stress gradients and reduces fatigue life. The rate of work hardening indicates the hardness of the material due to deformation, and a higher rate of work hardening helps to improve wear resistance and fatigue resistance.
The formula presents a set of characteristic parameters essential for evaluating the machined surface of titanium alloy. Here, D1 represents the workpiece material attribute, D2 denotes the tool material attribute, D3 signifies the tool structure parameter, and D4 reflects the turning process parameter.
D = D 1 , D 2 , D 3 , D 4
D 3 = κ r , κ r , γ , β , r a
D 4 = a p , n , f
Based on the above model, different surface morphology parameters can be obtained when the workpiece material properties, tool material properties, tool structure parameters, and process parameters are different.

3. Titanium Alloy Turning Process Morphology Correction Method

3.1. Workpiece Material and Tool Material

TC6 titanium alloy contains α-stabilizing element Al, eutectic β-stabilizing element Mo, and eutectoid β-stabilizing elements Cr and Fe, as well as neutral element Si. The β-stabilization coefficient Kp = 0.6. The D1 set in Equation (21) in Section 2.3 is shown in Table 1.
The workpiece material is TC6, and the tool material is WC cemented carbide. The D2 set in Section 2.3 Chinese (21) is shown in Table 2.

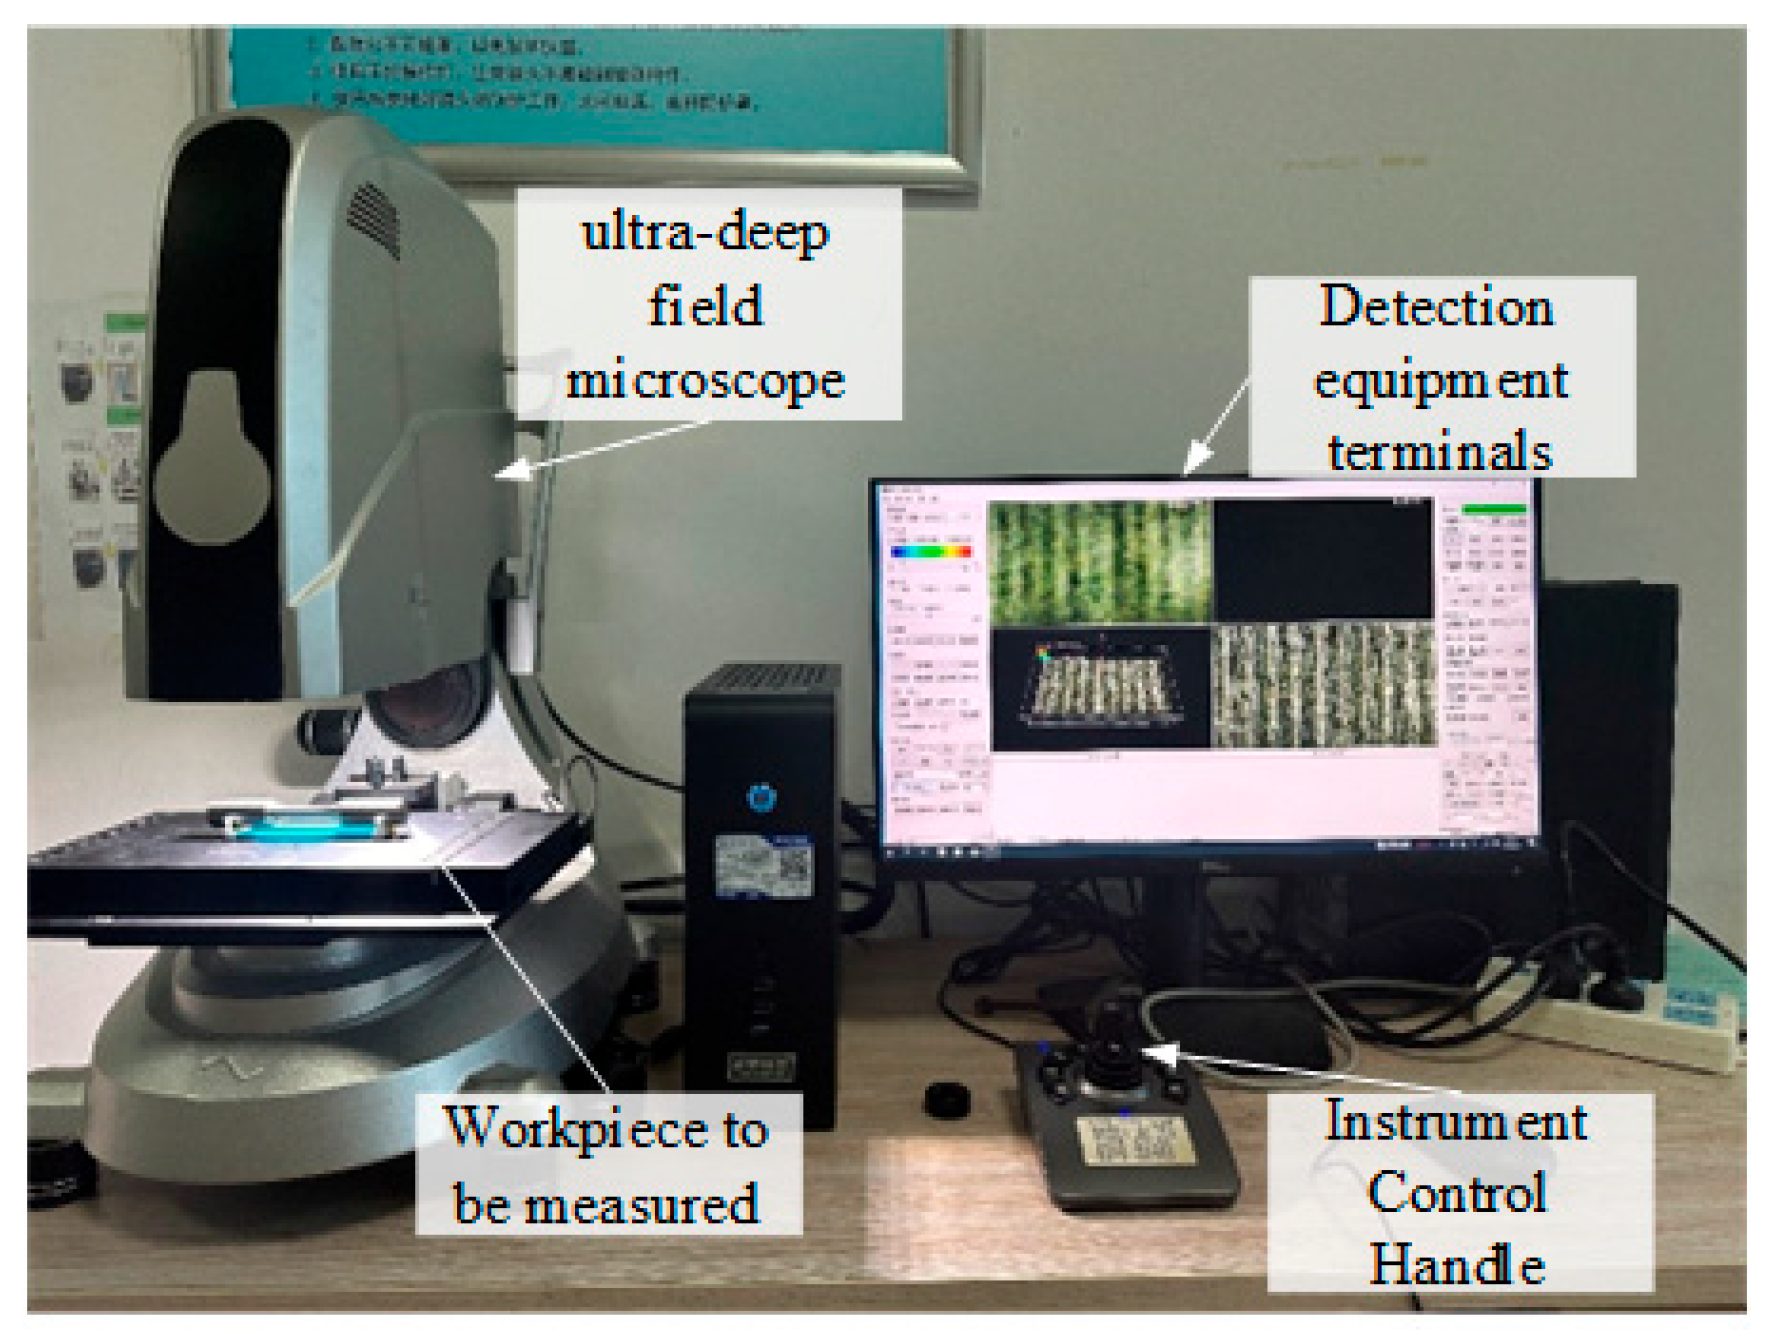
3.2. Experimental Conditions and Methods for Titanium Alloy Turning

During machining operations, the tool’s instantaneous pose exhibits dynamic fluctuations caused by factors such as vibration and precision deviations, resulting in stochastic changes in the microstructure of the machined surface. Experimental turning was conducted to measure the surface morphology of a titanium alloy. Data points from the sections were extracted and subjected to multi-Scheme regression analysis to refine the simulation model for the machining surface morphology of the titanium alloy.
A CNC lathe was utilized to machine a titanium alloy workpiece using a 55° cylindrical turning tool produced by Walter Company. The machining process involved cylindrical turning, with a main deviation angle of 93°. The radius of the tool tip arc was set at 0.4 mm. The tool holder model used was PDJNR2525M1506, and the insert model was DNMG150604. The selected cutting parameters are detailed in Table 3, and the cutting method employed was dry cutting. The materials for both the workpiece and the tool are specified in Table 1 and Table 2 in Section 2.1.
The three-dimensional surface topography of machined specimens was quantitatively characterized using a PZ-CS3500A super depth-of-field microscope produced by Beijing Pinzhichuangsi Precision Instruments Co., with the corresponding experimental setup illustrated in Figure 5.

3.3. Corrective Modeling of Surface Morphology for Turning of Titanium Alloys

The topographical parameters of titanium alloy machined surfaces exhibit stochastic variations across distinct sampling locations. These spatial-dependent characteristics were mathematically modeled through Equations(24)–(29), which establish functional relationships between surface parameters and sampling coordinates.
x k i z k i , θ k i = x k 1 z k 1 , θ k 1 , x k 2 z k 2 , θ k 2 , x k 3 z k 3 , θ k 3 , , x k 0 z k 0 , θ k 0
x m i z m i , θ m i = x m 1 z m 1 , θ m 1 , x m 2 z m 2 , θ m 2 , x m 3 z m 3 , θ m 3 , , x m 0 z m 0 , θ m 0
Δ x k i z k i , θ k i = Δ x k 1 z k 1 , θ k 1 , Δ x k 2 z k 2 , θ k 2 , Δ x k 3 z k 3 , θ k 3 , , Δ x k 0 z k 0 , θ k 0
Δ x m i z m i , θ m i = Δ x m 1 z m 1 , θ m 1 , Δ x m 2 z m 2 , θ m 2 , Δ x m 3 z m 3 , θ m 3 , , Δ x m 0 z m 0 , θ m 0
R m i z m i , θ m i = R m 1 z m 1 , θ m 1 , R m 2 z m 2 , θ m 2 , R m 3 z m 3 , θ m 3 , , R m 0 z m 0 , θ m 0
R a i z m i , θ m i = R a 1 z m 1 , θ m 1 , R a 2 z m 2 , θ m 2 , R a 3 z m 3 , θ m 3 , , R a 0 z m 0 , θ m 0
Variations in machining parameters necessitate the identification of deterministic surface morphology variables in turning operations. Multivariate regression models through Equations (24)–(29) were developed to establish correlations between process parameters, sampling locations, and topographical descriptors of machined surfaces.
S a = x k z k , θ k , x m z m , θ m , Δ x k z k , θ k , Δ x m z k , θ m , R m z m , θ m , R a
Let’s denote the characteristic covariates within the parameter set. The corresponding regression model is expressed by Equation (31), with its coefficients systematically summarized in Table 4.
s a = β a p α 1 n α 2 f α 3 z α 4 θ α 5 s 0
where β, α1~α5 are the coefficients of the fitted regression equation, and s0 represents the value of each characteristic parameter corresponding to the ideal uniform surface. When the machined surface is ideal and uniform, β = 1, α15 are all 0, meaning that sa = s0.
S0 is related to tool parameters, process parameters, and other factors, with the set of variables shown in Equation(32).
s 0 = D 1 , D 2 , D 3 , D 4 , L c

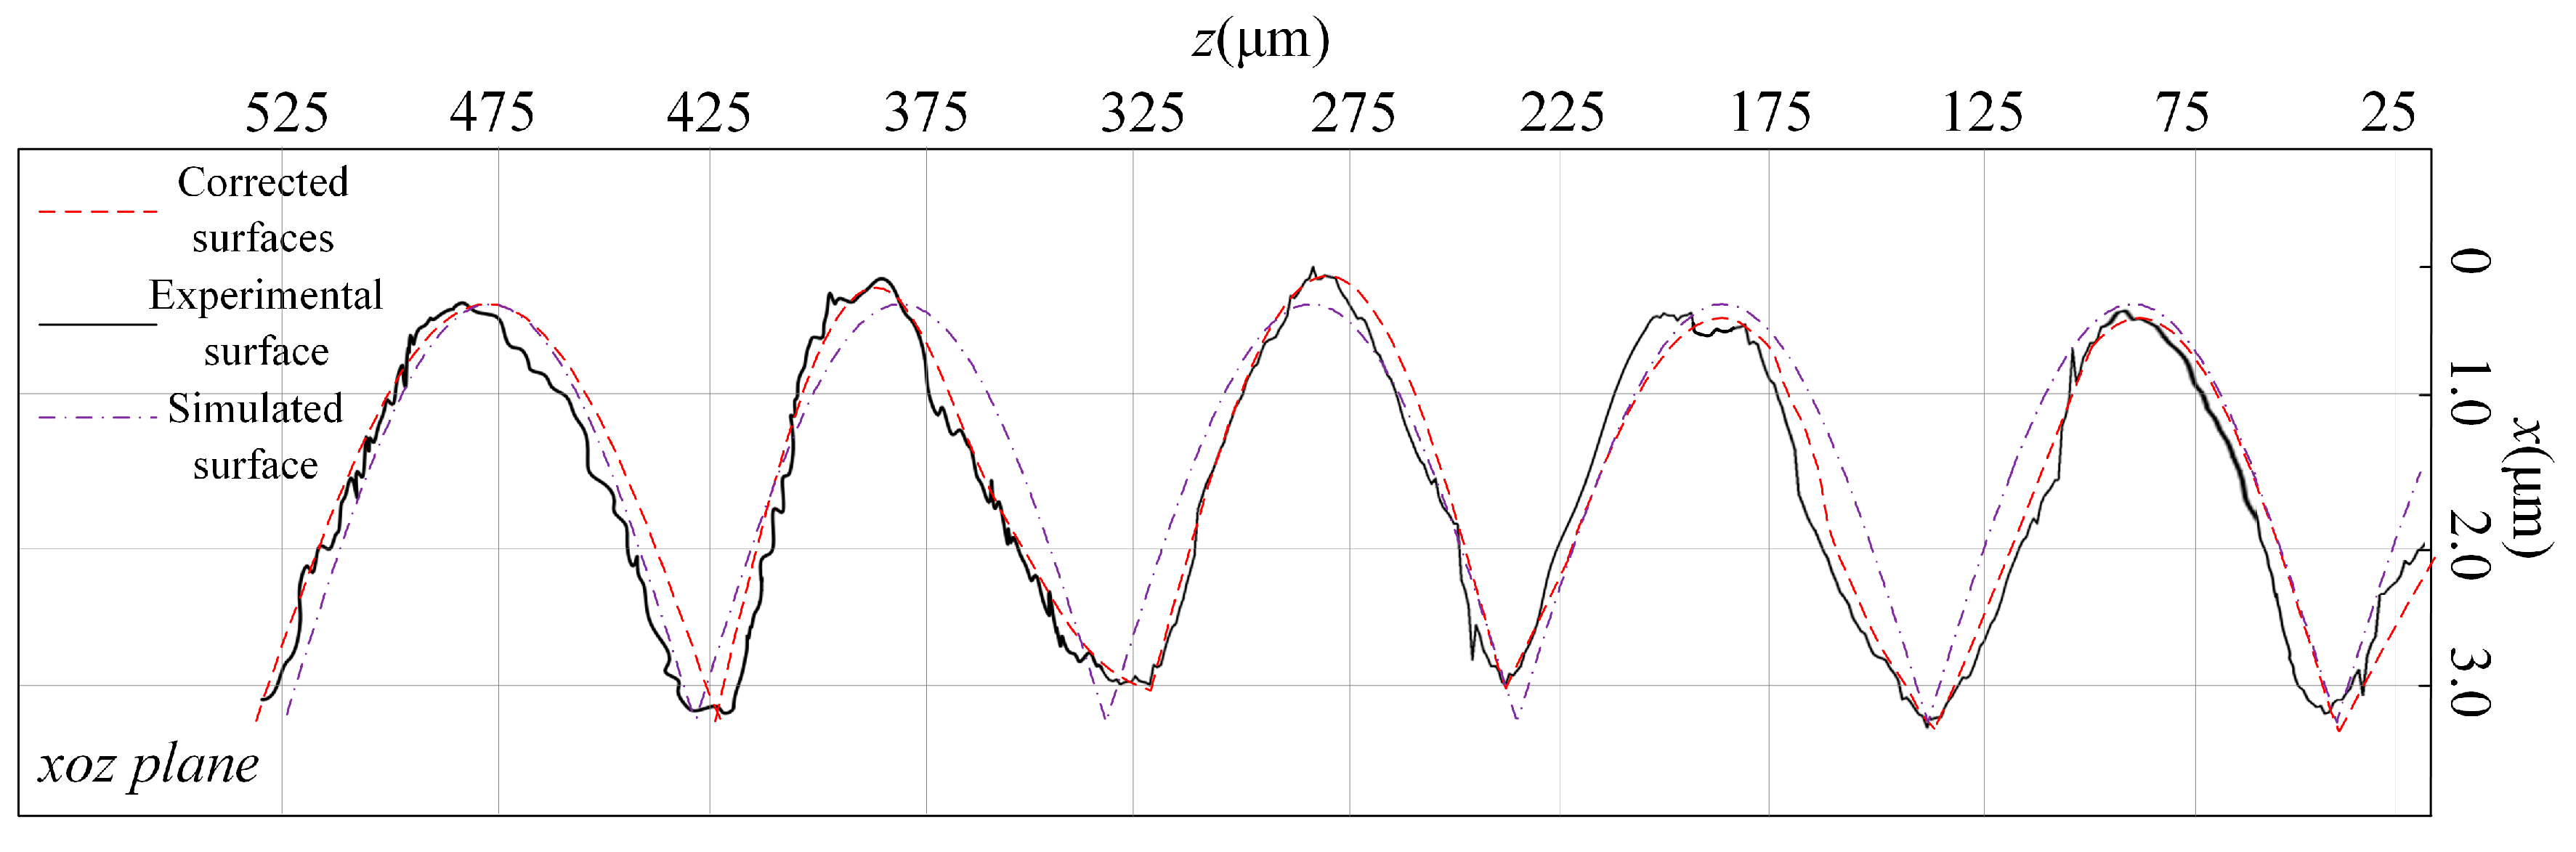
3.4. Comparison of Titanium Alloy Turning Surface Morphology Correction Results with Experimental Results

Based on the above-mentioned turning surface calculation correction model, MATLAB was used to calculate the turning morphology with the introduction of correction coefficients. In the turning process parameter set D3, the feed rate f per revolution was 0.1 mm, the spindle speed n was 983 r/min, and the cutting depth ap was 0.1 mm. This Scheme was defined as Scheme 1. The turning morphology was simulated again at the same position, and the feature point identification is shown in Figure 6.
Figure 7 compares the cross-sectional profiles of the machined surface topography with experimentally measured profiles, both before and after error correction. Gray correlation analysis reveals a correlation coefficient of 0.81 between the original simulated profile and the experimental measurements. After correction, this value increases to 0.93, indicating a strong correlation. These results validate the feasibility of applying fitted regression functions to enhance surface topography predictions in turning processes.
The location of different characteristic points of the surface topography of the turning process and the radius of curvature are solved, and the results are shown in Table 5. Group 1 is the ideal smooth surface, Group 2 is the simulated surface, and Group 3 is the modified surface.
Table 6 presents the peak and valley positions in the machined surface topography, along with the absolute and relative errors between the corrected and experimental surfaces. The results indicate that after the correction of the machined surface topography, the relative errors for most positions and their corresponding distances in the feed and depth-of-cut directions are small. Specifically, 50.00% of the positions have relative errors between 0% and 5%, 16.67% fall between 5% and 10%, and 8.33% lie between 10% and 15%, totaling 75%. This suggests a high correlation between the characteristic coefficient positions and their respective measurements.

4. Method for Calculating the Distribution Characteristics of Surface and Subsurface Performance Parameters of Titanium Alloy Turned Parts

4.1. Finite Element Model Construction Method for Titanium Alloy Turning Process

Based on the properties of titanium alloys and tool materials presented in Table 1 and Table 2 of Section 3.1, it is evident that the elastic modulus of the tool material (705 GPa) is significantly higher than that of the workpiece material (109.8 GPa). As a result, the deformation of the tool during machining is minimal, allowing it to be treated as a rigid body in the modeling process. In the ABAQUS environment, a thermal-mechanical coupled field analysis model was developed for the external cylindrical turning of titanium alloy. Given the considerable heat generated by friction during the turning process, which impacts the material’s mechanical properties, the model underwent thermal-mechanical coupled field analysis. The boundary conditions of the model were established as follows: the bottom surface and both ends of the workpiece were fixed, while the tool moved relative to the workpiece at a predetermined feed rate and rotational speed, simulating actual turning conditions. Titanium alloys exhibit low thermal conductivity, which means that the heat generated by friction during machining can significantly influence their mechanical properties. During the machining of titanium alloy TC6, heat generated by plastic deformation cannot dissipate quickly within a short duration, thus allowing the machining process to be regarded as an adiabatic shearing process.
For this purpose, the Johnson–Cook dynamic response constitutive model was selected as the benchmark for material behavior analysis, as shown in Equation (33).
σ = ( A + B ε n ) ( 1 + C ln ε ˙ ε ˙ 0 ) [ 1 ( T T 0 T m e l t T 0 ) m ]
where plastic J–C stress is a function of strain, strain rate and temperature, A, B, n, C, and m are model constants. σ is the flow stress, ε is the equivalent plastic strain, is the strain rate, is the reference true strain, T is the operating temperature, Tmelt is the melting temperature of the material, and T0 is the ambient temperature.
In the context of mesh partitioning, the workpiece is modeled using linear reduced integration 8-node hexahedral elements, while the tool is represented by tetrahedral temperature-displacement coupled elements. The contact relationship between the tool and the workpiece is established as a master-slave contact pair, with the tool acting as the master surface and the workpiece serving as the slave surface. The tool-workpiece contact interface is characterized using a kinematic friction model, with a friction coefficient of μ = 0.1. The initial temperature of the workpiece is set to room temperature (20 °C). Using the developed finite element model, the turning process for the outer diameter of the titanium alloy is analyzed.

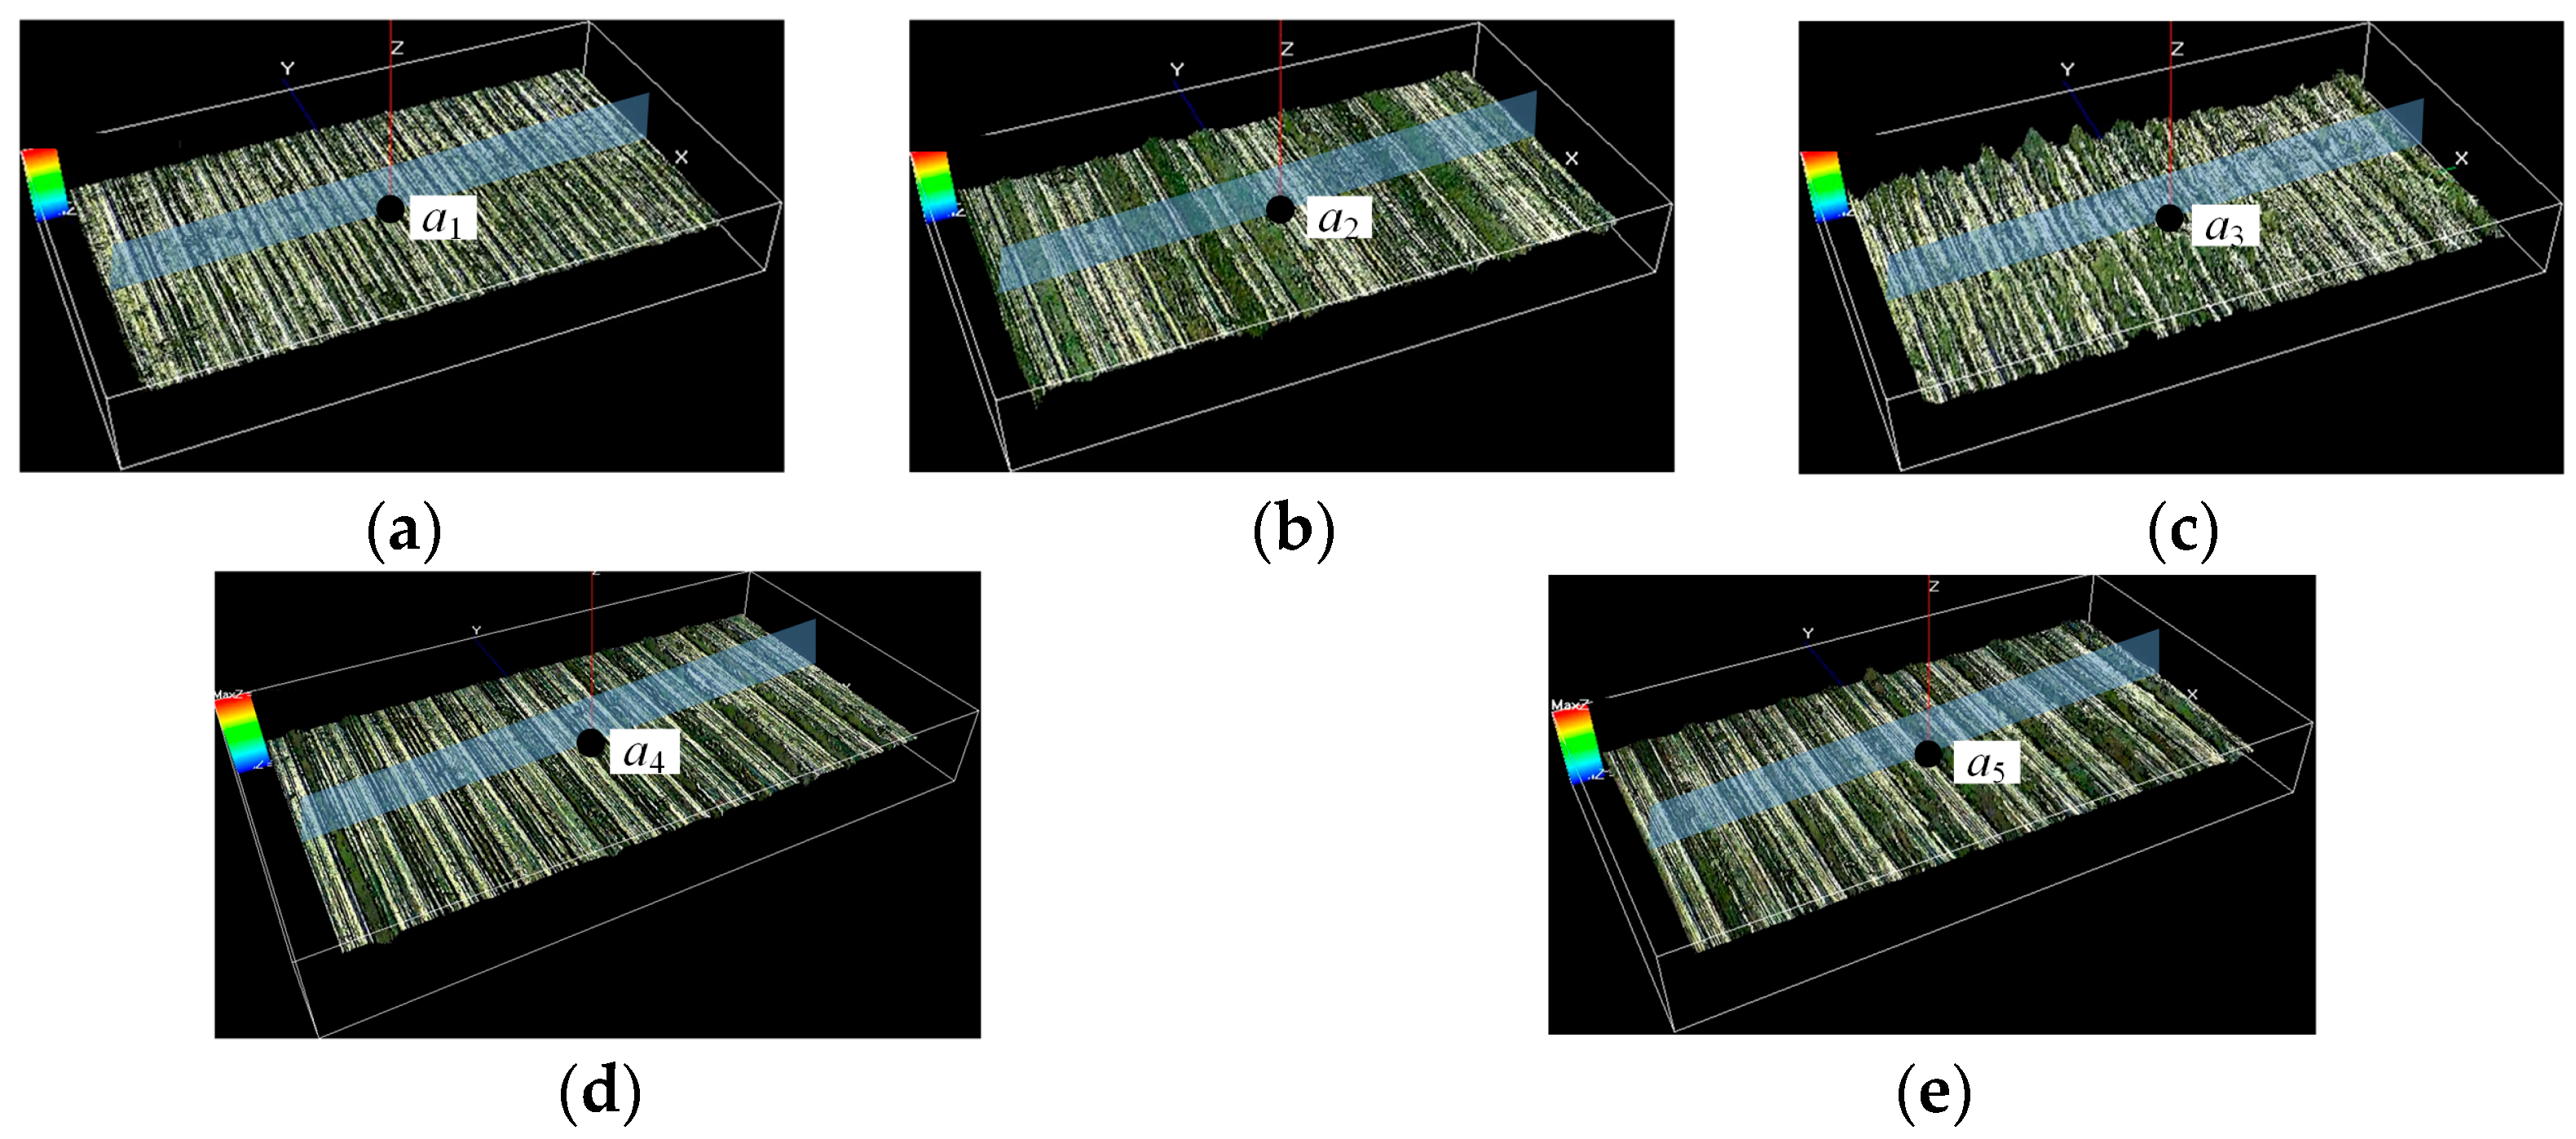
4.2. Method for Selecting Characteristic Points and Their Surface and Subsurface Performance Parameters

Five equidistant characteristic points (a1a5) were analyzed along the xoz surface, spaced at 2.5 mm intervals over a 10 mm total length. As illustrated in Figure 8a,b, the stress and strain field distributions across section A1-A1 at point a1 demonstrate typical cross-sectional behavior.
Utilizing the model and methodology delineated in Section 3.1, determine the dimensions and dispersion of the performance metrics pertaining to the specified characteristic points along both the axial orientation and the perimeter of the cross-section. This analysis is conducted under conditions where the feed rate per revolution (f) is 0.1 mm, the spindle speed (n) is 983 revolutions per minute, and the cutting depth (ap) is 0.1 mm. Notably, the plastic strain and residual stress values can be directly extracted, while the work hardening rate necessitates derivation through the stress–strain relationship during the plastic strain phase of the stress–strain curve, as depicted in the provided formula.
η = σ ε
where σ and ε denote the stress and strain during plastic deformation, respectively.
Plastic strain denotes the permanent deformation of a material subjected to external forces, typically manifesting after the material’s yield point. Residual stress serves as a crucial metric for evaluating the surface quality of finished turning operations and plays a pivotal role in assessing the machinability of workpiece materials. The work hardening rate quantifies the extent of hardness augmentation in the material’s surface layer resulting from plastic deformation and thermodynamic influences during mechanical processing.

4.3. Surface and Subsurface Performance Parameter Calculation Results

Based on the characteristic points specified in Section 3.2 and the method for selecting surface and subsurface performance parameters, the characteristic points are selected, and the different surface and subsurface characteristic parameters in the axial and circumferential directions on their cross-sections are extracted. The plastic strain of the characteristic points on the cross-sections where a1 to a5 are located is shown in Figure 9, and the residual stress is shown in Figure 10. Taking a1 as an example, its stress–strain curve is shown in Figure 11. By differentiating the stress–strain plastic deformation stage using the equation, the work hardening rate versus depth curve shown in Figure 12 is obtained.
As shown in Figure 9, Figure 10, Figure 11 and Figure 12, on the machined surface of titanium alloy, the variation characteristics of different surface and subsurface performance parameters along the axial and circumferential directions exhibit certain similarities, but their distribution still exhibits a certain degree of non-uniformity.

5. Calculation Method for Torsional Fatigue Life of Titanium Alloy Turning Surface

5.1. Construction Method of Torsional Strength and Fatigue Life Analysis Model of Titanium Alloys

In the titanium alloy machining surface performance assessment, its fatigue life is an important basis for assessment; the machining surface performance directly determines the fatigue life of the titanium alloy workpiece machining surface. Fatigue life not only reflects the endurance performance of the material under dynamic loading but also reveals the influence of surface properties on the long-term reliability of the material. Therefore, by combining surface properties and fatigue life research, the performance of titanium alloys in practical applications can be more accurately predicted and optimized to ensure their reliability and durability under high-stress and complex environments.
Using the results of processing surface morphology correction in Section 3.4 and Section 4.3 and the results of superficial sub-surface layer performance parameter solving and taking into account the non-uniformity of the distribution of each characteristic parameter on the machined surface of titanium alloys, the titanium alloy torsion model shown in Figure 13 is constructed by taking the cross-section where a4 is located as an example.
Figure 13 illustrates three key distribution functions along the depth direction: g1 represents the plastic strain distribution, g2 denotes the residual stress distribution, and g3 characterizes the work-hardening rate distribution. Additionally, G4(x,y,z) defines the mathematical formulation of the turning transition surface associated with characteristic point a4.
Using ABAQUS, a torsional dynamics simulation is performed on the corrected surface under the conditions of applied initial performance parameters. The maximum stress of the frame before torsional fracture is extracted as 670 MPa, recorded as the torsional strength, and the corresponding maximum torque under the current conditions is 360 N m. When the workpiece undergoes torsion, the nominal shear stress it experiences is approximately 167.5 MPa (≈τmax/4 [23]). When the nominal shear stress is 167.5 MPa, the torque T is approximately 90 N m. Therefore, in fatigue life analysis, a torque of 90 N m is uniformly selected for finite element simulation. Under the action of the maximum torque, the equivalent stress, plastic strain, and torsion process of the corrected surface are shown in Figure 14 and Figure 15, while the torsion process of the simulated surface of the titanium alloy under the maximum torque is shown in Figure 16.
Based on the results of the analysis of the torsion process, it is clear that the non-uniformity in the distribution of the machined surface morphology and the superficial sub-surface property parameters leads to significant differences in the location of the torsional fracture, which results in a deviation from the center of the workpiece.

5.2. Torsional Strength and Fatigue Life Analysis Program for Titanium Alloys

As evident from Figure 15 and Figure 16, the stress and strain distributions demonstrate pronounced non-uniformity during torsional plastic deformation of the titanium alloy workpiece. This heterogeneity stems from variations in both the initial characteristic surface parameters and their spatial distribution. Such non-uniform deformation induces localized stress concentrations, which may precipitate premature damage initiation or fatigue failure, ultimately compromising the material’s mechanical performance and fatigue life. This study systematically analyzes how machined surface topography parameters and surface/subsurface performance characteristics influence the torsional strength, maximum torque, fatigue life, and fracture location of titanium alloy workpieces. These effects are evaluated through different parametric definitions, with the specific performance parameter configurations detailed in Table 7.

5.3. Titanium Alloy Torsional Strength Solution Results

Groups 1–3 are simulation experiments with different machined surface topographies under the same surface and subsurface performance parameter conditions. Their initial states, torsional stress fields, and torsional fracture points are shown in Figure 17. When the machined surface topography is an ideal smooth surface and the surface/subsurface performance parameters are all zero, the torsional strength of the titanium alloy workpiece reaches a maximum of 1170 MPa, with the corresponding maximum torque being 630 N m, The torsional fracture position is any point on the central section where a3 is located. When the machined surface topography is a surface with uniform wave crests, wave troughs, and their spacing, and the surface/subsurface performance parameters are all zero, the maximum torque of the titanium alloy workpiece decreases to 340 N m, with a large decline. The torsional fracture point is still any point on the central section where a3 is located. When the machined surface topography is a modified surface and the surface/subsurface performance parameters are all zero, the maximum torque continues to decrease to 300 N m. However, the position of the torsional fracture point is between the sections corresponding to a3 and a4, and the fracture point is unique. It can be seen from the calculation results that when the machined surface topographies are different, the maximum torque, fatigue life, and fracture position of the titanium alloy workpieces are different.
Groups 4–6 are the simulation calculation results of single-factor analysis on the mean values of plastic strain, work hardening rate, and residual stress, as shown in Figure 18. The fracture positions are all arbitrary points on the central section where a3 is located. When plastic strain acts alone, the maximum torque decreases compared to Group 3, indicating that plastic strain has a negative effect on the maximum torque; when residual stress acts alone, the maximum torque increases by 30.00% compared to Group 3, rising to 390 N m, showing a significant improvement; when the work hardening rate acts alone, the maximum torque increases by 16.67% compared to Group 3, rising to 350 N m, with the improvement range smaller than that of residual stress.
The maximum torque and fracture location corresponding to Groups 7–10 are shown in Figure 19. They are the results of solving the minimum, average, and maximum values of the three surface sub-surface performance parameters under the same machined surface morphology conditions and the inhomogeneous distribution, respectively. As can be seen from the figure, when the performance parameter increases from the minimum value to the maximum value, the maximum torque of Groups 7–9 increases continuously, which is 450 N m, 480 N m, and 560 N m, respectively, but there is no change in the location of the torsional fracture. Under the condition of Group 10, its maximum torque is smaller than 450 N m of Group 7, which is 420 N m. It shows that the load-carrying capacity and maximum torque decrease under the uneven distribution. From the solution results, it can be seen that when the machined surface topography is the same, applying the uniform surface sub-surface performance parameter has different effects on the maximum torque, but it has no effect on the location where the torsional fracture occurs. Among the three, the residual stress has the greatest positive effect on the maximum torque, the work-hardening rate is the second highest, and the plastic strain causes the maximum torque to decrease.
The maximum torque and torsional fracture locations for Groups 10 and 11 are shown in Figure 20. As can be seen from the figure, under the condition of the same initial performance parameters of the surface sub-surface layer, the maximum torque and torsional fracture point of titanium alloy workpieces are different with different surface morphology, which indicates that the surface morphology of the processed surface plays a decisive role in the torsional fracture location of titanium alloy workpieces. The maximum torque of the titanium alloy workpiece is higher than that of the modified titanium alloy workpiece when the surface morphology is more uniformly distributed, with the same subsurface property parameters.

5.4. Titanium Alloys Fatigue Life Solution Results

This study establishes a torsional fatigue life analysis procedure for TC6 titanium alloy turned workpieces based on the fatigue life analysis function of FE-SAFE, with a detailed examination of its key components. The FE-SAFE fatigue analysis is conducted using ABAQUS simulation results as input data. Therefore, the initial modeling must be performed in ABAQUS to generate and export the necessary stress and strain parameters. In the subsequent FE-SAFE analysis, the Rainflow counting algorithm is applied at each nodal point to determine fatigue cycle counts and predict fatigue life.
During the FE-SAFE preprocessing phase, surface roughness and residual stress are incorporated as boundary conditions for the workpiece. The material constitutive model is calibrated using the Seeger algorithm, with key mechanical properties including elastic modulus and torsional strength being explicitly defined. A dedicated S-N curve is established to characterize the material’s fatigue behavior. Following the material property definition, the stress–strain results from the final torsional state are imported into FE-SAFE. The fatigue life assessment of TC6 titanium alloy turned workpieces is then performed using the S-N curve algorithm. The variation curves of fatigue life with torque for different surfaces are shown in Figure 21.
As can be seen from Figure 21, when the torque is 90 N m, the fatigue life of the ideal smooth surface titanium alloy specimens shows a significant decrease, and at this torque, the fatigue life of each group differs greatly, which is easier to analyze, verifying the validity of the selection of 90 N m torque as mentioned in the previous section.
The fatigue life of each point a1a5 of the current turning surface is solved, and the results are shown in Figure 22.
Figure 22 presents the calculated maximum torque and fatigue life values at characteristic points a1a5 on the machined turning surface. The results demonstrate substantial spatial variations in both mechanical properties across different axial positions of the titanium alloy workpiece. A clear correlation emerges between proximity to the fracture location and reduced performance metrics, with nearer points showing systematically lower maximum torque and fatigue life values. Although points a1a5 display limited consistency under identical processing conditions, the overall variation remains considerable. Most significantly, point a4 exhibits a markedly reduced fatigue life (approximately X% lower than the average of other points), indicating potential localized processing defects or non-uniform parameter distribution that warrant further investigation.
By analyzing the fatigue life of different characteristic points at corresponding angles, their degree of unevenness was obtained, as shown in Figure 22. The calculation results indicate that the fatigue lives of points a3 and a4 exhibit obvious fluctuations, suggesting poor distribution consistency.
It can be seen from the solution results that the fatigue life distribution of different feature points along the axial direction on the machined surface of titanium alloy is still quite different, and the fatigue life of the feature points close to the fracture position is lower. According to the results, although feature points a1a5 show some consistency under the same process parameters, the overall consistency is not high, and the fatigue life of feature point a4 is significantly lower than that of other points, which indicates potential processing problems and uneven distribution. The fatigue life at points a3 and a4 shows obvious fluctuations and poor distribution consistency, as shown by the solution results.

6. Torsional Fatigue Property and Distribution Characteristic Identification Method of Titanium Alloy Turning Surface

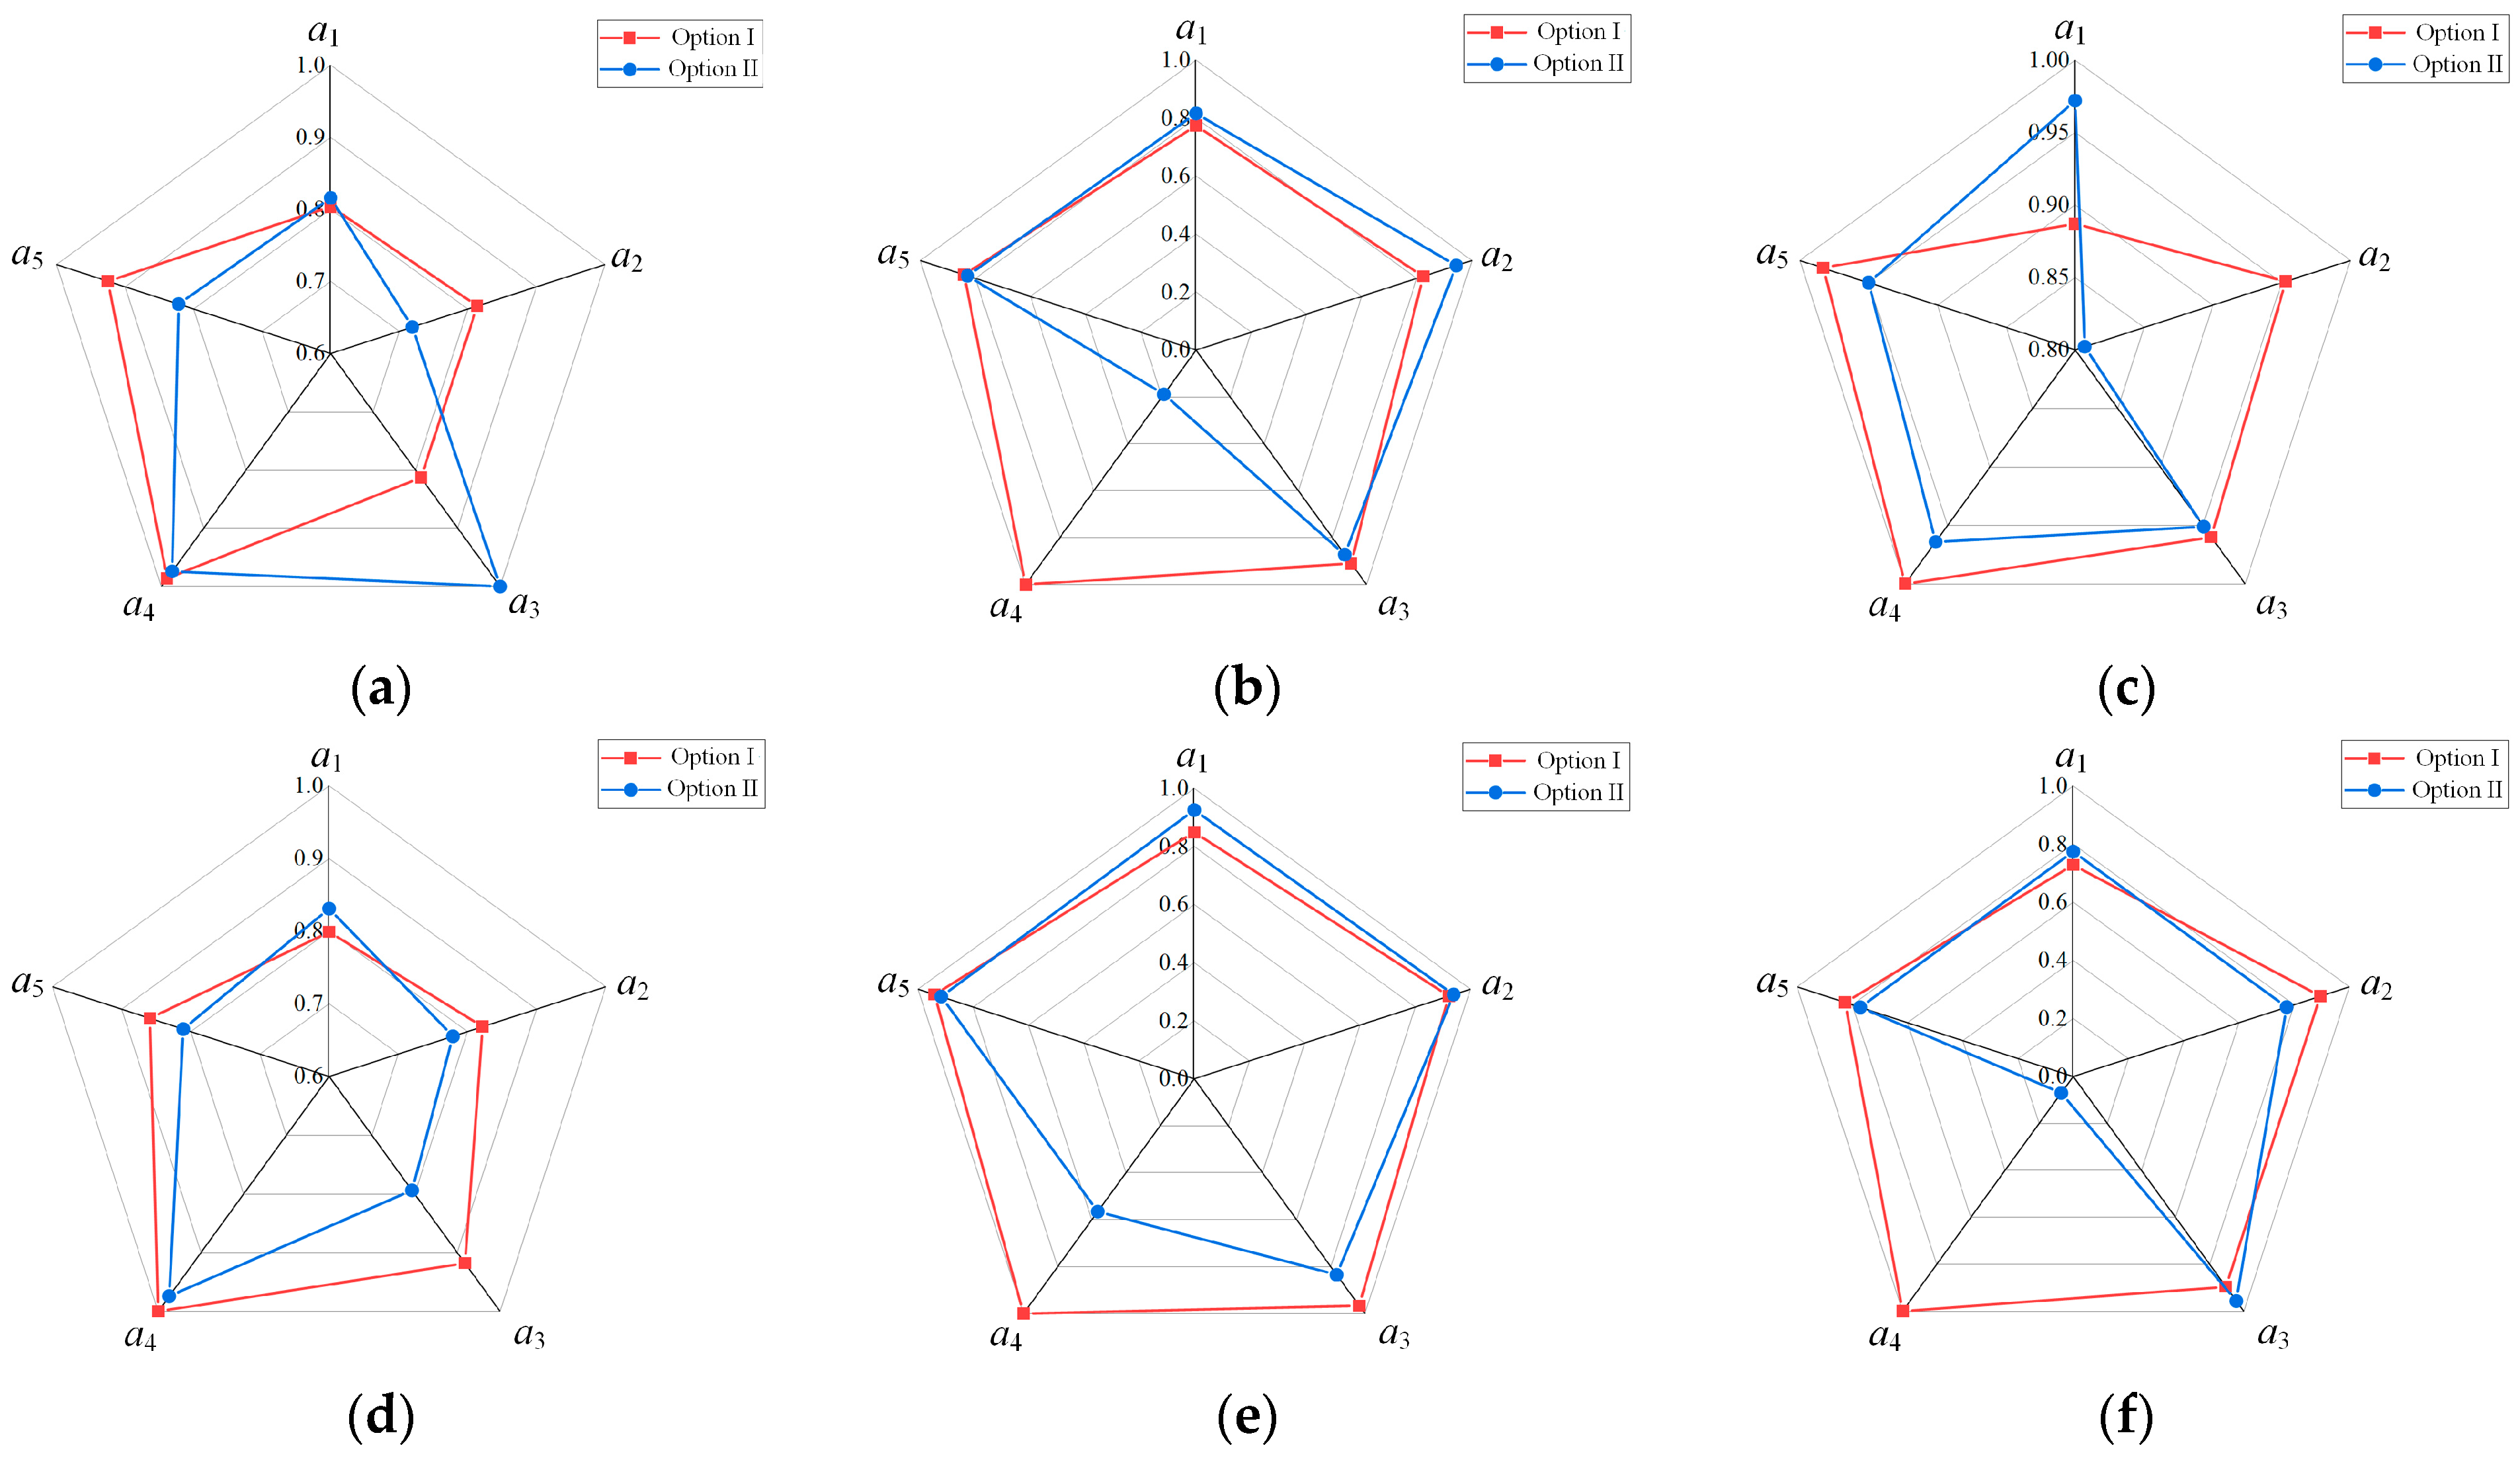
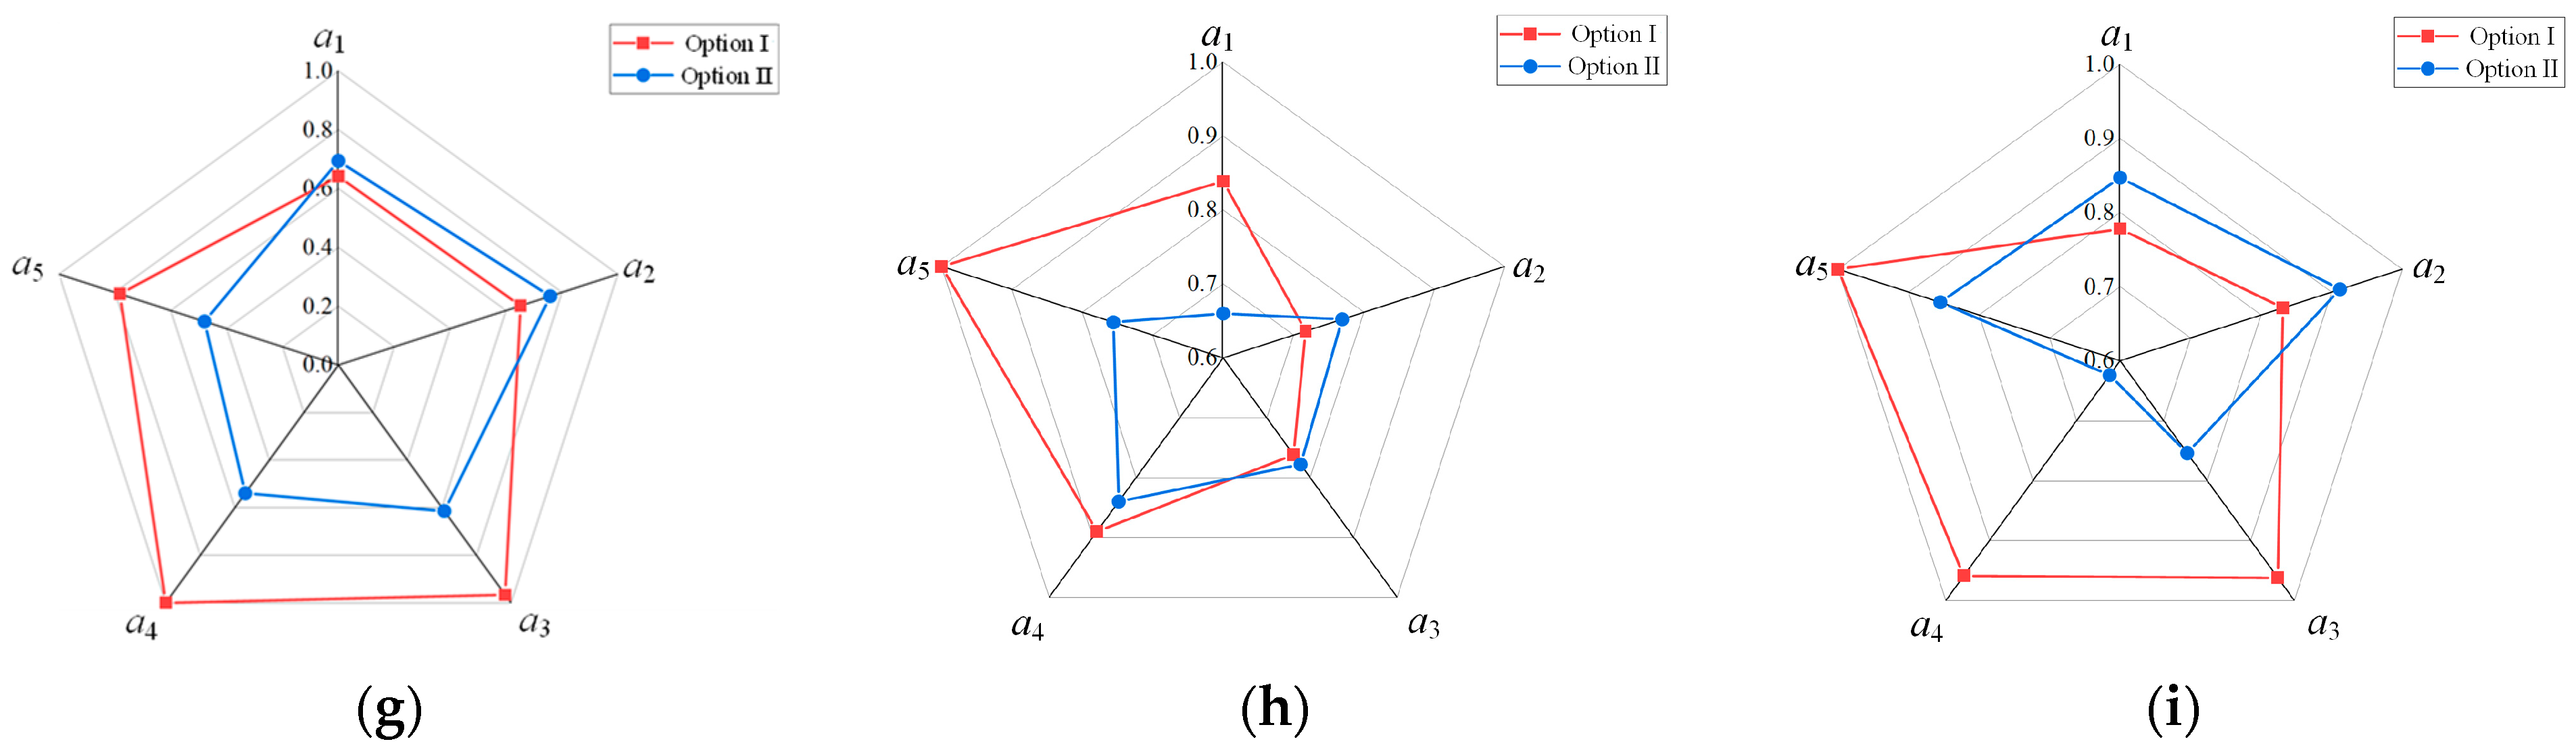
6.1. Identification Method for Torsion Fatigue Performance and Its Distribution Characteristics

The titanium alloy turning surface torsional fatigue performance parameter identification method is shown in Figure 23.

6.2. Comparison and Analysis of Calculation Results for Different Turning Process Solutions

To validate the effectiveness of the method for identifying surface torsional fatigue performance parameters in titanium alloy turning, turning simulations and experimental tests were conducted using the same cutting tool, workpiece, mounting method, cutting method, and testing method as in Section 3.4, Scheme 1. The feed rate per revolution f was 0.1 mm, the spindle speed n was 1081 r/min, and the cutting depth ap was 0.1 mm.
The surface morphology of Scheme 2 was calculated and corrected for comparison, as shown in Figure 24.
Grey relational analysis was employed to evaluate the correlation between section profiles and experimental data. The pre-correction relational grade measured 0.88, increasing to 0.97 post-correction, demonstrating strong correlation characteristics. This optimized correlation significantly exceeds the performance observed in Scheme 1.
The titanium alloy turning process under the Scheme 2 parameters was simulated using ABAQUS finite element analysis. Five identical characteristic points corresponding to Scheme 1 were selected for comparative analysis. Material properties were initialized using the same definition methodology as Scheme 1, with consistent torsional loading application procedures. The resulting torsional response characteristics are depicted in Figure 25.
Finite element (FE) simulation results from the torsional fracture analysis were subsequently processed in FE-SAFE for fatigue life prediction. Scheme 2 demonstrates a fatigue life of 3.72 × 10⁵ cycles under cyclic loading conditions. Comparative performance metrics, including peak torque, fatigue life expectancy, and fracture locations for both experimental Schemes, are systematically presented in Table 8.
Table 8 reveals that Scheme 2 exhibits a 19.44% increase in peak torque and a 45.88% enhancement in fatigue life compared to Scheme 1. Furthermore, the torsional fracture location demonstrates closer proximity to the titanium alloy specimen’s axial midpoint, suggesting improved uniformity in both material performance parameters and surface morphology characteristics.
Calculate the maximum torque and fatigue life of each point a1~a5 in Scheme 2, and the calculation results are shown in Figure 26. Compared with the first Scheme, the overall consistency of the second Scheme is improved after the optimization of process parameters. The radial maximum torque and fatigue life of the turning surface are more uniform, and the maximum torque and fatigue life of each feature point are improved.
By analyzing the fatigue life of different feature points corresponding to the angle to obtain their uneven degree, the results are shown in Figure 26. Through analysis, the error of characteristic point a3 at all angles is relatively high, indicating that fatigue fracture is more likely to occur near a3.

6.3. Comparison and Analysis of Experimental Methods and Measurement Results

The measurement method shown in Figure 5 of Section 2.2 was used to detect the five characteristic points of Scheme 1 and Scheme 2 separately. In surface morphology analysis, measurements were conducted within a 1 mm radius of the titanium alloy workpiece’s characteristic points. Figure 27 presents the test results for Scheme 1, revealing uniform and smooth surface morphology at positions a1 and a2. Figure 27 demonstrates that the characteristic parameters of surface morphology exhibit greater heterogeneity at positions a3 and a4 compared to other measurement points in Scheme 1. From a3, surface roughness and irregular texture increase significantly, while surface defects become more pronounced at a4, suggesting the presence of micro-defects or stress concentration zones. These material imperfections promote fatigue stress accumulation between a3 and a4, initiating crack propagation that ultimately leads to fracture in this region.
The results of Scheme 2 are shown in Figure 28. The surface morphology at points a1 and a2 is relatively smooth and regular, while the surface morphology at point a3 exhibits more obvious roughness and an increase in microdefects. Due to pre-existing defects or stress concentration within the material, stress tends to accumulate and propagate cracks between points a2 and a3 during fatigue testing, resulting in fractures occurring in this region. The surface topography of the processed cross-sections at different characteristic points for Scheme 2 is shown as illustrated. The normalized comparison results of the characteristic parameter standard deviations between Scheme 1 and Scheme 2 are shown in Figure 29. As can be seen from the figure, Scheme 2 generally performs better than Scheme 1 under most parameters. In particular, the standardized values of parameters x and z are close to 1, indicating Scheme 2′s advantage in processing accuracy. In comparisons of spacing Δx and Δz in different directions, Scheme 2 also demonstrates significantly more consistent performance at most feature points.
The change in element content reflects the difference in surface characteristic parameters directly, which can effectively reveal the performance difference of the machined surface in different regions. Element composition and content ratio of the titanium alloy turning surface were obtained by SU5000 scanning electron microscope and energy spectrum analyzer, and element content of different machined surfaces and different positions of the same machined surface were analyzed and compared. The SEM scanning results of Scheme 1 and Scheme 2 and their area scanning element distributions are shown in Figure 30.
Figure 30 reveals that Scheme 1 exhibits inferior surface quality relative to Scheme 2, displaying increased surface defects, localized microcracks, and porosity. The results of scanning electron microscope testing show that there is obvious plastic deformation on the surface of the titanium alloy turned parts. These observations suggest localized stress concentration during machining. In contrast, Scheme 2 demonstrates a smooth, dense surface morphology, achieved through optimized machining parameters that enhance titanium alloy surface integrity. Figure 31 comparatively presents the elemental composition of machined surfaces from both Schemes.
As can be seen from Figure 31, after turning processing, the element content of α-phase elements C and N is significantly increased, and the element content of Al decreased by about 25%; The neutral element Si decreased from 0.40% to 0.25%, and the matrix element Ti decreased significantly. Compared with Scheme 1, the content of β-phase elements in Scheme 2 was higher, and the content of Cr, Fe, and Mo increased by 83.87%, 16.28%, and 45%, respectively. The content of α-phase elements in the three different surfaces was 7.13%, 18.25%, and 15.85%, respectively, and the content of β-phase elements was 6.00%, 3.87%, and 5.97%, respectively. The α-phase element content of the ideal titanium alloy workpiece without machining is low, and the β-phase element content is high, which makes it have better mechanical properties. However, after machining, the α-phase element content of Scheme 1 is higher than that of Scheme 2, and the β-phase element content is lower than that of Scheme 2, resulting in poor mechanical properties and low fatigue life.
Point scanning energy spectrum detection was performed on different characteristic points of the machined surface of Scheme 1, as shown in Figure 32. The detection results are shown in Figure 33.
The α-phase element ratios for a1 to a5 are 17.06%, 16.54%, 17.20%, 18.5%, and 15.09%, respectively, while the β-phase element ratios are 4.77%, 4.89%, 3.74%, 3.58%, and 5.04%. The α-phase element ratios for both a3 and a4 are higher than those of the other points, and the β-phase element ratios are lower than those of the other points, indicating that the brittleness increases between these two points, reducing ductility and toughness, leading to fatigue fracture first. The element content of the machining surface at different positions under the same process parameters shows obvious inhomogeneity. The uneven distribution of surface element content in this titanium alloy machining further affects the difference in its mechanical properties.
Scanning electron microscopy (SEM) analysis of the fracture surface reveals fine crack initiation sites and microstructural defects, including non-uniform particle distribution and micropores. These imperfections serve as stress concentration points. Pre-existing defects and localized stress concentrations predispose the material to accelerated crack propagation and fracture under subsequent torsional fatigue loading. This fracture mechanism primarily arises from cumulative micro-defect aggregation and localized stress intensification during cyclic loading.
In Scheme 2, point scanning spectroscopy was used to detect different characteristic points on the surface of turning. The test results are shown in Figure 34.
The α-phase element content of a1~a5 was 13.27%, 14.64%, 16.54%, 12.56%, and 12.06%, respectively, and the β-phase element content was 8.12%, 5.11%, 4.49%, 7.46%, and 7.96%, respectively. The α-phase element ratio of a2 and a3 is higher than that of other points, and the β-phase element ratio is lower than that of other points, resulting in the earliest fatigue fracture in the interval between two points. Compared with the fracture interval detection results of Scheme 1, there was no obvious non-uniform particle and hole formation on the surface of the titanium alloy workpiece of Scheme 2. Although dislocations and other phenomena still existed in some local areas, there were no obvious microcracks.

7. Conclusions

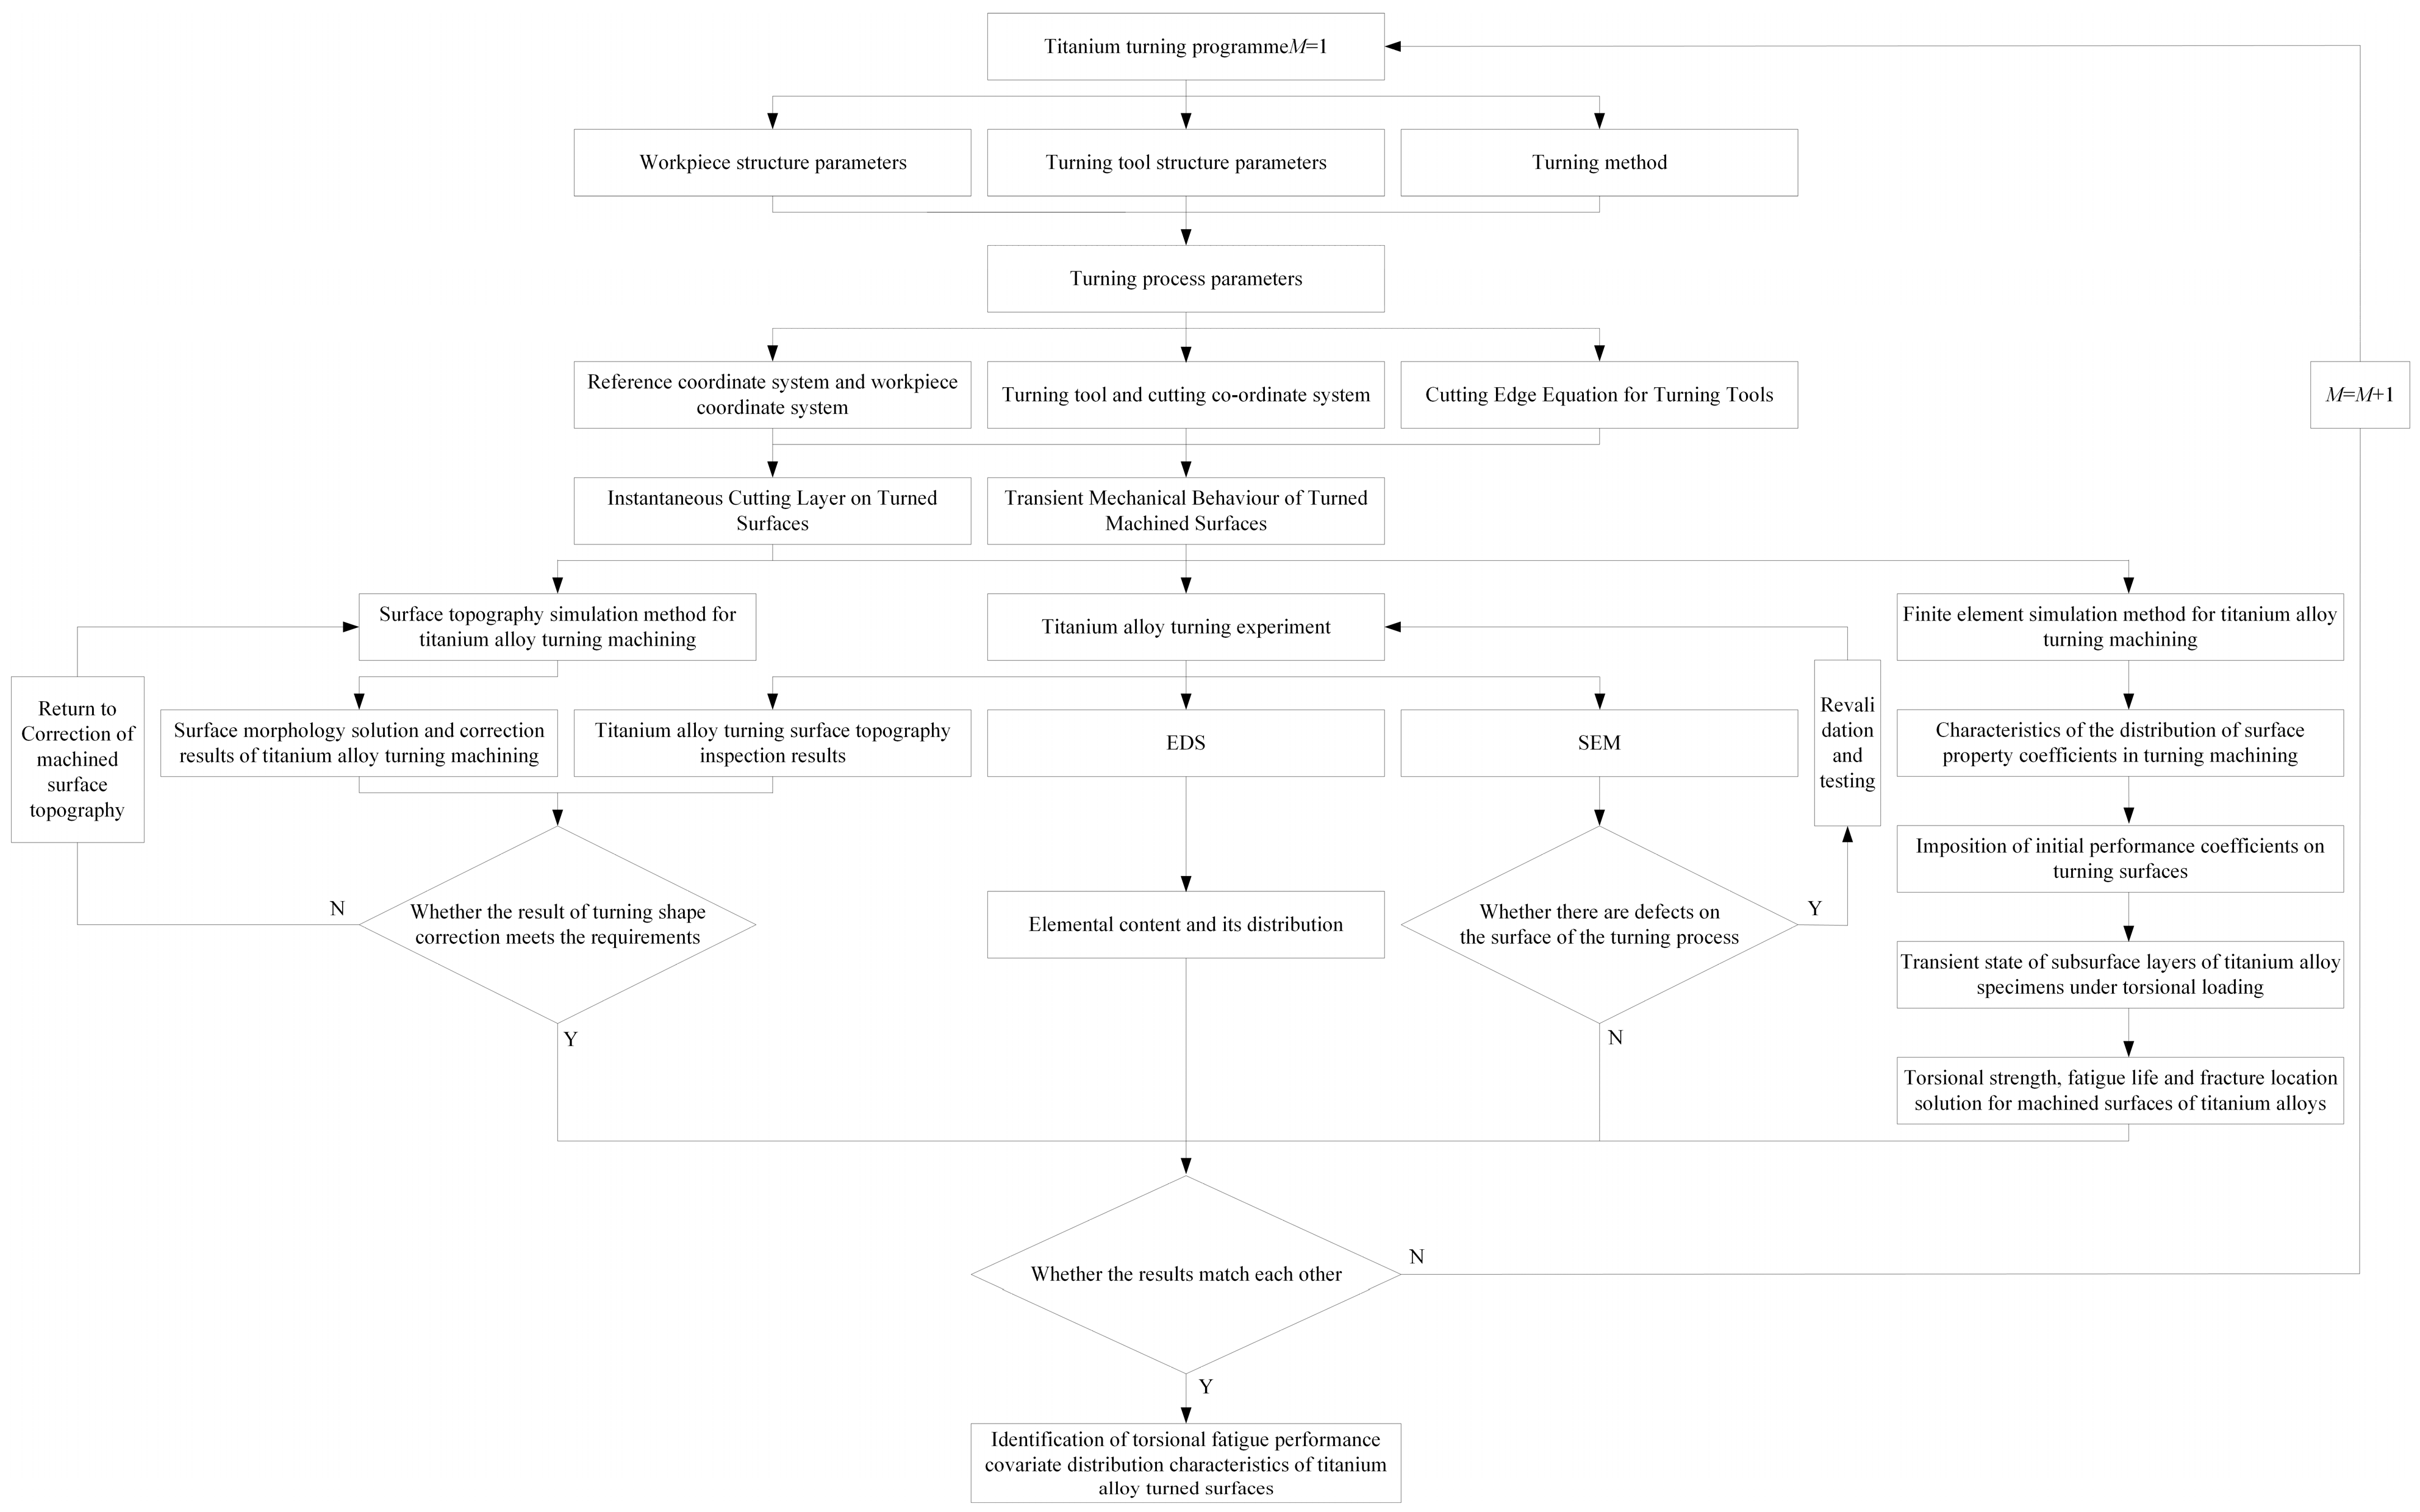
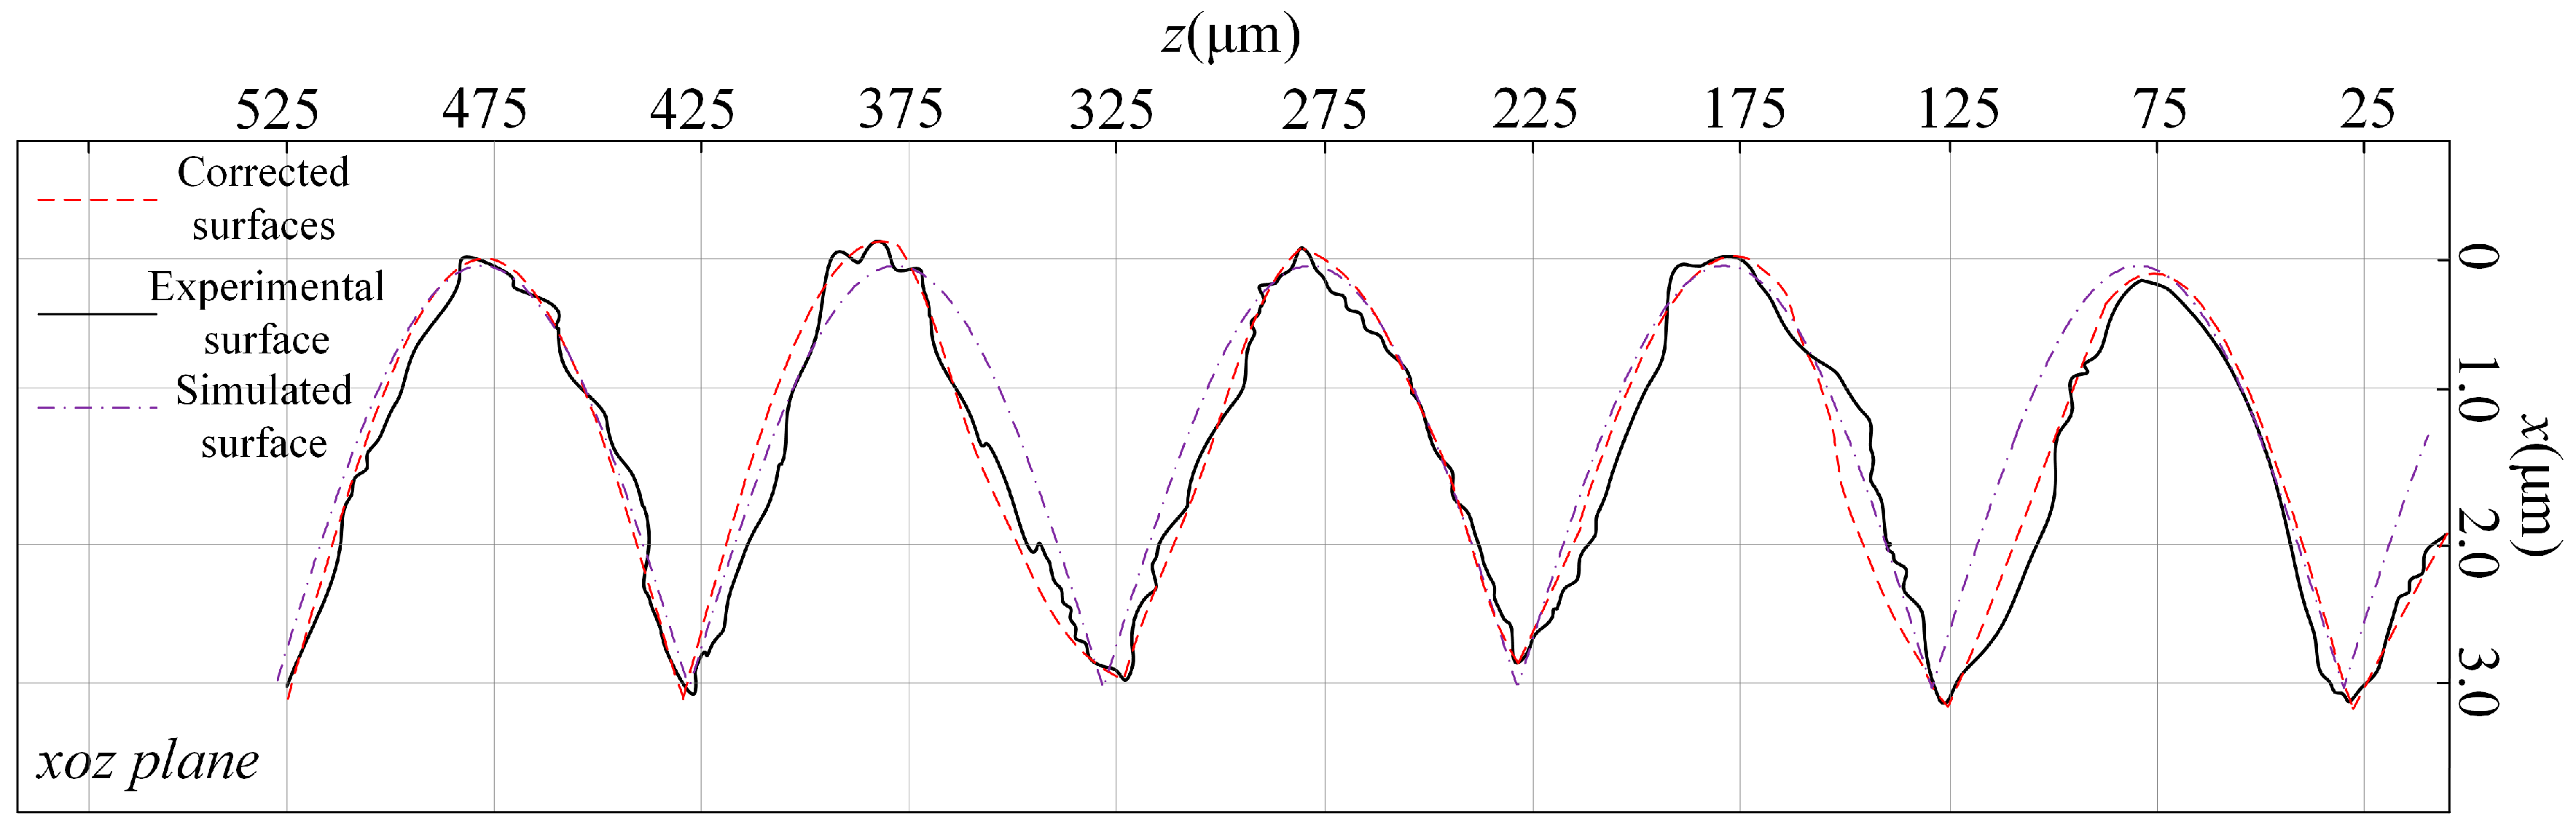
  • To account for the influence of tool geometry parameters, cutting parameters, and cutting forces on tool-workpiece surface morphology, an instantaneous cutting behavior model was developed. Parametric equations describing the primary and secondary cutting edges, along with their transitional arc segments, were formulated. Solutions for machining transition surfaces across adjacent cutting cycles were derived. A methodology for characterizing instantaneous cutting layers and mechanical responses during titanium alloy machining was established. Furthermore, a simulation framework and surface morphology correction model were implemented to analyze machined titanium alloy surfaces.
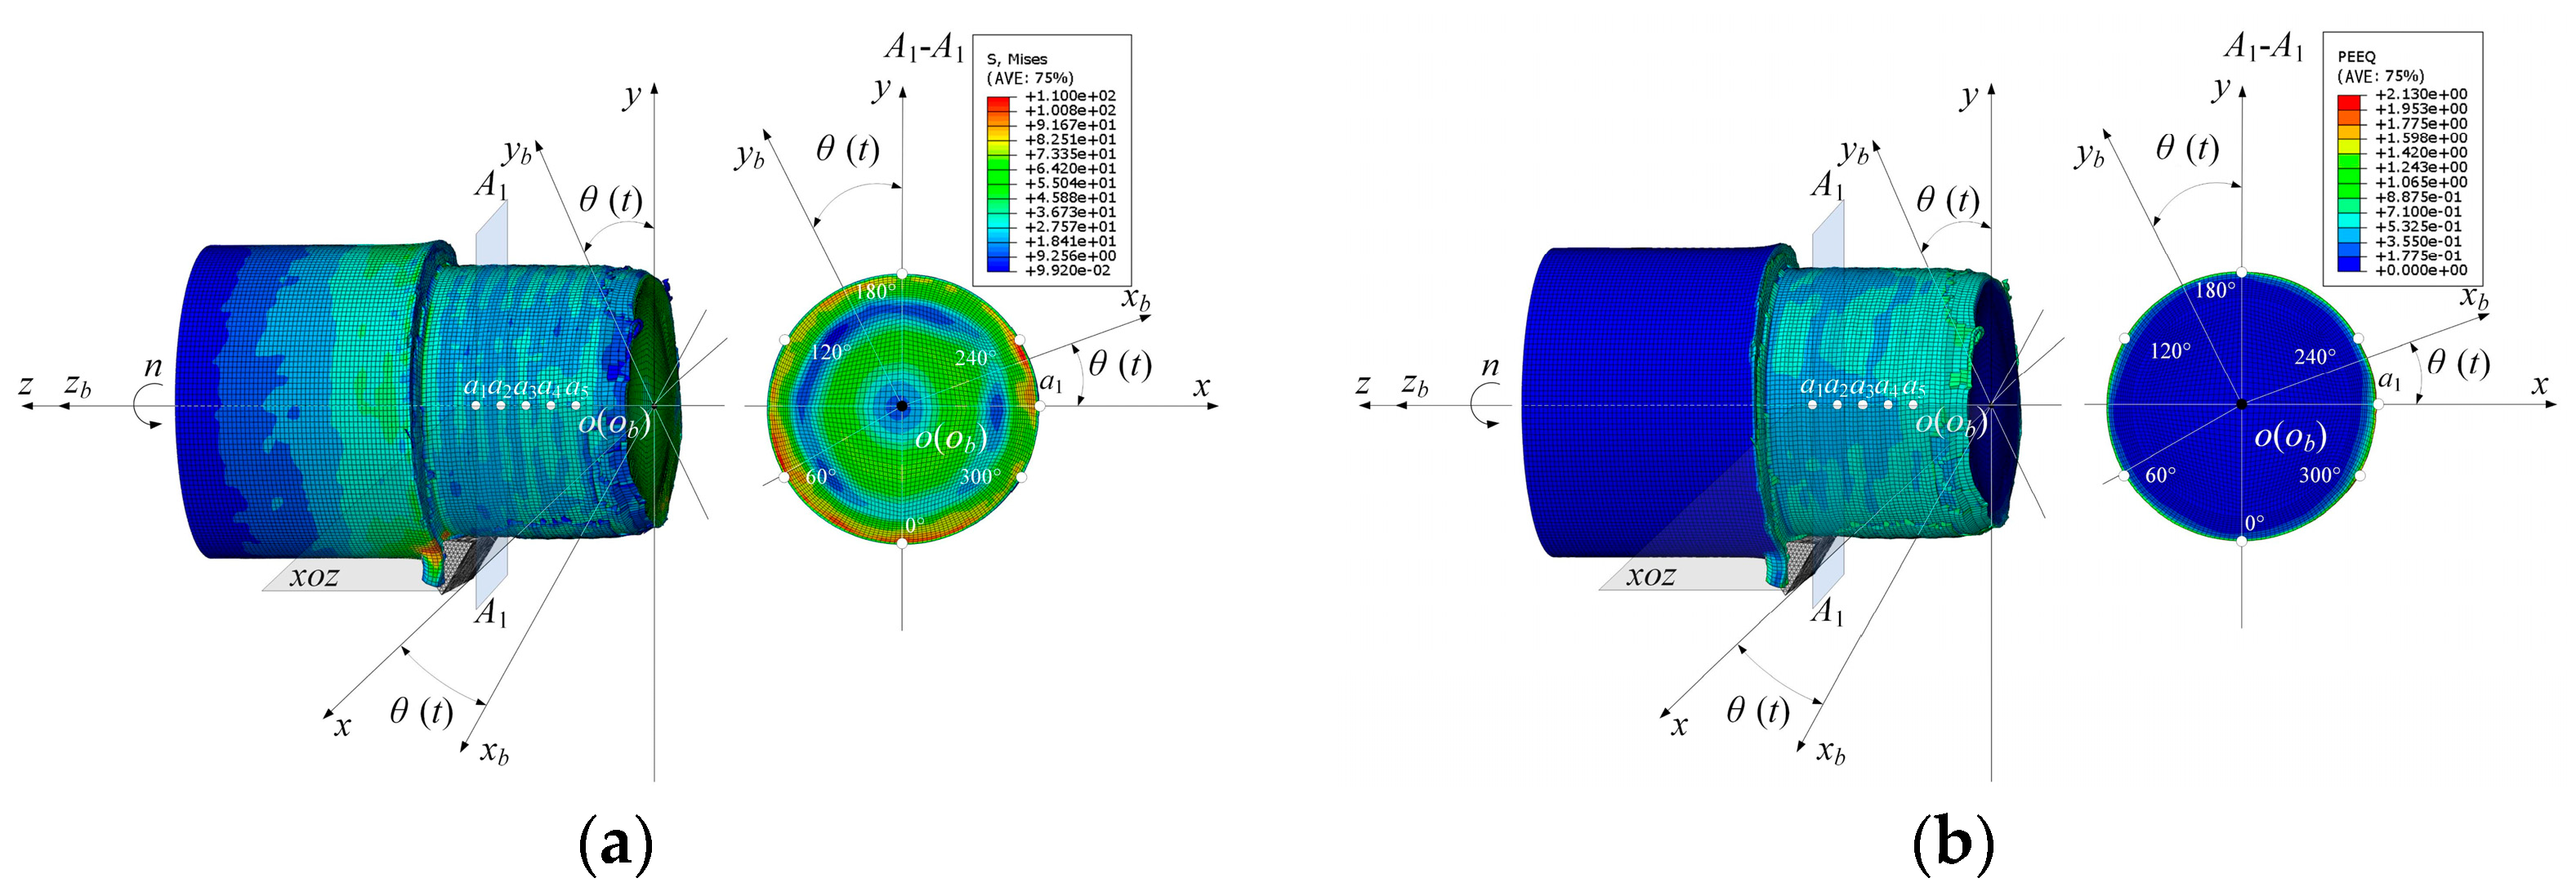
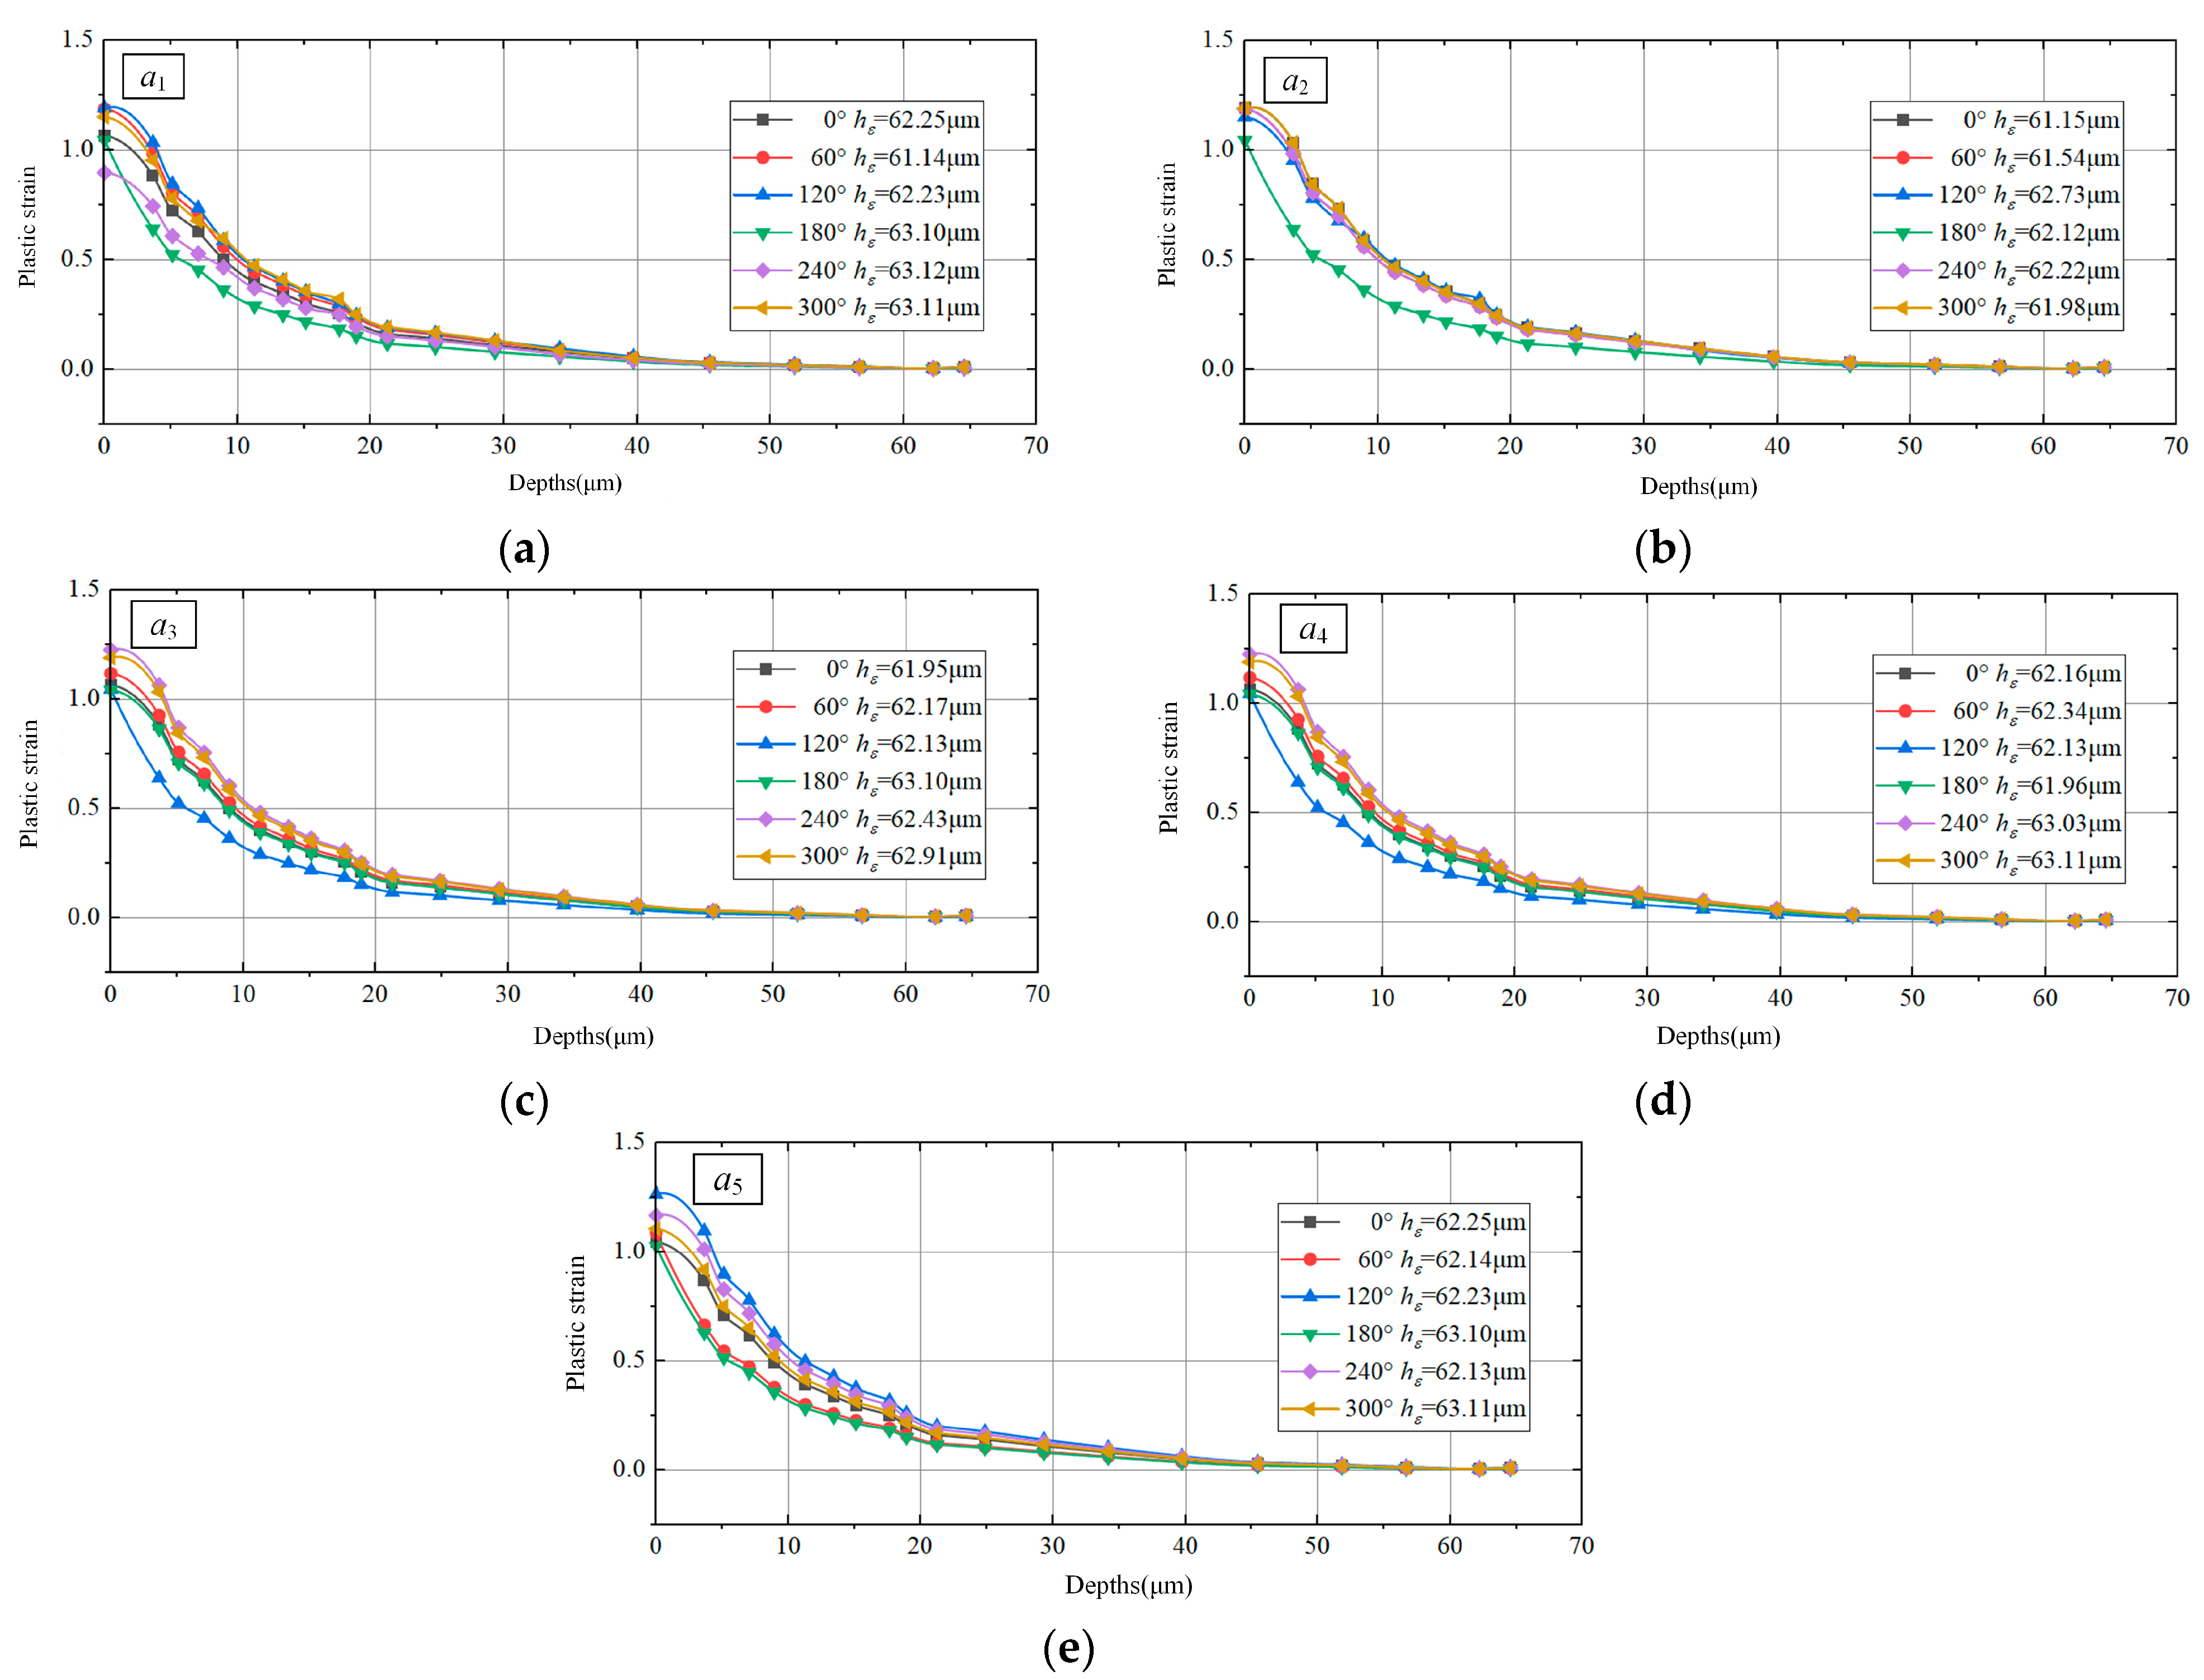
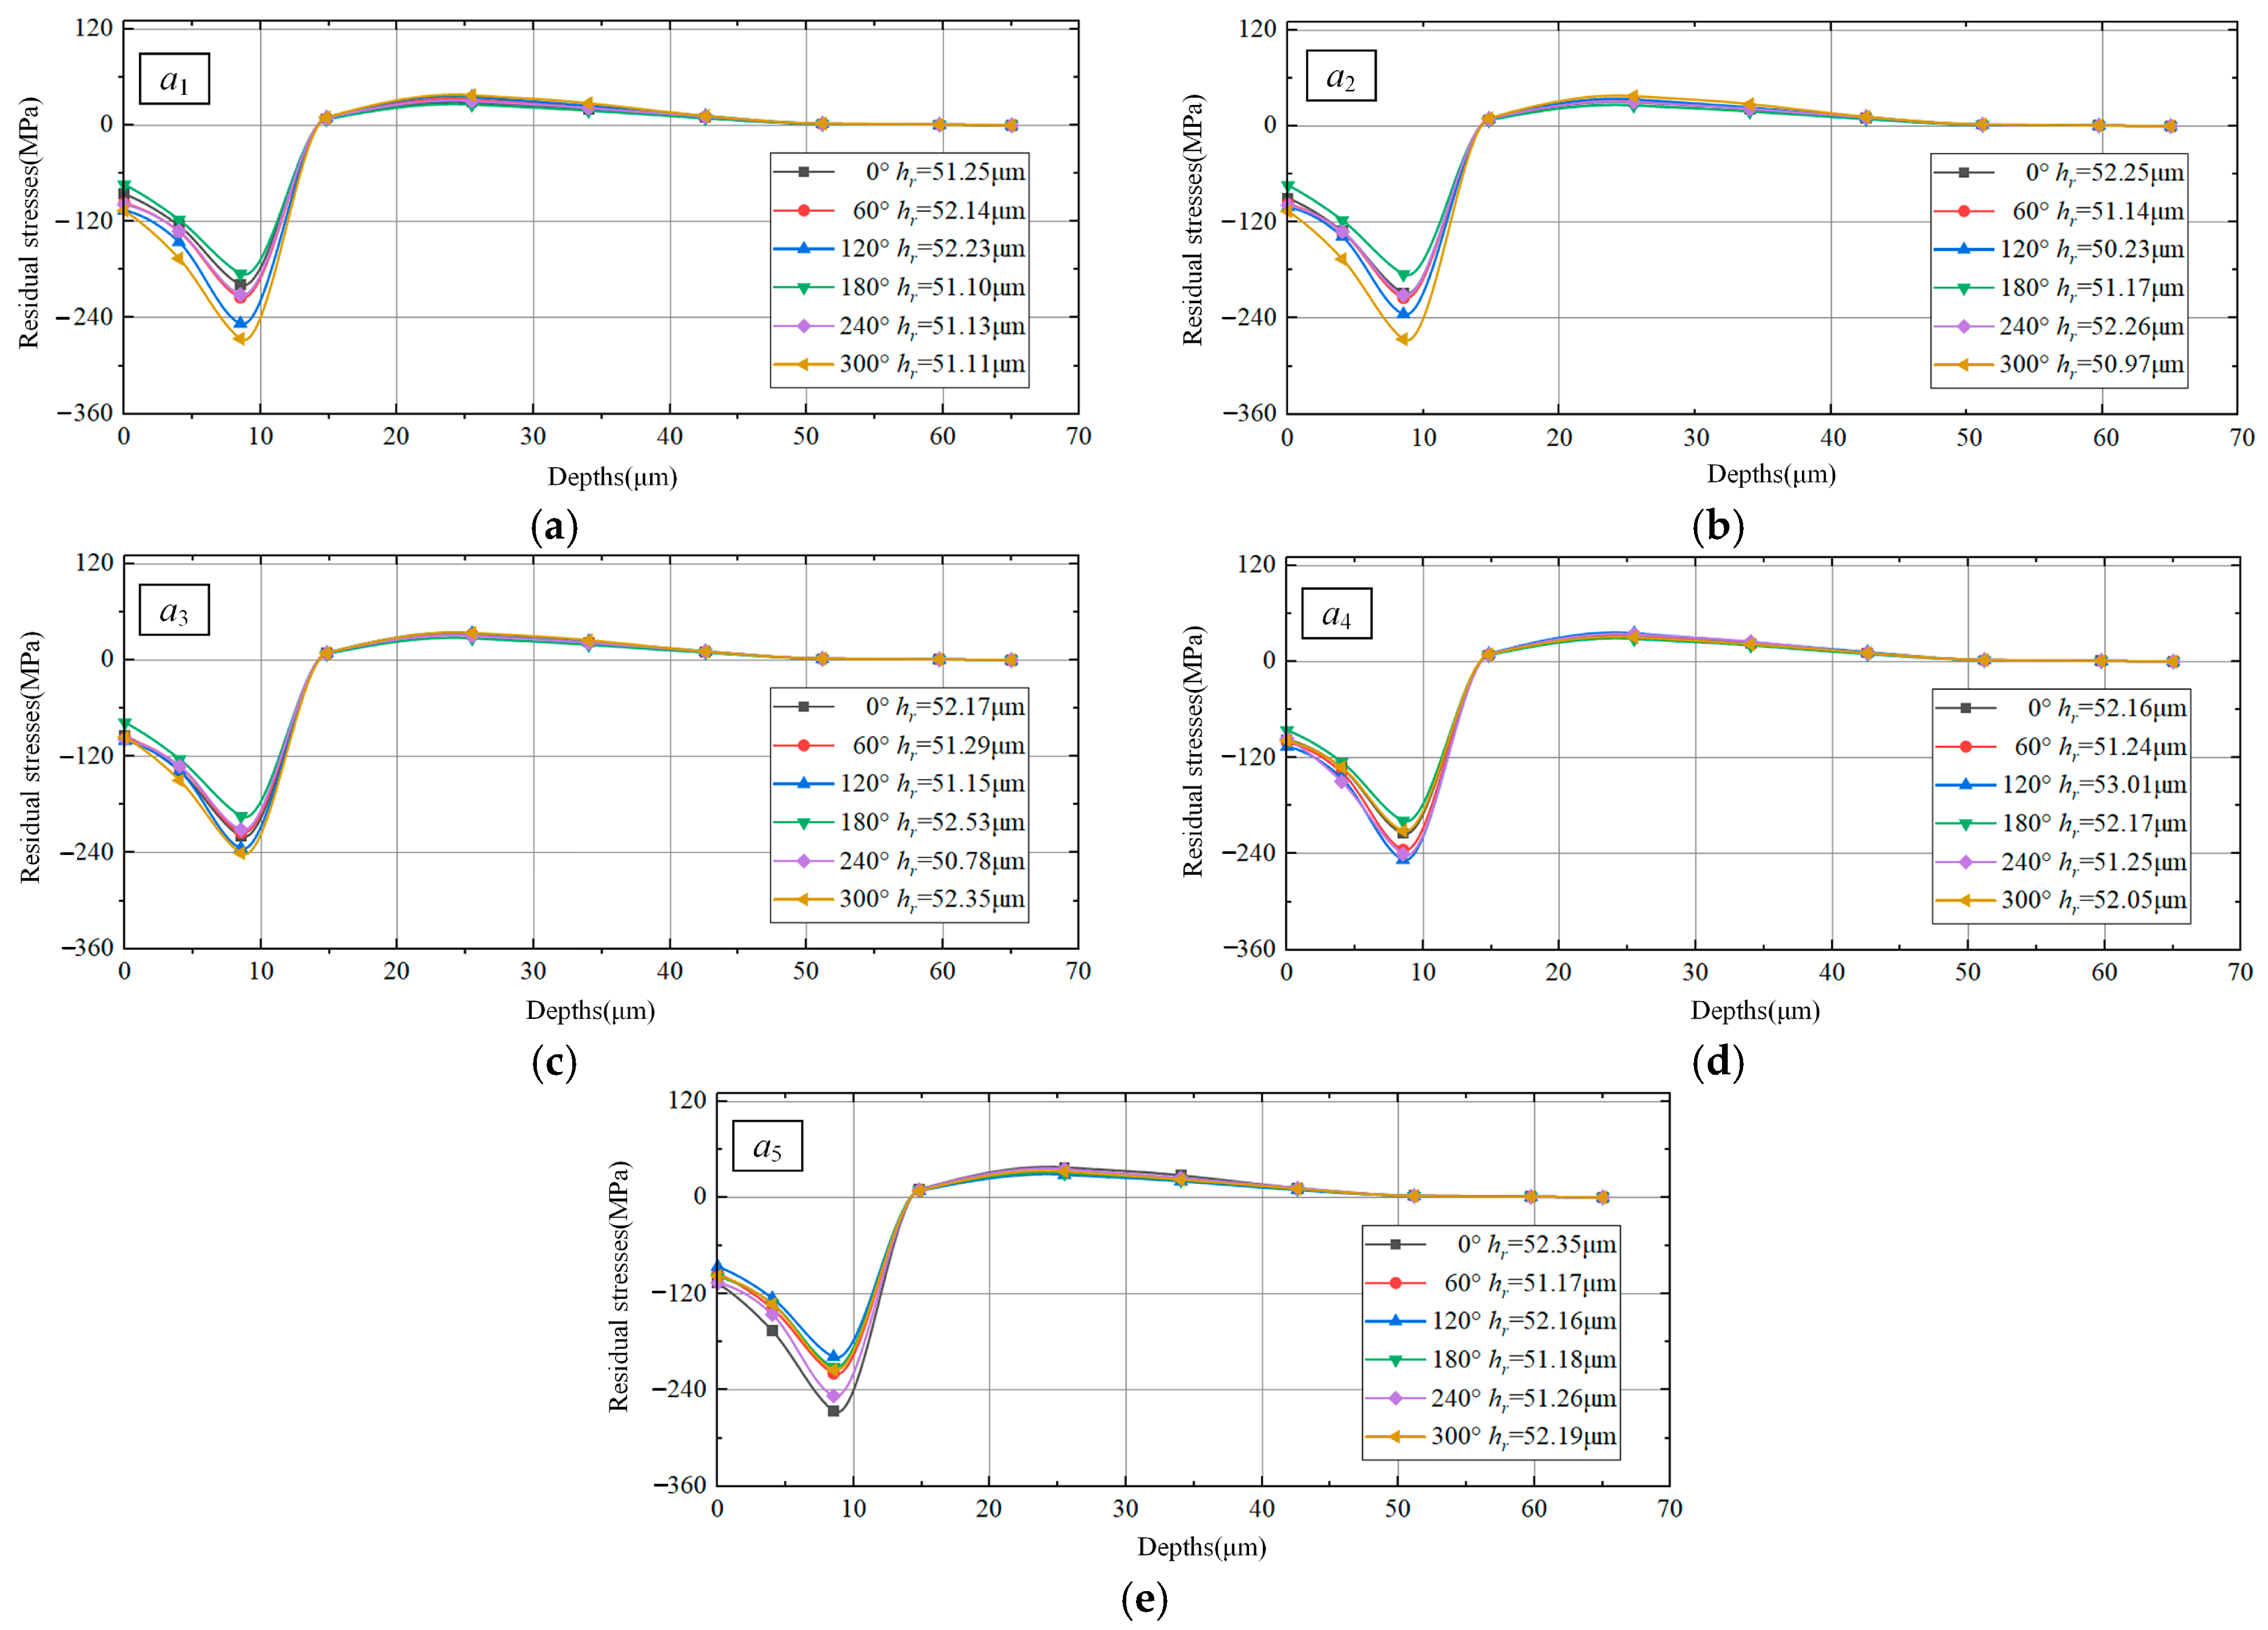
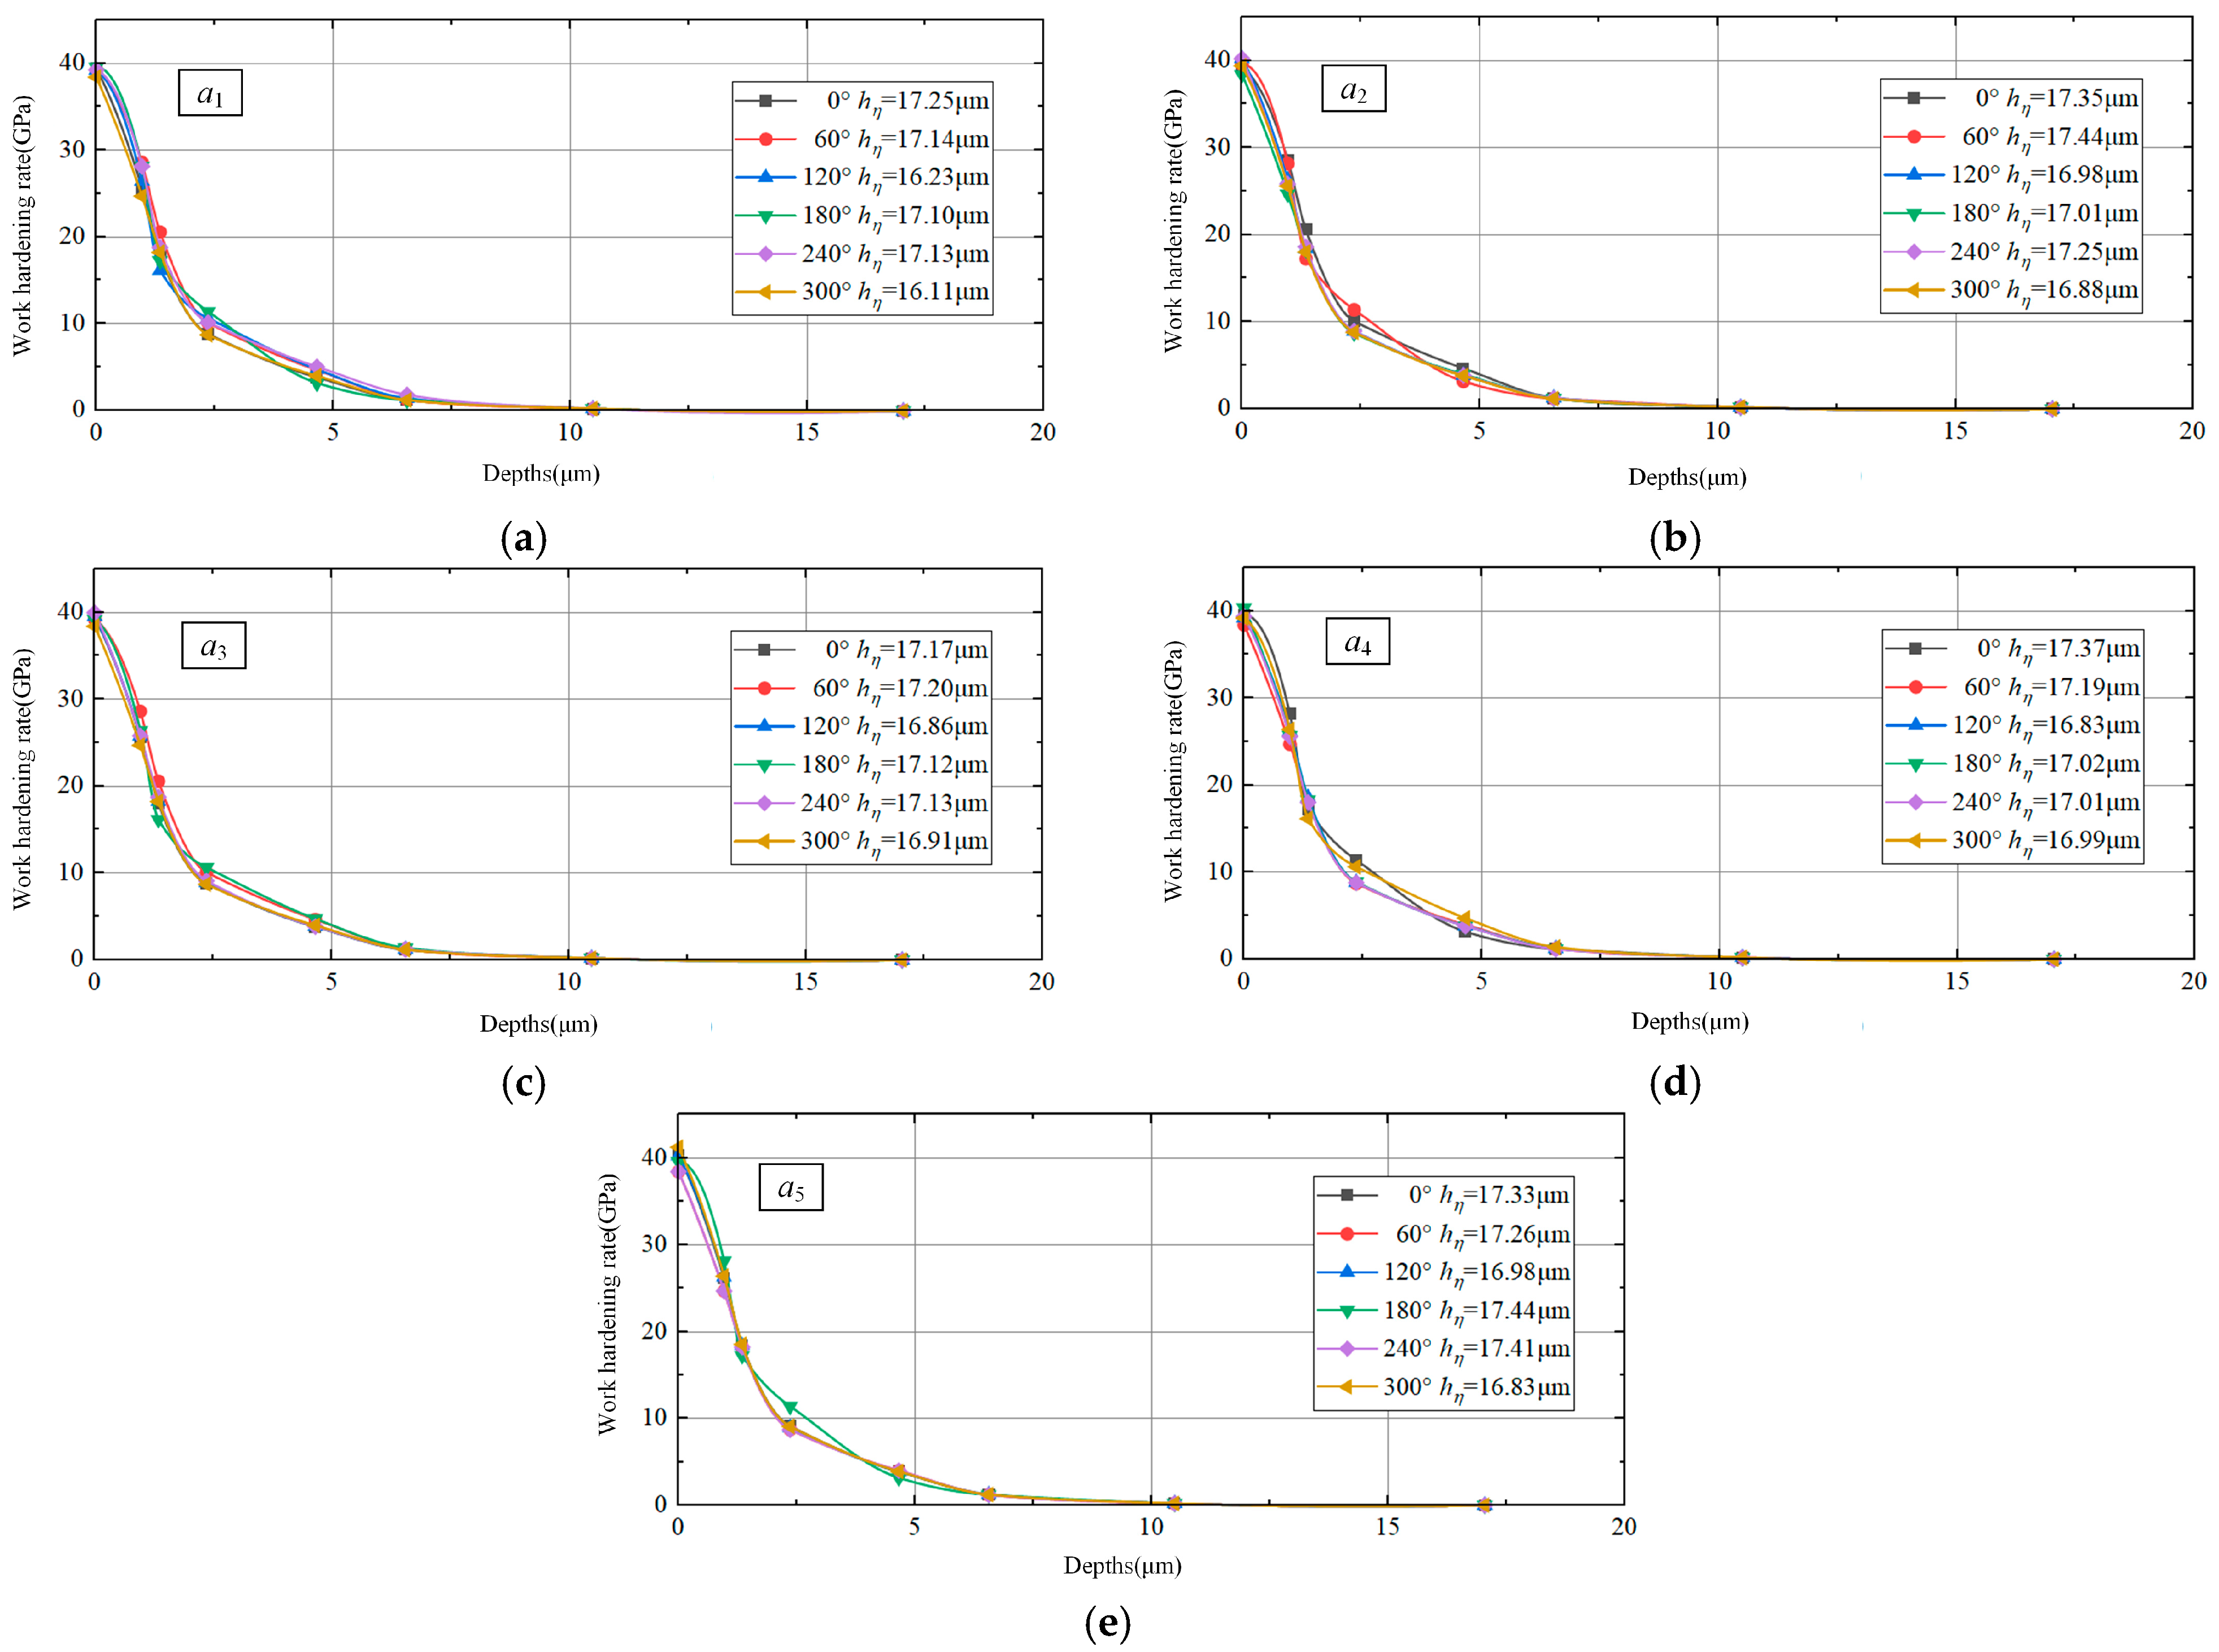
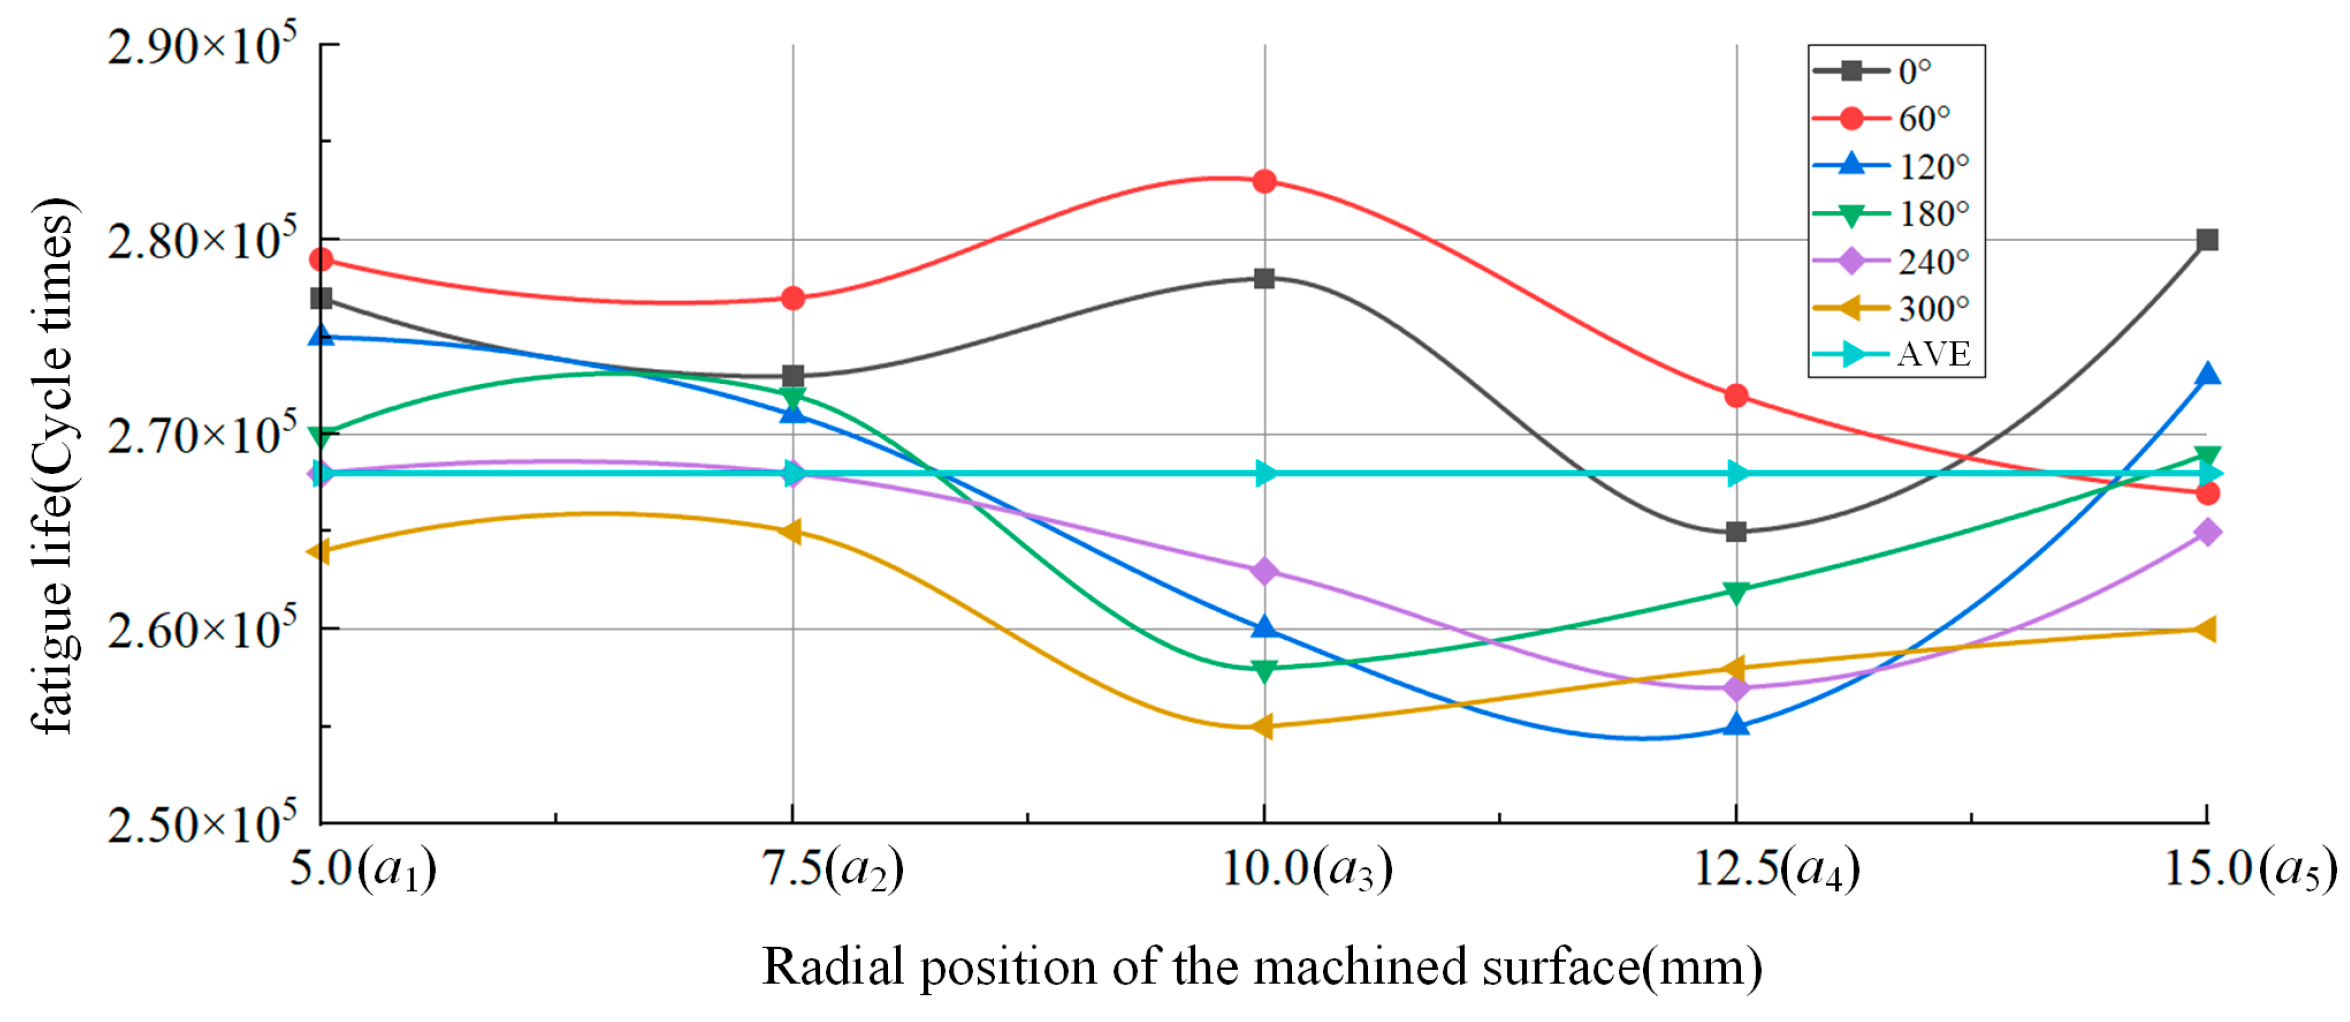
  • To address the non-uniform distribution of surface feature parameters in titanium alloy turning, the instantaneous subsurface state during machining was characterized. A finite element model and analytical framework were developed to investigate axial and radial distributions of surface feature parameters on machined titanium alloy surfaces. Results demonstrate positional variations in both axial and radial dimensions for the size and depth of machined surface features during titanium alloy processing.
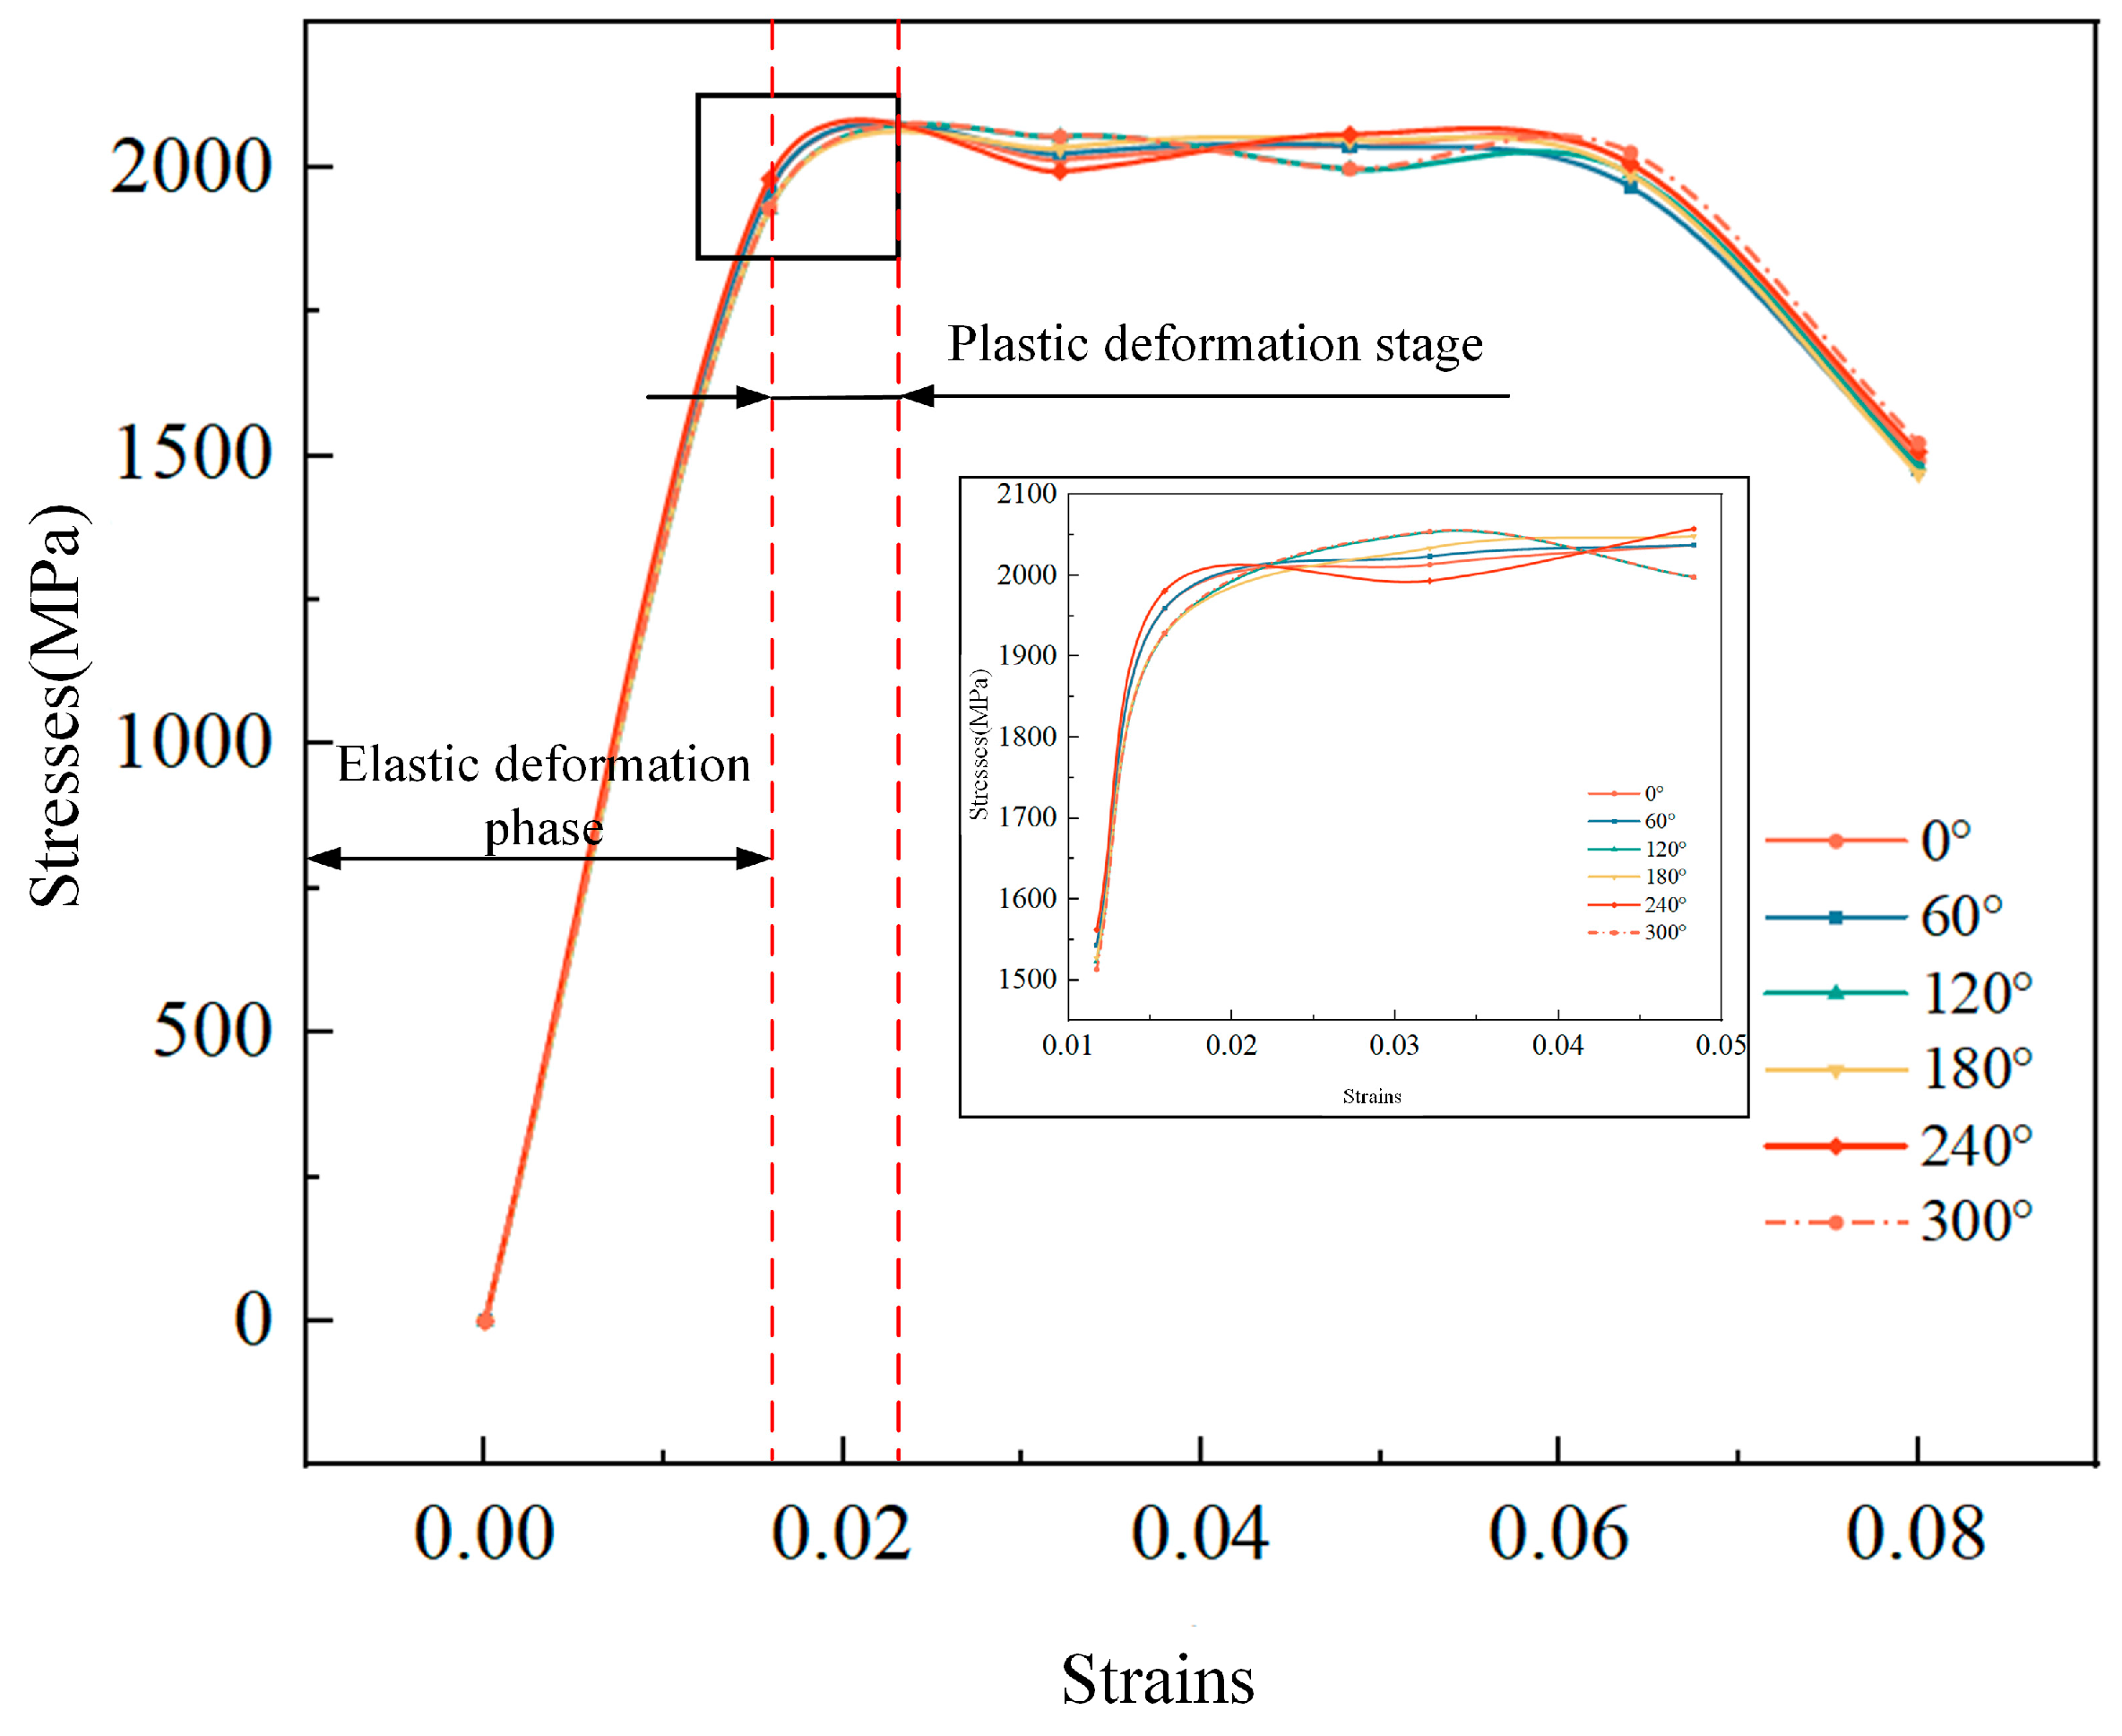
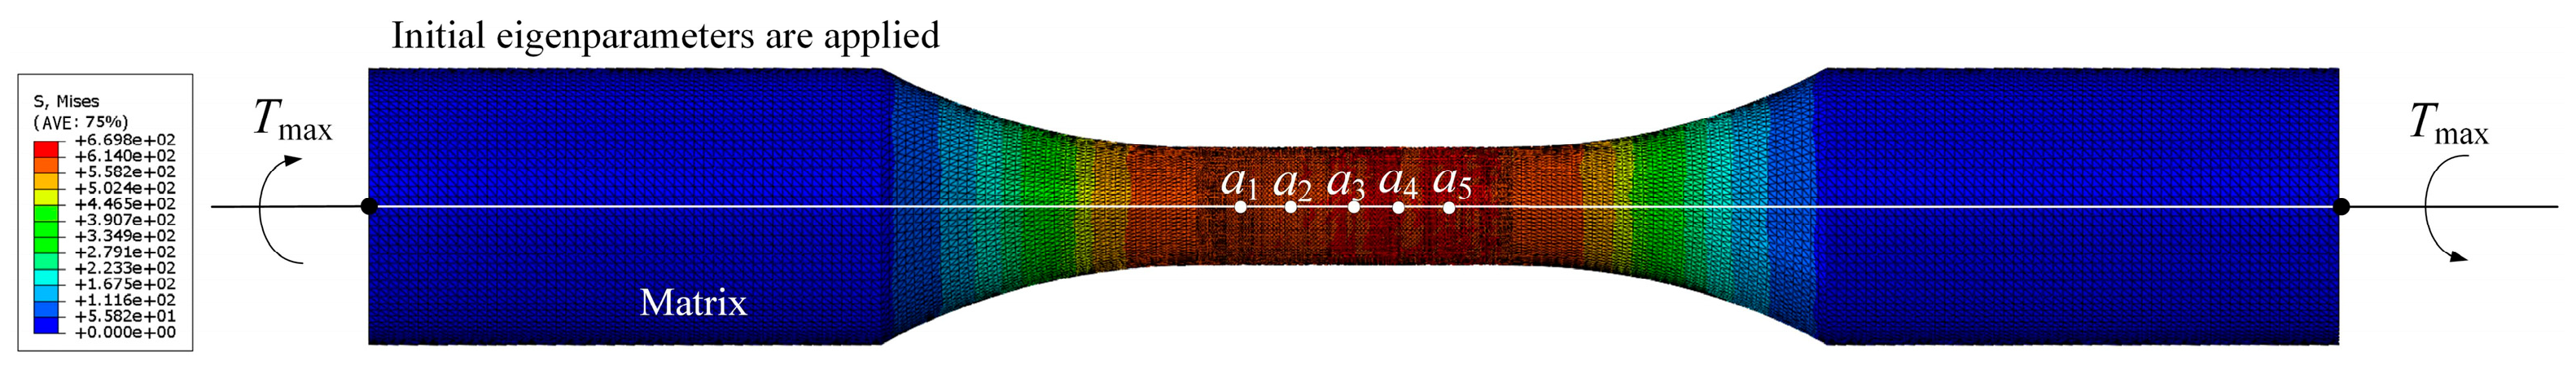
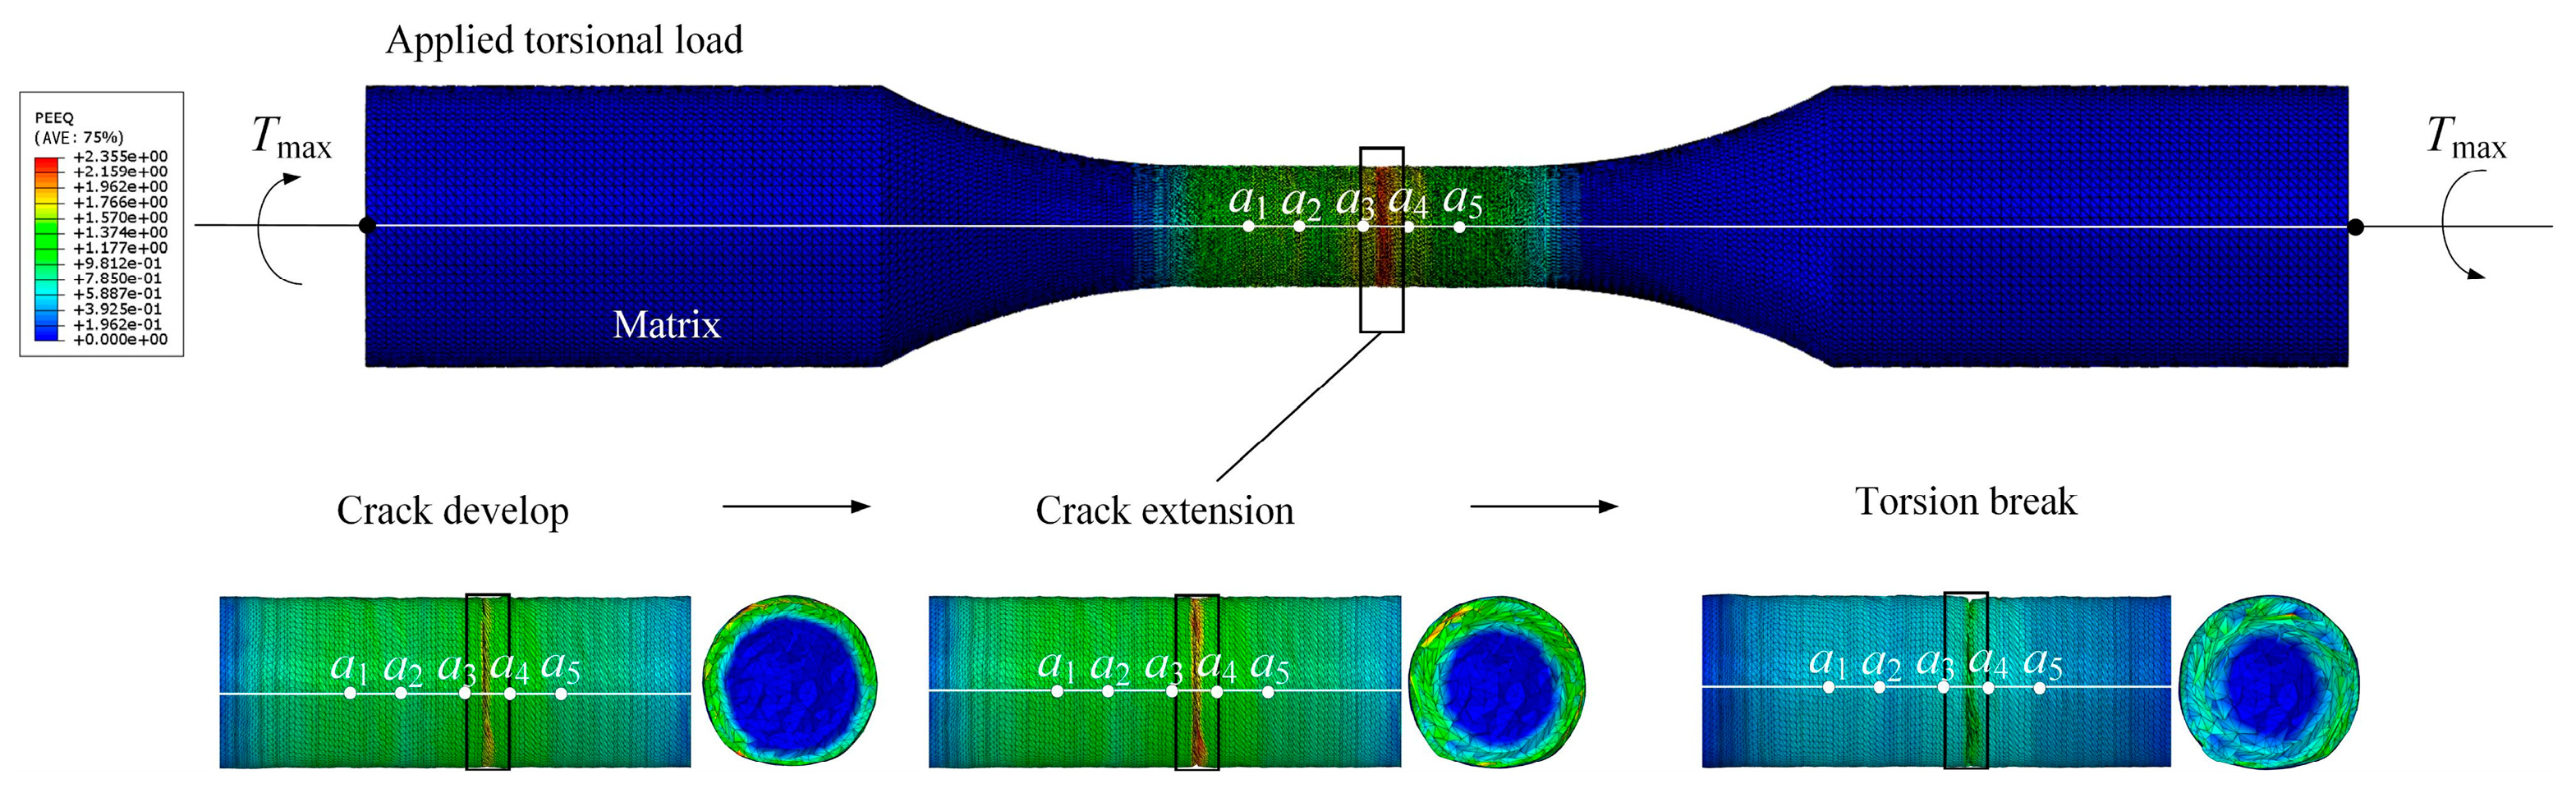
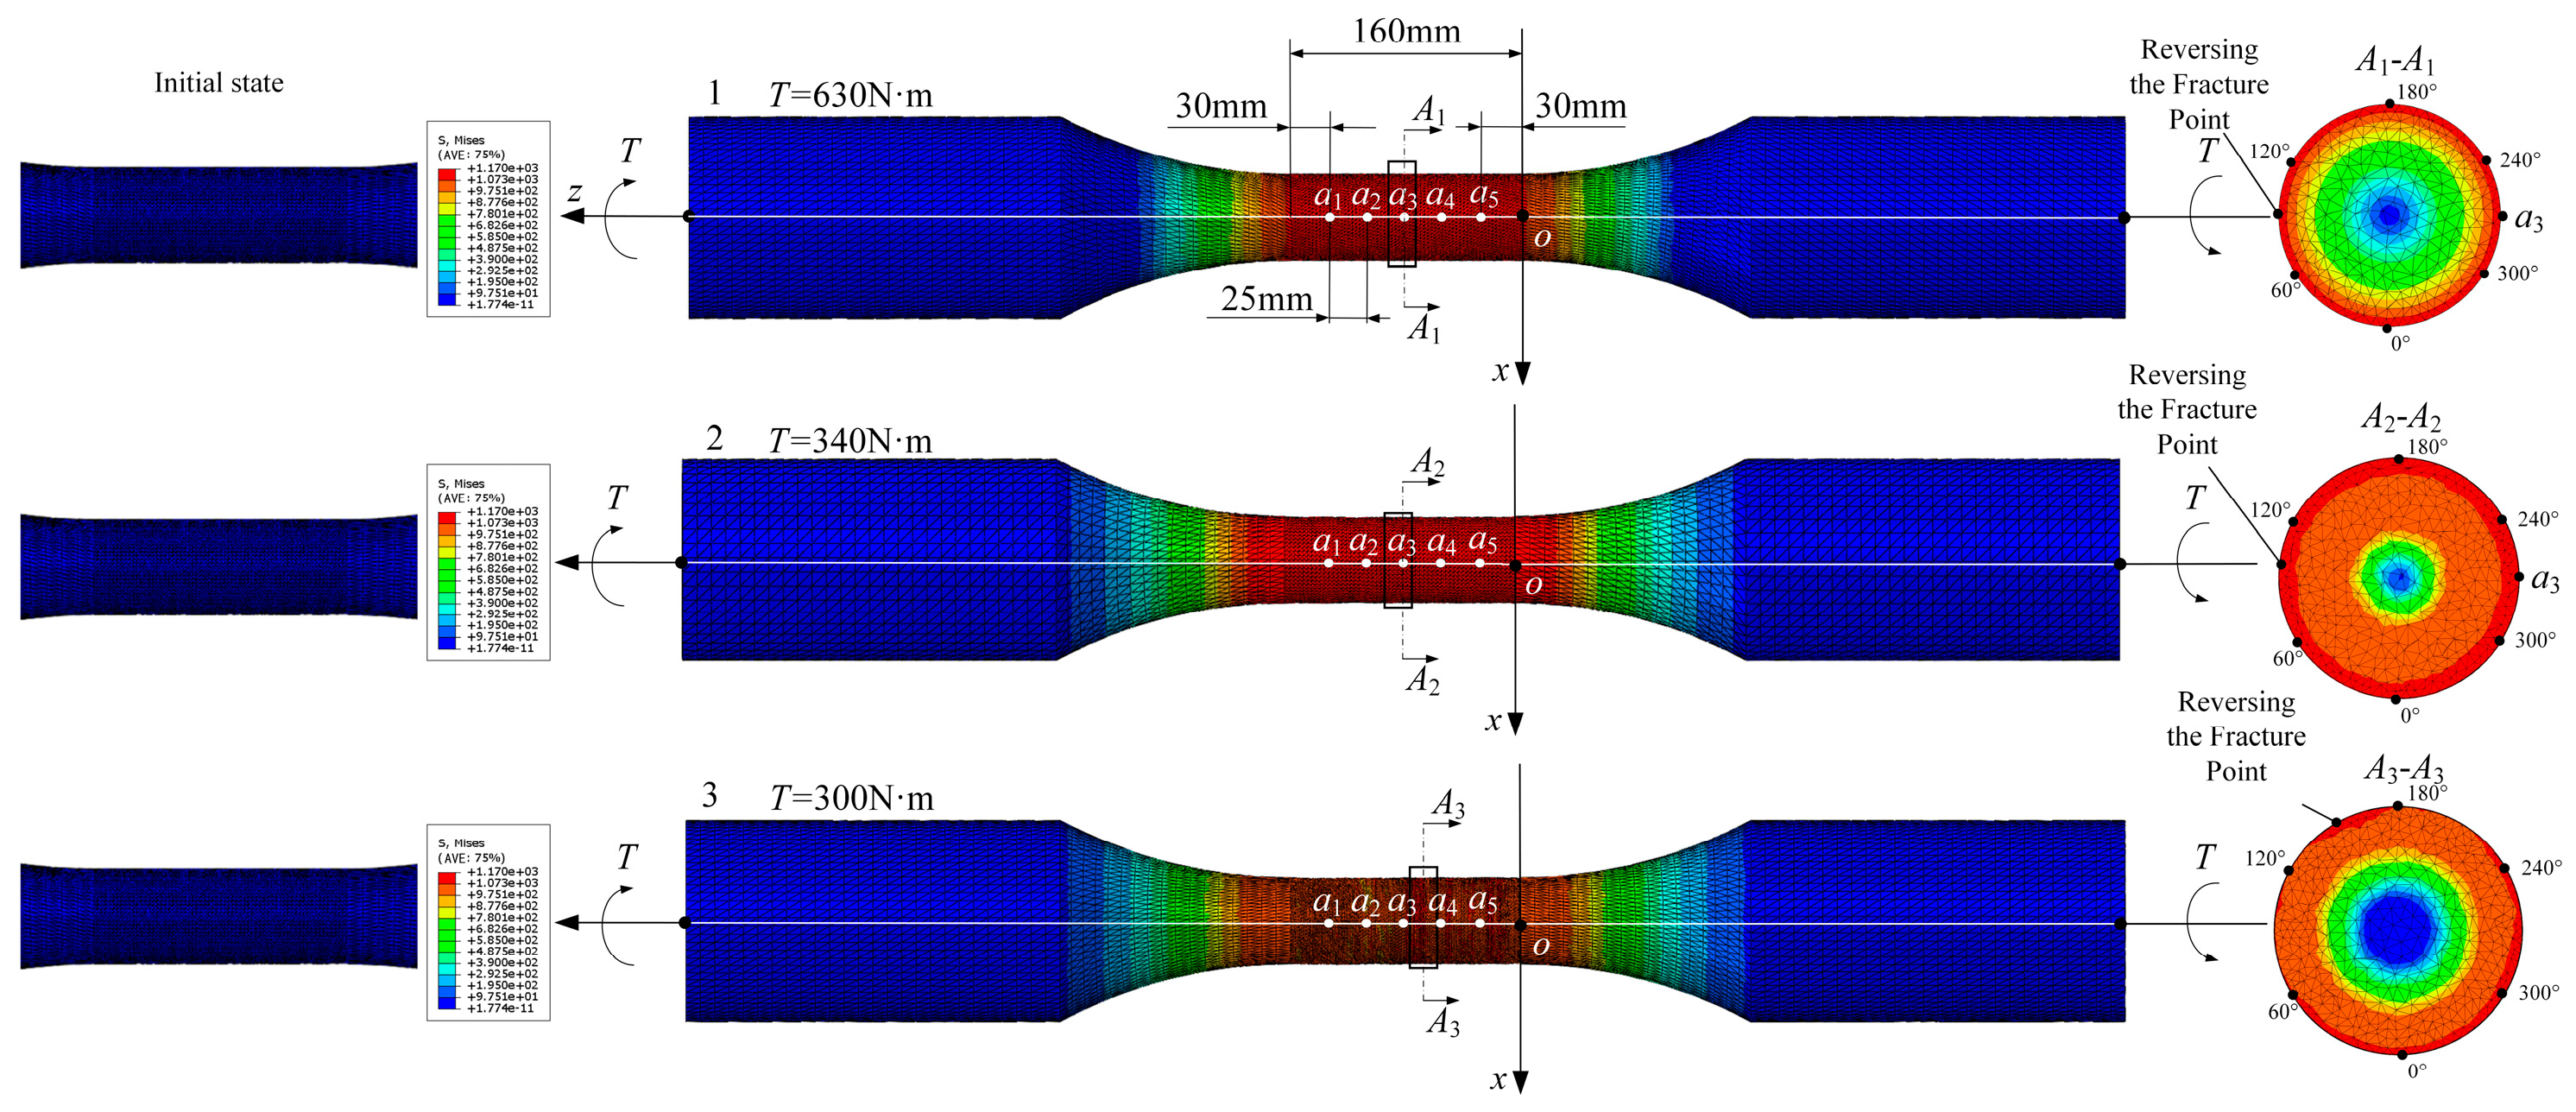
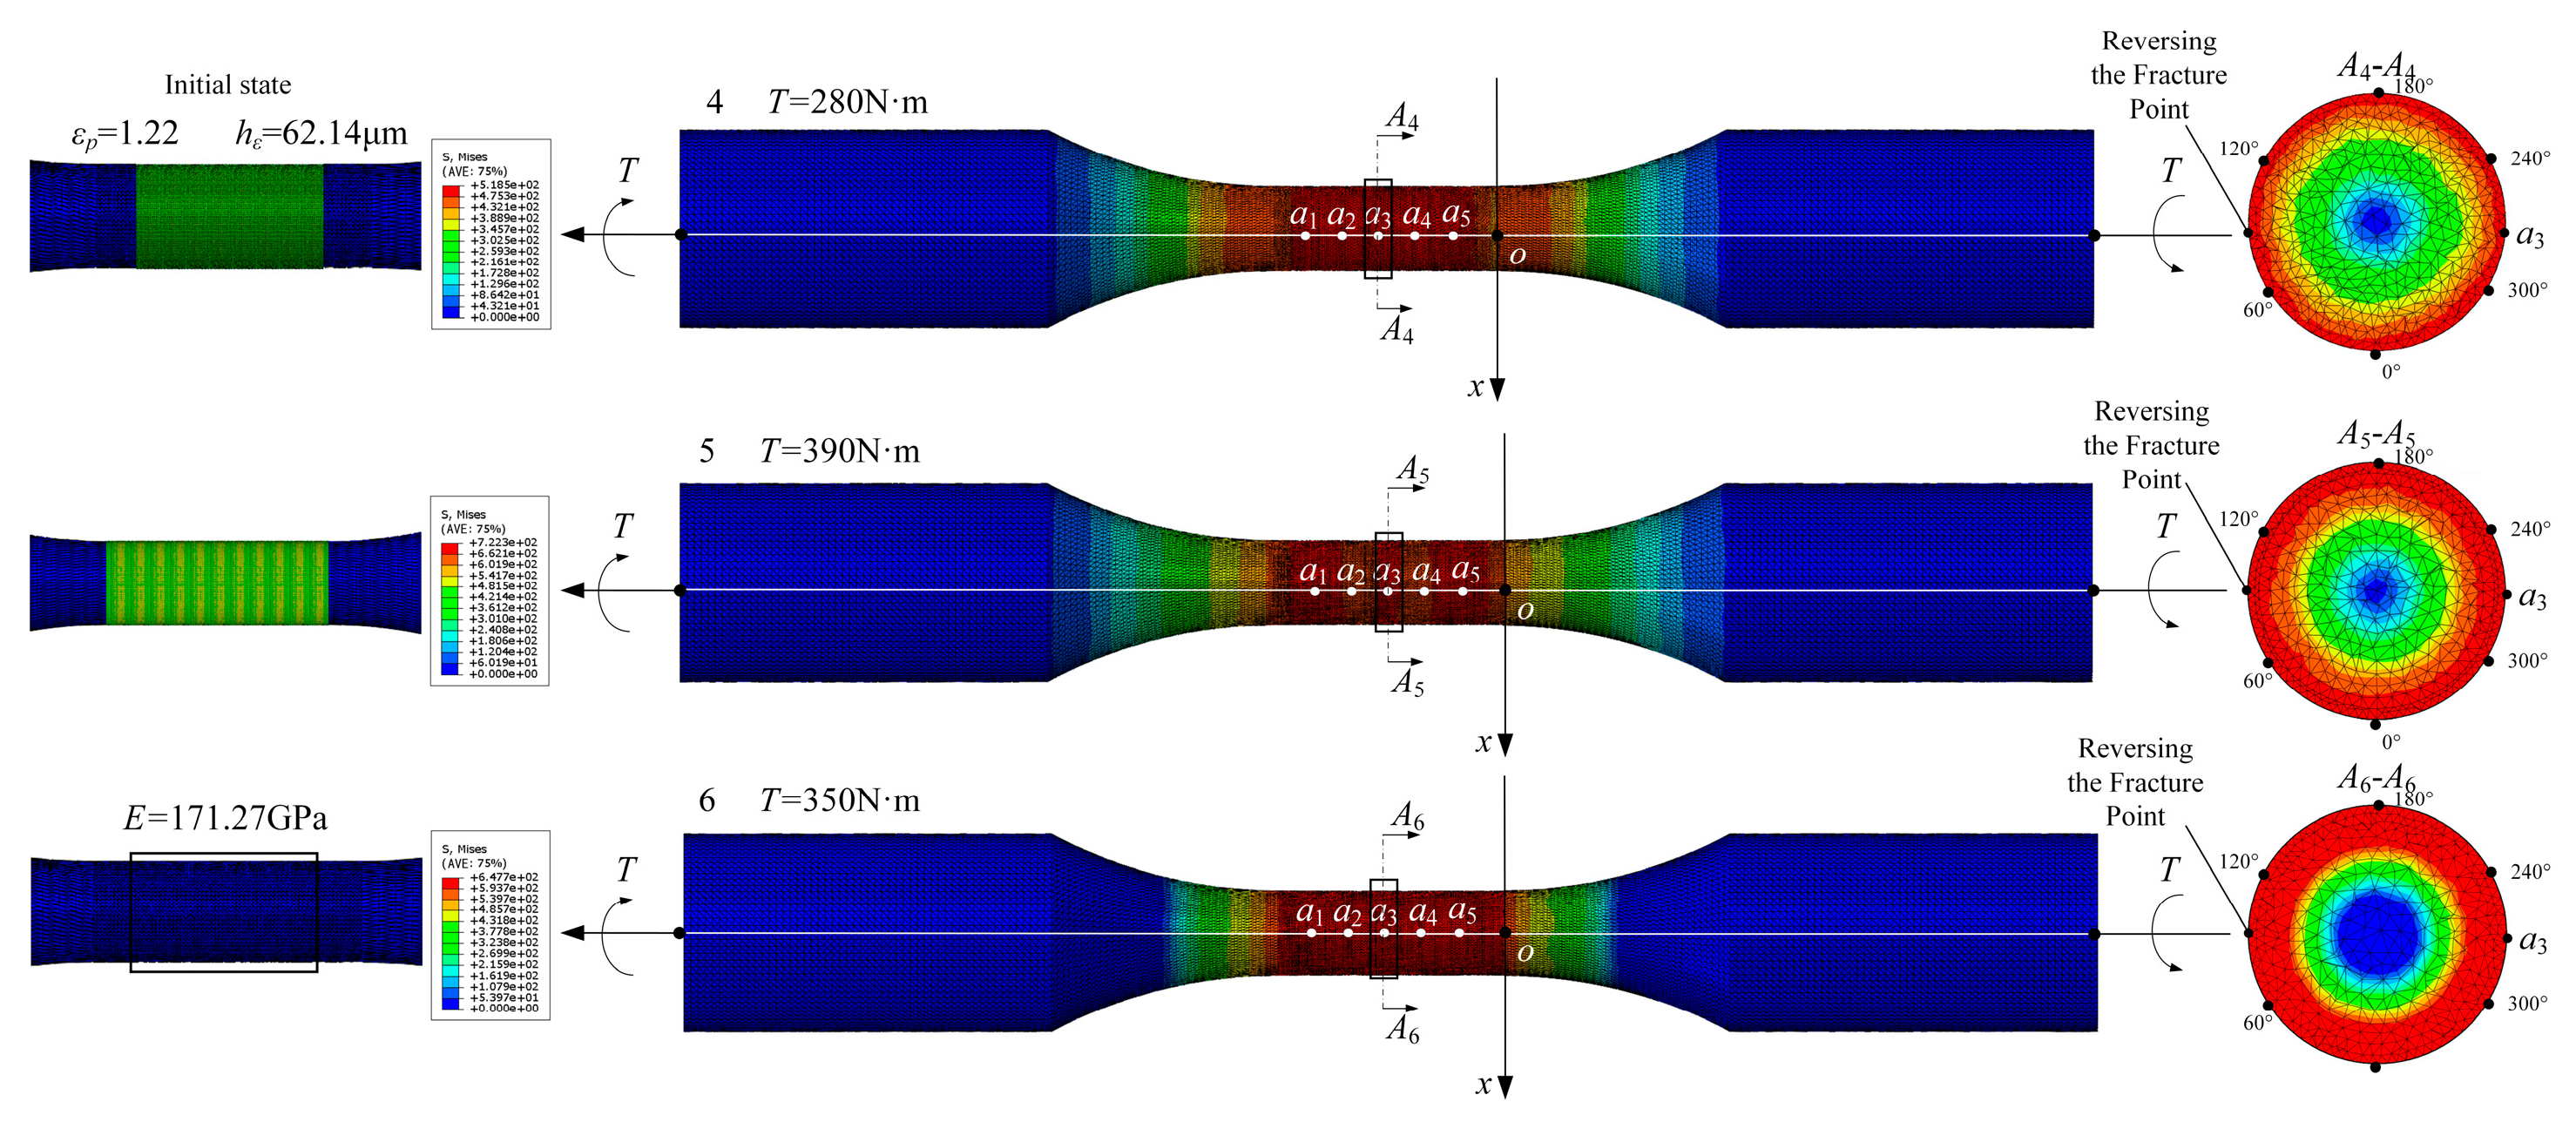
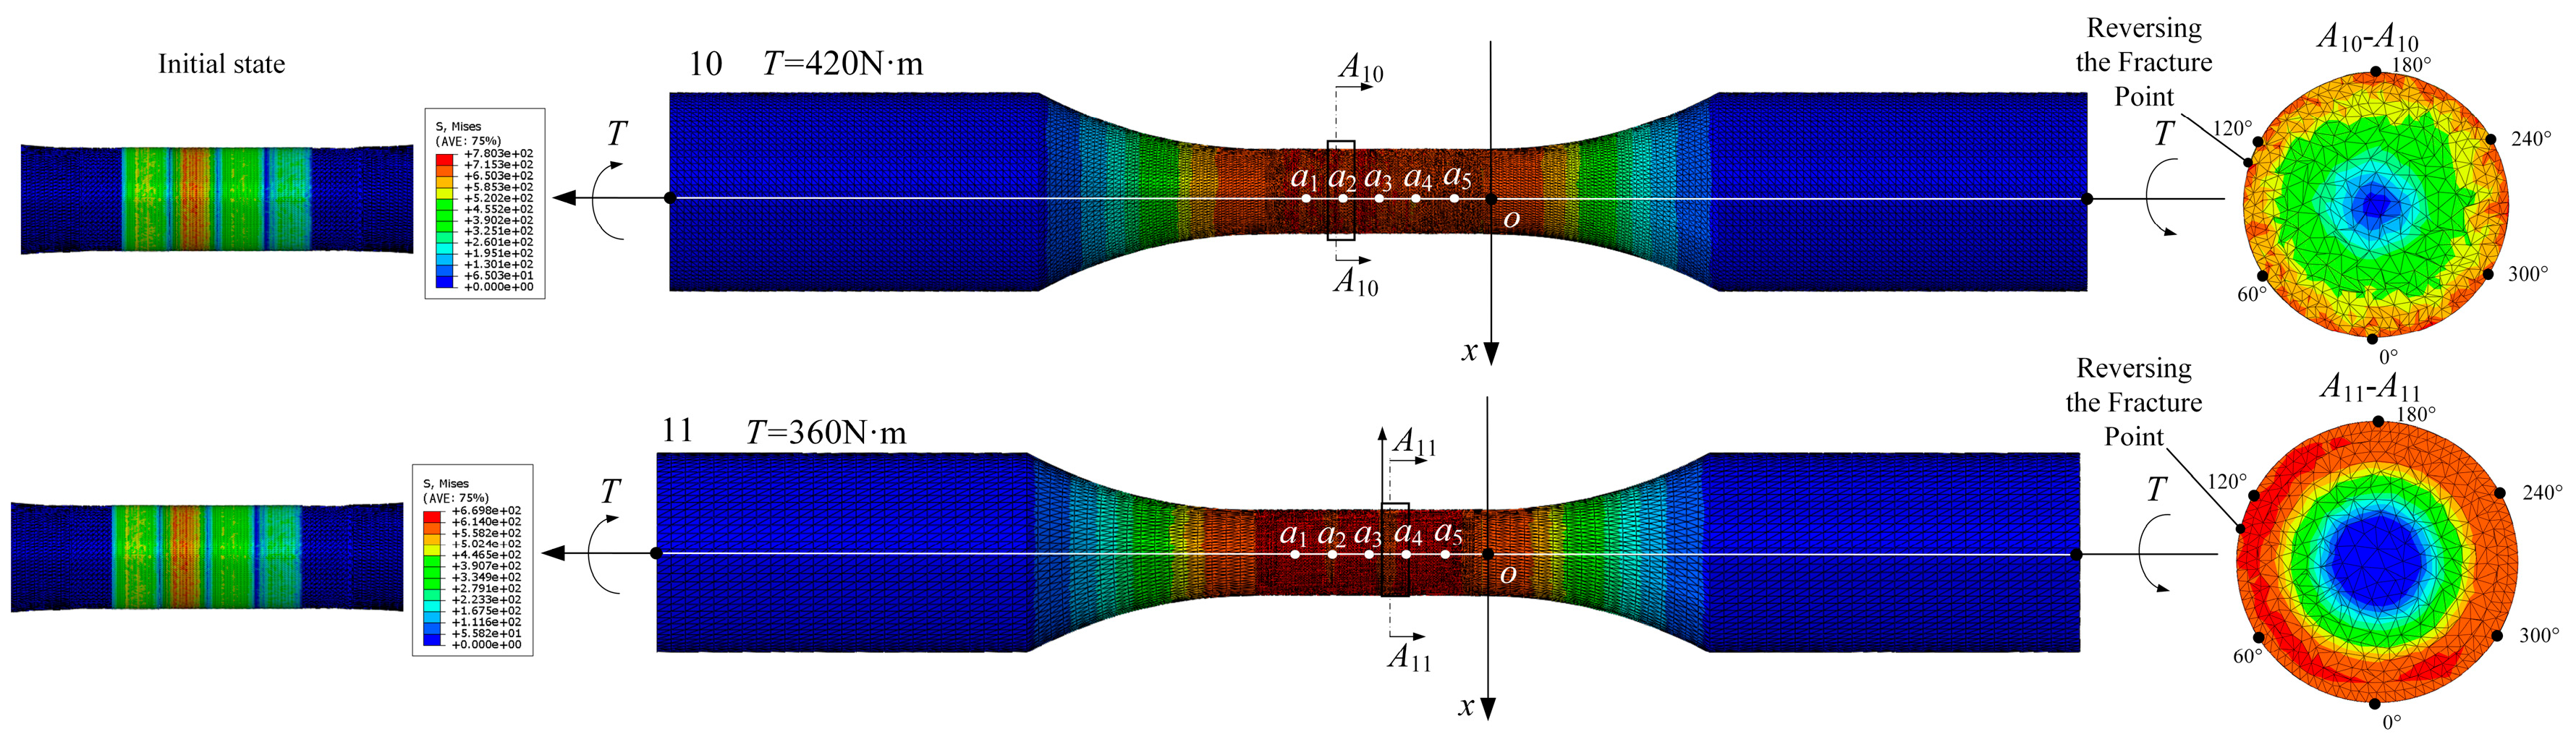
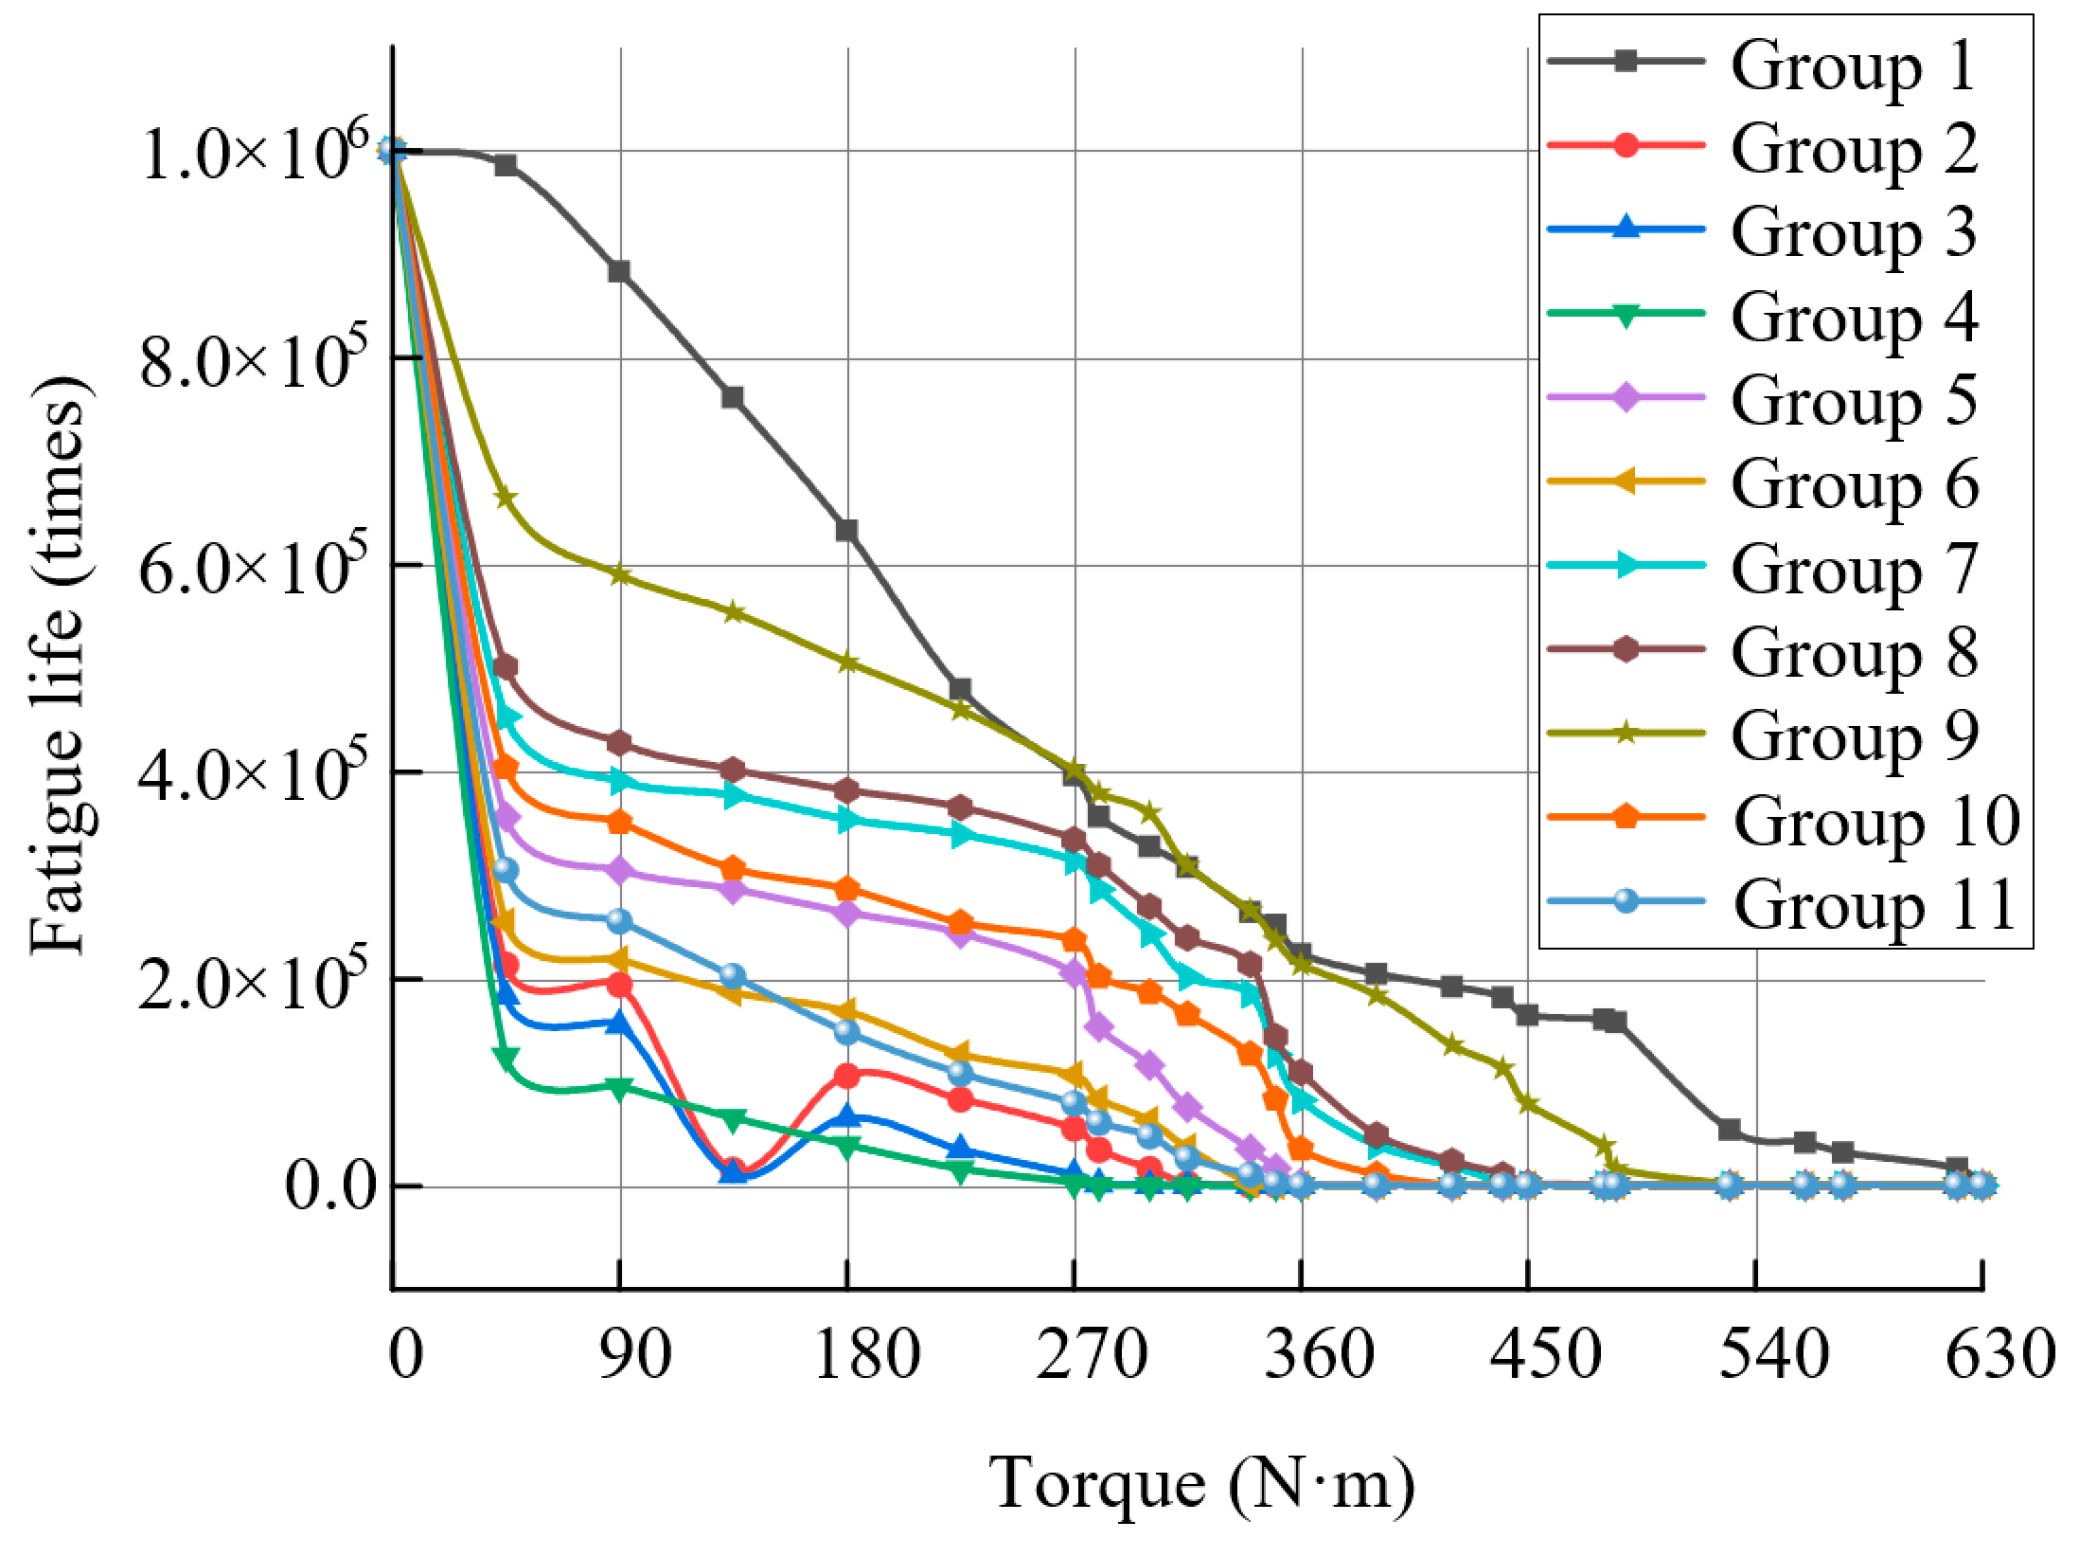
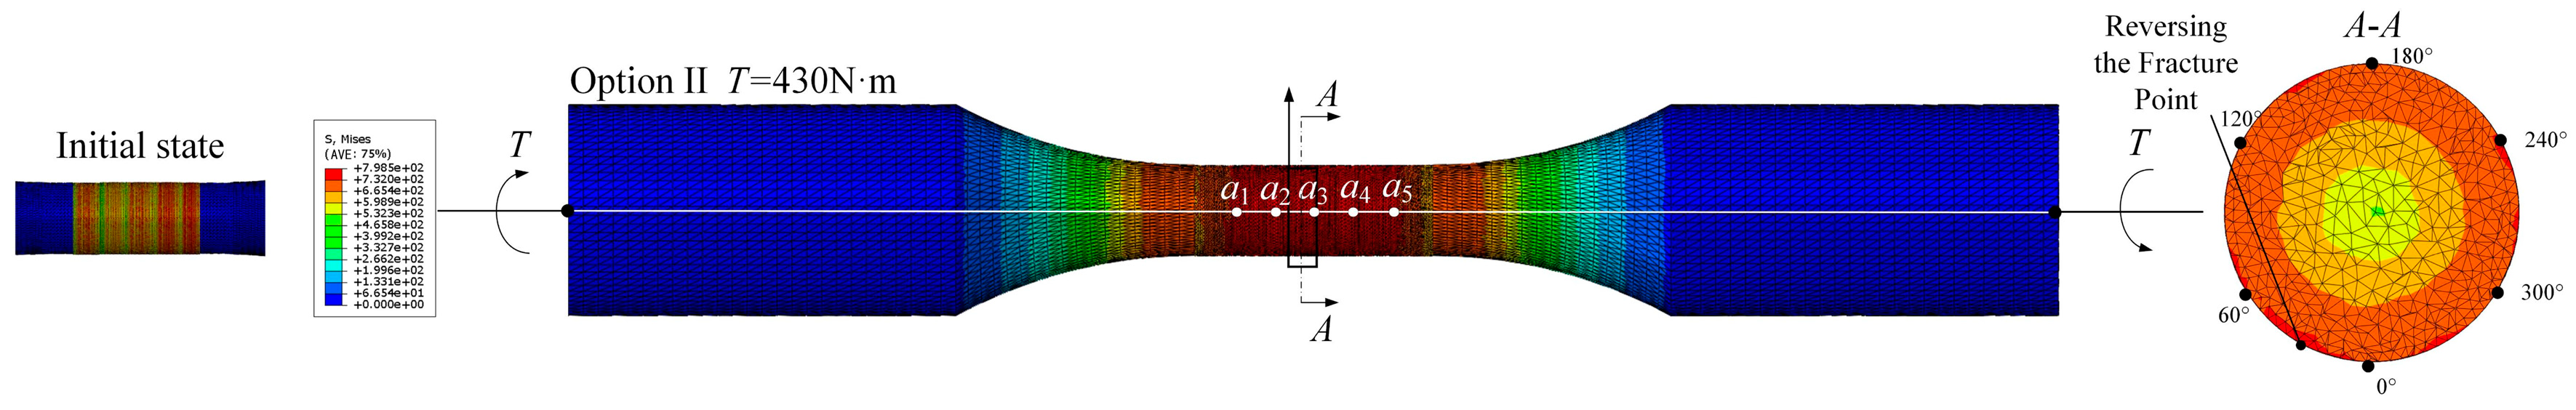
  • A torsional fatigue life prediction model for turned titanium alloys was developed, incorporating torque loading conditions and torsional strength variations induced by non-uniform initial load distributions. Fatigue life analysis of machined surfaces with heterogeneous parameter distributions was performed, accounting for surface feature parameter discrepancies across distinct regions. This investigation quantifies the influence of parameter heterogeneity on fatigue performance. Experimental results demonstrate significant variations in fatigue life distribution among titanium alloy workpieces under identical torque conditions, directly attributable to differences in surface feature parameters. Comparative analysis and experimental verification demonstrate that tool parameter optimization enables modification of titanium alloy turned surfaces’ performance parameters, elemental composition, and distribution characteristics. This adjustment enhances surface mechanical properties, effectively improving torsional strength and fatigue life in titanium alloy components.
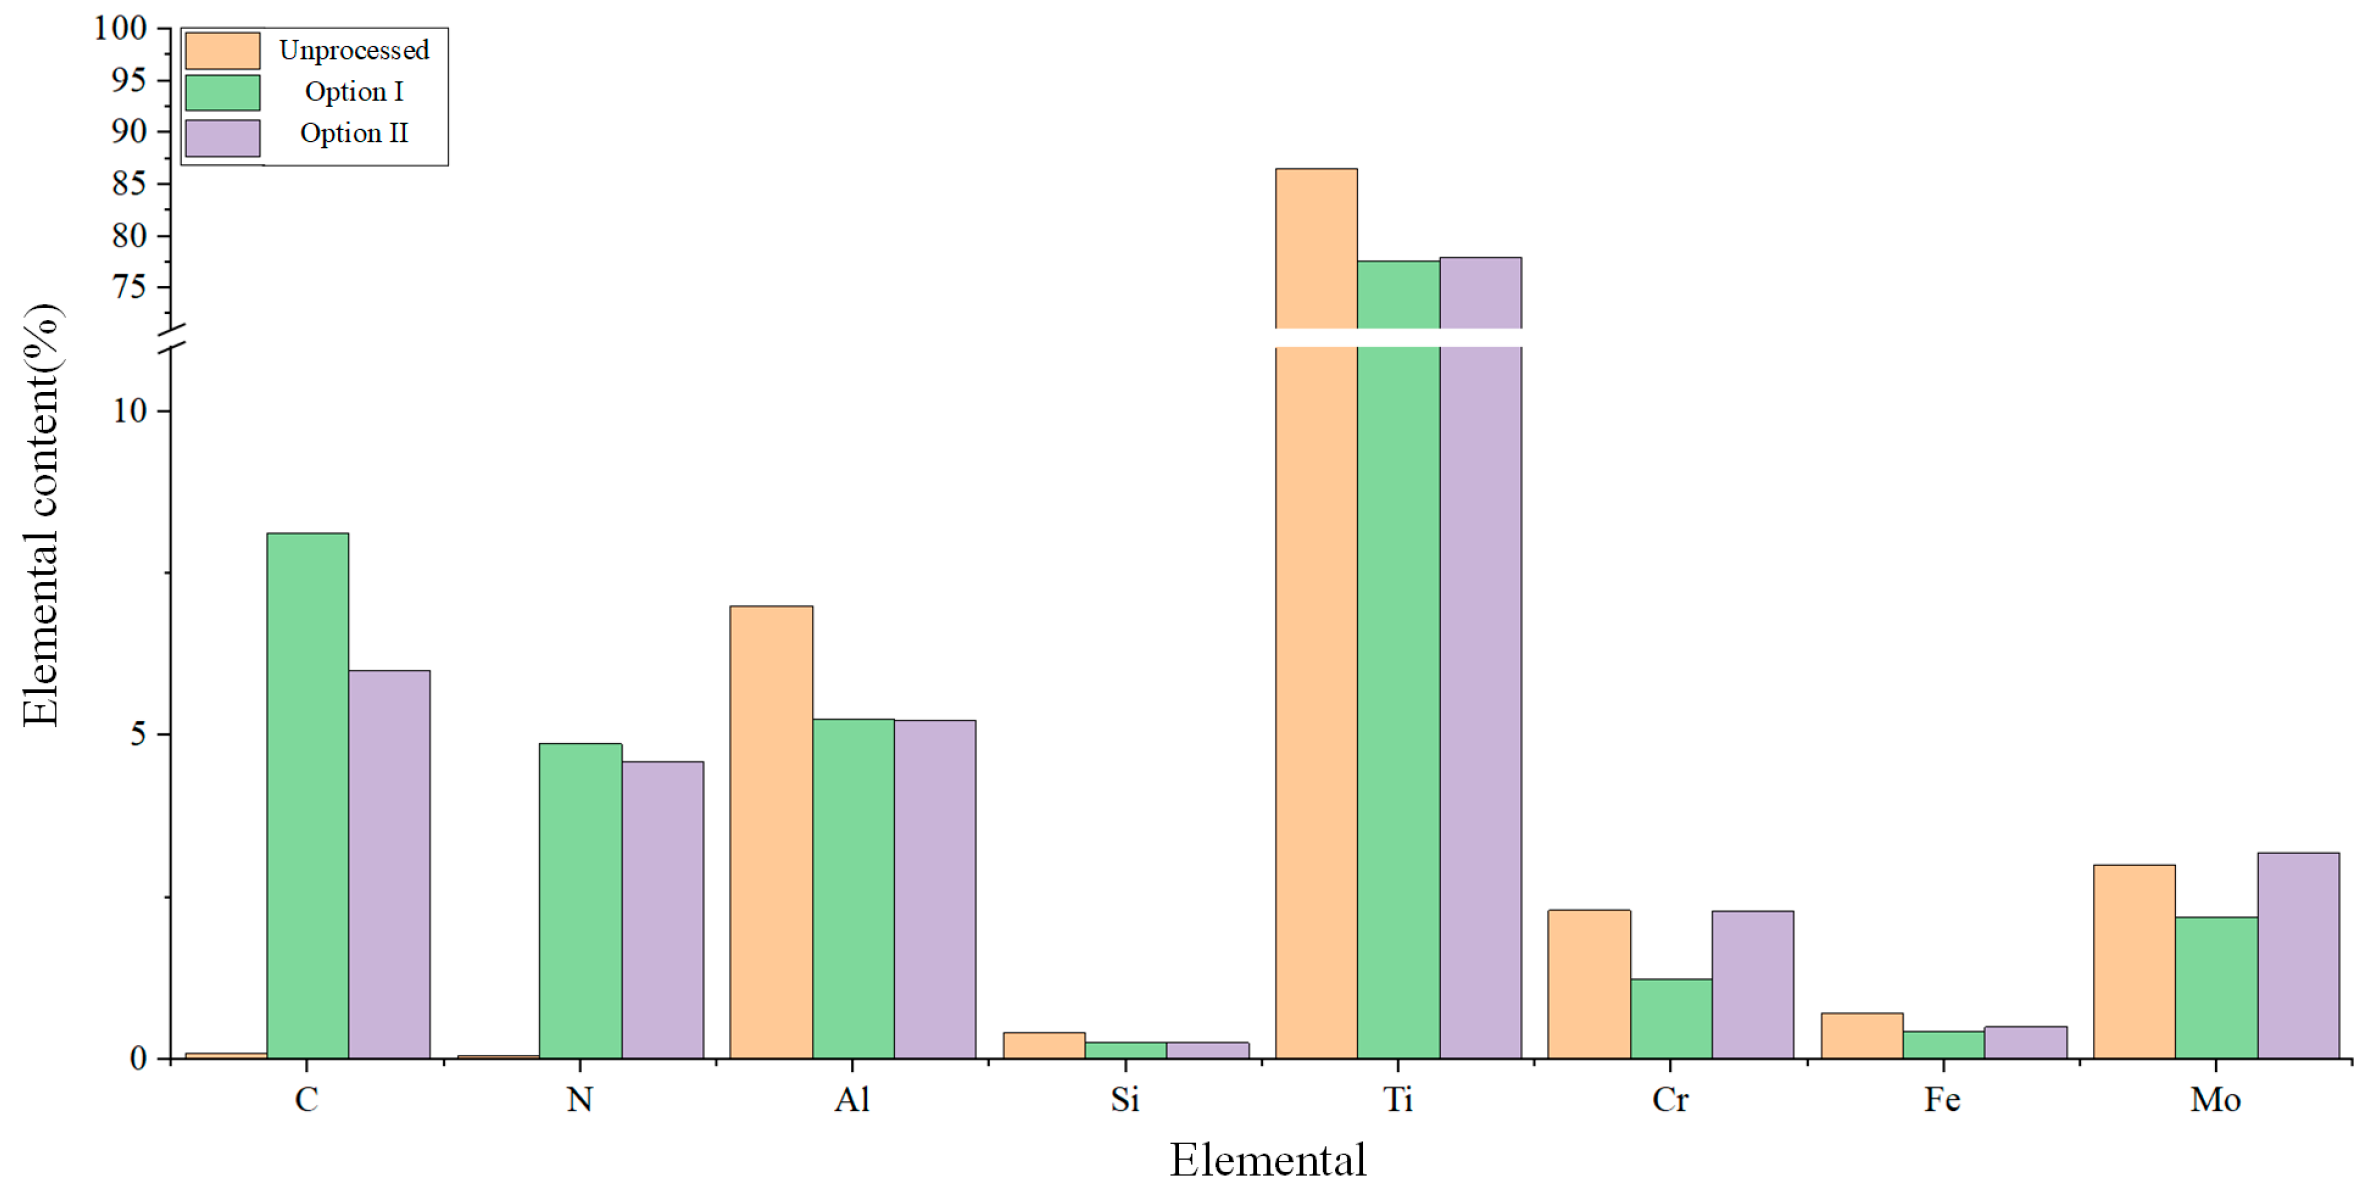
  • Comparative analysis and experimental verification results show that by adjusting the cutting tool process parameters to alter the performance parameters, element content, and distribution of the machined surface of titanium alloys, it is possible to improve the mechanical properties of the machined surface to a certain extent, thereby enhancing its torsional strength and fatigue life.

Author Contributions

Conceptualization, B.J.; methodology, P.Z.; software, D.W.; validation, H.S.; data curation, D.W.; writing—original draft preparation, D.W.; writing—review and editing, B.J. and P.Z.; funding acquisition, B.J. and P.Z. All authors have read and agreed to the published version of the manuscript.

Funding

This research was funded by the National Natural Science Foundation of China, grant number 52375421, and the Key R&D Program of Heilongjiang Province, grant number JD2023SJ12.

Data Availability Statement

The original contributions presented in this study are included in the article. Further inquiries can be directed to the corresponding author.

Conflicts of Interest

The authors declare no conflicts of interest.

References

  1. Zhou, X.; Liu, H.; Yu, T.; Guo, R.; Sun, Y.; Chen, M. Experimental and Modeling Study of Surface Topography Generation Considering Tool-Workpiece Vibration in High-Precision Turning. Chin. J. Aeronaut. 2023, 36, 194–212. [Google Scholar] [CrossRef]
  2. Wang, Z.; Li, H.; Yu, T. Study on Surface Integrity and Surface Roughness Model of Titanium Alloy TC21 Milling Considering Tool Vibration. Appl. Sci. 2022, 12, 4041. [Google Scholar] [CrossRef]
  3. Tepla, T.L.; Izonin, I.V.; Duriagina, Z.A.; Tkachenko, R.O.; Trostianchyn, A.M.; Lemishka, I.A.; Kulyk, V.V.; Kovbasyuk, T.M. Alloys selection based on the supervised learning technique for design of biocompatible medical materials. Arch. Mater. Sci. Eng. 2018, 93, 32–40. [Google Scholar] [CrossRef]
  4. Pimenov, D.Y.; Kiran, M.; Khanna, N.; Pintaude, G.; Vasco, M.C.; da Silva, L.R.R.; Giasin, K. Review of Improvement of maChinability and Surface Integrity in Machining on Aluminum Alloys. Int. J. Adv. Manuf. Technol. 2023, 129, 4743–4779. [Google Scholar] [CrossRef]
  5. Singh, A. Experimental Investigations on Surface Integrity in Thin Structure Machining of Aluminum 6061-T6. J. Mater. Eng. Perform. 2025, 34, 1959–1973. [Google Scholar] [CrossRef]
  6. Guo, S.; Lu, S.; Zhang, B.; Cheung, C.F. Surface Integrity and Material Removal Mechanisms in High-Speed Grinding of al/SiCp Metal Matrix Composites. Int. J. Mach. Tools Manuf. 2022, 178, 103906. [Google Scholar] [CrossRef]
  7. Chen, G.; Caudill, J.; Chen, S.; Jawahir, I.S. Machining-Induced Surface Integrity in Titanium Alloy Ti-6Al-4V: An Investigation of Cutting Edge Radius and Cooling/Lubricating Strategies. J. Manuf. Process. 2022, 74, 353–364. [Google Scholar] [CrossRef]
  8. Li, M.; Zhao, W.; Li, L.; He, N.; Stepan, G. Influence of Milling Stability on Machined Surface Integrity and Fatigue Performance of Ti-6Al-4V Titanium Alloy. Eng. Fail. Anal. 2025, 168, 109103. [Google Scholar] [CrossRef]
  9. Yang, S.; Li, X.; Wang, Z.; Guan, C. Influence of Side Milling on Surface Integrity and Fatigue Behavior of TC4 Specimens. Surf. Technol. 2019, 48, 372–380. [Google Scholar]
  10. Shen, H.; Wang, C.; Li, J. Study on Effect of Feed on Fatigue Life in Cutting Titanium Alloy Process. Tool Eng. 2022, 56, 35–39. [Google Scholar]
  11. Zhao, W.; Zheng, G.; Zhang, H.; Ji, R.; Li, X. Effect of tool wear on machined surface integrity and fatigue propertiesof FGH96 specimen. Mod. Manuf. Eng. 2023, 3, 8–14. [Google Scholar]
  12. Jiang, A.; Zhao, J.; Cui, P.; Liu, Z.; Wang, B. Effects of TiAlN Coating Thickness on Machined Surface Roughness, Surface Residual Stresses, and Fatigue Life in Turning Inconel 718. Metals 2024, 14, 940. [Google Scholar] [CrossRef]
  13. Wang, P.; Zhao, W.; Liu, Y.; Liu, S.; Chen, H.; Liu, Z. Distinguishing effect of turning and grinding on the surface integrity and fatigue performance of ultra-high strength steel. Int. J. Adv. Manuf. Technol. 2024, 133, 4317–4330. [Google Scholar] [CrossRef]
  14. Lai, X.; Wang, Y.; Wang, D.; Zhao, G.; Yang, Y. Research on Surface Integrity and Fatigue Properties in the Turning of TC17 Titanium Alloy Based on the Response Surface Method. Materials 2023, 16, 7180. [Google Scholar] [CrossRef]
  15. Wang, D.; Chen, X.; Lai, X.; Zhao, G.; Yang, Y. Effect of Cutting Surface Integrity on Fatigue Properties of TC17 Titanium Alloy. Materials 2023, 16, 5658. [Google Scholar] [CrossRef]
  16. Wang, S.; He, C.; Wang, Z.; Yan, J. Subsurface amorphization-induced ultrasmooth and ultrahard surface during the diamond turning of polycrystalline pure copper. Mater. Des. 2025, 249, 113549. [Google Scholar] [CrossRef]
  17. Imran, M.; Shuangfu, S.; Yuzhu, B.; Yuming, W.; Raheel, N. Optimising subsurface integrity and surface quality in mild steel turning: A multi-objective approach to tool wear and machining parameters. J. Mater. Res. Technol. 2025, 35, 3440–3462. [Google Scholar] [CrossRef]
  18. Bartarya, G.; Choudhury, S.K. FEM and experimental analysis to study the effect of tool wear on the surface integrity of finish hard turned EN31 steel. Sādhanā 2024, 49, 189. [Google Scholar] [CrossRef]
  19. Xia, J.; Jin, H. Numerical Analysis for Controlling Residual Stresses in Welding Design of Dissimilar Materials Girth Joints. Int. J. Precis. Eng. Manuf. 2018, 19, 57–66. [Google Scholar] [CrossRef]
  20. Bang, H.S.; Park, C.S.; Bang, H.S. Structural Analysis of Automotive Cowl Parts Considering Welding Residual Stress. Int. J. Precis. Eng. Manuf. 2017, 18, 729–737. [Google Scholar] [CrossRef]
  21. Liu, Z.; Zhang, W. Comprehensive Impact of Machined Surface Integrity on Stress Corrosion Cracking Initiation in 316 Austenitic Stainless Steel. J. Mater. Eng. Perform. 2025, 34, 4230–4239. [Google Scholar] [CrossRef]
  22. Yue, Q.; He, Y.; Li, Y.; Tian, S. Investigation on Effects of Single- and Multiple-Pass Strategies on Residual Stress in Machining Ti-6Al-4V Alloy. J. Manuf. Process. 2022, 77, 272–281. [Google Scholar] [CrossRef]
  23. Hu, Y.; Zhang, D.; Xu, L.; Sun, T.; Zhang, P.; Lei, J. Effect of Notch on Torsional Fatigue Performance of 34crni3mo Alloy Steel. J. Wuhan Univ. Technol. 2024, 48, 309–314. [Google Scholar]
Figure 1. Tool structure parameters and its coordinate system.
Applsci 15 06767 g001
Figure 2. Turning instantaneous cutting position.
Applsci 15 06767 g002
Figure 3. Instantaneous cutting layer and instantaneous force on turning surface: (a) Instantaneous force at the lowest point of the workpiece surface; (b) Cutting layer parameters; (c) Instantaneous force at any point of the transition arc.
Applsci 15 06767 g003
Figure 4. Surface morphology of turning machining.
Applsci 15 06767 g004
Figure 5. Ultra-depth of field microscope measurement site.
Applsci 15 06767 g005
Figure 6. Corrected cross-section feature point identification.
Applsci 15 06767 g006
Figure 7. Comparison of the surface before and after correction and the experimental surface.
Applsci 15 06767 g007
Figure 8. Stress–strain field of turning titanium alloy and selection of characteristic points: (a) Stress field and characteristic points selection in turning titanium alloy; (b) Strain field and characteristic points selection for turning titanium alloys.
Applsci 15 06767 g008
Figure 9. Plastic strain distribution in the cross-section at different characteristic points: (a) a1 Plastic strain in cross-section; (b) a2 Plastic strain in cross-section; (c) a3 Plastic strain in section; (d) a4 Plastic strain in section; (e) a5 Plastic strain in section.
Applsci 15 06767 g009
Figure 10. Residual stress distribution in the cross-section where different characteristic points are located: (a) a1 Residual stress in section; (b) a2 Residual stress in section; (c) a3 Residual stress in section; (d) a4 Residual stress in section; (e) a5 Residual stress in section.
Applsci 15 06767 g010
Figure 11. Stress–strain curve at the characteristic point of the section where a1 is located.
Applsci 15 06767 g011
Figure 12. Work hardening rate distribution across characteristic points within the cross-section: (a) a1 Cross-section rate of work hardening; (b) a2 Cross-section rate of work hardening; (c) a3 Cross-section rate of work hardening; (d) a4 Cross-section rate of work hardening; (e) a5 Cross-section rate of work hardening.
Applsci 15 06767 g012
Figure 13. Initial application of performance parameters for titanium alloy workpieces.
Applsci 15 06767 g013
Figure 14. Equivalent stress in the torsion process of the corrected surface under initial performance parameter conditions.
Applsci 15 06767 g014
Figure 15. Torsion process of the corrected surface under initial performance parameter conditions.
Applsci 15 06767 g015
Figure 16. Torsion process of the corrected surface under initial performance parameter conditions.
Applsci 15 06767 g016
Figure 17. Maximum torque and torsional fracture points of Groups 1–3.
Applsci 15 06767 g017
Figure 18. Maximum torque and torsional fracture points of Groups 4–6.
Applsci 15 06767 g018
Figure 19. Maximum torque and torsional fracture points of Groups 7–10.
Applsci 15 06767 g019
Figure 20. Maximum torque and torsional fracture points of Groups 10 and 11.
Applsci 15 06767 g020
Figure 21. Variation curves of fatigue life with torque for different surfaces.
Applsci 15 06767 g021
Figure 22. Fatigue life distribution of points a1~a5 in Scheme 1.
Applsci 15 06767 g022
Figure 23. Parameter identification method of torsional fatigue performance of titanium alloy turning surface.
Applsci 15 06767 g023
Figure 24. Comparison of characteristic points between the simulated surface and corrected surfaces in Scheme 2.
Applsci 15 06767 g024
Figure 25. Maximum torque and torsional fracture point for Scheme 2.
Applsci 15 06767 g025
Figure 26. Fatigue life distribution of Scheme 2 a1~a5.
Applsci 15 06767 g026
Figure 27. Test results of surface morphology of characteristic points in Scheme 1 (a) a1, (b) a2, (c) a3, (d) a4, (e) a5.
Applsci 15 06767 g027
Figure 28. Test results of surface morphology of feature points in Scheme 2 (a) a1, (b) a2, (c) a3, (d) a4, (e) a5.
Applsci 15 06767 g028
Figure 29. Normalized comparison of the standard deviation of different morphological characteristic parameters between Scheme 1 and Scheme 2 (a) xk, (b) zk, (c) Δzk, (d) xm, (e) zm, (f) Δzm, (g) Δxkm, (h) Δzkm, (i) Rm.
Applsci 15 06767 g029aApplsci 15 06767 g029b
Figure 30. SEM scan results and distribution of surface scanning elements for Scheme 1 and Scheme 2: (a) The results of SEM and EDS surface scanning are shown in Scheme 1, (b) SEM and EDS surface scan measurement results of Scheme 2.
Applsci 15 06767 g030
Figure 31. Content of different surface elements.
Applsci 15 06767 g031
Figure 32. Point scan SEM and EDS measurement results of different Schemes: (a) Scheme 1, (b) Scheme 2.
Applsci 15 06767 g032
Figure 33. Scanning test results of Scheme 1: (a) The elements are distributed along the feed direction, (b) Element content at different sampling points.
Applsci 15 06767 g033
Figure 34. Point scan detection results of Scheme 2: (a) The elements are distributed along the feed direction, (b) Element content at different sampling points.
Applsci 15 06767 g034
Table 1. TC6 material properties.
MaterialDensity (g/cm3)Poisson
Ratio
Hardness (N/mm2)Yield
Strength (MPa)
Tensile Strength (MPa)Compressive Strength (MPa)Elastic
Modulus (GPa)
TC64.510.34340123113001687109.8
Table 2. Parameters of WC materials.
MaterialDensity (g/cm3)Elastic
Modulus (GPa)
Poisson RatioThermal Conductivity (W/m·°C)Specific Heat
Capacity (J/kg·°C)
WC15.77050.2324178
Table 3. Turning experiment plan.
PlanTurning Process Parameters
ap (mm)n (r/min)f (mm)
10.15900.1
20.155900.1
30.25900.1
40.255900.1
50.24910.1
60.27860.1
70.211800.1
80.25900.06
90.25900.14
100.25900.2
Table 4. Fitting coefficients of surface morphology characterizing coefficients for turning machining.
Characteristic Parameter: (sa)Coefficients of the Fitted Equations
βα1α2α3α4α5
xk0.0003−0.01080.031.91880.0586−0.0290
xm0.00022.2266−0.7410.31090.0482−0.0376
Δxk6.9255 × 10−51.9741−0.76510.85470.00760.0003
Δxm3.7007 × 10−51.9987−0.7010.87420.01080.0092
Rm3326.3511−0.34730.196−0.38680.0120.0174
Ra7.0221 × 10−84.4540−1.61630.7695−0.0015−0.0008
Table 5. Characteristic points of the machined surface morphology.
GroupHighest Point of Machined Surface Topography pkLowest Point of Machined Surface Topography pm
xk (μm)Δxk (μm)Δzk (μm)xm (μm)Δxm (μm)Δzm (μm)Rm (μm)
1000000
23010000100400
32.73~4.050~1.3297.86~101.12−0.75~1.080~1.8398.76~102.11383.54~415.24
Table 6. Position of the highest and lowest points of the machined surface profile and their errors.
DirectionHighest Point of Surface Topography for
Different Machining Cycles pki
Minimum Point of Surface Topography for Different Machining Cycles pmi
i = 1i = 2i = 3i = 4i = 5i = 1i = 2i = 3i = 4i = 5
Corrected surfaces x (μm)2.883.202.613.022.980.170.18−0.29−0.690.09
z (μm)28.89127.05227.17312.76424.2579.84179.57275.84380.56478.57
Δx (μm)-0.32−0.590.41−0.04-0.01−0.47−0.400.78
Δz (μm)-98.16100.1285.59111.49-99.7396.27104.7298.01
Experimental surfacex (μm)2.923.242.732.953.000.180.19−0.26−0.750.09
z (μm)29.17127.03227.12313.68424.1480.32181.14276.33379.97480.18
Δx (μm)-0.32−0.510.220.05-0.01−0.45−0.490.66
Δz (μm)-97.86100.0986.56110.36-100.8295.19103.64100.21
Absolute errorx (μm)0.040.040.120.070.020.010.010.030.060
z (μm)0.280.020.050.920.110.481.570.490.591.61
Δx (μm)-00.080.190.01-00.020.110.12
Δz (μm)-0.300.030.974.13-1.091.081.082.2
Relative errorx (%)1.371.234.402.370.675.565.2611.548.000
z (%)6.710.992.368.1312.799.0225.5736.8411.8731.08
Δx (%)-015.6953.6620.00-04.4422.4518.18
Δz (%)-0.310.011.123.74-1.081.131.042.20
Table 7. Torsional finite element model surface parameters.
GroupMachined
Surface
Topography
Residual Stress DistributionHardening Rate DistributionPlastic Strain DistributionElastic Modulus Distribution
σr1 (MPa)σr2 (MPa)hr (μm)η (GPa)hη (μm)εphε (μm)E (GPa)hE (μm)
110000000109.800
220000000109.800
330000000109.800
42000001.2262.14109.800
52−94.57−221.9553.010000109.800
6200039.4117.0500171.2717.05
72−73.69−184.8751.1038.4016.110.8963.12168.8516.11
82−94.57−221.9553.0139.4117.051.2262.14171.2717.05
92−106.04−247.0152.2341.2116.831.2662.23175.7716.83
102−73.69
~
−106.04
−184.87
~
−247.01
51.1
~
52.23
38.4
~
41.21
16.11
~
16.83
0.89
~
1.26
51.1
~
52.23
168.85
~
175.77
16.11
~
16.83
113−73.69
~
−106.04
−184.87
~
−247.01
51.1
~
52.23
38.4
~
41.21
16.11
~
16.83
0.89
~
1.26
51.1
~
52.23
168.85
~
175.77
16.11
~
16.83
Table 8. Maximum torque, fatigue life, and fracture location of Scheme 1 and Scheme 2.
SchemeMaximum Torque Tmax (N m)Fatigue Life Nf (×105)Fracture Line
z (mm)θ (°)
13602.5568282
24303.728331
Disclaimer/Publisher’s Note: The statements, opinions and data contained in all publications are solely those of the individual author(s) and contributor(s) and not of MDPI and/or the editor(s). MDPI and/or the editor(s) disclaim responsibility for any injury to people or property resulting from any ideas, methods, instructions or products referred to in the content.

