Article

Influence of Water Immersion on Coal Rocks and Failure Patterns of Underground Coal Pillars Considering Strength Reduction

1
School of Resources and Safety Engineering, University of Science and Technology Beijing, Beijing 100083, China
2
School of Civil Engineering and Architecture, Henan University of Science and Technology, Luoyang 471000, China
3
School of Civil Engineering, Harbin Institute of Technology, Harbin 150090, China
*
Author to whom correspondence should be addressed.
Appl. Sci. 2025, 15(12), 6700; https://doi.org/10.3390/app15126700 (registering DOI)
Submission received: 25 April 2025 / Revised: 2 June 2025 / Accepted: 13 June 2025 / Published: 14 June 2025

Abstract

:
The long-term immersion of coal rock may affect its mechanical properties and failure modes, potentially impacting the stability of coal pillars. This work aims to investigate the influence of the immersion duration on the mechanical properties and fracture evolution processes of coal, employing acoustic emission detection and the digital image correlation (DIC) method. The work focuses on the weakening law of the coal pillar dam in contact with water and obtains a model of the strength deterioration after different periods of water immersion. The stress–strain curves of coal specimens with varying immersion durations are obtained. The results show that the peak absorption rate of coal samples immersed in water transpires within 24 h, with fundamental saturation being achieved at between 25 and 30 days at saturation moisture content of 1.97%. The specimen’s compressive stress after being immersed in water for 7 days is 3.34 MPa, with strain of 0.18%. The cracking stress is 15.60 MPa, with strain of 0.54%. The peak stress is recorded at 27.65 MPa, with strain of 0.92%. The complete rupture stress measures 23.37 MPa, with the maximum strain at 0.95%. During the yielding stage, the specimen has the highest strain increment of 0.38%. Short-term immersion brings about an increase in the coal sample’s plasticity, exhibiting a relatively minor softening impact of water, resulting in comparatively intact fragmentation and modest breakage. A negative exponential function relationship is observed between the compressive strength of coal and the immersion duration. The mechanical reduction relationship is utilized to analyze the failure patterns of coal pillars in underground reservoirs. With prolonged water immersion, the damage area expands to include the coal pillars and the surrounding rock of the excavation area.

1. Introduction

The implementation of underground water reservoir technology in coal mines effectively addresses issues concerning safe and prosperous coal mining and the protection and utilization of groundwater resources in western mining areas [1,2,3]. In situations where the water content is high, prolonged exposure to groundwater has a weakening effect on the coal rock body and impairs its mechanical properties. Additionally, groundwater can cause the instability and collapse of the excavation area due to the presence of watertight coal pillars left in the reservoir, thus greatly threatening coal mine production and personnel safety. There are three main forms of water damage to underground coal pillar dams: (1) the instability of coal pillars caused by water pressure and erosion; (2) water surges caused by dam damage; and (3) the instability of coal pillar dams. Consequently, research on the mechanical properties and rupture mechanisms of waterlogged coal rock has become a significant trend in recent years [4,5,6].
Numerous experts have conducted extensive research on the mechanical properties and damage evolution of coal rock following water immersion. Yao et al. [7] utilized nondestructive water immersion methods to conduct water immersion tests on coal-bearing rock systems of different lithologies. They found that mechanical indices, such as the uniaxial compressive strength, regularly decreased following water immersion in coal-bearing rock systems. Chen et al. [8] performed uniaxial compression tests on three types of coal rock assemblies with varying water immersion durations to identify degradation patterns and mechanisms associated with the assemblies’ mechanical properties. Lu et al. [9] discovered that the coal rock’s structure changed and the permeability increased as the immersion duration increased. Jiang et al. [10] conducted loading and unloading tests on coal rock under various water content conditions. Their results show that the bearing strength of coal rock decreases as the water content increases. Additionally, they observed an evident hysteresis phenomenon in the evolution of damage and deformation of the coal rock during the loading and unloading process. Yao et al. [11] conducted experiments on coal rock specimens with varying levels of water content and observed that, as the water content increased, the peak stress, elastic modulus, and strain softening modulus decreased, while the peak strain increased. These results were obtained through uniaxial compression testing. Ma et al. [12] observed a tendency for the tensile strength of coal rock to increase and then decrease after undergoing water immersion, according to Brazilian splitting experiments with varying immersion lengths. Additionally, they discovered a negative correlation between the pore-like ratio and the tensile strength. Li et al. [13] determined that the mechanical properties of coal rock remained consistent across different water content levels via triaxial compression testing, and they developed a water–force coupling damage model for coal rock using elastic damage mechanics. Ai et al. [14] examined the time-dependent impact of water on coal’s mechanical and mesoscale features, utilizing immersion experiments with varying immersion durations. Poulsen et al. [15] examined the mean strength of assemblages comprising coal rock, mudstone, and non-mudstone through a numerical simulation of the law of water saturation. They discovered that, as the water saturation increases, the strength of the coal column decreases. These findings are relevant to coal seams consisting of rock-bearing strata that are uniformly distributed. Chen et al. [16,17] conducted a compression test on coal rock at various loading rates while adjusting the water content levels. Their study yielded insights into the impacts of the loading rates and water content on the overall stress–strain curves of coal rock assemblages. The authors also proposed stress thresholds for crack development, closure, initiation, and damage. Using digital image correlation technology, Jing et al. [18] examined the mechanical properties and damage modes of coal rocks with varying laminations following water immersion. They observed that water-immersed coal rocks underwent a transformation from uniform deformation to non-uniform deformation during the damage process.
Coal rock damage is closely tied to energy fluctuations. The process of fracture aids in reflecting the overall impact of water damage on the coal rock. The accumulation and release of strain energy contribute to the generation and expansion of internal cracks in coal rocks. During the rupture process, the existence of acoustic emission phenomena is attributed to the generation of microcracks. Scholars have investigated the mechanism of rupture evolution in rocks by using acoustic emission. Yao et al. [19] employed a rock straight shear test coupled with an acoustic emission detection system to determine the mechanical properties and strength damage law of sandy mudstone under water. Xia et al. [20] investigated the mechanical properties and acoustic emission characteristics of water-saturated amphibolite under varying immersion durations. They developed an acoustic emission damage model for water-saturated rocks based on the immersion duration and observed that the change in the cumulative acoustic emission count aligned with the internal damage evolution of the rock samples. Ma et al. [21] conducted a uniaxial compression test to investigate the deformation laws and acoustic emission characteristics of coals with varying strengths. Their study investigated the deformation processes and acoustic emission characteristics of both soft and hard coals and revealed that hard coals possessed distinct mechanical properties compared to soft coals, and the deformation processes of both types were divided into two stages. This provides a valuable reference for the application of acoustic emission technology in coals with different strengths. Gao et al. [22] conducted uniaxial compression experiments to analyze the mechanical properties of coal rocks under the joint effects of high temperatures and water immersion. They also examined the acoustic emission patterns during the damage process and obtained the generation and alteration mechanisms of the acoustic emission signals in coal rocks subjected to high temperatures and water immersion. Yao et al. [23] carried out uniaxial compression tests on coal rock assemblages with different water immersion conditions and investigated their acoustic emission evolution. Guo et al. [24] conducted uniaxial cyclic loading tests and utilized an acoustic emission system to investigate the mechanical properties of igneous rocks with varying water content. They observed that saturated, water-immersed igneous rocks exhibited lower peak strength, higher strain, and a greater number of cumulative acoustic emissions. Their study serves as a useful reference in studying the mechanical properties of coal rock in submerged water conditions.
The issue of mine water treatment and utilization is of great significance in China. In 2013, the National Development and Reform Commission (NDRC) issued the Development Plan for Mine Water Utilization [25]; in 2014, the State Council issued the Action Plan for the Prevention and Control of Water Pollution, which explicitly pointed out the need to “promote the comprehensive utilization of mine water, and give priority to the use of mine water for the supplemental water of the coal mining area, and for the production and ecological water of the neighboring regions” [26].
This work examines the mechanical properties and rupture evolution characteristics of the coal rock body via uniaxial compression testing with varying water immersion durations and obtains a strength deterioration model for coal rock with different immersion durations. Acoustic emission monitoring and digital scattering are used to analyze the internal rupture and surface deformation fields of coal rock. This research investigates the uniaxial compression and rupture evolution laws of coal rock with dissimilar water immersion durations and explores the impact of the natural water absorption rate on the mechanical properties and rupture mechanisms of the coal rock; it also reveals the axial strain change and crack extension evolution mechanism of specimens under different immersion durations. The strength deterioration model of water-soaked coal rock proposed in this study is applicable to the simulation of the water-soaking damage evolution of coal pillar dams. The research findings will offer a scientific reference for the examination of the deformation and rupture mechanisms of coal rock in varying water immersion environments.

2. Experimental Tests

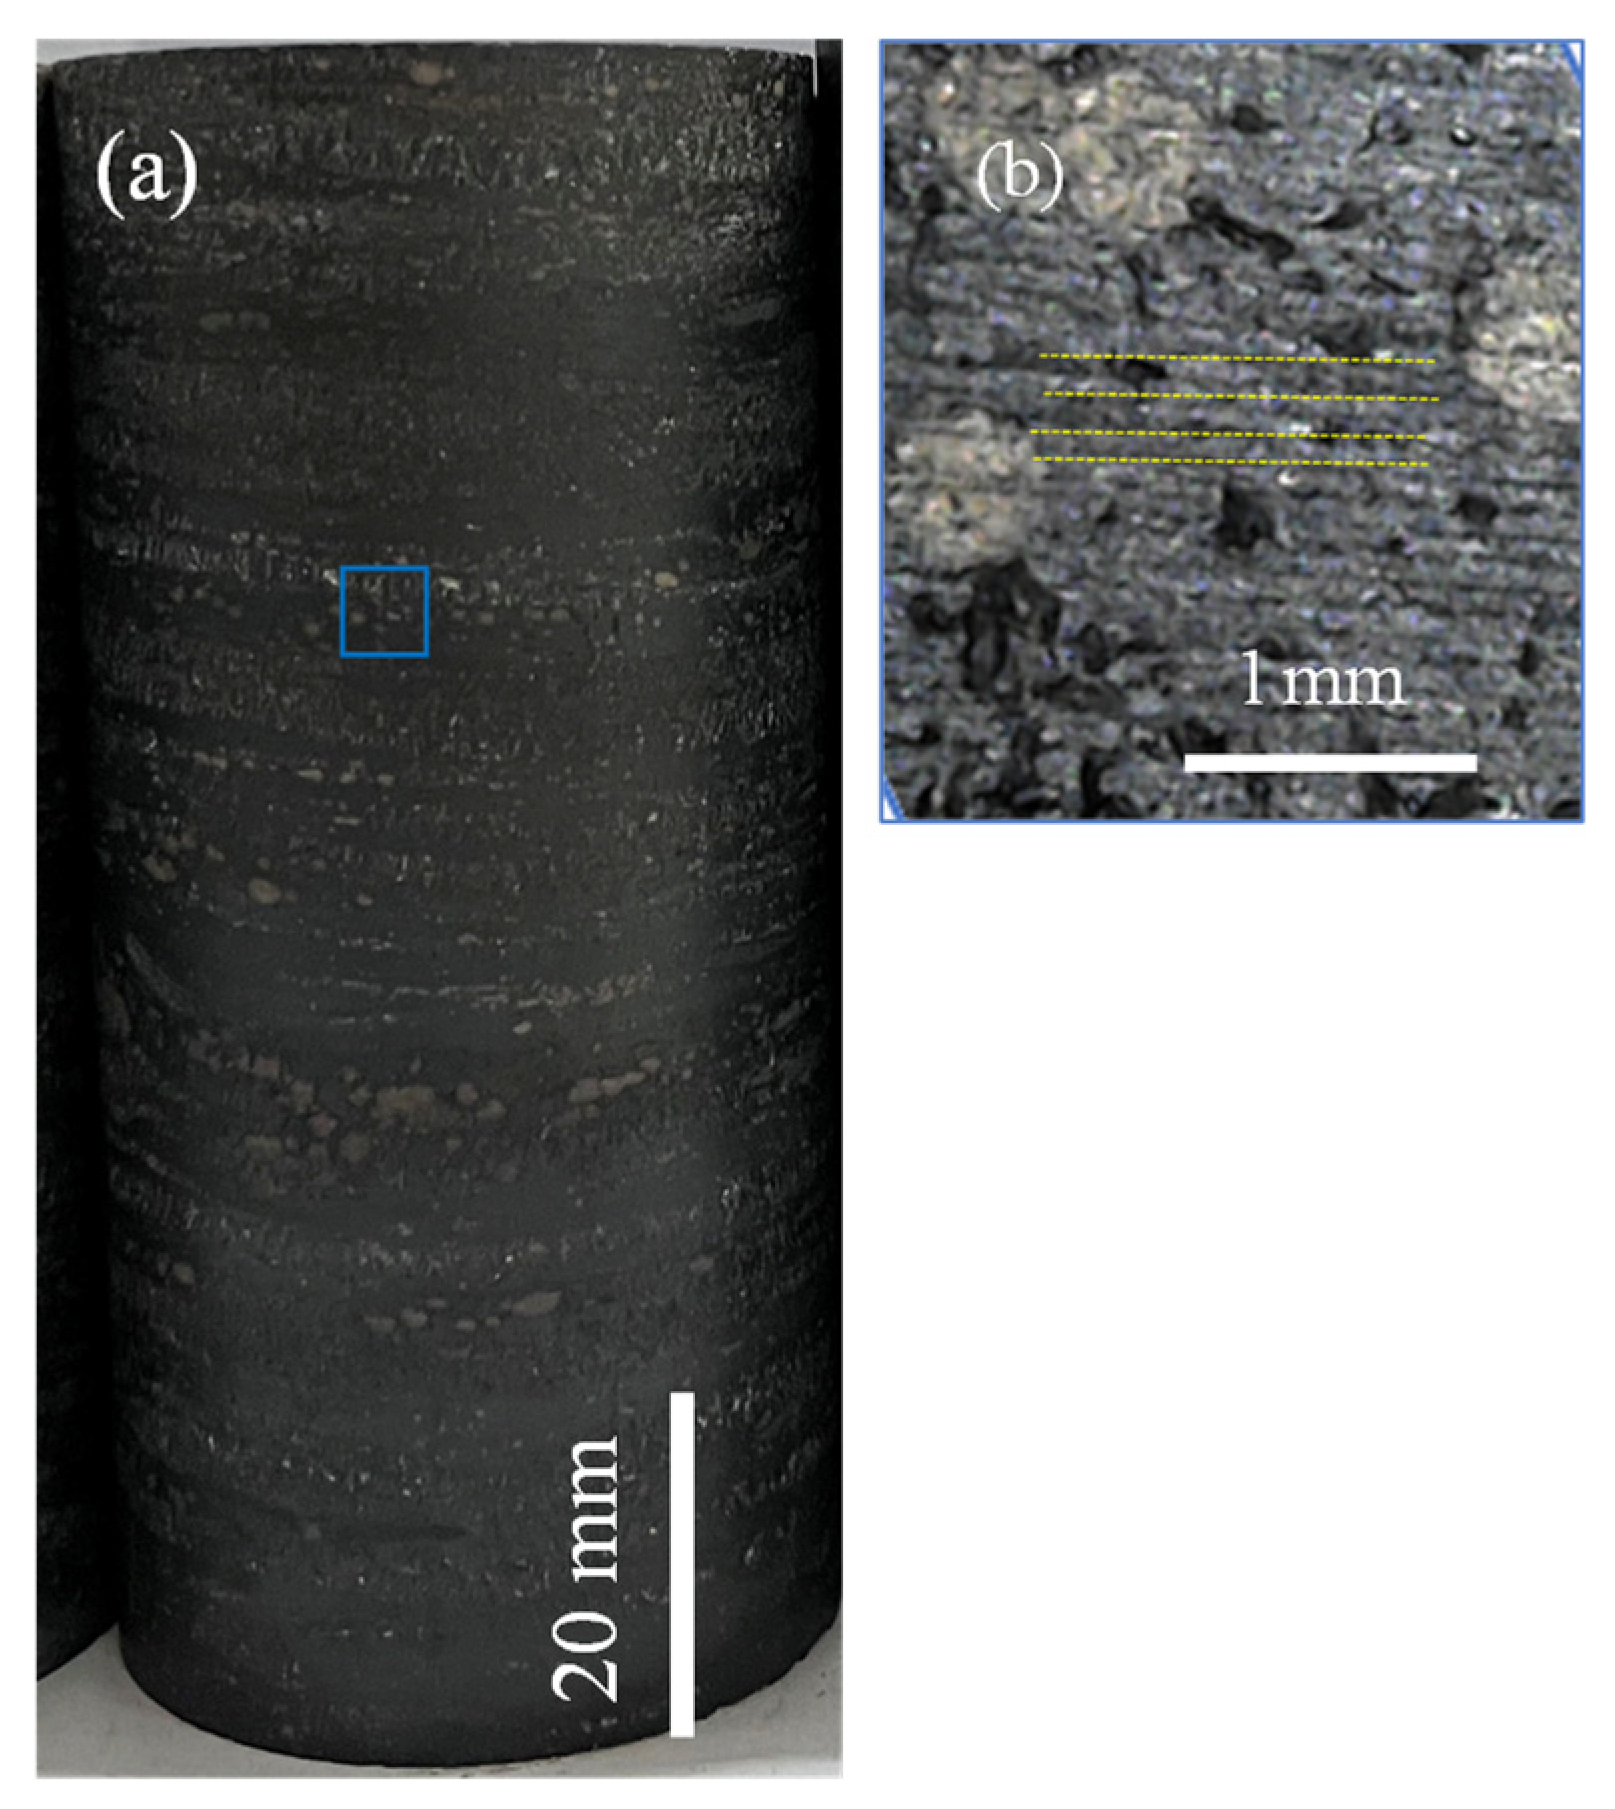
2.1. Basic Indicators of Coal Rock

The samples were cut from the mechanically cut rock mass rather than blasted. According to the standards of the International Society for Rock Mechanics and Rock Engineering (ISRM) [27], standard cylindrical specimens measuring 50 × 100 mm were prepared with specified tolerances: (1) the non-parallelism error between the two end surfaces of the specimen could not exceed 0.05 mm; (2) the diameter’s error along the height of the specimen could not exceed 0.3 mm; and (3) the end face had to be perpendicular to the specimen’s axis, and the maximum deviation could not exceed 0.25. After measuring the specimens, a standard specimen could be obtained through screening, as shown in Figure 1.
To examine the mechanical properties of coal rock with respect to different time periods of immersion, we utilized five sets of samples for an immersion analysis. The immersion durations ranged from 0 to 30 days. Following immersion, we conducted ultrasonic longitudinal wave velocity tests and measured the weight of each sample to determine the water absorption rate. The physical indices after water immersion are listed in Table 1. The wave velocity of the coal rock specimens exhibited an upward trend with an increase in the water immersion duration.

2.2. Experimental Process

The equipment for the uniaxial compression test is depicted in Figure 2. It employs a self-sufficient assembly of instrumentation systems, which is segregated into three individual parts: an MTS 815 pressure loading system, an acoustic emission monitoring system, and an image monitoring system. The acoustic emission monitoring system consists of a PCI-E acoustic emission meter from PAC and a mic 30 probe. High-precision axial strain gauges with a ±4 mm strain travel range and high-precision radial strain gauges with a strain travel range of +12.5, −2.5 mm are also included. Each system has a unique role in the loading process. The pressure loading system provides an axial load to load the specimen. The acoustic emission monitoring system collects the acoustic emission signals during the damage process, which are then analyzed to determine the energy release inside the specimen during loading. The image monitoring system is responsible for tracking the process of rupture expansion in real time on the surface of the specimen, which reflects the intuitive evolution of the rupture on the specimen surface. The three techniques were sequentially applied during the testing process. To facilitate the smooth progression of the test, the specimen was wrapped with cling film following the water immersion step. For the uniaxial compression test, both load-controlled and displacement-controlled pressurization were executed, with a loading rate of 0.1 KN/s, followed by a switch to displacement loading control of 0.01 mm/min after the preloading condition was reached.

3. Results and Analyses

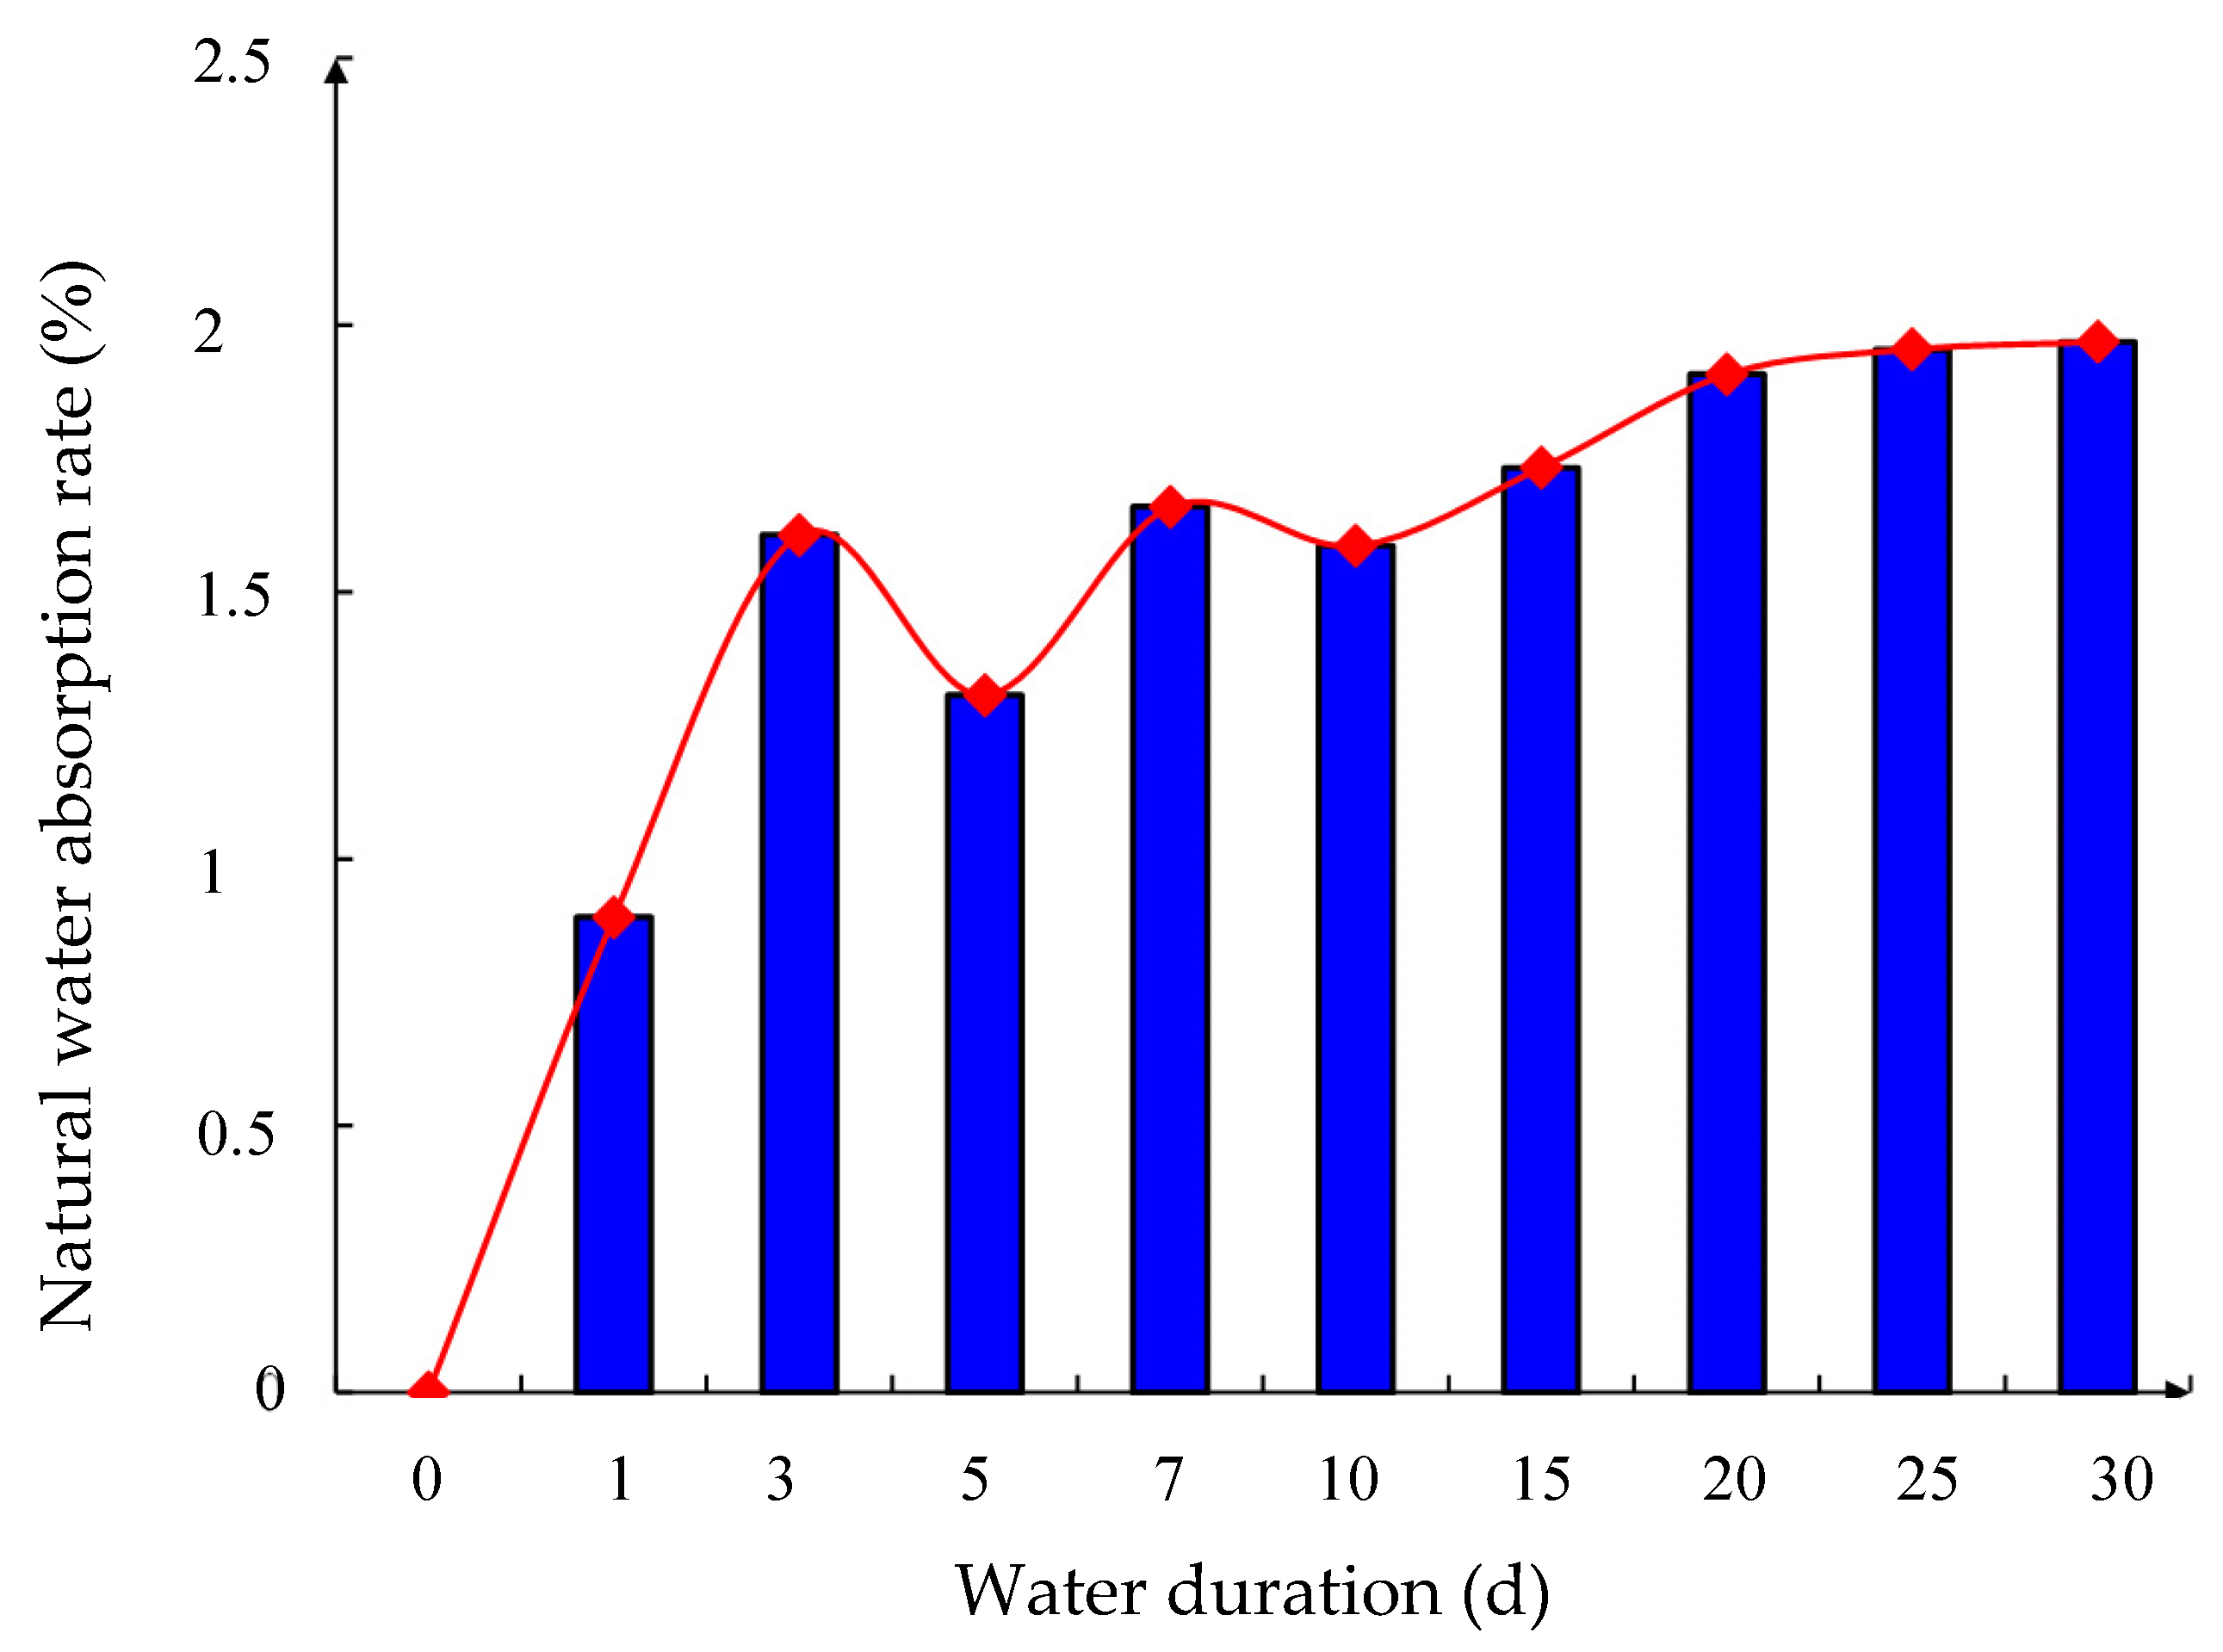
3.1. Changes in Natural Water Absorption Rate

To investigate the properties of coal rock immersion, we weighed the specimens prior to and after immersion. The gravimetric analysis method was utilized to calculate the water absorption rate of the coal rock. In other words, we measured the weight increase resulting from natural water absorption, i.e.,
w = m t m 0 m 0 × 100 % ,
where w represents the specimen’s natural water absorption rate, m0 represents the natural mass, and mt represents the mass after water immersion.
By calculating the average natural water absorption rates of specimens submerged in the same conditions, a curve was obtained illustrating the relationship between the coal rock immersion duration and the natural water absorption rate. Refer to Figure 3 for details. The corresponding natural water absorption rates were 0%, 0.89%, 1.61%, 1.31%, 1.66%, 1.59%, 1.73%, 1.91%, 1.95%, and 1.97%. Overall, the natural water absorption rate of the coal rock increased as the immersion duration increased. Differences in porosity among each coal rock resulted in variations in the natural water absorption rate. For instance, the coal rock sample’s water absorption rate was lower after 5 days of water immersion compared to the sample that was soaked for only 3 days. The gradient of the growth curve shows that the natural water absorption rate tends to flatten out gradually as the soaking time increases, indicating that the coal rock tends to be gradually saturated with water.

3.2. Uniaxial Compressive Properties

The stress–strain curve for the natural coal rock specimen is displayed in Figure 4 and reveals a calculated elastic modulus of 3.50 GPa, with peak compressive strength of 27.42 MPa and a Poisson’s ratio of approximately 0.19. This curve is distinguished by four significant stages, namely the compression–dense stage, linear elasticity stage, pre-peak compression–dense stage, and strain softening stage. The first stage is the compaction stage (range marked as I), caused by the existence of natural microcracks and pores inside the sample. After compression, the sample undergoes brief compaction, and the curve exhibits nonlinear characteristics. The second stage is the linear elasticity stage (range marked as II), where the stress–strain curve experiences linear growth until it reaches point A, with an intensity of 24.71 MPa; elastic energy gradually accumulates, resulting in the curve accounting for the largest proportion during this stage. The third stage indicates pre-peak compaction, while both the first and second stages denote the pre-peak compression phase, with each represented as stage III. The third stage (III) represents the pre-peak compression stage. After the completion of stage II, the specimen fractures internally and cracks develop, causing a slight decrease in curve intensity. Due to the different particle sizes of broken particles within the specimen, the specimen experiences two rounds of compression. As a result, the intensity reaches the peak compressive strength (point B) of 27.42 MPa. The fourth stage is the softening stage (range IV). The curve exhibits a “zigzag” decline, and the strain remains constant at point C as the stress decreases to 18.28 MPa, resulting in a decrease in the specimen’s bearing capacity. As loading continues, the stress–strain curve shows many fluctuating peaks that are associated with crack closure, fracture surface friction, crack extension, penetration, and slip [28,29]. This is due to internal particles becoming more densely compressed, causing a local rise in strength but an overall decline. Additionally, the surface of the specimen experiences local fracturing and the serious extension of cracks.
An extensometer was used to measure the circumferential strain of the specimen, and the transverse strain during peak stress was −4.25 × 10⁻³. The transverse deformation of the coal rock specimen was categorized into three stages. During the initial stage, the specimen exhibited a brief transverse contraction, which corresponded to the axial strain (stage I, stage II). In the second stage of the curve, a portion of the linear growth became apparent, corresponding to the axial strain (stage II). The strength of the specimen was increased as its internal particles were compressed, and the curve exhibited a rising trend. In the third stage, macroscopic damage occurred, corresponding to the development of cracks. The specimens’ internal particles were compressed, resulting in increased strength. Sustained macroscopic damage was observed during the third stage, with significant crack development (stage III). Following peak strength, the transverse strain gradually decreased. The transverse strain did not increase until the specimen completely fractured during the fourth stage, as indicated in the stress–strain curve, at 18.28 MPa.
Figure 5 displays the secant modulus of natural coal rock based on a strain interval of 1 × 10⁻⁵. The results indicate that the secant modulus curve of the coal rock remains nearly horizontal when the axial strain is at 2.5 × 10⁻³~4.5 × 10⁻³, with an average secant modulus of 3.5 GPa. The Poisson’s ratio of 0.186 was obtained by measuring the axial strain and circumferential strain of the specimen at this point.
Figure 6 displays the fitted curves for the compressive strength, peak strain, elastic modulus, and natural water absorption rate of coal rock with varied immersion durations. According to the figure, the natural water absorption rates of different coal rocks decrease logarithmically; it exhibits a negative logarithmic function relationship as the immersion duration increases. This relationship is represented in Equation (2):
r = 0.2891 ln ( h ) + 1.0043 ,
where h—water immersion duration (d); r—natural water absorption rate of coal rock (%).
Under the conditions of short-term water immersion (0–7 d), the compressive strength of the coal rock decreases sporadically with an increase in the water immersion duration. After one day of water immersion, the softening effect of water damages the internal structure of the coal rock, resulting in a reduction in strength. With an increase in water immersion for three days, the natural water absorption rate in the coal rock increases; this increase in the internal natural water absorption rate leads to an enhancement in the plasticity of the coal rock, and, as a result, the strength of the coal rock rises. There are variations in porosity among different coal rocks. The peak compressive strength of the coal rock is low after 5 days of water immersion. In addition, the peak compressive strength remains low. Later, after 7 days of water immersion, the natural water absorption rate increases and the compressive strength increases again. However, it remains lower than that observed after 3 days of water immersion. The natural water absorption rate of the coal rock increases after being immersed for 7 days, causing an increase in compressive strength. However, the strength is still lower than that obtained after 3 days of immersion. According to the analysis above, the optimal natural water absorption rate for coal rock is 1.61% and the immersion duration should be around 3 days for maximum strength. Under long-term water immersion (10–30 d), the compressive strength of coal rock gradually decreases and the water softening effect significantly increases. Considering the natural water absorption rate, the coal rock becomes saturated after being immersed in water for around 25–30 days. At this point, the compressive strength of the coal rock drops to as low as 9.59 MPa, rendering it unable to bear any pressure. This is a clear indication of coal rock saturation. Overall, the compressive strength of the coal rock fits a negative exponential function relationship with the water immersion duration. Equation (3) displays the relationship:
σ c = 29.463 e 0.024 h ,
where σc—peak strength of coal rock (MPa); h—water immersion duration (d).
The varying porosity of coal rock results in a more distinct peak strain. However, with an increase in the water immersion duration, the peak strain of the coal rock decreased overall. During short-term flooding, the peak strain was greatest when the coal rock had an optimal natural water absorption rate. This indicates the significant plasticity of the coal rock at this juncture. However, long-term water immersion drastically weakened the compressive strength of the coal rock, which made it susceptible to crushing without undergoing sufficient plastic deformation. The elastic modulus of the coal rock increased initially when submerged but decreased as the submergence period elapsed, with the highest elastic modulus being observed when optimal natural water absorption rate was reached. The peak strain of coal rock exhibits a negative exponential relationship with the water immersion duration, as shown in the Figure 6. Additionally, as per Equation (4), a linear function relationship is observed between the water immersion duration and the elastic modulus:
ε y = 10.411 e 0.036 h E = 0.0208 h + 3.5674 ,
where εy—coal rock strain (-), E—elastic modulus of coal rock (GPa), and h—water immersion duration (d).

3.3. Analysis of Damage Patterns

The macroscopic damage of coal rock is a consequence of the continuous development, expansion, and penetration of internal fractures. Figure 7 illustrates the damage distribution characteristics of the specimen. The white scatters for DIC monitoring were prepared manually using a whiteboard pen. By observing the coal rock damage pattern and sketching larger cracks, we can use the DIC image detection system to determine the instantaneous changes in the strain and rupture characteristics during the stressing process of the coal rock specimen. This informs us of the main failure mode. Coal rock is brittle, and the damage mode of coal rock varies under different immersion durations. When the natural coal rock was immersed in water for 0 days, it displayed two pronounced cracks at its base, indicating that the primary source of damage was shear. The specimen presented slip damage along the shear surface in response to compressive stress. One crack was particularly obvious; it spanned from the lower center of the specimen to the right side, forming through damage at an approximately 60° angle about the edge of the specimen. This suggests that crack No. 1 was the predominant source of damage. A vertical crack arose along the sprouting position but did not result in a complete fracture. The two cracks exhibited characteristics of “Y”-type damage, and internal granular densification dominated the specimen’s damage, as demonstrated in the stress–strain curves shown in Figure 4. The strain curves exhibit stages III and IV.
During brief water immersion, the damage pattern of coal rock is relatively intact, and its degree of fragmentation is lower than that of natural coal rock. This occurs because coal rock’s brittleness is reduced after brief water immersion, resulting in a weaker degree of destruction. After immersing the coal rock in water for one day, a longitudinal rupture occurred. The crack extended from the lower left to the middle but did not pass through, and there was only one main crack and fewer fine branches. When immersed for three days, the coal rock experienced tensile rupture. The crack position extended from the lower right to the middle but did not pass through, and there was only one main crack but more fine branches. After being submerged in water for 5 days, the coal rock underwent longitudinal ruptures. The crack’s position extended from the bottom to the middle but did not pass through. The main crack had only two fine branches or fewer. Similarly, after 7 days in water, longitudinal ruptures occurred in the coal rock, extending its crack position from the bottom to the middle but not penetrating it. The main crack had two or fewer fine branches. When the coal rock was immersed in water for 7 days, it underwent tensile rupture, resulting in one main crack and two secondary cracks with fewer small branches. Long-term flooding caused significant damage to the coal rock, resulting in more surface cracks and shedding due to the relatively loose structure of the coal rock under the water softening effect. After being submerged in water for 10 days, there was a shear rupture on the left side of the observed surface of the coal rock. This induced the appearance of a single crack and shedding. When submerged for 15 days, there was a shear rupture on the top surface of the coal rock, resulting in the creation of two main cracks that extended through the surface, causing shedding to occur. After 20 days of immersion in water, there was shear damage on the top of the coal rock under pressure, accompanied by local shedding. After 25 days, there was a longitudinal rupture of the coal rock, with one main crack passing through the middle. Upon immersion in water for 30 days, the coal rock was damaged by water softening. After being immersed in water for 30 days, the coal rock exhibited multiple longitudinal fractures. The natural water absorption rate had reached 1.97% at this point, approaching saturation and causing the significant softening of the rock’s internal structure. Comprehensive results indicate that short-term water immersion improves the plasticity of coal rock, with limited softening effects and relatively complete damage. Additionally, there is low fragmentation. However, long-term water immersion leads to a noticeable softening effect and a change in the damage form from shear rupture to longitudinal rupture. The internal structure gradually loosens, and the coal sample’s hardness significantly decreases.

4. Discussion

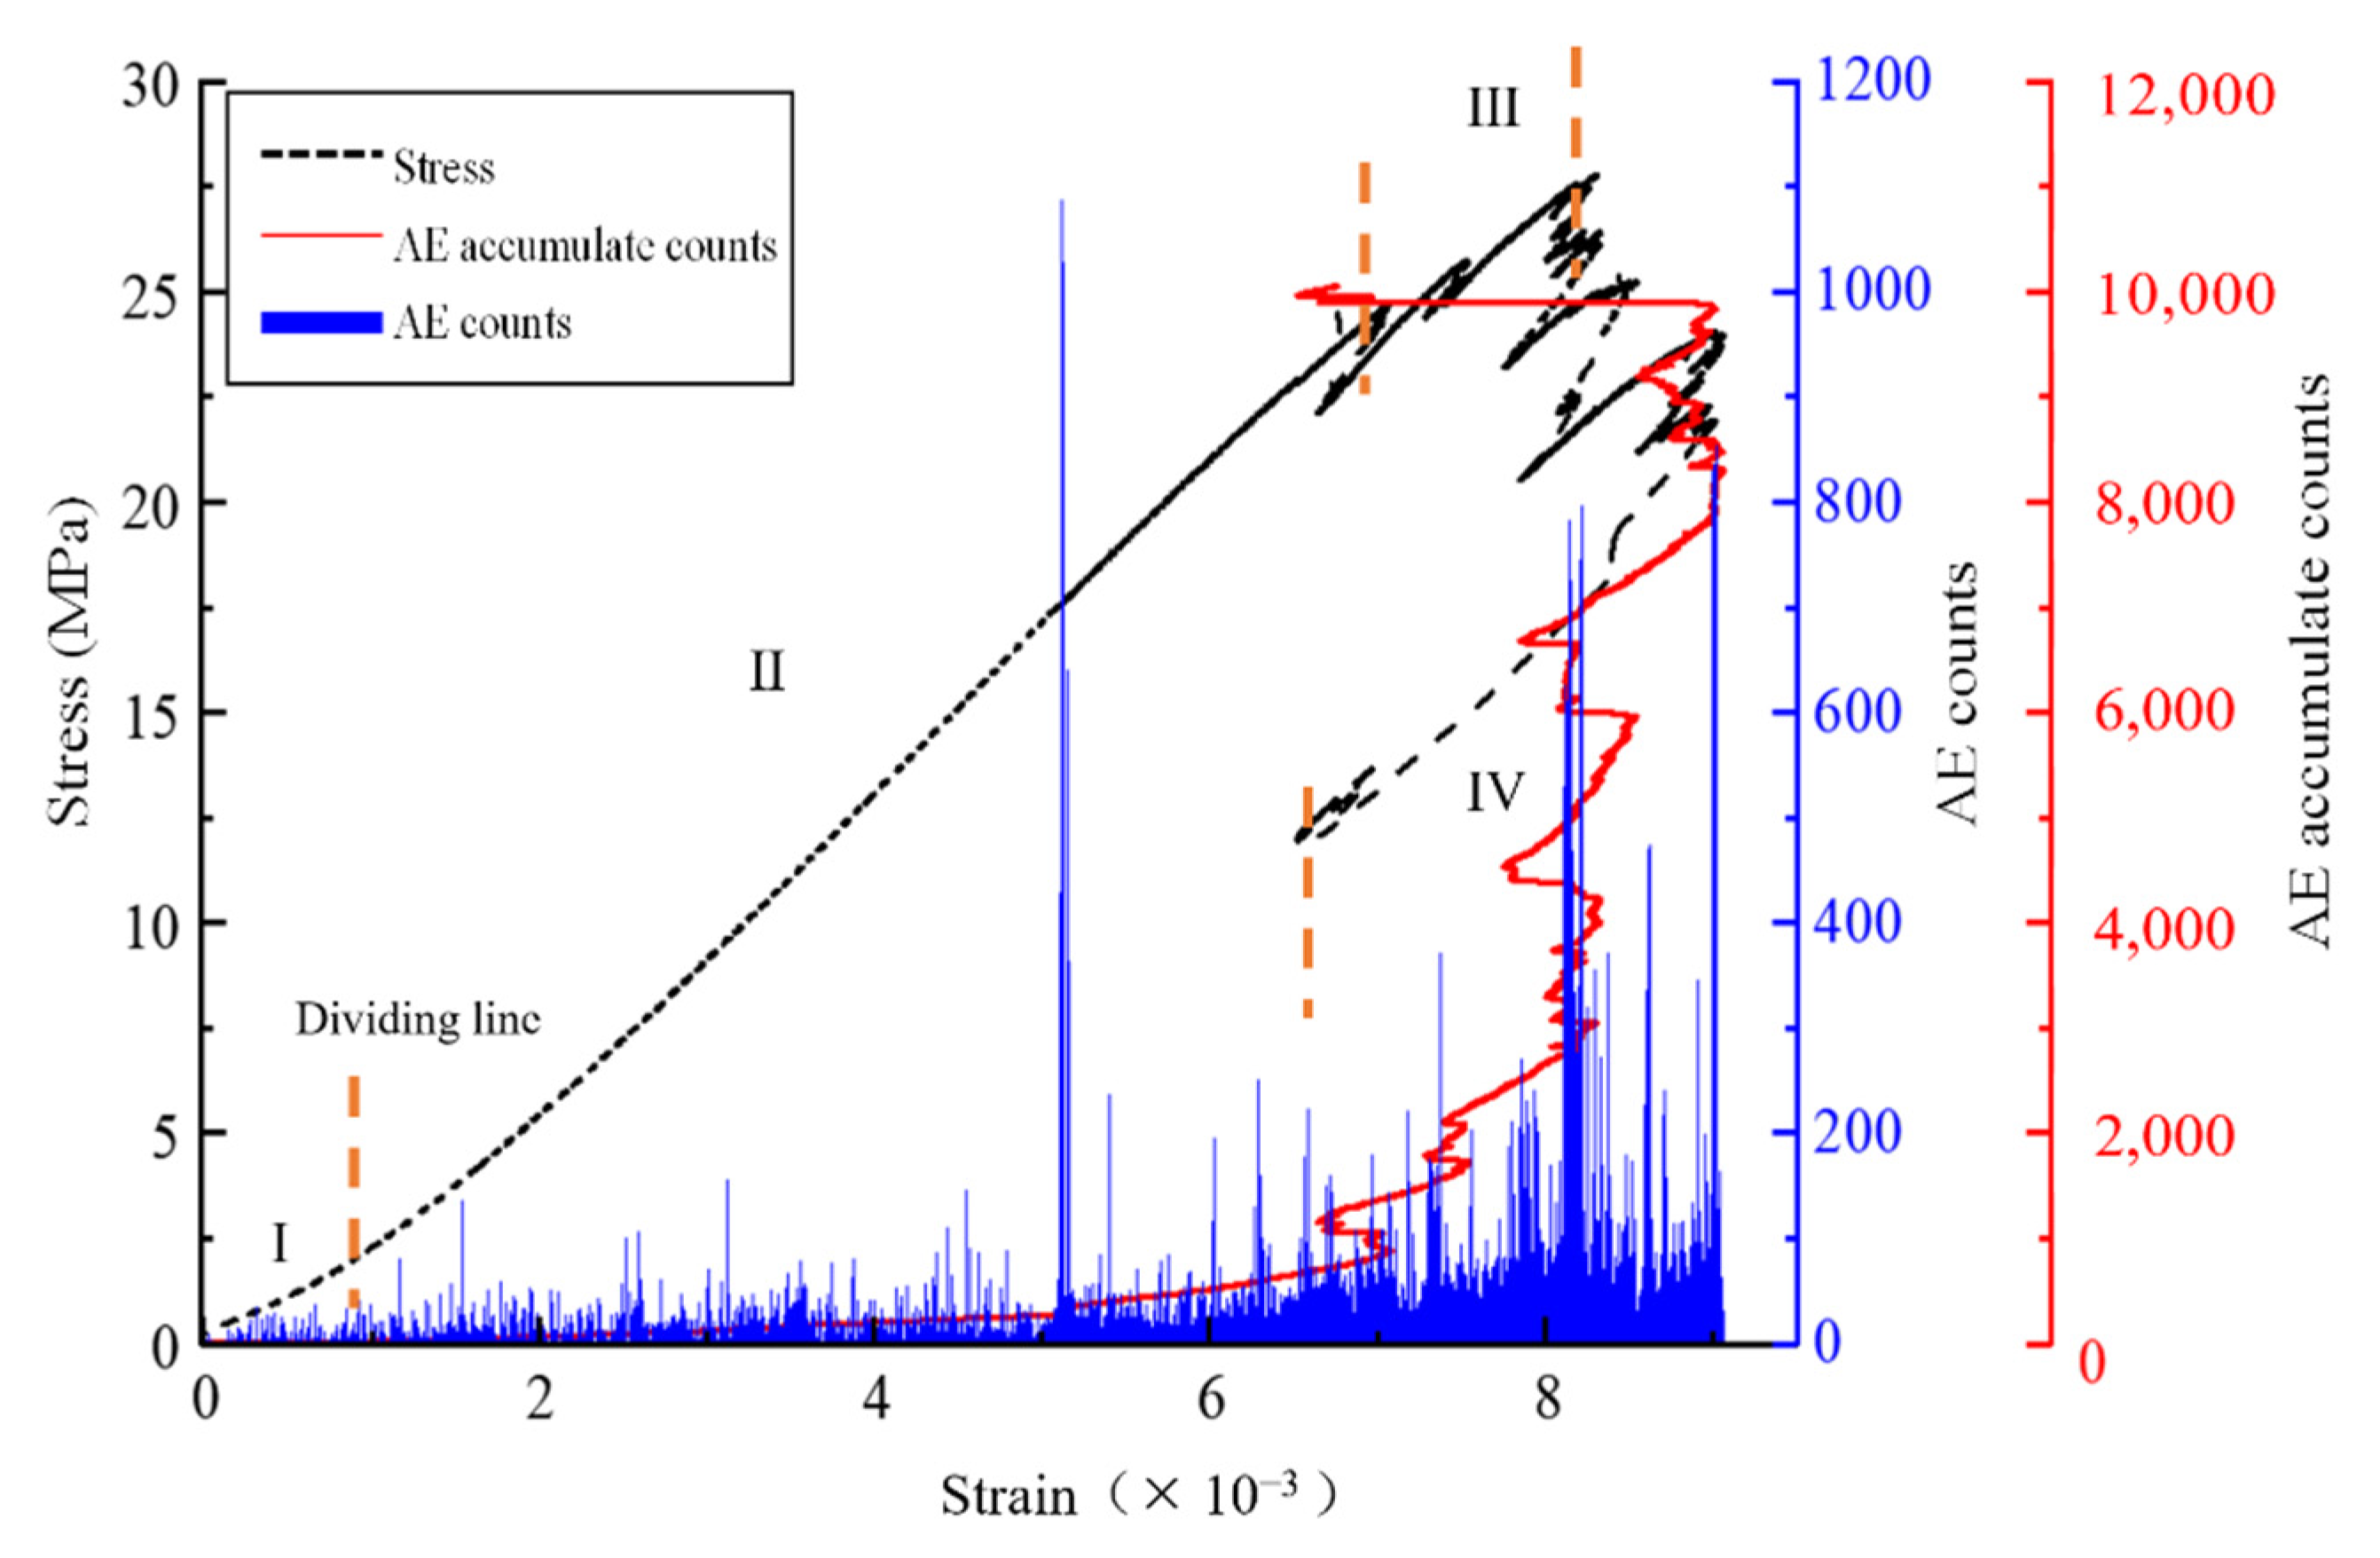
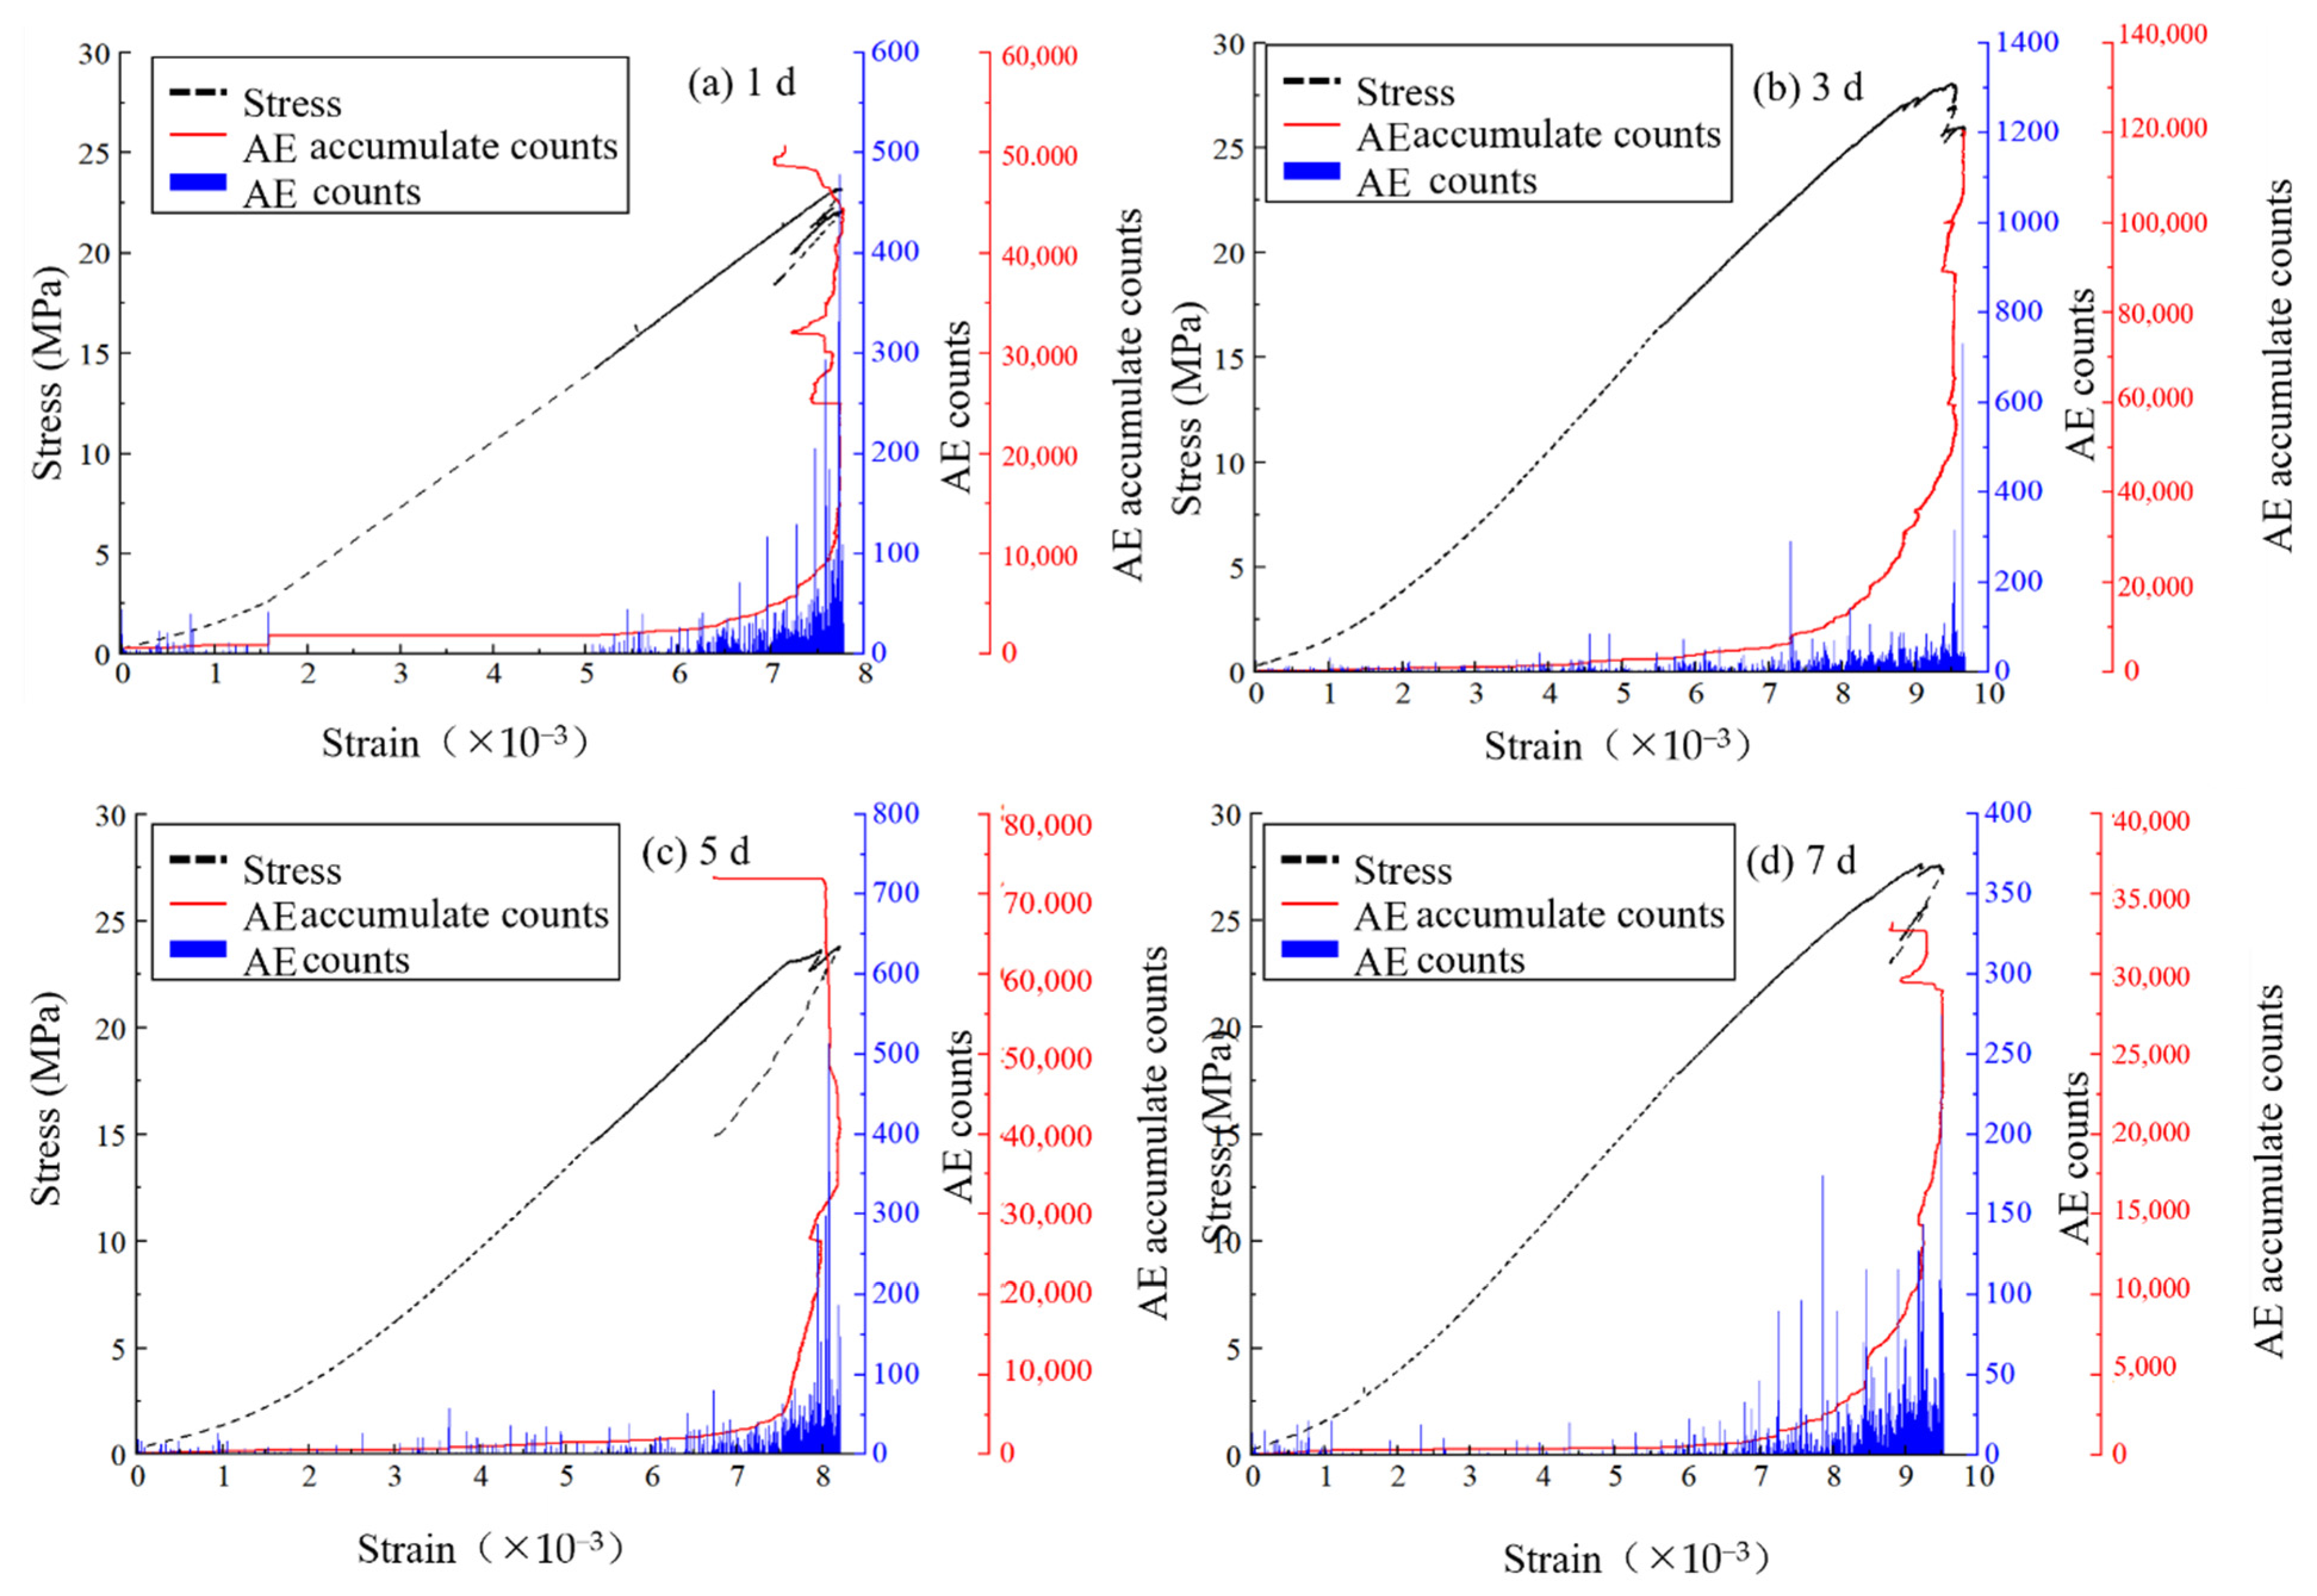
4.1. Acoustic Emission Characteristics

Figure 8 displays the acoustic emission curves for coal rock ringing and the cumulative ringing of the coal rock specimen corresponding to the stress–strain curve. The cumulative acoustic emission ringing curves for the specimen exhibit a stage with an increase in strain. During the compacting stage (stage I), the specimen’s acoustic emission activity decreases, as internal pores and cracks gradually become compacted. Furthermore, new microcracks are not generated, and almost no energy is released. In the linear elasticity stage (stage II), the specimen’s acoustic emission activity increases, but not to a significant extent. The ringing counts and cumulative ringing counts only increase slightly, while the microcracks inside the specimen expand steadily. During the yielding stage (stages II–III), the acoustic emission of the specimen becomes active, causing a significant increase in signal and permanent damage cracks. The expansion of unstable cracks on the surface is accompanied by the detachment of the coal rock, leading to an increase in internal loose particles. Accordingly, the compression and densification of the particles result in increased strength until peak stress, where the specimen’s strength undergoes a zigzag-type reduction. At this stage, the specimen’s acoustic emission ringing count sharply increases, and the cumulative ringing count continues to rise, suggesting the ongoing release of a significant amount of acoustic emission and strain energy. During the post-peak strain softening stage (stage IV), there is a decrease in the specimen’s acoustic emission activity. Additionally, there is a reduction in the degree of growth of the cumulative ringing number, which eventually reaches a maximum value of 1.05 × 10⁵ before disappearing as the loading process comes to a halt.
The ringing characteristics and cumulative ringing numbers of the immersed specimens are presented in Figure 9. The acoustic emission strain-ringing cumulative number curves of the specimens undergoing varying immersion durations exhibit comparable patterns to those of the unimmersed specimens, and the specimens can be categorized into four phases based on the uniaxial compression process. Upon initial analysis, the results appear congruent with the anticipated outcomes. During the compression–density phase, the specimens are in a compressed and dense state, resulting in decreased acoustic emission activity characterized by mainly small-energy events and a slow increase in cumulative ringing. In the linear elasticity stage, the specimen’s acoustic emission activity is similarly low, with a maximum number of ringers of less than 100, and the specimen remains undamaged. During the pre-peak stage of fissure stability development, the specimen exhibits active acoustic emission events. The degree of activity varies depending on the immersion length. Specifically, the immersion lengths of 1 d, 3 d, 5 d, and 7 d register maximum ringing numbers of 478, 729, 513, and 274, respectively. The cumulative increase in the ringing number is significant and corresponds to the internal damage of the specimen at this stage. Additionally, the number of broken particles increases. During the stage of crack instability development, the specimen reaches its peak stress attachment. At this point, acoustic emission events rapidly grow and are often accompanied by sudden increases in energy, particularly near the peak stress. This suggests that a substantial amount of strain energy is released during damage. Additionally, the cumulative number of rings experiences significant growth, plateauing after unloading. Finally, cracks appear on the specimen’s surface, leading to plastic damage. The process of acoustic emission energy change in the water-immersed specimen corresponds with the stress–strain curve. The maximum cumulative ringing count of the water-immersed specimens subjected to durations of 1 day, 3 days, 5 days, and 7 days were 5.06 × 10⁵, 1.20 × 10⁵, 7.22 × 10⁴, and 3.32 × 10⁴, respectively. The findings indicate that the total number of rings on the specimen decreases as the immersion duration increases, revealing the noticeable weakening effect of water. Additionally, the likelihood of crack initiation and rupture within the specimen also decreases as the immersion duration lengthens.

4.2. Fracture Evolution

The digital image correlation analysis method can reveal surface deformation and rupture, along with enabling an analysis of rock strain and the identification of the tension shear rupture type, to explain the mechanisms of crack initiation and extension evolution. This method obtained the axial strain for specimens with varied immersion durations, as depicted in Figure 10. To examine the alterations in strain and the development of fracture extension in immersed specimens during the compression process, we analyzed the strain from various compression stages while combining this with stress–strain curves. The chromaticity bar in the cloud diagram registers tension as positive and compression as negative. The deformation of the coal rock sample can be classified into four distinct stages: the compression–density stage, the linear elasticity stage, the yielding stage, and the post-peak softening stage.
For the purpose of analysis and comparison, this study defines the stress at the junction point between the compressive and linear elastic phases as the compressive stress, the stress at the junction point between the linear elastic phase and the yielding phase as the initiation stress, the stress at the junction point between the yielding phase and the post-peak softening phase as the peak stress, and the last surface damage map captured by the high-speed DIC camera as complete rupture stress. This approach ensures consistency in the stress terminology. Figure 10a presents the axial strain cloud of the specimen after one day of immersion in water. The compaction pressure of the specimen is 2.60 MPa, resulting in the overall blue coloration of the strain cloud map. The strain exhibits negligible fluctuations around the value of zero, implying limited deformation at this stage. The initial stress required for cracking was 17.20 MPa, with a red area of strain present in the lower-left region of the strain map. The maximum strain observed was 0.5%. As the specimen reached its peak stress of 23.23 MPa, the red area expanded further, and the crack significantly grew, resulting in an increase in strain up to 0%. In the post-peak softening stage, the specimen incurred the maximum strain of 0.78% in the red strain area, which extended from the lower-left part to the upper-middle section. The maximum strain remained at 0.78%. The complete rupture stress amounted to 18.72 MPa. Consequently, the specimen sustained damage at this point, with cracks appearing and small coal rock fragments dislodged in the above area. The specimen initially experienced uniformly distributed strain during 1-day water immersion, followed by the gradual formation of a strain concentration area and the occurrence of damage. The final area of damage coincides with the strain concentration area, suggesting that the damage process of coal rock undergoes a transition from uniform to non-uniform deformation.
Figure 10b–d display the axial strain for specimens submerged in water for 3, 5, and 7 days. The samples examined during the compaction stage are similar to those immersed in water for 1 day, exhibiting more uniform deformation. During the remainder of this stage, samples with immersion durations of 3, 5, and 7 days show no visible surface cracks and display a strain concentration area in the form of a band oriented vertically along the laminae. This band is believed to be associated with the direction of the internal joints. The critical stress of specimens with different immersion lengths reached various stages. Specifically, the specimen immersed in water for 3 days experienced compressive stress of 2.11 MPa with strain of 0.44%. The cracking stress reached 15.56 MPa with strain of 0.53%, while the peak stress was 28.04 MPa, and the strain was 0.95%. The cracking stress reached 15.56 MPa with strain of 0.53%, while the peak stress was 28.04 MPa, and the strain was 0.95%. The cracking stress reached 15.56 MPa with strain of 0.53%, while the peak stress was 28.04 MPa, and the strain was 0.95%. The complete rupture stress peaked at 25.59 MPa with maximal strain of 0.97%. Notably, the yielding stage exhibited the highest increase in strain, reaching 0.97%, with an increment of 0.42% and with the strain leading to an increase in red-striped regions, progressing until the termination of the maximum strain. After immersing the specimen in water for 5 days, the compressive stress was measured at 1.81 MPa, with strain of 0.13%. The cracking stress was 16.85 MPa, with strain of 0.59%, while the peak stress was 23.82 MPa, with strain of 0.81%. Finally, the complete rupture stress was recorded at 15 MPa. The specimen experienced stress of 27 MPa and maximal strain of 0.82%. During the linear elasticity stage, the strain had a notable increase of 0.46%, resulting in the development of a red band-like area in the strain cloud diagram. The red stripes in the strain cloud became more pronounced and continued to develop, culminating in the formation of flaky red strain concentration areas in the yielding stage. Eventually, these areas led to the formation of cracks in the lower-right part of the specimen. The specimen’s compressive stress after being immersed in water for 7 days was 3.34 MPa with strain of 0.18%. The cracking stress was 15.60 MPa, with strain of 0.54%. The peak stress was recorded at 27.65 MPa, with strain of 0.92%. The complete rupture stress measured 23.37 MPa, with the maximum strain at 0.95%. During the yielding stage, the specimen had the highest strain increment of 0.38%. There were many red-striped areas observed in the strain map, and a crack was formed. Numerous red stripes are visible on the strain map, with a greater concentration in the right portion of the specimen. The results indicate a significant increase in specimen strain following immersion in water. Furthermore, the specimen’s damage reduces and the softening effect enhances its plasticity while decreasing its brittleness and the intensity of damage.

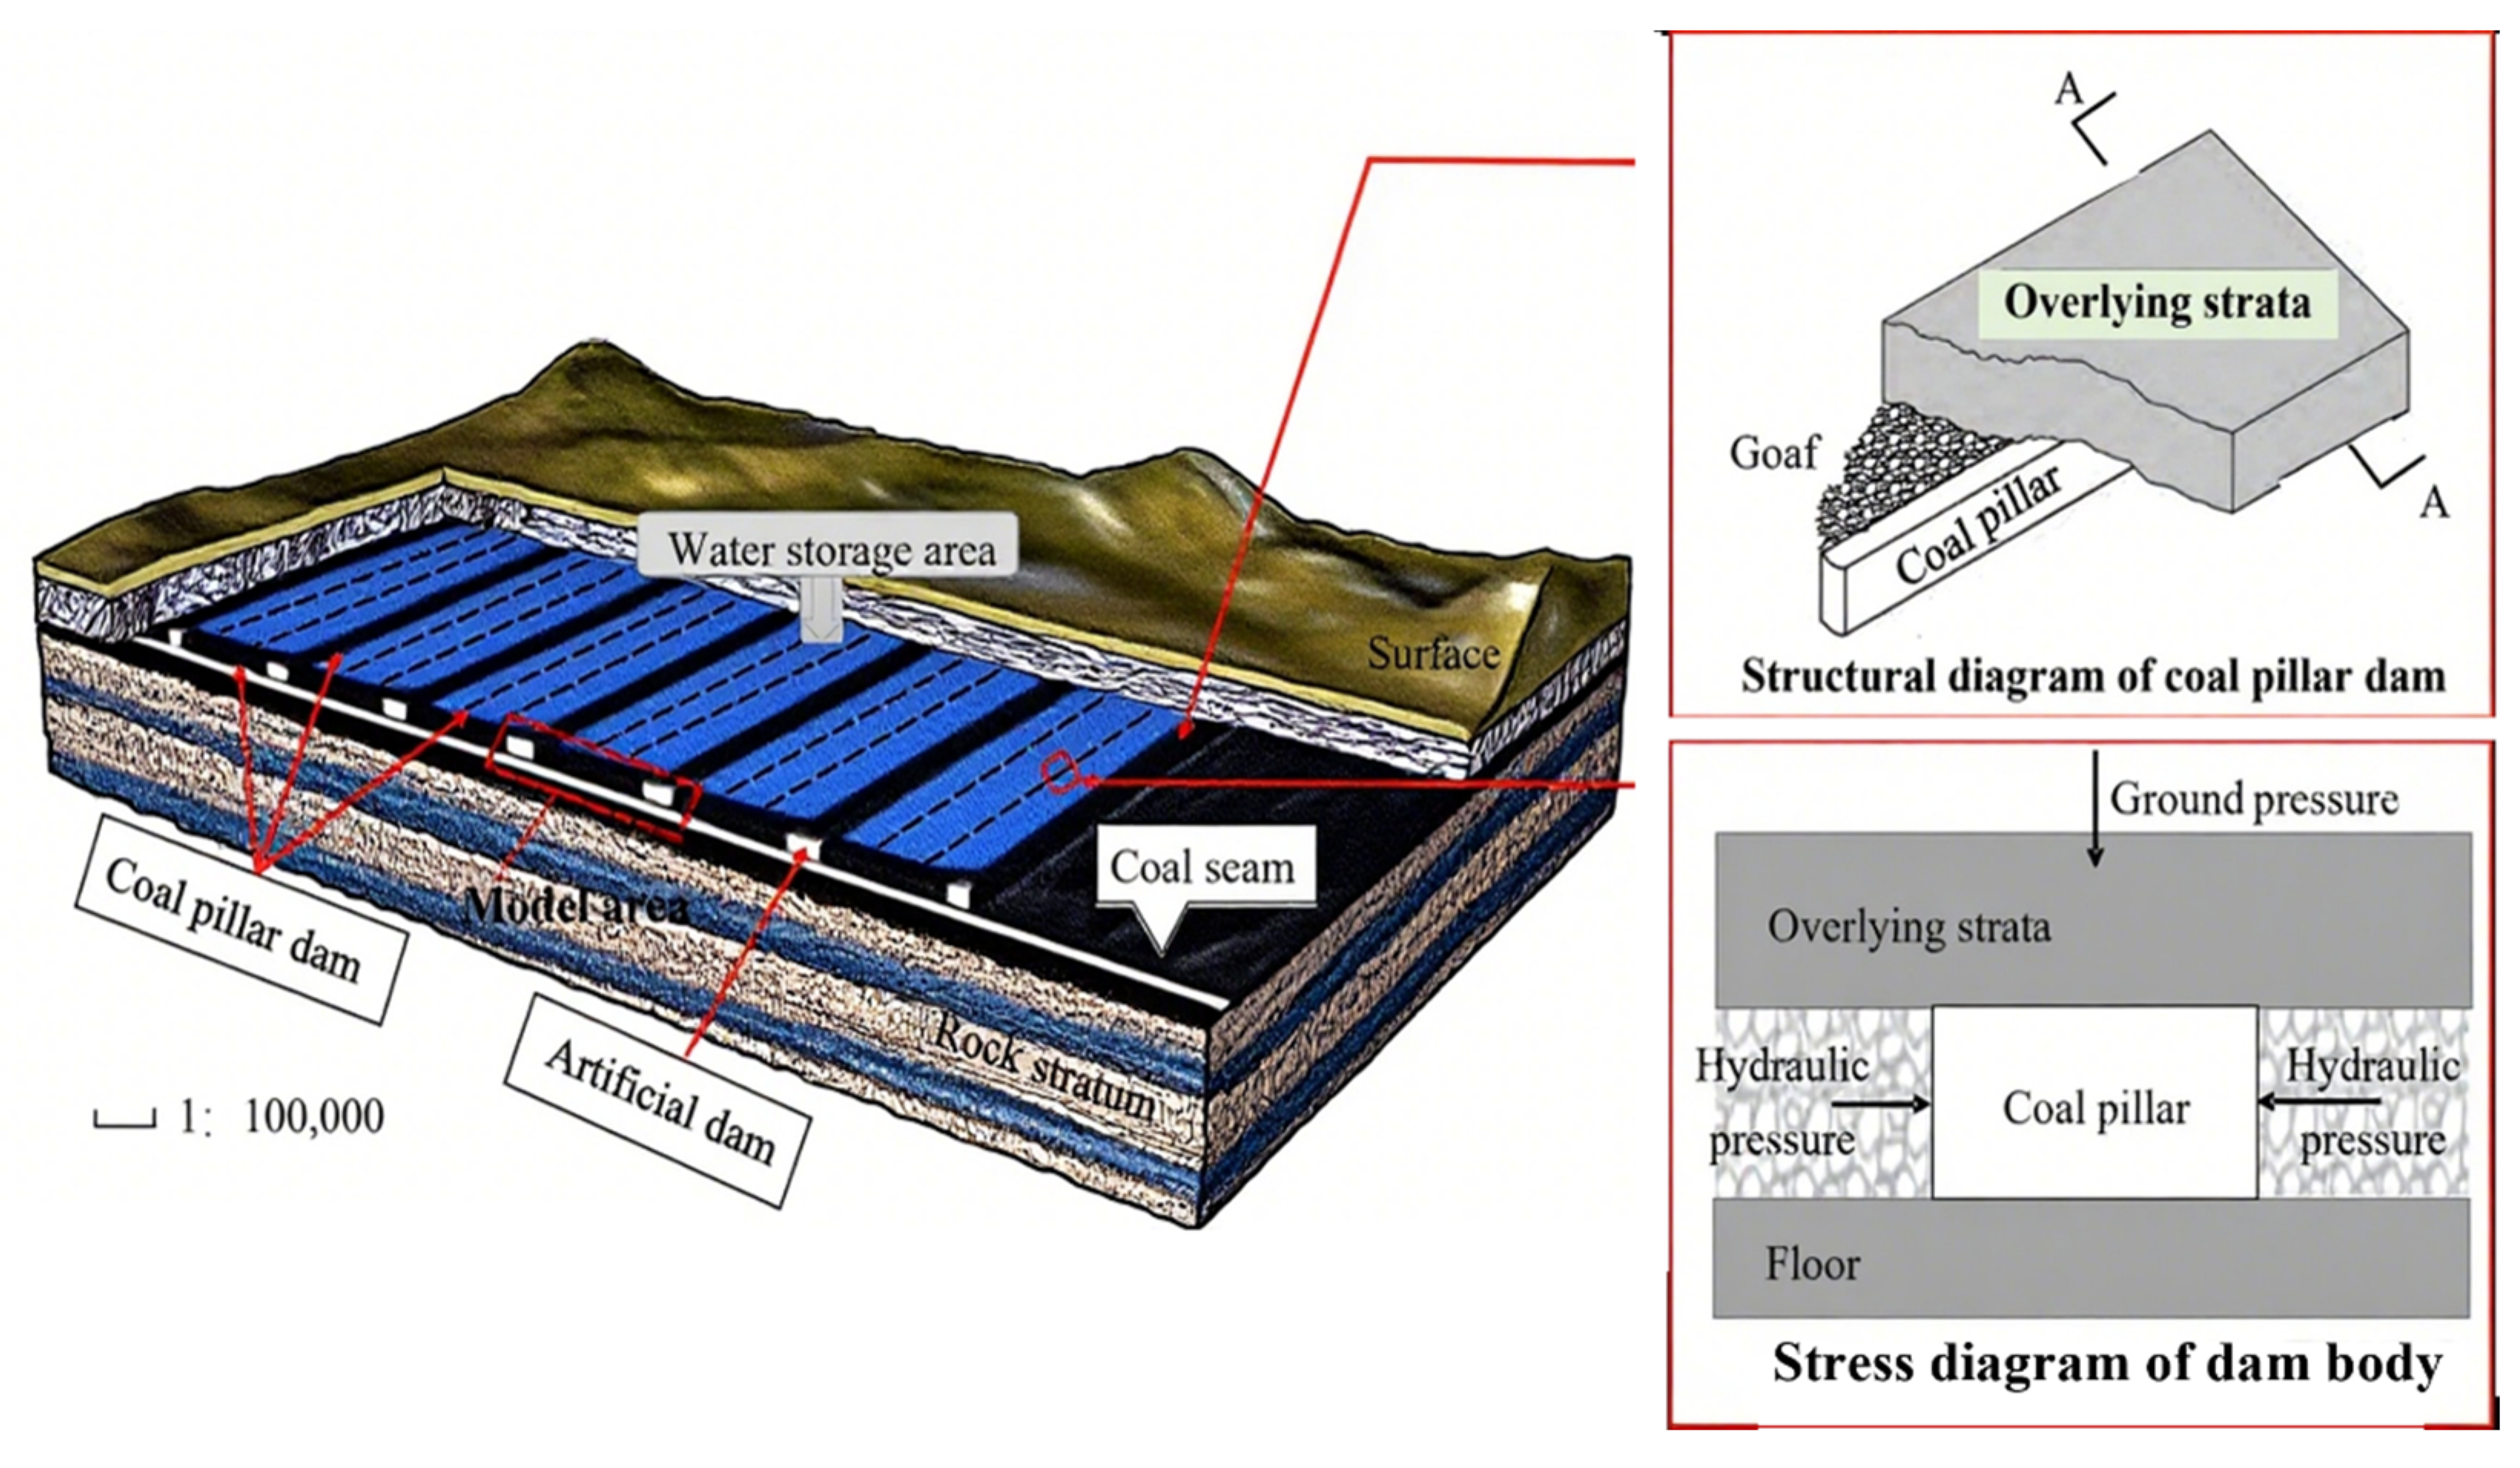
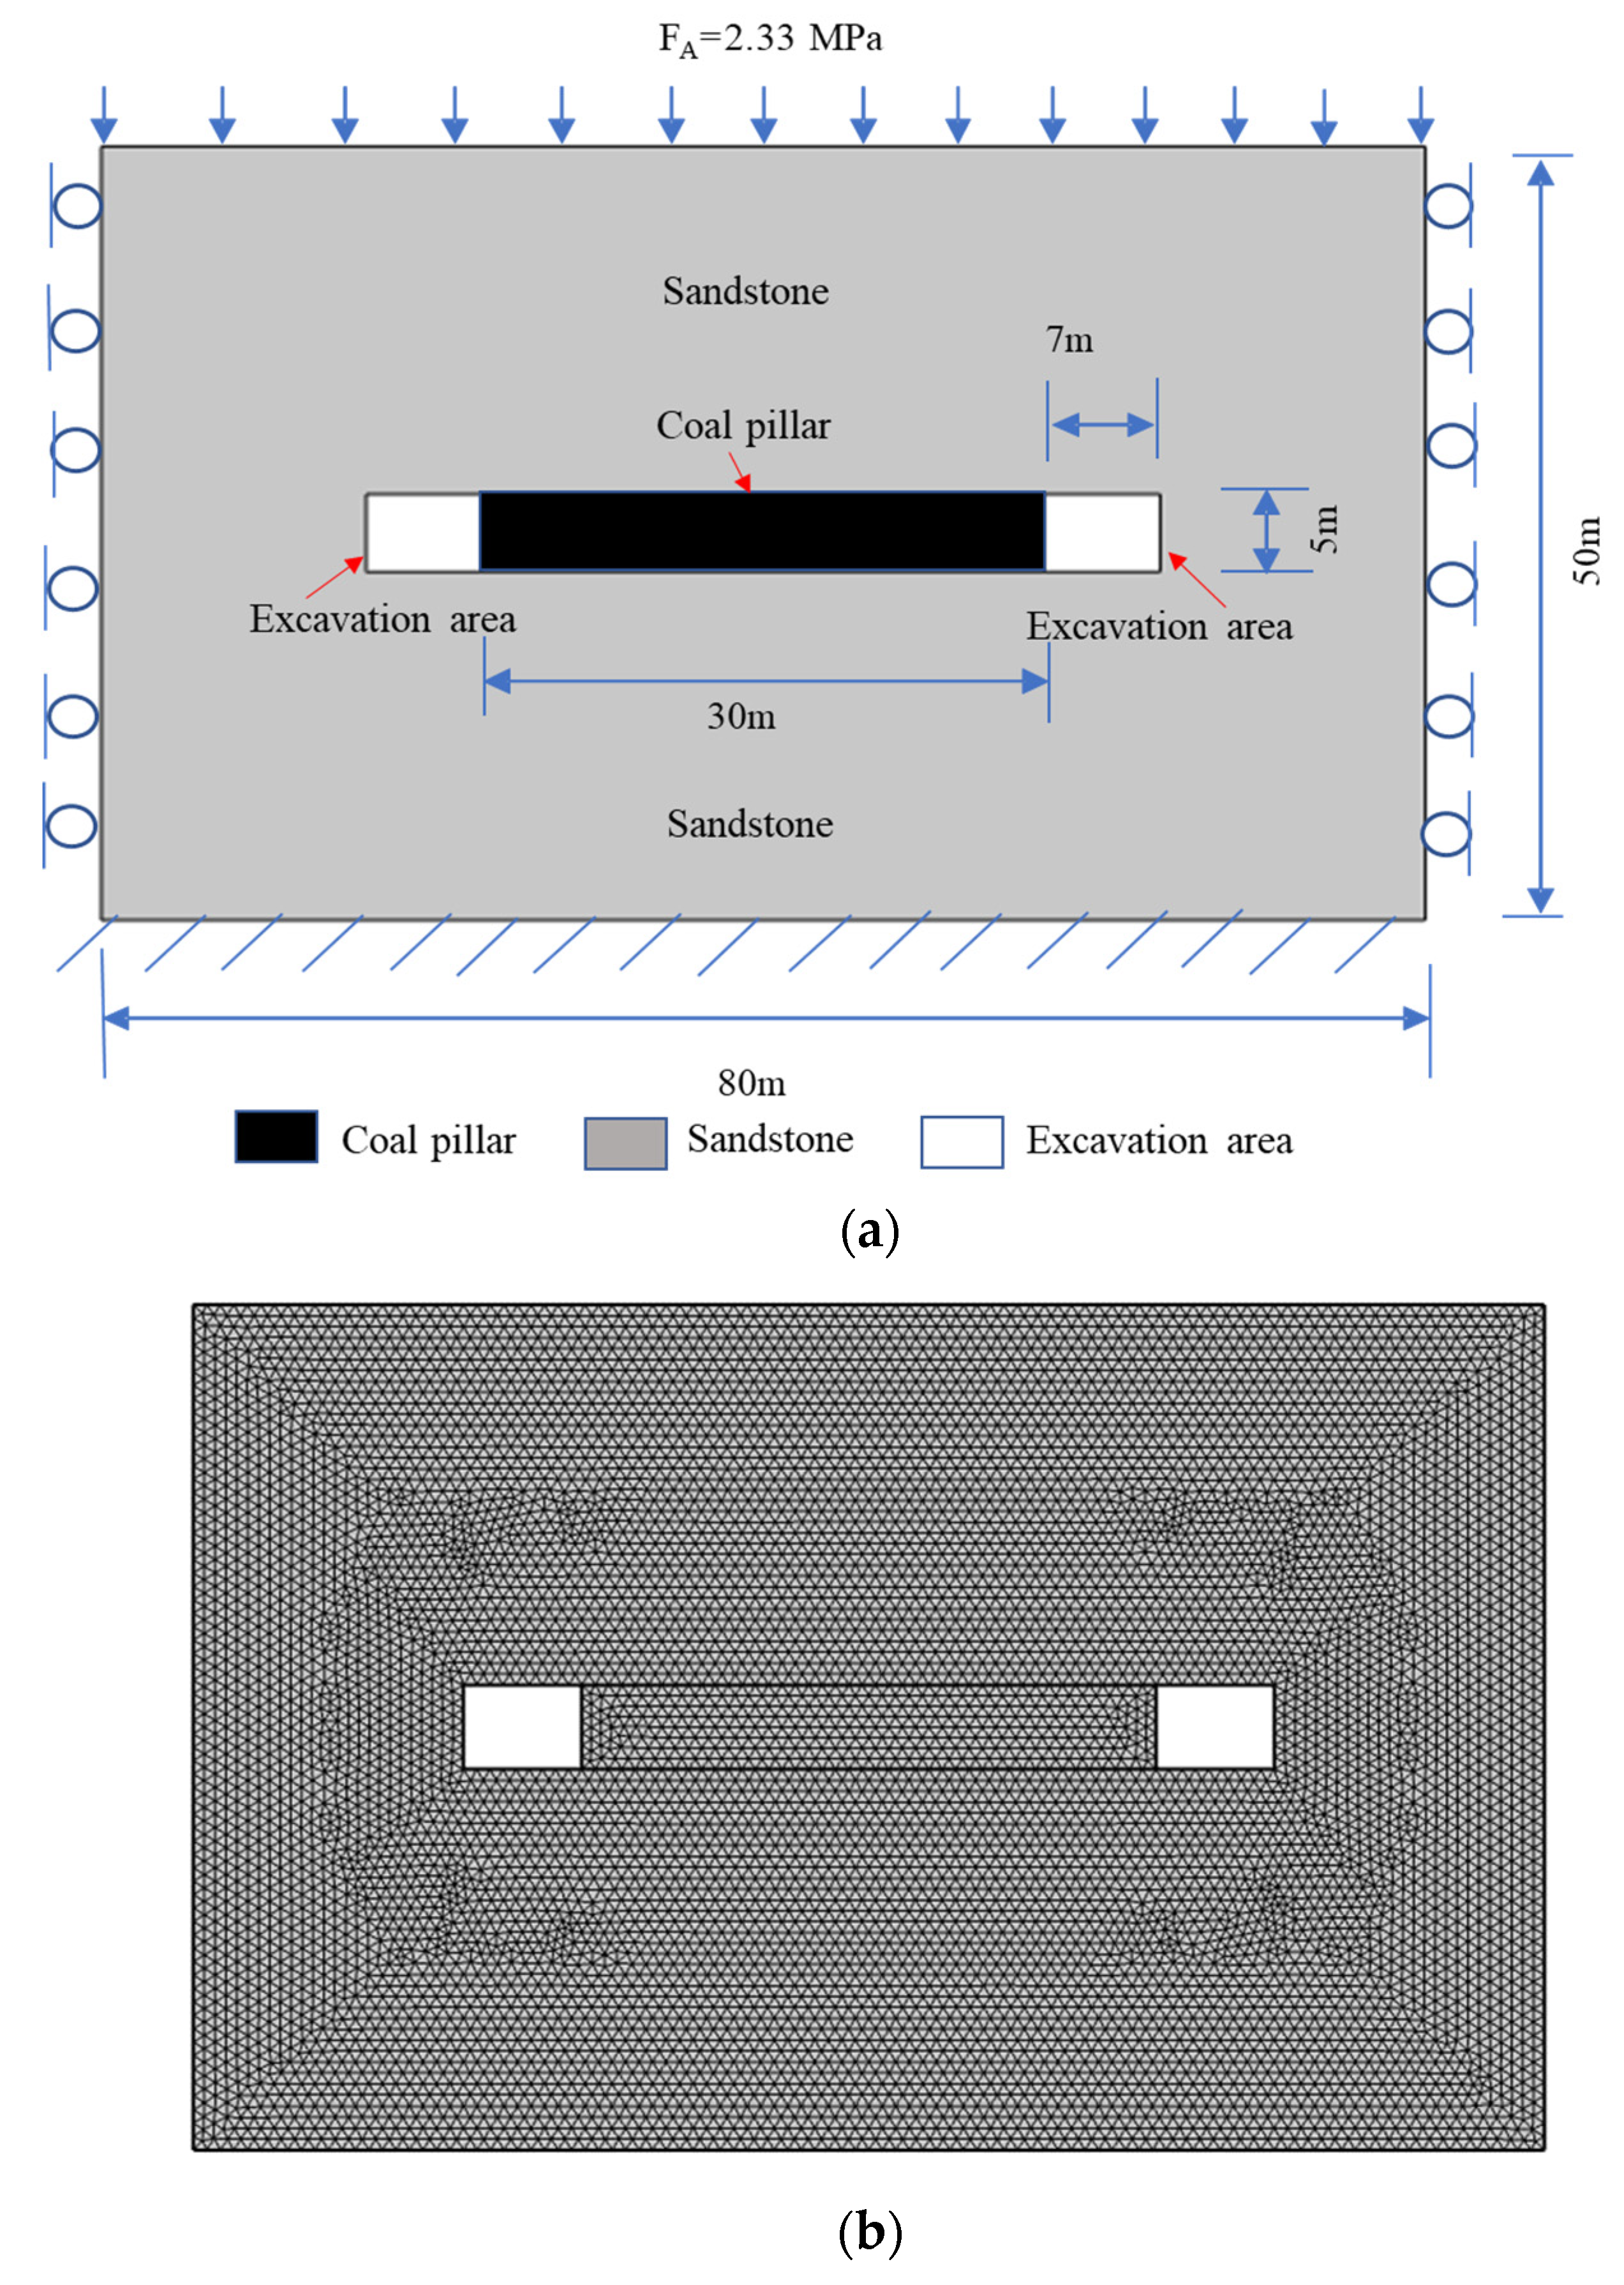
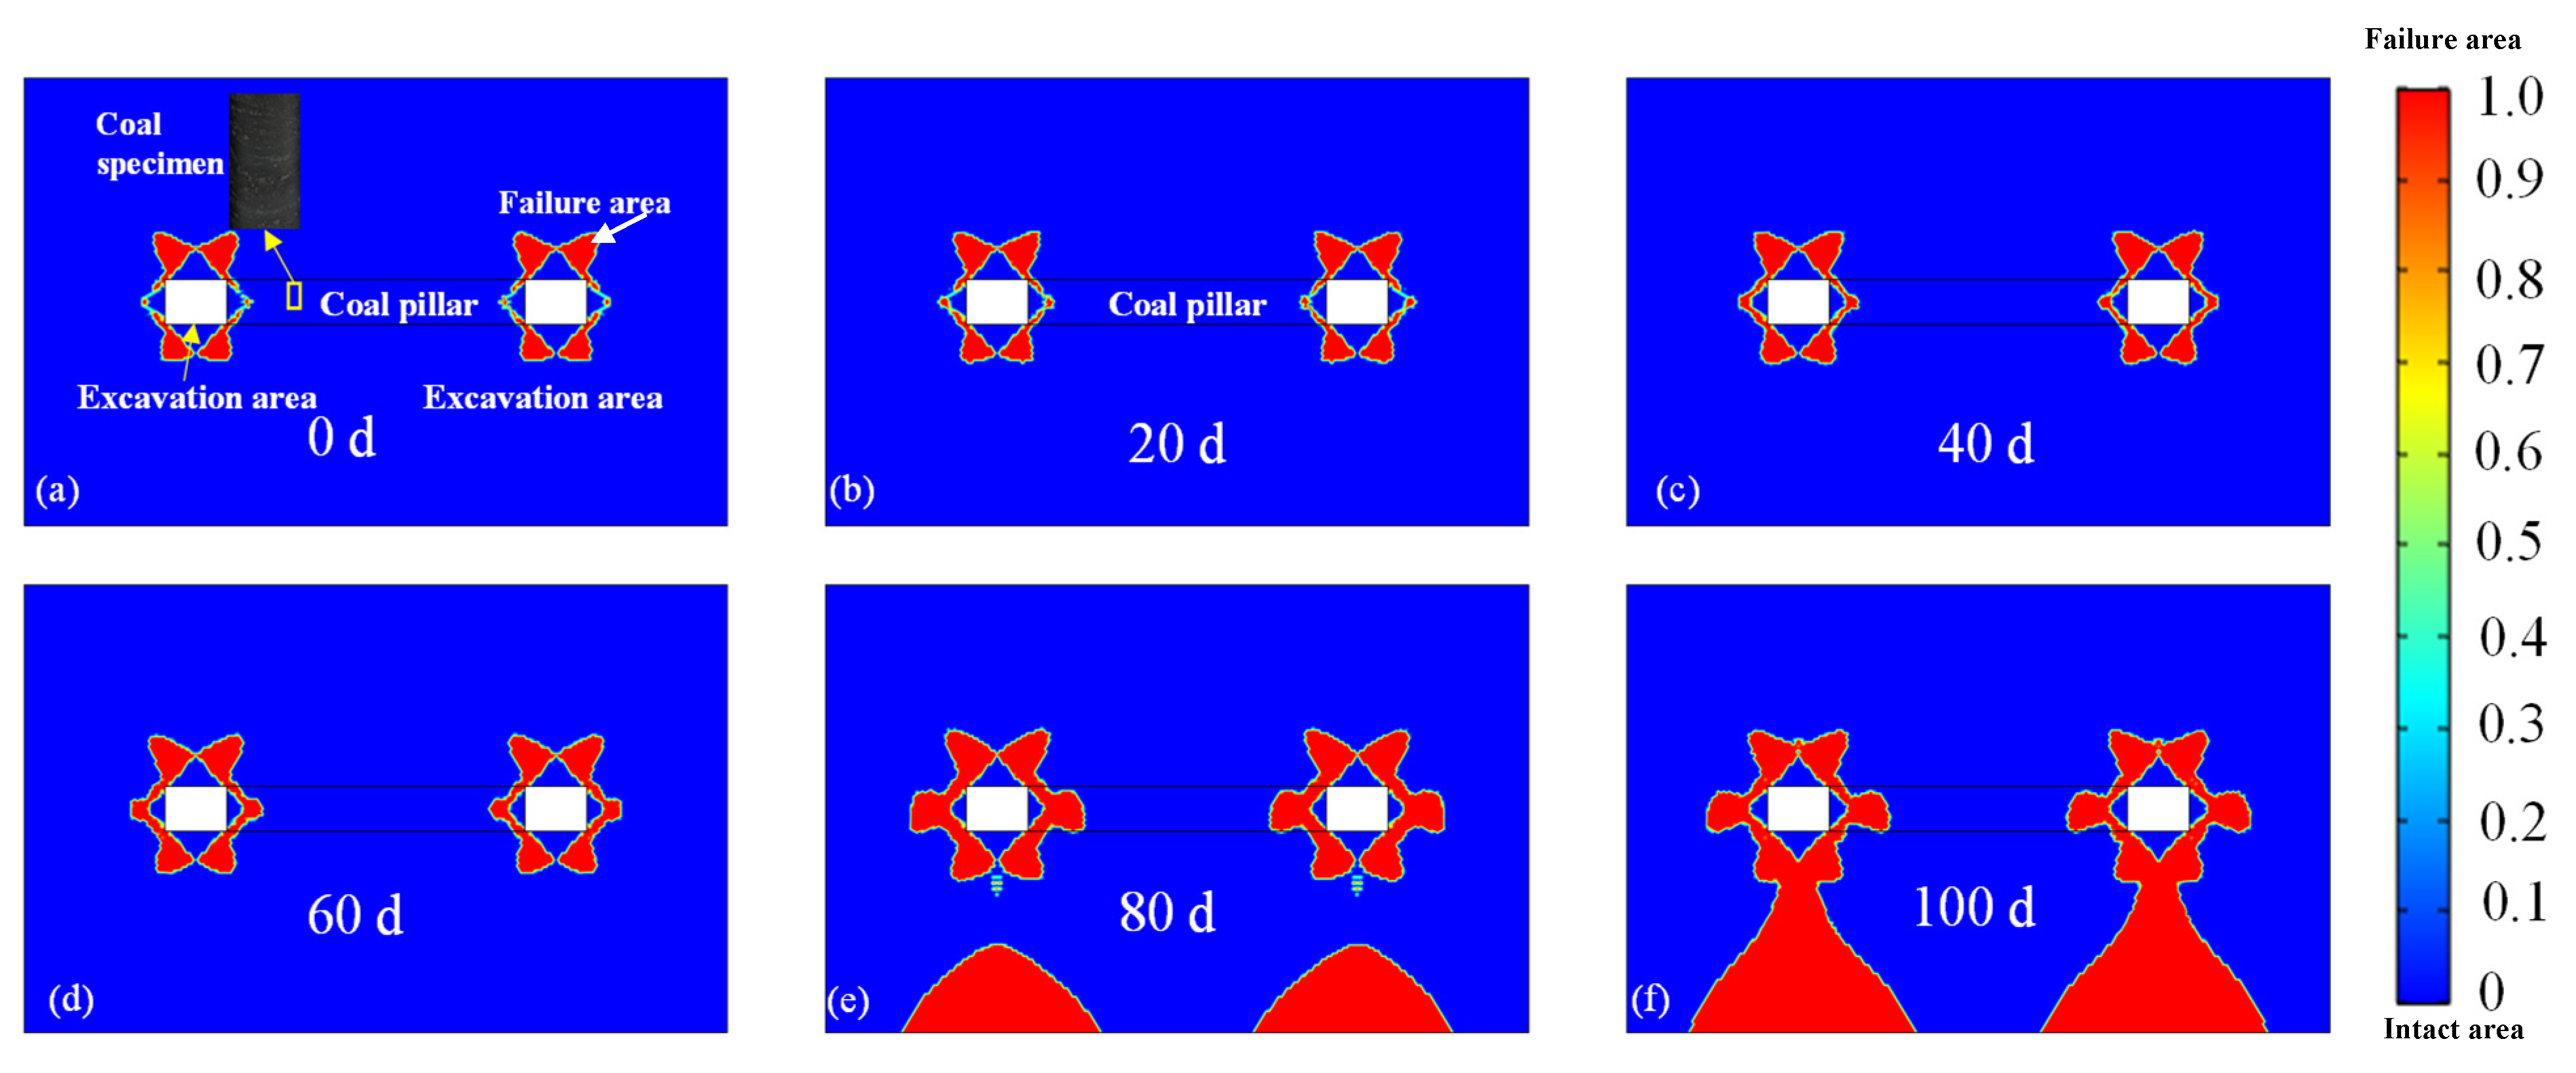
4.3. Application in Coal Pillar Failure

Underground reservoirs need to store water for a long time, and the immersion duration has a great influence on the body of the coal pillar dam (Figure 11, Gu et al. [30]). The numerical model is based on an engineering application reported by Yang et al. [31]. The fitting curves of the compressive strength and elastic modulus of coal samples under different immersion durations were obtained, and the damage of coal pillar dams with different immersion durations was analyzed based on the COMSOL6.0 software. The computational model incorporates stress field evolution and surrounding rock deformation during hydraulic fracturing, including their combined influence on damage propagation. The transient analysis employs a time-stepping scheme with the following parameters: initial time (t0) = 0, time increment (Δt) = 0.1, and final time (t_f) = 1. The model scale and conditions used in the analysis are presented in Figure 12a. According to the actual size of the coal pillar dam body, a two-dimensional mechanical model with a length of 80 m and a height of 50 m is established, as shown in Figure 12a. The coal pillar model is 30 m wide and 5 m high, and the gob model is 7 m wide and 5 m high. The strength, deformation, and structural parameters of each rock layer used for numerical simulation are shown in Table 2. The model is discretized using a second-order quadratic discretization, which is controlled by the respective physical fields. The solid mechanics physical field for solid media and the Darcy’s law physical field for porous media are controlled by Poisson-type partial differential equations, and the second-order unit is the default choice for all of these equations in COMSOL Multiphysics. In order to achieve the required accuracy, it is necessary to perform grid refinement. Increasingly finer grids (smaller and smaller units) are used to solve the same problem, and the complete mesh of the present model contains 15,982 area units and 476 boundary units, as shown in Figure 12b.
Wang et al. [32] discussed the anisotropic properties of coal pillars under failure considering the effects of bedding planes. Their study revealed that the anisotropy of the coal pillar dam body is one of the most significant factors when the principal direction of the mechanical properties is θ = 45° or θ = 135°. This conclusion is in line with the main direction of crack development in the damage area shown in Figure 13. Here, we continue to analyze the influence of water immersion on the mechanical properties and fracture evolution of coal pillars. The damage of coal pillar dams with immersion durations of 0 d, 20 d, 40 d, 60 d, 80 d, and 100 d was investigated. The mechanical properties of the coal pillar under different immersion durations are based on Equations (3) and (4). The strength criterion when judging the failure of anisotropic materials is achieved mainly through the combination of a series of stress–strength indices. The equation is as follows:
σ 1 2 X t X c σ 1 σ 2 X t X c + σ 2 2 Y t Y c + X c X t X t X c σ 1 + Y c Y t Y t Y c σ 2 + τ 12 2 S 2 = 1
where σ 1 is the stress along the joint direction, σ 2 is the stress perpendicular to the joint direction, τ 12 is the shear stress in the joint direction, X t and Y t are the tensile strength indices parallel to the direction of the layered rock joints and perpendicular to the direction of the layered rock joints, X c and Y c are the compressive strength indices parallel to the direction of the layered rock joints and perpendicular to the direction of the layered rock joints, and S is the shear strength index in the rock bedding direction, which is calculated based on the Mohr–Coulomb theory.
Figure 13 shows the failure areas of coal pillar dams with different immersion durations. As the water immersion duration increases, the damage area of the coal pillar dam body and the surrounding rock of the excavation area continues to expand. Within 0 d of immersion, the damage patterns of the coal pillar dam and the surrounding rock of the excavation area are consistent with the conclusions previously obtained. With an increase in the immersion duration, after 20 d of immersion, the failure areas at both ends of the coal pillar dam widen and have a tendency to pass through, and there is no obvious change in the damage pattern of the surrounding rock of the excavation area. After 40 d of immersion, the failure areas at both ends of the coal pillar dam widen and have a tendency to pass through, and the two fracture bands intersect to form a square damage area, while the damage pattern of the excavation area surrounding the rock is not obvious. After 60 d of immersion, the damage pattern of the coal pillar dam and the excavation area surrounding rock is not obvious; after 60 d of immersion, the damage pattern of the coal pillar dam and the damage pattern of the excavation area surrounding the rock are not obvious. After 60 d of water immersion, the crack width at both ends of the dam continues to increase, the square damage area increases, and there is no obvious change in the damage pattern of the excavation area surrounding the rock. After 80 d of water immersion, the width of the failure area at both ends of the dam increases significantly, the square damage area expands to the top and bottom of the dam, and the damage area at the top and bottom of the excavation area surrounding the rock increases, while a new damage area appears in the lower part of the bottom plate. After 100 d of water immersion, the joints between both ends of the dam are completely damaged, and the damage of the excavation area surrounding the rock bottom plate penetrates through the damage. After 100 d of water immersion, the connection between the two ends of the coal pillar dam is completely damaged, and the bottom plate of the tunnel is damaged through. This study shows that the stability of the coal pillar dam and the excavation area is poor after 80 d of water immersion. These results provide a reference for the prediction of the damage morphology of the coal pillar dam after long-term immersion in real scenarios.

5. Conclusions

When a coal sample absorbs more water, the mechanical properties are greatly affected; for example, the coefficient of friction decreases, and crack development increases and leads to a decrease in the elastic modulus [33]. Using acoustic emission technology and digital image processing, we conducted uniaxial compression tests on coal rock samples immersed for varying durations. We uncovered the patterns of compressive strength degradation and fracture evolution of coal rock under immersion-induced weakening.
(1)
The natural water absorption rate of coal rock reaches its peak after being immersed in water for 1 day. As the immersion duration increases, the absorption rate gradually stabilizes at around 20 days, indicating the gradual saturation of the coal rock with water absorption. The saturated natural water absorption rate is 1.97%. The longitudinal wave velocity of the coal rock tends to increase after water immersion.
(2)
Short-term water immersion results in an improvement in the plasticity of the coal rock with only a minor softening effect, resulting in a relatively complete damage morphology and a low degree of fragmentation. Conversely, prolonged water immersion results in the significant softening of the coal rock, which causes a shift in the damage morphology from shear fracture to longitudinal fracture. A negative exponential function was used to establish the relationship between the compressive strength and peak strain of the coal rock during continuous immersion, revealing a linear correlation between the elastic modulus and immersion duration.
(3)
The active periods of acoustic emission in coal rocks with different water immersion durations are comparable, with the most significant stress peaks occurring near the highest intensity. With increasing immersion durations, the cumulative number of acoustic events decreases, indicating the pronounced attenuation effect of water. Furthermore, the longer the immersion duration, the lower the extent of damage and the higher the level of integrity. The number of failure areas in the compressive fracture process of coal rock decreases after water immersion. The area of strain concentration forms a narrow strip in the direction of vertical lamination, and this is significantly influenced by the orientation of the primary joints within the coal.
(4)
The fitting curves of the compressive strength and elastic modulus under different immersion durations were obtained. The mechanical reduction relationship was applied to the failure patterns of coal pillars in underground reservoirs. The damage area of the coal pillar and the surrounding rock of the excavation area is expanded when increasing the duration of water immersion.
The mechanical reduction relationship model of coal rocks with different immersion durations is based on a 30-day specimen, and future studies will increase the immersion duration to further validate the reliability of the mechanical reduction relationship model.

Author Contributions

Investigation, H.Z.; methodology, P.W.; software, K.Z.; data curation, Y.G. and Z.Q.; writing—review and editing, P.W.; project administration, M.C. All authors have read and agreed to the published version of the manuscript.

Funding

This work was financially supported by the National Key R&D Program of China (No. 2023YFC2907400, 2021YFC2900500), the National Natural Science Foundation of China (No. 52074020), the specific research fund of the Innovation Platform for Academicians of Hainan Province (YSPTZX202504), and the Hainan Province Science and Technology Special Fund (ZDYF2024GXJS307).

Institutional Review Board Statement

Not applicable.

Informed Consent Statement

Not applicable.

Data Availability Statement

The original contributions presented in this study are included in the article. Further inquiries can be directed to the corresponding author.

Conflicts of Interest

The authors declare that they have no conflicts of interest.

References

  1. Qian, M.G.; Miu, X.X.; Xu, J.L. Green mining of coal resources harmonizing with environment. J. China Coal Soc. 2007, 32, 1–7. [Google Scholar]
  2. Qian, M.G. On sustainable coal mining in China. J. China Coal Soc. 2010, 35, 529–534. [Google Scholar]
  3. Gu, D.Z. Theory framework and technological system of coal mine underground reservoir. J. China Coal Soc. 2015, 40, 239–246. [Google Scholar]
  4. Liu, Q.; Sun, Y.J.; Li, J. Experimental study on seepage characteristics of Jurassic weakly cemented sandstone under water-rock interaction. Geofluids 2020, 3, 8543687. [Google Scholar] [CrossRef]
  5. Chen, T.; Yao, Q.L.; Du, M.; Zhu, C.G.; Zhang, B. Experimental research of effect of water intrusion times on crack propagation in coal. Chin. J. Rock Mech. Eng. 2016, 35, 3756–3762. [Google Scholar]
  6. Tang, C.J. Study on Damage Characteristics of Coal Under the Influence of Dryness-Saturation Cycles and Acid Water Environment. Master’s Thesis, China University of Mining and Technology, Xuzhou, China, 2020. [Google Scholar]
  7. Yao, Q.L.; Wang, W.N.; Li, X.H.; Tang, C.J.; Xu, Q.; Yu, L.Q. Study of mechanical properties and acoustic emission characteristics of coal measures under water-rock interaction. J. China Univ. Min. Technol. 2021, 50, 558–569. [Google Scholar]
  8. Chen, G.B.; Zhang, J.W.; Li, T.; Chen, S.J.; Zhang, G.H.; Lv, P.F.; Teng, P.C. Timeliness of damage and deterioration of mechanical properties of coal-rock combined body under water-rock interaction. J. China Coal Soc. 2021, 46, 701–712. [Google Scholar]
  9. Lu, J.; Xu, Q.Y.; Ning, Z.X. Analysis of structural characteristics of the coal with different water immersion time. J. Henan Polytech. Univ. (Nat. Sci.) 2019, 38, 28–36. [Google Scholar]
  10. Jiang, C.B.; Duan, M.K.; Yin, G.Z.; Wu, G.P.; Yu, H. Loading-unloading experiments of coal containing gas under the condition of different moisture contents. J. China Coal Soc. 2016, 41, 2230–2237. [Google Scholar]
  11. Yao, Q.L.; Chen, T.; Ju, M.H.; Ling, S.; Liu, Y.P.; Li, X.H. Effects of water intrusion on mechanical properties of and crack propagation in coal. Rock Mech. Rock Eng. 2016, 49, 4699–4709. [Google Scholar] [CrossRef]
  12. Ma, H.F.; Yin, D.W.; Chen, S.J.; Liu, X.Q.; Chen, B. Research on soaking effects on the tensile strength and failure characteristics of rock. Min. Res. Dev. 2018, 38, 56–60. [Google Scholar]
  13. Li, B.B.; Wang, Z.H.; Ren, C.H.; Zhang, Y.; Xu, J.; Li, J.H. Mechanical properties and damage constitutive model of coal under the coupled hydro-mechanical effect. Rock Soil Mech. 2021, 42, 315–323. [Google Scholar]
  14. Ai, T.; Wu, S.Y.; Zhang, R.; Gao, M.Z. Changes in the structure and mechanical properties of a typical coal induced by water immersion. Int. J. Rock Mech. Min. Sci. 2021, 138, 104597. [Google Scholar] [CrossRef]
  15. Poulsen, B.A.; Shen, B.; Williams, D.J.; Huddlestone-Holmes, C.; Erarslan, N.; Qin, J. Strength reduction on saturation of coal and coal measures rocks with implications for coal pillar strength. Int. J. Rock Mech. Min. Sci. 2014, 71, 41–52. [Google Scholar] [CrossRef]
  16. Chen, G.Q.; LI, T.B.; GUO, F.; Wang, Y.K. Brittle mechanical characteristics of hard rock exposed to moisture. Bull. Eng. Geol. Environ. 2017, 76, 219–230. [Google Scholar] [CrossRef]
  17. Chen, T.; Yao, Q.L.; Wei, F.; Zhong, Z.H.; Zhou, J.; Wang, C.B.; Li, J. Effects of water intrusion and loading rate on mechanical properties of and crack propagation in coal–rock combinations. J. Cent. S. Univ. 2017, 24, 423–431. [Google Scholar] [CrossRef]
  18. Jiang, L.J.; Zhao, H.J.; Zhao, Y.Q.; Fang, J.; Cao, Z.G. Study on mechanical properties of coal before and after flooding considering bedding direction. Coal Sci. Technol. 2023, 51, 97–108. [Google Scholar]
  19. Yao, Q.L.; Wang, W.N.; Yang, S.Y.; Fang, J.; Zhou, B.Q. Direct shear and acoustic emission characteristics of sandy mudstone under the effect of moisture content. J. China Coal Soc. 2021, 46, 2910–2922. [Google Scholar]
  20. Xia, D.; Yang, T.H.; Xu, T.; Wang, P.T.; Zhao, Y.C. Experimental study on AE properties during the damage process of water-saturated rock specimens based on time effect. J. China Coal Soc. 2015, 40, 337–345. [Google Scholar]
  21. Ma, S.W.; Liang, H.; Cao, C. Laboratory study of deformational characteristics and acoustic emission properties of coal with different strengths under uniaxial compression. Minerals 2021, 11, 1070. [Google Scholar] [CrossRef]
  22. Gao, L.; Zhang, W.R.; Lu, W.; Hu, X.M.; Wu, H.; Wang, J.Q.; Kong, B. Study on the effects of temperature and immersion on the acoustic emission and electromagnetic radiation signals of coal rock damage under load. Eng. Geol. 2022, 297, 106503. [Google Scholar] [CrossRef]
  23. Yao, Q.L.; Wang, W.N.; Zhu, L.; Xia, Z.; Tang, C.J.; Wang, X.H. Effects of moisture conditions on mechanical properties and AE and IR characteristics in coal–rock combinations. Arab. J. Geosci. 2020, 13, 615–630. [Google Scholar] [CrossRef]
  24. Bai, J.W.; Du, X.J.; Feng, G.R.; Guo, J.; Li, Z.; Qi, T.Y.; Wang, P.F.; Wang, Z.H.; Yang, J. Dynamic mechanical behavior of dry and water saturated igneous rock with AE monitoring. Shock Vib. 2018, 4, 2348394. [Google Scholar]
  25. National Development and Reform Commission, National Energy Administration. Mine Water Utilization Development Planning; National Development and Reform Commission: Beijing, China, 2013; pp. 3–45.
  26. Wu, Q.; Shen, J.J.; Wang, Y. Mining techniques and engineering application for “Coal-Water” dual-resources mine. J. China Coal Soc. 2017, 42, 8–16. [Google Scholar]
  27. International Society for Rock Mechanics Commission on Standardization of Laboratory and Field Tests. Suggested methods for the quantitative description of discontinuities in rock masses. Int. J. Rock Mech. Min. Sci. Geomech. Abstr. 1978, 15, 319–368. [Google Scholar]
  28. Galouei, M.; Fakhimi, A. Size effect material ductility and shape of fracture process zone in quasi-brittle materials. Comput. Geotech. 2015, 65, 126–135. [Google Scholar] [CrossRef]
  29. Liu, Q.; Xu, J.; Liu, X.; Jiang, J.; Liu, B. The role of flaws on crack growth in rock-like material assessed by AE technique. Int. J. Fract. 2015, 193, 99–115. [Google Scholar] [CrossRef]
  30. Gu, D.Z.; Yan, Y.G.; Zhang, Y.; Wang, E.Z.; Cao, Z.G. Experimental study and numerical simulation for dynamic response of coal pillars in coal mine underground reservoir. J. China Coal Soc. 2016, 41, 1589–1597. [Google Scholar]
  31. Yang, P. Study on Strength Damage Mechanism of Coal Pillar Dam in Coal Mine Groundwater Reservoir. Ph.D. Thesis, China University of Mining and Technology, Xuzhou, China, 2019. [Google Scholar]
  32. Wang, P.T.; Qi, Z.W.; Ma, C.; Cai, M.F. Anisotropic behavior of the seepage-stress coupling mechanical model of coal pillars of underground reservoirs. Geomech. Geophys. Geo-Energy Geo-Resour. 2023, 9, 3. [Google Scholar] [CrossRef]
  33. Eberhardt, E.; Stimpson, B.; Stead, D. Effects of grain size on the initiation and propagation thresholds of stress-induced brittle fractures. Rock Mech. Rock Eng. 1999, 32, 81–99. [Google Scholar] [CrossRef]
Figure 1. The experimental specimen (a) The coal specimen and (b) the microstructure.
Applsci 15 06700 g001
Figure 2. The MTS 815 mechanical test equipment for rock.
Applsci 15 06700 g002
Figure 3. Natural water absorption rate of absorbed coal rock.
Applsci 15 06700 g003
Figure 4. The stress–strain curve of the coal specimen at stages I–IV.
Applsci 15 06700 g004
Figure 5. Secant modulus of coal during compression.
Applsci 15 06700 g005
Figure 6. The relationship of the compressive strength, peak strain, elastic modulus, and natural water absorption rate.
Applsci 15 06700 g006
Figure 7. Failure patterns of long coal samples with different immersion durations (I: stage I; II: stage II).
Applsci 15 06700 g007
Figure 8. Characteristics of energy and accumulated AE counts of natural coal samples at stage I–IV (0 d).
Applsci 15 06700 g008
Figure 9. Characteristics of coal sample energy and accumulated AE counts under water immersion.
Applsci 15 06700 g009
Figure 10. (a) 1d; (b) 3d; (c) 5d; (d) 7d. Axial strain of long coal samples under different immersion durations.
Applsci 15 06700 g010
Figure 11. Schematic of underground reservoir [30,31,32].
Applsci 15 06700 g011
Figure 12. (a) The model scale and conditions; (b) meshing of the model.
Applsci 15 06700 g012
Figure 13. (a) Immersion 0 d; (b) Immersion 20 d; (c) Immersion 40 d; (d) Immersion 60 d; (e) Immersion 80 d; (f) Immersion 100 d. Fracture behavior of underground pillars under different immersion durations.
Applsci 15 06700 g013
Table 1. The parameters of the coal specimens.
Time (d)Size
(mm × mm)
Mass Before Immersion (g)Mass After Immersion (g)Water Ratio (%)Before
Vp (km/s)
After
Vp (km/s)
050.06 × 100.10323.90323.9002.12/
150.02 × 100.00325.70329.100.892.342.45
350.06 × 100.00323.60327.601.612.242.48
550.00 × 100.04321.40326.301.312.192.50
750.02 × 100.04325.40330.801.662.182.41
1050.11 × 10.10321.5326.61.592.222.43
1550.10 × 100.30317.4322.91.732.192.45
2050.00 × 100.34325331.21.912.172.38
2550.21 × 100.18327.4333.81.952.272.45
3050.00 × 100.28325.1331.51.972.272.32
Table 2. Physical and mechanical parameters of rock used in calculations [32].
Rock
Type
Thickness
/m
Density
/kg·m−3
Elastic Modulus/GPaPoisson’s RatioCohesion
/MPa
Friction/°Tensile Strength/MPaCompressive Strength/MPa
Aeolian sand2016000.280.30.5320.417.2
Sandstone80233015.1–29.500.2–0.346–1323–351.4–4.7536–48
5−2 coal seam313204.89–9.300.2–0.340.5–8.812–380.25–1.3613–18
Sandstone10~60238015.1–29.500.2–0.346–1323–351.4–4.7536–48
Floor sandstone20243038.00.203.2382.536.5
Disclaimer/Publisher’s Note: The statements, opinions and data contained in all publications are solely those of the individual author(s) and contributor(s) and not of MDPI and/or the editor(s). MDPI and/or the editor(s) disclaim responsibility for any injury to people or property resulting from any ideas, methods, instructions or products referred to in the content.

