Article

Experimental Investigation of Lateral Stresses and Bearing Capacity of Sandy Soil Under Shallow Foundation Loads

by
Huseyin Suha Aksoy
1 and
Damla Küçükay Kayaalp
2,3,*
1
Department of Civil Engineering, Engineering Faculty, Firat University, Elazig 23100, Turkey
2
Department of Civil Engineering, Engineering Faculty, Van Yuzuncu Yil University, Van 65090, Turkey
3
Graduate School of Natural and Applied Sciences, Firat University, Elazig 23100, Turkey
*
Author to whom correspondence should be addressed.
Appl. Sci. 2025, 15(12), 6699; https://doi.org/10.3390/app15126699 (registering DOI)
Submission received: 7 May 2025 / Revised: 31 May 2025 / Accepted: 6 June 2025 / Published: 14 June 2025

Abstract

:
While existing analytical methods provide solutions for calculating vertical pressures in soil, calculating lateral stresses remains a critical challenge. Therefore, experimentally measuring stress values is essential, considering the various factors influencing these stresses. This study investigates the lateral stress variations occurring beneath foundations placed on sandy soil and assesses the ultimate bearing capacity and settlement behavior of these foundations. Additional lateral stresses were measured beneath square shallow foundations on the sand with varying relative densities. The model tests were conducted in a square-sectioned sand tank. The results revealed that the lateral stress values tended to increase with both the foundation size and soil density, with this effect being most pronounced at a relative density of 90%. Furthermore, the lateral stresses decreased with increasing depth beneath the foundation for all foundation sizes. Loading tests were performed on square foundations of various sizes placed on sand prepared at different relative densities. A significant increase in the ultimate bearing capacity was noted as the foundation size and relative density of the soil increased. The measured lateral stresses were compared with theoretical predictions, and it was found that the values derived from the theoretical equations aligned well with the experimental results. In the second part of the study, a regression analysis was conducted to predict the lateral stresses within the soil. It was concluded that lateral stresses can be estimated with a high degree of accuracy using the proposed regression model (R2 = 0.982).

1. Introduction

Foundations are building elements that enable the safe transfer of structural loads to the soil. Due to the existing weight of the structure and soil, stresses occur in the soil mass. These stresses, caused by structural loads in the soil, are not constant and depend on depth. Understanding the stress distribution in soil masses is essential for resolving many soil mechanics issues. The estimation of lateral stress increases with an increase in vertical stress in the soil, which is necessary for the design and stability analysis of retaining walls, sheet piles, grain storage silos, and underground structures [1]. Many studies have emphasized the importance of lateral stress in the geotechnical design of such structures [2]. Design solutions may become unfeasible if lateral stresses are not considered [3]. The magnitude and distribution of lateral stresses are greatly influenced by parameters such as the internal friction angle, frictional resistance between the embankment and retaining wall, relative soil density, stress history, and direction of retaining wall movement [4,5,6]. Considering that the soil is a homogeneous, isotropic, and semi-infinite medium, the vertical stress increases in the soil mass were determined using elastic solutions. Laboratory test methods have been developed to examine stress changes in field conditions and the parameters that affect stress. The primary purpose of these test methods is to accurately predict the mechanical behavior of samples under field conditions in a laboratory environment [7]. Experimental studies have been conducted to investigate the effects of parameters such as soil type, relative soil density, pore water pressure, and soil stress history on the coefficient of earth pressure at rest (K0) [8,9,10,11,12,13,14,15,16,17].
To understand the earth’s pressure at rest, he analyzed laboratory test data on more than 170 different soil types and developed empirical relationships that are valid for various soil types, particularly clay, silt, and sand [17]. It was stated that the K0 value for these soils can be estimated only by using the internal friction angle (φ’). The K0-internal friction relationship obtained as a result of this study was similar to the formulation proposed by Jaky in 1948 [9].
Therefore, it is necessary to determine the lateral stress variations caused by changes in soil properties. Lateral stresses occurring at different relative densities and depths under a square foundation have been investigated experimentally [18]. It has been determined that increases in lateral stresses do not change at the same rate as increases in vertical stresses and that lateral stresses change with changes in parameters such as the relative density and depth of sand. It is known that the bearing capacity and stresses may change depending on the degree of compaction of the soil [19,20,21].
Researchers have investigated the stresses occurring under square foundations resting on sand. Keskin et al. [22] investigated the vertical stress changes under the square foundation. In these experiments, sand was placed using the dynamic compression method at a relative density of 65 %. The vertical stresses formed at different depths under the foundation were measured using pressure transducers. The stresses under the foundation decreased with increasing depth [23]. The well-known K0 equation proposed by Jaky 1948 [9] is widely adopted to determine the K0 values for the internal friction angle. The simplified form used in current engineering practice is as follows:
K0 = (1 − sinφ)
The validity of Equation (1) has been experimentally investigated and analyzed using various methods [17,24]. Lateral stress is a critical design factor [25]. For this purpose, a centrifuge model test was used to examine the K0 values of sand soils with varying relative densities. Sand samples with varying relative densities were prepared using the sand pluviation method, and a centrifugal force of 50 g-ton was applied. Then, the relationship between K0 and Dr was examined for soils with different relative densities. The test results showed that the K0 value for the same sand type increased gradually with relative density. According to the research results, the existing earth pressure theories can be improved significantly [24].
Lee et al. [26] investigated the K0 values experimentally using different granular materials. The relationship between the K0 values of the materials and their strength was investigated by considering different stress conditions. A high relative density resulted in lower K0 values. Luo et al. [25], in the model experimental system of 800 × 800 × 800 mm3, shallow foundations in square and circular geometries were loaded on coral sand. This study focused on the effects of relative density, foundation size, particle shape, and particle crushing on foundation performance. Intense crushing and occlusions were observed immediately below the foundation base. The results of the experimental and numerical studies showed that the ultimate bearing capacity increased significantly with increasing relative density and foundation size.
Evaluating the literature, it became clear that very few studies have been conducted on determining the lateral stresses formed in the soil mass. However, most studies have been based on modeling lateral deformations using numerical methods. It has been observed that lateral deformations are measured in almost all studies [27,28,29,30,31]. Very few studies have measured the lateral pressures formed in soil masses.

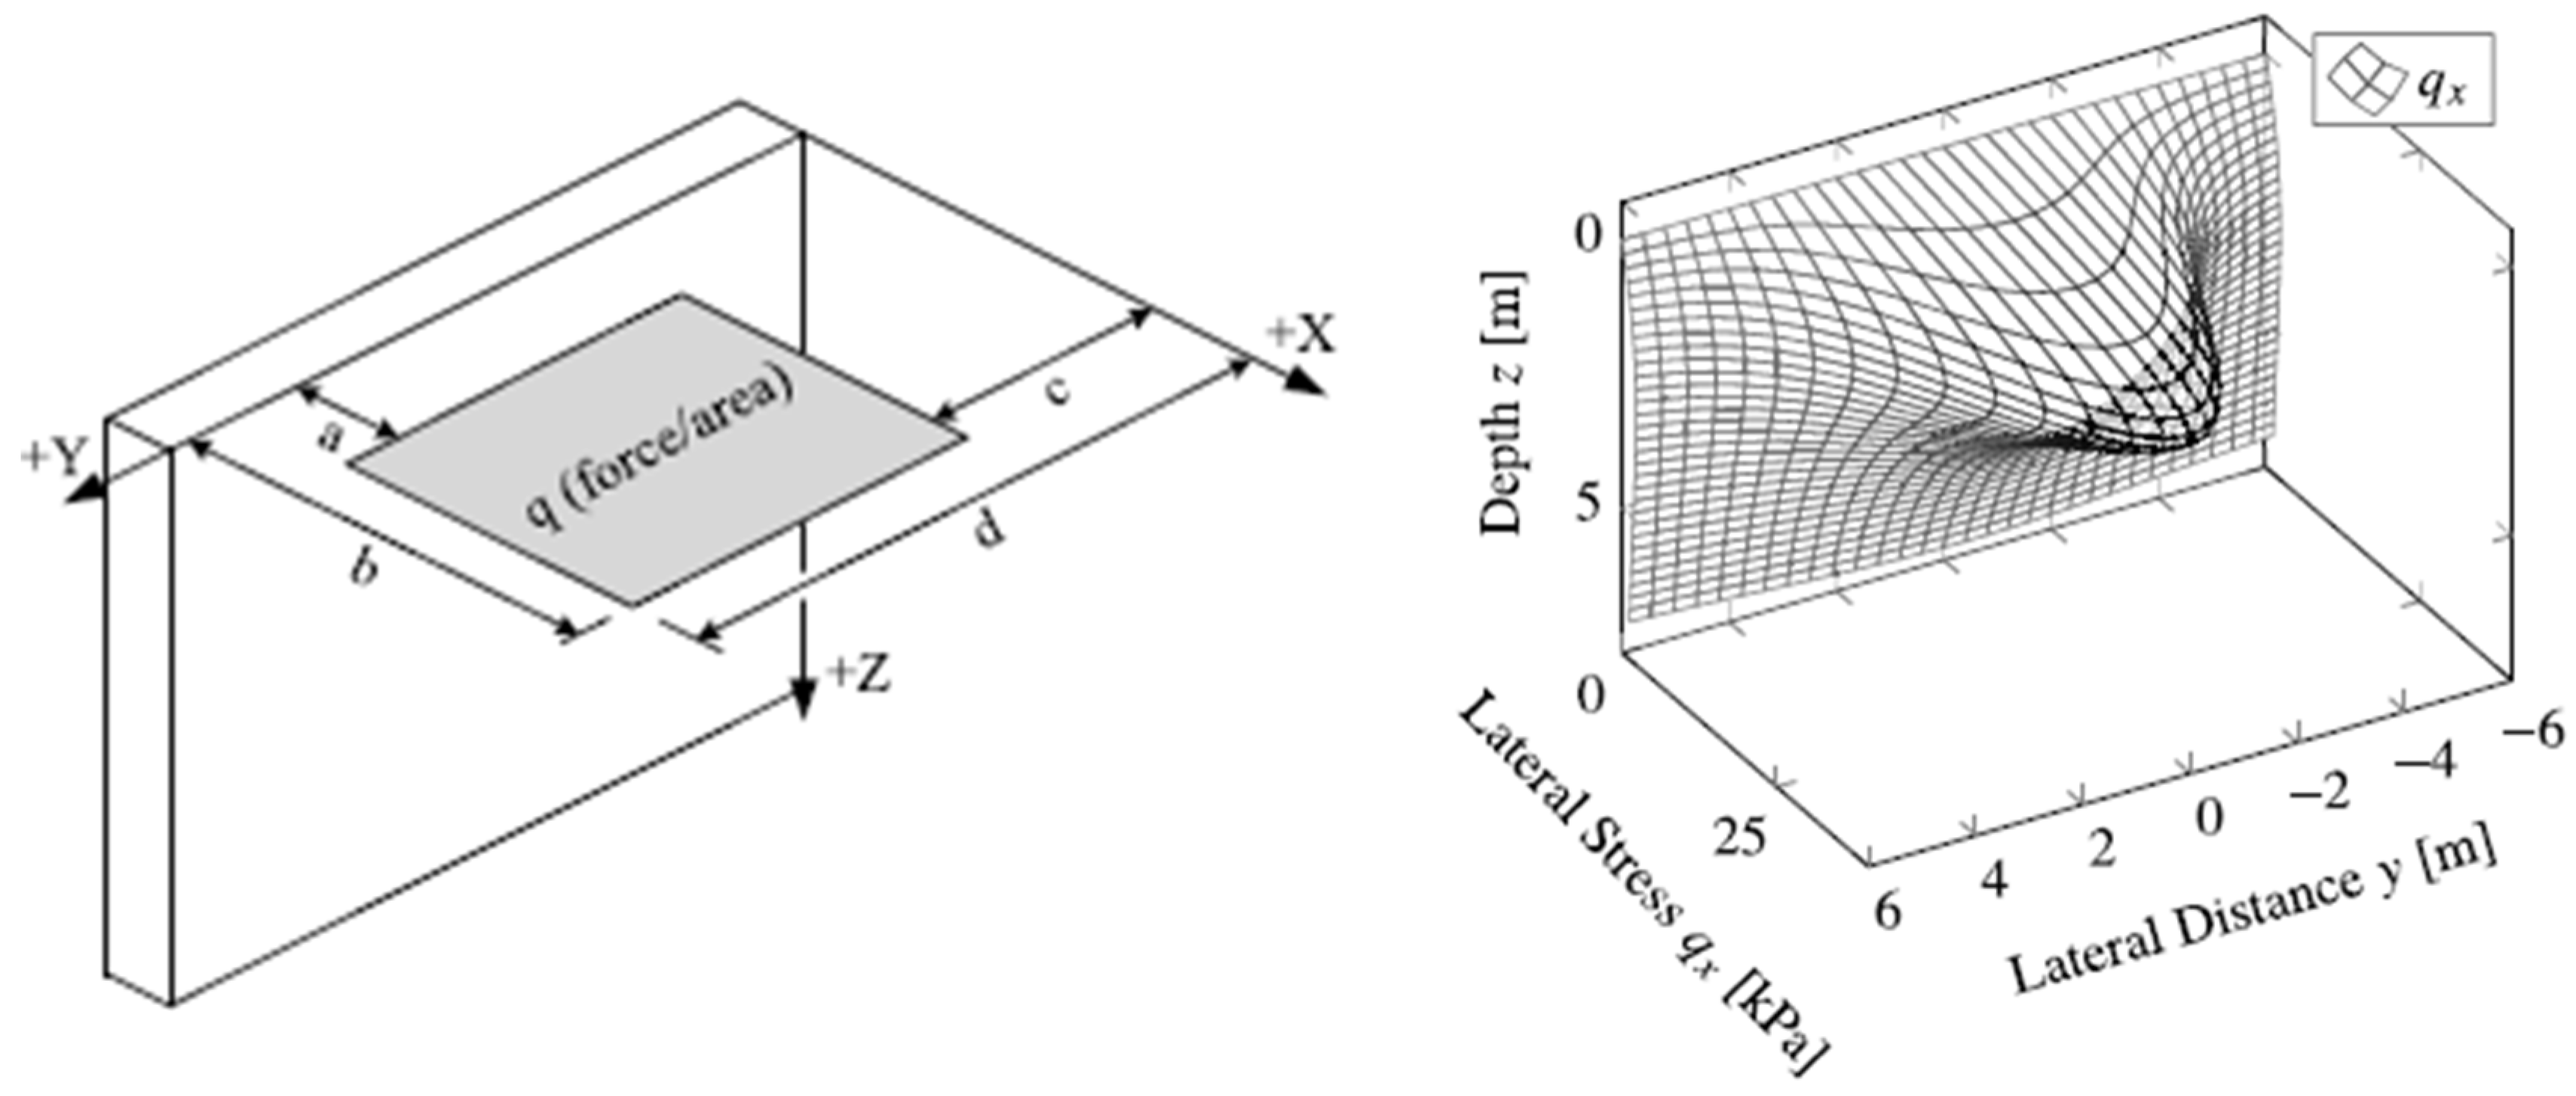
1.1. Lateral Stress Theories in Literature

The accurate determination of stress distribution in soils is of great importance in geotechnical engineering in terms of foundation design, stability of soil structures, and safety of underground structures. The widely used Boussinesq theory can only calculate the vertical stress distribution in isotropic and homogeneous soils within the framework of elasticity theory [32]. This theory, solved the problem of stress distribution in an elastic, isotropic, infinite half-space by taking into account a point load on its planar surface. However, since this theory is based on certain assumptions, it may not always accurately reflect the actual soil conditions (such as soil type, relative density, internal friction angle, cohesion, and void ratio). Although the Boussinesq theory is an essential tool in soil mechanics, it may not be sufficient in all cases due to the complexity of real soil conditions. In particular, in cases such as elastoplastic behavior, layered soil structure, and stress increases in the soil, more accurate analyses should be conducted through alternative empirical studies. Since then, numerous studies have been conducted to investigate the applicability of the Boussinesq theory in determining the stress distribution in soils resulting from surface loading or foundation pressures [33,34,35,36,37,38,39]. It has been realized that the soil, being a non-elastic and anisotropic material, does not behave as perfectly as the Boussinesq theory assumes; therefore, experimentalists have proposed several modifications to the basic formulations [36,37,38,40].
Certain formulations are available in the literature for estimating stress in soil mechanics, particularly for infinite loading. Poulos and Davis (1974) performed stress calculations under various loading and geometric conditions to determine the stress distributions in soil, particularly under surface and rigid loading [41]. These calculations were performed using the basic equations of elastic theory. The lateral stress distribution in the soil under a rectangular area with a uniform load applied to the surface;
σ x = 2 q π x 2 z x 2 + z 2 2
where q is the uniformly distributed load, z is the depth, and x is the distance parallel to the wall surface, as expressed in Equation (2). It should also be noted that finite-area loading solutions are available, but they have limitations. Newmark (1935) and Gray (1936) provided an equation and chart for calculating the vertical stresses under the corner of a finite rectangular area, from which extrapolation can be made to find the loading at any point under the rectangle, considering rectangular areas of different sizes [35,42]. However, these methods are time-consuming and are used to control vertical stress in the soil. The literature review also shows that Poisson’s ratio is generally assumed to be equal to 0.50 while developing formulations for lateral stress. As stated by AASHTO (2017) [43], Poisson’s ratio for soil can vary from about 0.25 (granular and hard cohesive soils) to 0.49 (soft cohesive soils); therefore, load reductions can be made if the soil properties are known. In appropriate cases, these lateral stress solutions can be represented by Poisson’s ratio of the soil considered in the formulations. For this purpose, a study was conducted that presented closed-form solutions for the stresses in the soil due to finite areas and loads [44]. In this analytical study, considering the three-dimensional Cartesian coordinate system, including finite line and finite area loads, the aim is to calculate the vertical and lateral stress values directly at any point. In this study, formulations are presented that calculate lateral stress estimates by considering the geometric dimensions and the effect of the soil’s Poisson ratio (Figure 1). The lateral stress calculations for a uniformly loaded finite area are presented in Equations (3) and (4). In this equation, ψ is the wall rigidity factor (1 for flexible walls and 2 for rigid walls), x, y, and z are the Cartesian coordinates (m), and q is the applied area load at the soil surface (kPa). However, since the properties of the soils are not taken into account (such as relative density and internal friction angle), it is known that similar results can be obtained for different soil types. However, when parameters other than the Poisson’s ratio change, it is inevitable to obtain different lateral stress values.
σ x y , z = ψ q 2 π f b , d f b , c f a , d + f ( a , c )
    f β , δ = t a n 1 β ( δ y ) z β 2 + ( δ y ) 2 + z 2 β z ( δ y ) ( β 2 + z 2 ) β 2 + ( δ y ) 2 + z 2
Analytical research was conducted, and an equation estimating the lateral stresses in the soil was presented. Giroud [45] calculated the settlement of a rectangular foundation with a linearly distributed load on a homogeneous soil. Then, the author determined the settlement of a heterogeneous soil and calculated the lateral increase in stress under a linearly distributed rectangular loaded area, taking into account the Poisson’s ratio (υ) of the soil.
σ x = P   ( K 2 1 2 υ K 2 )
In Equation (5), variables K 2   and K 2 ′, which depends on the size of the foundation and the depth of the soil, are used. The σ x   value is the lateral stress value occurring under a rectangular loaded foundation. P is the maximum load before the failure. One study stated that the soil pressure at rest is related to the relative density. It is observed that there are very few studies measuring lateral stresses, and almost all of these studies are aimed at determining the K0 value. However, vertical stresses are mainly determined in theoretical studies, and there are very few recognized studies on lateral stresses. In most studies investigating the lateral behavior of soil, lateral deformations are measured and modeled using numerical methods. Lateral stresses are crucial design parameters in many engineering projects, such as retaining walls, silos, and tunnel designs. Therefore, this study measured the lateral stresses occurring in sandy soils with different internal frictions. Furthermore, the experimental results obtained were compared with the results of Equation (5). Therefore, the section comparing the experimental and theoretical results contributes significantly to this literature. Then, nonlinear regression analysis was performed based on the experimental results and geometric parameters. An empirical equation that can be used to predict additional lateral stress increases was developed.
This study explored the impacts of relative density and foundation size on the bearing capacity, lateral stresses, and deformation behavior of rigid shallow foundations on sandy soil. Model experiments were used to determine the load-settlement relationships and lateral stress distributions that varied with depth. The theoretical calculation method was also used to assess the ultimate bearing capacity of the foundations. The results calculated using the equation presented by Giroud [45], one of the rare studies on this subject, were compared with the experimental lateral stress values. Classical elasticity theory-based relations, such as Boussinesq, can estimate the stress distribution in the subsoil in a general framework; however, they are limited in directly estimating lateral stresses. These theories mainly focus on the vertical stress distribution under vertical loading and calculate the horizontal stress values assuming an ideal elastic medium. Therefore, the use of these theories for lateral stress estimation may not provide sufficient accuracy, especially in cases where plastic deformations or changes in soil density need to be considered. In contrast, Jaky’s K0 theory is a valuable approach for estimating the lateral stress at rest before the soil is loaded. However, it does not account for stress changes that occur in active loading cases, such as foundation loading. As a result of the analytical and theoretical literature review, comparisons were made with the formulation presented by Frezaa [38], where the lateral stress estimation was calculated by considering the Poisson’s ratio of the soil and the geometric conditions. Giroud’s theory inspired this study because his formulation, which accounts for the soil’s internal friction angle and Poisson’s ratio, produces results that are more accurate. Therefore, it was considered that the study should be compared to Giroud’s theory.

1.2. Importance of the Study

An essential innovation of this study is that a simple equation can be used to estimate the variation in lateral stresses, depending on both the foundation size and soil relative density. As stated in the literature on lateral soil theories, the geomechanical properties of the soil were not taken into account in previous studies, and these studies proposed formulas that provided the same results for all soil types.
The model proposed in this study provides an integrated approach that can estimate lateral stress increases with high accuracy by evaluating multiple parameters, such as foundation dimensions, depth factors, geometric variables, and relative density. Compared to the relations based on elasticity theory, the results of the suggested formulation are more realistic because they are derived from experimental data.

2. Materials and Methods

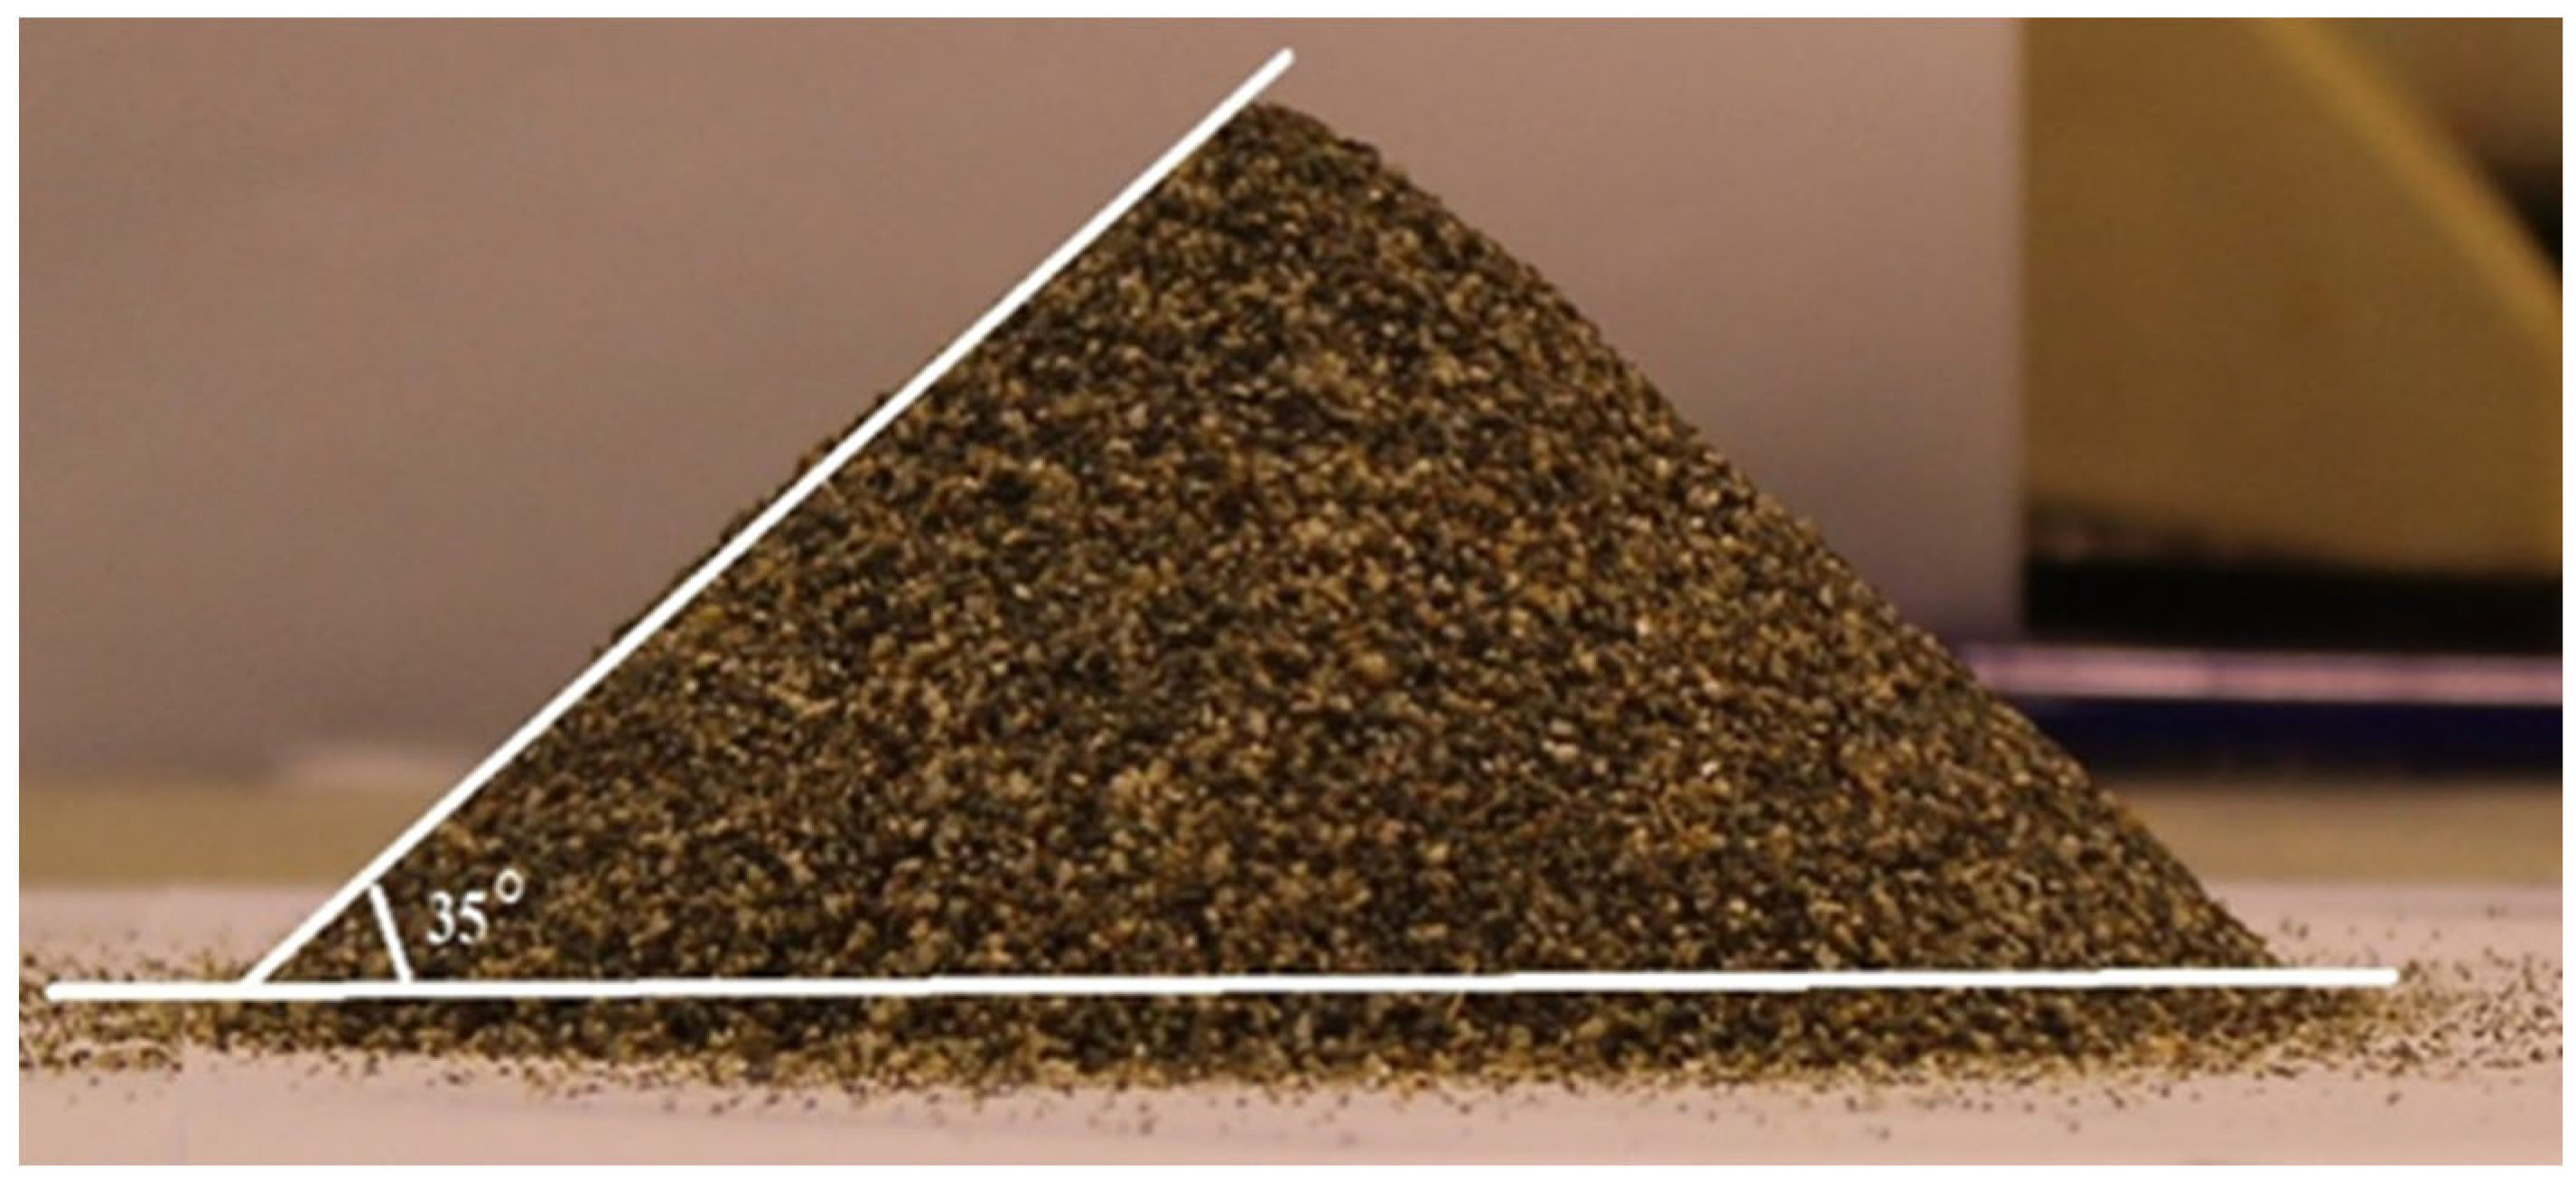
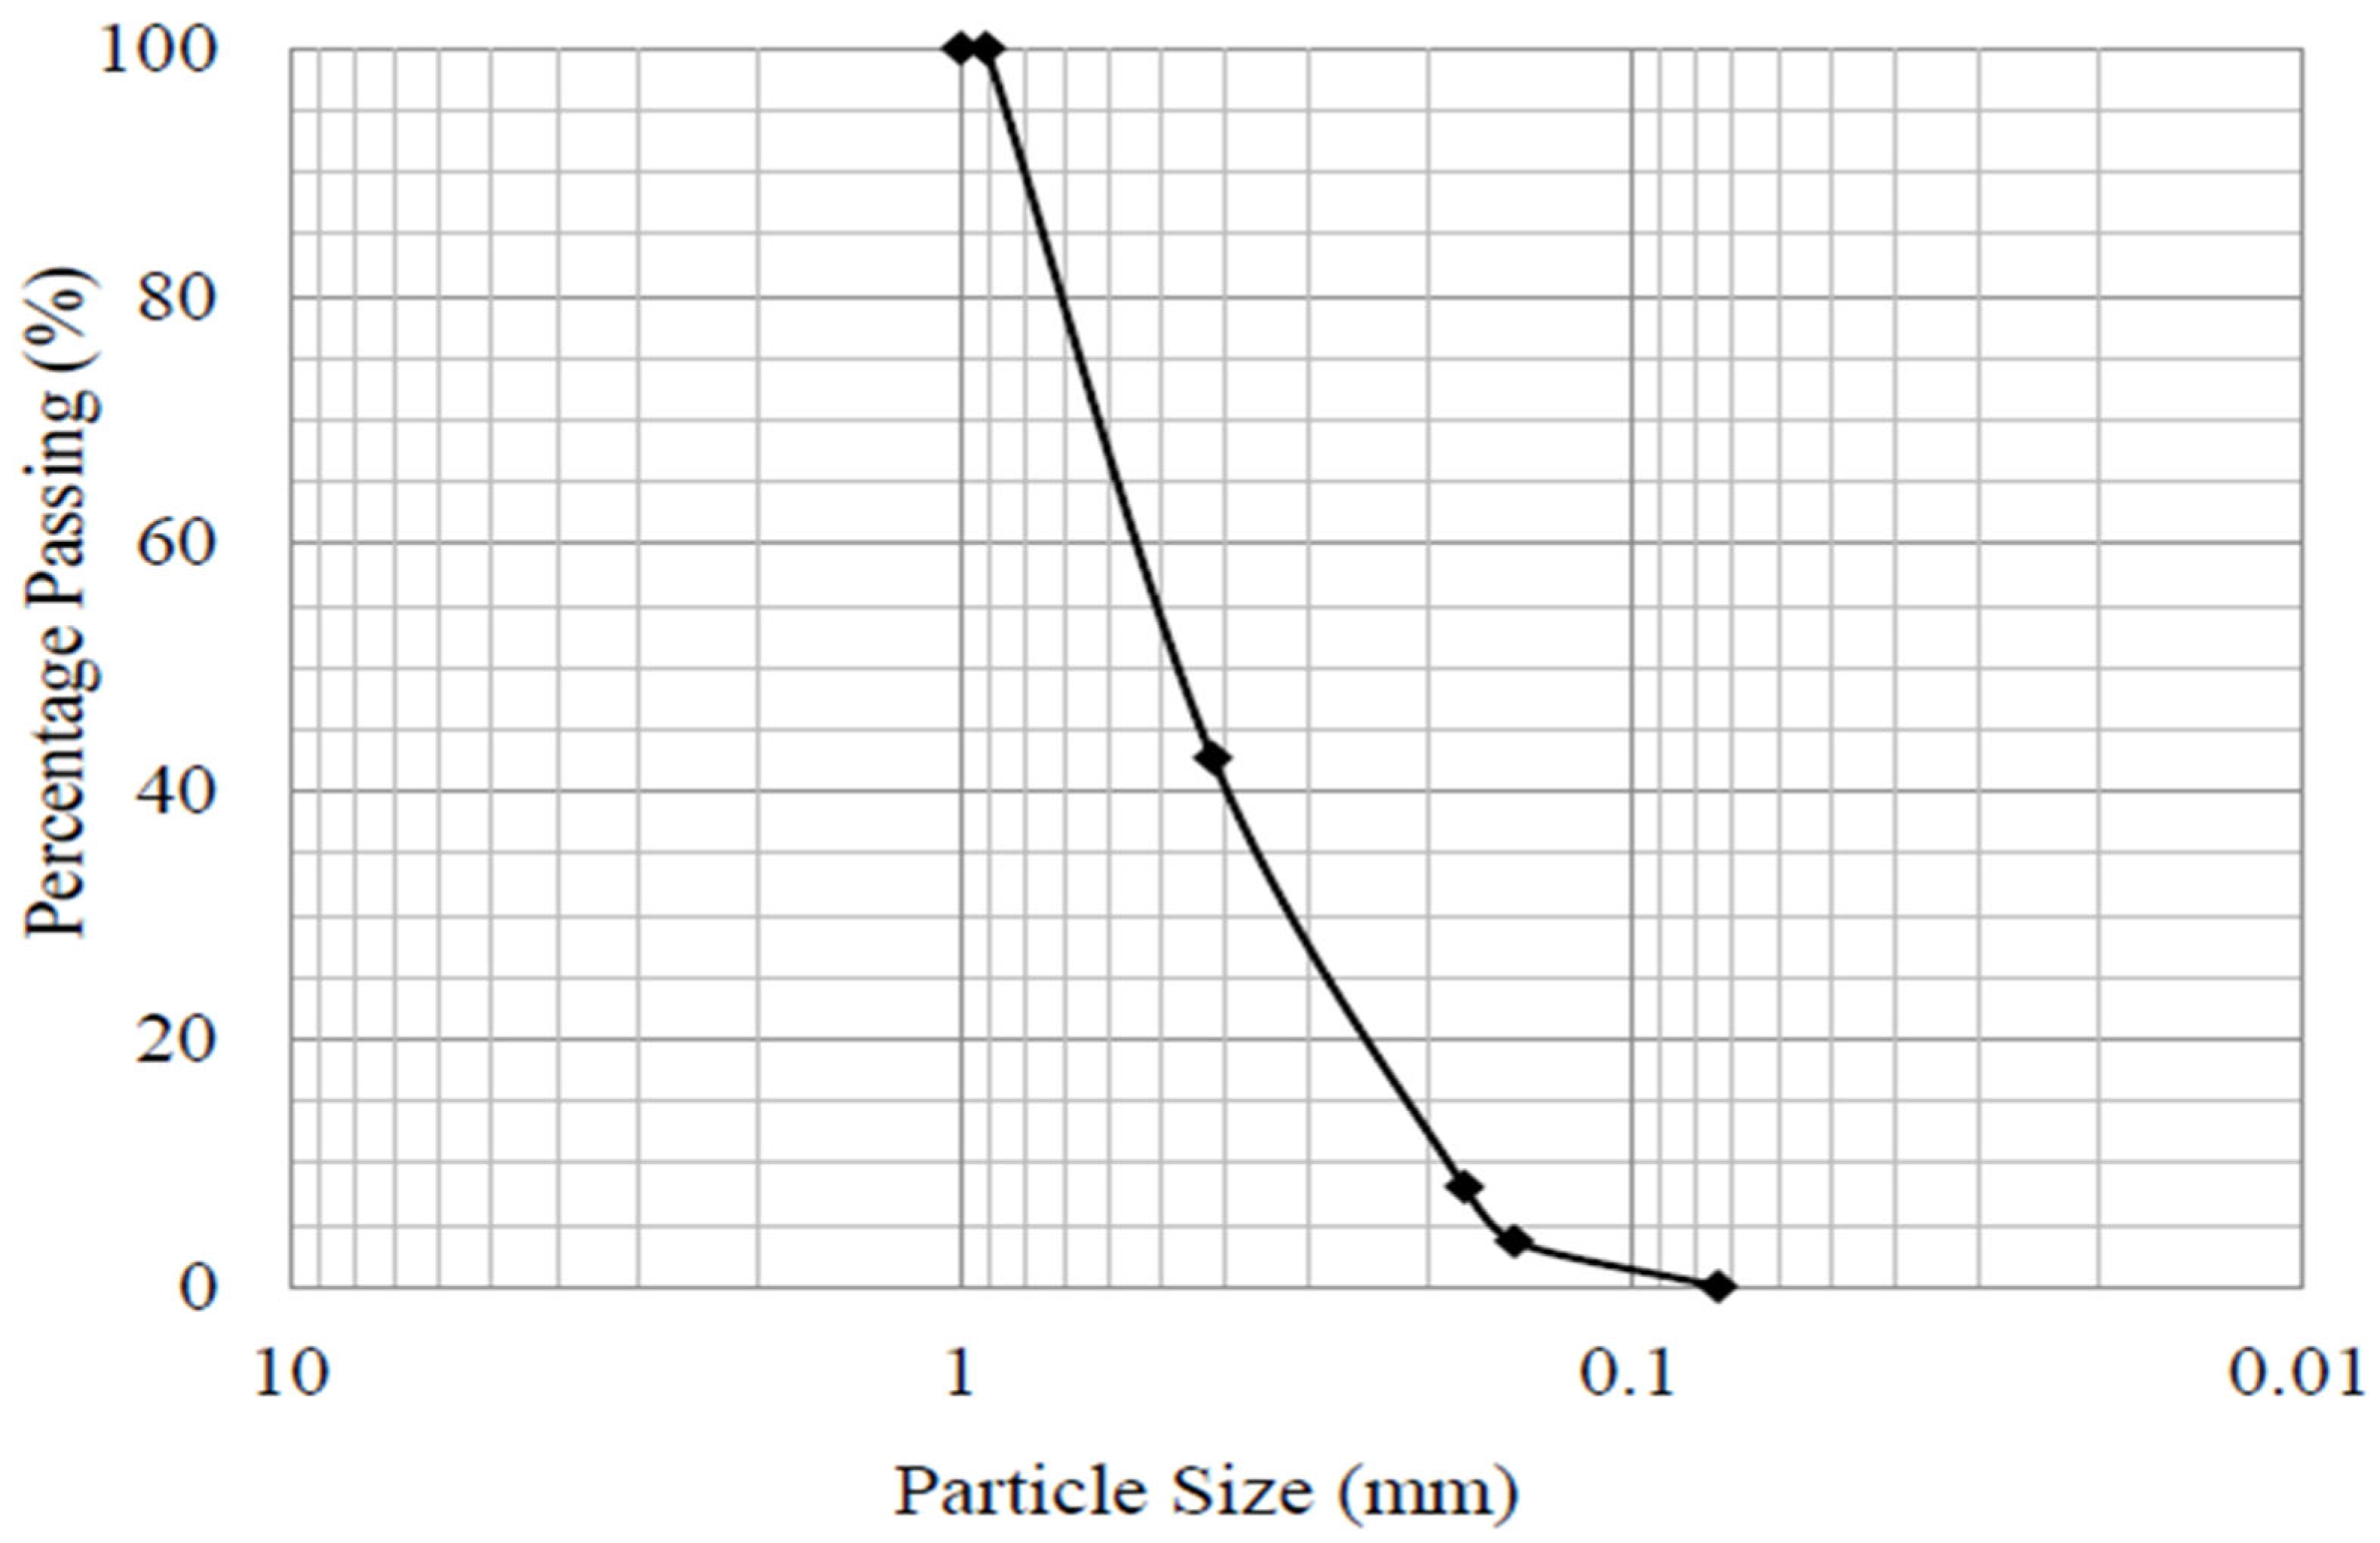
2.1. Properties of Test Sand

In this study, river sand with uniform gradation was used. After cleaning, the sand was oven-dried and sieved through a #18 (1 mm) sieve as applied in previous studies, then retained through a #200 (0.075 mm) sieve [46,47]. The geometry and color of the sand particles were examined by taking close-up photographs using a digital camera (Figure 2). The results showed that the sand particles were mostly dark colored and had angular to subangular shapes. According to the measurements made according to the ASTM-C1444-00 standard, the angle of the rest of the sand was determined to be 35°, as shown in Figure 3 [48]. In addition, the particle distribution curve of the test sand was obtained according to ASTM D422-63 [49] and is shown in Figure 4. The specific gravity of the sand was measured according to the ASTM D854-14 standard [50]. The maximum and minimum dry densities of the sand were determined experimentally in agreement with ASTM D4254 [51] (Table 1).

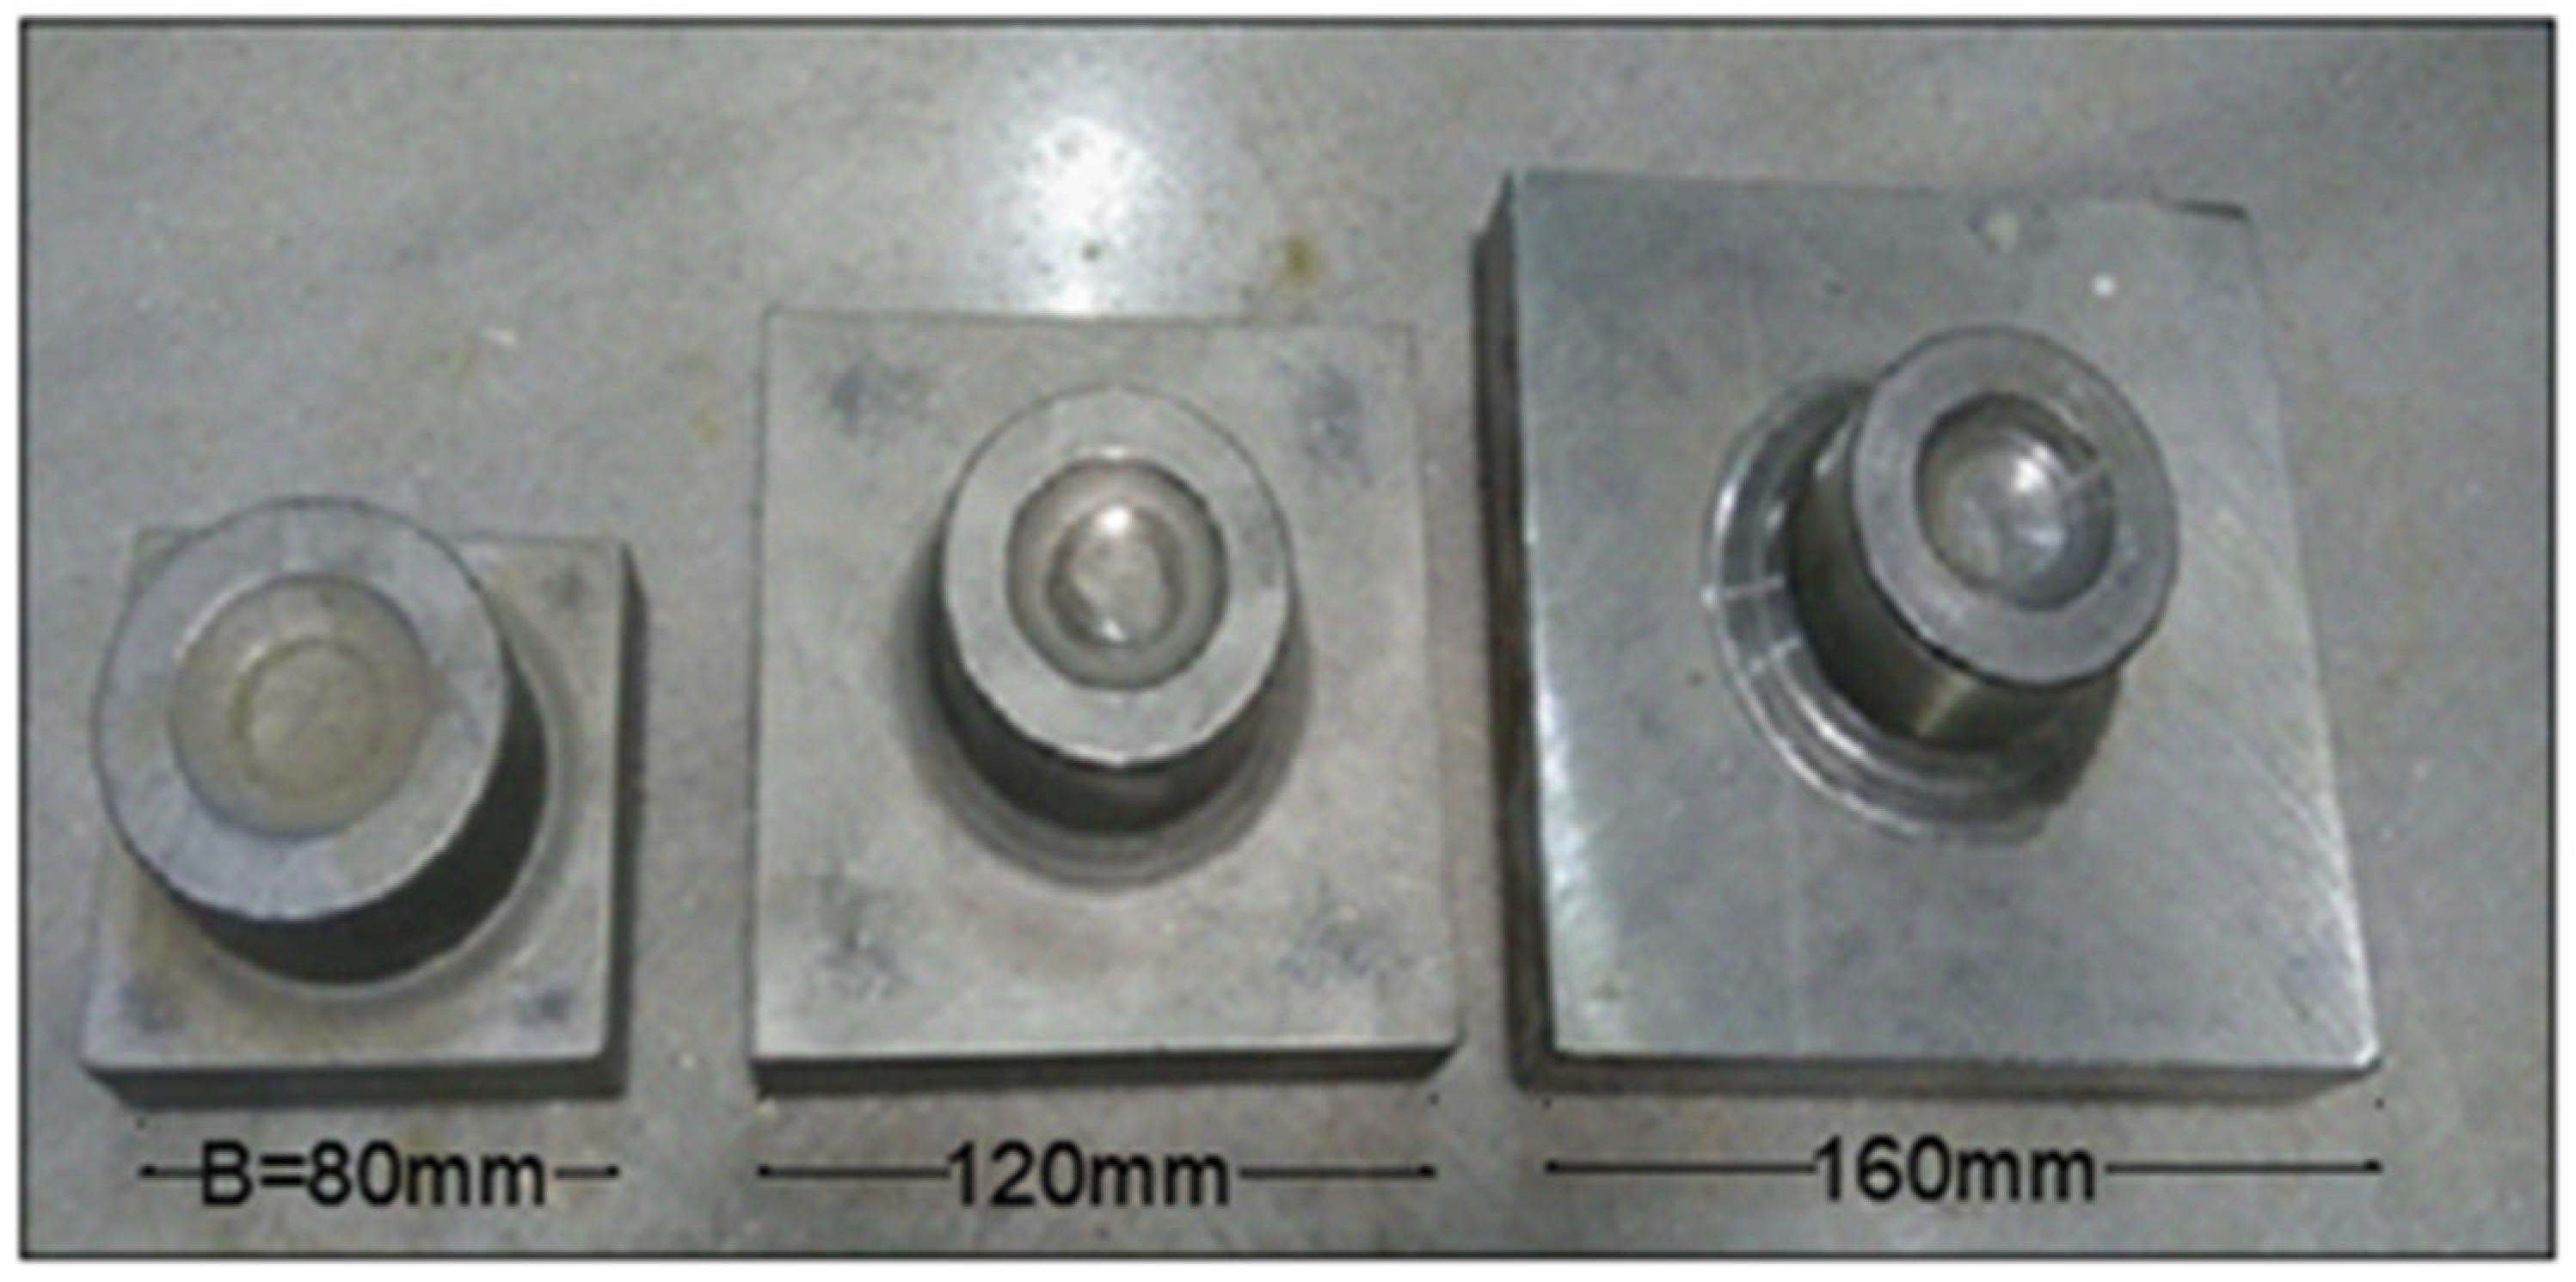
2.2. Model Shallow Foundations

The model foundation was made of St37 mild steel with dimensions B = B1 = 80 mm, B2 = 1.5 B, and B3 = 2 B, as shown in Table 2, which shows the parameters of the test methodology. It is then galvanized to prevent corrosion. A spot for the loading shaft was created at the center of the foundation for the vertical loading tests. To ensure that the stresses applied to the soil were uniform, the model foundations were made with a thickness of 20 mm (Figure 5).

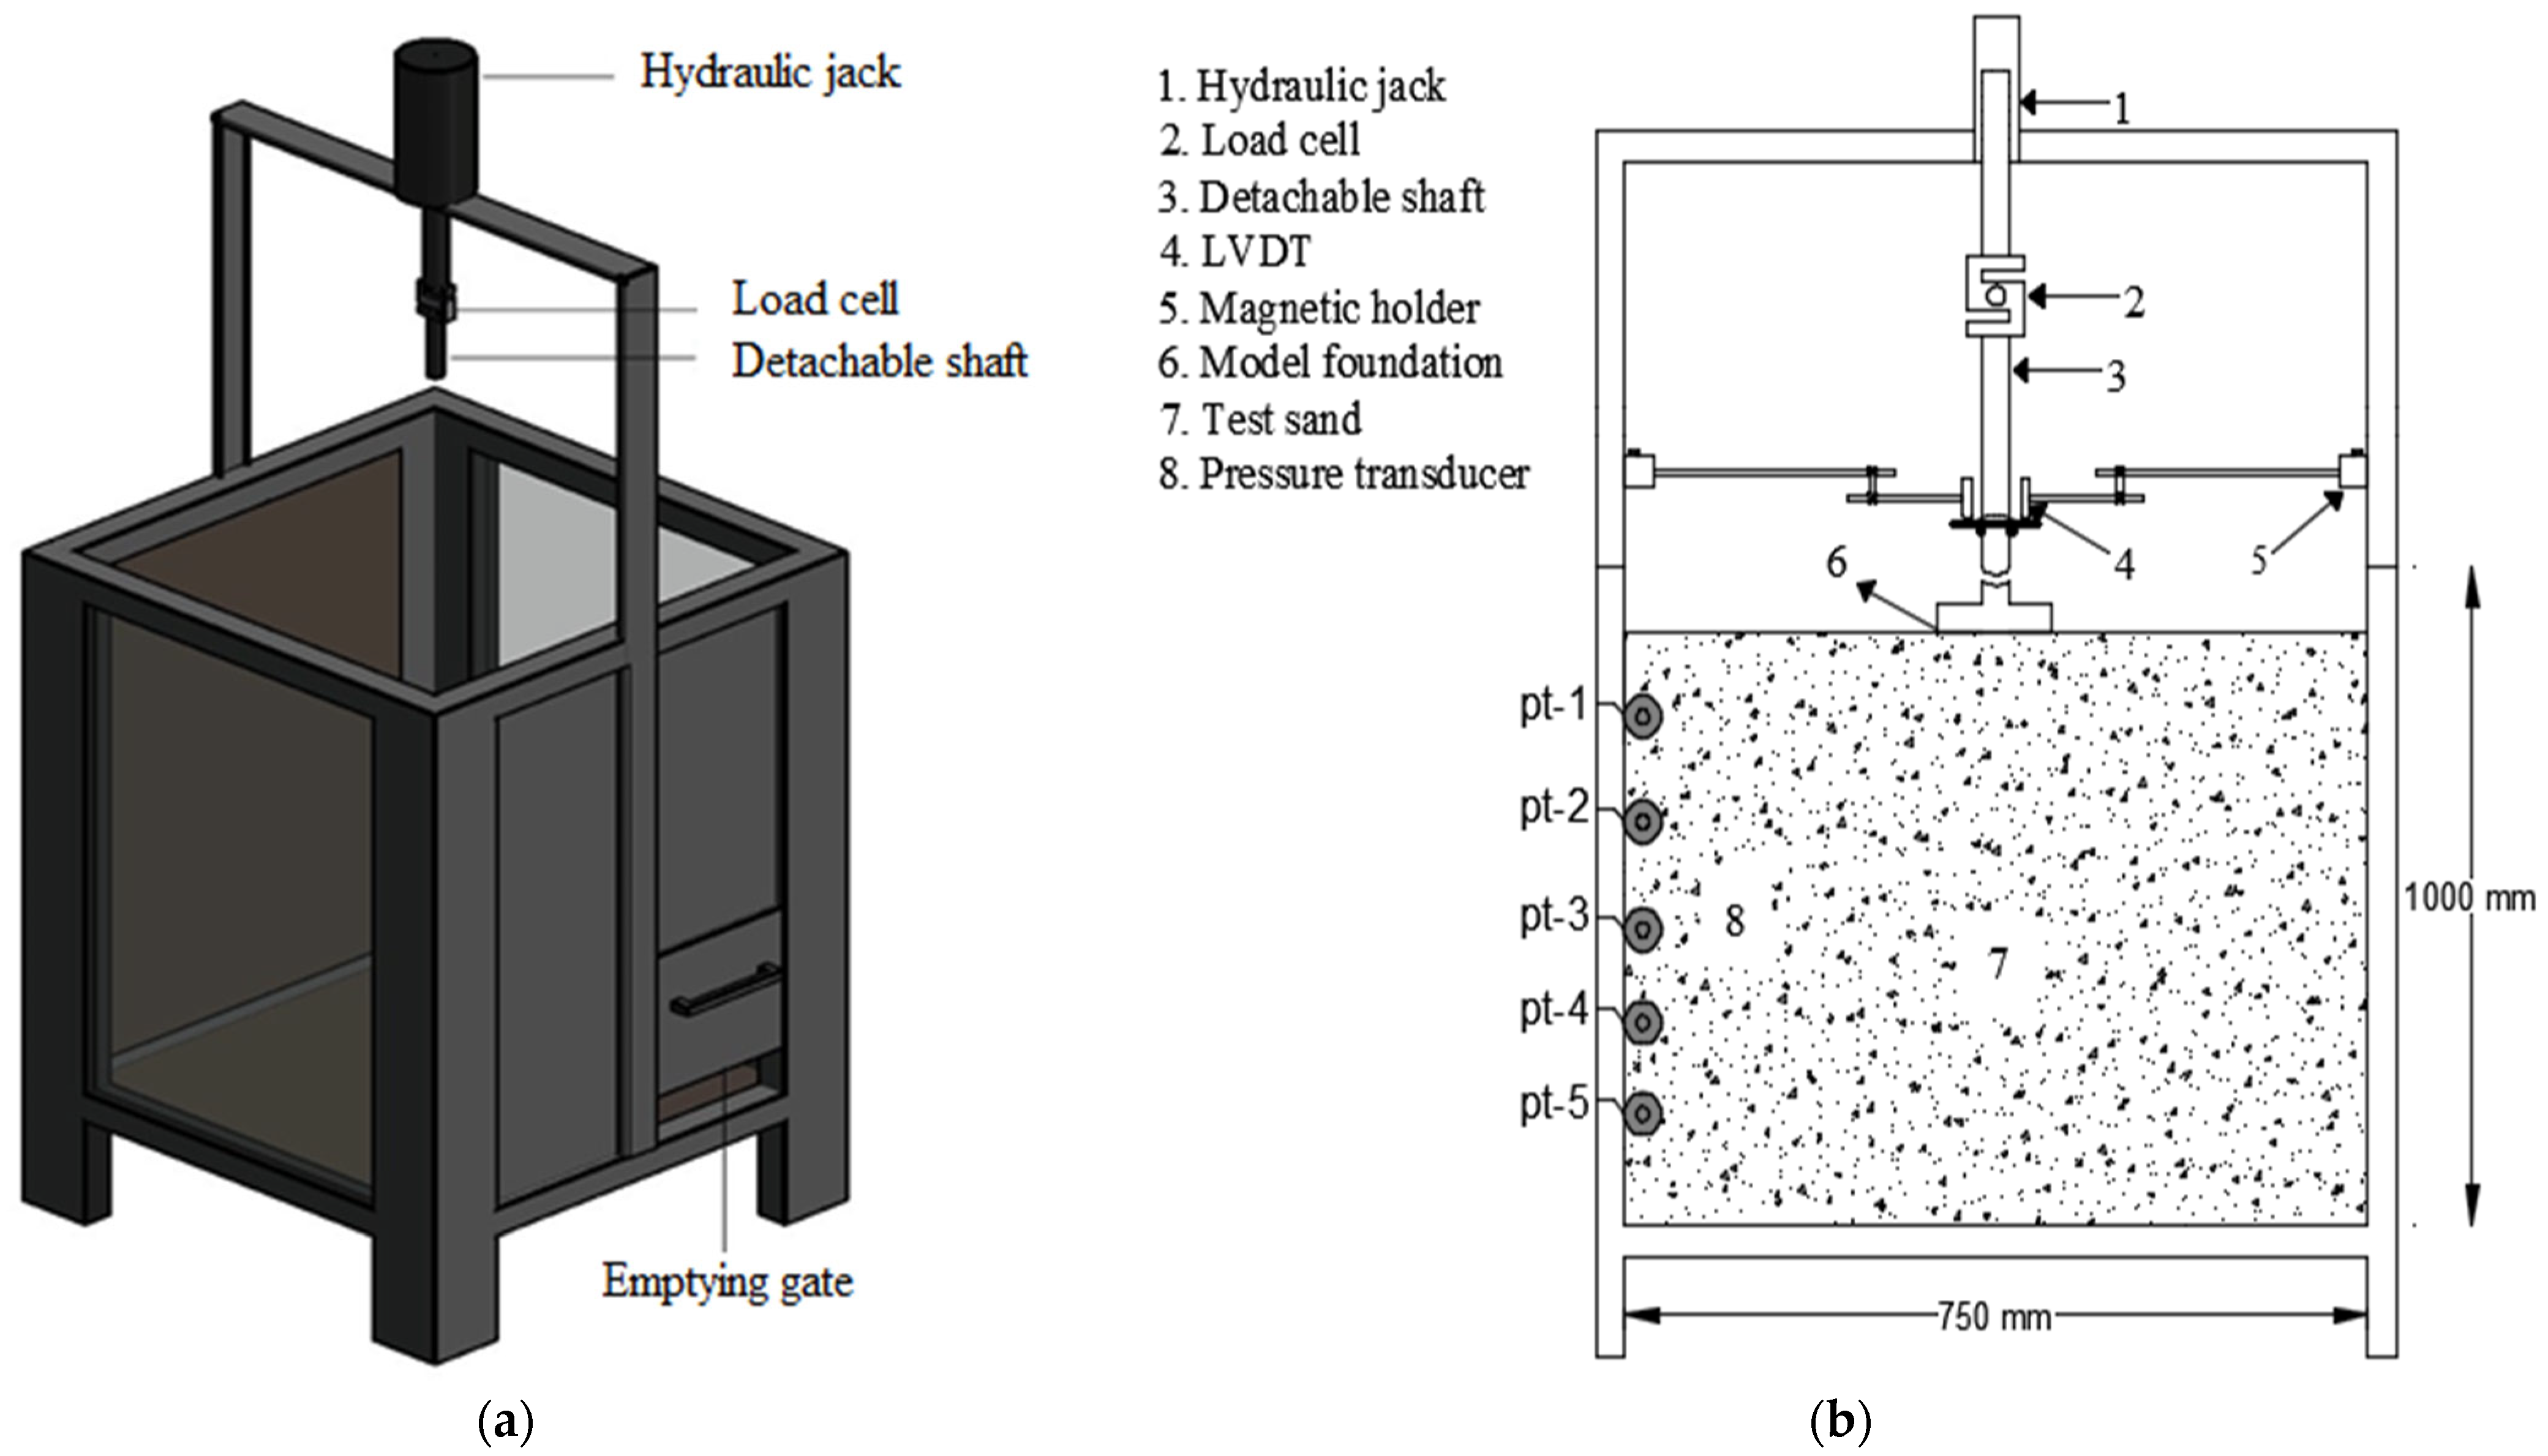
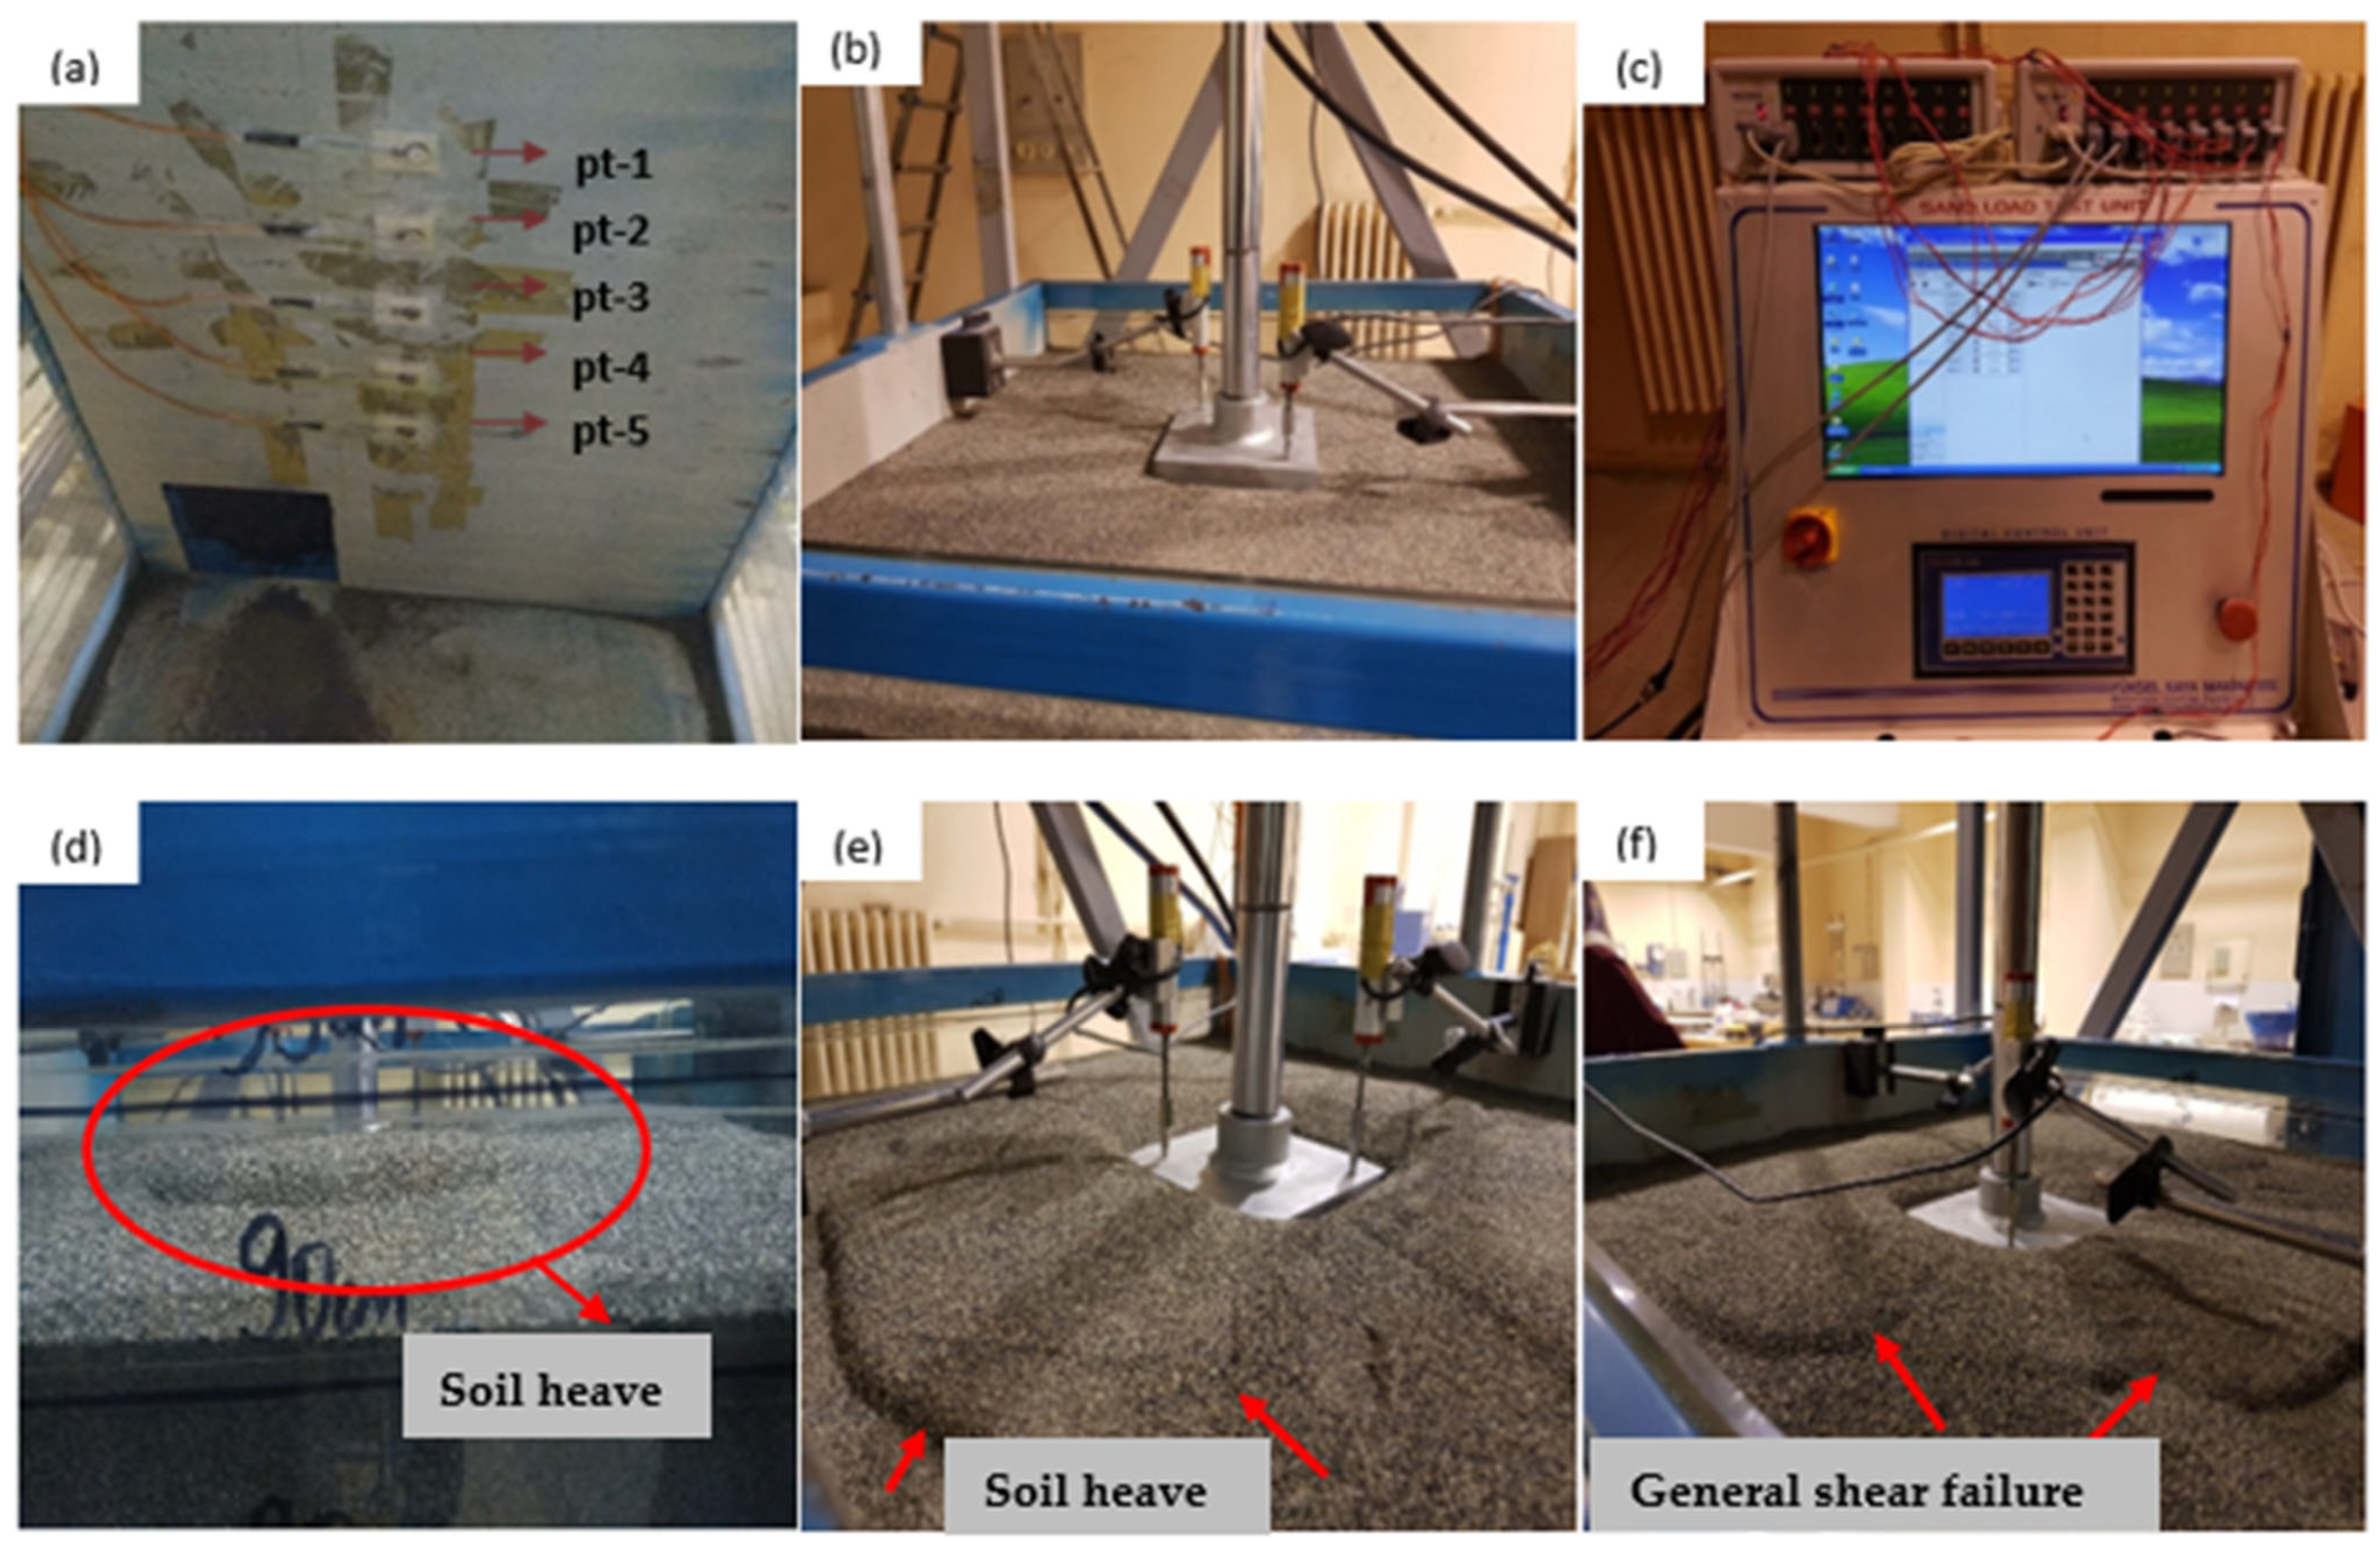
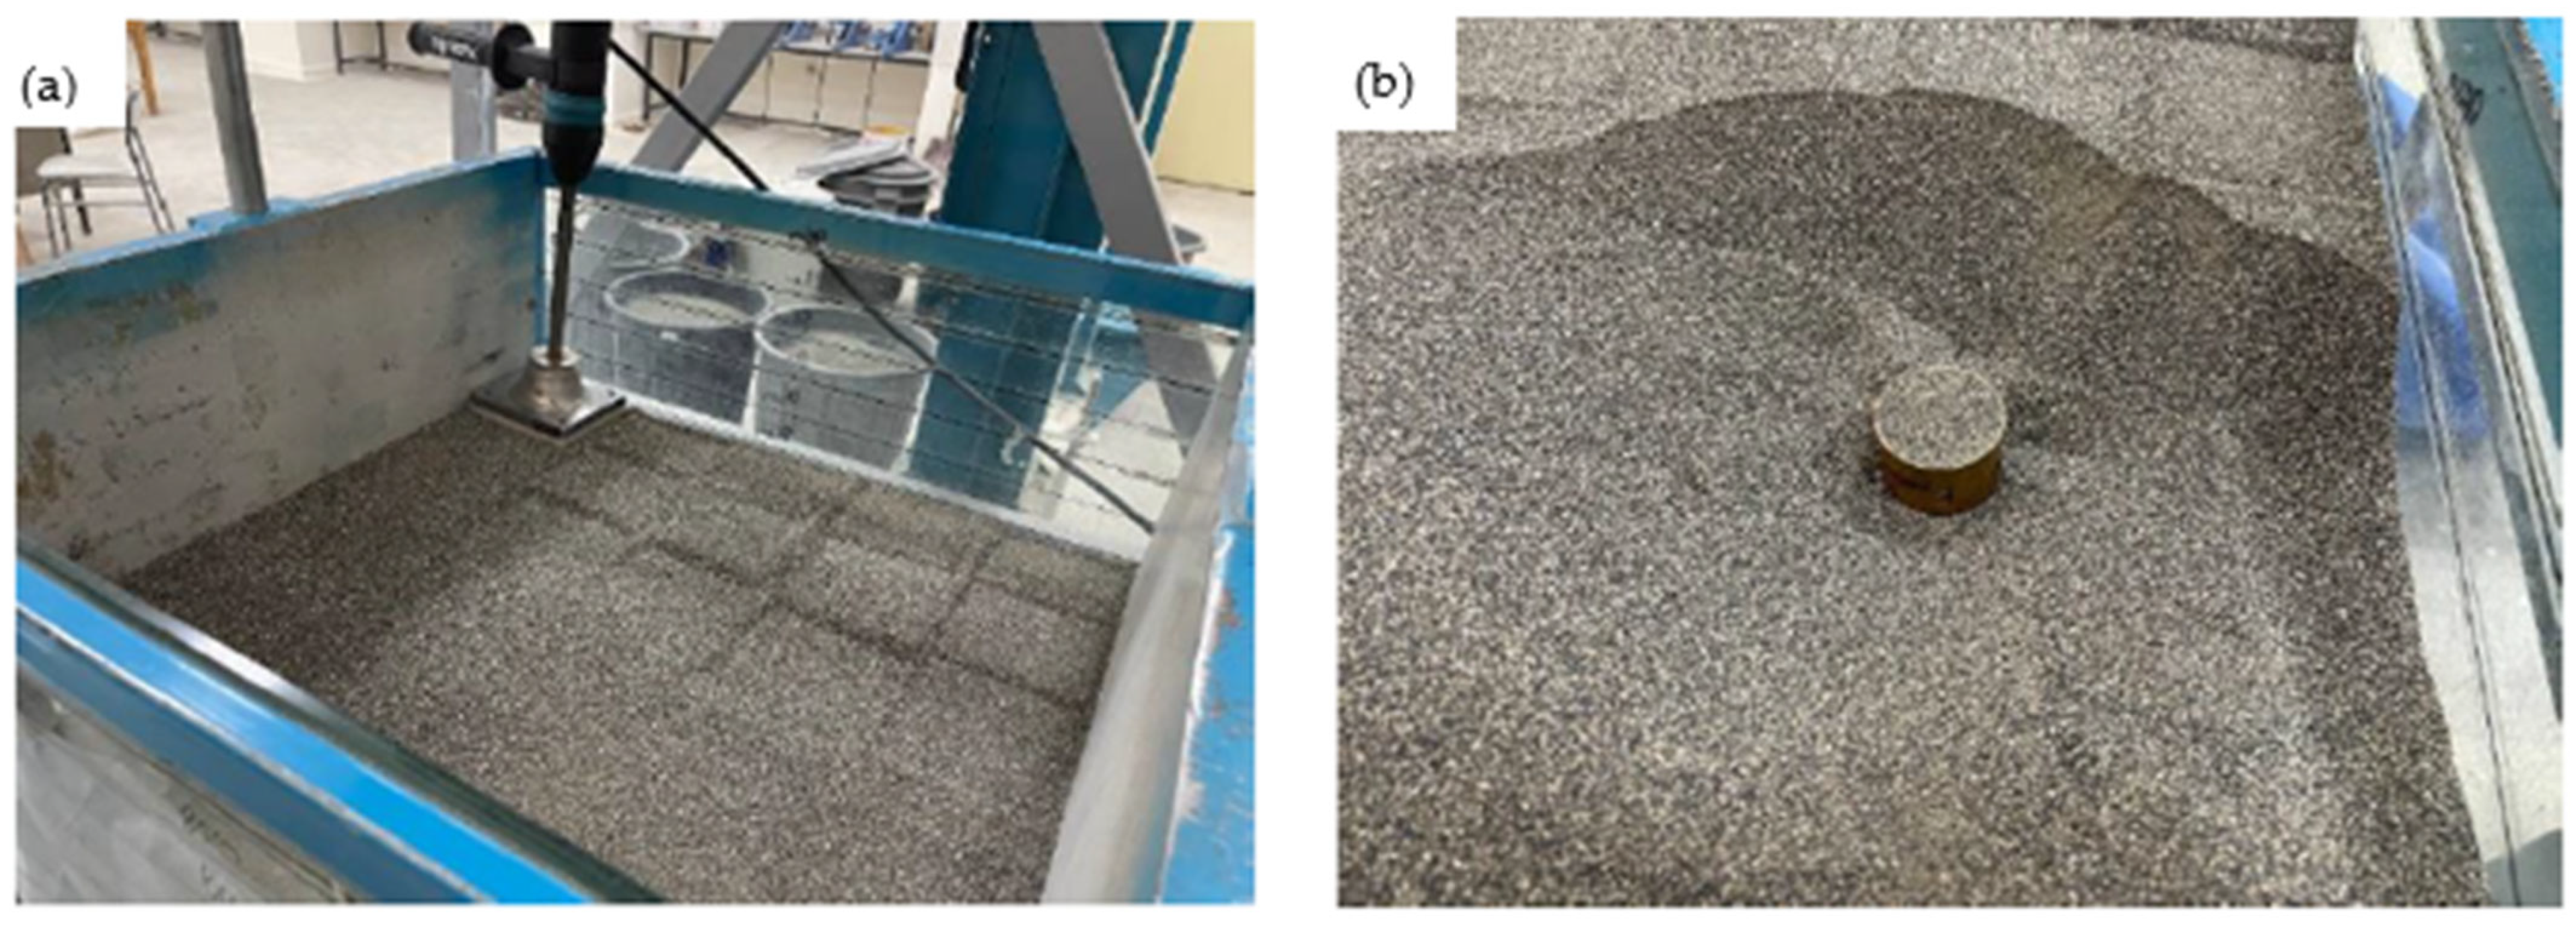
2.3. Experimental Setup and Test Program

In the model experiments, a 1000 mm × 750 mm × 750 mm3 (height × width × thickness) square-section sand tank was used, as shown in Figure 6. The frame of the test tank was made of steel profiles, and 8 mm thick tempered glass was used on the front and back surfaces. The side surfaces and base were made of 3 mm-thick steel. The test tank was designed to be rigid to constitute plane strain conditions. At the same time, lateral deformations were prevented by placing steel profiles on the side walls of the tank, which were resistant to loading. Vibrating equipment compacts the soil, increases its bearing capacity, and reduces soil settlement [53]. In the model experiments, the Makita HM0870C (Makita Co., Nagoya, Japan) model vibration device with an energy of 12 joules at 33 Hz was used to obtain a very loose density.
(Dr = ≤10%), medium- dense soil (Dr = ≤40%), and dense soil (Dr = ≥65–90%). The foundation brief names, sizes, and relative densities of the model tests are listed in Table 2. The sand was poured into the test tank in 10 cm-thick layers using the pluviation method and compacted in a controlled manner until the determined relative density ratios were reached using a vibration device (Table 3). The sand pluviation technique [54] was used to control the height and flow rate of the sand, ensuring the smoothness and compactness of the fill.
After the compaction process was completed, the foundations were placed, and the leveling of the soil surface was considered (Figure 7b).
The load was applied vertically to the center of the foundation using a hydraulic jack at a loading speed of 1.5 mm/min. Settlement measurements were performed using two Opkon brand LVDTs (Linear Variable Differential Transformers) placed at both corners of the foundation. To measure the additional lateral stress increases in the soil, five FSG model soil pressure transducers with a capacity of 200 kPa were installed on the tank wall at 100 mm intervals, as shown in Figure 7a. The data received as digital signals were then transmitted to a computer for storage and analysis. During the experiments, the data were recorded using a data logger (Figure 7c). Figure 7d illustrates a noticeable increase in the settlement at the foundation and heaving around it as it approached its ultimate bearing capacity. The analog signals from the sensors (pressure transducers, load ring, and LVDTs) were amplified by voltage amplifiers and then taken as numerical values at one data point per second with an analog-to-digital converter. The loading tests were completed when the foundation reached its ultimate bearing capacity. (Figure 7e). At this stage, the foundations were loaded slowly and continuously using a hydraulic loading system until they reached their ultimate bearing capacity. When the loading tests were completed, general shear failure was observed in medium-dense (40%) and dense (65% and 90%) soils, as shown in Figure 7e,f. To determine the effects of the foundation size and relative density on the bearing capacity and lateral stress changes, 12 distinct model tests were carried out.
In model tests, the dimensions of the test tank should be selected such that the boundary effects have the least impact on the test results. Many studies have been conducted on the selection of model foundations and dimensions of the test tank to provide semi-infinite media conditions where the boundary effects do not change the experimental results. The results of these studies showed that if there is a 2 B (B is the dimension of the foundation) gap between the edge points of the foundation and the tank edges, the boundary conditions will not affect the test, and thus semi-infinite conditions will be provided [54,55,56]. In this study, since the side length of the test tank was 750 mm, the foundation dimensions were determined as B = B1 = 80 mm, B2 = 1.5 B = 120 mm, and B3 = 2 B = 160 mm to provide semi-infinite conditions. Due to stress-dependent soil properties, it is important to accurately model the prototype stress conditions in small-scale modeling experiments. One of the common ways for applying gravity (g) in modeling experiments is to reproduce full-scale stress levels. Details of the rules and modeling practices used in laboratory modeling can be found in [55]. The scaling laws used in this study are listed in Table 4.
Small containers were strategically placed at various points in the test tank during the model experiments to control the relative density of the sand. To ensure the homogeneity of the sand in the test tank during the tests, small boxes were placed in various areas of the soil tank for control (Figure 8). After each test, the small boxes were carefully removed from the test tank, and the density of the sample was calculated as described in the literature [56]. In this study, the plane stress condition of the test system was assumed to be true. When the foundation width was B1 = B = 80, B2 = 1.5 B, and B3 = 2 B (equivalents in the prototype were B1 = B = 1.6 m, B2 = 2.4 m, and B3 = 3.2 m), the thickness of the soil layer was constant at 900 mm (equivalent in the prototype was 18 m). The width of the system was 750 mm (equivalent to 15 m in the prototype) according to the scaling law given in Table 4.

3. Results and Discussion

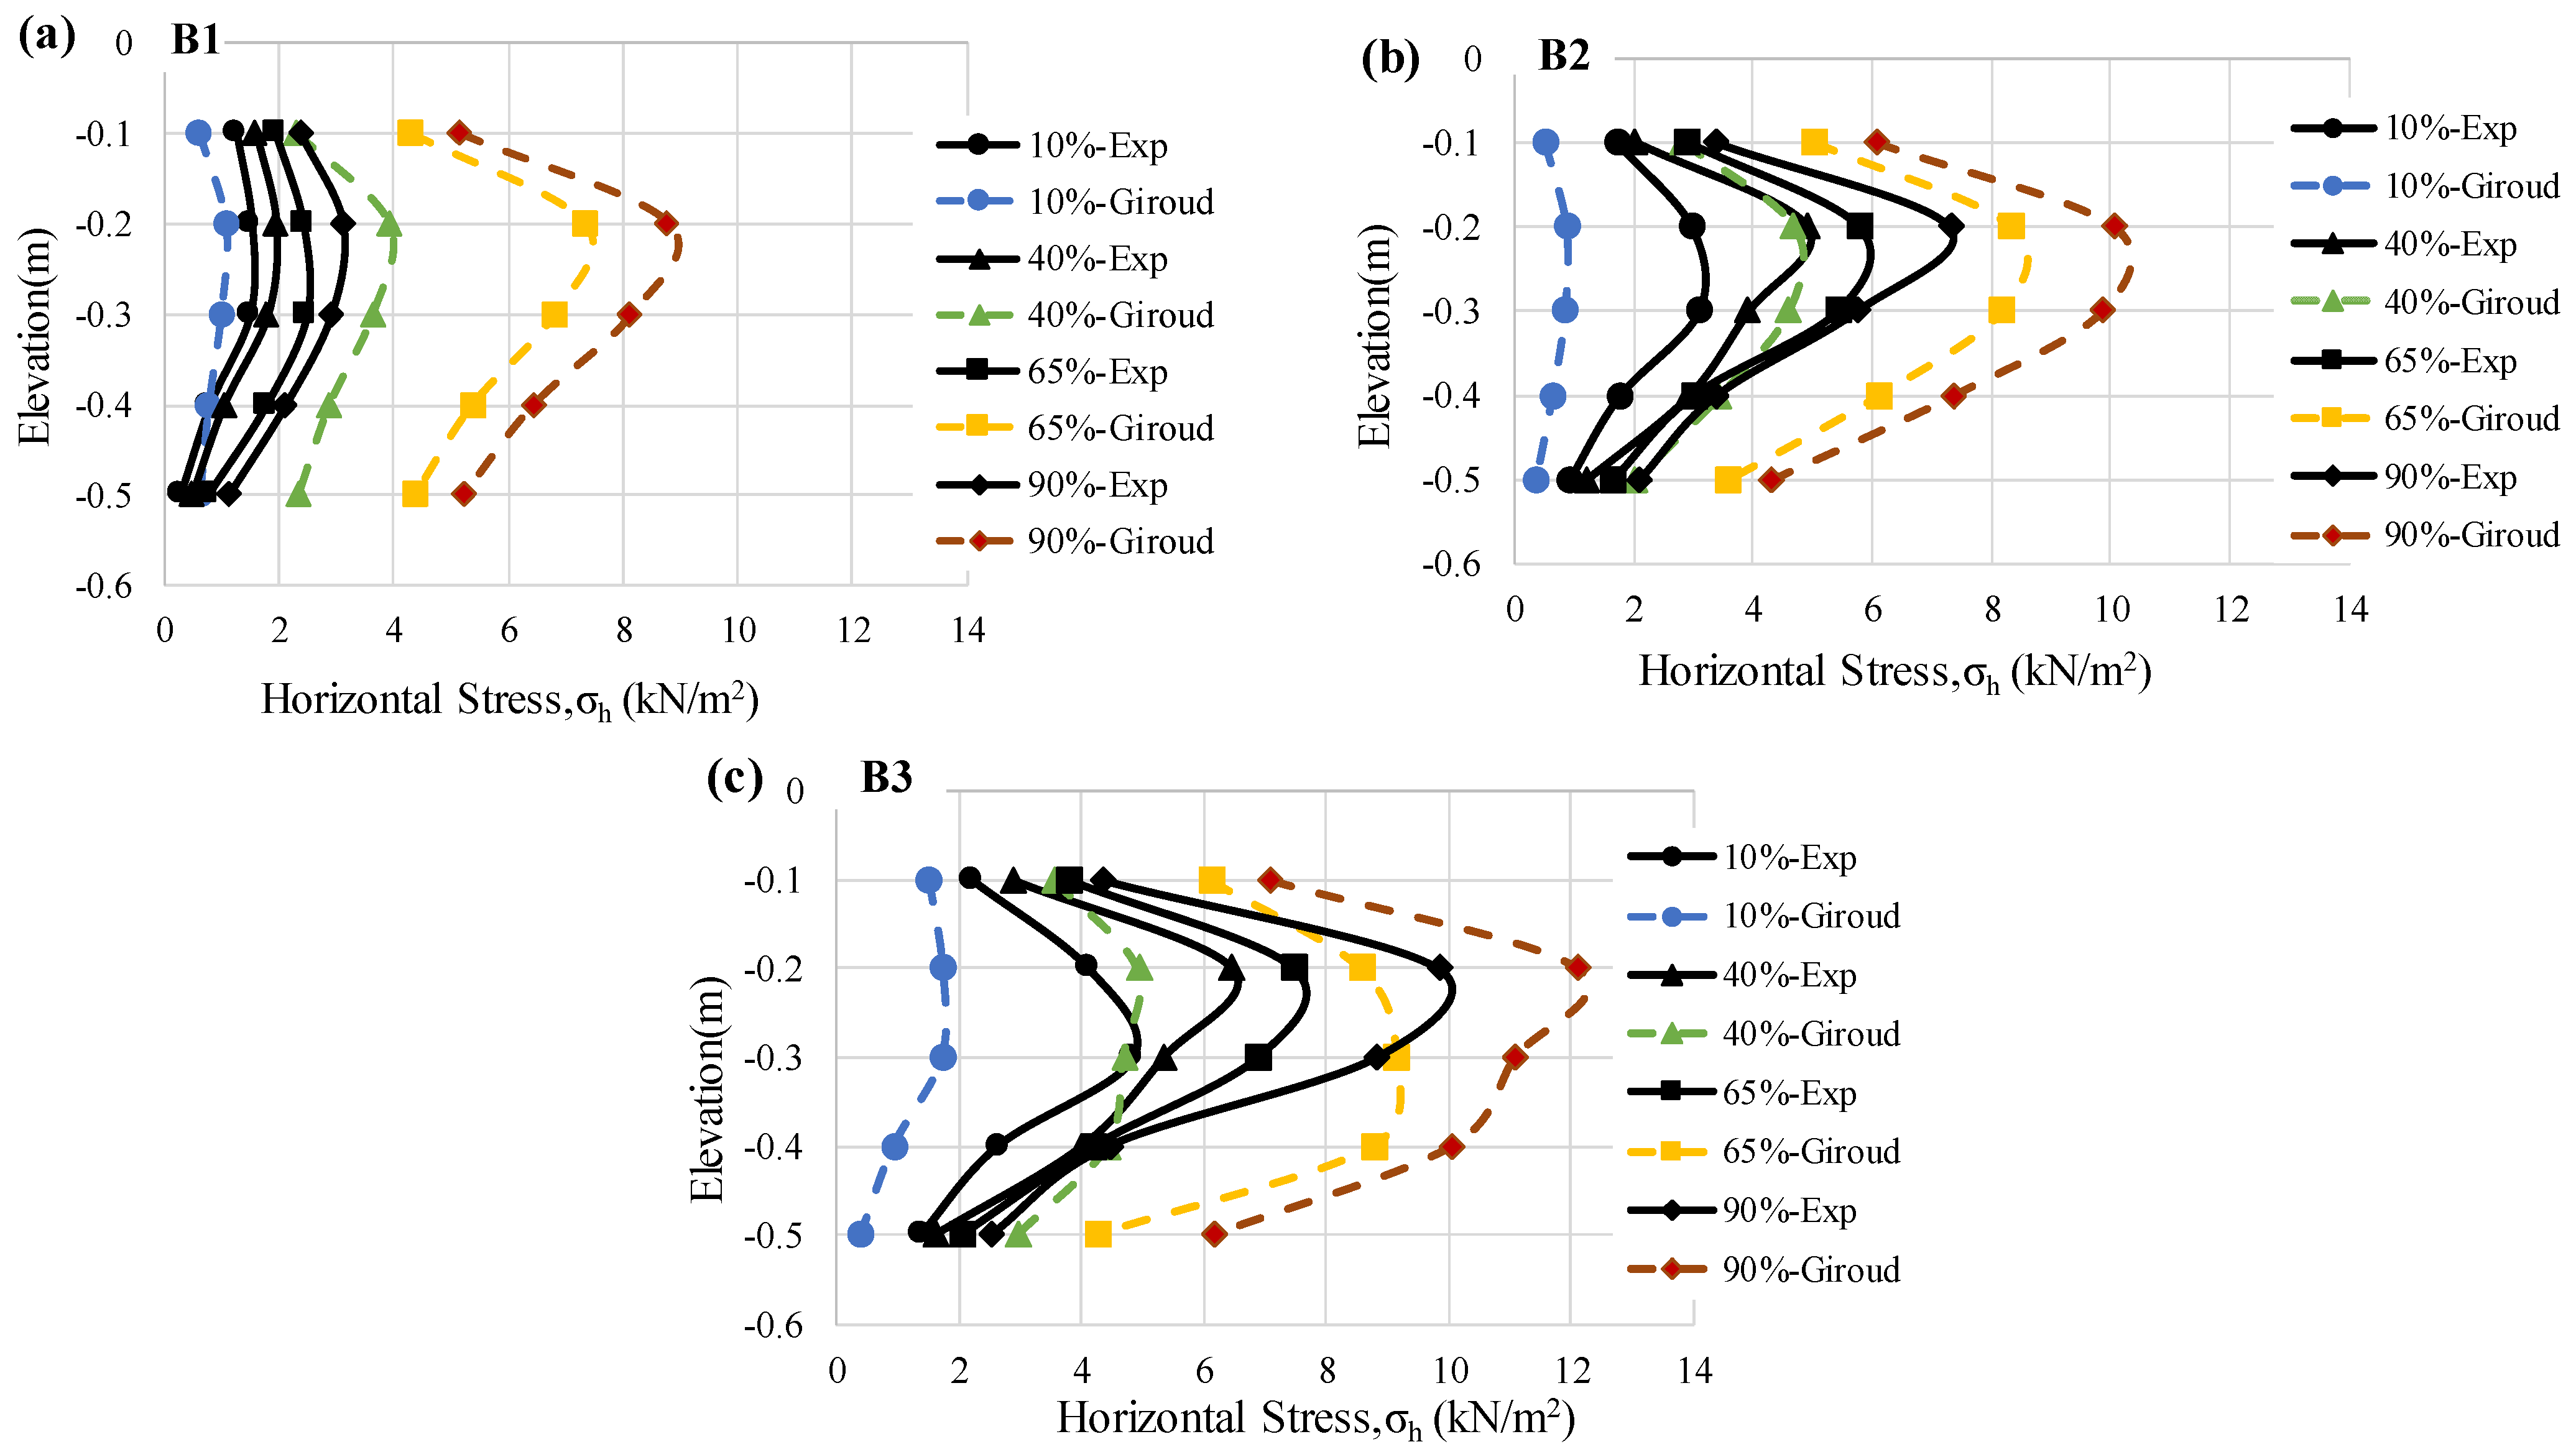
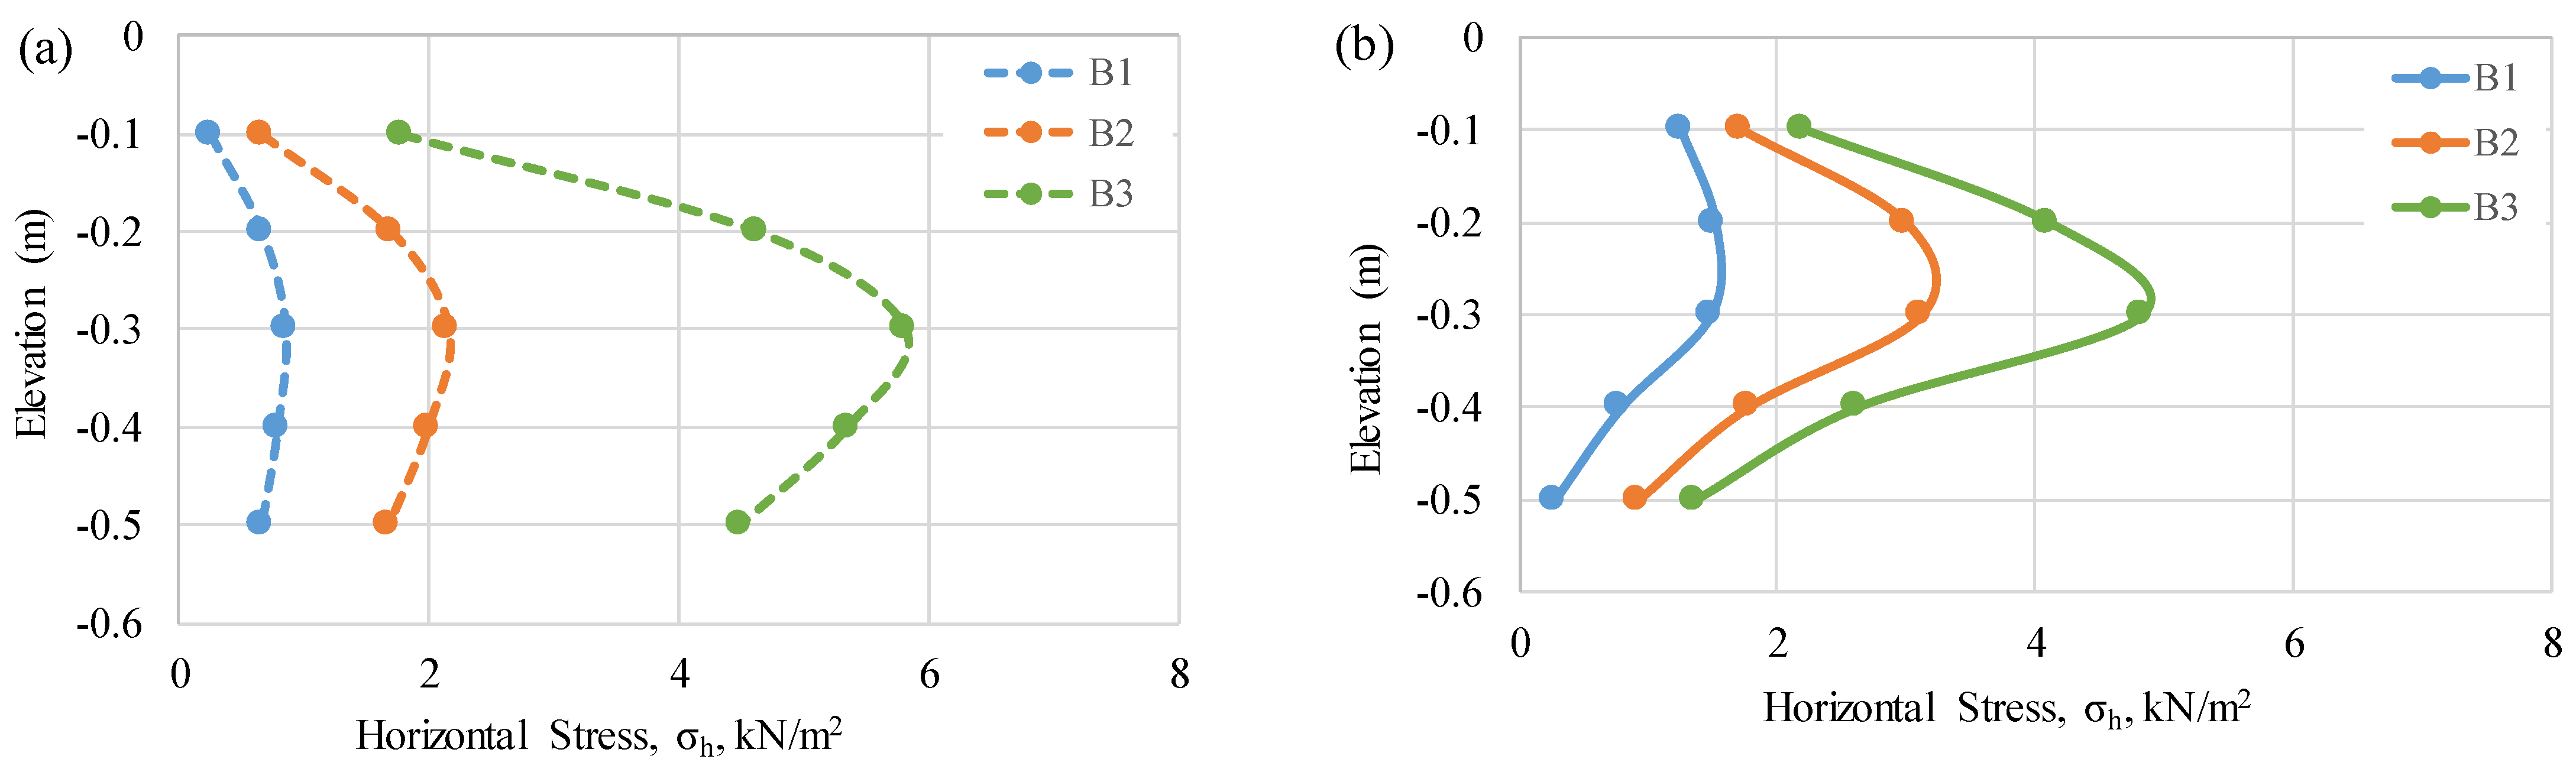
3.1. Evaluation of Lateral Stress Values

In this section, model experiments are used to investigate the effects of relative density and foundation size on additional lateral stresses under square foundations on sand. The lateral stress in the soil increases due to the loading of shallow foundations measured at five different depths (z1 = 1.25 B, z2 = 2.5 B, z3 = 3.75 B, z4 = 5 B, z5 = 6.25 B). As the foundation size increased, the vertical load also increased. Accordingly, the lateral stresses also increased. The maximum lateral stresses for all foundation sizes were measured at a depth of z = 2.5 B (Figure 9b–d) in (Dr ≥ 40%). The maximum lateral stresses in the case of (Dr = 10%) are observed at a depth of z = 3.75 B, as shown in Figure 9a. This situation can be explained as the load applied through the foundation being transmitted a distance from the foundation due to the loose soil. Except for the very loosely dense soil, the maximum stresses at all other densities are observed in Figure 9b–d at z = 2.5 B. As shown in Figure 10a–c, for all foundation dimensions, as the relative density increased, the additional lateral stress also increased. Starting at the foundation base, the additional lateral stresses gradually decreased along the z depth and formed a pressure bulb shape, as described in the literature.
In the B3 foundation, the maximum lateral stress was determined as σh = 9.84 kPa in soil with a relative density (Dr = 90%). The maximum lateral stress value under the same foundation was σh = 4.10 kPa (Dr = 10%). Consequently, the relative density increased, and the lateral stresses at the same depth increased by 140%. The other foundations were compared similarly, and the lateral stresses increased by 106% for foundation B1 and 145% for foundation B2.
All lateral stresses measured using the model experiments were compared with Equation (5), which gives the lateral stress increase occurring under a rectangular loaded area. Figure 9 and Figure 10 show that the experimental and theoretical results changed proportionally with depth. Additionally, it was observed that at (Dr = 10%), the Giroud equation [45] produced similar results for different foundations (Figure 9a).
According to the model test results, as the relative density (Dr) increased for all foundation dimensions (B), the additional lateral stresses in the soil also increased. This situation can be explained by the fact that more loads are carried in denser soils, and therefore, greater stress transfer occurs. Similarly, as the foundation size increased, the increase in the applied vertical loads caused the load to be transmitted to deeper levels and higher lateral stress. These findings are consistent with the load transfer and pressure distribution models defined by Vesic (1973) and Das (2010) [19,56]. In particular, in soils with a relative density of ≥40%, maximum lateral stresses occurred at a depth of z = 2.5 B. This finding is consistent with the “pressure bulb” model, which describes the distribution of the load from the foundation base to the soil at an angle [57]. However, in the case of very loose soil (Dr = 10%), the maximum lateral stress occurred at z = 3.75 B. This situation can be attributed to the load being transmitted to deeper depths due to the higher deformation capacity of loose sands. This observation is consistent with the studies of Meyerhof and Hanna (1978) on foundation load transfer in loose soils [58]. In addition, for all densities and foundation sizes, the additional lateral stresses gradually decreased with increasing depth from the foundation base, forming a classical pressure bulb. This distribution shows that the load effect under the foundation weakens with depth, and the soil responds to this loading gradually [59]. Experiments have shown that with an increase in relative density (Dr), the additional lateral stresses in the soil also increase. This finding was also emphasized in the study conducted by Perkins and Madson (2000) [60]. In this study, it was stated that maximum lateral stresses were observed at deeper points due to the transfer of the load to deeper levels in loose soils. It was also stated that with an increase in relative density, the bearing capacity of the foundation increases, causing an increase in lateral stresses [61].

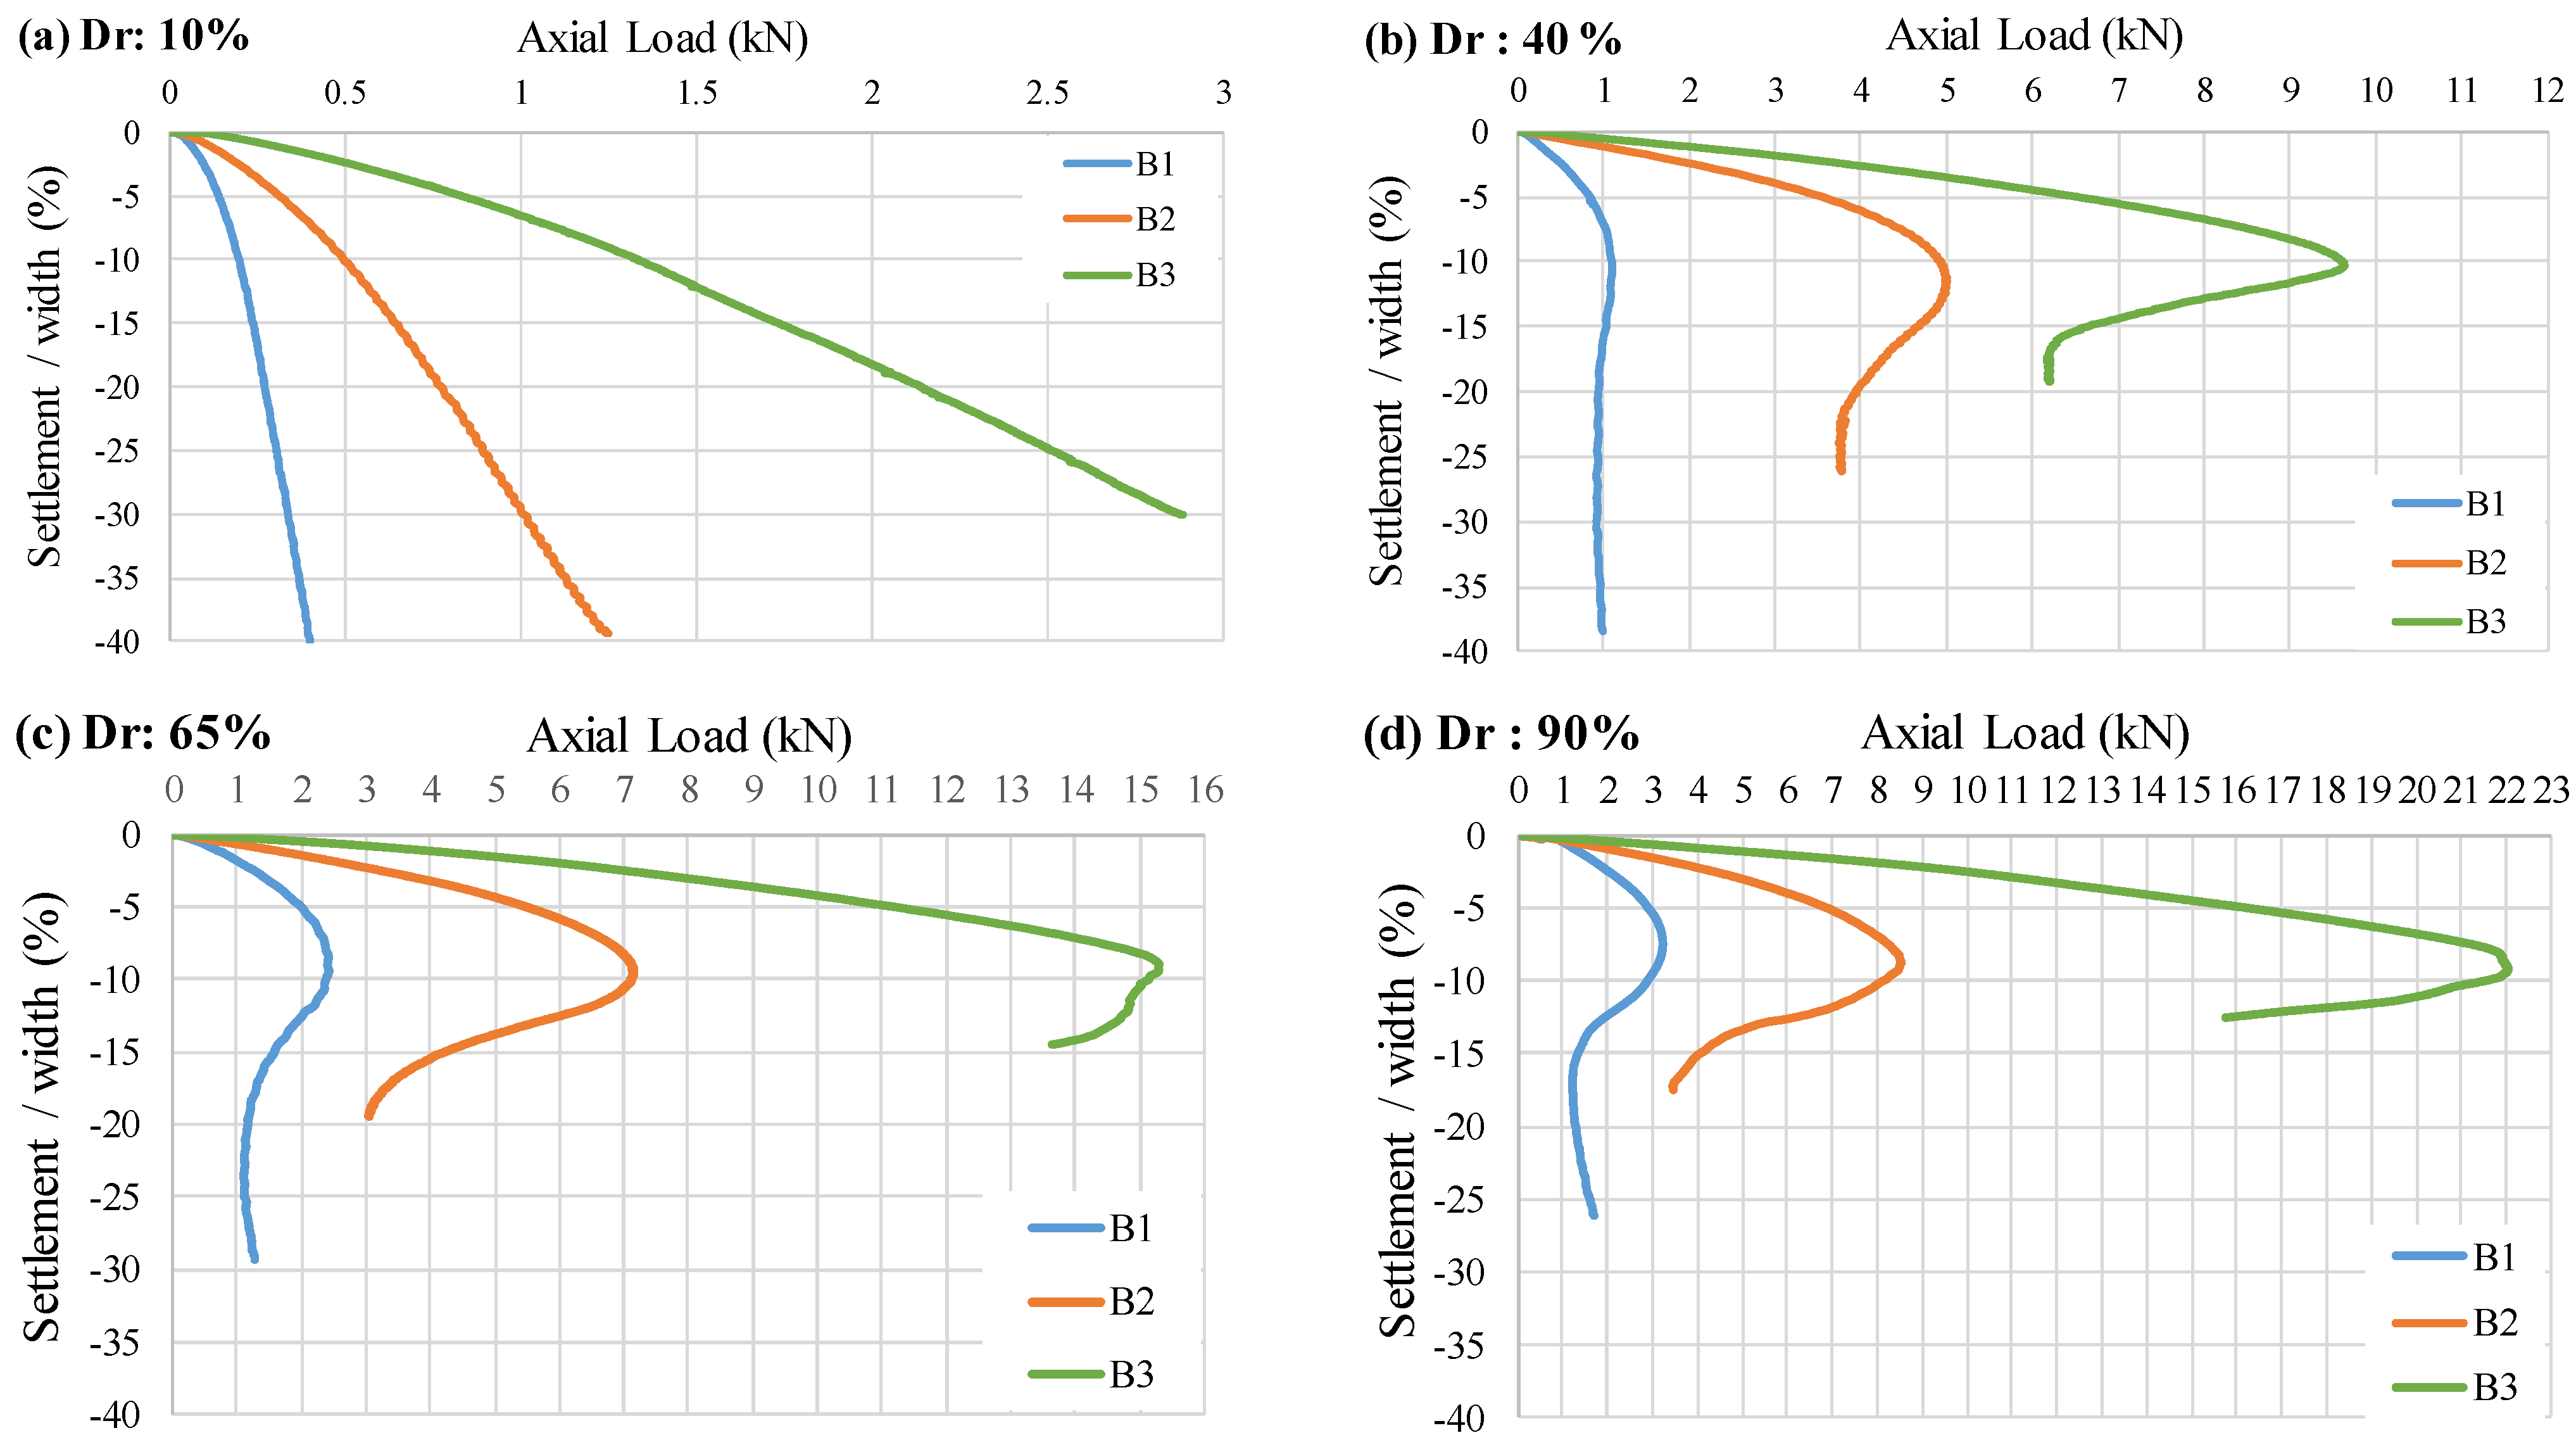
3.2. Load-Settlement Response

The load-settlement (q-s) curves were used to determine the ultimate bearing capacity. At high relative densities, the peak point of the q-s curve is considered the ultimate bearing capacity. The test was terminated after the peak point, when the carrying capacity decreased, and the collapse increased rapidly. Since the load-settlement curve does not peak in loose soils, the ultimate bearing capacity is accepted as the stress value when the settlement equals 10% of the foundation size (B) [8]. The graphs in Figure 11 show the changes in the normalized settlement values with the stress applied to the model foundations. As mentioned above, the ultimate bearing capacity reached around 10% of the normalized settlement values (settlement/foundation width) (Figure 11b–d).
When the load-settlement (q-s) curves presented in Figure 11 are examined, it is observed that the curves do not show a peak in loose sands (Dr = 10%), and the settlement continues with increasing load. In contrast, a peak point was evident in dense soils, followed by post-peak softening behavior. This situation causes dense sand to accumulate more energy in the structure and experience a sudden loss of resistance [62]. This transition can be explained by the fact that loose soils become denser when compressed under load, and thus, the bearing capacity increases. The results indicate that the bearing capacity behavior depends on both the relative density and foundation size and that these two parameters should be evaluated together in terms of soil-foundation interaction. The results obtained show that foundation design should be optimized according to soil properties for engineering applications.
The effect of the relative density and foundation size on the ultimate bearing capacity (qu) of the model foundations is shown in Table 5. The ultimate bearing capacity of the smallest-size foundation increased by 1531.7% when Dr increased from 10% (qu = 30.9 kPa) to 90% (qu = 504.2 kPa); it increased by 1616.5% when Dr increased from 10% (qu = 34.5 kPa) to 90% (qu = 592.2 kPa) in the B2 foundation size; and it increased by 1543.4% when Dr increased from 10% (qu = 52.3 kPa) to 90% (qu = 859.5 kPa) in the B3 foundation size. This indicates that a higher relative density significantly increases the ultimate bearing capacity of sandy soils. In addition, the effect of the foundation size is significant. Increasing the foundation size from 80 mm to 160 mm increases qu from 504.2 kPa to 859.5 kPa for the highest relative density (Dr = 90%). This result highlights the positive correlation between the ultimate bearing capacity and the increasing foundation size.
As the foundation size increases, the ultimate bearing capacity and settlements increase (Table 3). As the density increases from Dr = 10% to 40%, a significant change, i.e., a significant increase in the bearing capacity and a noticeable difference in the damage patterns, is observed. While hardening behavior is observed in loose sand (Figure 11a), post-peak softening behavior is observed as the soil density increases (Figure 11b–d). It is known that loose soils become denser by decreasing the void ratio during loading [52]. Therefore, very high settlements were observed in soils with a relative density of Dr = 10%. The settlements were very low in dense soils (Dr = 65% and 90%) since the bearing capacity was very high. The largest settlements, however, occurred with a density of Dr = 40% because of their limited bearing capacity and high void ratio.

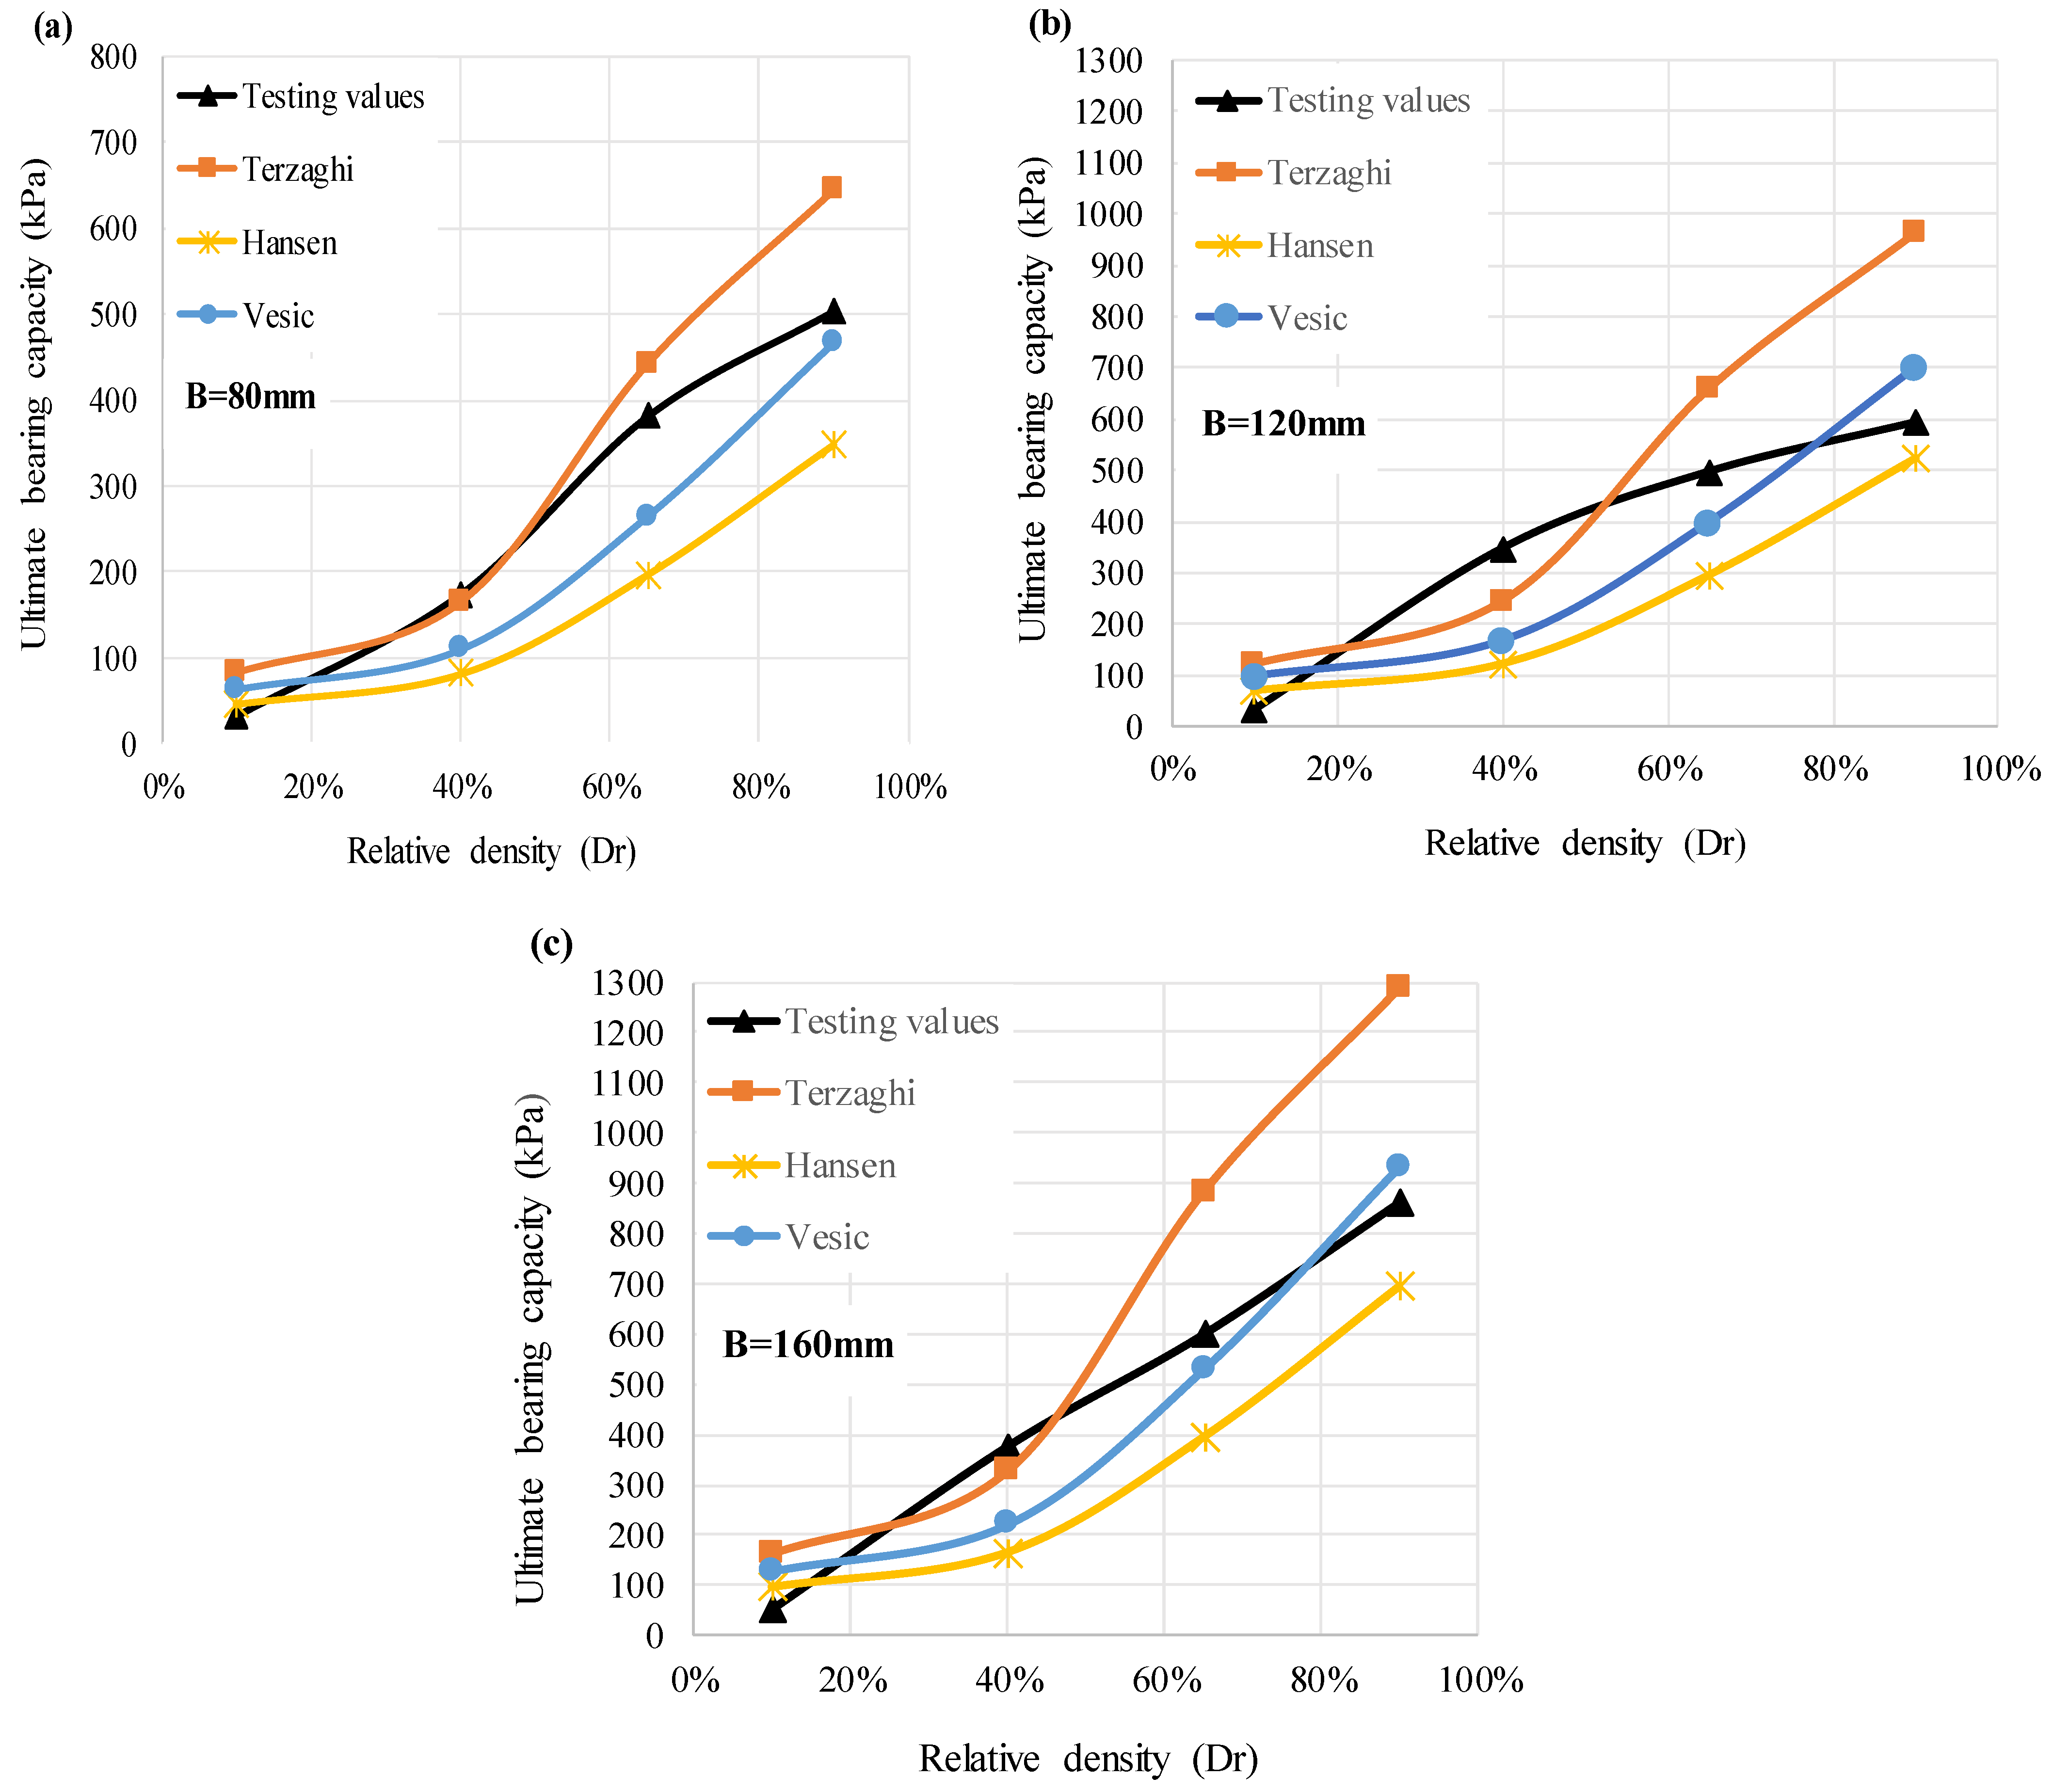
3.3. Comparison of Ultimate Bearing Capacity with Existing Theoretical Methods

The ultimate bearing capacities obtained from the model tests were compared with the equations presented by Terzaghi, Meyerhof, Hansen, and Vesic [63,64,65,66] (Table 5). It was observed that there was good agreement between the values obtained from the Vesic equation and the experimental results at higher relative densities (Dr = 65% and 90%). In contrast, the theoretical approaches of Terzaghi [63] and Hansen [65] are the closest to the experimental results at low relative densities (Dr = 10% and 40 %) (Figure 12). The Meyerhof theory bearing capacities in Table 5 were eliminated from the graphs because they were extremely high compared to all other data. It is known that as the foundation size increases, the results obtained in model experiments will be closer to reality [25]. In the model experiments, it was observed that as the foundation size increased, the experimental and theoretical data (especially with the Vesic equation [56]) became closer to each other.
Vesic (1975) presented a broader theoretical framework by considering the foundation dimensions, load distribution, and soil properties, thus enabling more accurate results to be obtained at high relative densities [66]. This finding is also supported in the literature; for example, Vesic’s theory shows that the load-bearing capacity increases depending on the soil properties, and the effect of the foundation size becomes more pronounced in high-density soils (Vesic, 1975) [66]. However, Terzaghi’s (1943) and Hansen’s (1970) theories provided better agreement at low relative densities (Dr = 10%, 40%) [63,65]. This indicates that both theories are more effective in predicting foundation behavior when the soil density is low. While Terzaghi’s (1943) [63] bearing capacity theory can accurately model soil behavior, especially at low densities, by focusing on the bearing capacity, Hansen’s (1970) [65] approach more accurately reflects the effects of foundation dimensions and soil properties. Furthermore, this finding supports the notion that these theories may be more suitable for evaluating foundation performance in soils with low relative density.
Meyerhof’s bearing capacity [64] calculations often yield extremely high values in the literature [67,68,69]. It is emphasized that the Meyerhof method yields overconfident results and that alternative calculation methods should be used for more accurate estimates. Therefore, Meyerhof’s theory, when compared to other theoretical results, overestimated the bearing capacity and was inconsistent with the experimental data. In Meyerhof’s theory, assumptions regarding the foundation size and load distribution can lead to overestimations under certain soil conditions. This finding shows that Meyerhof’s theory is invalid in some cases, and lower bearing capacity results can be obtained in model experiments.
As a result of the shear box tests, the internal friction angles of the sand soil were obtained as 42.8 for Dr = 10%, 45.4 for Dr = 40%, 49.4 for Dr = 65%, and 51.7 for Dr = 90%.
In the model experiments, it was also observed that the theoretical and experimental data yielded closer results with increasing foundation size. This provides a more accurate representation of the soil and foundation interaction and shows that larger foundations yield results closer to real soil conditions. The literature also states that the bearing capacity can be estimated more accurately with increasing foundation size and that theoretical approaches and experimental results tend to converge [70]. This emphasizes that future studies should be conducted with larger foundation sizes to better understand the effects of foundation size and soil density on the bearing capacity.
In conclusion, this study has shown that Vesic’s theory provides a better fit, especially in soils with a high relative density, while Terzaghi and Hansen’s theories provide more accurate results in soils with a low density. Meyerhof’s theory should not be considered because it provides excessively high results. It has also been observed that increasing the foundation size contributes to a closer approximation of the theoretical and experimental results. These findings indicate the limitations of existing theories and potential improvements for more accurate modeling of foundation design and soil interactions.

3.4. Statistical Analysis

Statistical analysis was performed by considering the relative density of the sand (Dr), depth of the pressure transducers (z), the angle made by the line connecting the pressure transducer to the foundation center point (α), and lateral stress values, which were normalized by the ultimate bearing capacity (Δσ). The experimental lateral stress increments calculated using Equation (5) are shown in Figure 13. An independent dataset was used to verify Equation (5), as shown in Figure 13. The descriptive statistical parameters for the 60 lateral stress values at different relative densities and depths in the 12 model experiments are listed in Table 6.
The regression study examines multiple stress correlations, with the optimal coefficient of determination in the nonlinear statistical analysis obtained as R2 = 0.982. Figure 13 compares the experimental and estimated stress increases. The correlation obtained from the statistical analysis is expressed as follows (Equation (6)), and the variable coefficients are presented in Table 7.
Δ σ =   e ( T · z + V · ( D r ) 0.01 + W · B + X · ( α ) 0.6 + Y · ( z / B ) 0.15 + Z )
Statistical analysis studies conducted to estimate the bearing capacity of foundations by taking into account the foundation geometry and soil properties (unit volume weight of sand and internal friction angle) yield results that are quite close to the existing theoretical calculations [71]. However, some studies have attempted to estimate using artificial neural networks [72,73,74]. However, statistical analysis studies on determining lateral stresses have not been encountered in the literature, except for a few artificial intelligence learning studies. The high R2 value obtained (0.982) shows that the nonlinear regression analysis takes into account the combined effects of parameters such as relative density, depth, and angle on the lateral stress increase quite accurately. This result is consistent with similar nonlinear regression techniques used in previous studies, such as Zhang et al. (2019) [75]. These studies demonstrate that nonlinear models are an effective tool for understanding the complex structure of soil mechanics.
However, this study has some limitations. Although the equation obtained predicts the lateral stress increments well, it would be useful to verify it with additional experimental data for different soil types and load conditions. In addition, the effects of other factors, such as the presence of water and soil size distribution, were not considered in this study. These parameters may contribute to the differences in the lateral stress behavior. Future studies can extend the analysis to include these variables and examine the effects of different boundary conditions on the lateral stress responses.

Validation of Statistical Analysis

In this section, the lateral stress increases in the study are compared with the independent dataset (15 lateral stresses) obtained from the experimental setup, as shown in Figure 13. Here, the independent dataset was substituted into Equation (5), and a validation set was created. The results were similar and compatible.
To test the reliability and validity of the experimental lateral stresses obtained in this part of the study, the results from Equation (5) were compared with the formulation presented in Frazee (2021) [44] When the experimental results were compared with the results in Figure 14a, it was observed that the lateral stress values were compatible for Dr = 10% Figure 14b. In the formulation given for the finite area load in Frazee (2021) [44], it was stated that ν = 0.5 was used, and no formulation was provided for other values of the Poisson ratio. Therefore, compatible results were obtained only for a relative stiffness value of 10%.

4. Conclusions

In this study, the additional lateral stress values formed in the soil by loading square foundations resting on sandy soil were investigated experimentally. The 60 lateral stress values obtained from the experiments were compared with those calculated using Giroud’s Equation (5). Comparisons were made between the ultimate bearing capacities found in the model experiments and the current theoretical relationships proposed by Terzaghi, Meyerhof, Hansen, and Vesic [63,64,65,66]. Multivariate regression analyses were conducted to estimate the experimental lateral stress values, and a usable equation for calculating the lateral stress increase is presented. The results obtained from this study are as follows:
  • Lateral Stress Distribution Depending on Depth: The results of the model experiments showed that the measured lateral stresses changed systematically depending on both the relative density and foundation width. In particular, in the measurements made in the loosest case (Dr = 10%), the highest lateral stress value was σh = 4.10 kPa, and this value was measured at a depth of z = 3.75 B. In the same foundation size and very dense case (Dr = 90%), the maximum lateral stress value reached σh = 9.84 kPa, which was recorded at a depth of z = 2.5 B. While the maximum stresses in all foundation dimensions for Dr = 40%, 65%, and 90% are concentrated at the level of z = 2.5 B, these values are around z = 3.75 B in the case of Dr = 10%.
  • Multivariate Regression for Lateral Stress Prediction: Multivariate regression analysis was performed to estimate the lateral pressure increases measured in the experiments. Considering the environmental geometric parameters and relative soil density, an equation was developed to determine the lateral stress increases under a square shallow foundation.
  • Effect of Soil Density and Foundation Size: Its lateral stresses and ultimate bearing capacity increased significantly with increasing relative density and foundation size. At the largest foundation size (B3), when Dr is increased from 10% to 90%, there is an increase of 140% in lateral stress. Similarly, a more than 1500% increase in the bearing capacity was observed.
  • Agreement with Theoretical Models: At high relative densities, the experimental results were in good agreement with Vesic’s theory. The ultimate bearing capacity values obtained from the model tests were compared with classical theoretical approaches, and the levels of agreement with different models were evaluated according to soil density. At Dr = 90% density, the experimental bearing capacity was calculated as 504.2 kPa for the B1 foundation size, while the Vesic bearing capacity was calculated as 466.7 kPa. The error rate was approximately 7.4%. In particular, the Vesic theory provides results that are very close to the experimental data in the experiments carried out on dense sands. At low densities, the Terzaghi and Hansen methods yield more realistic results. In contrast, Meyerhof’s method consistently overestimated the carrying capacity and did not agree with the experimental data.
  • Load-Settlement Behavior: The load settlement curves exhibited nonlinear behavior with no obvious inflection points in the loose state (Dr = 10%). However, post-peak softening behavior was observed when the density increased steadily to 90%. Higher relative densities resulted in higher carrying capacity values at the same settlement level. However, the ultimate bearing capacity was reached at about 10% of the normalized settlement value when the settlement values were normalized with the foundation width.

Author Contributions

H.S.A.: Writing—review and editing, writing—original draft, validation, methodology, investigation, statistical analysis; D.K.K.: Writing—review and editing, writing—original draft, investigation, conducting experiments. This study was produced from the master’s thesis titled “Experimental and Numerical Analysis of Bearing Capacity and Lateral Pressures Under Square Foundation Resting on Sand” by the second author Damla Küçükay Kayaalp (Thesis number: 606941). All authors have read and agreed to the published version of the manuscript.

Funding

The financial support for this work was provided by Firat University Scientific Research Projects Coordination Unit (FUBAP) (Project No: MF.19.25).

Institutional Review Board Statement

This study did not require ethical approval.

Informed Consent Statement

Not applicable.

Data Availability Statement

All data, models, and codes generated or used during the study are included in the submitted article.

Conflicts of Interest

The authors declare no conflicts of interest.

References

  1. Bowles, J.E. Foundation Analysis and Design, 5th ed.; McGraw-Hill: New York, NY, USA, 1997. [Google Scholar]
  2. Hoopes, O.; Hughes, J. In Situ Lateral Stress Measurement in Glaciolacustrine Seattle Clay Using the Pressuremeter. J. Geotech. Geoenviron. Eng. 2014, 140, 04013054. [Google Scholar] [CrossRef]
  3. Massarsch, K.R.; Wersäll, C.; Fellenius, B.H. Horizontal stress increase induced by deep vibratory compaction. Proc. Inst. Civ. Eng. Geotech. Eng. 2020, 173, 228–253. [Google Scholar] [CrossRef]
  4. Duncan, J.M.; Mokwa, R.L. Passive Earth Pressures: Theories and Tests. J. Geotech. Geoenviron. Eng. 2001, 127, 248–257. [Google Scholar] [CrossRef]
  5. Hanna, A.; Al Khoury, I. Passive Earth Pressure of Overconsolidated Cohesionless Backfill. J. Geotech. Geoenviron. Eng. 2005, 131, 978–986. [Google Scholar] [CrossRef]
  6. Roy, A.; Patra, N.R. Effect of arching on passive earth pressure for rigid retaining walls considering translation mode. In Structures Congress 2009: Don’t Mess with Structural Engineers: Expanding Our Role; American Society of Civil Engineers: Reston, VA, USA, 2009; pp. 2784–2793. [Google Scholar] [CrossRef]
  7. Yaghoubi, E.; Disfani, M.M.; Arulrajah, A.; Kodikara, J. Impact of compaction method on mechanical characteristics of unbound granular recycled materials. Road Mater. Pavement Des. 2018, 19, 912–934. [Google Scholar] [CrossRef]
  8. Terzaghi, K.V. Old earth pressure theories and new test results. Eng. News Rec. 1920, 85, 632–637. [Google Scholar]
  9. Jaky, J. Pressure in Silos. In Proceedings of the 2nd International Conference on Soil Mechanics and Foundation Engineering, Rotterdam, The Netherlands, 21–30 June 1948; pp. 103–107. [Google Scholar]
  10. Bishop, A.W. Test Requirements for Measuring proc. In Proceedings of the Test Requirements for Measuring Proc., Brussls, Belgium, 1958; pp. 2–14. [Google Scholar]
  11. Hendron, A. The Behavior of Sand in One Dimensional Compression; University of Illinois: Urbana, IL, USA, 1963. [Google Scholar]
  12. Brooker, E.W.; Ireland, H.O. Earth Pressures at Rest Related to Stress History. Can. Geotech. J. 1965, 2, 1–15. [Google Scholar] [CrossRef]
  13. Saglamer, A. Soil parameters affecting coefficient of earth pressure at rest of cohesionless soils. In Proceedings of the Istanbul Conference on Soil/Mechanics and Foundation Engineering, Istanbul, Turkey, 31 March–2 April 1975; pp. 9–16. [Google Scholar]
  14. Hanna, B.A.; Ghaly, A. Effects of K0 and overconsolidation on uplift capacity. J.Geotech. Eng. 1992, 118, 1449–1469. [Google Scholar] [CrossRef]
  15. Hanna, A.M.; Soliman-Saad, N. Effect of compaction duration on the induced stress levels in a laboratory prepared sand bed. Geotech. Test. J. 2001, 24, 430–438. [Google Scholar] [CrossRef]
  16. Bağrıaçık, B.; Laman, M. Investigation of the Size Effect at Different Geometries on Stress Distribution of Sandy Soils. In Proceedings of the International Balkans Conference on Challenges of Civil Engineering, Tirana, Albania, 19–21 May 2011; pp. 19–21. [Google Scholar]
  17. Talesnick, M.; Nachum, S.; Frydman, S. K0 determination using improved experimental technique. Geotechnique 2020, 71, 509–520. [Google Scholar] [CrossRef]
  18. Aksoy, H.S.; Küçükay, D.; Gör, M. KumZemïne Oturan Kare Temel Altinda Oluşan YanaGerïlmelerïn Deneysel VeTeorïÏncelemesï. Ömer Halisdemir Üniversitesi Mühendislik Bilim. Derg. 2019, 8, 912–921. [Google Scholar] [CrossRef]
  19. Das, B.M. Geotechnical Engineering Handbook; J. Ross Publishing: Plantation, FL, USA, 2010. [Google Scholar]
  20. Bilgen, G. Utilization of Powdered Glass as an Additive in Clayey Soils. Geotech. Geol. Eng. 2020, 38, 3163–3173. [Google Scholar] [CrossRef]
  21. Bilgen, G.; Altuntas, O.F. Sustainable re-use of waste glass, cement and lime treated dredged material as pavement material. Case Stud. Constr. Mater. 2023, 18, e01815. [Google Scholar] [CrossRef]
  22. Keskin, M.S.; Laman, M.; Baran, T. Experimental determination and numerical analysis of vertical stresses under square footings resting on sand. Tek. Dergi/Technical J. Turkish Chamb. Civ. Eng. 2008, 19, 1263–1279. [Google Scholar]
  23. Giroud, J.P. Settlement of a linearly loaded rectangular area. Civ. Eng. J. Soil Mech. ASCE 1968, 96, 813–831. [Google Scholar] [CrossRef]
  24. Li, L.; Dai, Z.; Liu, R.; Jian, F. Experimental Study on the Coefficient of Earth Pressure at Rest for Sand. Buildings 2023, 13, 1276. [Google Scholar] [CrossRef]
  25. Luo, Z.; Ding, X.; Zhang, X.; Ou, Q.; Yang, F.; Zhang, T.; Cao, G. Experimental and numerical investigation of the bearing capacity and deformation behavior of coral sand foundations under shallow footing loads. Ocean Eng. 2024, 310, 118601. [Google Scholar] [CrossRef]
  26. Lee, J.; Yun, T.S.; Lee, D.; Lee, J. Assessment of K0 correlation to strength for granular materials. Soils Found. 2013, 53, 584–595. [Google Scholar] [CrossRef]
  27. Li, Z.X.; Hou, G.Y.; Hu, T.; Zhou, T.C.; Xiao, H.L. Deformation behavior monitoring of a tunnel in its temporary shoring demolishing process using optical fiber sensing technology. Meas. J. Int. Meas. Confed. 2021, 176, 109170. [Google Scholar] [CrossRef]
  28. Moayedi, H.; Nazir, R.; Mosallanezhad, M.; Bin, R.; Noor, M. Lateral de fl ection of piles in a multilayer soil medium. Case study: The Terengganu seaside platform. Measurement 2018, 123, 185–192. [Google Scholar] [CrossRef]
  29. Liu, C.; Jiang, Z.; Yu, H. Safety analysis for bridge pier under nearby road construction and operation. Meas. J. Int. Meas. Confed. 2020, 151, 107169. [Google Scholar] [CrossRef]
  30. Xu, D.S.; Yin, J.H.; Cao, Z.Z.; Wang, Y.L.; Zhu, H.H.; Pei, H.F. A new flexible FBG sensing beam for measuring dynamic lateral displacements of soil in a shaking table test. Meas. J. Int. Meas. Confed. 2013, 46, 200–209. [Google Scholar] [CrossRef]
  31. Moayedi, H.; Nazir, R.; Gör, M.; Kassim, K.A.; Foong, L.K. A new real-time monitoring technique in calculation of the p-y curve of single thin steel piles considering the influence of driven energy and using strain gauge sensors. Measurement 2019, 153, 107365. [Google Scholar] [CrossRef]
  32. Boussinesq, J. et des pressions que produisent. In Proceedings of the Application des Potentiels à L’étude de L’équilibre et du Mouvement des Solides Élastiques: Principalement au Calcul des Déformations et des Pressions Que, Paris, France, 1885. [Google Scholar]
  33. Feld, J. Lateral Earth Pressure: The Accurate Experimental Determination of the Lateral Earth Pressure, Together with A Resume of Previous Experiments. Trans. Am. Soc. Civ. Eng. 1923, 86, 1448–1505. [Google Scholar] [CrossRef]
  34. Gerber, E. Untersuchungen über die Druckverteilung im Örtlich Belasteten Sand. Doctoral Dissertation, Eidgenössische Technische Hochschule Zürich (ETH Zurich), Zürich, Switzerland, 1929. [Google Scholar]
  35. Newmark, N.M. Simplified computation of vertical pressures in elastic foundations. Eng. Exp. Stn. Circ. 1935. [Google Scholar]
  36. Spangler, M.G. Horizontal Pressures on Retaining Walls Due to Concentrated Surface Loads; Iowa State College of Agriculture and Mechanic Arts: Ames, IA, USA, 1938. [Google Scholar]
  37. Heagler, J.B. Horizontal Pressures on Retaining Walls Due to Line Surface Loads. Master’s Thesis, Missouri University of Science and Technology, Rolla, MO, USA, 1954. [Google Scholar]
  38. James, R.W.; Brown, D.A. Wheel-load-induced earth pressures on box culverts. Transp. Res. Rec. 1987, 1129, 55–62. [Google Scholar]
  39. Rehnman, S.; Broms, B.B. Lateral pressures on basement wall. Results from full-scale tests. In Proceedings of the 5th European Conference on Soil Mechanics and Foundation Engineering, Madrid, Spain, 10–13 April 1972. [Google Scholar]
  40. Abdel-Karim, A.M.; Tadros, M.K.; Benak, J.V. Live load distribution on concrete box culverts. Transp. Res. Rec. 1990, 136–151. [Google Scholar]
  41. Poulos, H.G.; Davis, E.H. Elastic solutions for soil and rock mechanics. Textbook. Figs, Tabls, Refs. Int. J. Rock Mech. Min. Sci. Geomech. Abstr. 1974, 11, A159. [Google Scholar] [CrossRef]
  42. Gray, H. Stress distribution in elastic solids. In Proceedings International Conference on Soil Mechanics and Foundation Engineering; ISSMGE: London, UK, 1936. [Google Scholar]
  43. AASHTO. LRFD Bridge Design Specifications, 8th ed.; AASHTO: Washington, DC, USA, 2017. [Google Scholar]
  44. Frazee, G.R. New Formulations of Boussinesq Solution for Vertical and Lateral Stresses in Soil. Pract. Period. Struct. Des. Constr. 2021, 26, 06021001. [Google Scholar] [CrossRef]
  45. Giroud, J.P. Stresses under linearly loaded rectangular area. J. Soil Mech. Found. Div. ASCE 1970, 96, 263–268. [Google Scholar] [CrossRef]
  46. Jardine, R.J.; Standing, J.R.; Chow, F.C. Some observations of the effects of time on the capacity of piles driven in sand. Geotechnique 2006, 56, 227–244. [Google Scholar] [CrossRef]
  47. Emirler, B.; Tolun, M.; Yildiz, A. Investigation on determining uplift capacity and failure mechanism of the pile groups in sand. Ocean Eng. 2020, 218, 108145. [Google Scholar] [CrossRef]
  48. ASTM-C1444-00; Standard Method for Measuring the Angle of Repose of Free-Flowing Mold Powders. American Society of Testing and Materials: Philadelphia, PA, USA, 2001; pp. 694–695.
  49. ASTM D422-63; Standard Test Method for Particle-Size Analysis of Soils. ASTM International: West Conshohocken PA, USA, 2007.
  50. ASTM D854-14; Standard Test Methods for Specific Gravity of Soil Solids by Water Pycnometer. ASTM International: West Conshohocken PA, USA, 2014.
  51. ASTM D4254; Standard Test Methods for Minimum Index Density and Unit Weight of Soils and Calculation of Relative Density. ASTM International: West Conshohocken, PA, USA, 2006.
  52. Holtz, R.D.; Kovacs, W.D.; Sheahan, T.C. An Introduction to Geotechnical Engineering, 2nd ed.; Pearson: London, UK, 2015. [Google Scholar]
  53. Chen, T.J.; Fang, Y.S. Earth pressure due to vibratory compaction. J. Geotech. Geoenviron. Eng. 2008, 134, 437–444. [Google Scholar] [CrossRef]
  54. Luo, Z.G.; Ding, X.M.; Ou, Q.; Fang, H.Q. Bearing capacity and deformation behavior of rigid strip footings on coral sand slopes. Ocean Eng. 2023, 267, 113317. [Google Scholar] [CrossRef]
  55. Wood, D.M. Geotechnical Modelling (Applied Geotechnics; v. 1); Taylor & Francis Group/Books: Boca Raton, FL, USA, 2004. [Google Scholar]
  56. Vesic, A.S. Analysis of ultimate loads of shallow foundations. J. Soil Mech. Found. Div. 1973, 99, 45–73. [Google Scholar] [CrossRef]
  57. Poulos, H.G.; Davis, E.H. Prediction of Downdrag Forces in End-Bearing Piles. J. Geotech. Eng. Div. 1975, 101, 189–204. [Google Scholar] [CrossRef]
  58. Meyerhof, G.G.; Hanna, A.M. Ultimate bearing capacity of foundations on layered soils under inclined load. Can. Geotech. J. 1978, 15, 565–572. [Google Scholar] [CrossRef]
  59. Terzaghi, A. Soil Management for Improvement of Soil Physical Characteristics Related to Erosion in Uruguay. Ph.D. Thesis, Wageningen University and Research, Wageningen, The Netherlands, 1996. [Google Scholar]
  60. Perkins, S.W.; Madson, C.R. Bearing capacity of shallow foundations on sand: A relative density approach. J. Geotech. Geoenviron. Eng. 2000, 126, 521–530. [Google Scholar] [CrossRef]
  61. Loukidis, D.; Salgado, R. Effect of relative density and stress level on the bearing capacity of footings on sand. Géotechnique 2011, 61, 107–119. [Google Scholar] [CrossRef]
  62. Lade, P.V.; Duncan, J.M. Elastoplastic stress-strain theory for cohesionless soil. J. Geotech. Eng. Div. 1975, 101, 1037–1053. [Google Scholar] [CrossRef]
  63. Terzaghi, K. Theoretical Soil Mechanics; John Wiley & Sons: Hoboken, NJ, USA, 1943. [Google Scholar]
  64. Meyerhof, G.G. The ultimate bearing capacity of foudations. Geotechnique 1951, 2, 301–332. [Google Scholar] [CrossRef]
  65. Hansen, J.B. A Revised and Extended Formula for Bearing Capacity; Bull, 28; Danish Geotechnical Institute: Copenhagen, Denmark, 1970. [Google Scholar]
  66. Vesic, A.S. Bearing Capacity of Shallow Foundations. In Foundation Engineering Handbook; Winterkorn, F.S., Fand, H.Y., Eds.; Van Nostrand Reinhold: New York, NY, USA, 1975. [Google Scholar]
  67. Liu, G.; Liu, C. Derivation of the Ultimate Bearing Capacity Formula for Layered Foundations Based on Meyerhof’s Theory. Appl. Sci. 2024, 14, 5121. [Google Scholar] [CrossRef]
  68. Padmavathi, M.; Padmavathi, V.; Madhav, M.R. Foundation Subjected to Moment Loading: Re-evaluation of Meyerhof’s Approach. Indian Geotech. J. 2014, 44, 260–268. [Google Scholar] [CrossRef]
  69. Ravichandran, N.; Mahmoudabadi, V.; Shrestha, S. Analysis of the Bearing Capacity of Shallow Foundation in Unsaturated Soil Using Monte Carlo Simulation. Int. J. Geosci. 2017, 08, 1231–1250. [Google Scholar] [CrossRef]
  70. Bowles, J.E. Foundation Analysis and Design, 5th ed.; McGraw-Hill: Peoria, IL, USA, 2012. [Google Scholar]
  71. Ahmad, M.; Ahmad, F.; Wróblewski, P.; Al-Mansob, R.A.; Olczak, P.; Kamiński, P.; Safdar, M.; Rai, P. Prediction of ultimate bearing capacity of shallow foundations on cohesionless soils: A gaussian process regression approach. Appl. Sci. 2021, 11, 10317. [Google Scholar] [CrossRef]
  72. Shahnazari, H.; Tutunchian, M.A. Prediction of ultimate bearing capacity of shallow foundations on cohesionless soils: An evolutionary approach. KSCE J. Civ. Eng. 2012, 16, 950–957. [Google Scholar] [CrossRef]
  73. Tsai, H.C.; Tyan, Y.Y.; Wu, Y.W.; Lin, Y.H. Determining ultimate bearing capacity of shallow foundations using a genetic programming system. Neural Comput. Appl. 2013, 23, 2073–2084. [Google Scholar] [CrossRef]
  74. Kohestani, V.R.; Vosoughi, M.; Hassanlourad, M.; Fallahnia, M. Bearing Capacity of Shallow Foundations on Cohesionless Soils: A Random Forest Based Approach. Civ. Eng. Infrastructures J. 2017, 50, 35–49. [Google Scholar] [CrossRef]
  75. Zhang, L.; Shi, Z.; Cheng, M.M.; Liu, Y.; Bian, J.W.; Zhou, J.T.; Zheng, G.; Zeng, Z. Nonlinear Regression via Deep Negative Correlation Learning. IEEE Trans. Pattern Anal. Mach. Intell. 2021, 43, 982–998. [Google Scholar] [CrossRef]
Figure 1. Lateral stress due to finite area load [44].
Applsci 15 06699 g001
Figure 2. Sub-angular particles of sand.
Applsci 15 06699 g002
Figure 3. Repose angle of the sand.
Applsci 15 06699 g003
Figure 4. Particle size distribution of the sand.
Applsci 15 06699 g004
Figure 5. Model rigit shallow foundation.
Applsci 15 06699 g005
Figure 6. Model test system: (a) 3D schematic sketch, (b) cross-section of test tank.
Applsci 15 06699 g006
Figure 7. Model test setup and arrangement: (a) mounted pressure transducers, (b) general test setup after filling the test tank, (c) collection of data in a computer environment via a data logger, (d) soil heave, (e) soil heave-zone of general shear failure, and (f) zones where heave is evident after failure.
Applsci 15 06699 g007
Figure 8. Controlling the relative density of sand in the test tank: (a) compression process (15 cm × 15 cm) and (b) control of compaction and homogeneity.
Applsci 15 06699 g008
Figure 9. Variation of measured lateral stresses with depth and relative density, comparison with Giroud’s calculations: (a) Dr: 10%, (b) 40%, (c) 65% and (d) 90%.
Applsci 15 06699 g009
Figure 10. Measured lateral stresses increase with relative density: (a) B1, (b) B2 and (c) B3.
Applsci 15 06699 g010
Figure 11. Normalized load–displacement curves of the model foundation at different relative densities: (a) Dr: 10% (b) Dr: 40% (c) Dr: 65% (d) Dr: 90%.
Applsci 15 06699 g011
Figure 12. (a) B= 80 mm (b) 120 mm (c) 160 mm Comparison of the experimental ultimate bearing capacity with the available theoretical calculations.
Applsci 15 06699 g012
Figure 13. Comparison of experimental and predicted data.
Applsci 15 06699 g013
Figure 14. (a) Lateral stress due to finite area load [38], (b) Experimental lateral stresses for Dr = 10%.
Applsci 15 06699 g014
Table 1. Properties of soil used in the model tests.
Granulometry ParametersUnitsValues
Spesific gravity, Gs-2.77
D10mm0.18
D50mm0.45
Max − min particle size, Dmax − Dminmm1–0.074
Max dry densitykN/m317.5
Min dry densitykN/m314.3
Max void ratio, emax-0.903
Min void ratio, emin-0.553
Soil class (USCS)-SP
Table 2. A list of model-testing methodologies.
Serial NumberFoundation Size (mm)Dr (%) Relative DensityLoose-Dense Condition [52]
B1 = B801010% ≤ very loose
4040% ≤ medium dense soil
65dense
90very dense
B2 = 1.5 B1201010% ≤ very loose
4040% ≤ medium dense soil
65dense
90very dense
B3 = 2 B1601010% ≤ very loose
4040% ≤ medium dense soil
65dense
90very dense
Table 3. Sand raining technique and compaction process.
Relative Density (Dr, %)Average Dry Unit Weight (γd), (kN/m3)Void Ratio (e)Pluviation and Compaction Process
1014.60.869Test sand was poured from a height of 10 to 15 cm until the model tank was filled to the needed depth.
4015.50.763The test sand was poured between 5 and 10 cm in height, and the tank was filled with layers every 10 cm. Each point (15 cm × 15 cm) was compacted for a brief period of time, less than a second.
6516.30.635The test sand was poured between 5 and 10 cm in height, and the tank was filled with layers every 10 cm. Each point (15 cm × 15 cm) was compacted for a brief period of time, less than a second.
9017.30.588The test sand was poured between 5 and 10 cm in height, and the tank was filled with layers every 5 cm. Each point (15 cm × 15 cm) was compacted for a brief period of time, less than a second.
Table 4. Scaling laws [55].
Physical ParametersScaling Factor
Gravity (m/s2)1
Length (m)1/n
Force (N)1/n3
Displacement (m)1/n2−α
Area (m2)1/n2
Strain1/n1−α
Stiffness (N)1/nα
Density (kg/m3)1
Stress (kPa)1/n
α1
Table 5. Theoretical and experimental ultimate bearing capacities.
Model FoundationDr (%)This StudyTerzaghi
[63]
Meyerhof [64]Hansen [65]Vesic [66]
B = B1 = 80 mm1030.981.8183.747.364.4
40173.0163.7358.181.9110.8
65380.6440.11083.5197.1264.7
90504.2642.82262.6348.4466.7
B21034.5122.8275.671.096.6
40347.2245.5537.1122.9166.2
65496.3660.11625.3295.7397.0
90592.2964.33393.8522.6700.0
B31052.3163.7367.494.6128.8
40375.4327.3716.2163.9221.6
65597.9880.22167.1394.2529.3
90859.51285.74525.1696.8933.4
Table 6. Descriptive statistical parameters of experimental data.
Δσ (kPa)z (m)B (m)z/BαDr (%)
Average0.0170.300.122.7136.330.51
Minimum0.0230.100.080.6314.930.10
Maximum0.0920.500.166.2553.130.90
Standard Deviation0.0220.140.031.5513.710.30
Skewness2.3143000.7005−0.3622−0.1064
Kurtosis4.7189−1.3081−1.5259−0.1588−1.2081−1.3293
Table 7. Variable coefficients in the equation were obtained.
CoefficientT (1st)V (2nd)W (3rd)X (4th)Y (5th)Z (6th)
Values−14.21−112.33−48.602.69−40.94140.20
Disclaimer/Publisher’s Note: The statements, opinions and data contained in all publications are solely those of the individual author(s) and contributor(s) and not of MDPI and/or the editor(s). MDPI and/or the editor(s) disclaim responsibility for any injury to people or property resulting from any ideas, methods, instructions or products referred to in the content.

