Article

Investigation of the Applicability of Acoustic Emission Signals for Adaptive Control in CNC Wood Milling

1
Department of Manufacturing Technology and Quality Management, Faculty of Technology, Technical University in Zvolen, Študentská 26, 960 01 Zvolen, Slovakia
2
Department of Manufacturing and Automation Technology, Faculty of Technology, Technical University in Zvolen, Študentská 26, 960 01 Zvolen, Slovakia
3
Institute of Machine and Industrial Design, Faculty of Mechanical Engineering, Brno University of Technology, Technická 2, 61669 Brno, Czech Republic
4
Department of Environmental Engineering, Faculty of Ecology and Environmental Sciences, Technical University in Zvolen, T. G. Masaryka 24, 960 01 Zvolen, Slovakia
*
Author to whom correspondence should be addressed.
Appl. Sci. 2025, 15(12), 6659; https://doi.org/10.3390/app15126659
Submission received: 13 May 2025 / Revised: 2 June 2025 / Accepted: 11 June 2025 / Published: 13 June 2025
(This article belongs to the Section Mechanical Engineering)

Abstract

The integration of acoustic emission (AE) signals into adaptive control systems for CNC wood milling represents a promising advancement in intelligent manufacturing. This study investigated the feasibility of using AE signals for the real-time monitoring and control of CNC milling processes, focusing on medium-density fiberboard (MDF) as the workpiece material. AE signals were captured using dual-channel sensors during side milling on a five-axis CNC machine, and their characteristics were analyzed across varying spindle speeds and feed rates. The results showed that AE signals were sensitive to changes in machining parameters, with higher spindle speeds and feed rates producing increased signal amplitudes and distinct frequency peaks, indicating enhanced cutting efficiency. The statistical analysis confirmed a significant relationship between AE signal magnitude and cutting conditions. However, limitations related to material variability, sensor configuration, and the narrow range of process parameters restrict the broader applicability of the findings. Despite these constraints, the results support the use of AE signals for adaptive control in wood milling, offering potential benefits such as improved machining efficiency, extended tool life, and predictive maintenance capabilities. Future research should address signal variability, tool wear, and sensor integration to enhance the reliability of AE-based control systems in industrial applications.

1. Introduction

Computer Numerical Control (CNC) technology has fundamentally transformed the woodworking industry, enabling unprecedented levels of precision, efficiency, and versatility [1,2,3]. CNC systems use computer software to control the movement of tools, automating tasks that were once performed manually. This technology has expanded the capabilities of woodworking machinery, enhancing the production of complex, customized, and high-precision components with minimal human intervention. The integration of CNC machines in woodworking has led to increased productivity, improved consistency, and reduced production times, all of which have significant economic implications for manufacturers.
The performance of CNC machines heavily depends on the interaction between the machining process and the machine tool. Variations in cutting conditions, tool wear, and material properties can lead to suboptimal machining performance, reduced tool life, and decreased part quality. To address these challenges, adaptive control systems (ACSs) have been developed to optimize CNC machining processes by dynamically adjusting control parameters in real time, ensuring consistent quality, efficiency, and reliability [4]. ACSs for CNC machining are designed to adjust the machining process parameters—such as feed rate, spindle speed, or depth of cut—during operation, based on feedback from sensors and process measurements. This adaptive capability is critical in compensating for unpredictable variations in the machining environment, such as changes in material hardness, cutting tool wear, or machine dynamics. The goal is to optimize cutting conditions in real time to maintain the desired machining performance while avoiding problems such as excessive tool wear, chatter, or part defects. One of the core concepts behind adaptive control in CNC machining is the use of feedback control loops [5]. In a typical ACS setup, sensors monitor variables such as cutting force, spindle load, or tool vibration. These variables provide real-time data that the adaptive control system uses to adjust the machining parameters dynamically. For example, if the system detects an increase in cutting force, indicating potential tool wear or an impending failure, it may reduce the feed rate or adjust the spindle speed to reduce the load on the tool and improve the overall machining efficiency [6]. In the field of CNC metal machining, ACSs have been traditionally used for applications such as feed rate adjustment [7,8,9] or tool condition monitoring [10,11,12,13,14,15]. Unlike metal machining, due to the inherent complexity of the wood material, including its heterogeneity, varying density, and moisture content, wood-based material machining presents unique challenges in achieving consistent machining results. In addition to material variability, traditional machining parameters such as feed rate, cutting speed, and depth of cut must be finely tuned to avoid issues like tool wear, surface defects, and dimensional inaccuracies. These factors highlight the need for adaptive control systems that can dynamically adjust machining parameters in real time, responding to fluctuations in material properties or cutting conditions.
Several approaches have been proposed that accomplish the monitoring of the CNC wood-based material machining process through cutting force [16,17,18], temperature [19,20,21], motor spindle power [22,23,24], vibration [25,26,27], airborne sound [28,29,30,31], and acoustic emission signals [32,33,34,35]. Furthermore, several studies have investigated the potential of multisensory systems to improve process monitoring during wood machining. However, there are some contradictory results in the literature regarding the integration of acoustic emission (AE) signals as a reliable input for adaptive control systems in CNC wood machining [36,37,38].
Acoustic emission (AE) encompasses phenomena in which a sudden release of energy at specific sites within a material produces brief elastic waves which can themselves trigger further transient waves [39]. The ability of AE to detect and characterize dynamic events occurring during machining makes it an ideal signal for adaptive control in CNC wood machining process. This makes AE particularly valuable for detecting early signs of tool wear or changes in cutting conditions that would otherwise go unnoticed by other monitoring techniques. Recorded AE signals are characterized by four basic parameters—average frequency, peak amplitude, rise time, and ring-down count—which in turn depend on the sensor’s frequency response and damping, the propagation medium, the structure’s frequency response, amplifier gain, voltage threshold, and overall sensor sensitivity [40]. Furthermore, both how and where AE sensors are installed critically influence the effectiveness of the monitoring technique [41].
Several studies have demonstrated the effectiveness of AE in CNC wood machining, particularly for monitoring tool condition and optimizing cutting parameters. Aguilera et al. [33] evaluated and quantified the surface quality and cutting energy consumption in radiata pine while varying the slope of the grain. They also quantified the relationship between surface roughness and acoustic emission under different cutting conditions. Nasir and Cool [42] developed an intelligent framework for airborne dust monitoring using AE sensors during the circular sawing process of Douglas-fir wood. Zhuo et al. [43] reviewed developments in the field of online monitoring of saw surface quality, sawing vibration, and saw blade conditions, as well as their application in automation control technology using AE monitoring. Derbas et al. [38] introduced a sensor-fusion strategy that combines airborne sound, cutting force, power consumption, and AE data during the milling of various wood-based materials, aiming to precisely predict workpiece properties such as wood density for strength grading and surface roughness to detect tool wear or suboptimal machining conditions.
On the contrary, Wilkowski and Górski [31] investigated the potential usefulness of vibro-acoustic signals for the indirect assessment of the geometrical and technological indicators of tool wear during laminated chipboard milling. They reported that the AE signal, measured by a contact sensor attached to the workpiece, was found to be completely useless as a source of information about any aspect of the tool wear problem. Furthermore, Górski et al. [32] evaluated vibro-acoustic signals for tool wear monitoring using a multiple regression technique in compreg milling. They found that AE signals were wholly inadequate for sensing tool wear.
Despite its potential, the use of AE in adaptive control systems for CNC wood milling presents several challenges. One of the primary challenges lies in the interpretation of AE signals, which can be influenced by a wide range of factors, including the type of material being machined, cutting tool geometry, machining parameters, and even environmental factors such as temperature and vibration. As a result, extracting meaningful information from AE signals requires sophisticated signal processing techniques, such as wavelet analysis, Fourier transforms, and machine learning algorithms. These techniques are essential for identifying patterns and distinguishing between different sources of acoustic emissions, enabling accurate real-time predictions of machining events. Another challenge is the integration of AE-based signals with existing CNC control systems. While AE sensors provide valuable data, they must be seamlessly integrated into adaptive control algorithms to influence the machine’s decision-making process. This requires the development of robust control strategies that can process AE signals, extract relevant information, and adjust machining parameters accordingly. Moreover, the adaptive control system must be capable of responding to real-time changes in machining conditions without compromising the stability and performance of the CNC machine. To address these gaps, the main contributions of this study are as follows:
  • The investigation of AE signal characteristics during the CNC milling of wood-based materials under varying machining conditions;
  • The evaluation of the feasibility of using AE signals for adaptive control by linking AE features to critical machining variables;
  • The identification of challenges and limitations associated with AE-based monitoring, including signal variability due to material heterogeneity and environmental influences.
The aim of this study is to investigate the use of acoustic emission (AE) signals for adaptive control in the CNC wood-based-material milling process. By analyzing the relationship between AE signal characteristics and machining variables, this research seeks to enhance the ability of CNC systems to respond to changing conditions in real time, improving overall machining performance and product quality. Additionally, the study will address the challenges associated with signal variability, including material differences and the influence of environmental factors, which can affect the accuracy of AE-based monitoring systems.
The novelty of this study lies in the application of acoustic emission (AE) signals for real-time adaptive control in CNC wood-based-material milling—an area where limited research exists and where AE integration remains controversial. Unlike previous studies, this work systematically investigates the correlation between AE signal features and machining parameters in wood materials.

2. Materials and Methods

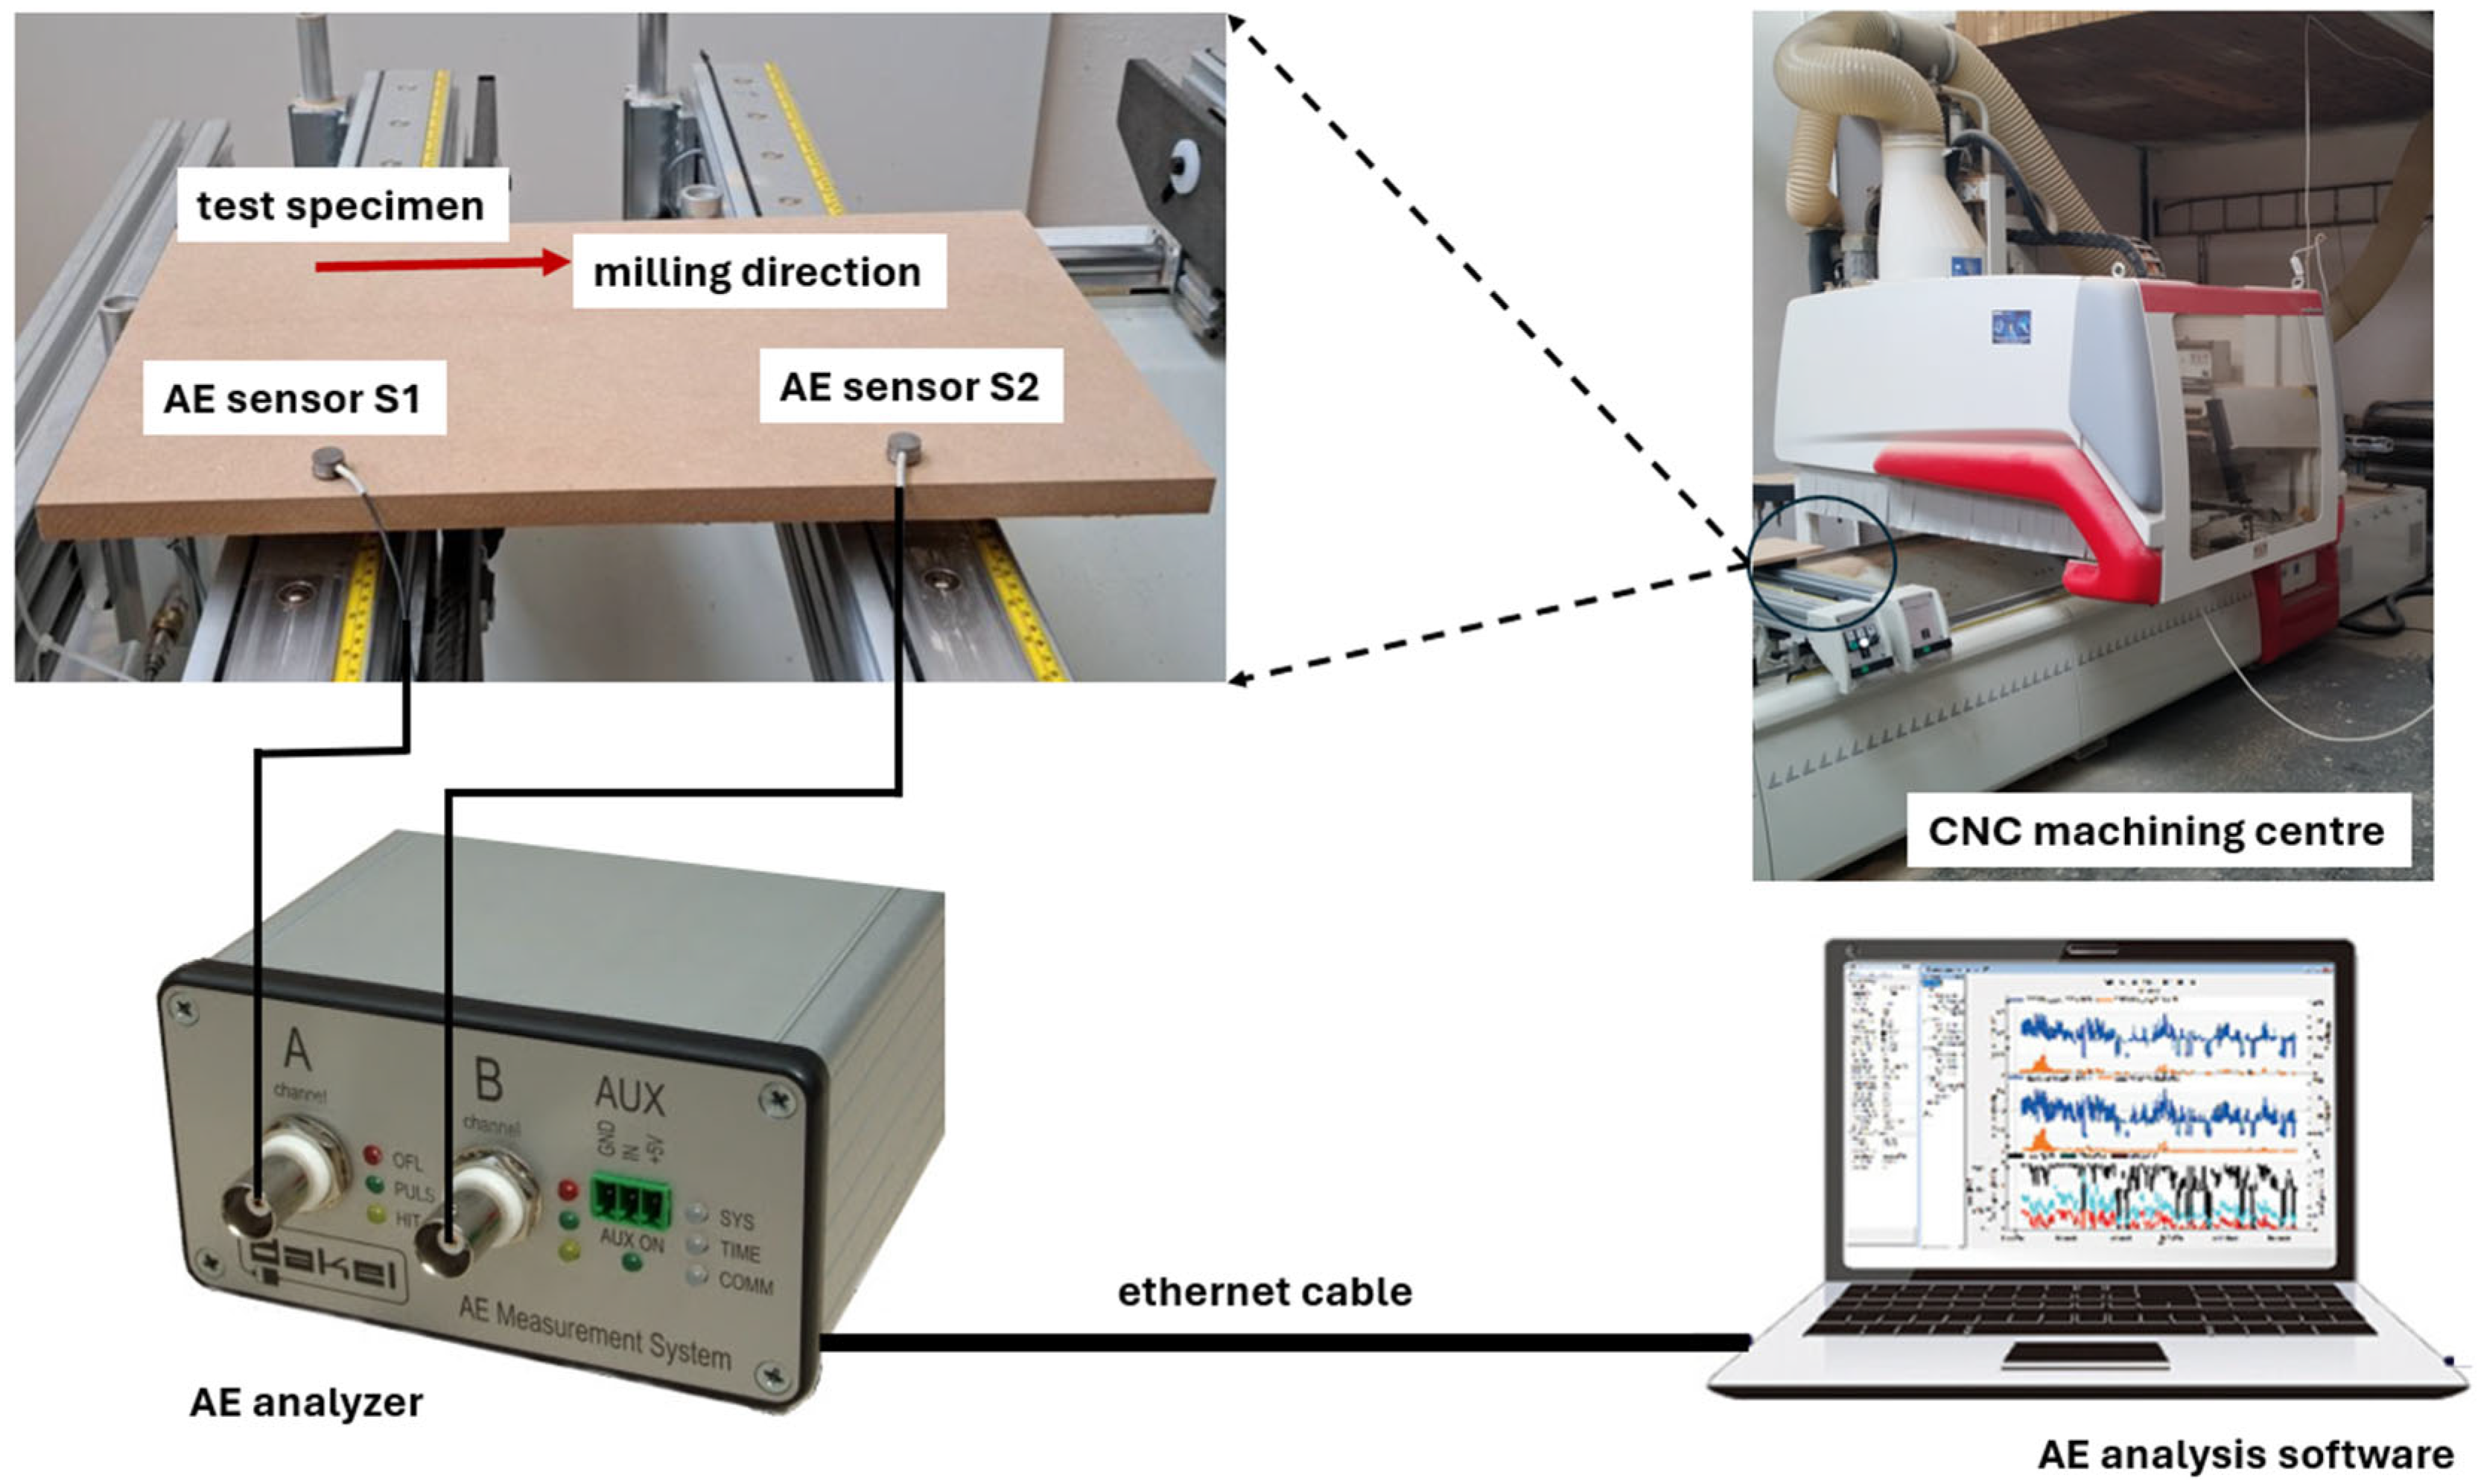
2.1. Experimental Setup

The schematic diagram of the experimental setup is presented in Figure 1. The experiments were conducted on a 5-axis CNC machining center (SCM Tech Z5, SCM Group, Rimini, Italy) with an 11 kW spindle power and a maximum rotational frequency of 20,000 rpm. AE measurements were performed using a dual-channel analyzer DAKEL-ZEDO (DAKEL-ZEDO 22, ZD Rpety-DAKEL, Hořovice, Czech Republic) during side milling of medium-density fiberboard. In side milling, the milling cutter rotates and moves along the side of the workpiece, removing material from its edges. The workpiece was fixed using four pneumatic clamping units, each providing a contact area of 120 × 120 mm and exerting a clamping pressure of 16 kg/m2. Two AE sensors with internal 35 dB preamplifiers (DAKEL IDK 14AS, ZD Rpety-DAKEL, Hořovice, Czech Republic) were attached to the surface of the specimen using adhesive. The Software ZEDO-Daemon 1.1.0.515 (ZD Rpety-DAKEL, Hořovice, Czech Republic) was used for data processing and visualization.

2.2. Test Specimens

Commercially available medium-density fiberboard (MDF) panels (Kronospan Ltd., Zvolen, Slovakia) were cut into specimens with dimensions of 500 mm × 300 mm × 18 mm (length × width × thickness). The selected technical characteristics of the MDF are shown in Table 1. The manufacturer declares that the material complies with the EN 316 [44] and EN 622-5 standards [45], as well as emission class E1 (EN ISO 12460-5) [46].

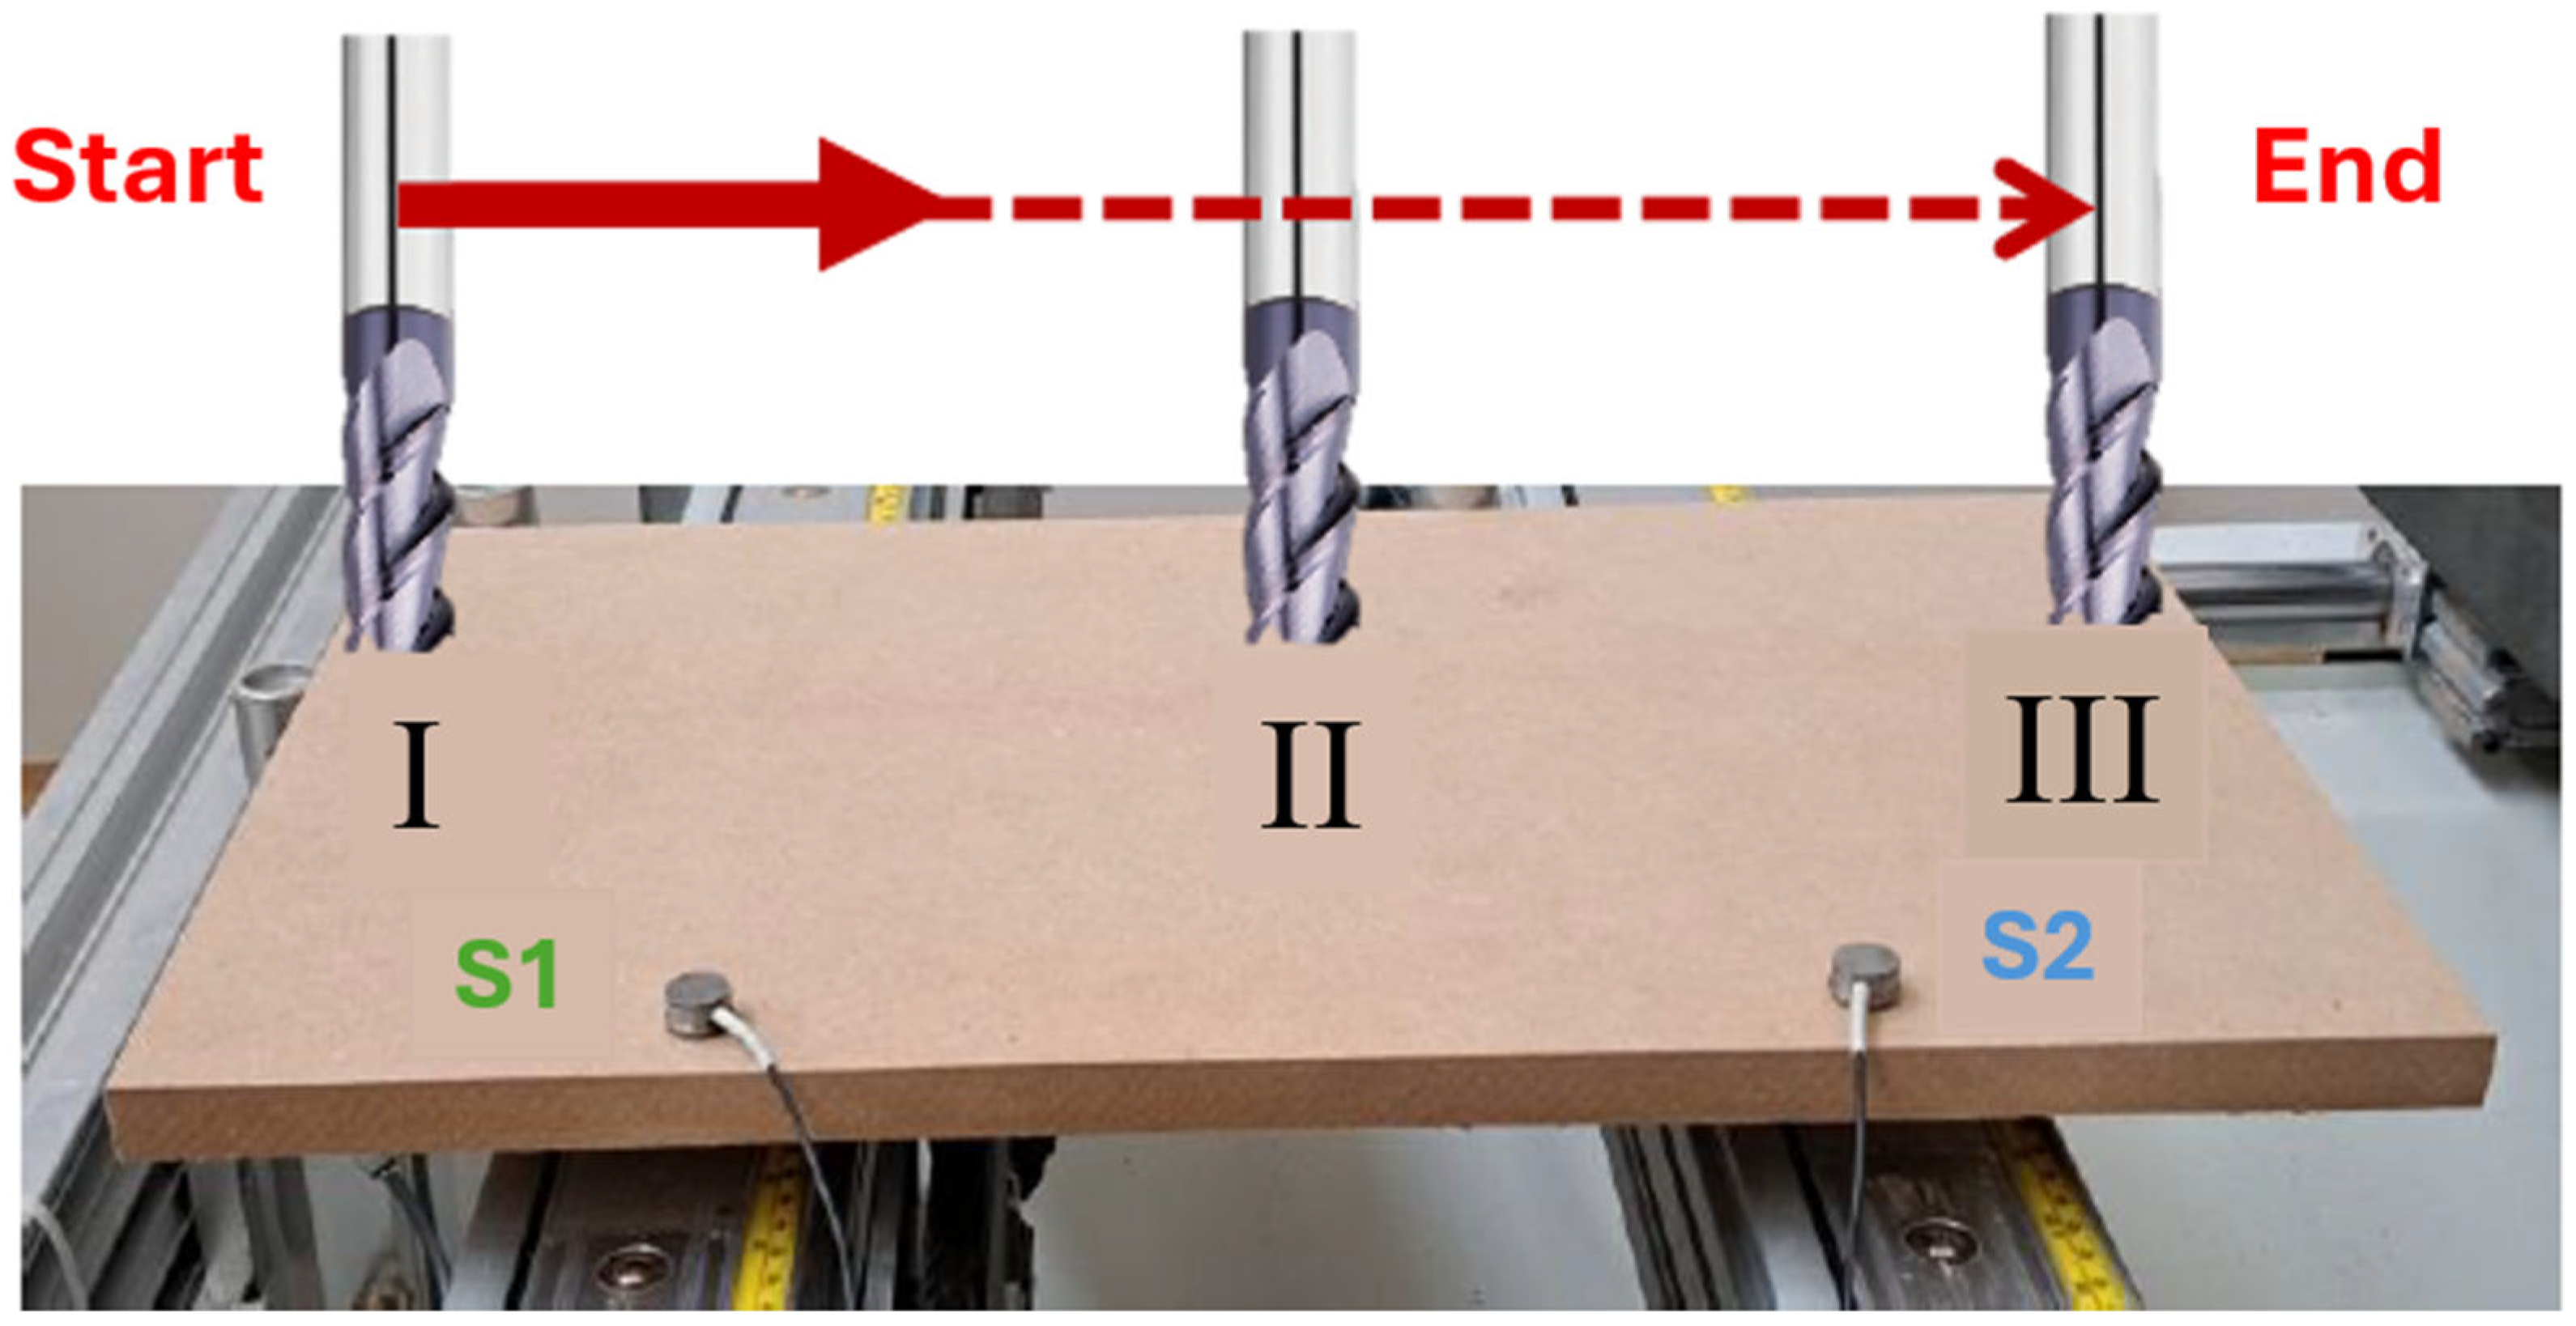
2.3. Cutting Conditions
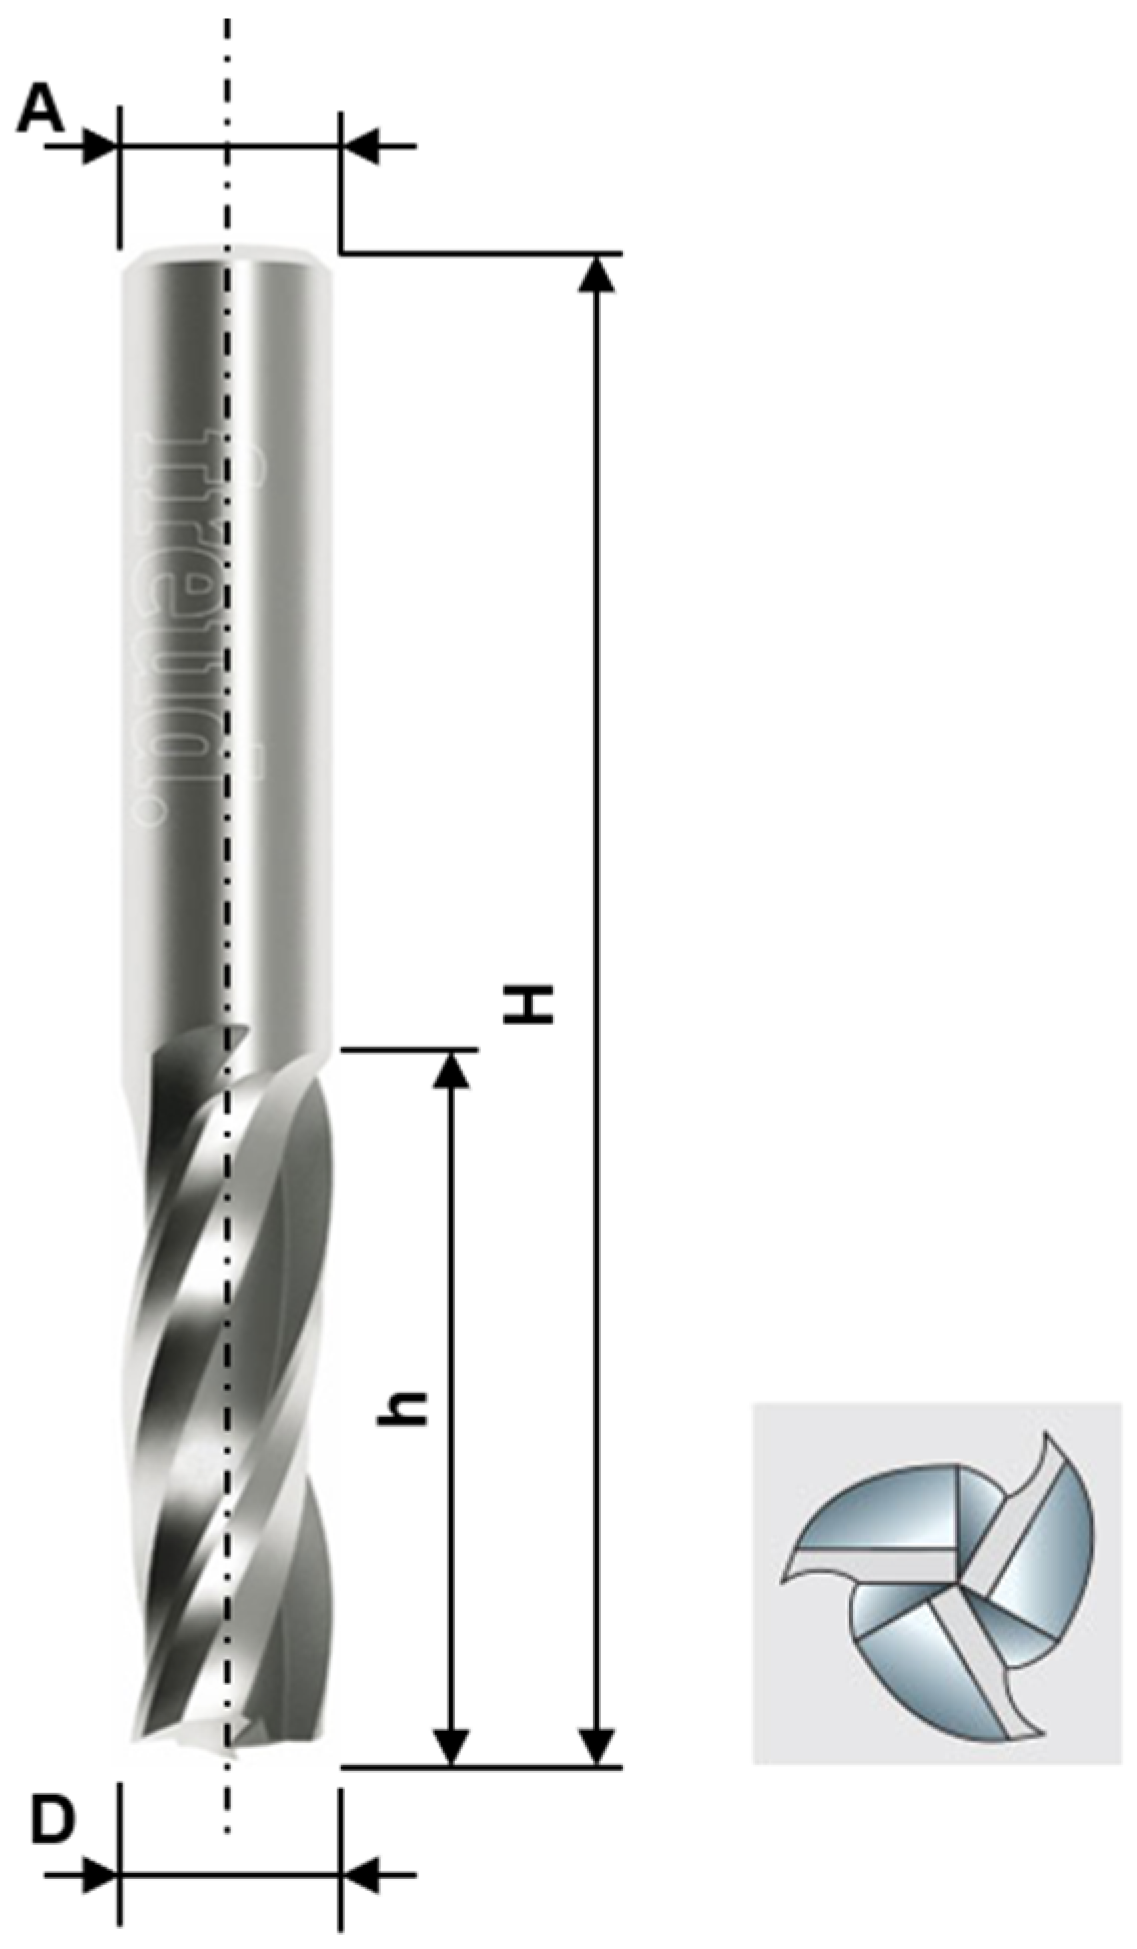
During the experiment, cutting parameters such as feed speed and spindle rotation were varied (see Table 2), whereas both the radial and axial depths of cut were held constant at 5 mm and 18 mm, respectively.

2.4. Cutting Tool

To mill the test specimens, the finishing upcut solid carbide cutter with three right-hand cutting edges (SCH3UFN284R, freud S.p.A., Pavia di Udine, Italy) was used. The tool parameters are shown in Figure 2 and Table 3, respectively.

2.5. AE Sensors Calibration

To verify the accuracy of AE acquisition, a pencil-lead-breaking experiment was conducted prior to the milling process. After the sensors were connected, calibration was performed, including the so-called “in situ” verification using a pen-test (ink breaking), which generated a sharp AE pulse with all frequencies equally represented up to about 10 MHz. The installation of both sensors complied with the requirements of EN 14584 [47], which specifies that the deviation of the mean amplitude value of the six signals on each sensor must be within ±3 dB from the mean value of both sensors. An example of the signal response to a pen-test between sensors located 250 mm apart is shown in Figure 3. It is evident that the breakage of stiffness near one transducer was also reflected in the other transducer, with an approximately tenfold drop in amplitude, corresponding to a 20 dB decrease.

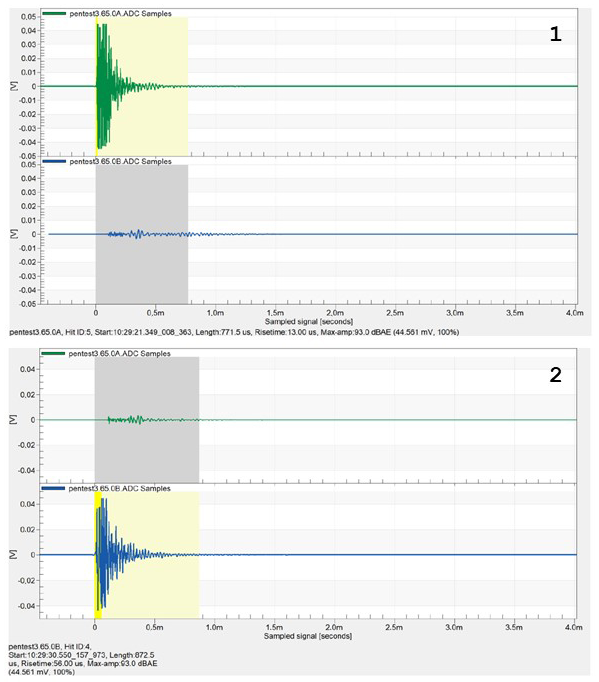
2.6. AE Signal Analysis

The sequence used in this study for the signal processing of AE was as follows: the AE signal was received from both sensors fixed to the test specimen. The signal was fully recorded with a sampling frequency of 8 MHz for each cut of the test. Then, a hit detector called the post-processing hit detector was created, which was then applied to the recorded signal for the entire test (offline, after the end of the actual test). We took each 20 ms of the signal and applied Fast Fourier Transform (FFT) on it to transform the signal from the time domain to the frequency domain. It was found that every change in cutting conditions generates distinct AE signal shapes (within a single revolution). This makes it possible, for example, to track the number of actively engaged cutting edges when machining with a particular tool. In turn, this allows for evaluating the “quality” of the cut and the degree of tool wear as a function of the cutting conditions. Then we identified the dominant frequency of each part of the signal. We applied a similar sequence of actions for the analysis of the AE signal that was received from both sensors fixed to the wood-based material. Many AE parameters were also extracted, but we chose to present just the RMS, the envelope of the signal (MAX_sig) in correlation with different cutting conditions, since MAX_sig is the most-used AE parameter according to the literature.
Figure 4 shows an example of a 20-millisecond signal sample from both sensors, taken midway through the milling period. From this, the number of temporally separated “sprinkles” of AE hits can be observed. These hits are regularly repeated and exhibit very good repeatability. It is clear from the record that this is not a typical continuous signal (i.e., a slowly changing noise-like signal), but rather distinct, short-term, time-separated bursts of signal—so-called AE hits—corresponding to individual events in the AE source. These segments of the signal were extracted during evaluation and assessed separately. From this, the number of temporally discrete bursts of AE hits can be identified (indicated by red ellipses, which correspond to the number of cutting edges actively engaged during the milling process).
For clarity, the signals from sensors S1 (channel A) and S2 (channel B) are color-coded within a fixed amplitude range (±30 mV) and evaluated in three time phases for detailed signal analysis: Phase I (beginning and entering the cut), Phase II (halfway through the cutting time, when the tool is centered between the sensors), and Phase III (ending and exiting the cut), as shown in Figure 5.

2.7. Data Analysis

The data were analyzed by STATISTICA (StatSoft Inc., Tulsa, OK, USA, ver. 12). The statistical significance was set at p < 0.05.

3. Results

The response of the AE signal (envelope) to the MDF milling process under each cutting condition is shown in Figure 6.
As shown in Figure 7, at the maximum speed (20,000 RPM) and maximum feed rate (12 m.min−1), there was only one significant increase in the signal (package). Reducing the feed rate by half had no substantial effect on the character of the signal. For better orientation, markers were placed on the logs to indicate the significant influence of the cutting edge on the machining process (red circle) and weak or negligible influence (red cross).
However, when the speed was halved to 10,000 RPM, and regardless of whether the feed remained the same or was reduced to 6 m.min−1, the cutter clearly engaged all the cutting edges with a single dominant package—see Figure 8.
The statistical analysis aimed to evaluate whether the experimental cutting conditions labeled A, B, C, and D in Table 4 significantly influenced the measured AE signals during the CNC milling process. Each cutting condition was repeated six times, providing a sufficient sample size for a robust statistical evaluation.
Table 4 shows that the individual experimental cutting conditions were conducted at different CNC tool speeds. Consequently, the AE signal data were normalized and referenced to a standard of one revolution per cut. Table 5 presents a comparison of the selected descriptive statistical parameters of the AE signal values, both for the original measurements and for the normalized values.
To determine the appropriate statistical methods, the normality of data within each cutting condition was first tested using the Shapiro–Wilk test. All four experimental conditions yielded p-values ≤ 0.050, indicating a statistically significant deviation from normality. Therefore, the Kruskal–Wallis H test was used to determine significant differences among the experimental cutting conditions. Subsequent analysis was based solely on normalized data to maintain objectivity in result evaluation.
The Kruskal–Wallis test produced an H statistic (4; 184,939) of 5671.651 and a p-value < 0.001, indicating that at least one experimental cutting condition differs significantly from the others in terms of the median AE signal value. Thus, a post hoc Dunn’s test was conducted to identify specific group differences while controlling for multiple comparisons. The results are presented in Table 6.
The data shown in Table 6 were corrected used a Bonferroni correction for multiple testing. The pairwise tests showed that cutting condition A differed significantly from both B (Bonferroni-adjusted p < 0.0001) and D (Bonferroni-adjusted p < 0.0001), but not from C (Bonferroni-adjusted p = 1.0000). Condition B likewise differed from C (Bonferroni-adjusted p < 0.0001) and from D (Bonferroni-adjusted p < 0.0001), and condition C differed from D (Bonferroni-adjusted p < 0.0001). Thus, five of the six possible comparisons reached statistical significance after adjustment: A vs. B, A vs. D, B vs. C, B vs. D, and C vs. D. Only A vs. C remained non-significant. These results demonstrate that condition B yields values significantly higher than A and D, and that condition C is statistically indistinguishable from A but significantly lower than B and D. Such a pattern suggests a graded effect across conditions, with C overlapping A, but B and D forming distinct extremes.
In addition, normalized AE signal data as calculated averages and sums of each cutting condition and measurement were analyzed (see Table 5). Prior to hypothesis testing, the homogeneity of variance across groups was confirmed via Levene’s test for both variables (average: W = 0.12, p = 0.95; sum: W = 0.06, p = 0.98), satisfying the ANOVA assumption of equal variances.
A one-way ANOVA demonstrated a significant effect of the cutting condition on AE average values (F = 11.470, p < 0.001). Subsequent pairwise comparisons using Tukey’s honestly significant difference (HSD) procedure revealed that the average value under cutting condition A was significantly higher than that under B (p = 0.008) and D (p = 0.002), while condition B exceeded C (p = 0.005) and C was lower than D (p = 0.001). No significant differences were observed between A and C or between the B and D cutting conditions. Figure 9 shows that these pairs with the same feed speed parameter produced comparable average measurements.
The analysis of sum values likewise yielded a highly significant main effect (F = 6050.136, p < 0.0001). Tukey HSD tests showed that cutting conditions A and B differed markedly (p < 0.001), as did A vs. D (p < 0.001), B vs. C (p < 0.001), and C vs. D (p < 0.001), respectively. Again, comparisons between A and C and between B and D did not reach significance (see Figure 10).

4. Discussion

The integration of AE signals into adaptive control systems for CNC wood milling represents a significant advancement in machining technology. This study aimed to investigate the applicability of AE signals for real-time monitoring and adaptive control in CNC wood milling processes. The findings provide valuable insights into the potential of AE-based monitoring systems to enhance machining efficiency, tool life, and product quality.
AE signals are generated by the rapid release of energy from localized sources within a material, such as micro-fractures or dislocations. In the context of CNC wood milling, these signals can provide real-time information about the machining process, including tool condition, material behavior, and cutting dynamics. This study demonstrated that AE signals are sensitive to variations in cutting parameters, such as feed rate and spindle speed, and can effectively reflect changes in the machining environment. The experimental setup, utilizing a five-axis CNC machining center and dual-channel AE sensors, allowed for the collection of high-frequency AE data during side milling of medium-density fiberboard (MDF). The analysis of AE signal characteristics, including root mean square (RMS) values and signal envelope (MAX_sig), revealed distinct patterns corresponding to different cutting conditions. These findings align with previous research [33,38,42,43] indicating the potential of AE signals to monitor machining processes in real-time. The complexity and non-stationary nature of AE signals necessitate advanced signal processing techniques for effective analysis. In this study, Fast Fourier Transform (FFT) was applied to transform AE signals from the time domain to the frequency domain. This approach facilitated the identification of dominant frequencies and allowed for the assessment of tool engagement and cutting efficiency.
The results indicated that variations in cutting conditions, such as changes in spindle speed and feed rate, significantly influenced the frequency characteristics of AE signals. For instance, at higher spindle speeds and feed rates, the AE signals exhibited increased amplitudes and distinct frequency peaks, suggesting enhanced tool engagement and material removal rates. Conversely, at lower cutting parameters, the AE signals displayed reduced amplitudes and broader frequency distributions, indicating decreased cutting efficiency. These observations are consistent with findings from other studies that have utilized AE signals to monitor cutting forces and tool wear in machining processes [48,49,50,51,52,53]. The ability of AE signals to capture dynamic changes in the machining environment underscores their potential as a reliable input for adaptive control systems.
The present study demonstrates that AE signals (specifically RMS) capture meaningful differences in CNC wood-milling regimes and therefore hold promise for adaptive process control. The statistical analysis revealed a highly significant overall effect of cutting conditions on AE signal magnitude, confirming that spindle speed and feed rate produce a distinct AE response. The non-significant comparison occurred between the cutting conditions using the same feed rate, indicating that their AE responses were similar. In practice, this means that an adaptive controller for CNC wood milling using RMS thresholds can reliably detect transitions across different spindle speeds but may require additional features or multivariate criteria to distinguish conditions, especially at lower feed rates. Increasing the feed rate from 6 m·min−1 to 12 m·min−1 resulted in a roughly 3.1 dB rise in the RMS value (from approximately 65.5 dB to 68.6 dB in the original data) and a corresponding increase in envelope (MAX_sig) amplitude. This increase suggests that doubling the feed rate increases the instantaneous chip load per tooth, producing more energetic fiber-fracture events and therefore higher AE energy per revolution. By contrast, when the spindle speed was doubled from 10,000 rpm to 20,000 rpm at a constant feed of 6 m·min−1, the RMS remained essentially unchanged. Thus, across mechanistic, fracture-dynamics, and statistical viewpoints, feed rate unequivocally governs AE signal amplitude in MDF milling, whereas spindle speed changes primarily affect cumulative energy through revolution count without significantly altering per-revolution AE intensity. In line with Mian et al. [54], this suggests that for two cutting conditions with an identical feed rate, the chip thickness imparted to each cutting edge remains constant, thereby yielding equivalent material removal per tooth engagement. Because AE energy originates predominantly from brittle fiber-fracture events whose magnitude scales with chip thickness, the per-revolution energy release is invariant for a given feed rate. Although increasing spindle speed reduces chip thickness per tooth, it simultaneously increases the tooth-pass frequency so that the total number of fracture events per revolution remains unchanged. Consequently, when AE metrics are normalized on a per-revolution basis, both the RMS amplitude and envelope maxima exhibit statistically indistinguishable values for any runs conducted at the same feed rate, irrespective of spindle speed.
While the current study offers valuable insights into the applicability of acoustic emission (AE) signals for adaptive control in CNC wood milling, it is important to critically assess its limitations. Recognizing these shortcomings not only contextualizes the results but also provides a foundation for refining future experimental designs and improving system integration in industrial settings. The following subsection identifies and discusses key experimental limitations across various dimensions of the study, including material and tool variability, sensor configuration, signal processing, environmental control, and the limitations inherent in generalizing the findings to industrial-scale adaptive control systems.
A significant limitation of this experiment lies in the choice and uniformity of the workpiece material—commercially available MDF. While MDF offers a relatively consistent internal structure compared to natural wood, it remains a composite material with inherent density and structural variability due to fiber orientation, resin distribution, and moisture content fluctuations. The material property table (Table 1) suggests a ±7% variability in density, which may introduce inconsistencies in AE signal behavior independent of cutting parameters. Additionally, the use of a single material type (MDF) restricts the generalizability of the results. Wood, as a biologically heterogeneous material, presents a wide range of responses in AE activity based on species, grain orientation, moisture content, and resin content. The experimental results from MDF milling may not directly extrapolate to other wood-based materials like solid wood, plywood, or oriented strand board (OSB). Consequently, the potential of AE signals for adaptive control in a broader context remains insufficiently tested. Another experimental limitation is the lack of the explicit characterization or variation of cutting tool geometries and conditions. Although it is mentioned that tool engagement influences the AE signal, the study does not systematically account for tool wear or blade integrity across repeated cuts. AE signals are known to be highly sensitive to changes in tool sharpness, edge chipping, and coating degradation. Without quantifying tool wear or employing worn versus new tools for comparative analysis, it is difficult to determine whether observed variations in AE amplitude and frequency distributions stem from machining parameters or a gradual degradation in the cutting edge. This oversight limits the interpretation of AE data as a reliable indicator of tool condition—one of the main promises of AE-based monitoring. Furthermore, the study did not investigate the effects of different tool materials (e.g., carbide, high-speed steel) or geometries (e.g., helix angle, rake angle) on AE signal response. The omission of these variables restricts the robustness and scope of the results, particularly for applications requiring a high customization of tool profiles in wood machining. The experiment was conducted using only four combinations of spindle speed and feed rate. While these settings do cover basic high and low operational extremes, the narrow range of cutting conditions constrains the ability to fully characterize the relationship between AE parameters and process dynamics. Real-world milling operations may involve more aggressive or varied conditions, including deeper cuts, interrupted cuts, or variable depth profiles across complex geometries. Although the study adhered to the EN 14584 standard for AE sensor calibration, sensor placement and configuration remain potential sources of limitation. The AE sensors were attached directly to the MDF surface using adhesive, which may alter the propagation path of acoustic waves and introduce damping or signal distortion. The adhesive interface and variability in sensor contact pressure could affect signal fidelity, particularly for high-frequency components. External environmental factors such as ambient temperature, humidity, and background vibration can significantly influence AE signal detection and interpretation. The dynamic behavior of the CNC machine itself—vibrations from spindle bearings, servo motors, or machine bed resonance—could introduce extraneous AE signals or interfere with the true acoustic signature of the cutting process. These machine-generated noises may be indistinguishable from material-related AE unless careful baseline measurements and filtering are applied. Although numerous AE parameters can be extracted from raw signals (e.g., count rate, rise time, duration, energy, frequency centroid), the study focused primarily on RMS and MAX_sig (signal envelope). While MAX_sig is frequently used in the literature, this reductionist approach may oversimplify the rich information content of AE signals.
The findings of this study have significant implications for the development of adaptive control systems in CNC wood milling. By incorporating AE signals into ACS, it is possible to dynamically adjust machining parameters, such as feed rate and spindle speed, in response to real-time changes in the machining environment. This adaptability can lead to improved machining efficiency, extended tool life, and enhanced product quality. Furthermore, the integration of AE-based monitoring systems can facilitate predictive maintenance strategies by identifying early signs of tool wear or process anomalies. This proactive approach can reduce unplanned downtime and maintenance costs, contributing to more sustainable and cost-effective manufacturing practices.

5. Conclusions

The aim of the present study was to assess the feasibility of utilizing acoustic emission (AE) signals as the primary feedback mechanism for adaptive control in the CNC milling of medium-density fiberboard (MDF). Four distinct cutting scenarios were investigated, combining two spindle speeds (10,000 rpm and 20,000 rpm) with two feed rates (6 m·min−1 and 12 m·min−1). Dual-sensor AE data were acquired during each milling pass, and time-domain root-mean-square (RMS) values as well as envelope maxima (MAX_sig) were computed. To eliminate the confounding effect of differing numbers of spindle revolutions per cut, AE metrics were normalized on a per-revolution basis. Comprehensive statistical analyses were employed to discern the influence of cutting parameters on AE characteristics.
This study establishes that acoustic emission signals, particularly normalized time-domain RMS and envelope metrics, serve as sensitive and reliable indicators of feed-related cutting forces in MDF milling, while remaining effectively invariant to moderate spindle speed changes. These characteristics render AE monitoring well suited for integration into adaptive control loops aimed at optimizing feed, extending tool life, and ensuring consistent surface quality. Therefore, AE-based monitoring systems can play a pivotal role in advancing smart manufacturing practices and achieving higher levels of automation and efficiency in the woodworking industry.
Future research should focus on addressing the challenges associated with the variability of AE signals and the integration of AE-based monitoring systems into existing CNC infrastructure. Developing standardized protocols for AE sensor calibration and signal processing can enhance the reliability and consistency of AE-based monitoring systems. Additionally, exploring the fusion of AE signals with other sensor data, such as vibration, temperature, and cutting force, can provide a more comprehensive understanding of the machining process. Machine learning algorithms and artificial intelligence techniques can be employed to analyze multi-sensor data and develop predictive models for adaptive control in CNC wood milling.

Author Contributions

Conceptualization, M.D. and P.K.; methodology, M.D. and F.V.; software, F.V.; validation, J.S.; formal analysis, P.K.; investigation, M.D. and F.V.; resources, P.K. and F.V.; data curation, F.V.; writing—original draft preparation, M.D. and J.S.; writing—review and editing, P.K. and F.V.; visualization, J.S.; supervision, F.V.; project administration, P.K.; funding acquisition, P.K. All authors have read and agreed to the published version of the manuscript.

Funding

This research was funded by the Slovak Research and Development Agency, Grant Number APVV-20-0403, for the FMA analysis of potential signals suitable for the adaptive control of nesting strategies for milling wood-based agglomerates.

Institutional Review Board Statement

Not applicable.

Informed Consent Statement

Not applicable.

Data Availability Statement

The data that support the findings of this study are available from the corresponding author, J.S., upon reasonable request.

Conflicts of Interest

The authors declare no conflicts of interest. The funders had no role in the design of the study; in the collection, analyses, or interpretation of data; in the writing of the manuscript; or in the decision to publish the results.

References

  1. Ouyang, Z.; Wu, Y.; Shao, H.; Wang, X.; Tao, T.; Chen, X.; Peng, T. Method for Drill-Bit Arrangement in CNC Woodworking Drilling Machine for Mass Customization. J. Manuf. Syst. 2025, 78, 200–212. [Google Scholar] [CrossRef]
  2. Adamčík, L.; Kminiak, R.; Banski, A. Comparison of the Roughness of the CNC Milled Surface of Selected Wood Species. Acta Fac. Xylologiae Zvolen 2024, 66, 61–74. [Google Scholar]
  3. Chen, C. Application of Support Vector Machine–Based CNC Machining in Furniture Product Visual Design and Production Control Process. Int. J. Adv. Manuf. Technol 2024, 1–9. [Google Scholar] [CrossRef]
  4. Kim, S.G.; Heo, E.Y.; Lee, H.G.; Kim, D.W.; Yoo, N.H.; Kim, T.H. Advanced Adaptive Feed Control for CNC Machining. Robot. Comput. Integr. Manuf. 2024, 85, 102621. [Google Scholar] [CrossRef]
  5. Li, Y.; Zhao, Z.; Wang, K.; Qian, N.; Fu, Y.; Cao, S. Active-Passive Hybrid Feed Rate Control Systems in CNC Machining: Mitigating Force Fluctuations and Enhancing Tool Life. J. Manuf. Syst. 2024, 77, 184–195. [Google Scholar] [CrossRef]
  6. Sousa, V.F.C.; Silva, F.J.G.; Fecheira, J.S.; Lopes, H.M.; Martinho, R.P.; Casais, R.B.; Ferreira, L.P. Cutting Forces Assessment in CNC Machining Processes: A Critical Review. Sensors 2020, 20, 4536. [Google Scholar] [CrossRef]
  7. Xie, J.; Zhao, P.; Hu, P.; Yin, Y.; Zhou, H.; Chen, J.; Yang, J. Multi-Objective Feed Rate Optimization of Three-Axis Rough Milling Based on Artificial Neural Network. Int. J. Adv. Manuf. Technol. 2021, 114, 1323–1339. [Google Scholar] [CrossRef]
  8. Xu, G.; Chen, J.; Zhou, H.; Yang, J.; Hu, P.; Dai, W. Multi-Objective Feedrate Optimization Method of End Milling Using the Internal Data of the CNC System. Int. J. Adv. Manuf. Technol. 2019, 101, 715–731. [Google Scholar] [CrossRef]
  9. Petráček, P.; Vlk, B.; Švéda, J. Linear Programming Feedrate Optimization. Int. J. Adv. Manuf. Technol. 2022, 120, 3625–3646. [Google Scholar] [CrossRef]
  10. Kasiviswanathan, S.; Gnanasekaran, S.; Thangamuthu, M.; Rakkiyannan, J. Machine-Learning- and Internet-of-Things-Driven Techniques for Monitoring Tool Wear in Machining Process: A Comprehensive Review. J. Sens. Actuator Netw. 2024, 13, 53. [Google Scholar] [CrossRef]
  11. Mohanraj, T.; Shankar, S.; Rajasekar, R.; Sakthivel, N.R.; Pramanik, A. Tool Condition Monitoring Techniques in Milling Process—A Review. J. Mater. Res. Technol. 2020, 9, 1032–1042. [Google Scholar] [CrossRef]
  12. Lazar, E.; Bennett, K.S.; Hurtado Carreon, A.; Veldhuis, S.C. An Automated Feature-Based Image Registration Strategy for Tool Condition Monitoring in CNC Machine Applications. Sensors 2024, 24, 7458. [Google Scholar] [CrossRef]
  13. Kotha Amarnath, S.; Inturi, V.; Rajasekharan, S.G.; Priyadarshini, A. Combining Sensor Fusion and a Machine Learning Framework for Accurate Tool Wear Prediction During Machining. Machines 2025, 13, 132. [Google Scholar] [CrossRef]
  14. Khadka, S.; Rahman Rashid, R.A.; Stephens, G.; Papageorgiou, A.; Navarro-Devia, J.; Hägglund, S.; Palanisamy, S. Predicting Cutting Tool Life: Models, Modelling, and Monitoring. Int. J. Adv. Manuf. Technol. 2025, 136, 3037–3076. [Google Scholar] [CrossRef]
  15. Pimenov, D.Y.; da Silva, L.R.R.; Ercetin, A.; Der, O.; Mikolajczyk, T.; Giasin, K. State-of-the-Art Review of Applications of Image Processing Techniques for Tool Condition Monitoring on Conventional Machining Processes. Int. J. Adv. Manuf. Technol. 2024, 130, 57–85. [Google Scholar] [CrossRef]
  16. Przybyś-Małaczek, A.; Antoniuk, I.; Szymanowski, K.; Kruk, M.; Kurek, J. Application of Machine Learning Algorithms for Tool Condition Monitoring in Milling Chipboard Process. Sensors 2023, 23, 5850. [Google Scholar] [CrossRef]
  17. Guo, X.; Wang, J.; Buck, D.; Zhu, Z.; Ekevad, M. Cutting Forces and Cutting Quality in the Up-Milling of Solid Wood Using Ceramic Cutting Tools. Int. J. Adv. Manuf. Technol. 2021, 114, 1575–1584. [Google Scholar] [CrossRef]
  18. Sörnmo, O.; Olofsson, B.; Robertsson, A.; Johansson, R. Learning Approach to Cycle-Time-Minimization of Wood Milling Using Adaptive Force Control. J. Manuf. Sci. Eng. 2015, 138, 011013. [Google Scholar] [CrossRef]
  19. Cao, K.; Han, J.; Xu, L.; Shi, T.; Liao, G.; Liu, Z. Real-Time Tool Condition Monitoring Method Based on in Situ Temperature Measurement and Artificial Neural Network in Turning. Front. Mech. Eng. 2022, 17, 5. [Google Scholar] [CrossRef]
  20. Saloni, D.E.; Lemaster, R.L.; Jackson, S.D. Process Monitoring Evaluation and Implementation for the Wood Abrasive Machining Process. Sensors 2010, 10, 10401–10412. [Google Scholar] [CrossRef]
  21. Kminiak, R.; Němec, M.; Igaz, R.; Gejdoš, M. Advisability-Selected Parameters of Woodworking with a CNC Machine as a Tool for Adaptive Control of the Cutting Process. Forests 2023, 14, 173. [Google Scholar] [CrossRef]
  22. Dong, W.; Xiong, X.; Ma, Y.; Yue, X. Woodworking Tool Wear Condition Monitoring during Milling Based on Power Signals and a Particle Swarm Optimization-Back Propagation Neural Network. Appl. Sci. 2021, 11, 9026. [Google Scholar] [CrossRef]
  23. Dong, W.; Guo, X.; Hu, Y.; Wang, J.; Tian, G. Discrete wavelet transformation and genetic algorithm—Back propagation neural network applied in monitoring woodworking tool wear conditions in the milling operation spindle power signals. BioResources 2021, 16, 2369–2384. [Google Scholar] [CrossRef]
  24. Zhu, Z.; Buck, D.; Guo, X.; Xiong, X.; Xu, W.; Cao, P. Energy Efficiency Optimization for Machining of Wood Plastic Composite. Machines 2022, 10, 104. [Google Scholar] [CrossRef]
  25. Nasir, V.; Cool, J. Intelligent Wood Machining Monitoring Using Vibration Signals Combined with Self-Organizing Maps for Automatic Feature Selection. Int. J. Adv. Manuf. Technol. 2020, 108, 1811–1825. [Google Scholar] [CrossRef]
  26. Apostolou, G.; Ntemi, M.; Paraschos, S.; Gialampoukidis, I.; Rizzi, A.; Vrochidis, S.; Kompatsiaris, I. Novel Framework for Quality Control in Vibration Monitoring of CNC Machining. Sensors 2024, 24, 307. [Google Scholar] [CrossRef] [PubMed]
  27. Hortobágyi, Á.; Koleda, P.; Koleda, P.; Kminiak, R. Effect of Milling Parameters on Amplitude Spectrum of Vibrations during Milling Materials Based on Wood. Appl. Sci. 2023, 13, 5061. [Google Scholar] [CrossRef]
  28. Li, G.; Shang, X.; Sun, L.; Fu, B.; Yang, L.; Zhou, H. Application of audible sound signals in tool wear monitoring: A review. J. Adv. Manuf. Sci. Technol. 2025, 5, 2025003. [Google Scholar] [CrossRef]
  29. Ahmed, M.; Kamal, K.; Ratlamwala, T.A.H.; Hussain, G.; Alqahtani, M.; Alkahtani, M.; Alatefi, M.; Alzabidi, A. Tool Health Monitoring of a Milling Process Using Acoustic Emissions and a ResNet Deep Learning Model. Sensors 2023, 23, 3084. [Google Scholar] [CrossRef]
  30. Derbas, M.; Frömel-Frybort, S.; Möhring, H.-C.; Riegler, M. Accelerated Singular Spectrum Analysis and Machine Learning to Investigate Wood Machining Acoustics. Mech. Syst. Signal Process. 2025, 223, 111879. [Google Scholar] [CrossRef]
  31. Wilkowski, J.; Górski, J. Vibro-acoustic signals as a source of information about tool wear during laminated chipboard milling. Wood Res. 2011, 56, 57–66. [Google Scholar]
  32. Górski, J.; Szymanowski, K.; Podziewski, P.; Śmietańska, K.; Czarniak, P.; Cyrankowski, M. Use of cutting force and vibro-acoustic signals in tool wear monitoring based on multiple regression technique for compreg milling. Bioresources 2019, 14, 3379–3388. [Google Scholar] [CrossRef]
  33. Aguilera, A.; Vega, M.; Méausoone, P.-J. Effects of Grain Angle on the Amplitudes of Acoustic Emission and Surface Roughness in Wood Machining. Wood Sci. Technol. 2007, 41, 373–381. [Google Scholar] [CrossRef]
  34. Iskra, P.; Hernández, R.E. Toward a Process Monitoring and Control of a CNC Wood Router: Development of an Adaptive Control System for Routing White Birch. Wood Fiber Sci. 2010, 46, 523–535. [Google Scholar]
  35. Chen, Y.; Tian, J.; Guo, X.; Na, B. Tool Condition Monitoring Strategies from Metal Cutting: Insights for Optimizing Wood-Based Material Processing. Eur. J. Wood Prod. 2025, 83, 46. [Google Scholar] [CrossRef]
  36. Aguilera, A.; Méausoone, P.J.; Rolleri, A.; Barros, J.L.; Burgos, F.; Aguilar, C. Advances on Indirect Methods to Evaluate Tool Wear for Radiata Pine Solid Wood Molding. Wear 2016, 350–351, 27–34. [Google Scholar] [CrossRef]
  37. Nasir, V.; Dibaji, S.; Alaswad, K.; Cool, J. Tool Wear Monitoring by Ensemble Learning and Sensor Fusion Using Power, Sound, Vibration, and AE Signals. Manuf. Lett. 2021, 30, 32–38. [Google Scholar] [CrossRef]
  38. Derbas, M.; Jaquemod, A.; Frömel-Frybort, S.; Güzel, K.; Moehring, H.-C.; Riegler, M. A Machine Learning Approach to Predict Properties of Wood Products During Milling. For. Prod. J. 2024, 74, 1–8. [Google Scholar] [CrossRef]
  39. ISO 12716:2001; Non-Destructive Testing—Acoustic Emission Inspection. ISO: Geneva, Switzerland, 2001. Available online: http://www.iso.org/standard/34090.html (accessed on 9 May 2025).
  40. Holford, K.M. Acoustic Emission–Basic Principles and Future Directions. Strain 2000, 36, 51–54. [Google Scholar] [CrossRef]
  41. Kishawy, H.A.; Hegab, H.; Umer, U.; Mohany, A. Application of Acoustic Emissions in Machining Processes: Analysis and Critical Review. Int. J. Adv. Manuf. Technol. 2018, 98, 1391–1407. [Google Scholar] [CrossRef]
  42. Nasir, V.; Cool, J. Characterization, Optimization, and Acoustic Emission Monitoring of Airborne Dust Emission during Wood Sawing. Int. J. Adv. Manuf. Technol. 2020, 109, 2365–2375. [Google Scholar] [CrossRef]
  43. Zhuo, R.; Deng, Z.; Chen, B.; Liu, G.; Bi, S. Overview on Development of Acoustic Emission Monitoring Technology in Sawing. Int. J. Adv. Manuf. Technol. 2021, 116, 1411–1427. [Google Scholar] [CrossRef]
  44. EN 316; Wood Fibre Boards. Definition, Classification and Symbols. CEN: Brussels, Belgium, 2009.
  45. EN 622-5; Fibreboards. Specifications. Part 5: Requirements for Dry Process Boards (MDF). CEN: Brussels, Belgium, 2009.
  46. EN ISO 12460-5; Wood-Based Panels. Determination of Formaldehyde Release. Part 5: Extraction Method (Called the Perforator Method). ISO: Geneva, Switzerland, 2015.
  47. EN 14584; Non-Destructive Testing. Acoustic Emission. Examination of Metallic Pressure Equipment During Proof Testing. Planar Location of AE Sources. CEN: Brussels, Belgium, 2013.
  48. Twardowski, P.; Tabaszewski, M.; Wiciak-Pikuła, M.; Felusiak-Czyryca, A. Identification of Tool Wear Using Acoustic Emission Signal and Machine Learning Methods. Precis. Eng. 2021, 72, 738–744. [Google Scholar] [CrossRef]
  49. Tien, D.H.; Thoa, P.T.T.; Duy, T.N. Application of Wavelet Ratio between Acoustic Emission and Cutting Force Signal Decomposing in Intelligent Monitoring of Cutting Tool Wear When Turning SKD 61. Int. J. Interact. Manuf. 2024, 18, 525–539. [Google Scholar] [CrossRef]
  50. Maia, L.H.A.; Abrão, A.M.; Vasconcelos, W.L.; Júnior, J.L.; Fernandes, G.H.N.; Machado, Á.R. Enhancing Machining Efficiency: Real-Time Monitoring of Tool Wear with Acoustic Emission and STFT Techniques. Lubricants 2024, 12, 380. [Google Scholar] [CrossRef]
  51. Uematsu, M.; Kato, K.; Watanabe, K.; Watanobe, T.; Natsu, W. Cutting Tool Monitoring Technology Using Wireless Acoustic Emission Sensor. Int. J. Autom. Technol. 2024, 18, 812–820. [Google Scholar] [CrossRef]
  52. Mathiyazhagan, V.; Meena, A. Predictive Modelling of Tool Wear in CFRP Drilling Using Acoustic Emission Sensors under Dry and Cryogenic Conditions. Wear 2025, 570, 205930. [Google Scholar] [CrossRef]
  53. Karabacak, Y.E. Intelligent Milling Tool Wear Estimation Based on Machine Learning Algorithms. J. Mech. Sci. Technol. 2024, 38, 835–850. [Google Scholar] [CrossRef]
  54. Mian, A.J.; Driver, N.; Mativenga, P.T. Estimation of Minimum Chip Thickness in Micro Milling Using Acoustic Emission. Proc. Inst. Mech. Eng. Part B J. Eng. Manuf. 2011, 225, 1535–1551. [Google Scholar] [CrossRef]
Figure 1. Experimental setup.
Applsci 15 06659 g001
Figure 2. Finishing cutter.
Applsci 15 06659 g002
Figure 3. Typical AE sensor signal response to pen-test: (1)—source at sensor S1 (green line), (2)—source at sensor S2 (blue line).
Applsci 15 06659 g003
Figure 4. Sample waveform during three rotations of the instrument, showing its individually separated signal packages (AE hits).
Applsci 15 06659 g004
Figure 5. Analyzed areas of the milled plate in detail.
Applsci 15 06659 g005
Figure 6. Comparison of the response of the AE signal to the MDF milling process under each cutting condition (rotation speed/feed rate): (A) 10,000 rpm/6 m.min−1, (B) 10,000 rpm/12 m.min−1, (C) 20,000 rpm/6 m.min−1, (D) 20,000 rpm/12 m.min−1.
Applsci 15 06659 g006
Figure 7. Records of individual milling stages (I-II-III)—detailed view for following cutting conditions (rotation speed/feed rate): (1) 20,000 rpm/12 m.min−1, (2) 20,000 rpm/6 m.min−1.
Applsci 15 06659 g007
Figure 8. Records of individual milling stages (I-II-III)—detailed view for following cutting conditions (rotation speed/feed rate): (1) 10,000 rpm/12 m.min−1, (2) 10,000 rpm/6 m.min−1.
Applsci 15 06659 g008
Figure 9. Box-plot comparing normalized AE signals for the investigated cutting conditions in terms of average values.
Applsci 15 06659 g009
Figure 10. Box-plot comparing normalized AE signals for investigated cutting conditions in terms of sum values.
Applsci 15 06659 g010
Table 1. Selected technical characteristics of the MDF test specimens.
Technical CharacteristicValue
Density750 kg·m−3 ± 7%
Swelling in thickness after 24 h≤12%
Bending strength≥20 N·mm−2
Modulus of elasticity in bending≥2200 N·mm−2
Internal bond≥0.55 N·mm−2
Moisture content4% ÷ 11%
Table 2. Cutting parameters of the milling experiment.
LabelingTool Revolution
(rev.min−1)
Feed Speed (m.min−1)
A10,0006
B10,00012
C20,0006
D20,00012
Table 3. Parameters of cutting tool.
ParameterValue
D (mm)20
h (mm)92
H (mm)170
A (mm)20
Number of cutting edges3
Maximal revolution (rev.min−1)25,000
Table 4. Labeling of cutting conditions and corresponding number of measurements for statistical analysis.
LabelingTool Revolution
(rev.min−1)
Feed Speed (m.min−1)Number of Revolutions per One CutNumber of Data
A10,0006833n = 61,324
B10,00012417n = 31,132
C20,00061667n = 61,326
D20,00012833n = 31,156
Table 5. Comparison of descriptive statistical parameters of AE signal values before and after normalization.
Cutting ConditionsMeasurementAE Signal
Original Data (dB)
AE Signal
Normalized Data (dB)
AverageSumSDAverageSumSD
A167.041684,220.0344.9780.079804.9770.006
265.116666,785.8275.6630.077784.4450.007
365.225666,469.9705.4290.077784.0300.006
465.391668,553.2605.4240.077786.5240.006
565.314667,901.8245.6020.077785.7440.007
665.407667,805.9555.3750.077785.6680.006
B169.621361,330.7514.6060.080416.7710.005
267.891351,810.0914.6300.078405.7920.005
367.836351,119.5274.7170.078404.9760.005
469.549361,097.6964.7270.080416.5110.005
567.967352,477.7984.9810.078406.5650.006
667.965353,824.2054.9330.078408.0810.006
C165.007664,633.7015.0160.076781.9320.006
265.077665,473.4234.9890.077782.9300.006
365.210666,571.5254.8850.077784.1690.006
466.778683,936.4624.8660.079804.6850.006
565.342667,274.4334.8590.077785.0190.006
665.481667,910.0954.7300.077785.7640.006
D169.661361,540.9403.9160.080417.0130.005
268.258354,669.9204.4130.079409.0700.005
368.214354,710.7004.5840.079409.1160.005
469.675362,586.6594.3520.080418.1840.005
568.404354,607.6674.2250.079409.0560.005
668.390354,399.4954.0930.079408.7670.005
Note: The AE signal data are represented using RMS values.
Table 6. Post hoc Dunn’s test analysis results.
Cutting Conditions ComparisonZ Statisticp-Value
Group 1Group 2
AB46.80<0.001
AC0.860.388
AD57.93<0.001
BC47.50<0.001
BD9.65<0.001
CD58,64<0.001
Disclaimer/Publisher’s Note: The statements, opinions and data contained in all publications are solely those of the individual author(s) and contributor(s) and not of MDPI and/or the editor(s). MDPI and/or the editor(s) disclaim responsibility for any injury to people or property resulting from any ideas, methods, instructions or products referred to in the content.

