
Beyond Human Vision: Unlocking the Potential of Augmented Reality for Spectral Imaging

 , , ,
, , ,  ,
,  and
and 
Abstract
1. Introduction
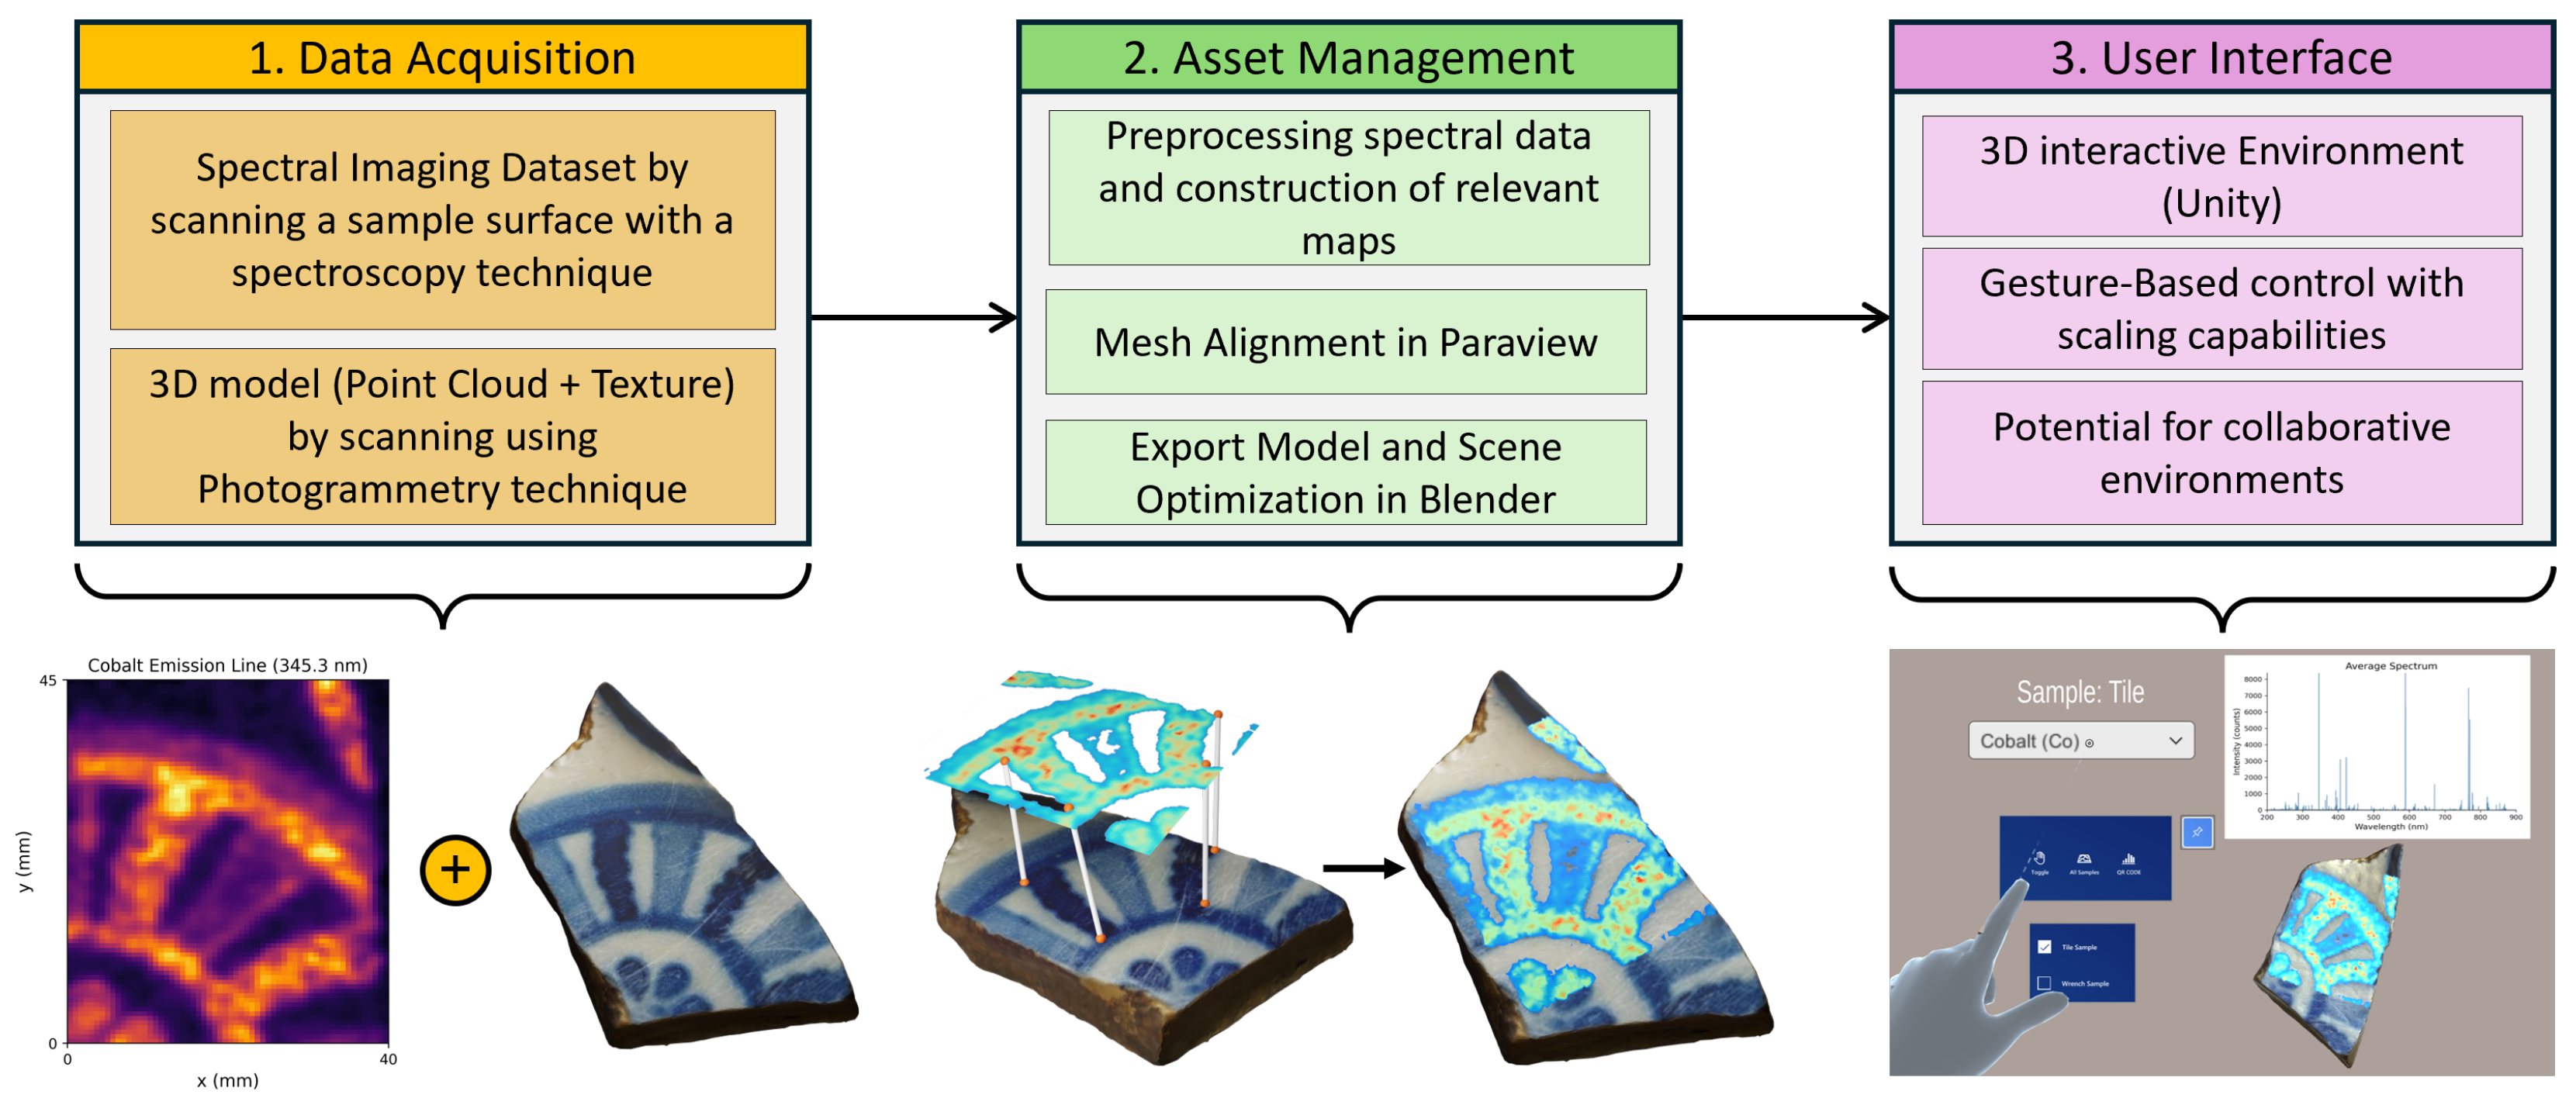
2. Method
2.1. Step 1: Data Acquisition
2.2. Step 2: Asset Management
2.3. Step 3: Development and Deployment of Unity Software Solution
3. Results
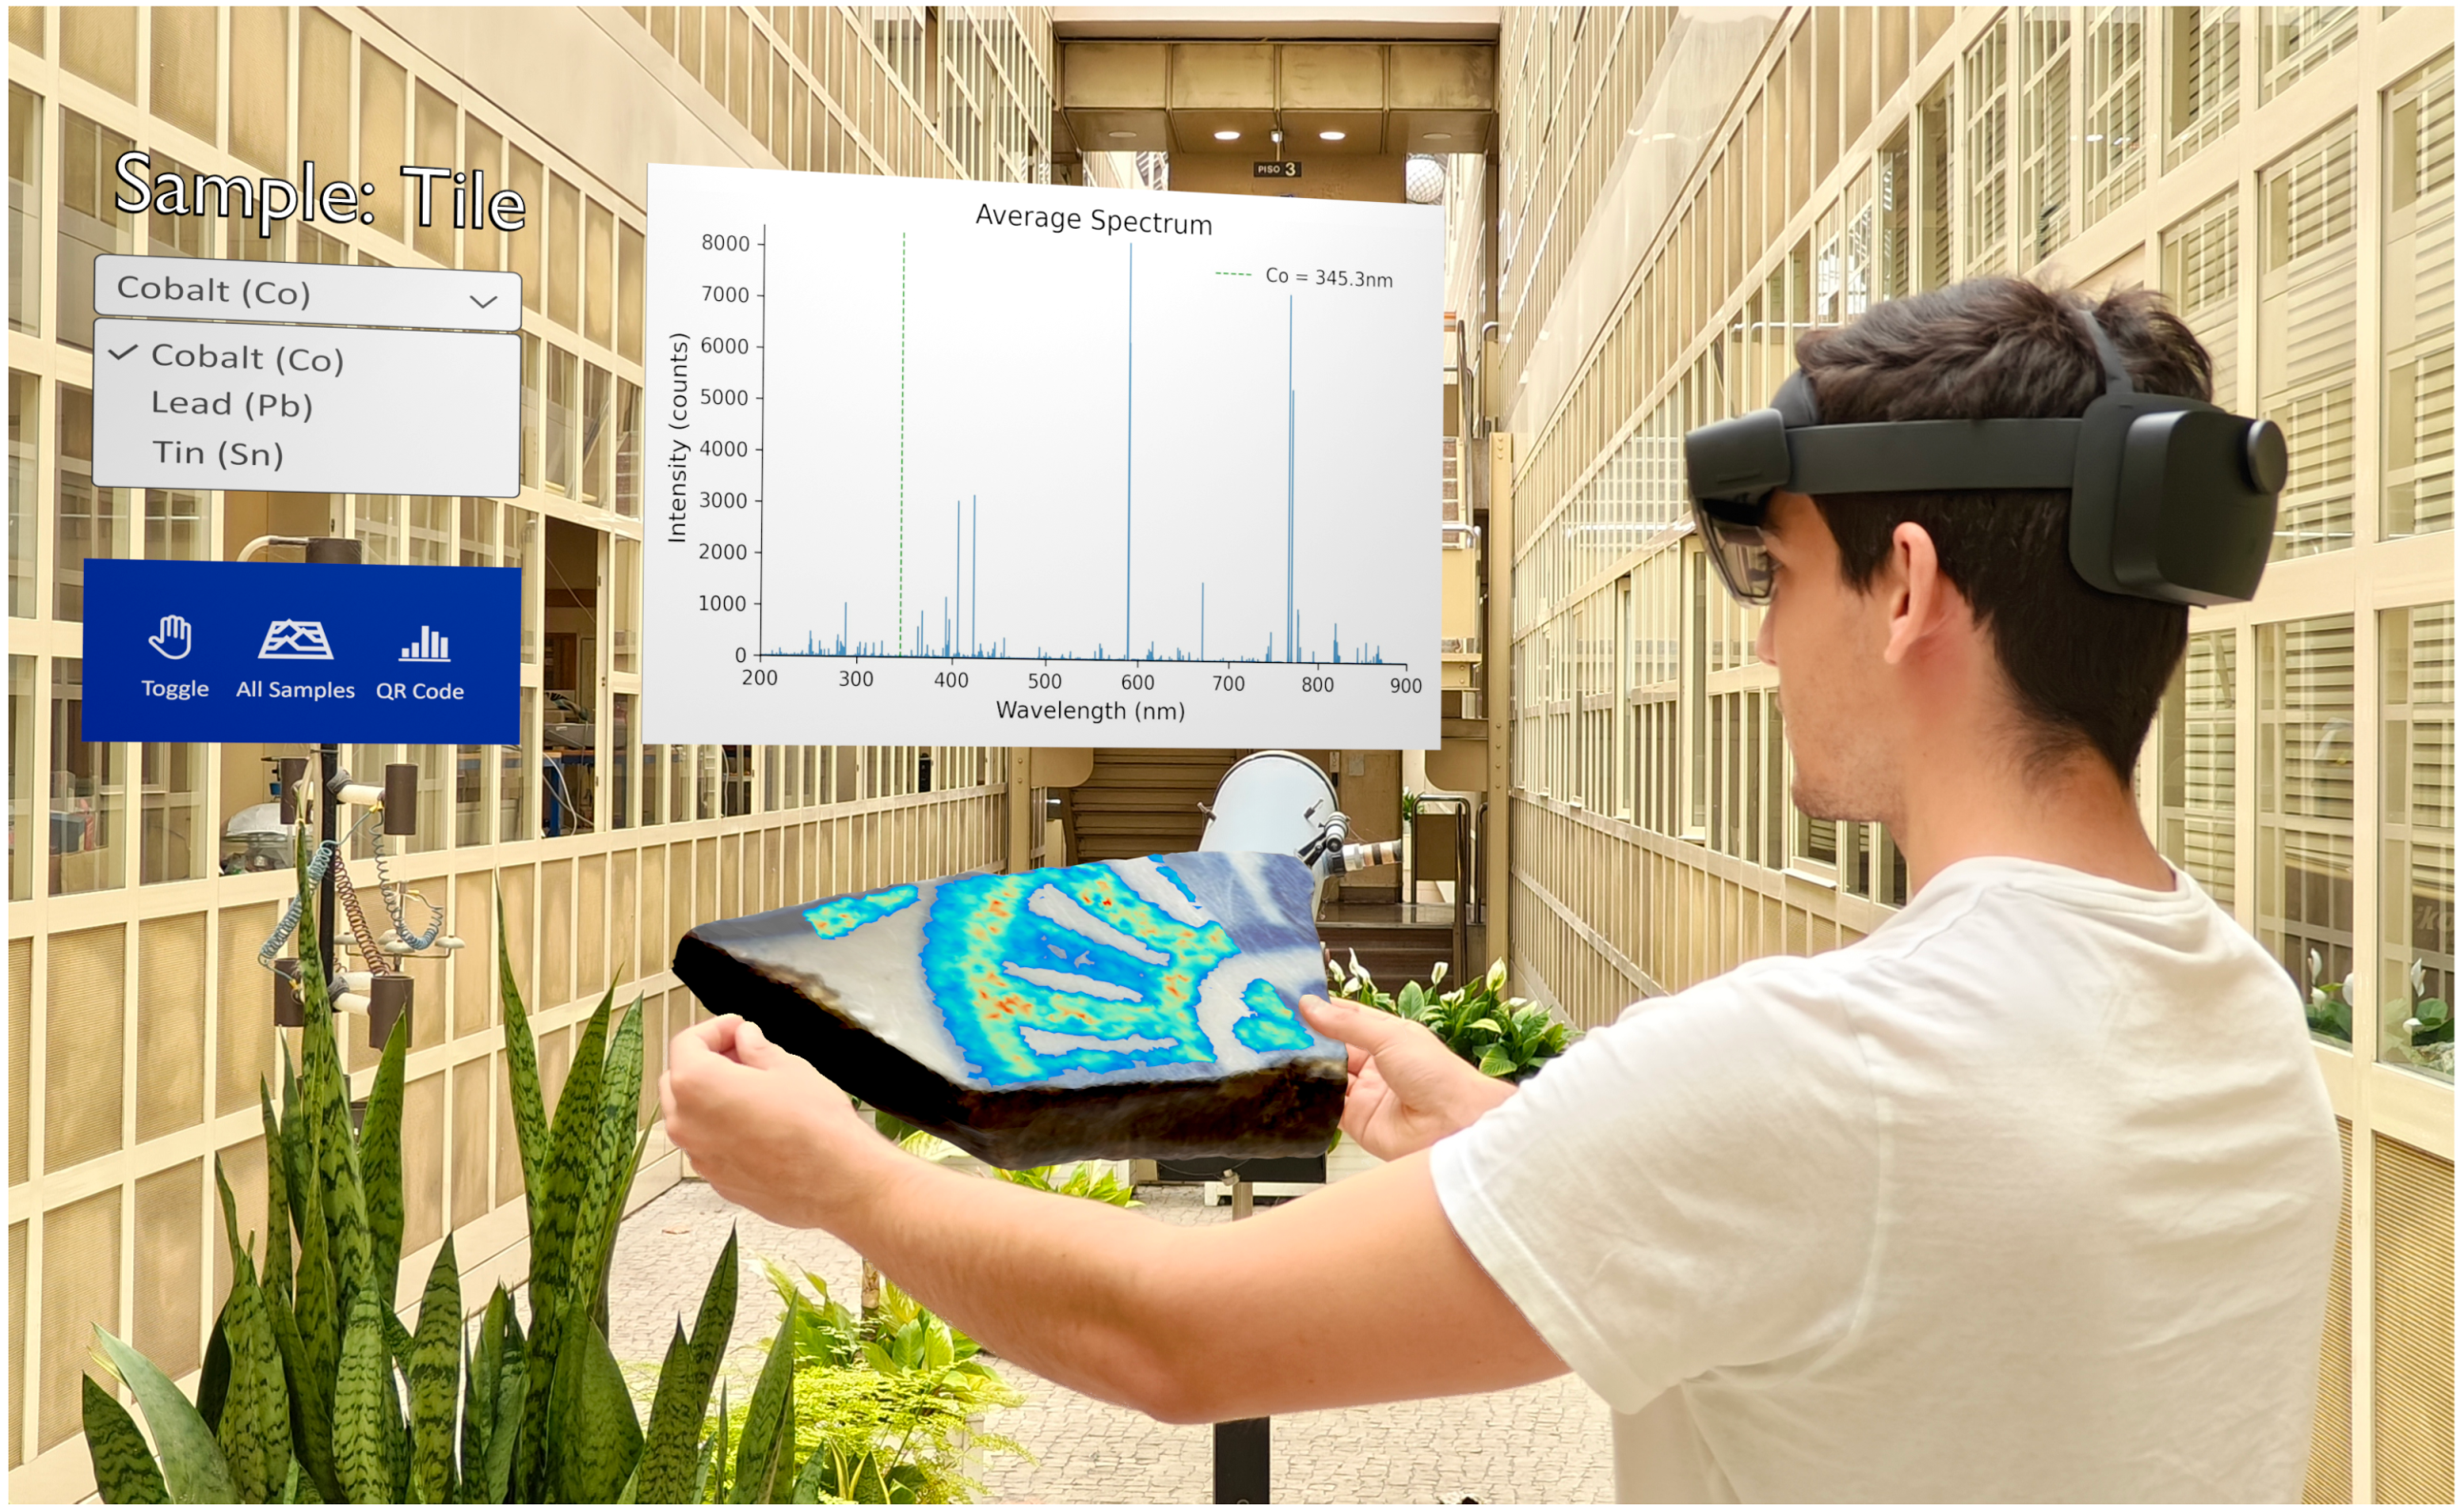
- Moving and rotating the sample: It allows us to position and move the sample freely, analyzing the composition in detail from multiple perspectives;
- Scaling: Allowing us to scale up small samples or reducing larger ones, the solution offers unique perspectives of the samples in integration with additional spectral features;
- Texture-based interpretation: Including the texture of the sample surface and possible roughness, it is possible to relate common signal variations (e.g., plasma signal in LIBS) due to the surface properties and better contextualize them.
- Multiple sample comparison: Adding multiple samples at the same time to the environment eases visual comparisons, enabling the deduction of clear connections or distinctions.
4. Discussion
Supplementary Materials
Author Contributions
Funding
Institutional Review Board Statement
Informed Consent Statement
Data Availability Statement
Conflicts of Interest
References
- Crofton, E.; Botinestean, C.; Fenelon, M.; Gallagher, E. Potential applications for virtual and augmented reality technologies in sensory science. Innov. Food Sci. Emerg. Technol. 2019, 56, 102178. [Google Scholar] [CrossRef]
- Schmalstieg, D.; Hollerer, T. Augmented Reality: Principles and Practice; Addison-Wesley Professional: Boston, MA, USA, 2016. [Google Scholar]
- Carmigniani, J.; Furht, B. Augmented Reality: An Overview; Springer Nature: Berlin, Germany, 2011; pp. 3–46. [Google Scholar] [CrossRef]
- Capela, D.; Ferreira, M.F.; Lima, A.; Dias, F.; Lopes, T.; Guimarães, D.; Jorge, P.A.; Silva, N.A. Robust and interpretable mineral identification using laser-induced breakdown spectroscopy mapping. Spectrochim. Acta Part B At. Spectrosc. 2023, 206, 106733. [Google Scholar] [CrossRef]
- Das, R.S.; Agrawal, Y. Raman spectroscopy: Recent advancements, techniques and applications. Vib. Spectrosc. 2011, 57, 163–176. [Google Scholar] [CrossRef]
- Lopes, T.; Rodrigues, P.; Cavaco, R.; Capela, D.; Ferreira, M.F.; Guimarães, D.; Jorge, P.A.; Silva, N.A. Interactive three-dimensional chemical element maps with laser-induced breakdown spectroscopy and photogrammetry. Spectrochim. Acta Part B At. Spectrosc. 2023, 203, 106649. [Google Scholar] [CrossRef]
- Mikhail, E.M.; Bethel, J.S.; McGlone, J.C. Introduction to Modern Photogrammetry; John Wiley & Sons: New York, NY, USA, 2001. [Google Scholar]
- Marín-Buzón, C.; Pérez-Romero, A.; López-Castro, J.L.; Ben Jerbania, I.; Manzano-Agugliaro, F. Photogrammetry as a new scientific tool in archaeology: Worldwide research trends. Sustainability 2021, 13, 5319. [Google Scholar] [CrossRef]
- Tavani, S.; Billi, A.; Corradetti, A.; Mercuri, M.; Bosman, A.; Cuffaro, M.; Seers, T.; Carminati, E. Smartphone assisted fieldwork: Towards the digital transition of geoscience fieldwork using LiDAR-equipped iPhones. Earth-Sci. Rev. 2022, 227, 103969. [Google Scholar] [CrossRef]
- Bi, S.; Yuan, C.; Liu, C.; Cheng, J.; Wang, W.; Cai, Y. A survey of low-cost 3D laser scanning technology. Appl. Sci. 2021, 11, 3938. [Google Scholar] [CrossRef]
- Antony, M.M.; Sandeep, C.S.; Matham, M.V. Hyperspectral vision beyond 3D: A review. Opt. Lasers Eng. 2024, 178, 108238. [Google Scholar] [CrossRef]
- Wang, N.; Wang, L.; Feng, G.; Gong, M.; Wang, W.; Lin, S.; Huang, Z.; Chen, X. Volumetric Imaging From Raman Perspective: Review and Prospect. Laser Photonics Rev. 2024, 19, 2401444. [Google Scholar] [CrossRef]
- Ferreira, M.F.; Guimarães, D.; Oliveira, R.; Lopes, T.; Capela, D.; Marrafa, J.; Meneses, P.; Oliveira, A.; Baptista, C.; Gomes, T.; et al. Characterization of Functional Coatings on Cork Stoppers with Laser-Induced Breakdown Spectroscopy Imaging. Sensors 2023, 23, 9133. [Google Scholar] [CrossRef]
- Gallot-Duval, D.; Quere, C.; De Vito, E.; Sirven, J.B. Depth profile analysis and high-resolution surface mapping of lithium isotopes in solids using laser-induced breakdown spectroscopy (LIBS). Spectrochim. Acta Part B At. Spectrosc. 2024, 215, 106920. [Google Scholar] [CrossRef]
- Azuma, R.; Baillot, Y.; Behringer, R.; Feiner, S.; Julier, S.; MacIntyre, B. Recent advances in augmented reality. IEEE Comput. Graph. Appl. 2001, 21, 34–47. [Google Scholar] [CrossRef]
- Huang, J.; Halicek, M.; Shahedi, M.; Fei, B. Augmented reality visualization of hyperspectral imaging classifications for image-guided brain tumor phantom resection. Proc. SPIE Int. Soc. Opt. Eng. 2020, 11315, 113150U. [Google Scholar]
- Yang, W.; Mondol, A.S.; Stiebing, C.; Marcu, L.; Popp, J.; Schie, I.W. Raman ChemLighter: Fiber optic Raman probe imaging in combination with augmented chemical reality. J. Biophotonics 2019, 12, e201800447. [Google Scholar] [CrossRef]
- Alsberg, B.K. Is sensing spatially distributed chemical information using sensory substitution with hyperspectral imaging possible? Chemom. Intell. Lab. Syst. 2012, 114, 24–29. [Google Scholar] [CrossRef]
- Sancho, J.; Villa, M.; Chavarrías, M.; Juarez, E.; Lagares, A.; Sanz, C. SLIMBRAIN: Augmented reality real-time acquisition and processing system for hyperspectral classification mapping with depth information for in-vivo surgical procedures. J. Syst. Archit. 2023, 140, 102893. [Google Scholar] [CrossRef]
- Engelke, U.; Rogers, C.; Klump, J.; Lau, I. HypAR: Situated mineralogy exploration in augmented reality. In Proceedings of the 17th International Conference on Virtual-Reality Continuum and Its Applications in Industry, Brisbane, QLD, Australia, 14–16 November 2019; pp. 1–5. [Google Scholar]
- Xiong, J.; Hsiang, E.L.; He, Z.; Zhan, T.; Wu, S.T. Augmented reality and virtual reality displays: Emerging technologies and future perspectives. Light. Sci. Appl. 2021, 10, 1–30. [Google Scholar] [CrossRef]
- Bolton, A.; Burnett, G.; Large, D.R. An investigation of augmented reality presentations of landmark-based navigation using a head-up display. In Proceedings of the 7th International Conference on Automotive User Interfaces and Interactive Vehicular Applications, AutomotiveUI’15, New York, NY, USA, 1–3 September 2015; pp. 56–63. [Google Scholar] [CrossRef]
- Stork, A.; Bimber, O.; Amicis, R.d. Projection-based Augmented Reality in Engineering Applications. In Proceedings of the CAD 2002, Dresden, Germany, 4–5 March 2002. [Google Scholar]
- Magnani, M.; Douglass, M.; Schroder, W.; Reeves, J.; Braun, D.R. The digital revolution to come: Photogrammetry in archaeological practice. Am. Antiq. 2020, 85, 737–760. [Google Scholar] [CrossRef]
- Baltsavias, E.P. A comparison between photogrammetry and laser scanning. ISPRS J. Photogramm. Remote Sens. 1999, 54, 83–94. [Google Scholar] [CrossRef]
- Lu, T.; Si, H.; Gao, Y. A research of 3D models for cloud-based technology combined with laser scanning close-range photogrammetry method. Int. J. Adv. Manuf. Technol. 2023, 1–10. [Google Scholar] [CrossRef]
- Gaudiuso, R.; Dell’Aglio, M.; De Pascale, O.; Senesi, G.S.; De Giacomo, A. Laser induced breakdown spectroscopy for elemental analysis in environmental, cultural heritage and space applications: A review of methods and results. Sensors 2010, 10, 7434–7468. [Google Scholar] [CrossRef]
- Peng, J.; Peng, S.; Jiang, A.; Wei, J.; Li, C.; Tan, J. Asymmetric least squares for multiple spectra baseline correction. Anal. Chim. Acta 2010, 683, 63–68. [Google Scholar] [CrossRef]
- Pořízka, P.; Klus, J.; Képeš, E.; Prochazka, D.; Hahn, D.W.; Kaiser, J. On the utilization of principal component analysis in laser-induced breakdown spectroscopy data analysis, a review. Spectrochim. Acta Part B At. Spectrosc. 2018, 148, 65–82. [Google Scholar] [CrossRef]
- Umeyama, S. Least-squares estimation of transformation parameters between two point patterns. IEEE Trans. Pattern Anal. Mach. Intell. 1991, 13, 376–380. [Google Scholar] [CrossRef]
- Ahrens, J.; Geveci, B.; Law, C. ParaView: An End-User Tool for Large Data Visualization. In Visualization Handbook; Elesvier: Amsterdam, The Netherlands, 2005; ISBN 978-0123875822. [Google Scholar]
- Kim, S.L.; Suk, H.J.; Kang, J.H.; Jung, J.M.; Laine, T.H.; Westlin, J. Using Unity 3D to facilitate mobile augmented reality game development. In Proceedings of the 2014 IEEE World Forum on Internet of Things (WF-IoT), Seoul, Republic of Korea, 6–8 March 2014; pp. 21–26. [Google Scholar]
- Carter, E.; Sakr, M.; Sadhu, A. Augmented Reality-Based Real-Time Visualization for Structural Modal Identification. Sensors 2024, 24, 1609. [Google Scholar] [CrossRef]
- Boboc, R.G.; Băutu, E.; Gîrbacia, F.; Popovici, N.; Popovici, D.M. Augmented reality in cultural heritage: An overview of the last decade of applications. Appl. Sci. 2022, 12, 9859. [Google Scholar] [CrossRef]
- Bekele, M.K.; Pierdicca, R.; Frontoni, E.; Malinverni, E.S.; Gain, J. A Survey of Augmented, Virtual, and Mixed Reality for Cultural Heritage. J. Comput. Cult. Herit. 2018, 11, 7. [Google Scholar] [CrossRef]
- Tscheu, F.; Buhalis, D. Augmented reality at cultural heritage sites. In Proceedings of the Information and Communication Technologies in Tourism 2016: Proceedings of the International Conference, Bilbao, Spain, 2–5 February 2016; Springer: Cham, Switzerland, 2016; pp. 607–619. [Google Scholar]
- Detalle, V.; Bai, X. The assets of laser-induced breakdown spectroscopy (LIBS) for the future of heritage science. Spectrochim. Acta Part B At. Spectrosc. 2022, 191, 106407. [Google Scholar] [CrossRef]
- Anglos, D.; Detalle, V. Cultural heritage applications of LIBS. In Laser-Induced Breakdown Spectroscopy: Theory and Applications; Springer: Berlin/Heidelberg, Germany, 2014; pp. 531–554. [Google Scholar]
- Moawad, G.; Elkhalil, J.; Klebanoff, J.; Rahman, S.; Habib, N.; Alkatout, I. Augmented Realities, Artificial Intelligence, and Machine Learning: Clinical Implications and How Technology Is Shaping the Future of Medicine. J. Clin. Med. 2020, 9, 3811. [Google Scholar] [CrossRef]
- Castelan, E.; Vinnikov, M.; Alex Zhou, X. Augmented reality anatomy visualization for surgery assistance with hololens: Ar surgery assistance with hololens. In Proceedings of the 2021 ACM International Conference on Interactive Media Experiences, Virtual, 21–23 June 2021; pp. 329–331. [Google Scholar]
- Mathiesen, D.; Myers, T.; Atkinson, I.; Trevathan, J. Geological visualisation with augmented reality. In Proceedings of the 2012 15th International Conference on Network-Based Information Systems, Melbourne, VIC, Australia, 26–28 September 2012; pp. 172–179. [Google Scholar]
- Mourtzis, D.; Siatras, V.; Angelopoulos, J. Real-time remote maintenance support based on augmented reality (AR). Appl. Sci. 2020, 10, 1855. [Google Scholar] [CrossRef]
Disclaimer/Publisher’s Note: The statements, opinions and data contained in all publications are solely those of the individual author(s) and contributor(s) and not of MDPI and/or the editor(s). MDPI and/or the editor(s) disclaim responsibility for any injury to people or property resulting from any ideas, methods, instructions or products referred to in the content. |
© 2025 by the authors. Licensee MDPI, Basel, Switzerland. This article is an open access article distributed under the terms and conditions of the Creative Commons Attribution (CC BY) license (https://creativecommons.org/licenses/by/4.0/).
Share and Cite
Cavaco, R.; Lopes, T.; Capela, D.; Guimarães, D.; Jorge, P.A.S.; Silva, N.A. Beyond Human Vision: Unlocking the Potential of Augmented Reality for Spectral Imaging. Appl. Sci. 2025, 15, 6635. https://doi.org/10.3390/app15126635
Cavaco R, Lopes T, Capela D, Guimarães D, Jorge PAS, Silva NA. Beyond Human Vision: Unlocking the Potential of Augmented Reality for Spectral Imaging. Applied Sciences. 2025; 15(12):6635. https://doi.org/10.3390/app15126635
Chicago/Turabian StyleCavaco, Rafael, Tomás Lopes, Diana Capela, Diana Guimarães, Pedro A. S. Jorge, and Nuno A. Silva. 2025. "Beyond Human Vision: Unlocking the Potential of Augmented Reality for Spectral Imaging" Applied Sciences 15, no. 12: 6635. https://doi.org/10.3390/app15126635
APA StyleCavaco, R., Lopes, T., Capela, D., Guimarães, D., Jorge, P. A. S., & Silva, N. A. (2025). Beyond Human Vision: Unlocking the Potential of Augmented Reality for Spectral Imaging. Applied Sciences, 15(12), 6635. https://doi.org/10.3390/app15126635