Article

Tracking Poultry Drinking Behavior and Floor Eggs in Cage-Free Houses with Innovative Depth Anything Model

1
Department of Poultry Science, University of Georgia, Athens, GA 30602, USA
2
School of Electrical and Computer Engineering, University of Georgia, Athens, GA 30602, USA
*
Author to whom correspondence should be addressed.
Appl. Sci. 2025, 15(12), 6625; https://doi.org/10.3390/app15126625
Submission received: 3 May 2025 / Revised: 7 June 2025 / Accepted: 9 June 2025 / Published: 12 June 2025
(This article belongs to the Special Issue Application of Intelligent Systems in Poultry Farming)

Abstract

In recent years, artificial intelligence (AI) has significantly impacted agricultural operations, particularly with the development of deep learning models for animal monitoring and farming automation. This study focuses on evaluating the Depth Anything Model (DAM), a cutting-edge monocular depth estimation model, for its potential in poultry farming. DAM leverages a vast dataset of over 62 million images to predict depth using only RGB images, eliminating the need for costly depth sensors. In this study, we assess DAM’s ability to monitor poultry behavior, specifically detecting drinking patterns. We also evaluate its effectiveness in managing operations, such as tracking floor eggs. Additionally, we evaluate DAM’s accuracy in detecting disparity within cage-free facilities. The accuracy of the model in estimating physical depth was assessed using root mean square error (RMSE) between predicted and actual perch frame depths, yielding an RMSE of 0.11 m, demonstrating high precision. DAM demonstrated 92.3% accuracy in detecting drinking behavior and achieved an 11% reduction in motion time during egg collection by optimizing the robot’s route using cluster-based planning. These findings highlight DAM’s potential as a valuable tool in poultry science, reducing costs while improving the precision of behavioral analysis and farm management tasks.

1. Introduction

In recent years, artificial intelligence has made significant strides, particularly in agricultural systems, where precision and efficiency are critical [1]. One major challenge in precision livestock farming is the monitoring of animal behavior and welfare, which are critical for ensuring comfort, reducing stress, and maintaining ethical husbandry practices. Separately, detecting health conditions and assessing physiological development are equally essential for enabling timely interventions and improving productivity [2].
While computer vision has driven innovations in this field, the growing volume of data from in-field sensors and cameras introduces complexities in data processing. Existing depth estimation methods in agriculture often rely on stereo vision systems, depth sensors (e.g., LiDAR, RGB-D cameras), or supervised deep learning models trained on small, annotated datasets. While these methods have demonstrated effectiveness in tasks such as plant phenotyping, orchard mapping, and fruit counting [3,4], their application in poultry production—especially in cage-free environments—remains very limited. Most prior studies in poultry behavior monitoring focus on 2D image-based detection without leveraging depth information, primarily due to cost and complexity associated with depth sensors [5]. Furthermore, existing monocular depth estimation techniques require substantial labeled data and often suffer from reduced generalization when applied to new environments [6]. Few, if any, studies have investigated scalable depth estimation models using only RGB data for monitoring poultry behavior and facility conditions. This study addresses this gap by applying a general-purpose monocular depth estimation model to poultry production, eliminating the need for specialized depth sensors and enabling a broader range of behavior and operational insights in commercial cage-free systems. Building on this foundation, we introduce the Depth Anything Model (DAM), a novel solution for monocular depth estimation, designed for diverse and challenging agricultural scenarios [7]. Unlike traditional deep models, such as those used for citrus yield prediction, DAM emphasizes scalability and simplicity using a massive, automatically annotated dataset. In contrast, traditional models typically rely on smaller, manually labeled datasets. For example, a study employing red, green, and blue (RGB), Near-Infrared (NIR), and depth sensors for citrus yield estimation used 195 training images and 30 testing and validation images. The deep learning model, based on the AlexNet algorithm, required 2000 manually cropped samples of fruit and background for training [8]. Although these models can be effective, they often demand labor-intensive data preparation and are restricted by their smaller dataset size [9]. Additionally, traditional models tend to focus on specific tasks, such as detecting circular objects in images using algorithms like the Circular Hough Transform (for RGB and NIR images) or the CHOICE algorithm (for depth images) [10]. This task-specific approach limits their generalization capabilities. In contrast, DAM focuses on simplicity and scalability, leveraging a dataset of over 62 million unlabeled images. This expansive dataset enables the model to generalize across varying conditions, making it ideal for precision agriculture applications. It enhances adaptability and efficiency in real-world scenarios, such as monitoring livestock behavior or detecting anomalies in farming environments [11].
Although DAM demonstrates a strong zero-shot capability for depth prediction and can estimate depth information from monocular images, such as those captured with standard RGB cameras, eliminating the need for specialized depth sensors, its application in poultry science remains underexplored [12,13,14]. By relying solely on RGB cameras, DAM has the potential to significantly reduce costs associated with depth sensor technologies. However, there are still challenges in translating the predicted disparity into actionable physical depth measurements within poultry housing environments. For instance, it is necessary to establish how the model’s depth predictions can be used to monitor specific behaviors, such as feeding patterns or welfare indicators like movement and activity levels. Additionally, its potential for managing operations, such as tracking floor eggs, requires further investigation [15]. To further validate DAM’s utility, this study investigates its application in poultry systems, focusing on behavior monitoring and task automation.
This study contributes to the field by demonstrating the applicability of the Depth Anything Model (DAM) to poultry science, particularly in monitoring behavior and automating operational tasks. It shows how disparity predictions from RGB images can be translated into meaningful depth information to identify drinking behavior with high accuracy. Furthermore, the integration of DAM with a robotic system highlights its potential in optimizing egg collection routes in cage-free environments, improving efficiency and supporting smart poultry farm management.

2. Materials and Methods

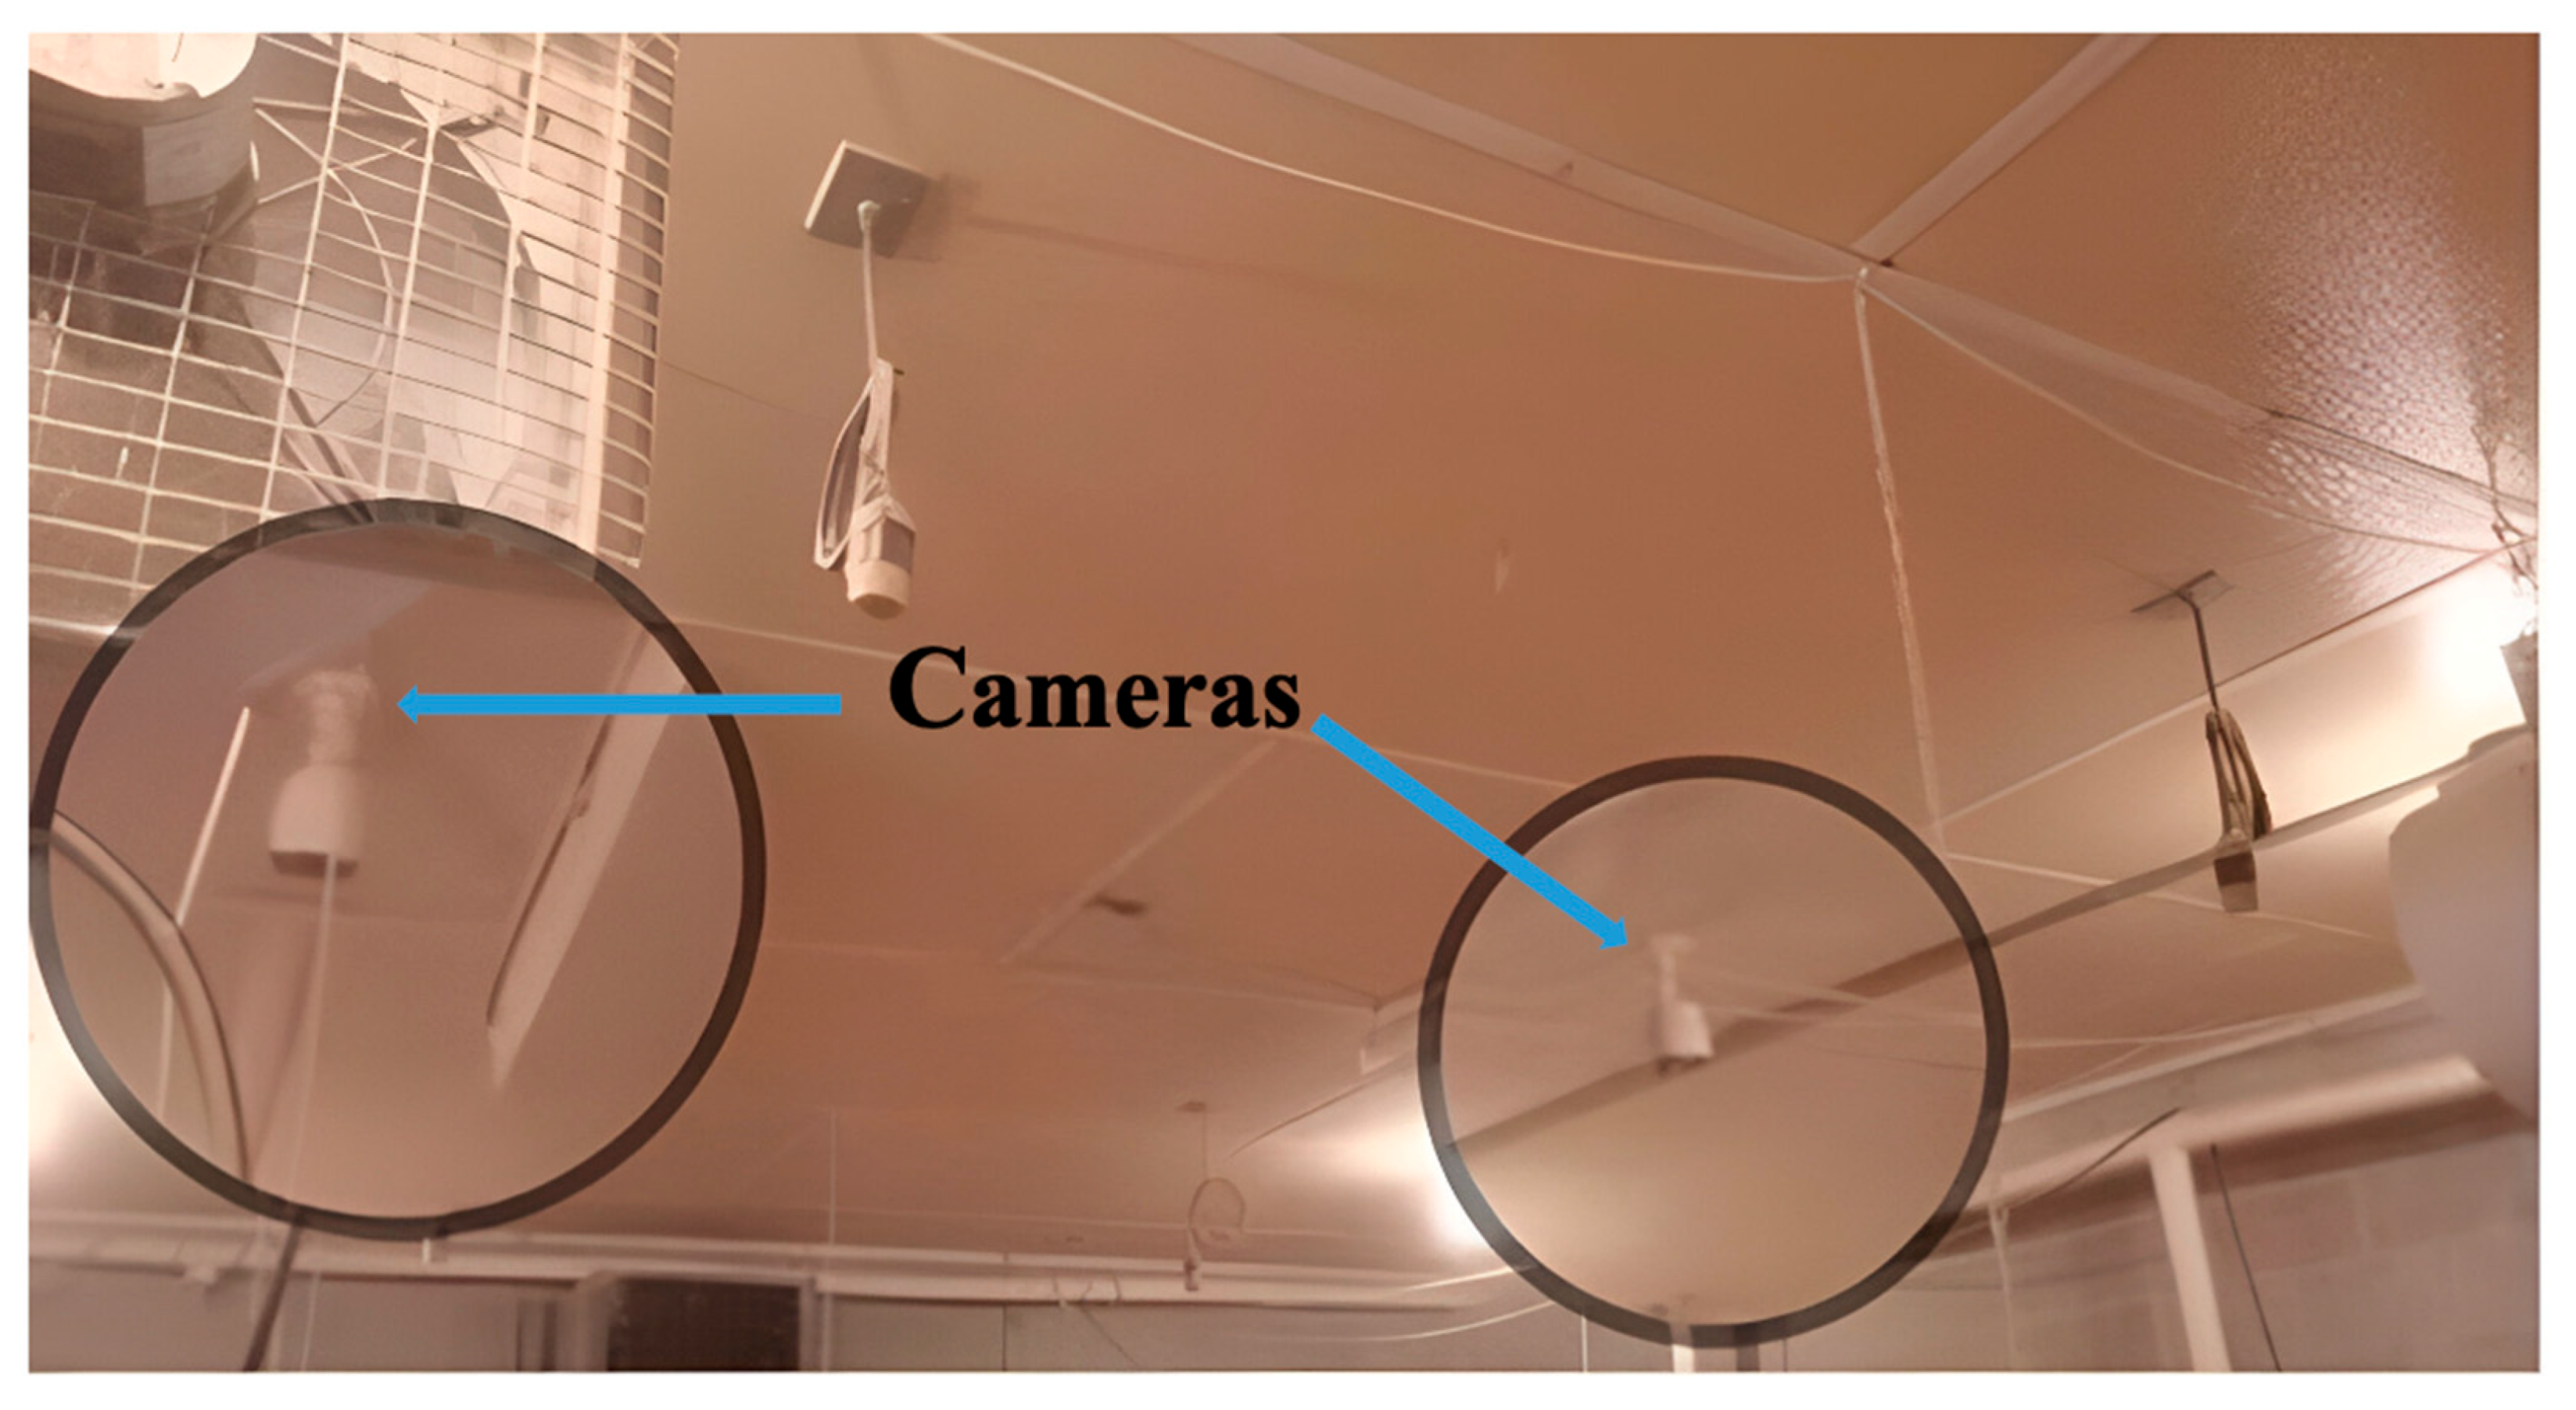
2.1. Experimental Setup

The experiment was conducted in four research cage-free layer houses on the University of Georgia’s Poultry Research Farm in Athens. Each house, measuring 7.3 m by 6.1 m and 3 m in height, accommodated 200 Lohmann White Leghorn Chickens. The houses featured essential equipment such as lights, perches, nest boxes, feeders, and drinkers, with pine shavings covering the floors. The perching zone was 3 m long and 1.8 m wide, offering six different heights for birds to perch: 0.3 m, 0.6 m, 1.0 m, 1.4 m, 2.0 m, and 2.4 m. Environmental conditions—light intensity and duration, ventilation, temperature, and humidity—were controlled via a Chore-Tronics Model 8 controller (CHORE-Time Controller, Milford, IN, USA). A soy–corn feed mixture was produced bi-monthly at the UGA feed mill to maintain freshness and prevent mildew. Team members adhered to the UGA Poultry Research Center Standard Operating Procedure, monitoring the hens’ growth and environmental conditions daily. This experiment complied with UGA’s Institutional Animal Care and Use Committee (IACUC; AUP approval #A2023 02-024-A1) guidelines. Additionally, for model verification, images and videos collected from two commercial cage-free houses (one with Lohmann White and one farm with Lohmann Brown hens) were used to verify the newly developed DAMs. The primary experiment involved 800 Lohmann White Leghorn hens. The mention of Lohmann Brown hens refers to external data sources used solely for model validation, ensuring robustness across different commercial environments.

2.2. Data Collection and Preparation

To evaluate detection performance—specifically in identifying perch heights, assessing optimal egg collection paths, and monitoring interactions between chickens and feeders—four night-vision network cameras (PRO-1080MSB, Swann Communications USA, Santa Fe Springs, LA, USA) were mounted approximately 3 m above the drinking system and feeder zones to record top-view footage (Figure 1). The hens’ activities were continuously monitored on a 24 h basis, with footage stored in digital video recorders (DVR-4580, Swann Communications USA Inc., Santa Fe Springs, LA, USA). The video files, have a resolution of 1920 × 1080 pixels at 15 frames per second (fps). Additionally, the “Unitree Go1” robotic dog (Unitree, Binjiang District, Hangzhou, China) was deployed twice daily at approximately 8:00 a.m. and 5:00 p.m., to inspect the entire poultry facility. The robot was equipped with a forward-facing camera angled slightly downward at approximately 30 degrees to capture the ground and the periphery of the hens’ environment (Figure 2). The camera on the Unitree Go1 recorded video at a resolution of 1280 × 720 pixels with a frame rate of 30 fps, optimized to capture clear images during the robot’s movements through the farm [16].

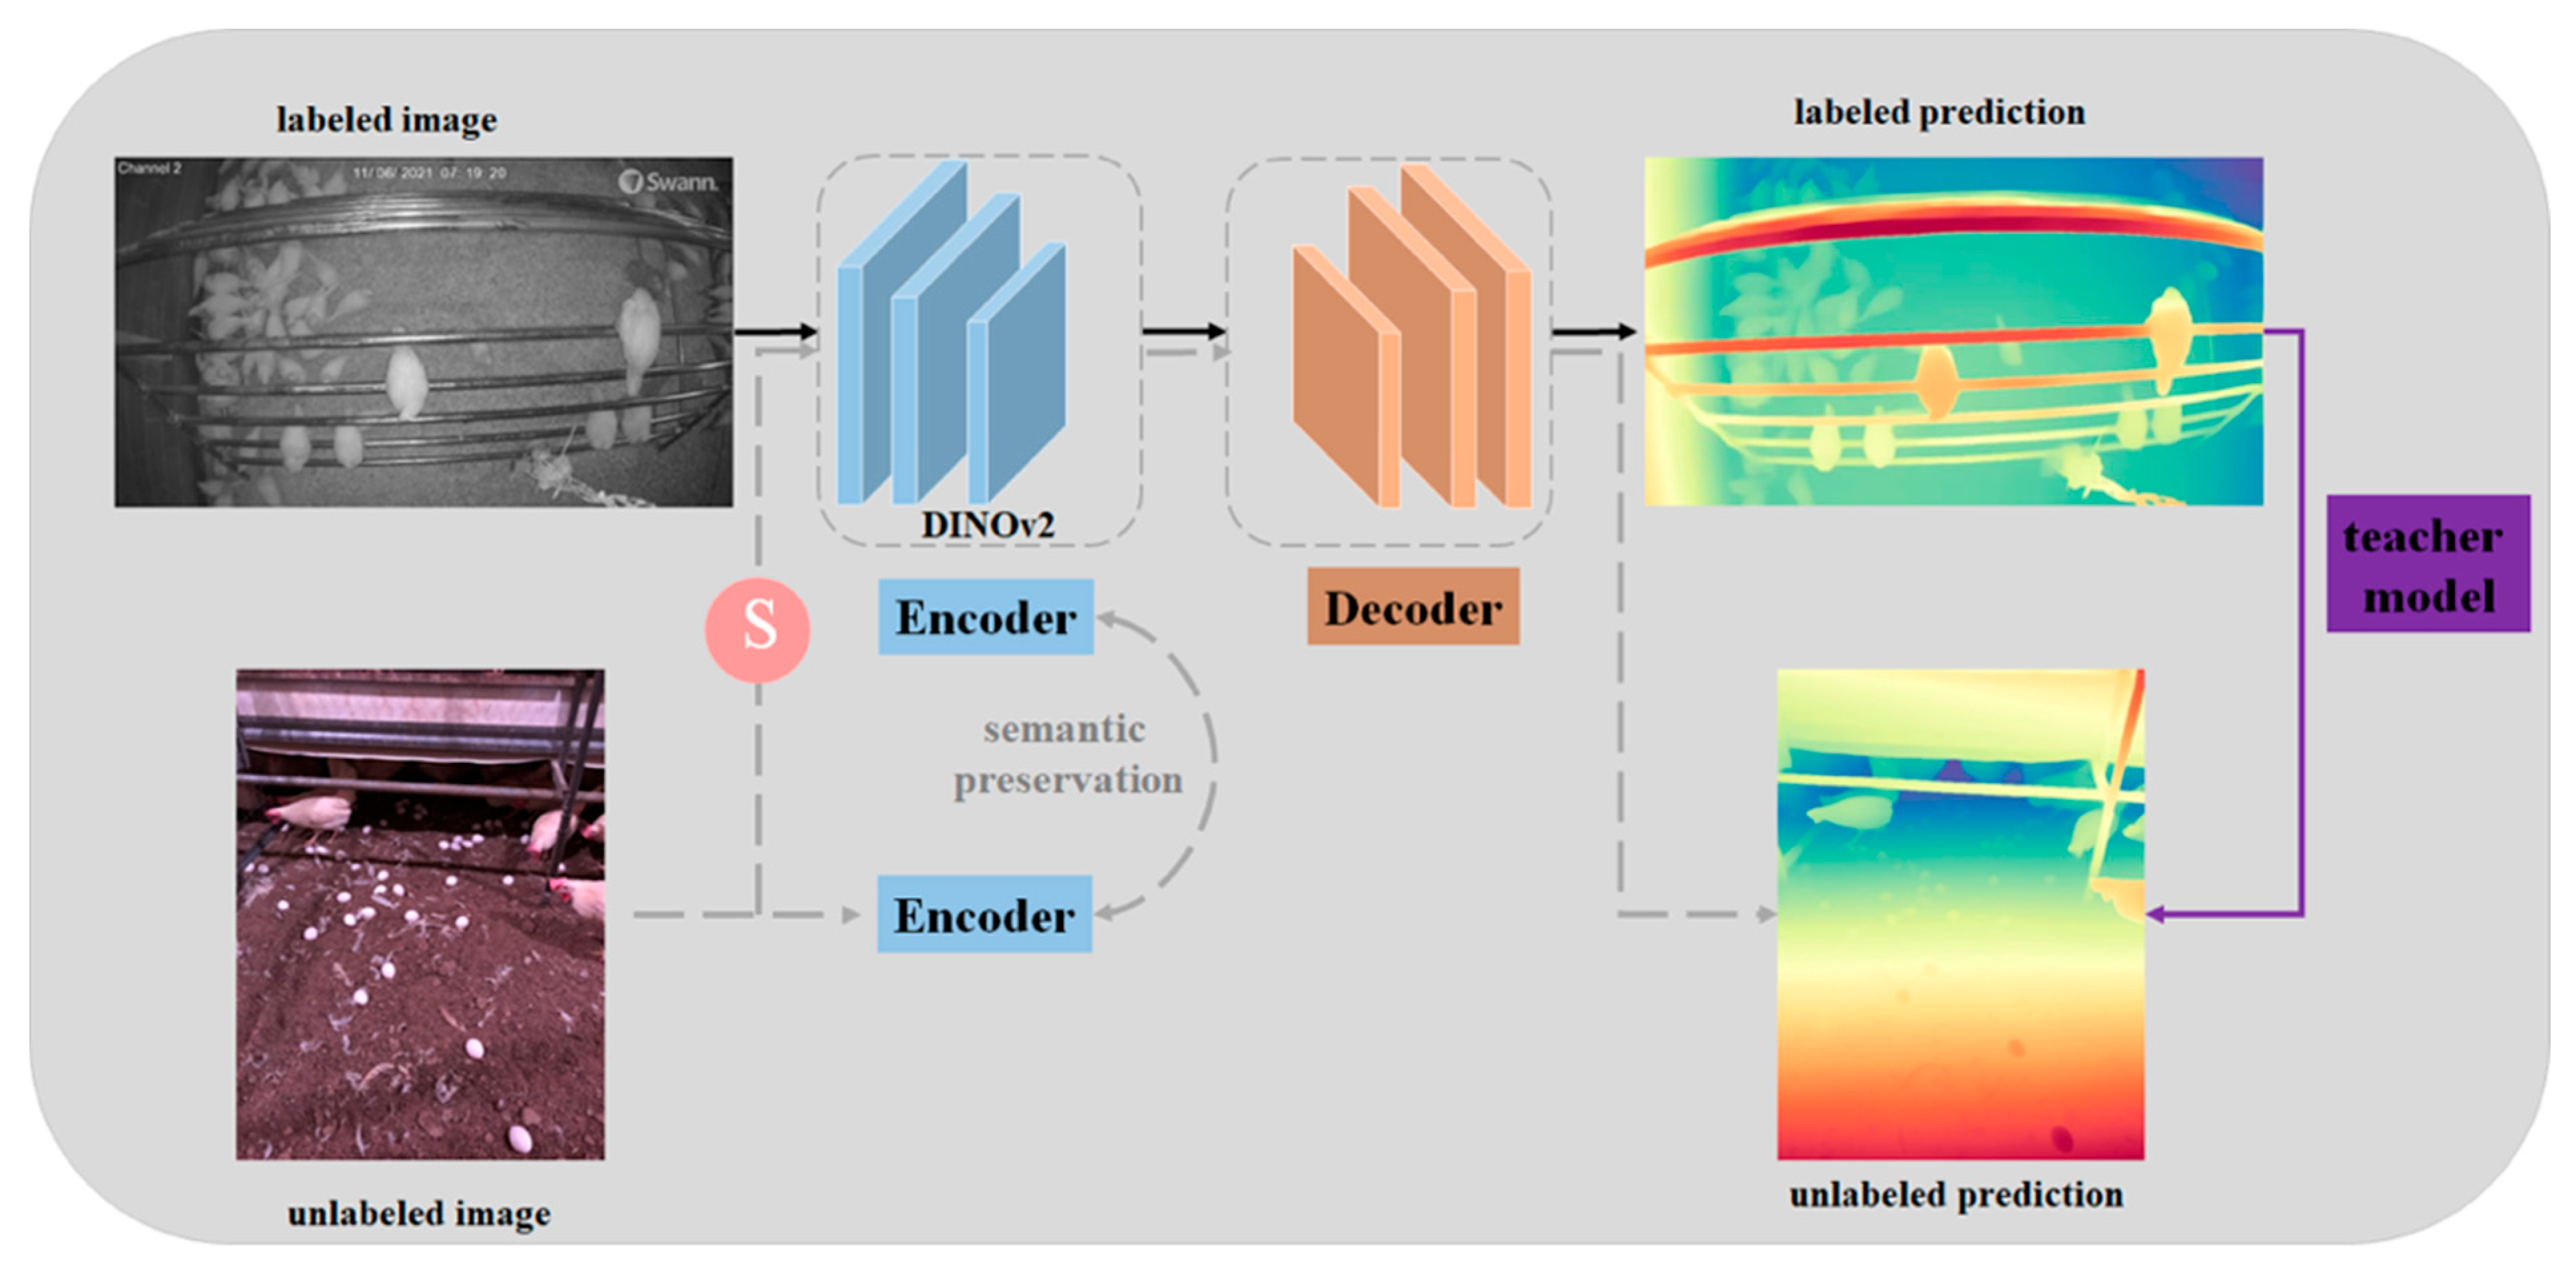
2.3. Deep Learning Model for Automated Detection of Perch, Chickens, and Eggs in Cage-Free Systems

In this research, we directly implemented the DAM, a deep learning model developed for monocular depth estimation. We applied this model to detect various objects, such as perch frames, chickens, and eggs, within cage-free poultry environments. The flexibility of the DAM, due to its ability to generalize across different scenarios, allowed us to utilize its pre-trained capabilities for these specific detection tasks [7].
The DAM was constructed with a focus on scalability and ease of use. Aiming to build a robust monocular depth estimation model by leveraging large-scale, unlabeled data. A data engine was designed to collect around 62 million diverse images from public datasets like SA-1B and BDD100K automatically [17,18]. Instead of manually annotating these images, they used a pre-trained model to assign pseudo-depth labels, reducing the cost and time needed for data annotation [13]. To improve generalization, strong perturbations were introduced, such as color jittering and spatial distortions (CutMix), during training [19]. These techniques helped the model learn more robust features, allowing it to handle complex environments and unseen scenarios. Additionally, the DAM was initialized with self-distillation with no label v2 (DINOv2) weights, which provided rich semantic information, further enhancing its depth estimation capabilities [20]. The DAM was trained using both labeled and pseudo-labeled images in a two-stage process: first, a teacher model was trained on labeled data, and then this model was used to generate pseudo-labels for unlabeled data, allowing the final student model to learn from a much larger dataset [21]. This approach resulted in a model capable of zero-shot depth estimation without the need for fine-tuning, making it highly practical for real-world applications (Figure 3) [22]. The implementation used PyTorch v2.1.0, with training conducted on an NVIDIA A100 GPU (40 GB VRAM). The model uses disparity as a key parameter, representing the inverse of depth [23]. This feature was particularly useful in identifying the relative distances of objects, such as chickens, perch frames, and eggs, from the camera. By leveraging these disparity values, we could monitor object proximity and thus observe behaviors and interactions within the poultry environment.

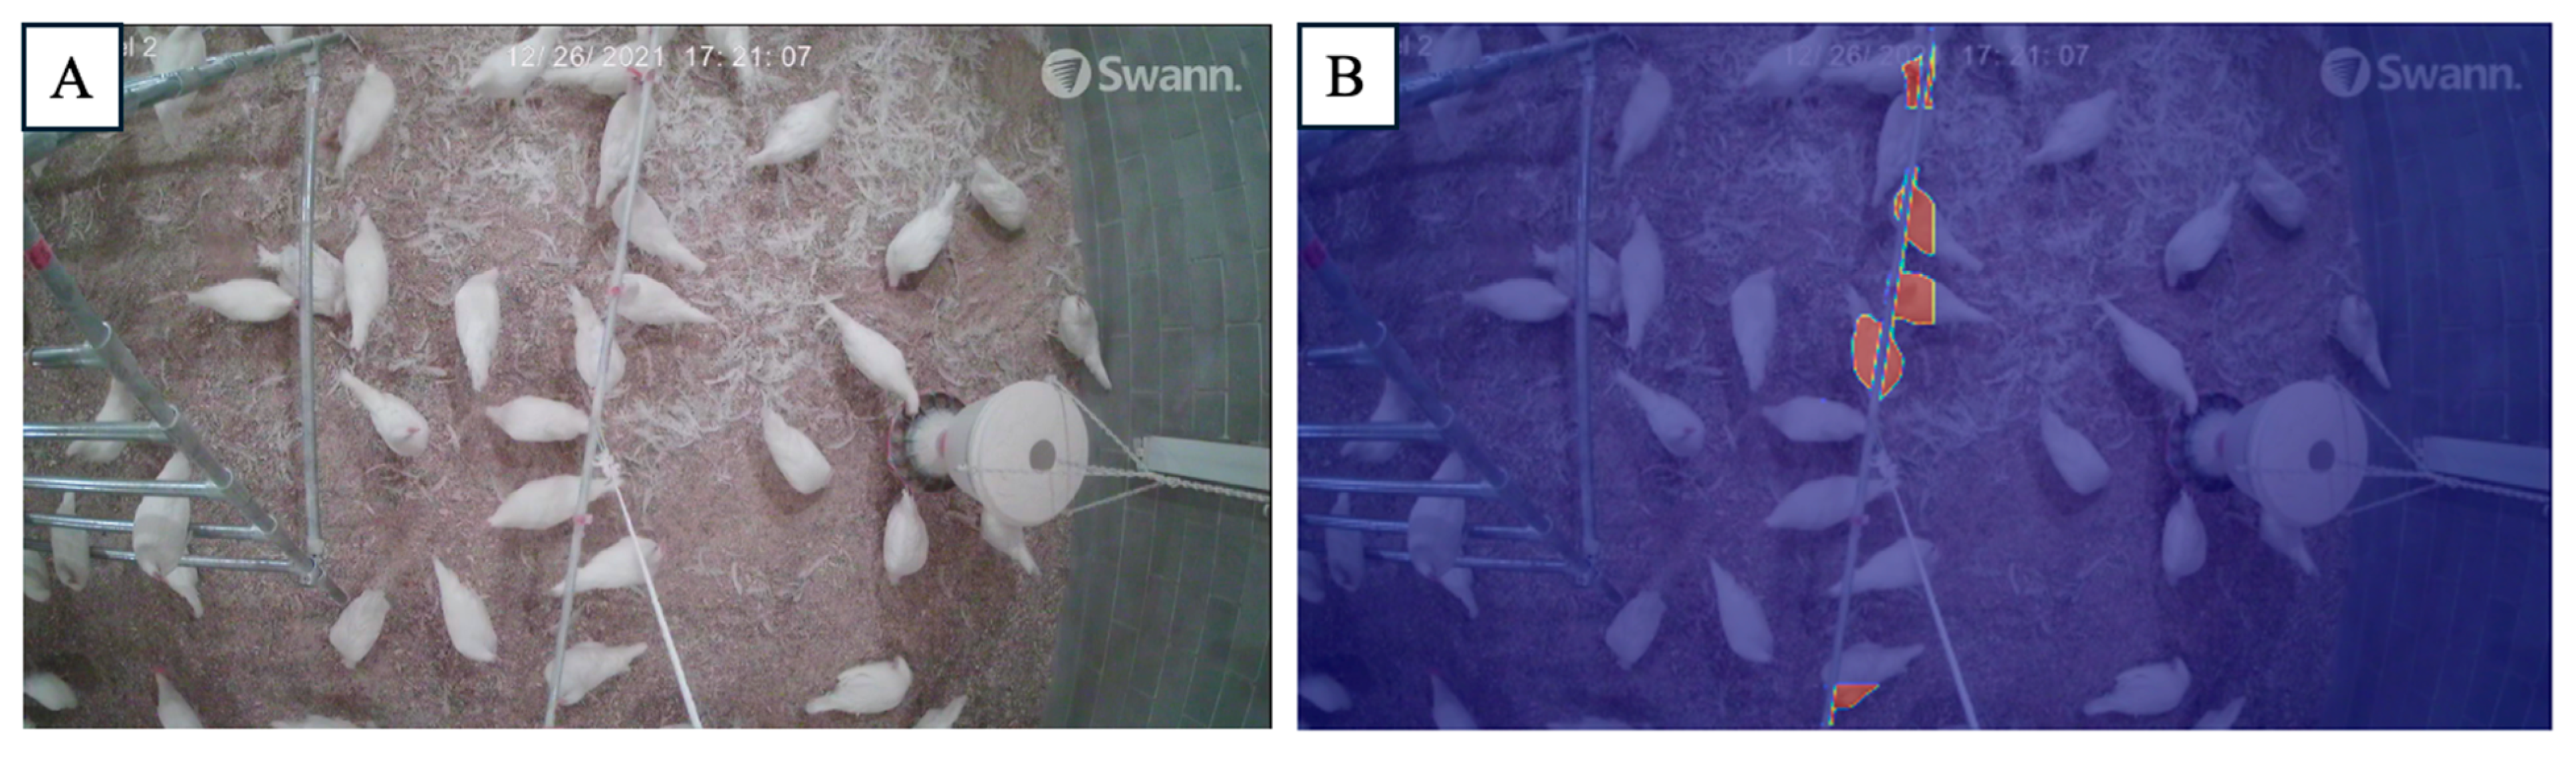
2.4. Drinking Behavior Detection

To focus on detecting drinking behaviors, we designated a specific region of interest (ROI) along the x-axis, between pixels 1300 and 1400. Instead of using an average depth threshold, we quantified the proportion of pixels within this region that fell within a predefined disparity range of 16 to 20 (Algorithm 1), which corresponds to the depth of the drinking line. This method enabled the detection of chicken drinking behavior based on localized disparity concentration rather than simple depth comparison. Although the DAM was originally developed for general object detection and segmentation tasks, in our study, we utilized its pre-trained monocular depth estimation capability to generate depth maps. These maps were then analyzed using a designated region of interest (ROI) to detect drinking behavior through disparity changes [24].
Algorithm 1. ROI Depth Analysis for Drinking Behavior Detection
import cv2
import numpy as np
# Load the image
image_path = ‘/mnt/data/image.png’ # Update with the path
image = cv2.imread(image_path, cv2.IMREAD_GRAYSCALE)
# Define the region of interest (ROI)
x_start, x_end = 1300, 1400
roi = image[:, x_start:x_end]
min_depth, max_depth = 16, 20
average_depth = np.mean(roi)
# Compare the pixel values in the ROI with the depth range
within_depth_range = (roi >= min_depth) & (roi <= max_depth)
proportion_within_range = np.sum(within_depth_range) / roi.size
print(f”Average depth in ROI: {average_depth}”)
print(f”Proportion of pixels within the depth range: {proportion_within_range:.2f}”)

2.5. Optimized Route Distance Calculation

In this study, we propose an optimized route design to enhance the efficiency of egg collection using robotic systems with the K-means clustering algorithm. The optimization is based on egg depth detection and clustering techniques. Eggs are first grouped into clusters according to their proximity, using a pre-planned strategy. Within each cluster, the robot follows a sequential order to minimize travel distance [25]. Once all eggs in a cluster are collected, the robot moves to the next cluster in the most efficient sequence. The detailed algorithm is presented in Algorithm 2.
Algorithm 2. Optimized Egg Collection Routes Using Depth and Clustering Techniques
def calculate_optimized_route(cluster_routes):
  full_route = []
  total_distance = 0
  route_details = []
  # Collect eggs within clusters in a pre-determined order (cluster_routes)
  for cluster_num in cluster_routes.keys():
    eggs_in_cluster = cluster_routes[cluster_num]
    full_route.extend(eggs_in_cluster)
  # Calculate total distance for the optimized route
  for i in range(len(full_route) − 1):
    dist = distance_matrix_eggs[full_route[i], full_route[i + 1]]
    total_distance += dist
    route_details.append((full_route[i], full_route[i + 1], dist))
  return total_distance, full_route, route_details

2.6. Model Evaluation and Statistical Data Analysis

In the task of monocular depth estimation, the absence of stereoscopic information—such as geometric constraints from binocular or multi-view systems—limits the model to inferring only relative depth relationships from a single two-dimensional image. Consequently, the estimated depth is often scale-ambiguous, reflecting the relative depth between objects in the scene rather than the absolute depth consistent with real-world physical scales. Monocular depth estimation relies on features such as texture, shadow, and perspective for reasoning, but these elements only provide relative depth orderings without determining the actual distance between objects and the camera. To convert the model’s estimated relative depth into physical depth values, a known reference scale is required. By comparing the estimated depth to ground truth data, a scale factor is calculated between the estimated and true depths. This scale factor is then applied to convert relative depth into actual depth, ensuring that the model’s output corresponds to real-world physical distances. For each level perch frame in the scene, the predicted depth is computed as the inverse of its disparity, we converted these to physical depth values using a known reference scale derived from ground truth data. Specifically, the predicted depth was calculated as the inverse of disparity, scaled by a calibration factor determined from the ratio between known true depths and predicted disparities. The scale for each perch frame is determined by the ratio between the true depth and the predicted depth, and the average scale across all perch frames is then calculated. Finally, this average scale is used to convert the predicted depths into actual depths, ensuring alignment within a realistic physical range.
To evaluate the accuracy of the DAM in detecting disparity in cage-free facilities, we compared the actual perch depth with the corresponding detected disparity at each level of the perch frame. The root mean square error (RMSE) was calculated to quantify performance, where a lower RMSE indicates better accuracy. One-way ANOVA followed by Tukey’s Honest Significant Difference (HSD) test was performed using JMP software (JMP Pro 16 for Mac, SAS Institute, Cary, NC, USA) to determine if there were significant differences between the predicted disparity and the actual depth across perch frames.
R M S E = 1 n i = 1 n ( ŷ i y i ) 2
where n is the number of observations, ŷ i is the predicted value, y i is the actual value, and ∑ represents the summation over all observations.

3. Results and Discussion

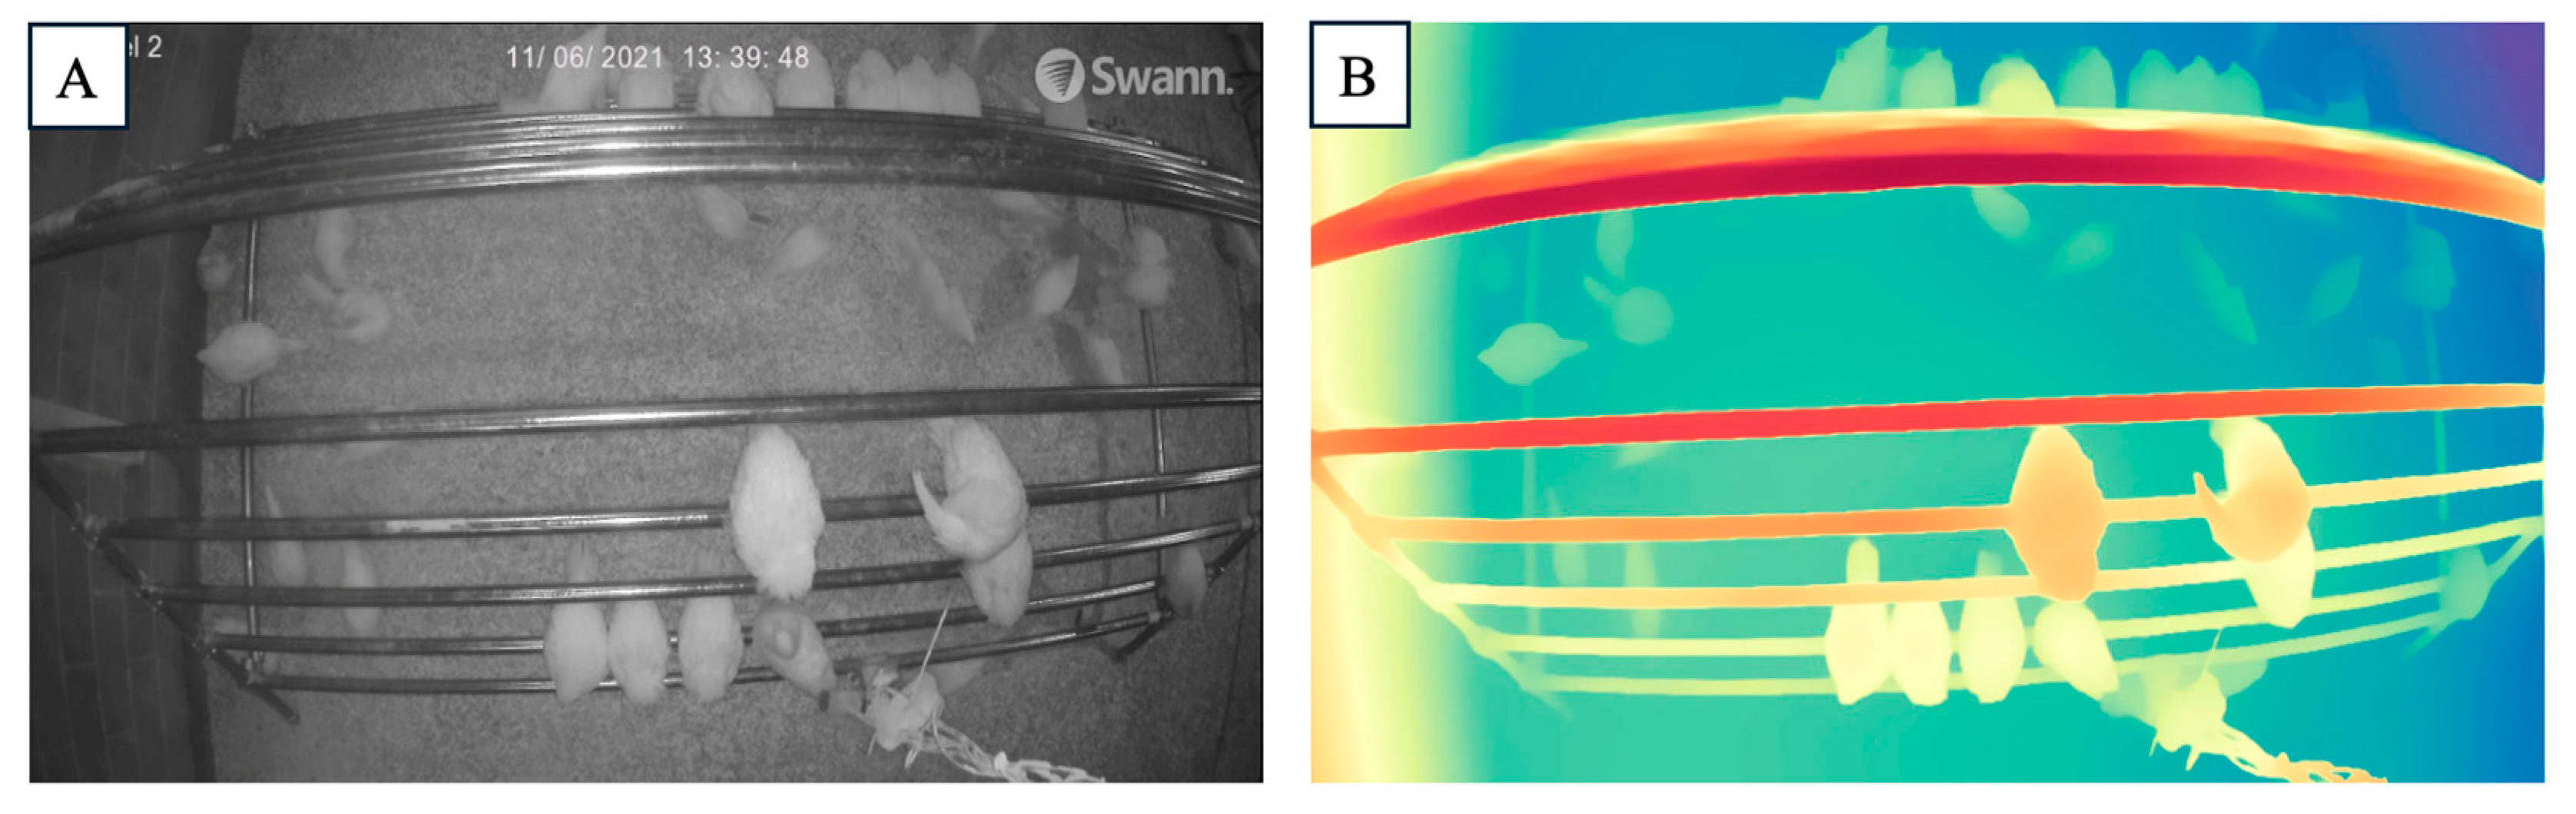
3.1. Results of Monocular Depth Estimation for Perch Frame Evaluation

To evaluate the performance of the DAM on depth prediction in poultry farms, we used perch frames as a reference due to their fixed height at different levels (from bottom to top: 1 m, 1.6 m, 2 m, 2.4 m, and 2.7 m). A total of 20 images containing the perch frames were used for the evaluation. The results are summarized in the table below (Table 1). Figure 4 presents the depth detection results obtained through the DAM.
For each level, the predicted disparity values were calculated. After applying the scale factor of 258.21, the predicted depths were adjusted to reflect real-world physical measurements. The comparison between the predicted and adjusted real depths demonstrates that the model’s predictions are closely aligned with the actual perch heights, with minor deviations across different levels [26]. The calculated RMSE between the adjusted depth and the actual depth for the provided data is approximately 0.11 m, indicating that the predicted and adjusted depths are quite close to the actual values, with only a minor error. This result demonstrates that the DAM can accurately predict the depths of perch frames with reasonable precision. This finding is significant for practical applications in cage-free poultry houses, where DAM can be effectively used to predict the depth of various facilities using only RGB camera input. Such depth information can enable further analysis of chickens’ interactions with these facilities, such as tracking the number of chickens staying around the perches or other equipment. This could contribute to research on flock behavior, welfare, and environmental preferences [27]. One of the major advantages of using DAM in combination with standard RGB cameras is the cost-effectiveness of this setup [28]. Traditional depth sensing technologies, such as LiDAR or depth cameras (i.e., Kinect), are often expensive and require specialized equipment and maintenance [29]. By contrast, RGB cameras are relatively affordable, widely available, and easy to install, making them a practical solution for commercial poultry houses [9]. Furthermore, the combination of RGB imagery with DAM reduces the need for specialized depth sensing hardware, significantly lowering implementation and maintenance costs [30,31].

3.2. Evaluation of Applying the DAM to Detect Drinking Behavior

Fifty images containing drinking areas were used to evaluate the performance of DAM in detecting drinking behavior. The average depth of the drinking lines was approximately 2.63 m, with the range of chickens drinking water being between 2.57 m and 2.68 m. Based on the predefined disparity range, we covered chicken’s drinking activity when their beaks peck the drinking nipples [32]. This interaction causes the depth of the chicken’s head and beak to align closely with the depth of the drinking line. The total number of chickens in the ROI is 504, with 430 identified as true positives and 35 as false negatives, resulting in an accuracy of 92.3%.
In our study, DAM successfully detected chickens within the ROI, with the orange-colored areas representing the chickens’ body parts that fell within the predefined disparity range (Figure 5. The model automatically identified the chickens’ heads and backs, whose disparity values closely aligned with those of the drinking line, demonstrating its capability to precisely detect drinking behavior. This also corroborates the reasonableness of using a predefined disparity range based on the chickens’ head and back positions along the drinking line [33]. Compared to previous studies, which either used a roughly designed ROI to count the number of birds in the drinking area or detected drinking behavior through classification based on a behaviorally segmented dataset, DAM provided a more practical approach [34]. For example, in Figure 5, if we do not use DAM and rely solely on the ROI, the total number of chickens drinking would be counted as nine. However, after applying DAM to compare the disparity of chickens with the drinking line, we successfully excluded four false detections, accurately counting only the chickens that were actually drinking. With only the ROI, the detection accuracy was 55.56%. After applying DAM to exclude the false detections, the accuracy improved to 100%. DAM’s detection-based method allowed for the precise identification of chickens actually drinking water, whereas simpler ROI designs may miscount non-drinking chickens or those simply passing through the area. Classification-based approaches, on the other hand, require segmenting drinking chickens before comparing them to other behaviors, leading to higher computational costs.
Although DAM demonstrated practical effectiveness in detecting drinking behavior with greater precision, certain challenges remain. One issue is false detection when a chicken’s tail, rather than its head, falls below the drinking line [35]. To address this, three potential solutions were considered. The first is to analyze areas where this tail-under-waterline phenomenon occurs frequently and use the y-axis of the picture to exclude irrelevant detections [36]. The second approach involves collecting more data on the average false detection range and comparing it to true detections, enabling a more accurate predefined range to balance detection accuracy [37]. The third alternative is to detect chicken heads specifically, but this would require higher-resolution images and the use of different-colored nipple connectors to avoid confusion with the color of the chickens’ heads. A robotics camera system can also provide a viable solution for detecting actual drinking behavior, particularly when using a robotic dog. This is because its camera is positioned above the drinking line, allowing for a wider field of view to monitor chickens while drinking. However, a potential concern is that the presence of the robot may disrupt the chickens’ normal behavior. Therefore, adapting the robot to minimize its impact on the chickens’ environment is essential. Overall, the application of DAM proved effective in automating the detection of drinking behavior in chickens with minimal errors, offering a practical and scalable solution for precision livestock farming.

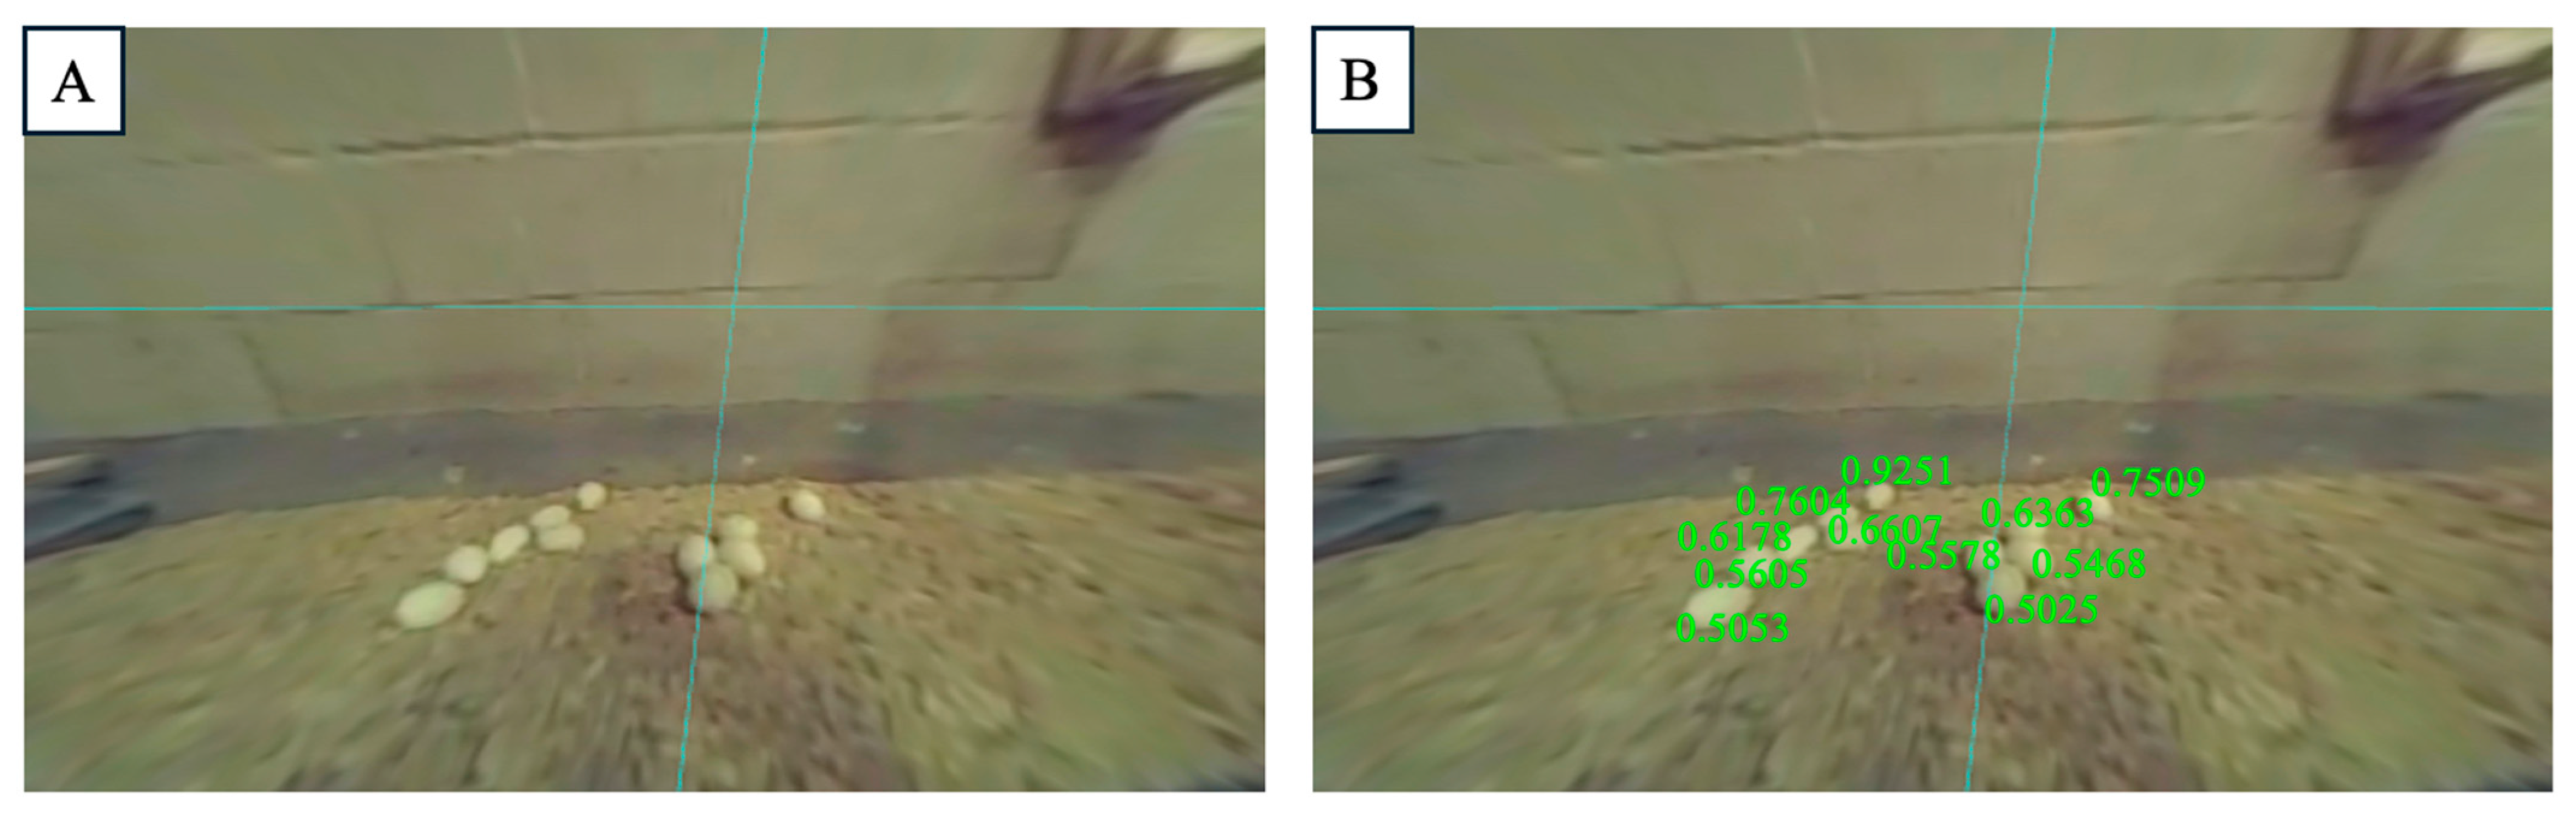
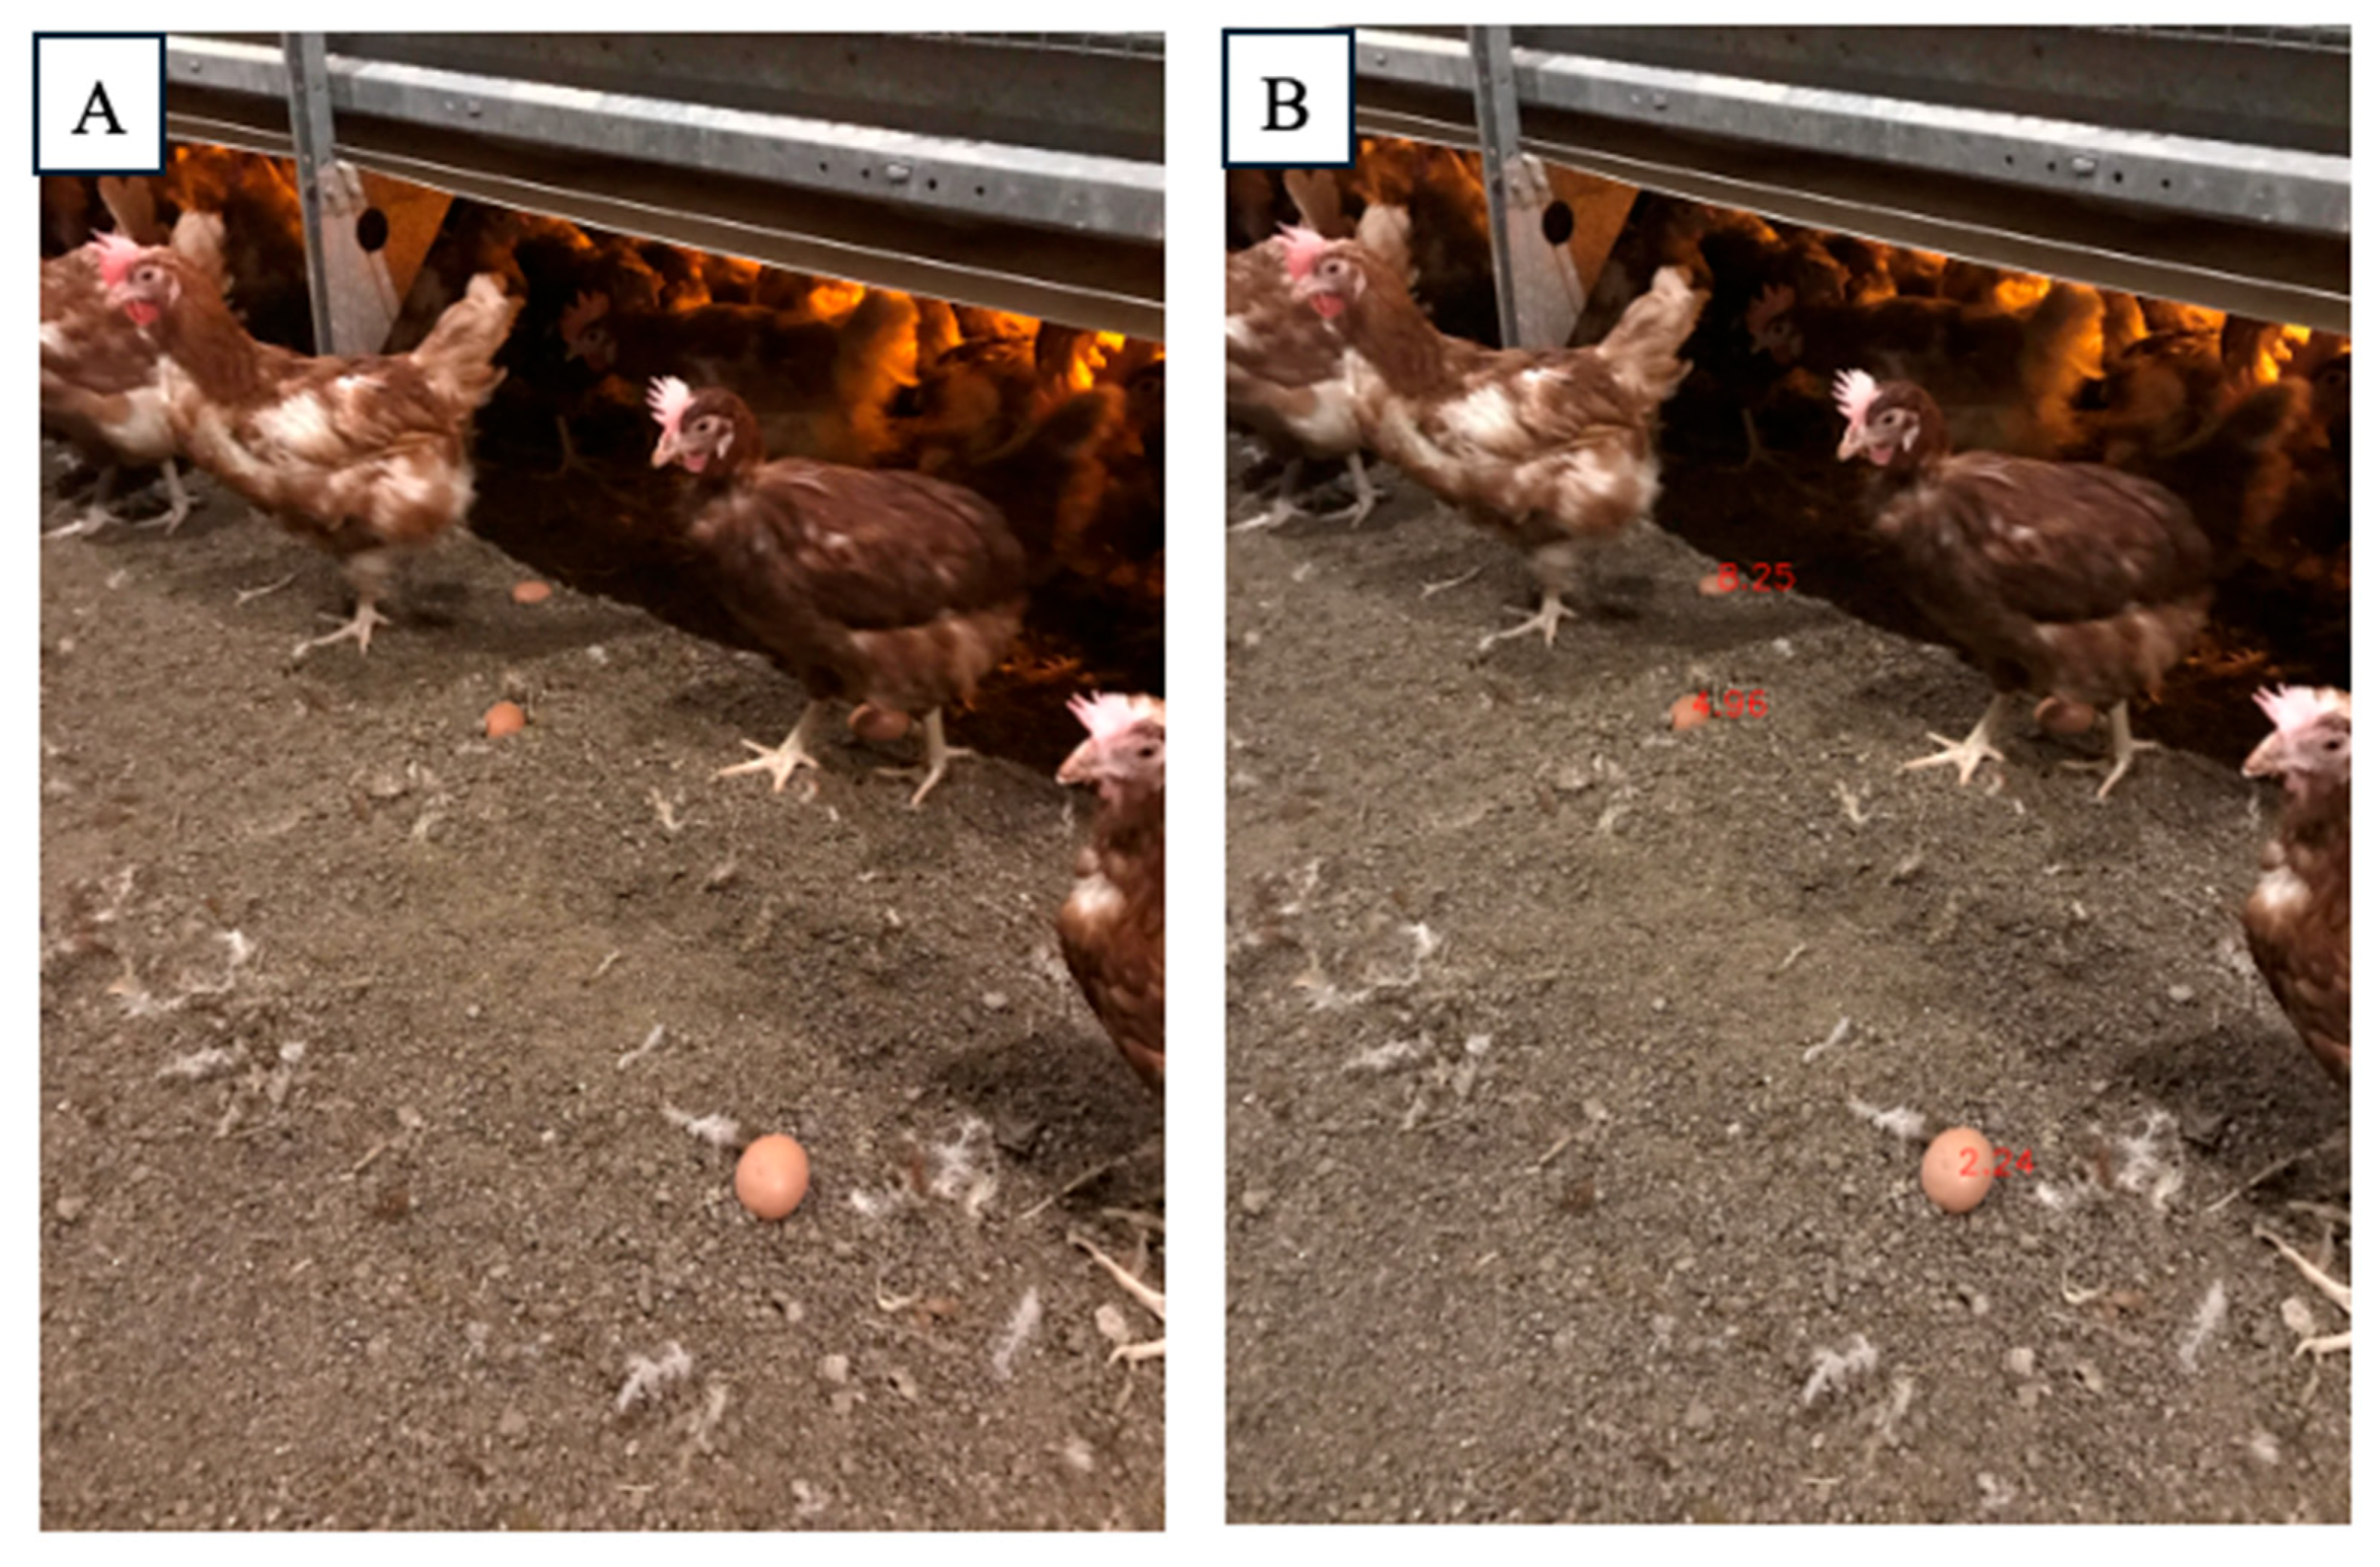
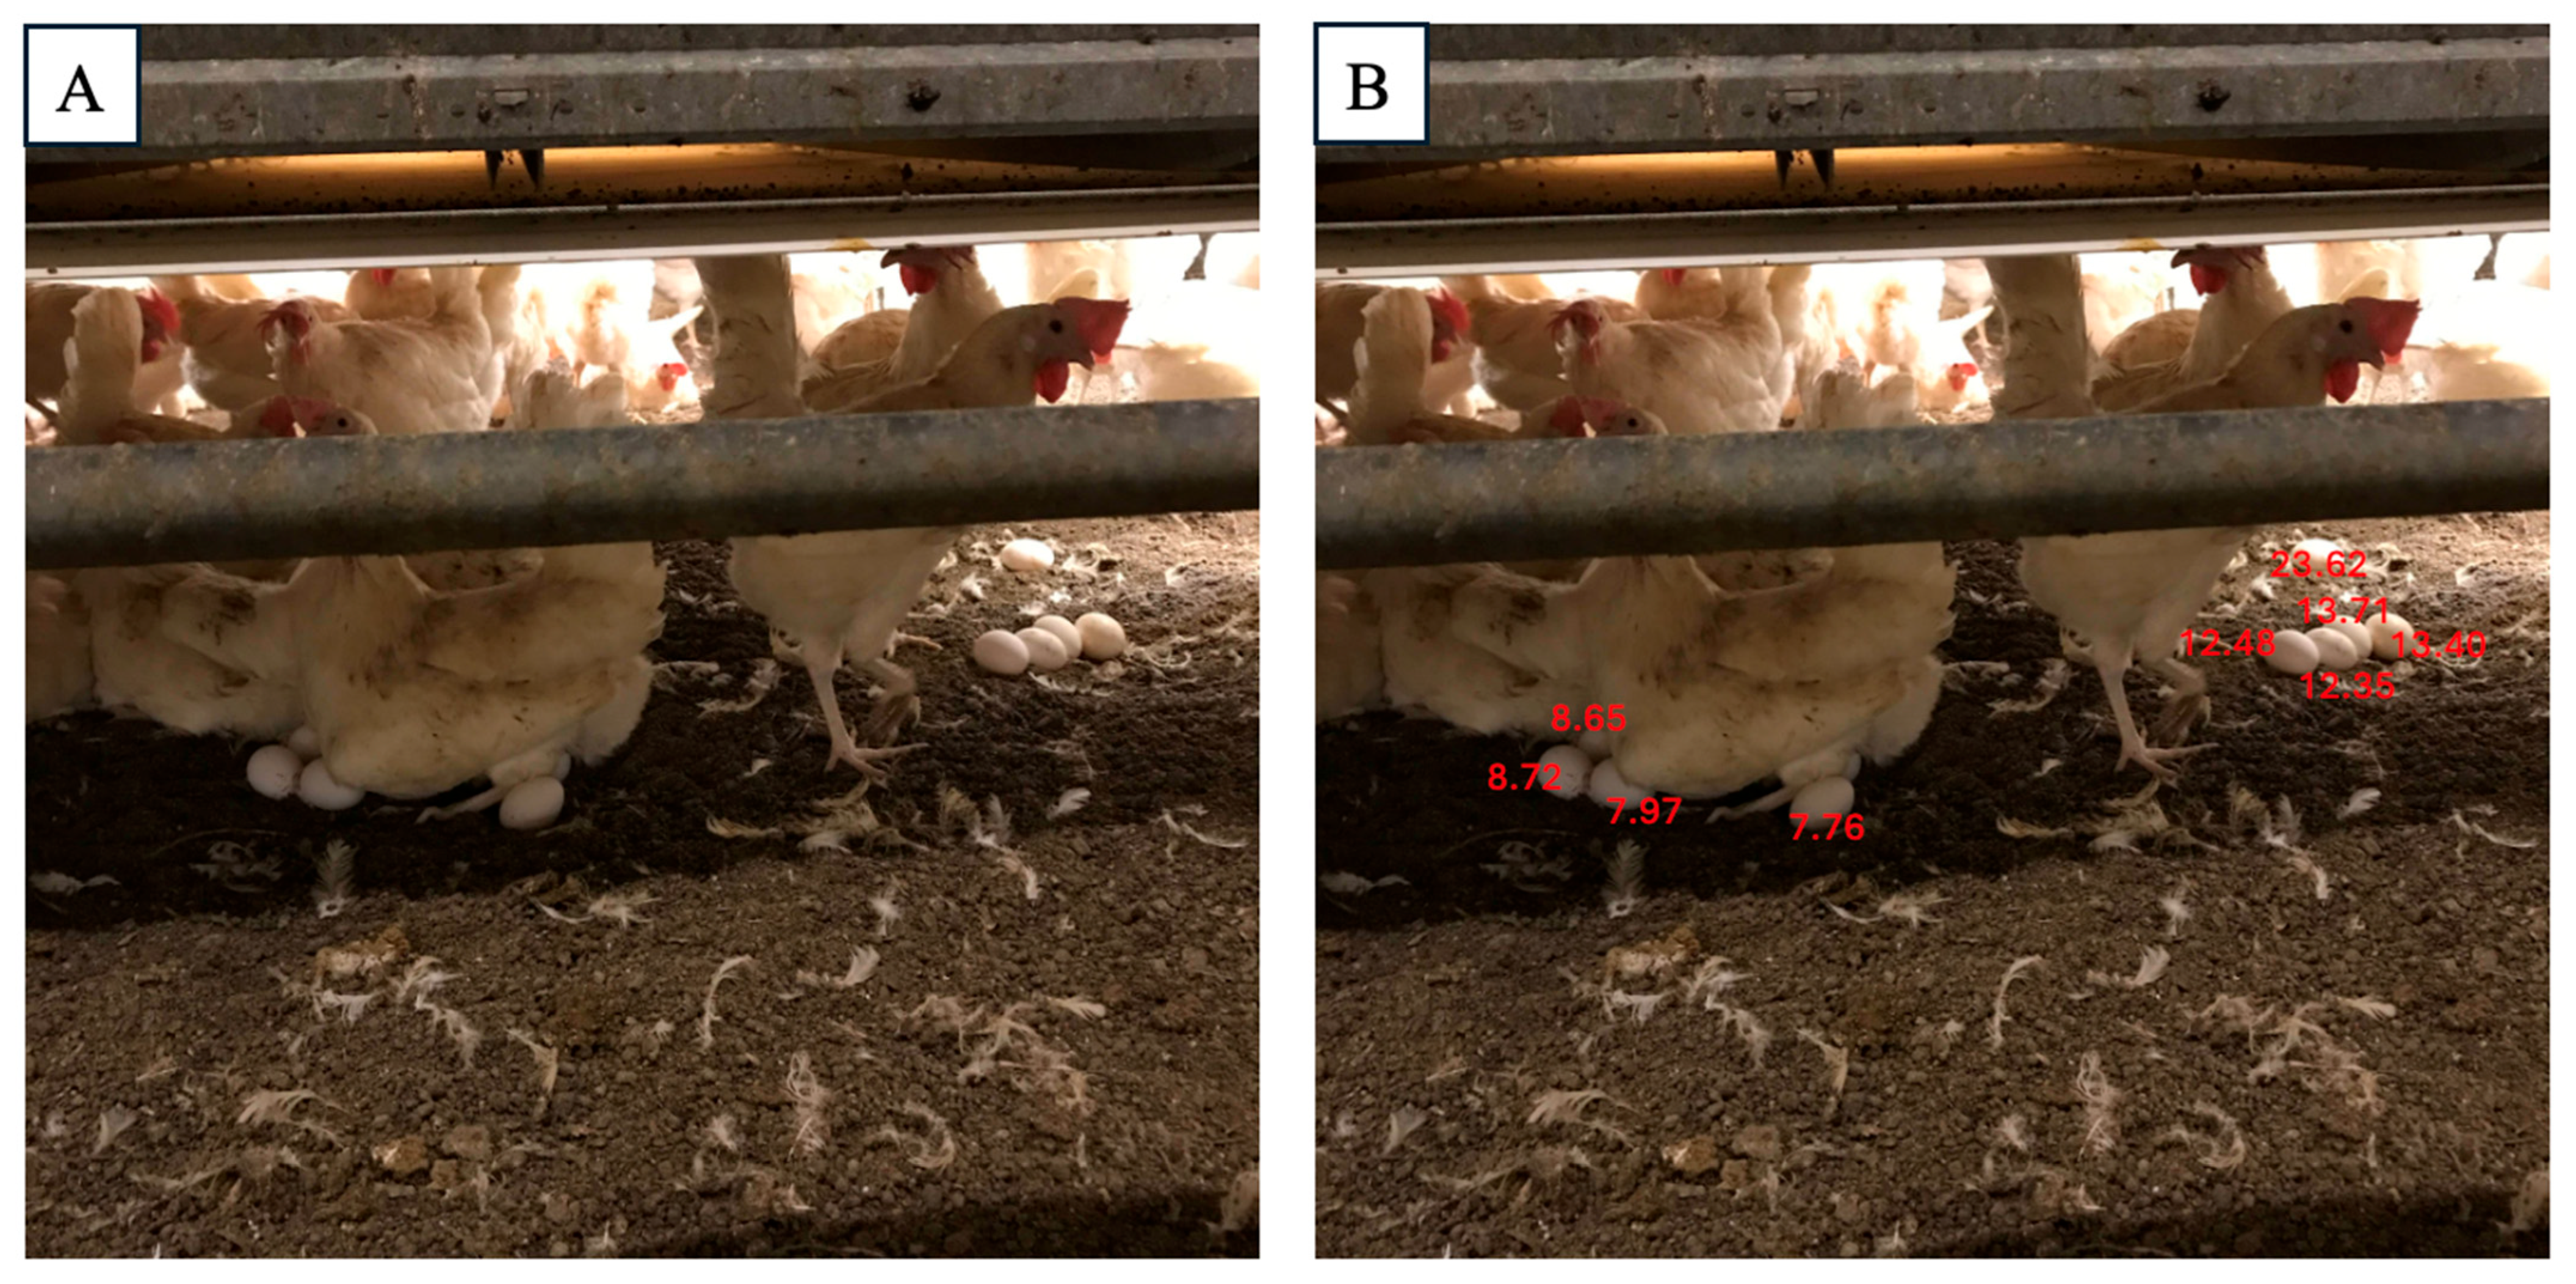
3.3. Evaluation of Applying DAM to Determine the Short Distance for Egg Collector Robotics

Mislaid eggs in cage-free houses are a common issue. While certain breeds of hens may have better habits for laying eggs in nesting boxes, the management of floor eggs remains an important area of exploration [38]. Egg collector robotics are at the forefront of solving this problem [39]. However, conventional egg collector robots typically collect eggs one by one, using computer vision to detect them. This method is efficient when the eggs are relatively dispersed across the poultry house. In real-world scenarios, however, hens tend to lay eggs in several concentrated areas, such as under feeders or in dark corners. When eggs are aggregated in these locations, the one-by-one collection strategy may become time-consuming. Through the utilization of depth estimation technology, it is possible to calculate the distance of each egg from the robotic collector and predict an optimal route. This approach allows for a more efficient collection process, minimizing time spent on retrieving eggs and improving overall productivity. In our research farm, chickens tended to lay eggs under the exhaust fan, so we detected the eggs’ disparities (0.5053, 0.5025, 0.5578, 0.5468, 0.5605, 0.6178, 0.6607, 0.6363, 0.7604, 0.7509, 0.9251) through DAM (Figure 6). The first step in optimizing the robot’s egg collection route involves grouping the eggs based on their depth disparities, which represent the relative distance between the eggs and the robot. To achieve this, the K-means clustering algorithm was applied to the disparity values [40]. This method allows for the identification of clusters of eggs that are spatially closer to one another, reducing the robot’s travel distance within each group. The clustering process resulted in three distinct clusters, as shown in Figure 7, with each cluster representing a group of eggs located in proximity based on their depth measurements. Once the eggs were grouped into clusters, the next step was to determine the most efficient collection sequence within each cluster. For each group, the disparities were sorted in ascending order, allowing the robot to begin with the closest egg and proceed sequentially within the cluster. This approach ensures that the robot minimizes travel time and energy consumption when operating within each cluster, as it collects eggs with disparities ranging from 0.6 to 0.76 in Cluster 1, disparities ranging from 0.5 to 0.64 in Cluster 2, and the single egg with a disparity of 0.9251 in Cluster 3. After establishing the collection order within each cluster, the full collection route was designed. The robot starts with the cluster closest to its starting position (Cluster 2) and collects eggs in the optimal sequence within this group. After completing the collection in Cluster 2, which includes eggs at indices [1, 0, 3, 2, 4, 5, 7], the robot proceeds to Cluster 1, repeating the same process of collecting eggs based on their proximity, which includes eggs at indices [6, 9, 8]. Finally, the robot moves to Cluster 3, which contains the farthest egg at index [10], and completes the collection process. The robot was controlled via the official Unitree Go1 app and pre-programmed to follow a fixed inspection route covering all sections of the farm. Compared to the traditional one-by-one route, the cluster-based strategy reduces motion time by 11% by allowing the robot to visit only the centroid of each cluster, minimizing redundant travel.

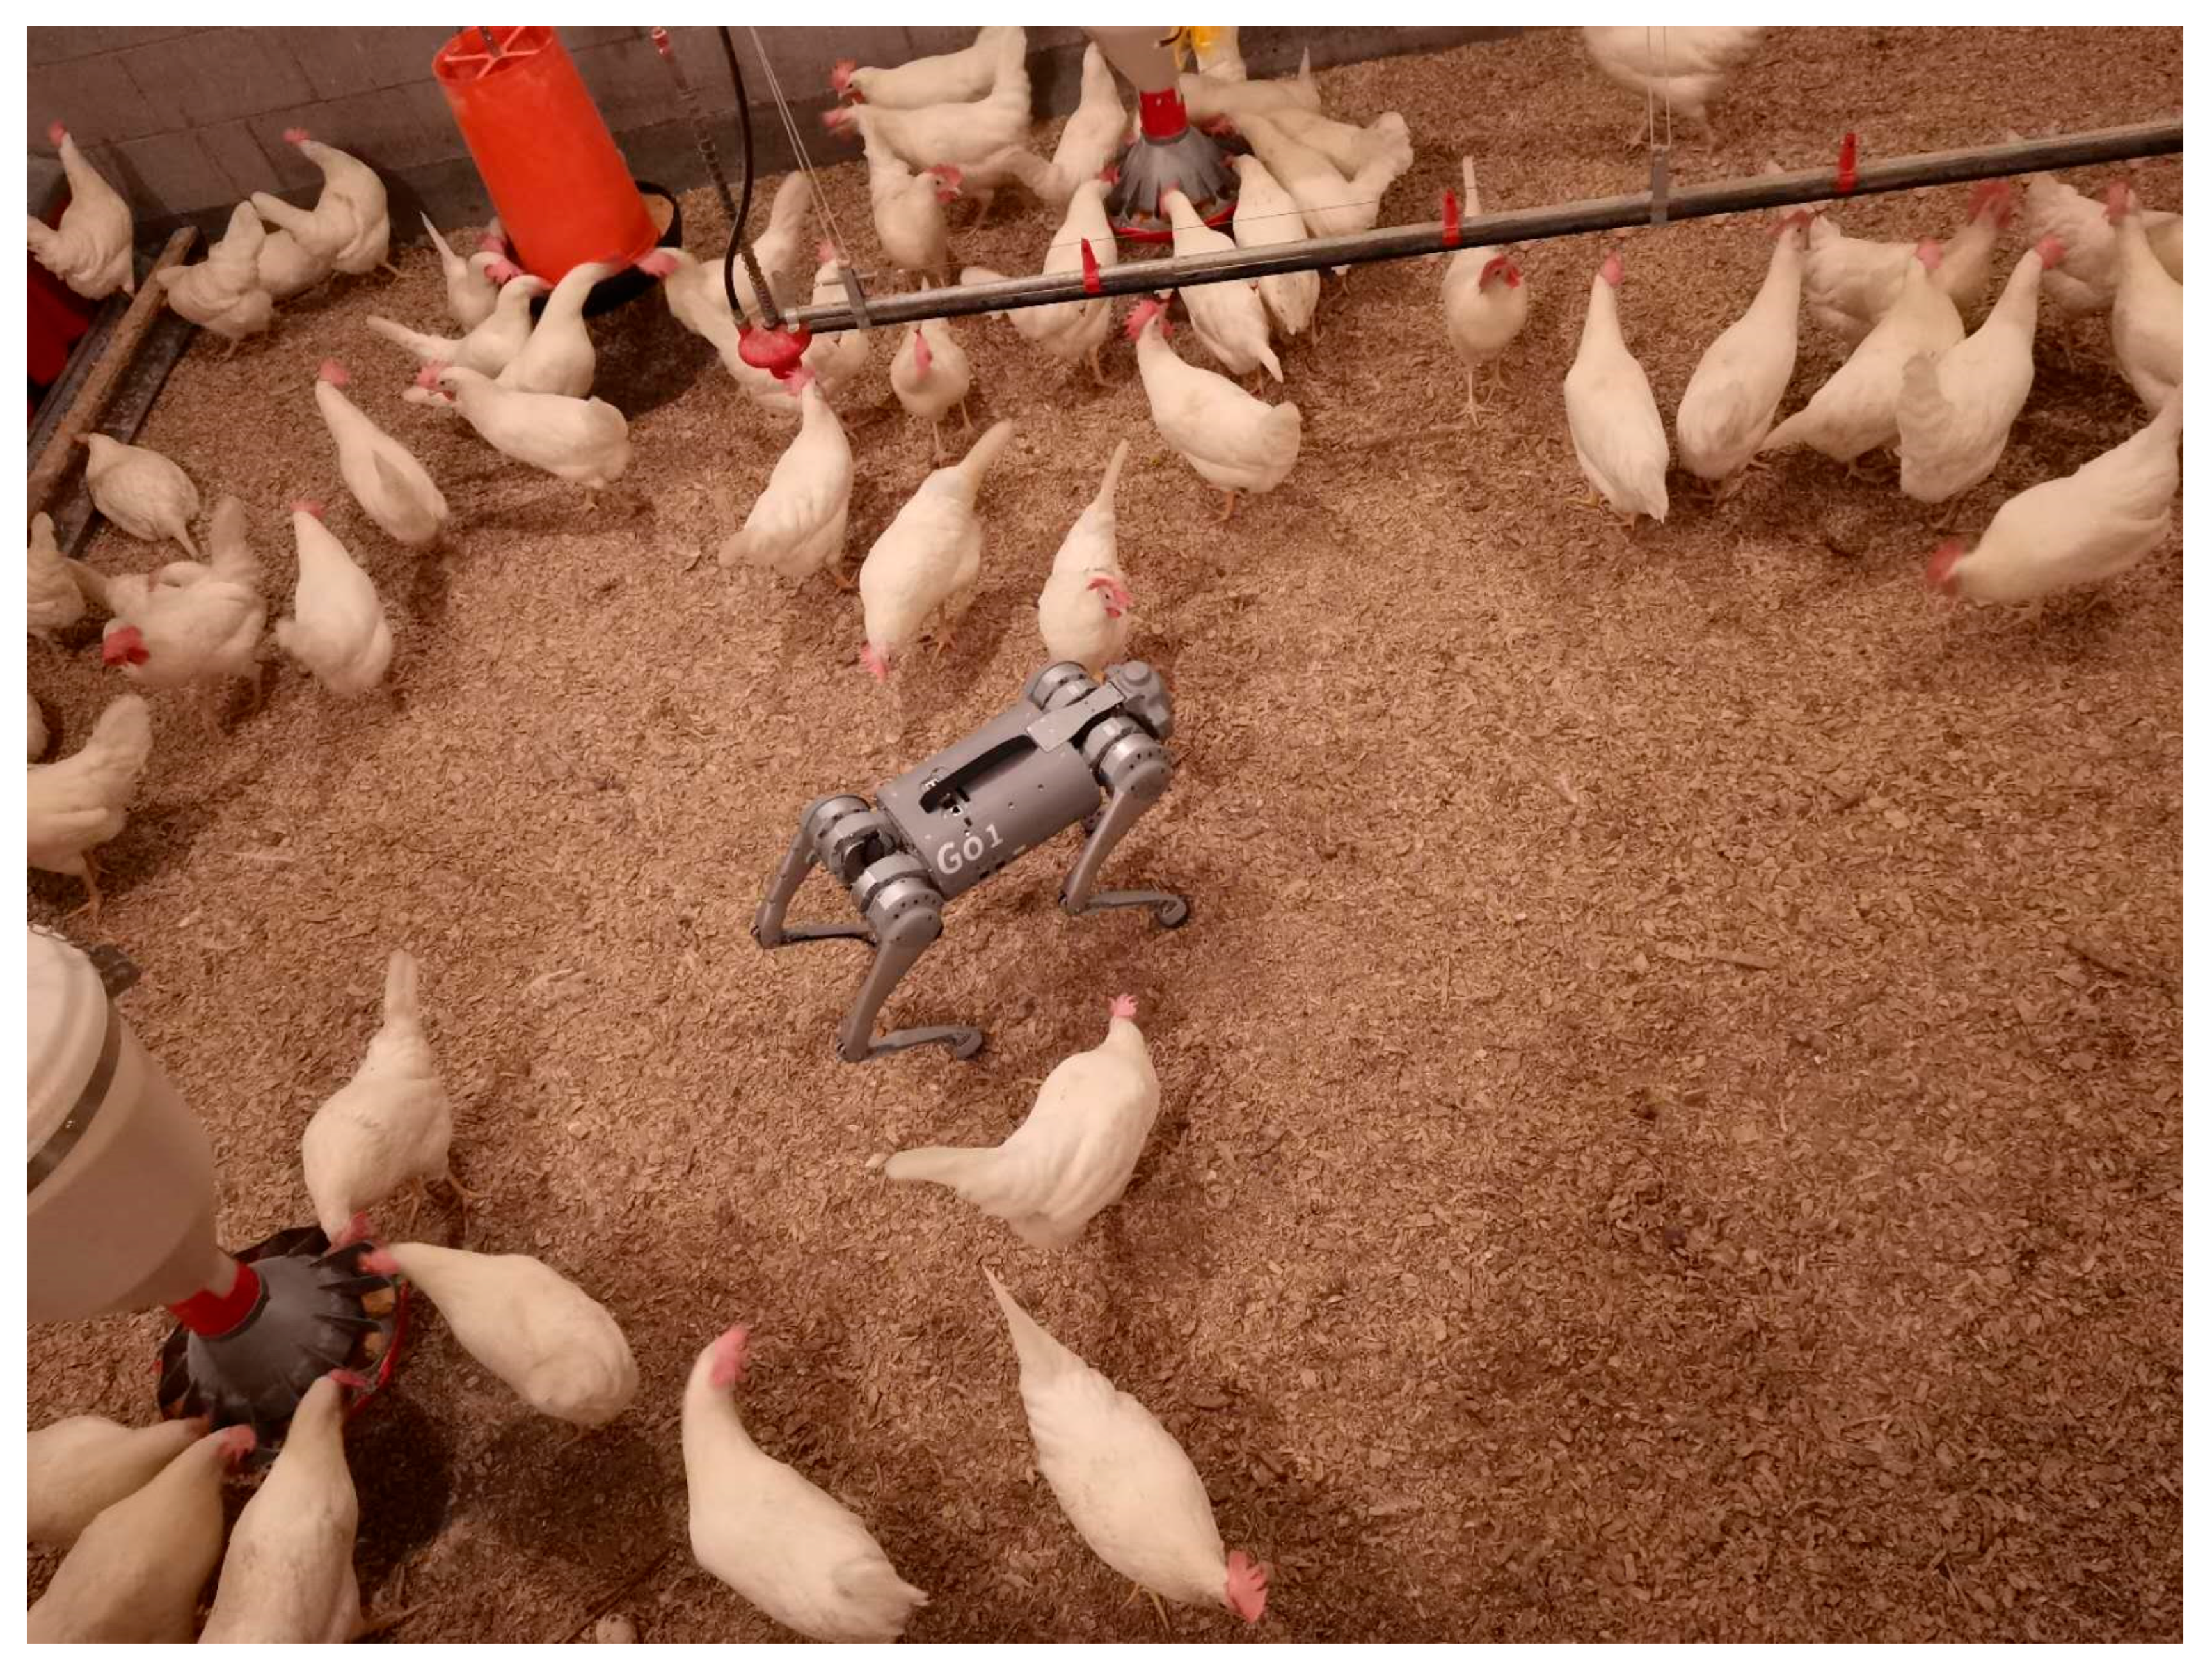
3.4. Exploring the Application of DAM in Commercial Cage-Free Houses

To further explore the application of the DAM in cage-free egg production, we conducted tests using twenty images consisting of commercial cage-free eggs with both white and brown shells, which represent the two main types of cage-free eggs. DAM demonstrated its capability to detect egg disparities effectively. For brown eggs, the disparities were measured at 2.24, 4.96, and 8.25 (Figure 8). In the case of white eggs, the disparities were 7.76, 7.97, 8.65, 8.72, 12.35, 12.48, 13.40, 13.71, and 23.62 (Figure 9). All egg disparities within these categories were correctly predicted, indicating that DAM is effective in detecting egg depth even in commercial cage-free farming systems. This depth information can be utilized to estimate the actual egg depth, enabling egg-collecting robotics to optimize picking routes, thereby improving efficiency and reducing operational costs.

4. Conclusions

This study evaluated the Depth Anything Model (DAM) for monocular depth estimation using standard RGB images in poultry farming, with the goal of eliminating the need for depth sensors. The DAM was applied to monitor poultry behaviors—particularly detecting drinking patterns—and to manage tasks like tracking floor eggs. Additionally, the model’s accuracy in detecting disparity was assessed using perch frame depth comparisons in cage-free environments. DAM showed robust depth prediction performance, accurately identifying drinking behavior and enabling optimized clustering for egg collection.
Although the model performed well overall, challenges such as false detections during drinking behavior and occlusions were noted. Further research will focus on enhancing detection accuracy under more complex conditions, including higher bird densities and commercial-scale variations. This work demonstrates the potential of DAM to improve behavioral monitoring and route optimization in cage-free systems, laying the groundwork for advanced machine vision solutions in precision livestock farming.

Author Contributions

Methodology, X.Y. and L.C.; Software, X.Y.; Validation, X.Y.; Formal analysis, X.Y.; Investigation, X.Y., G.L., J.Z., B.P., A.D., S.D., R.B.B. and L.C.; Resources, G.L. and L.C.; Writing—original draft, X.Y., G.L., J.Z., B.P., A.D., S.D. and L.C.; Supervision, L.C.; Project administration, L.C.; Funding acquisition, L.C. All authors have read and agreed to the published version of the manuscript.

Funding

The study was sponsored by the Georgia Research Alliance (Venture Fund), Oracle America (Oracle for Research Grant, CPQ-2060433), and UGA Institute for Integrative Precision Agriculture.

Data Availability Statement

The original contributions presented in this study are included in the article. Further inquiries can be directed to the corresponding author.

Conflicts of Interest

The authors declare no conflict of interest.

References

  1. Senoo, E.E.K.; Anggraini, L.; Kumi, J.A.; Luna, B.K.; Akansah, E.; Sulyman, H.A.; Mendonça, I.; Aritsugi, M. IoT Solutions with Artificial Intelligence Technologies for Precision Agriculture: Definitions, Applications, Challenges, and Opportunities. Electronics 2024, 13, 1894. [Google Scholar] [CrossRef]
  2. Li, N.; Ren, Z.; Li, D.; Zeng, L. Review: Automated Techniques for Monitoring the Behaviour and Welfare of Broilers and Laying Hens: Towards the Goal of Precision Livestock Farming. Animal 2020, 14, 617–625. [Google Scholar] [CrossRef]
  3. Sa, I.; Ge, Z.; Dayoub, F.; Upcroft, B.; Perez, T.; McCool, C. DeepFruits: A Fruit Detection System Using Deep Neural Networks. Sensors 2016, 16, 1222. [Google Scholar] [CrossRef]
  4. Kamilaris, A.; Prenafeta-Boldú, F.X. Deep Learning in Agriculture: A Survey. Comput. Electron. Agric. 2018, 147, 70–90. [Google Scholar] [CrossRef]
  5. Nasirahmadi, A.; Edwards, S.A.; Sturm, B. Implementation of Machine Vision for Detecting Behaviour of Cattle and Pigs. Livest. Sci. 2017, 202, 25–38. [Google Scholar] [CrossRef]
  6. Ranftl, R.; Bochkovskiy, A.; Koltun, V. Vision Transformers for Dense Prediction. In Proceedings of the IEEE/CVF International Conference on Computer Vision, Montreal, BC, Canada, 11–17 October 2021; pp. 12179–12188. [Google Scholar]
  7. Yang, L.; Kang, B.; Huang, Z.; Xu, X.; Feng, J.; Zhao, H. Depth Anything: Unleashing the Power of Large-Scale Unlabeled Data. In Proceedings of the IEEE/CVF Conference on Computer Vision and Pattern Recognition, Seattle, WA, USA, 16–22 June 2024. [Google Scholar]
  8. Krizhevsky, A.; Sutskever, I.; Hinton, G.E. ImageNet Classification with Deep Convolutional Neural Networks. In Advances in Neural Information Processing Systems; Curran Associates, Inc.: Red Hook, NY, USA, 2012; Volume 25. [Google Scholar]
  9. Choi, D.; Lee, W.S.; Schueller, J.K.; Ehsani, R.; Roka, F.; Diamond, J. A Performance Comparison of RGB, NIR, and Depth Images in Immature Citrus Detection Using Deep Learning Algorithms for Yield Prediction. In Proceedings of the 2017 ASABE Annual International Meeting, Spokane, WA, USA, 16–19 July 2017; American Society of Agricultural and Biological Engineers: St. Joseph, MI, USA, 2017; p. 1. [Google Scholar]
  10. Bekhor, S.; Ben-Akiva, M.E.; Ramming, M.S. Evaluation of Choice Set Generation Algorithms for Route Choice Models. Ann. Oper. Res. 2006, 144, 235–247. [Google Scholar] [CrossRef]
  11. Sharma, V.; Tripathi, A.K.; Mittal, H. Technological Revolutions in Smart Farming: Current Trends, Challenges & Future Directions. Comput. Electron. Agric. 2022, 201, 107217. [Google Scholar] [CrossRef]
  12. Bist, R.B.; Yang, X.; Subedi, S.; Chai, L. Mislaying Behavior Detection in Cage-Free Hens with Deep Learning Technologies. Poult. Sci. 2023, 102, 102729. [Google Scholar] [CrossRef] [PubMed]
  13. Guo, Q.; Shi, Z.; Huang, Y.-W.; Alexander, E.; Qiu, C.-W.; Capasso, F.; Zickler, T. Compact Single-Shot Metalens Depth Sensors Inspired by Eyes of Jumping Spiders. Proc. Natl. Acad. Sci. USA 2019, 116, 22959–22965. [Google Scholar] [CrossRef]
  14. Yang, X.; Chai, L.; Bist, R.B.; Subedi, S.; Wu, Z. A Deep Learning Model for Detecting Cage-Free Hens on the Litter Floor. Animals 2022, 12, 1983. [Google Scholar] [CrossRef]
  15. Vroegindeweij, B.A.; van Willigenburg, G.L.; Groot Koerkamp, P.W.G.; van Henten, E.J. Path Planning for the Autonomous Collection of Eggs on Floors. Biosyst. Eng. 2014, 121, 186–199. [Google Scholar] [CrossRef]
  16. Martinez Angulo, A.; Henry, S.; Tanveer, M.H.; Voicu, R.; Koduru, C. The Voice-To-Text Implementation with ChatGPT in Unitree Go1 Programming. 2024. Available online: https://digitalcommons.kennesaw.edu/undergradsymposiumksu/spring2024/spring2024/227/ (accessed on 8 June 2025).
  17. Kirillov, A.; Mintun, E.; Ravi, N.; Mao, H.; Rolland, C.; Gustafson, L.; Xiao, T.; Whitehead, S.; Berg, A.C.; Lo, W.-Y.; et al. Segment Anything. In Proceedings of the IEEE/CVF International Conference on Computer Vision, Paris, France, 1–6 October 2023. [Google Scholar]
  18. Yu, F.; Chen, H.; Wang, X.; Xian, W.; Chen, Y.; Liu, F.; Madhavan, V.; Darrell, T. BDD100K: A Diverse Driving Dataset for Heterogeneous Multitask Learning. In Proceedings of the 2020 IEEE/CVF Conference on Computer Vision and Pattern Recognition (CVPR), Seattle, WA, USA, 13–19 June 2020; pp. 2633–2642. [Google Scholar]
  19. Yun, S.; Han, D.; Oh, S.J.; Chun, S.; Choe, J.; Yoo, Y. Cutmix: Regularization Strategy to Train Strong Classifiers with Localizable Features. In Proceedings of the IEEE/CVF International Conference on Computer Vision, Seoul, Republic of Korea, 27 October–2 November 2019; pp. 6023–6032. [Google Scholar]
  20. Oquab, M.; Darcet, T.; Moutakanni, T.; Vo, H.; Szafraniec, M.; Khalidov, V.; Fernandez, P.; Haziza, D.; Massa, F.; El-Nouby, A.; et al. DINOv2: Learning Robust Visual Features without Supervision. arXiv 2024, arXiv:2304.07193. [Google Scholar]
  21. Pham, H.; Dai, Z.; Xie, Q.; Le, Q.V. Meta Pseudo Labels. In Proceedings of the IEEE/CVF Conference on Computer Vision and Pattern Recognition, Nashville, TN, USA, 20–25 June 2021; pp. 11557–11568. [Google Scholar]
  22. Silberman, N.; Hoiem, D.; Kohli, P.; Fergus, R. Indoor Segmentation and Support Inference from RGBD Images. In Computer Vision—ECCV 2012, Proceedings of the 12th European Conference on Computer Vision, Florence, Italy, 7–13 October 2012; Fitzgibbon, A., Lazebnik, S., Perona, P., Sato, Y., Schmid, C., Eds.; Lecture Notes in Computer Science; Springer: Berlin/Heidelberg, Germany, 2012; Volume 7576, pp. 746–760. ISBN 978-3-642-33714-7. [Google Scholar]
  23. Eigen, D.; Puhrsch, C.; Fergus, R. Depth Map Prediction from a Single Image Using a Multi-Scale Deep Network. In Advances in Neural Information Processing Systems; Curran Associates, Inc.: Red Hook, NY, USA, 2014; Volume 27. [Google Scholar]
  24. Lin, C.-Y.; Hsieh, K.-W.; Tsai, Y.-C.; Kuo, Y.-F. Automatic Monitoring of Chicken Movement and Drinking Time Using Convolutional Neural Networks. Trans. ASABE 2020, 63, 2029–2038. [Google Scholar] [CrossRef]
  25. Truswell, A.; Lee, Z.Z.; Stegger, M.; Blinco, J.; Abraham, R.; Jordan, D.; Milotic, M.; Hewson, K.; Pang, S.; Abraham, S. Augmented Surveillance of Antimicrobial Resistance with High-Throughput Robotics Detects Transnational Flow of Fluoroquinolone-Resistant Escherichia Coli Strain into Poultry. J. Antimicrob. Chemother. 2023, 78, 2878–2885. [Google Scholar] [CrossRef] [PubMed]
  26. Geiger, A.; Roser, M.; Urtasun, R. Efficient Large-Scale Stereo Matching. In Computer Vision—ACCV 2010, Proceedings of the 10th Asian Conference on Computer Vision, Queenstown, New Zealand, 8–12 November 2010; Kimmel, R., Klette, R., Sugimoto, A., Eds.; Springer: Berlin/Heidelberg, Germany, 2011; pp. 25–38. [Google Scholar]
  27. Bist, R.B.; Subedi, S.; Chai, L.; Regmi, P.; Ritz, C.W.; Kim, W.K.; Yang, X. Effects of Perching on Poultry Welfare and Production: A Review. Poultry 2023, 2, 134–157. [Google Scholar] [CrossRef]
  28. Gunnarsson, S.; Yngvesson, J.; Keeling, L.J.; Forkman, B. Rearing without Early Access to Perches Impairs the Spatial Skills of Laying Hens. Appl. Anim. Behav. Sci. 2000, 67, 217–228. [Google Scholar] [CrossRef]
  29. Abas, A.M.F.M.; Azmi, N.A.; Amir, N.S.; Abidin, Z.Z.; Shafie, A.A. Chicken Farm Monitoring System. In Proceedings of the 6th International Conference on Computer and Communication Engineering (ICCCE 2016), Kuala Lumpur, Malaysia, 26–27 July 2016; IEEE: New York, NY, USA, 2016; pp. 132–137. [Google Scholar]
  30. Chen, Z.; Hou, Y.; Yang, C. Research on Identification of Sick Chicken Based on Multi Region Deep Features Fusion. In Proceedings of the 2021 6th International Conference on Computational Intelligence and Applications (ICCIA), Xiamen, China, 11–13 June 2021; pp. 174–179. [Google Scholar]
  31. Nasiri, A.; Amirivojdan, A.; Zhao, Y.; Gan, H. An Automated Video Action Recognition-Based System for Drinking Time Estimation of Individual Broilers. Smart Agric. Technol. 2024, 7, 100409. [Google Scholar] [CrossRef]
  32. Li, G.; Ji, B.; Li, B.; Shi, Z.; Zhao, Y.; Dou, Y.; Brocato, J. Assessment of Layer Pullet Drinking Behaviors under Selectable Light Colors Using Convolutional Neural Network. Comput. Electron. Agric. 2020, 172, 105333. [Google Scholar] [CrossRef]
  33. Bist, R.B.; Subedi, S.; Yang, X.; Chai, L. A Novel YOLOv6 Object Detector for Monitoring Piling Behavior of Cage-Free Laying Hens. AgriEngineering 2023, 5, 905–923. [Google Scholar] [CrossRef]
  34. Bidese Puhl, R. Precision Agriculture Systems for the Southeast US Using Computer Vision and Deep Learning. Ph.D. Thesis, Auburn University, Auburn, AL, USA, 2023. [Google Scholar]
  35. Girshick, R.; Donahue, J.; Darrell, T.; Malik, J. Region-Based Convolutional Networks for Accurate Object Detection and Segmentation. IEEE Trans. Pattern Anal. Mach. Intell. 2016, 38, 142–158. [Google Scholar] [CrossRef]
  36. Zhang, H.; Zhang, L.; Jiang, Y. Overfitting and Underfitting Analysis for Deep Learning Based End-to-End Communication Systems. In Proceedings of the 2019 11th International Conference on Wireless Communications and Signal Processing (WCSP), Xi’an, China, 23–25 October 2019; pp. 1–6. [Google Scholar]
  37. Wolc, A.; Settar, P.; Fulton, J.E.; Arango, J.; Rowland, K.; Lubritz, D.; Dekkers, J.C.M. Heritability of Perching Behavior and Its Genetic Relationship with Incidence of Floor Eggs in Rhode Island Red Chickens. Genet. Sel. Evol. 2021, 53, 38. [Google Scholar] [CrossRef] [PubMed]
  38. Chang, C.-L.; Xie, B.-X.; Wang, C.-H. Visual Guidance and Egg Collection Scheme for a Smart Poultry Robot for Free-Range Farms. Sensors 2020, 20, 6624. [Google Scholar] [CrossRef] [PubMed]
  39. Ahmed, M.; Seraj, R.; Islam, S.M.S. The K-Means Algorithm: A Comprehensive Survey and Performance Evaluation. Electronics 2020, 9, 1295. [Google Scholar] [CrossRef]
  40. Ren, G.; Lin, T.; Ying, Y.; Chowdhary, G.; Ting, K.C. Agricultural Robotics Research Applicable to Poultry Production: A Review. Comput. Electron. Agric. 2020, 169, 105216. [Google Scholar] [CrossRef]
Figure 1. Positions of installed ceiling cameras for monitoring hens’ behaviors.
Applsci 15 06625 g001
Figure 2. The robot dog in walking mode for collecting chicken and egg images in the research poultry house.
Applsci 15 06625 g002
Figure 3. Pipeline for the deep anything model applied in poultry science for monitoring and analysis (S means strong perturbations).
Applsci 15 06625 g003
Figure 4. Depth detection of perching frame in poultry using DAM (Depth Anything Model). (A) shows the original camera image of poultry perching on a multi-level structure, while (B) represents the corresponding depth map generated by DAM.
Applsci 15 06625 g004
Figure 5. The Depth Anything Model (DAM) for monitoring drinking behavior: (A) original image, and (B) detected actual drinking behavior.
Applsci 15 06625 g005
Figure 6. The disparity detected by DAM (Depth Anything Model). (A) original image, (B) detected image showing disparity in eggs.
Applsci 15 06625 g006
Figure 7. Clustered egg collection route based on disparity.
Applsci 15 06625 g007
Figure 8. Disparity detected by DAM (Depth Anything Model) in brown-shelled cage-free eggs. (A) original image, (B) detected image showing disparity in eggs.
Applsci 15 06625 g008
Figure 9. Disparity detected by DAM (Depth Anything Model) in white-shelled cage-free eggs. (A) original image, (B) detected image showing disparity in eggs.
Applsci 15 06625 g009
Table 1. Predicted and actual depths of perch frames with adjusted predictions.
Perch LevelPredicted DisparityAdjusted Depth (m)Actual Depth (m)
10.004561.181.00
20.005751.491.60
30.007481.932.00
40.009842.312.40
50.010482.712.70
Disclaimer/Publisher’s Note: The statements, opinions and data contained in all publications are solely those of the individual author(s) and contributor(s) and not of MDPI and/or the editor(s). MDPI and/or the editor(s) disclaim responsibility for any injury to people or property resulting from any ideas, methods, instructions or products referred to in the content.

