Next Article in Journal
Recent Developments on Biomineralization for Erosion Control
Previous Article in Journal
Acoustic Analysis and Perceptual Evaluation of Second Language Cantonese Tones Produced by Advanced Mandarin-Speaking Learners
 
 
Due to scheduled maintenance work on our database systems, there may be short service disruptions on this website between 10:00 and 11:00 CEST on June 14th.
Article

LiteTom-RTDETR: A Lightweight Real-Time Tomato Detection System for Plant Factories

1
School of Mechanical Engineering, Shaanxi University of Technology, Hanzhong 723000, China
2
School of Mechanics, Civil Engineering and Architecture, Northwestern Polytechnical University, Xi’an 710129, China
*
Author to whom correspondence should be addressed.
Appl. Sci. 2025, 15(12), 6589; https://doi.org/10.3390/app15126589
Submission received: 6 May 2025 / Revised: 5 June 2025 / Accepted: 10 June 2025 / Published: 11 June 2025

Abstract

:
The accuracy and speed of tomato detection were increased to facilitate fully automated harvesting by improving the Real-Time Detection Transformer (RTDETR) to develop a new lightweight tomato detection model called LiteTom-RTDETR. This model employed RepViT as a lightweight backbone network instead of the original RTDETR backbone, considerably reducing both the number of parameters in and computational complexity of the model. Furthermore, a context guide fusion module was designed to enhance multiscale feature extraction efficiency, and an adaptive sliding weight mechanism was integrated into the loss function to mitigate class-imbalance issues. The proposed LiteTom-RTDETR model was shown to balance high tomato identification accuracy (88.2%) with an excellent real-time inference speed (52.2 frames per second) and computational efficiency (36.3 GFLOPs). Notably, the average detection accuracy of LiteTom-RTDETR was 0.6% higher, its detection speed was 15.5% faster, and its computational load and model size were 36.2% and 31.6% smaller, respectively, than those of the original RTDETR model. Therefore, the proposed model provides a practical approach for realizing visual recognition tasks in resource-constrained mobile automated tomato harvesting equipment.

1. Introduction

Tomatoes are well-suited for multicyclic cultivation in greenhouse plant factories because of their short growth cycle, which enables multiple harvests annually for a high economic return [1]. Currently, tomato harvesting is a labor-intensive and time-consuming process [2] primarily because tomato plants yield a high fruit density in an uneven vertical distribution and their dense foliage often obstructs access to fruit clusters. As these challenges make finding fruits difficult and thereby hinder the effective implementation of mechanical automation, realizing the rapid and accurate identification of ripe tomatoes represents a crucial step toward automating the harvesting process.
Indeed, object recognition plays a crucial role in the vision systems of tomato-harvesting robots. Rapid advances in deep learning have introduced revolutionary computer vision methodologies, with modern object detection algorithms transitioning from traditional handcrafted feature extraction approaches to data-driven paradigms based on neural networks [3,4]. Traditional image processing techniques primarily include color feature identification, edge detection, and texture analysis, whereas deep-learning-based detectors widely employ convolutional neural networks (CNNs) to realize feature extraction [5,6]. For example, Junhui et al. [7] achieved an 86.3% recognition accuracy for ripe tomatoes in complex scenarios by analyzing edge contour features and improving the Hough circle transformation algorithm, which significantly enhanced computational efficiency. Furthermore, Zeng [8] combined image saliency with a CNN model to extract and classify features, achieving an accuracy of 95.6% on a self-assembled dataset containing 26 classes of fruits and vegetables. The recognition accuracy of most CNNs can be improved by increasing the network depth and stacking additional convolutional layers to enhance feature extraction [9]. However, this approach requires significant computational resources and storage overhead, potentially leading to training inefficiencies, excessive parameters, and challenges in meeting practical deployment requirements for mobile and embedded devices.
Various implementations of object recognition in agricultural produce detection systems have been achieved through representative CNN-based single-stage detectors, particularly the single-shot multibox detector (SSD) [10] and you only look once (YOLO) [11] approaches. The operational superiority of these models is derived from their sustained real-time inference speeds and energy-efficient computation, which satisfy the stringent requirements for resource-constrained edge deployment in precision agriculture scenarios. Notably, Xin et al. [12] replaced the backbone network of an SSD with a lightweight MobileNetV3 network and enhanced its original model framework using depthwise separable convolutions to achieve a recognition accuracy of 92.5%, a 7.9% improvement over that of the baseline model. Zheng et al. [13] enhanced the original YOLOv8 model by integrating a Large Separable Kernel Attention mechanism, dynamic upsampling layer, and Inner Intersection over Union loss function. The modified model achieved a recognition accuracy of 99.4% on a test dataset, demonstrating a 3.3% higher precision than that provided by a YOLOv5 model. Although CNN-based models typically exhibit satisfactory detection accuracy, two critical steps—threshold filtering and non-maximum suppression (NMS)—dictate their robustness and inference speed [14]. The Real-Time Detection Transformer (RTDETR) [15] is a novel detection method that eliminates the need for NMS post-processing, thereby reducing optimization complexity and enhancing robustness. Nevertheless, challenges persist in RTDETR implementation, including redundant backbone architectures and suboptimal data flow between modules.
Researchers have recently focused on developing lightweight network architectures with significantly enhanced model deployment adaptability to edge computing scenarios, including mobile and embedded devices. Zuo et al. [16] reduced computational costs by replacing standard convolutions with lightweight grouped spatial convolutions and enhanced feature extraction using a triplet attention mechanism in a YOLOv8 backbone network. Furthermore, they optimized multi-scale feature fusion by substituting the original path aggregation network–feature pyramid network with a bidirectional feature pyramid network. The experimental results demonstrated an identification accuracy of 94.4% and reductions in computational cost, parameters, and model size of 32.1%, 47.8%, and 44.4%, respectively, compared with those of the baseline model. Xu et al. [17] optimized the backbone network using partial convolution and efficient multiscale attention to reduce computational overhead. Furthermore, the original cross-stage partial bottleneck with two convolutions module in the neck structure was replaced with generalized sparse convolution and variety-of-view group shuffle cross stage partial connections modules; an auxiliary head was also incorporated to improve small-target recognition. This model achieved an accuracy of 93.4% and reduced the computational cost, parameters, and model size by 22.9%, 20%, and 50%, respectively, compared to the original model. Furthermore, Zeyang et al. [18] reduced computational costs by replacing the original backbone network with EfficientNet-B0 and enhanced feature retention using a mobile inverted bottleneck convolution module. They also optimized the loss and activation functions using the Distance Intersection over Union and Hardswish, respectively, to improve convergence and inference speed. Their experimental results indicated an accuracy of 95.9% with a 55.1% reduction in computational cost, 48.9% smaller model, and 59.3% faster inference speed compared to the baseline model. Diye et al. [19] adopted a lightweight FasterNet backbone to reduce the computational overhead and introduced cascaded group attention and high-level screening–feature fusion pyramid networks to address the feature fusion challenges in complex backgrounds. Furthermore, they implemented the Focaler Intersection over Union loss function to enhance edge detection precision. The resulting model achieved an accuracy of 96.4% with a 16.1% smaller computational cost, 18.2% fewer parameters, and 10.1% faster inference speed compared to the original model.
These results of previous research have clearly demonstrated iterative advancements in object recognition and detection technologies by improving critical technical characteristics, including detection accuracy, inference speed, and model size. Although innovative methodological frameworks and engineering solutions have been developed to advance these domains, few studies have evaluated the use of RTDETR-based lightweight models for tomato classification and recognition. To overcome these dual limitations of accuracy degradation and inefficient computation, RTDETR’s NMS-free architecture serves as the foundational framework. Its inherent attention mechanism provides robust occlusion reasoning capabilities, though structural optimization remains essential for agricultural edge deployment. Therefore, this study experimentally investigated the recognition performance of a proposed Lightweight Tomato Real-Time Detection Transformer (LiteTom-RTDETR) on images of tomato samples cultivated in plant factory laboratories in three growth stages (immature, semi-mature, mature) under three supplemental lighting conditions (blue, red, and white). The proposed LiteTom-RTDETR model is based on an RTDETR architecture that was improved to maintain high recognition accuracy while significantly reducing computational complexity. This approach provides a theoretical foundation for the deployment of agricultural vision systems on resource-constrained mobile devices.
The primary focus of this paper encompasses the following aspects:
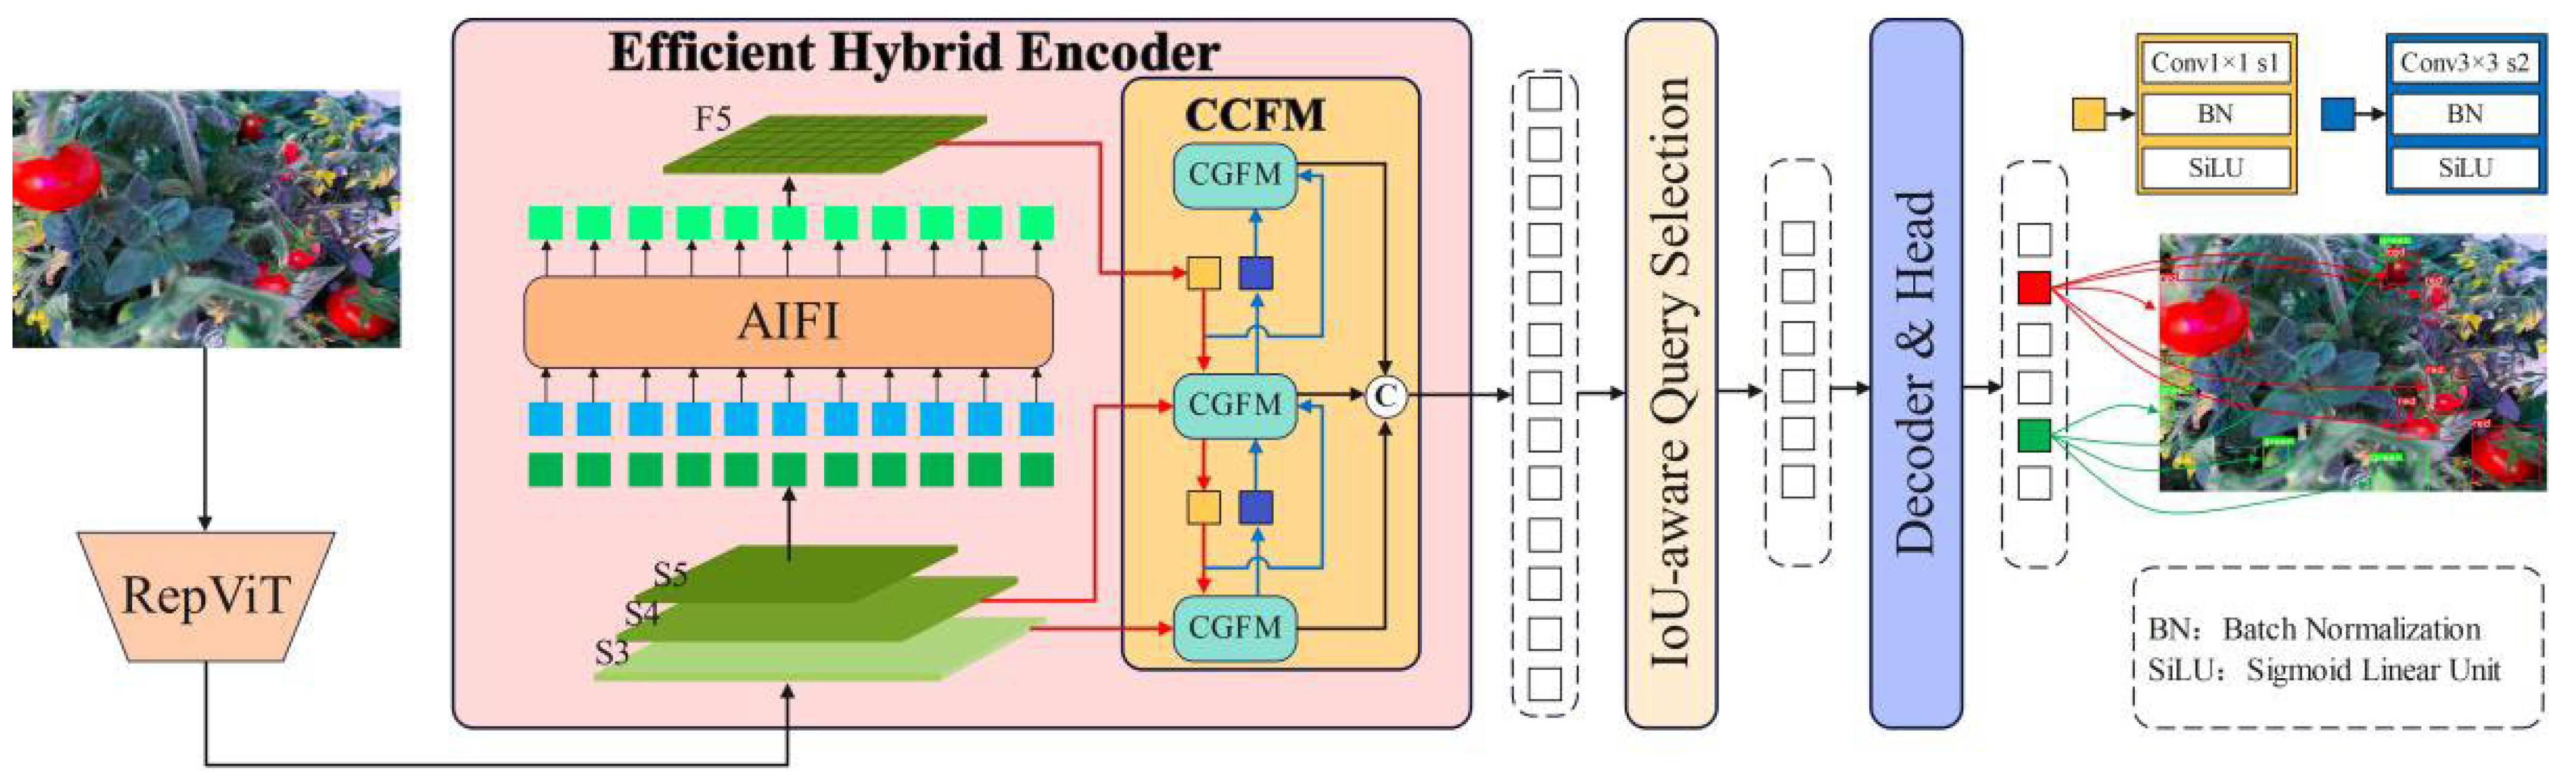
  • An innovative lightweight tomato-based target detection model named LiteTom-RTDETR is proposed for tomato detection in plant factories. This model not only effectively improves detection performance but also significantly reduces model complexity and parameter counts.
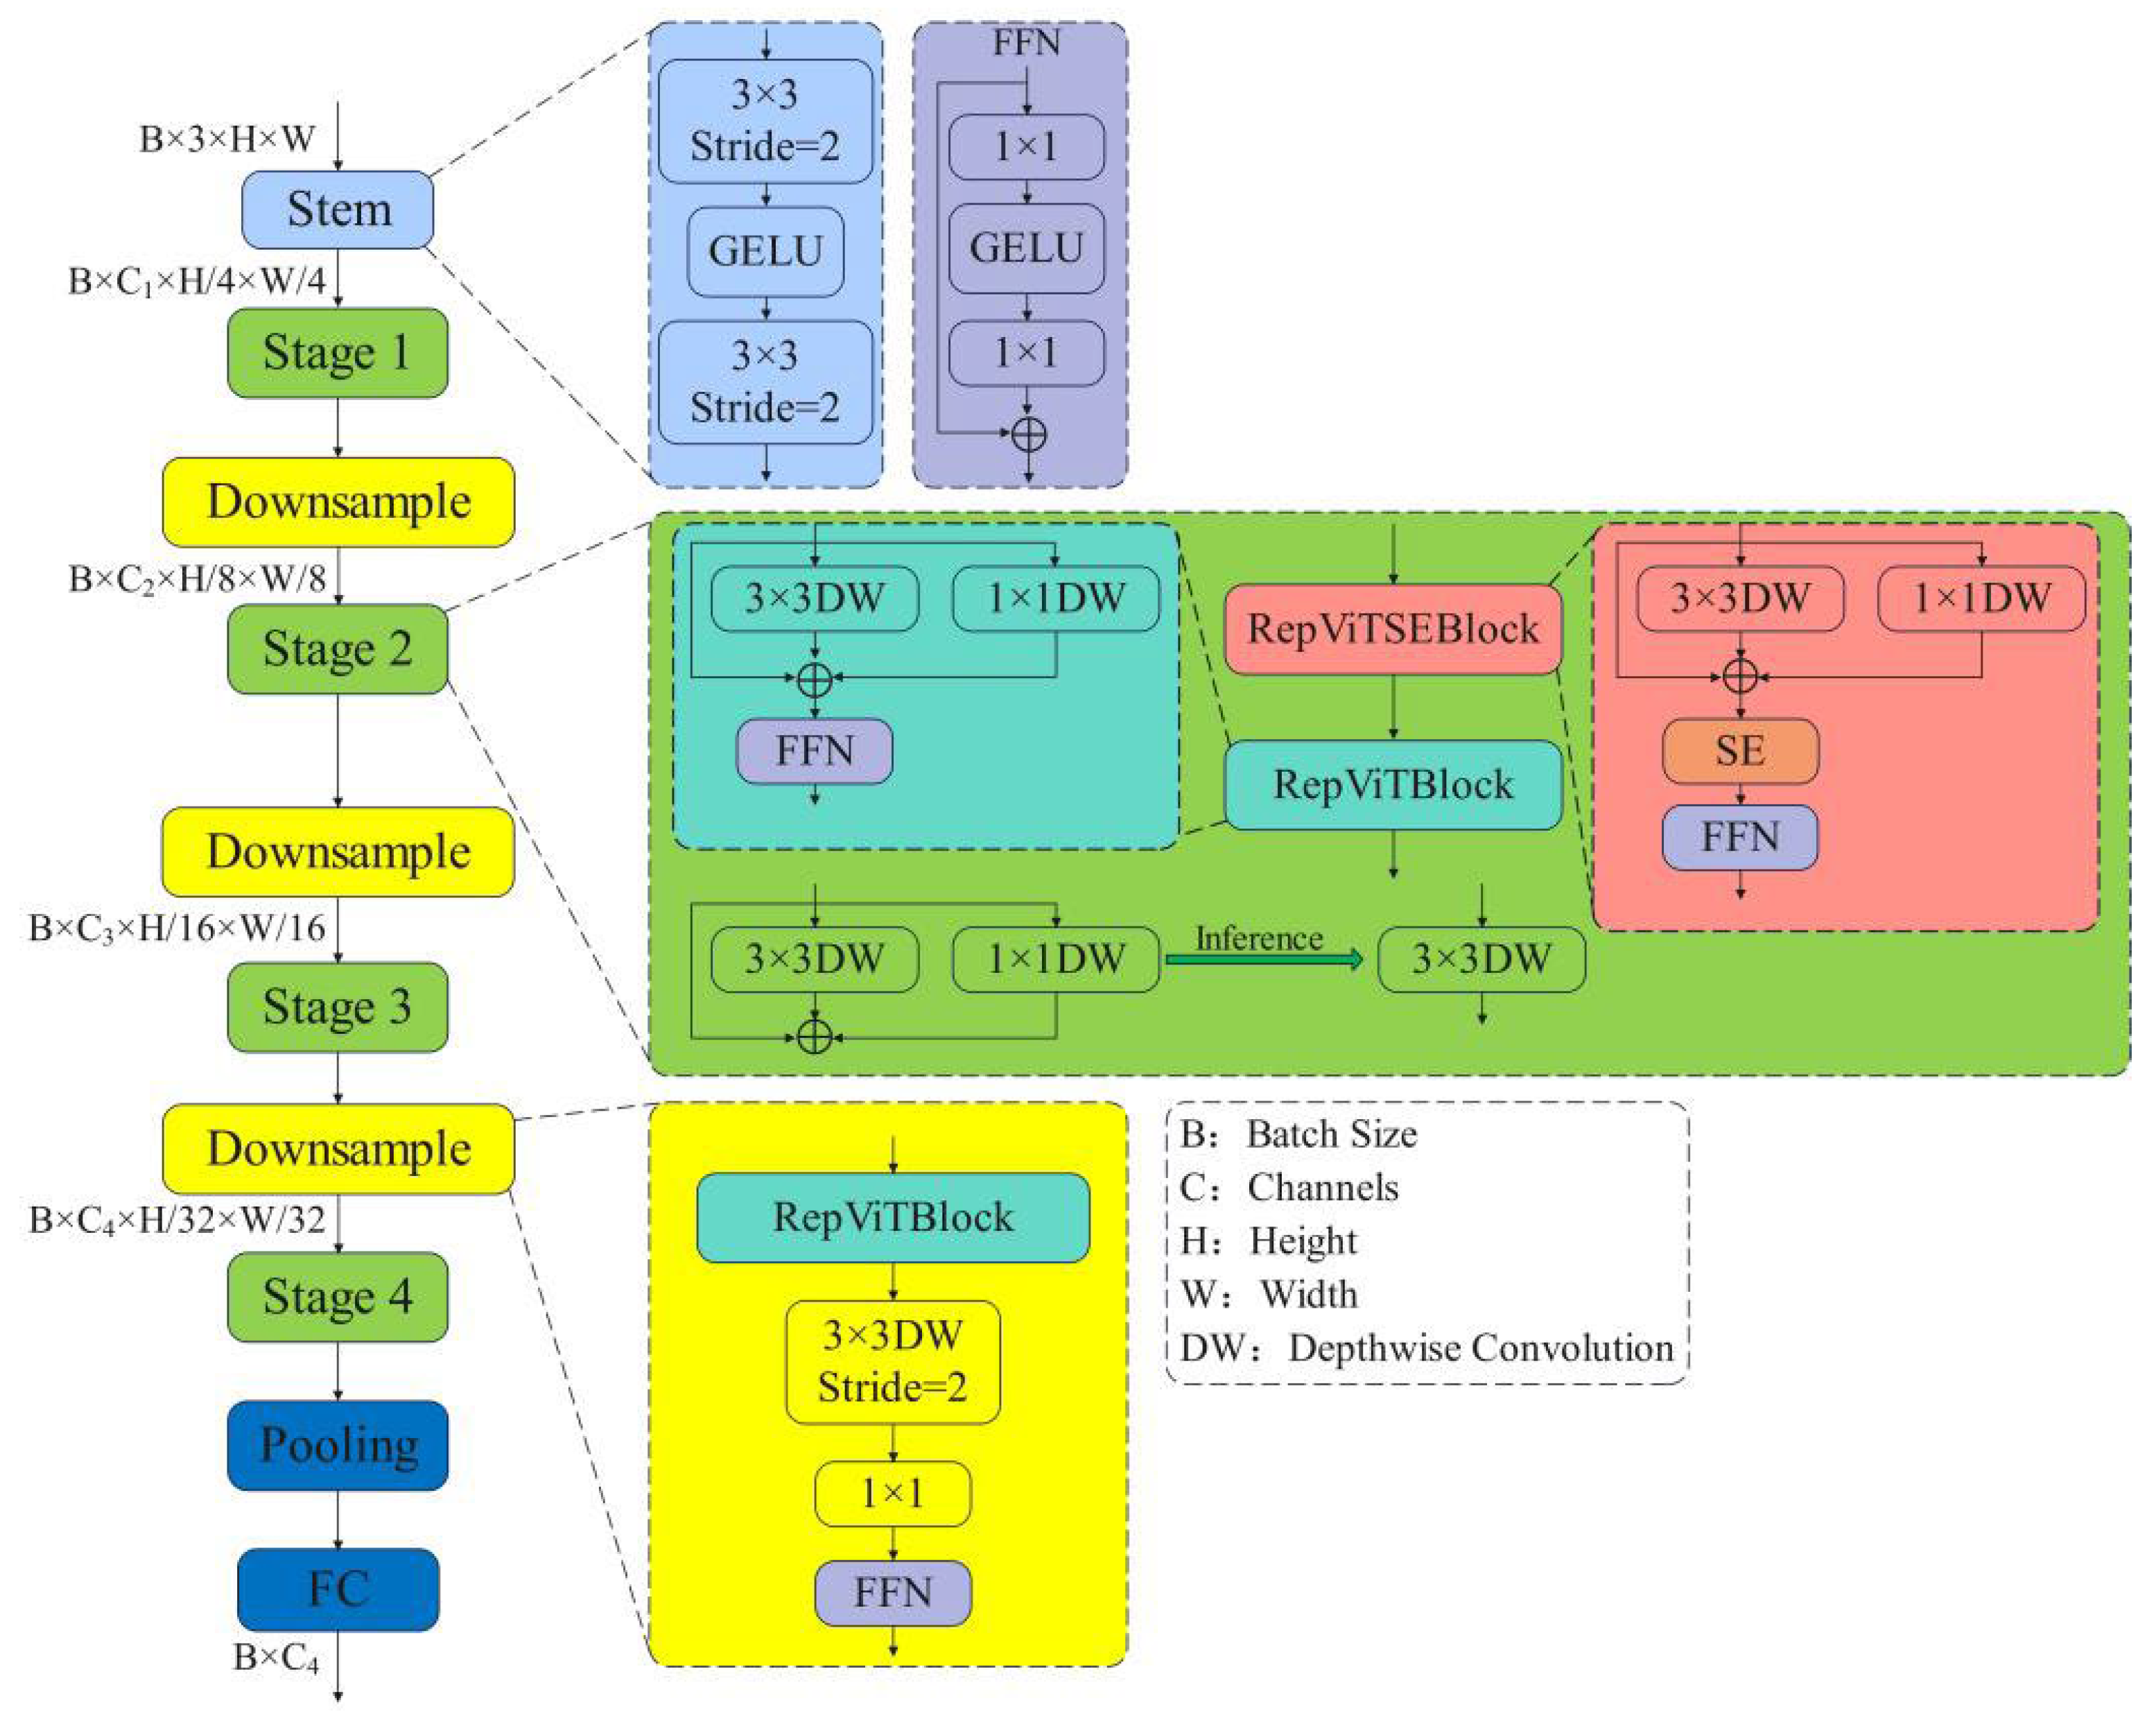
  • The backbone network of RTDETR-R18 is improved and designed based on the RepViT lightweight network. The backbone network adopts structural re-parameterization with stage-wise SE layer placement mechanisms. The proposed structure significantly reduces the number of parameters and computational requirements, thereby enhancing detection efficiency while preserving its ability to detect, thus leading to improved overall performance.
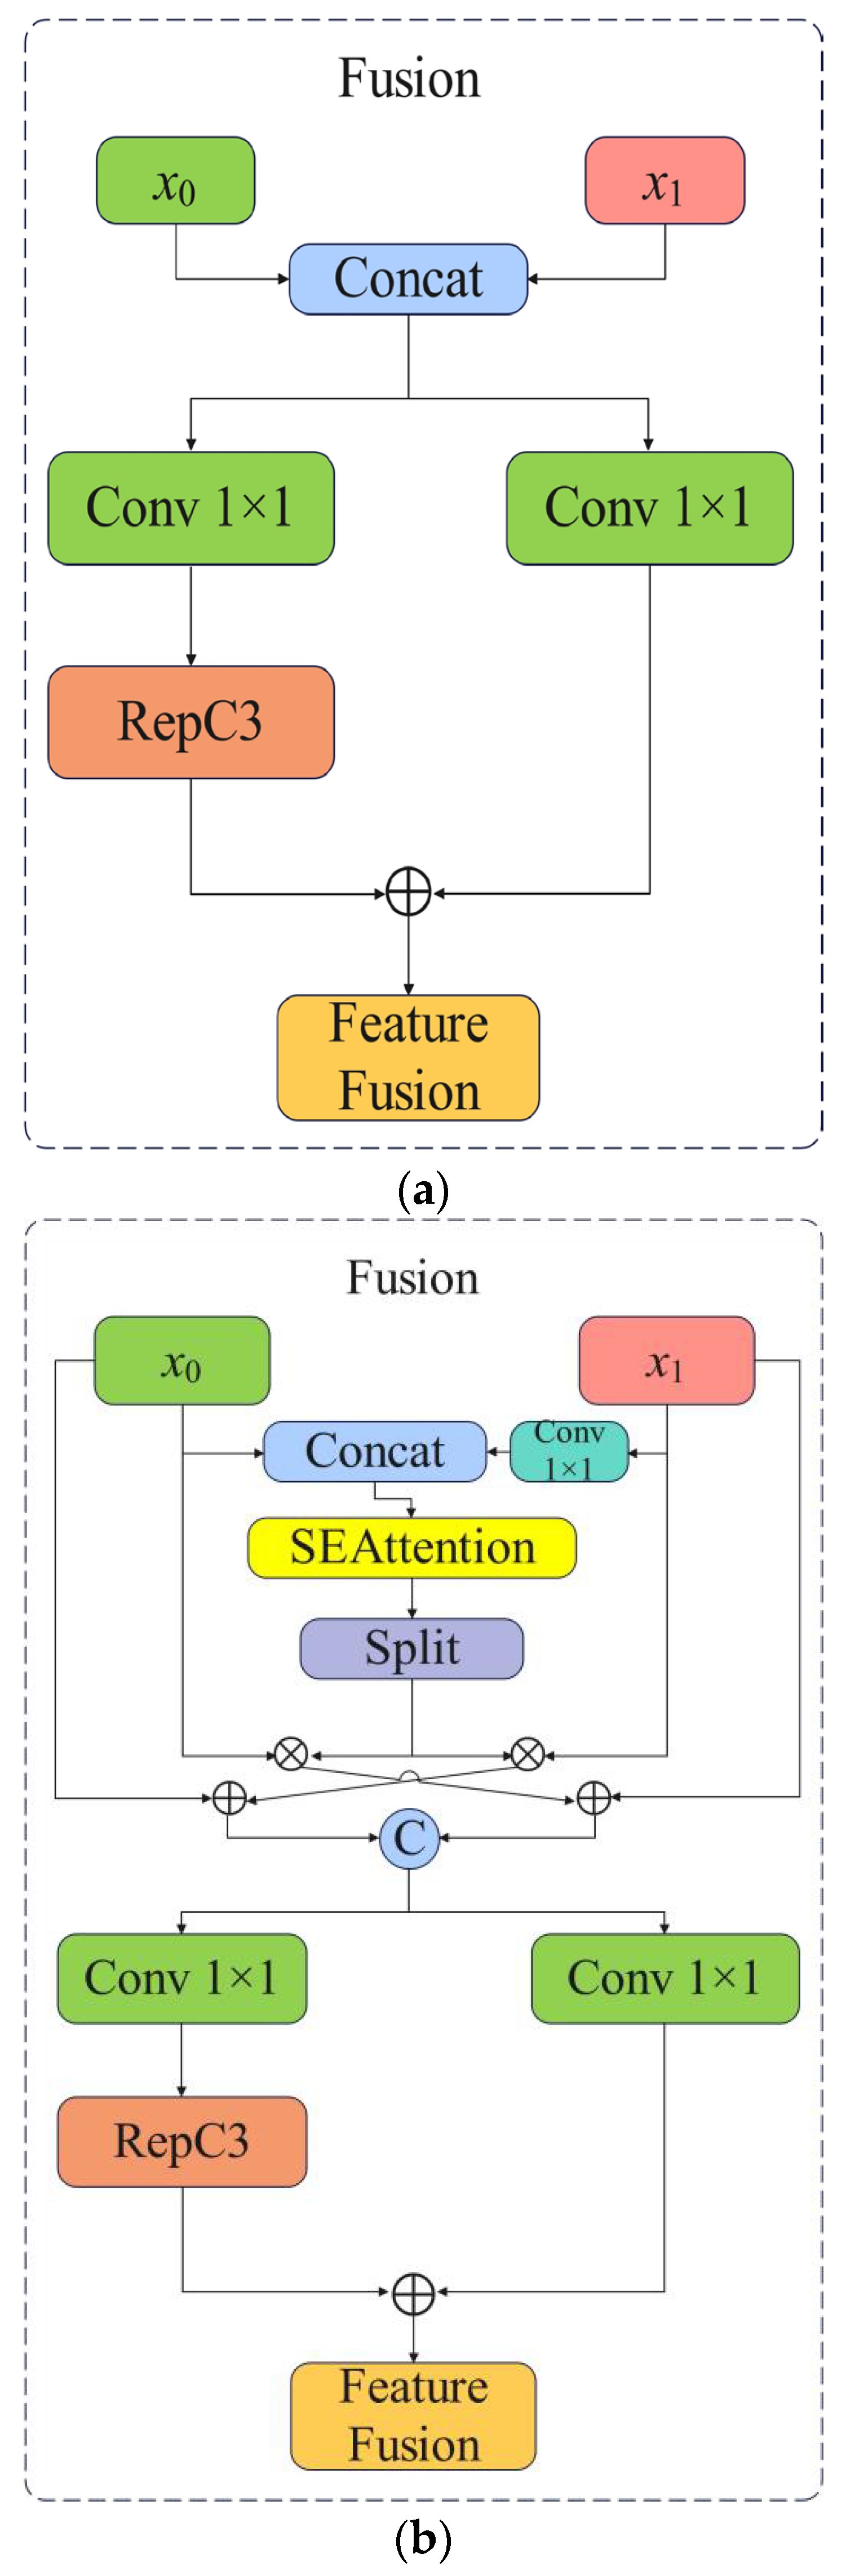
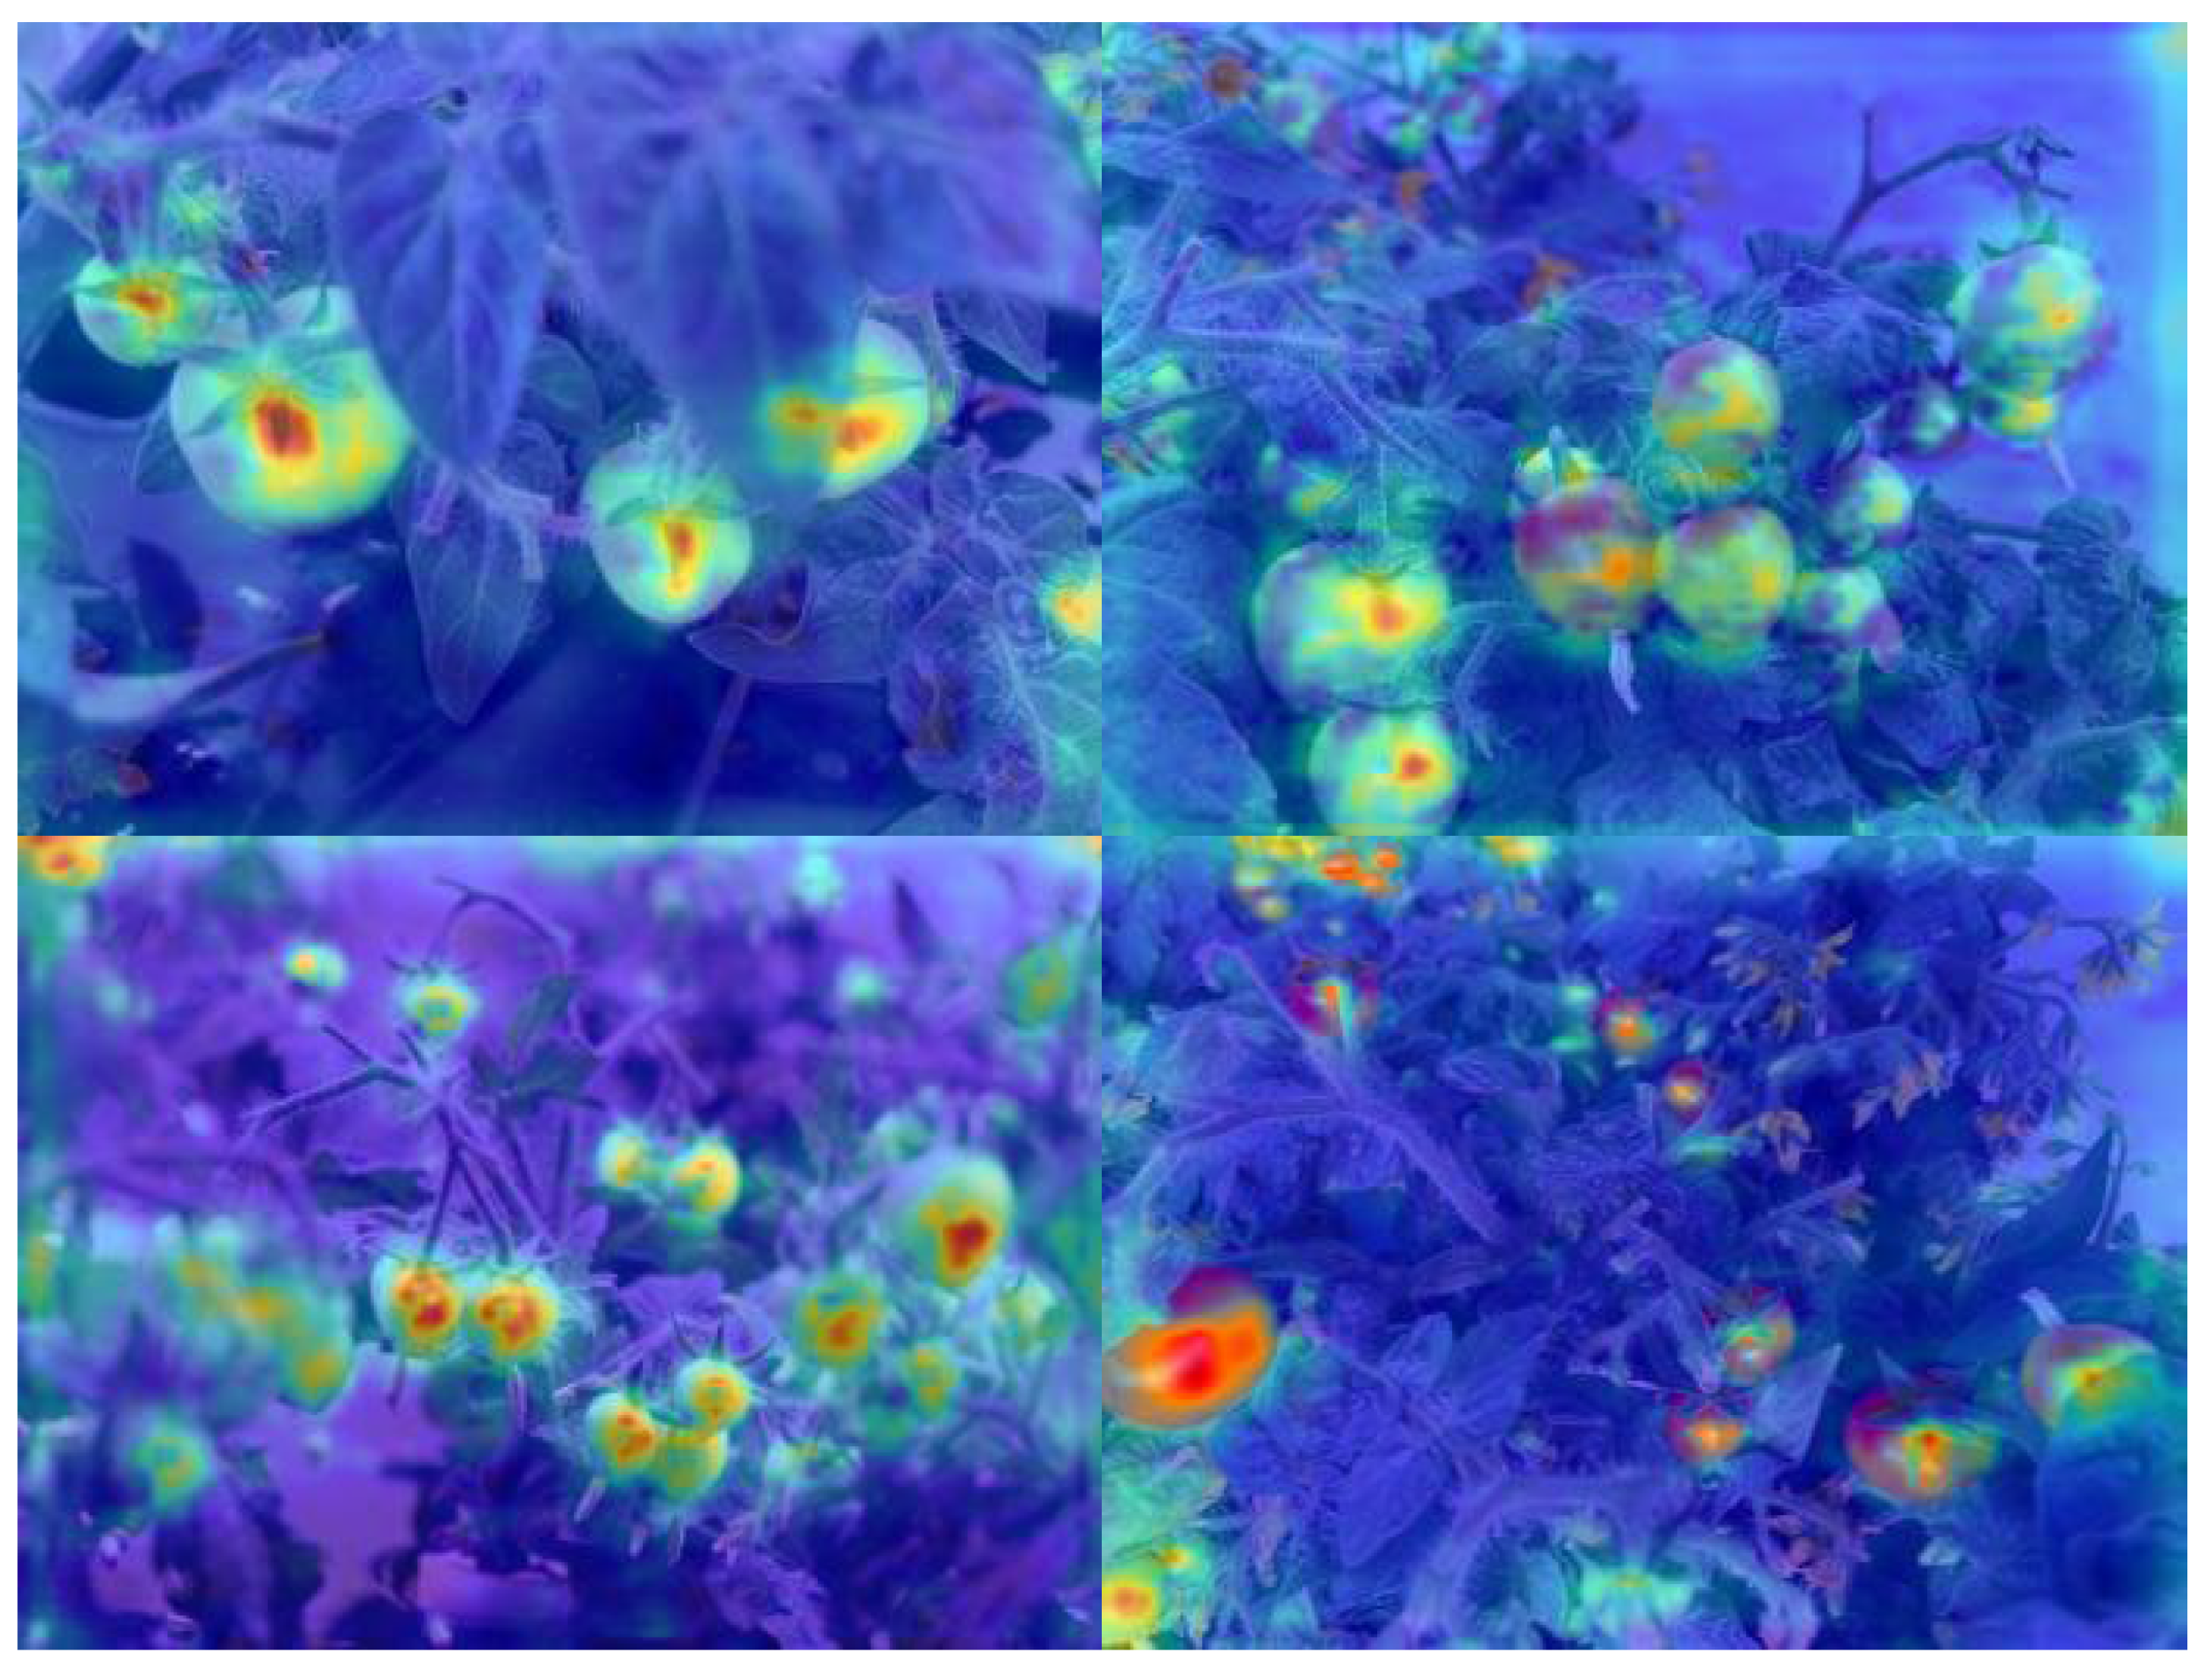
  • The neck structure is enhanced by the context-guided feature fusion module (CGFM), which achieves multiscale feature fusion through adaptive channel recalibration and dynamic weight allocation. This enhancement increases the model’s interlayer feature interactions during the encoding process through targeted attention weighting, thereby improving its detection capabilities. The SE Attention attention mechanism is employed to dynamically allocate distinct weights to each channel, thereby facilitating the network in prioritizing salient feature information, enhancing the model’s ability to capture crucial information, and improving its detection capability.
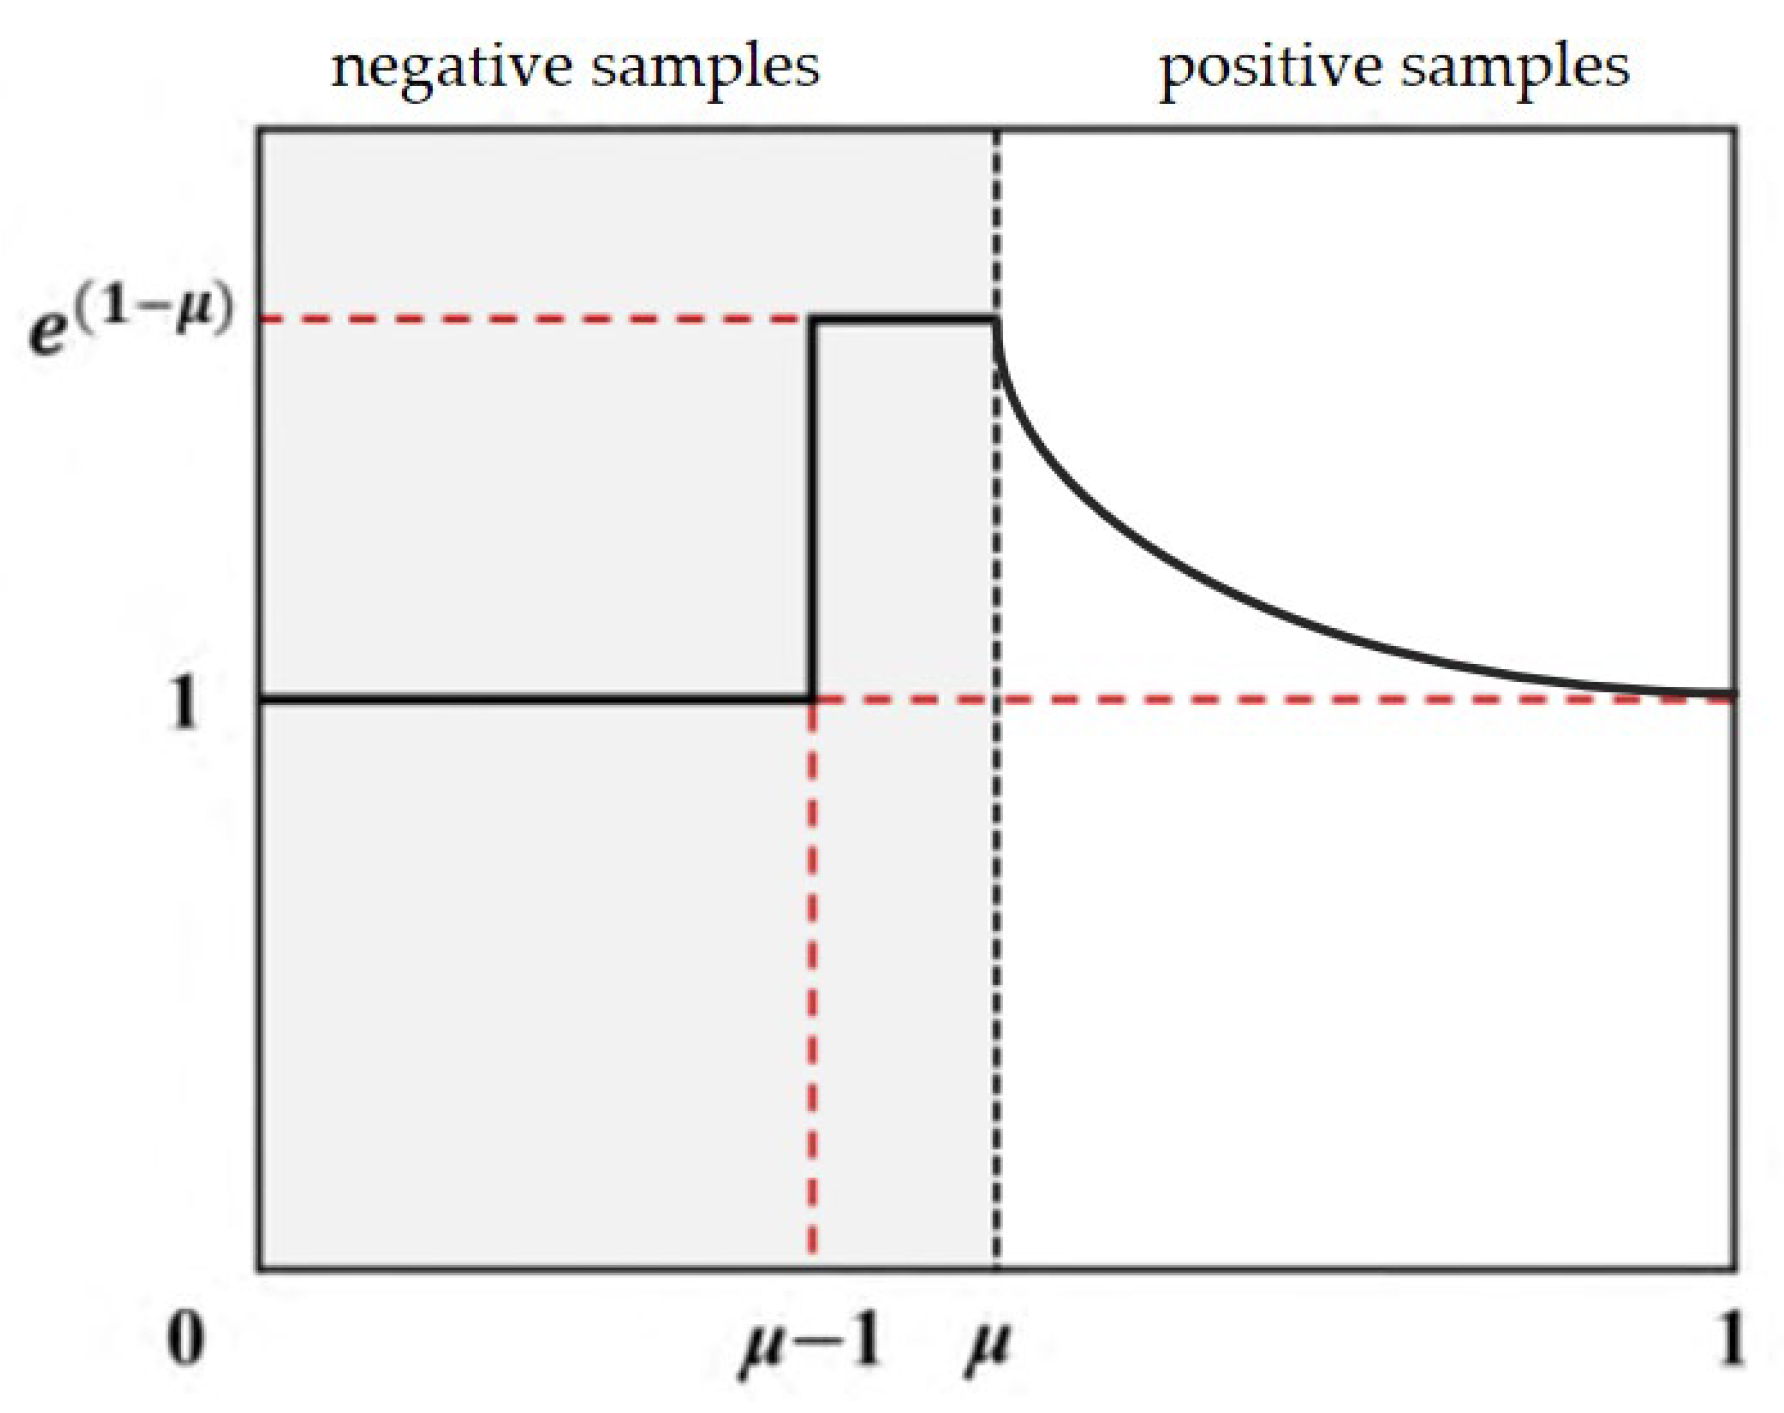
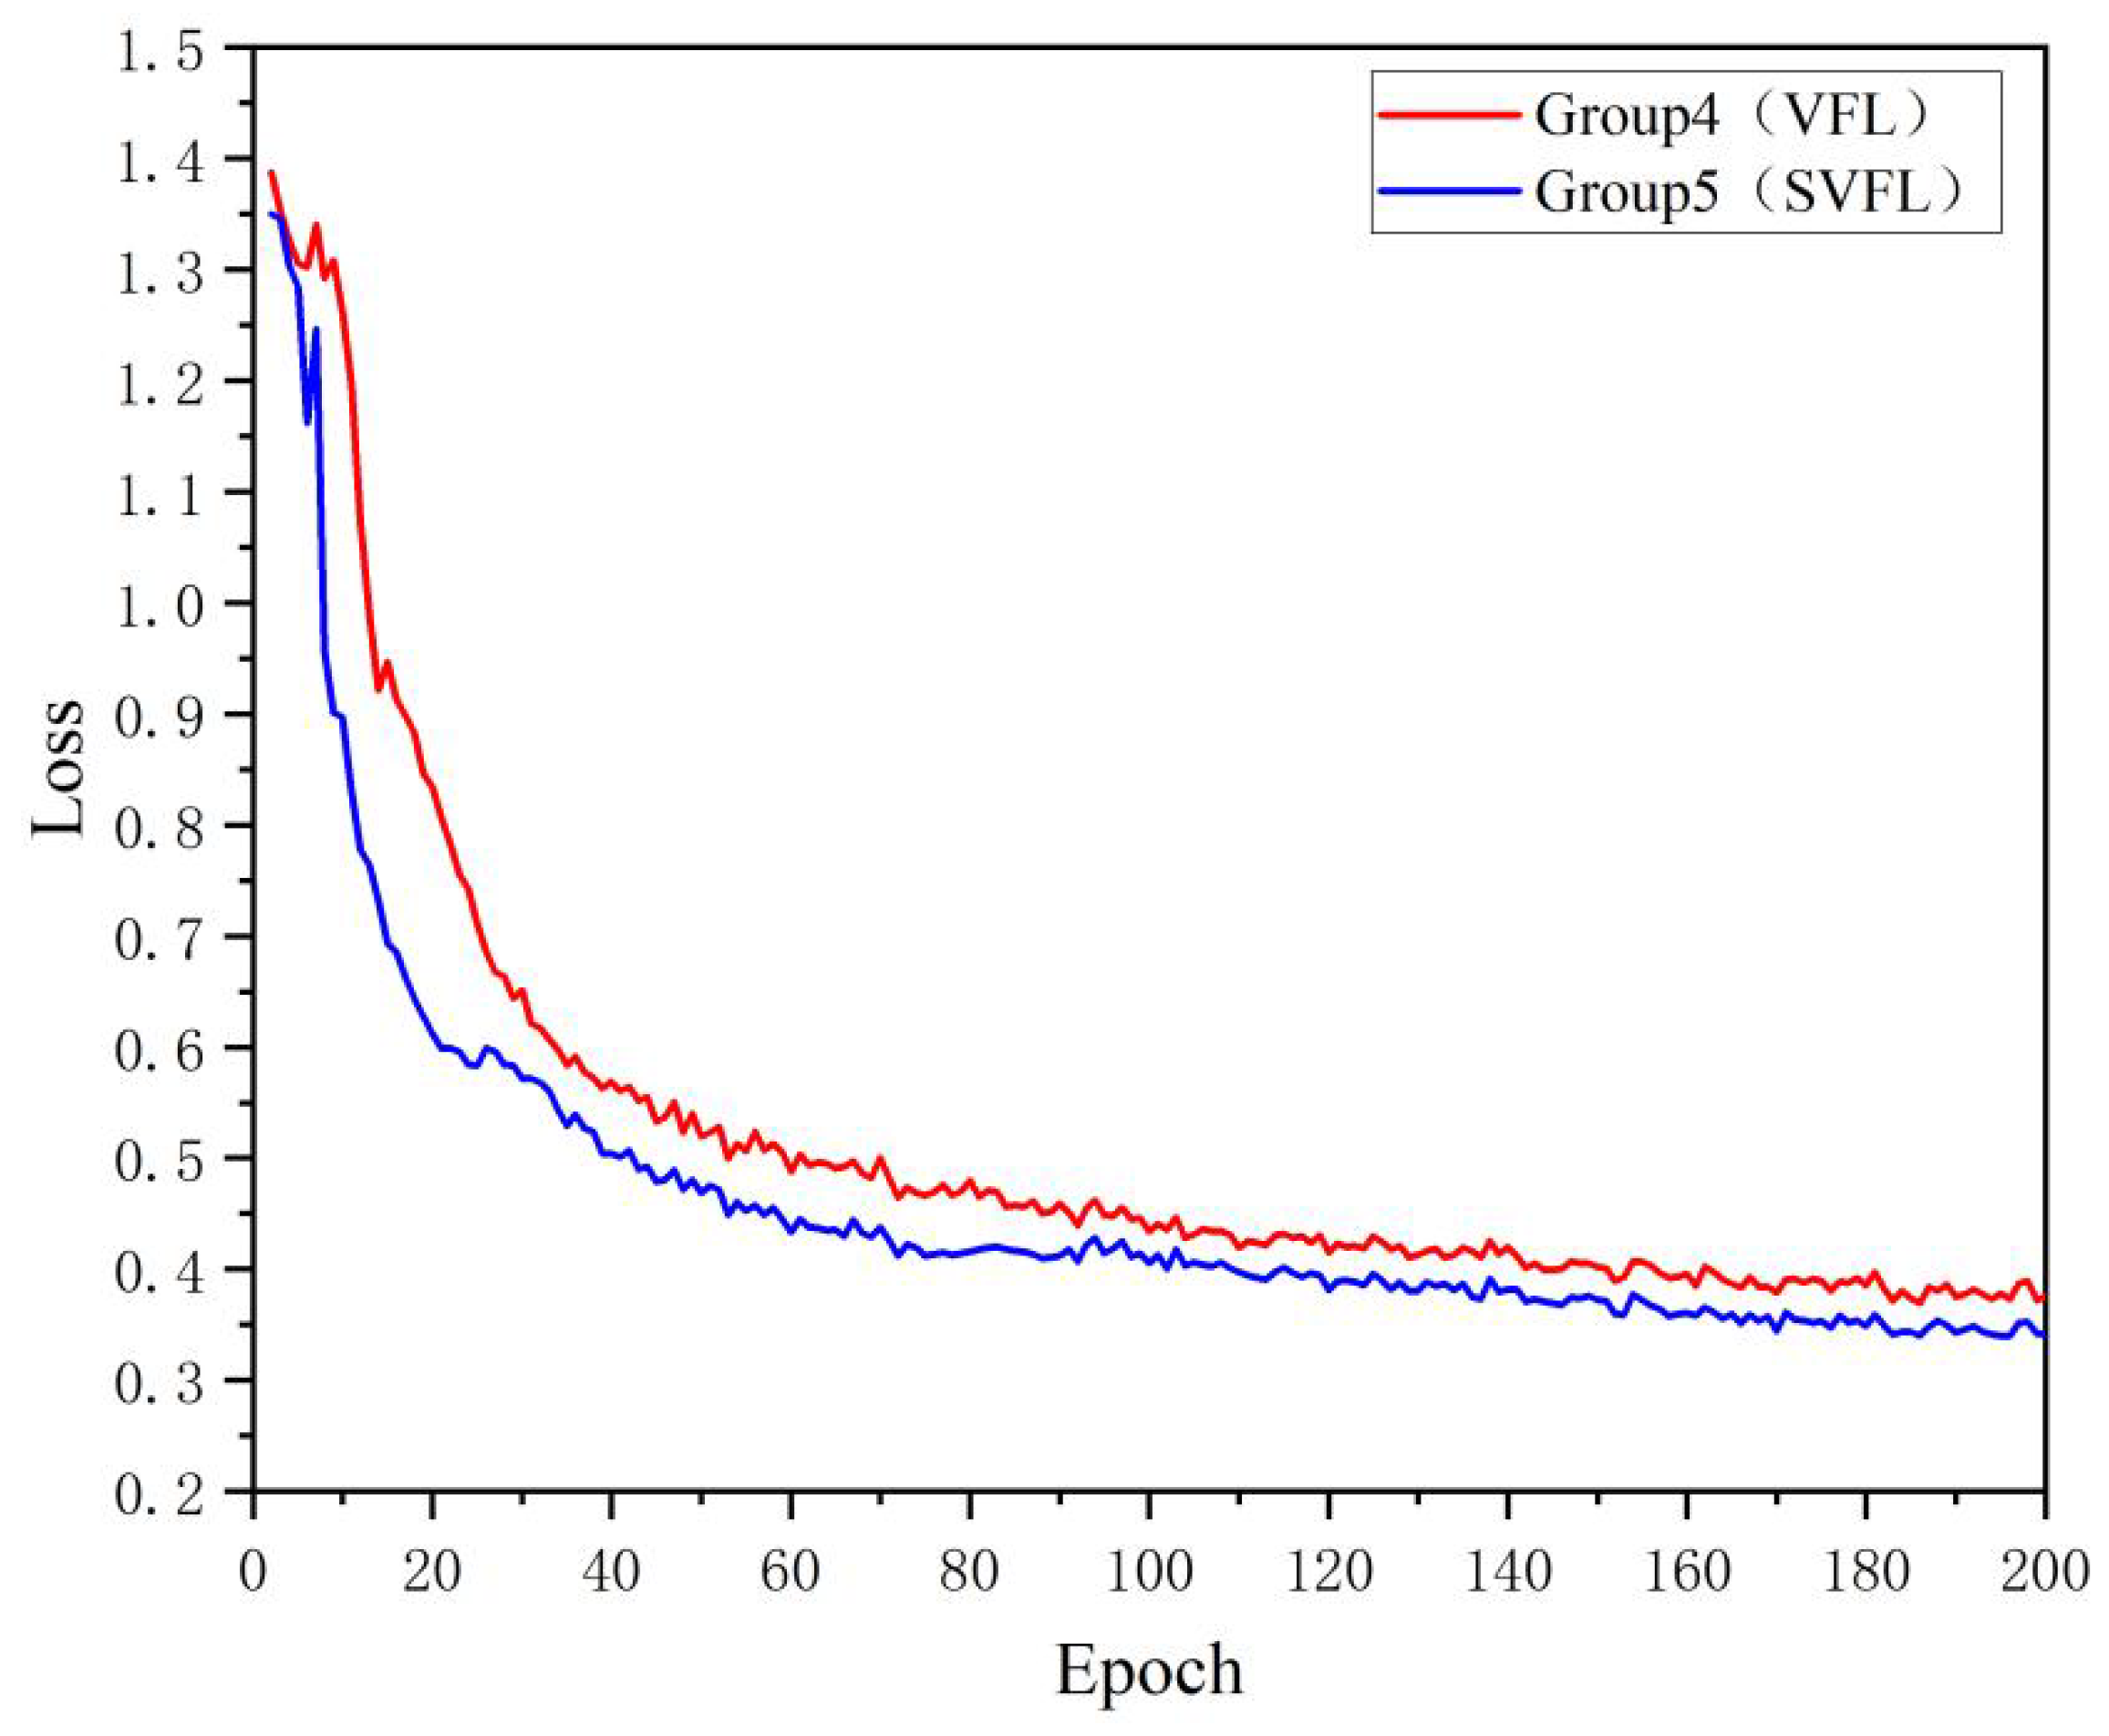
  • The Sliding Varifocal Loss (SVFL) integrates the dynamic sample weighting of Varifocal Loss (VFL) with the adaptive sliding mechanism. This function dynamically adjusts loss weights based on sample quality, prioritizing high-IoU samples while suppressing ambiguous or low-quality feature regions. This enhances detection accuracy and robustness in dense-object scenarios.

2. Related Work

Compared to established general-purpose object detectors (YOLOv8m and RTDETR), the proposed LiteTom-RTDETR achieves significantly lower parameters, GFLOPs, and model size. When compared to existing RTDETR-based specialized models (PP-DETR [14], FCHF-DETR [19], and the model in Reference [20]), LiteTom-RTDETR also exhibits superior performance with reduced parameters and computational complexity. These results clearly indicate that the proposed LiteTom-RTDETR achieves exceptional computational efficiency, making it particularly suitable for deployment on resource-constrained agricultural mobile devices. The detailed parameter comparison is presented in Table 1.
Recent studies, such as References [14,19,20], have explored lightweight RT-DETR variants for edge deployment. Three critical distinctions emerge in LiteTom-RTDETR:
Architectural Innovation: The proposed RepViT+CGFM+SVFL architecture demonstrates significant efficiency improvements across multiple state-of-the-art frameworks: it achieves a simultaneous 44.4% reduction in parameters and 39.5% decrease in GFLOPs relative to Reference [16]’s SPDRSFE+AFPN+Conv3XCC3 framework; reduces parameters by 18.4% and GFLOPs by 24.1% compared to Reference [21]’s FasterNet+CGA+HSFPNSFF_Focaler+CloU structure; and attains parameter and GFLOPs reductions of 28.9% and 34.6%, respectively, against Reference [22]’s SlimNeck+SENetv2+CGBlock design;
Domain-Specific Optimization: The task-specific optimizations for agricultural vision (e.g., enhanced dense-object detection for occluded tomatoes in Section 3.3.3) contrast with the general-purpose methodology adopted in Reference [17].
Efficiency–Accuracy Balance: As evidenced in Tables 9 and 10, LiteTom-RTDETR exhibits a 0.6% higher average detection accuracy, 15.5% faster inference speed, and reductions of 36.2% in computational cost and 31.6% in model size relative to the original RTDETR baseline, demonstrating superior efficiency–accuracy trade-offs.
These optimizations establish LiteTom-RTDETR as a deployable solution for resource-limited agricultural edge devices.

3. Materials and Methods

3.1. Dataset Construction and Preprocessing

3.1.1. Data Acquisition

The data used in this study were sourced from the Artificial Light Plant Factory Laboratory at the Henan Institute of Science and Technology in Xinxiang City, Henan Province [23]. The Micro-Tom tomato cultivar was selected as the target for data acquisition, which was undertaken by systematically collecting tomato images across all growth stages from December 2021 (initial flowering phase) to February 2022 (peak fruit maturity). These images were captured using a Canon 80D digital single-lens reflex camera (resolution: 6000 × 4000 pixels) and an iPhone 11 wide-angle camera (resolution: 4032 × 3024 pixels) and stored in the *.jpg format.

3.1.2. Dataset Construction

A total of 520 tomato images were collected for the dataset used in the experiments. This dataset included tomato samples under diverse lighting conditions during multiple developmental stages to ensure comprehensive coverage for robust model training. Figure 1 illustrates representative tomato images obtained under these heterogeneous conditions in complex environments.
The collected tomato images were reviewed to manually annotate the fruits shown within as green or red. Data annotation was performed using the LabelImg software 1.8, and the dataset was structured in the YOLO format. The finalized dataset was partitioned into training, validation, and test sets at a 7:1:2 ratio to obtain 364 images for training, 52 for validation, and 104 for testing. Table 2 lists the distribution of tomato images and annotated instances across the dataset.

3.1.3. Data Augmentation

This study addressed the challenges of limited original data, class imbalance, and overfitting mitigation while enhancing model robustness and generalization using multiple data augmentation techniques comprising random translation, rotation, flipping, and cropping [21]. Schematic diagrams of the applied augmentation techniques are shown in Figure 2. Random translation was applied to shift an image by a certain pixel distance in a specific direction. Random rotation was applied to rotate the image using a random angle determined according to a predefined probability. Random flipping was applied to mirror the image horizontally or vertically at random. Finally, random cropping was applied to probabilistically trim the image. These augmentation techniques expanded the dataset to 1560 images. This larger dataset was divided into training, validation, and test sets using the same 7:1:2 ratio, resulting in 1092 training, 156 validation, and 312 test images. Table 3 details the post-augmentation distribution of tomato images and annotated instances.

3.2. Architecture of LiteTom-RTDETR

3.2.1. Baseline RTDETR Network Structure

The RTDETR is a transformer-based real-time object detection model proposed by Yian et al. [15] that addresses the suboptimal real-time performance of the detection transformer while achieving superior accuracy over YOLO series models on public datasets. The official implementation of RTDETR offers multiple backbone architectures based on the residual neural network (RTDETR-R18, RTDETR-R34, RTDETR-R50, and RTDETR-R101) and hierarchical graph network (RTDETR-HGNetv2-L and RTDETR-HGNetv2-X). The detailed specifications of these architectures are listed in Table 4. Guided by the “no free lunch” theorem [24], which posits a strong correlation between model complexity (parameter count) and performance, this study prioritized the practical deployment constraints for tomato recognition: real-time inference and compatibility with the limited capabilities of mobile devices. Consequently, the RTDETR-R18 architecture based on ResNet18 was selected as the baseline model because of its favorable balance of low parameter count, moderate computational demand, and competitive accuracy. The architecture of this model is shown in Figure 3.
The RTDETR-R18 architecture primarily comprises three components: a backbone network, hybrid encoder, and decoder with an auxiliary prediction head. The hybrid encoder combines an attention-based intra-scale feature interaction (AIFI) module, which operates similarly to a transformer encoder by encoding the S5 feature map through self-attention mechanisms, and a CNN-based cross-scale feature fusion module (CCFM), which is optimized to enhance cross-scale fusion through multiple convolutional blocks inserted into the feature propagation paths. The decoder employs an Intersection over Union (IoU)-aware query module that models the joint latent variables of the encoder features by constructing and optimizing cognitive uncertainty, thereby generating high-quality queries for precise detection.

3.2.2. Improvement of RTDETR-R18 Model

This study introduced lightweight improvements to the RTDETR-R18 model to reduce the parameter count and computational cost while maintaining performance. The key modifications comprised three aspects. First, the original backbone network was replaced with RepViT [25], which is a lightweight architecture that employs structural reparameterization and compact design principles, to reduce the computational load, parameter count, and overall model size. Second, the Squeeze-and-Excitation (SE) attention mechanism and cross-layer feature-interaction paths were introduced into the new feature fusion module, resulting in a novel context-guided feature fusion module (CGFM) that replaced the original CCFM. Third, the Sliding Varifocal Loss (SVFL) function was proposed as a loss function integrating the dynamic sample weighting of the Varifocal Loss (VFL) function with the sliding adaptive mechanism of the Sliding Loss function [26]. This combined approach enhanced the adaptability of the model to diverse sample types while accelerating convergence. The enhanced LiteTom-RTDETR model is shown in Figure 4.

3.3. Detailed Improvement Strategies for LiteTom-RTDETR

3.3.1. Lightweight Backbone with RepViT

The RepViT backbone achieves a lightweight design through structural reparameterization [25]. Its architecture comprises three core components: the initial embedding layer (Stem module), multistage stacked RepViT blocks (Stage module), and depthwise separable downsampling layers (Downsample module). The detailed structural configuration is shown in Figure 5. The Stem module performs 4× downsampling via two stride-2 3 × 3 convolutions, each followed by Gaussian error linear unit (GELU) activation [27] to balance computational efficiency and shallow feature extraction. The Stage module alternates between the RepViTSE and RepViT blocks. The RepViTSE block employs multibranch depthwise convolutions [28] during training that are later merged into a single branch through structural reparameterization during inference and integrates SE attention [29] by utilizing global average pooling [30] and two fully connected layers to dynamically recalibrate the channel weights. In contrast, the RepViT block simplifies the branch structures to optimize computational efficiency. Both blocks utilize a feed-forward network (FFN) comprising 1 × 1 convolution with the GELU and residual connections to enhance feature representation. Finally, the Downsample module integrates four core components: depthwise separable convolution, pointwise convolution [31], an FFN, and the RepViT block. During training, structural reparameterization is leveraged to fuse multi-branch operations, which are streamlined into single-branch inference steps. Simultaneously, 1 × 1 convolutions regulate channel-dimensionality adjustments, while the internal FFN optimizes feature-interaction refinement.

3.3.2. Multiscale Feature Fusion Using the CGFM

Typical feature fusion modules employ static methodologies in which feature maps with heterogeneous channel dimensions are forcibly unified using fixed-size convolutional kernels prior to channel concatenation. However, this process results in the degradation of high-frequency details and dilution of small target features [32,33]. These limitations were addressed in this study by proposing the CGFM, which achieves multiscale feature fusion through adaptive channel recalibration and dynamic weight allocation. The CGFM was designed based on the superficial detail fusion module (SDFM) in Profound Semantic Fusion [34]. In contrast to the cross-stage feature compensation approach applied in the SDFM, the CGFM employs a novel gated-attention-driven weight allocation strategy. This innovation specifically enhances interlayer feature interactions during the encoding process through targeted attention weighting. Thus, the CGFM provides richer contextual priors for the decoder by strengthening the feature representation capabilities of the encoder, enabling more precise semantic reconstruction.
The critical role played by the CGFM in the encoding process is primarily manifested in three aspects: multiscale feature fusion, dynamic feature weighting, and contextual information enhancement, as illustrated in Figure 6. First, by integrating feature maps from different hierarchical levels, the CGFM enables the simultaneous capture of local details and global contextual information, thereby generating more discriminative feature representations. Second, by leveraging the SE attention mechanism, the CGFM dynamically adjusts the weights of distinct feature maps, amplifying critical features while suppressing redundant features, thereby ensuring flexible and efficient feature fusion. Finally, the output features of the CGFM retain the original feature information and incorporate cross-scale contextual cues to provide richer representations for subsequent decoders and significantly enhance the overall model performance.
The workflow of the CGFM begins with two input feature maps, x0 and x1. If the channel dimensions of x0 and x1 differ, the CGFM adjusts x0 to match x1 using a 1 × 1 convolution. Next, the aligned x0 and x1 values are concatenated along the channel dimensions to form a unified feature map. Subsequently, the SE attention mechanism is applied to the concatenated feature map, and the channelwise weights are dynamically recalibrated to emphasize task-critical channels. This weighted feature map is split into two components that are multiplied elementwise with the original x0 and x1 to achieve feature refinement. Finally, the refined features are fused and concatenated along the channel dimensions to produce an output feature map. This computational process can be expressed as follows:
x 0 = C o n v 1 × 1 ( x 0 )     ( i f    c 1 c 2 )
x c o n c a t = C o n c a t ( x 0 , x 1 )
ω = S E A t t e n t i o n ( x c o n c a t )
x w e i g h t e d = x c o n c a t ω
x 0 w e i g h t e d , x 1 w e i g h t e d = S p l i t ( x w e i g h t e d )
x 0 f u s e d = x 0 + x 1 w e i g h t e d
x 1 f u s e d = x 1 + x 0 w e i g h t e d
O u t p u t = C o n c a t ( x 0 f u s e d , x 1 f u s e d )
where c0 and c1 represent the respective channel dimensions of the x0 and x1 input feature maps; x0 refers to the channel-aligned version of x0 after 1 × 1 convolution; the xconcat concatenated feature map is generated by concatenating x0 and x1 along the channel axis; ω denotes the channel attention weights computed by the SE mechanism; the weighted feature map xweighted is split into x0weighted and x1weighted, which correspond to the reweighted versions of x0 and x1, respectively; x0fused and x1fused are obtained by elementwise addition of the cross-weighted features; and the final Output is the concatenated feature map derived from x0fused and x1fused, integrating multi-scale contextual information for downstream tasks.
In the original fusion architecture (Figure 7a), shallow and deep feature maps are first concatenated, then subjected to a 1 × 1 convolution before the application of the RepC3 module to enhance feature representation. Finally, multiscale features are integrated and output. This module employs multibranch convolutions and feature reuse to improve fusion robustness and computational efficiency. However, this method is limited to concatenating two feature maps with identical channel dimensions, and repeated convolutional operations can lead to partial feature information loss.
The enhanced fusion module (Figure 7b) resolves these limitations by implementing an adaptive channel adjustment through 1 × 1 convolutions before undertaking feature concatenation, thereby guaranteeing dimensional consistency across the input feature maps. Furthermore, the SE attention mechanism is applied to the concatenated features to preserve critical information. This mechanism compresses spatial information through global average pooling and dynamically learns channelwise attention weights through fully connected layers. These weights rescale the feature channels, amplifying task-relevant features while suppressing redundant features. Thus, the redesigned fusion module enables multiscale feature capture and fusion, enhancing the ability of the model to capture global contextual patterns as well as local structural details, thereby fostering a more comprehensive understanding of the input data.

3.3.3. SVFL Function

The RTDETR employs the Hungarian matching algorithm to assign positive and negative samples with its original VFL classification function [20]. However, the fixed weighting parameters in VFL struggle to adapt to the dynamic label assignment used in RTDETR, leading to classification ambiguity in dense-object scenarios [35]. The Sliding Loss (SlideLoss) function [26], which dynamically adjusts sample weights based on their quality and distribution characteristics, was applied to address these limitations by enhancing the supervision signals in the boundary regions between positive and negative samples, effectively mitigating class imbalances and sample quality discrepancies in object detection. The adaptive weight variation of the Sliding Loss function, which prioritizes high-quality samples while suppressing noisy and ambiguous samples, is shown in Figure 8, where μ represents the threshold parameters for positive and negative samples.
The proposed SVFL function integrates the dynamic sample weighting strategy of the VFL function with the sliding adaptive mechanism of the Sliding Loss function. This synergistic design enhances the adaptability of the model to heterogeneous sample distributions while optimizing convergence efficiency. The SVFL function dynamically adjusts the loss weights based on sample quality, prioritizing high-confidence positive samples while adaptively suppressing ambiguous or low-quality regions. This significantly enhances detection accuracy and robustness in dense-object scenarios.
The SVFL function can be formulated given the smoothing factor λ (0 ≤ λ ≤ 1) governing the trade-off between historical weight retention and current information integration, weight decay coefficient β, and iteration step t to obtain the following dynamic updating rule for the positive sample weight parameter αt:
α t = λ α t 1 + ( 1 λ ) 1 N p o s i p o s p i t
where Npos denotes the number of positive samples and p i t represents the predicted score of the i-th positive sample at the t-th iteration.
The update rule for the β of the negative samples is given by
β = β 0 e k t / T
where β0 denotes the initial value of the weight decay parameter, k is the decay coefficient controlling the decay rate, and T indicates the total number of iterations.
In each update step, the weights are dynamically adjusted based on the quality of the positive samples and the threshold of the IoU between the predicted bounding box and the ground-truth box for the current positive sample using the following rule:
γ p o s = γ b a s e + μ ( 1 IoU )
where γpos denotes the weighting factor for the positive samples; γbase represents the base weight of the positive samples; and μ is the scaling factor, which controls the rate at which the IoU influences weight adjustment.
Finally, Equations (9)–(11) are combined to obtain the following final expression for the SVFL function:
L s l i e d = 1 N p o s i p o s α t p i γ p o s log ( p i ) + 1 N n e g j n e g β ( 1 p j ) γ n e g log ( 1 p j )
where Npos denotes the number of positive samples; pi represents the predicted score of the i-th positive sample, bounded within the range [0, 1]; αt is adaptively updated during training; γpos serves to balance the weights between high-quality and low-quality samples by scaling piγpos, a term designed to suppress loss contributions from well-classified samples; the log(pi) term reflects the standard cross-entropy loss for positive samples, quantifying the discrepancy between the predicted score pi and the ground-truth label; Nneg indicates the number of negative samples; pj is the predicted score of the j-th negative sample (also within [0, 1]); β controls the global weight of the negative samples; γneg acts as a loss modulation factor to differentiate high-quality and low-quality negative samples; and the log(1 − pj) term reflects the cross-entropy loss for the negative samples, reflecting the alignment between the predictions pj and ground-truth labels.

3.4. Experimental Setup and Evaluation Metrics

The experiments in this study were conducted using the PyTorch deep learning framework with Python as the programming language, and the computations were accelerated using GPU hardware. The detailed experimental configurations and hyperparameter settings are provided in Table 5 and Table 6, respectively. No pre-trained weights were utilized during model initialization or training to eliminate potential experimental bias.
The tomato recognition performance and computational complexity of the LiteTom-RTDETR model were comprehensively evaluated in this study. The quantitative evaluation of object detection performance was undertaken using five established metrics: precision (P), recall (R), F1-score (F1), mean average precision at an IoU threshold of 0.5 (mAP50), and mean average precision across 10 IoU thresholds spanning 0.5–0.95 (mAP50:95) [6]. These metrics are formulated as follows:
P = T p T p + F p
R = T p T p + F N
F 1 = 2 × P × R P + R
m A P = 1 M k = 1 M A P ( k )
where Tp denotes the number of true positive detections that correctly identified tomatoes, Fp represents false positive detections that erroneously classified tomatoes, FN indicates false negative instances in which tomatoes remained undetected, M corresponds to the total number of object categories in the detection framework, and AP(k) quantifies the average precision metric for the k-th object category.
Model complexity was assessed using four established computational metrics: parameter count (millions), 106 floating point operations (GFLOPs), model size (megabytes, MB), and inference speed (frames per second, FPS) [6]. These metrics collectively evaluate the degree of lightweight optimization realized by the model, providing an essential reference for agricultural applications that require efficient resource utilization.

4. Experimental Results and Analysis

4.1. Performance Comparison of CGFM Insertion Positions

Four candidate positions were identified for integrating the CGFM module within the RTDETR feature fusion network, indicated by the boxes numbered ①–④ in Figure 9. These positions were evaluated individually and in combination according to the controlled variable principle, resulting in the 15 configurations shown in Table 7; the table also reports the corresponding recognition performance metrics for each configuration.
The experimental data reported in Table 7 indicate that multi-position configurations achieved moderate accuracy gains compared to single-position configurations (e.g., a +1.1% improvement in R), but their comprehensive performance metrics, particularly mAP50:95 and F1, underperformed the single-position configurations by 0.8–1.8%. In terms of detection, the LiteTom-RTDETR-CGFM-①+② configuration achieved a P of 88.8%, R of 78.4%, F1 of 86.6%, mAP50 of 61.3%, and mAP50:95 of 83.3%, corresponding to marginal performance differentials of −0.2%, −1.7%, +0.2%, +0.3%, and −1.0%, respectively, compared to the baseline LiteTom-RTDETR. The expanded LiteTom-RTDETR-CGFM-①+②+③ configuration achieved a P of 86.6%, R of 81.2%, F1 of 86.9%, mAP50 of 61.2%, and mAP50:95 of 83.8%, corresponding to performance differentials of −2.4%, +1.1%, +0.5%, +0.2%, and −0.5%, respectively, compared to the baseline model. The single-position LiteTom-RTDETR-CGFM-③ configuration exhibited the best performance among the evaluated configurations, with a P of 89.6%, R of 81.1%, F1 of 88.2%, mAP50 of 61.9%, and mAP50:95 of 85.1%, corresponding to consistent improvements of +0.6%, +1.0%, +1.8%, +0.9%, and +0.8%, respectively, compared to the baseline model. Notably, the P, F1, and mAP50 values for this configuration were the highest among the considered experimental configurations. Thus, the integration of the CGFM at position ③ demonstrated superior architectural compatibility during model optimization to achieve peak performance metrics for tomato detection, and the LiteTom-RTDETR-CGFM-③ architecture was considered the optimal baseline framework in the subsequent crop recognition research. Notably, the enhanced feature fusion mechanism in this model exhibited exceptional efficacy in tomato identification scenarios, demonstrating its significant potential for agricultural vision applications.

4.2. Ablation Experiments

Ablation experiments were systematically conducted to quantitatively evaluate the effectiveness of the individual model modules under the controlled variable principle. The considered experimental conditions are described along with their comprehensive performance metrics in Table 8. This methodological approach sequentially evaluated the three architectural modifications: first, the baseline backbone network was replaced with RepViT to enhance computational efficiency; second, the CGFM mechanism was integrated at position ③ to refine the feature fusion capabilities; third, the SVFL function was implemented to improve detection accuracy.
The results for Groups 1 and 2 in Table 8 indicate that the replacement of the original backbone with RepViT significantly reduced the model size and GFLOPs by 31.6% and 36.2%, respectively. This reduction in complexity stems from the lightweight architecture of RepViT, which optimized computational efficiency.
The Group 3 and 5 results indicate that introducing the CGFM enhanced the mAP50 by 1.8% compared to Group 2, with marginal increases in the number of parameters (+0.3%) and inference speed (+0.9 FPS). These performance improvements stem from the adaptive multiscale feature fusion mechanism in the CGFM, which enhanced the contextual awareness of the agricultural targets through hierarchical feature interactions. Notably, the use of the CGFM achieved superior detail preservation in this complex field environment while maintaining computational efficiency, which is a critical requirement for real-time agricultural vision systems. The heatmap analysis shown in Figure 10 demonstrates the enhanced feature fusion capability of the improved CGFM module. Both green and red fruits exhibited concentrated attention regions in their lower-middle sections, indicating robust multiscale object recognition that effectively avoided misclassifying green foliage as immature fruit.
Finally, the loss curves presented in Figure 11 demonstrate that the incorporation of the SVFL function significantly accelerated the convergence rates compared with the baseline VFL configuration while achieving superior final loss metrics, confirming its effectiveness in dynamic training optimization for agricultural target detection tasks.

4.3. Comparative Analysis of Tomato Detection Performance

4.3.1. Tomato Recognition

The enhanced tomato detection capabilities of the LiteTom-RTDETR model were validated through systematic comparative experiments. Four detection models—Faster-RCNN, YOLOv8m, original RTDETR, and LiteTom-RTDETR—were rigorously evaluated on the tomato image dataset described in Section 3.1 to establish performance benchmarks. The P, R, F1, and mAP50 metrics for these four models were systematically evaluated, with the results presented in Table 9.
Clearly, the LiteTom-RTDETR model exhibited superior performance metrics for tomato recognition, attaining peak values of 89.6% for P, 85.1% for F1, and 88.2% for mAP50. Compared with the Faster-RCNN, YOLOv8m, and original RTDETR models, LiteTom-RTDETR exhibited significant improvements in P of 28.4%, 1.7%, and 1.9%, respectively, in F1 of 16.9%, 0.3%, and 0.2%, respectively, and in mAP50 of 13.4%, 0.1%, and 0.6%, respectively. These results demonstrate the advantages of LiteTom-RTDETR in agricultural target detection, particularly for tomato recognition tasks requiring high precision and multiscale adaptability.

4.3.2. Computational Complexity

The computational efficiency of LiteTom-RTDETR was rigorously validated through comprehensive benchmarking against the Faster-RCNN, YOLOv8m, and original RTDETR architectures. This performance evaluation utilized the tomato image dataset described in Section 3.1 to ensure the validity of the comparison. The experimental environment and hyperparameters for benchmarking are detailed in Table 5 and Table 6. All four models were trained under identical conditions and uniformly saved in PyTorch format (*.pt). The benchmarked complexity metrics comprised parameter counts, GFLOPs, inference speed, and model size. Specifically, parameter counts, GFLOPs, and inference speed were measured using the PyTorch Profiler toolkit, while model size refers to the storage space occupied by the PyTorch-format saved model. These four model complexity evaluation metrics are recorded in Table 10.
The results clearly indicate that LiteTom-RTDETR exhibited the best computational efficiency metrics for agricultural vision applications, with 13.3 × 10⁶ parameters, 36.3 GFLOPs, a 52.2 FPS inference speed, and a 26.4 MB model size. The LiteTom-RTDETR architecture demonstrated significant efficiency improvements compared to Faster-RCNN, YOLOv8m, and baseline RTDETR, with parameter count reductions of 53%, 48.4%, and 33.2%, respectively, GFLOPs reductions of 79.1%, 53.9%, and 36.2%, respectively, FPS improvements of 84.5%, 31.2%, and 15.5%, respectively, and model size reductions of 75.6%, 46.8%, and 31.6%, respectively. These results confirm the ability of LiteTom-RTDETR to balance recognition accuracy with operational efficiency while simultaneously maintaining high precision and achieving lightweight deployment capabilities, all of which are critical for real-time field applications.

4.3.3. Visual Comparison of Detection Outcomes

The performances of the four evaluated detection models when applied to the recognition of dense tomato clusters in challenging agricultural environments are compared in Figure 12. The green and red bounding boxes respectively denote correctly detected green and red tomatoes, whereas the yellow boxes indicate missed detections. This visual comparison clearly demonstrates the robustness of LiteTom-RTDETR against complex illumination variations and partial occlusions, with the proposed model significantly outperforming the other models in low-light and vegetation-obstructed scenarios. Under blue light conditions, both RTDETR and LiteTom-RTDETR completely detected occluded fruits, whereas Faster-RCNN and YOLOv8m missed some fruits. Under red light conditions, Faster-RCNN and YOLOv8m persistently missed detections and RTDETR exhibited edge-related false positives, misclassifying ground surfaces as green tomatoes. Under white light conditions, LiteTom-RTDETR maintained detection integrity under 60–80% foliage occlusion, whereas both Faster R-CNN and YOLOv8m failed to detect fruits, and RTDETR generated duplicate detections in high-density regions. This comparison confirms that LiteTom-RTDETR exhibits superior accuracy and reliability for automated tomato-monitoring systems in practical field environments.

5. Conclusions

This study developed an automatic tomato detection model framework that balances complexity and recognition accuracy under challenging illumination conditions. Four phases of work were undertaken: dataset construction, model architecture optimization, detection algorithm deployment, and multistage experimental validation. The key findings of this study are as follows:
The LiteTom-RTDETR model was proposed based on an improved RTDETR architecture. This model achieved performance breakthroughs through three architectural innovations: backbone replacement with RepViT to reduce computational complexity, deployment of a CGFM to enhance multiscale feature representation under variable lighting, and integration of sliding weight mechanisms in the loss function to mitigate class imbalance. These synergistic improvements enabled real-time tomato detection at an inference speed of 52.2 FPS while maintaining a mean average precision of 88.2%.
Ablation experiments were conducted to assess the contributions of the architectural enhancements provided in LiteTom-RTDETR by evaluating five identification models under controlled experimental conditions. The replacement of the original RTDETR backbone with RepViT improved model accuracy while reducing parameter number, computational load, and model size, thereby achieving the preliminary lightweight objectives. Furthermore, the integration of the CGFM and SVFL function improved recognition accuracy without significantly increasing the number of parameters, computations, or model size.
Under identical experimental conditions, the LiteTom-RTDETR model demonstrated significant advantages over the Faster-RCNN, YOLOv8m, and original RTDETR models. The proposed model exhibited a 0.1–13.4% higher mean average precision while accelerating the inference speed by 15.5–84.5%; it also exhibited 33.2–53.0% fewer model parameters, 36.2–79.1% fewer GFLOPs, and a 31.6–75.6% smaller model size. These improvements collectively confirmed the successful lightweight implementation of the model while maintaining superior detection accuracy. Therefore, the proposed LiteTom-RTDETR model shows considerable promise for application in resource-constrained mobile agricultural management equipment.

6. Discussion

Prior successful deployments of lightweight models offer valuable references. Chen et al. [22] implemented a YOLOv5-based road damage detection system on Android mobile devices, achieving real-time inference at 23 FPS. Similarly, Zhou et al. [36] deployed an RTDETR-based defect detection model on RK3568 embedded systems, satisfying industrial real-time requirements with <50 ms latency. Building upon these proven approaches, the proposed LiteTom-RTDETR can be effectively deployed on agricultural mobile platforms to facilitate tomato localization and automated harvesting. The robotic harvesting implementation employs a systematic workflow comprising image acquisition, data annotation, model training, inference execution, target recognition, spatial localization, and robotic harvesting execution.
While LiteTom-RTDETR is designed for tomato recognition, its lightweight architecture provides a template for edge-compatible agricultural vision systems. The proposed model can be applied in plant factories, and by modifying training datasets, it can be adapted for crop recognition tasks, such as cucumbers or strawberries. Extending this framework to other crops requires three strategic developments:
Species-specific dataset curation: Collect crop images across diverse environments to ensure sufficient data coverage of different growth stages.
Data annotation and augmentation: Perform data annotation on the collected images to clarify identification targets. Conduct data augmentation when necessary to enhance the model’s generalization capability.
Model training: Perform experimental environment configuration according to Section 3.4, followed by model training.
The deployment process requires converting the model into a mobile-optimized format and integrating it into the Android Studio project. First, the trained PyTorch model (.pt file) is converted to TensorFlow Lite format (.tflite). Subsequently, the existing model in the Android Studio project is replaced with the newly generated LiteTom-RTDETR model. Finally, a confidence threshold of 0.5 is established, ensuring that only tomato detection results exceeding this confidence level are displayed on the Android interface.
Future work will involve deploying LiteTom-RTDETR on mobile devices, extending its application to tomato localization, and ultimately integrating this solution to guide robotic harvesters for automated picking operations. Additional datasets will be collected, and more recognition networks will be evaluated. Furthermore, this lightweight model will be deployed on automated tomato harvesting equipment for detection trials in real-world vegetable garden environments.

Author Contributions

This study was conceptualized and coordinated by W.L. (corresponding author), who also secured funding. Q.L. (Qingzheng Liu) led the methodology design, software development, data analysis/validation, and manuscript drafting. W.Q. contributed to software implementation, results validation, and visualization. J.W. and Q.L. (Qiang Liu) jointly supervised the research and managed the project. X.Y. conducted the literature review and data curation. Y.T. participated in research discussions and manuscript revisions. All authors have read and agreed to the published version of the manuscript.

Funding

This research was supported by the Shaanxi Provincial Key R&D Program (grant No. 2023-YBGY-385), the Key Research Program Project of Shaanxi Provincial Department of Science and Technology (grant No. 2024NC-YBXM-203), the Shaanxi Provincial Department of Science and Technology General Project (grant No. 2022JM-131), the Special Program for Local Service and Industrialization Cultivation Project of Shaanxi Provincial Department of Education (grant No. 24JC024), and university-level projects at Shaanxi University of Technology (grant No. SLGRCQD2101).

Institutional Review Board Statement

Not applicable.

Informed Consent Statement

Not applicable.

Data Availability Statement

The raw data supporting the conclusions of this article will be made available by the authors on request.

Acknowledgments

We gratefully acknowledge the Artificial Light Plant Factory Laboratory at the Henan Institute of Science and Technology (Xinxiang, Henan Province) for providing the experimental dataset. Special thanks are extended to the laboratory researchers who contributed to data acquisition.

Conflicts of Interest

The authors declare no conflicts of interest.

References

  1. Liu, T.; Zhu, H.; Yuan, Q.; Wang, Y.; Zhang, D.; Ding, X. Prediction of Photosynthetic Rate of Greenhouse Tomatoes Based on Multi-model Fusion Strategy. Trans. Chin. Soc. Agric. Mach. 2024, 55, 337–345. [Google Scholar] [CrossRef]
  2. Miao, R.; Li, Z.; Wu, J. Lightweight Maturity Detection of Cherry Tomato Based on Improved YOLO v7. Trans. Chin. Soc. Agric. Mach. 2023, 54, 225–233. [Google Scholar] [CrossRef]
  3. Jiang, X.; Ji, K.; Jiang, K.; Zhou, H. Research progress of non-destructive detection of forest fruit quality using deep learning. Trans. Chin. Soc. Agric. Eng. 2024, 40, 1–16. [Google Scholar] [CrossRef]
  4. Liu, W.; Quan, W.; Wang, J.; Yao, X.; Liu, Q.; Liu, Q.; Tian, Y. Structural Parameter Optimization of the Vector Bracket in a Vertical Takeoff and Landing Unmanned Aerial Vehicle. Aerospace 2025, 12, 487. [Google Scholar] [CrossRef]
  5. Yang, S.; Zhang, P.; Wang, L.; Tang, L.; Wang, S.; He, X. Identifying tomato leaf diseases and pests using lightweight improved YOLOv8n and channel pruning. Trans. Chin. Soc. Agric. Eng. 2025, 41, 206–214. [Google Scholar] [CrossRef]
  6. Zhao, B.; Liu, S.; Zhang, W.; Zhu, L.; Han, Z.; Feng, X.; Wang, R. Performance Optimization of Lightweight Transformer Architecture for Cherry Tomato Picking. Trans. Chin. Soc. Agric. Mach. 2024, 55, 62–71+105. [Google Scholar] [CrossRef]
  7. Feng, J.; Li, Z.; Rong, Y.; Sun, Z. Identification of mature tomatoes based on an algorithm of modified circular Hough transform. J. Chin. Agric. Mech. 2021, 42, 190–196. [Google Scholar] [CrossRef]
  8. Zeng, G. Fruit and vegetables classification system using image saliency and convolutional neural network. In Proceedings of the 2017 IEEE 3rd Information Technology and Mechatronics Engineering Conference (ITOEC), Chongqing, China, 3–5 October 2017. [Google Scholar] [CrossRef]
  9. Simonyan, K.; Zisserman, A. Very Deep Convolutional Networks for Large-Scale Image Recognition. arXiv 2014, arXiv:1409.1556. [Google Scholar] [CrossRef]
  10. Liu, W.; Anguelov, D.; Erhan, D.; Szegedy, C.; Reed, S.; Fu, C.Y.; Berg, A.C. SSD: Single Shot MultiBox Detector. In Proceedings of the Computer Vision—ECCV 2016, Amsterdam, The Netherlands, 17 September 2016; Volume 9905, pp. 21–37. [Google Scholar] [CrossRef]
  11. Redmon, J.; Divvala, S.; Girshick, R.; Farhadi, A. You Only Look Once: Unified, Real-Time Object Detection. In Proceedings of the 2016 IEEE Conference on Computer Vision and Pattern Recognition (CVPR), Las Vegas, NV, USA, 27–30 June 2016. [Google Scholar] [CrossRef]
  12. Chen, X.; Wu, P.; Zu, S.; Xu, D.; Zhang, Y.; Dong, J. Study on identification method of thinning flower and fruit of tomato based on improved SSD lightweight neural network. China Cucurb. Veg. 2021, 34, 38–44. [Google Scholar] [CrossRef]
  13. Zheng, S.; Jia, X.; He, M.; Zheng, Z.; Lin, T.; Weng, W. Tomato Recognition Method Based on the YOLOv8-Tomato Model in Complex Greenhouse Environments. Agronomy 2024, 14, 1764. [Google Scholar] [CrossRef]
  14. Xu, X.; Chen, Y.; Zhan, L.; Qi, Q.; Deng, M. Pavement pothole detection model based on improved RT-DETR. J. Wuhan Univ. Sci. Technol. 2024, 47, 457–467. [Google Scholar] [CrossRef]
  15. Zhao, Y.; Lv, W.; Xu, S.; Wei, J.; Wang, G.; Dang, Q.; Liu, Y.; Chen, J. DETRs Beat YOLOs on Real-time Object Detection. In Proceedings of the 2024 IEEE/CVF Conference on Computer Vision and Pattern Recognition (CVPR), Seattle, WA, USA, 16–22 June 2024. [Google Scholar] [CrossRef]
  16. Zuo, Z.; Gao, S.; Peng, H.; Xue, Y.; Han, L.; Ma, G.; Mao, H. Lightweight Detection of Broccoli Heads in Complex Field Environments Based on LBDC-YOLO. Agronomy 2024, 14, 2359. [Google Scholar] [CrossRef]
  17. Xu, J.; Zhao, L.; Ren, Y.; Li, Z.; Abbas, Z.; Zhang, L.; Islam, M.S. LightYOLO: Lightweight model based on YOLOv8n for defect detection of ultrasonically welded wire terminations. Eng. Sci. Technol. Int. J. 2024, 60, 101896. [Google Scholar] [CrossRef]
  18. Bi, Z.; Yang, L.; Lv, S.; Gong, Y.; Zhang, J.; Zhao, L. Lightweight Greenhouse Tomato Detection Method Based on EDH−YOLO. Trans. Chin. Soc. Agric. Mach. 2024, 55, 246–254. [Google Scholar] [CrossRef]
  19. Xin, D.; Li, T. Revolutionizing tomato disease detection in complex environments. Front. Plant Sci. 2024, 15, 1409544. [Google Scholar] [CrossRef]
  20. Jin, M.; Zhang, J. Research on Microscale Vehicle Logo Detection Based on Real-Time DEtection TRansformer (RT-DETR). Sensors 2024, 24, 6987. [Google Scholar] [CrossRef]
  21. Yue, K.; Zhang, P.; Wang, L.; Guo, Z.; Zhang, J. Recognizing citrus in complex environment using improved YOLOv8n. Trans. Chin. Soc. Agric. Eng. 2024, 40, 152–158. [Google Scholar] [CrossRef]
  22. Chen, F.; Zhang, Y.; Wu, J.; Li, R.; Peng, L. Lightweight Road Disease Detection Model Based on YOLOv5 and Its Mobile Deployment. 2025. Available online: http://kns.cnki.net/kcms/detail/42.1671.TP.20250604.0810.008.html (accessed on 5 June 2025).
  23. Wu, Z.; Liu, M.; Sun, C.; Wang, X. A dataset of tomato fruits images for object detection in the complex lighting environment of plant factories. Data Brief 2023, 48, 109291. [Google Scholar] [CrossRef]
  24. Wolpert, D.H.; Macready, W.G. No free lunch theorems for optimization. IEEE Trans. Evol. Comput. 1997, 1, 67–82. [Google Scholar] [CrossRef]
  25. Wang, A.; Chen, H.; Lin, Z.; Han, J.; Ding, G. RepViT: Revisiting Mobile CNN From ViT Perspective. In Proceedings of the 2024 IEEE/CVF Conference on Computer Vision and Pattern Recognition (CVPR), Seattle, WA, USA, 16–22 June 2024. [Google Scholar] [CrossRef]
  26. Yu, Z.; Huang, H.; Chen, W.; Su, Y.; Liu, Y.; Wang, X. YOLO-FaceV2: A scale and occlusion aware face detector. Pattern Recognit. 2024, 155, 110714. [Google Scholar] [CrossRef]
  27. Minhyeok, L. Mathematical Analysis and Performance Evaluation of the GELU Activation Function in Deep Learning. J. Math. 2023, 2023, 4229924. [Google Scholar] [CrossRef]
  28. Dang, P.; Pang, P.; Lee, J. Depth-Wise Separable Convolution Neural Network with Residual Connection for Hyperspectral Image Classification. Remote Sens. 2020, 12, 3408. [Google Scholar] [CrossRef]
  29. Hu, J.; Shen, L.; Sun, G. Squeeze-and-Excitation Networks. In Proceedings of the 2018 IEEE/CVF Conference on Computer Vision and Pattern Recognition, Salt Lake City, UT, USA, 18–23 June 2018. [Google Scholar] [CrossRef]
  30. Li, J.; Han, Y.; Zhang, M.; Li, G.; Zhang, B. Multi-scale residual network model combined with Global Average Pooling for action recognition. Multimed. Tools Appl. 2022, 81, 1375–1393. [Google Scholar] [CrossRef]
  31. Hua, B.-S.; Tran, M.-K.; Yeung, S.-K. Pointwise Convolutional Neural Networks. In Proceedings of the 2018 IEEE/CVF Conference on Computer Vision and Pattern Recognition, Salt Lake City, UT, USA, 18–23 June 2018. [Google Scholar] [CrossRef]
  32. Wang, F.; Li, C.; Wu, B.; Yu, K.; Jin, C. Infrared Small Target Detection Method Based on Multi-Scale Feature Fusion. Infrared Technol. 2021, 43, 688–695. [Google Scholar] [CrossRef]
  33. Zhou, X.; Liu, C.; Zhou, B. Ship Detection in SAR Images Based on Multiscale Feature Fusion and Channel Relation Calibration of Features. J. Radar. 2021, 10, 531–543. [Google Scholar] [CrossRef]
  34. Tang, L.; Zhang, H.; Xu, H.; Ma, J. Rethinking the necessity of image fusion in high-level vision tasks: A practical infrared and visible image fusion network based on progressive semantic injection and scene fidelity. Inf. Fusion 2023, 99, 101870. [Google Scholar] [CrossRef]
  35. Zhang, H.; Wang, Y.; Dayoub, F.; Sünderhauf, N. VarifocalNet: An IoU-aware Dense Object Detector. In Proceedings of the 2021 IEEE/CVF Conference on Computer Vision and Pattern Recognition (CVPR), Nashville, TN, USA, 20–25 June 2021. [Google Scholar] [CrossRef]
  36. Zhou, Z.; Lu, Y.; Lv, L. A real-time defect detection algorithm for steel plate surfaces: The StarNet-GSConv-RetC3 detection transformer (SSR-DETR). Ann. N. Y. Acad Sci. 2025, 1–12. [Google Scholar] [CrossRef]
Figure 1. Sample images from the tomato dataset showing the (a) blue light, (b) red light, and (c) white light conditions and tomatoes in the (d) unripe, (e) partially ripe, and (f) ripe states.
Applsci 15 06589 g001
Figure 2. Illustrations of applied dataset augmentation techniques.
Applsci 15 06589 g002
Figure 3. RTDETR-R18 architecture.
Applsci 15 06589 g003
Figure 4. Enhanced LiteTom-RTDETR architecture.
Applsci 15 06589 g004
Figure 5. RepViT backbone structure.
Applsci 15 06589 g005
Figure 6. CGFM structure.
Applsci 15 06589 g006
Figure 7. The (a) original and (b) enhanced fusion model architecture.
Applsci 15 06589 g007
Figure 8. Dynamic weight variation schematic of the Sliding Loss function framework.
Applsci 15 06589 g008
Figure 9. Schematic diagram of CGFM insertion points in the feature fusion network, where S3 represents stage 3 feature map from the backbone network; S4 represents stage 4 feature map from the backbone network; F5 represents processed feature map from stage 5 after AIFI module.
Applsci 15 06589 g009
Figure 10. Visualization of the CGFM effect using heatmaps.
Applsci 15 06589 g010
Figure 11. Comparison of training loss convergence for Groups 4 and 5.
Applsci 15 06589 g011
Figure 12. Comparison of detection results provided by the (a) Faster-RCNN, (b) YOLOv8m, (c) original RTDETR, and (d) LiteTom-RTDETR models.
Applsci 15 06589 g012
Table 1. Parameter Comparison of Existing Models.
ModelParameters (Millions)GFLOPsModel Size (MB)Applicable ScenariosKey Contributions
PP-DETR [14]23.960.0-Pavement pothole detectionSPDRSFE+AFPN+Conv3XCC3
FCHF-DETR [19]16.347.8-Tomato disease detectionFasterNet+CGA+HSFPNSFF_Focaler+CloU
Based on RTDETR [20]18.7455.5-Vehicle logo detectionSlimNeck+SENetv2+CGBlock
YOLOv8m25.878.749.6General object detection-
RTDETR19.956.938.6General object detection-
LiteTom-RTDETR13.336.326.4Tomato detectionRepViT+CGFM+SVFL
Table 2. Number of tomato images and sample types in the constructed dataset.
Number of ImagesNumber of Green Tomato SamplesNumber of Red Tomato Samples
Training set36444892022
Validation set52468326
Test set1041039768
Total52059963116
Table 3. Number of tomato images and sample types in the augmented dataset.
ClassNumber of ImagesNumber of Green Tomato SamplesNumber of Red Tomato Samples
Training set1456150046650
Validation set20815991075
Test set41634752486
Total20802007810211
Table 4. Comparison of the RTDETR series models.
ModelAPAP50Parameters (Millions)GFLOPs
RTDETR-R1846.563.82060
RTDETR-R3448.966.83192
RTDETR-R5053.171.342136
RTDETR-R10154.372.776259
RTDETR-HGNetv2-L53.071.632110
RTDETR-HGNetv2-X54.873.167234
Note: AP indicates average precision; AP50 indicates average precision at an Intersection over Union threshold of 0.5; GFLOPs indicates 109 floating point operations per second.
Table 5. Experimental environment configuration.
CategoryConfiguration
CPUAMD Ryzen5 5600X CPU @ 3.6 GHz
GPUNVIDIA GeForce GTX 1660 SUPER
Operating systemWindows 10
Deep learning frameworkPyTorch 1.13.1+cu117
Programming languagePython 3.8
Table 6. Experimental hyperparameter settings.
ParameterSetting
Input image size640 × 640
Initial learning rate0.0001
Momentum0.9
Weight decay coefficient0.0001
IoU threshold0.7
Batch-size4
Training epochs200
Table 7. Comparative performance of models with different CGFM insertion points (%).
ModelPRmAP50mAP50:95F1
LiteTom-RTDETR89.080.186.461.084.3
LiteTom-RTDETR-CGFM-①89.180.487.062.784.5
LiteTom-RTDETR-CGFM-②88.280.587.162.384.2
LiteTom-RTDETR-CGFM-③89.681.188.261.985.1
LiteTom-RTDETR-CGFM-④87.279.686.361.483.2
LiteTom-RTDETR-CGFM-①②88.878.486.661.383.3
LiteTom-RTDETR-CGFM-①③87.179.586.361.183.1
LiteTom-RTDETR-CGFM-①④88.578.786.662.483.3
LiteTom-RTDETR-CGFM-②③88.079.686.562.483.6
LiteTom-RTDETR-CGFM-②④88.480.186.861.284.0
LiteTom-RTDETR-CGFM-③④87.180.386.562.383.6
LiteTom-RTDETR-CGFM-①②③86.681.286.961.283.8
LiteTom-RTDETR-CGFM-①②④89.379.886.862.384.3
LiteTom-RTDETR-CGFM-①③④88.379.987.161.683.9
LiteTom-RTDETR-CGFM-②③④88.179.386.260.583.5
LiteTom-RTDETR-CGFM-①②③④88.779.086.661.283.6
Note: Bold values indicate the optimal results.
Table 8. Results of ablation experiment.
GroupBackboneCGFMVFLSVFLmAP50ParametersGFLOPsInference Speed (FPS)Model Size (MB)
ResNet18RepViT(%)(Millions)
187.619.9756.945.238.6
286.213.3036.352.526.4
386.413.3036.352.326.4
487.013.3436.351.826.4
588.213.3436.353.226.4
Note: The symbol “√” indicates that the module is activated, whereas the symbol “—” indicates that it is deactivated.
Table 9. Comparative analysis of recognition models.
ModelP (%)R (%)F1 (%)mAP50 (%)
Faster-RCNN61.276.968.274.8
YOLOv8m87.982.084.888.1
RTDETR87.782.384.987.6
LiteTom-RTDETR89.681.185.188.2
Table 10. Complexity evaluation of different models.
ModelParameters (Millions)GFLOPsInference Speed (FPS)Model Size (MB)
Faster-RCNN28.3174.128.3108.2
YOLOv8m25.878.739.849.6
RTDETR19.956.945.238.6
LiteTom-RTDETR13.336.352.226.4
Disclaimer/Publisher’s Note: The statements, opinions and data contained in all publications are solely those of the individual author(s) and contributor(s) and not of MDPI and/or the editor(s). MDPI and/or the editor(s) disclaim responsibility for any injury to people or property resulting from any ideas, methods, instructions or products referred to in the content.

