


Assessment of Carbon Neutrality Performance of Buildings Using EPD-Certified Korean Construction Materials


Abstract
1. Introduction
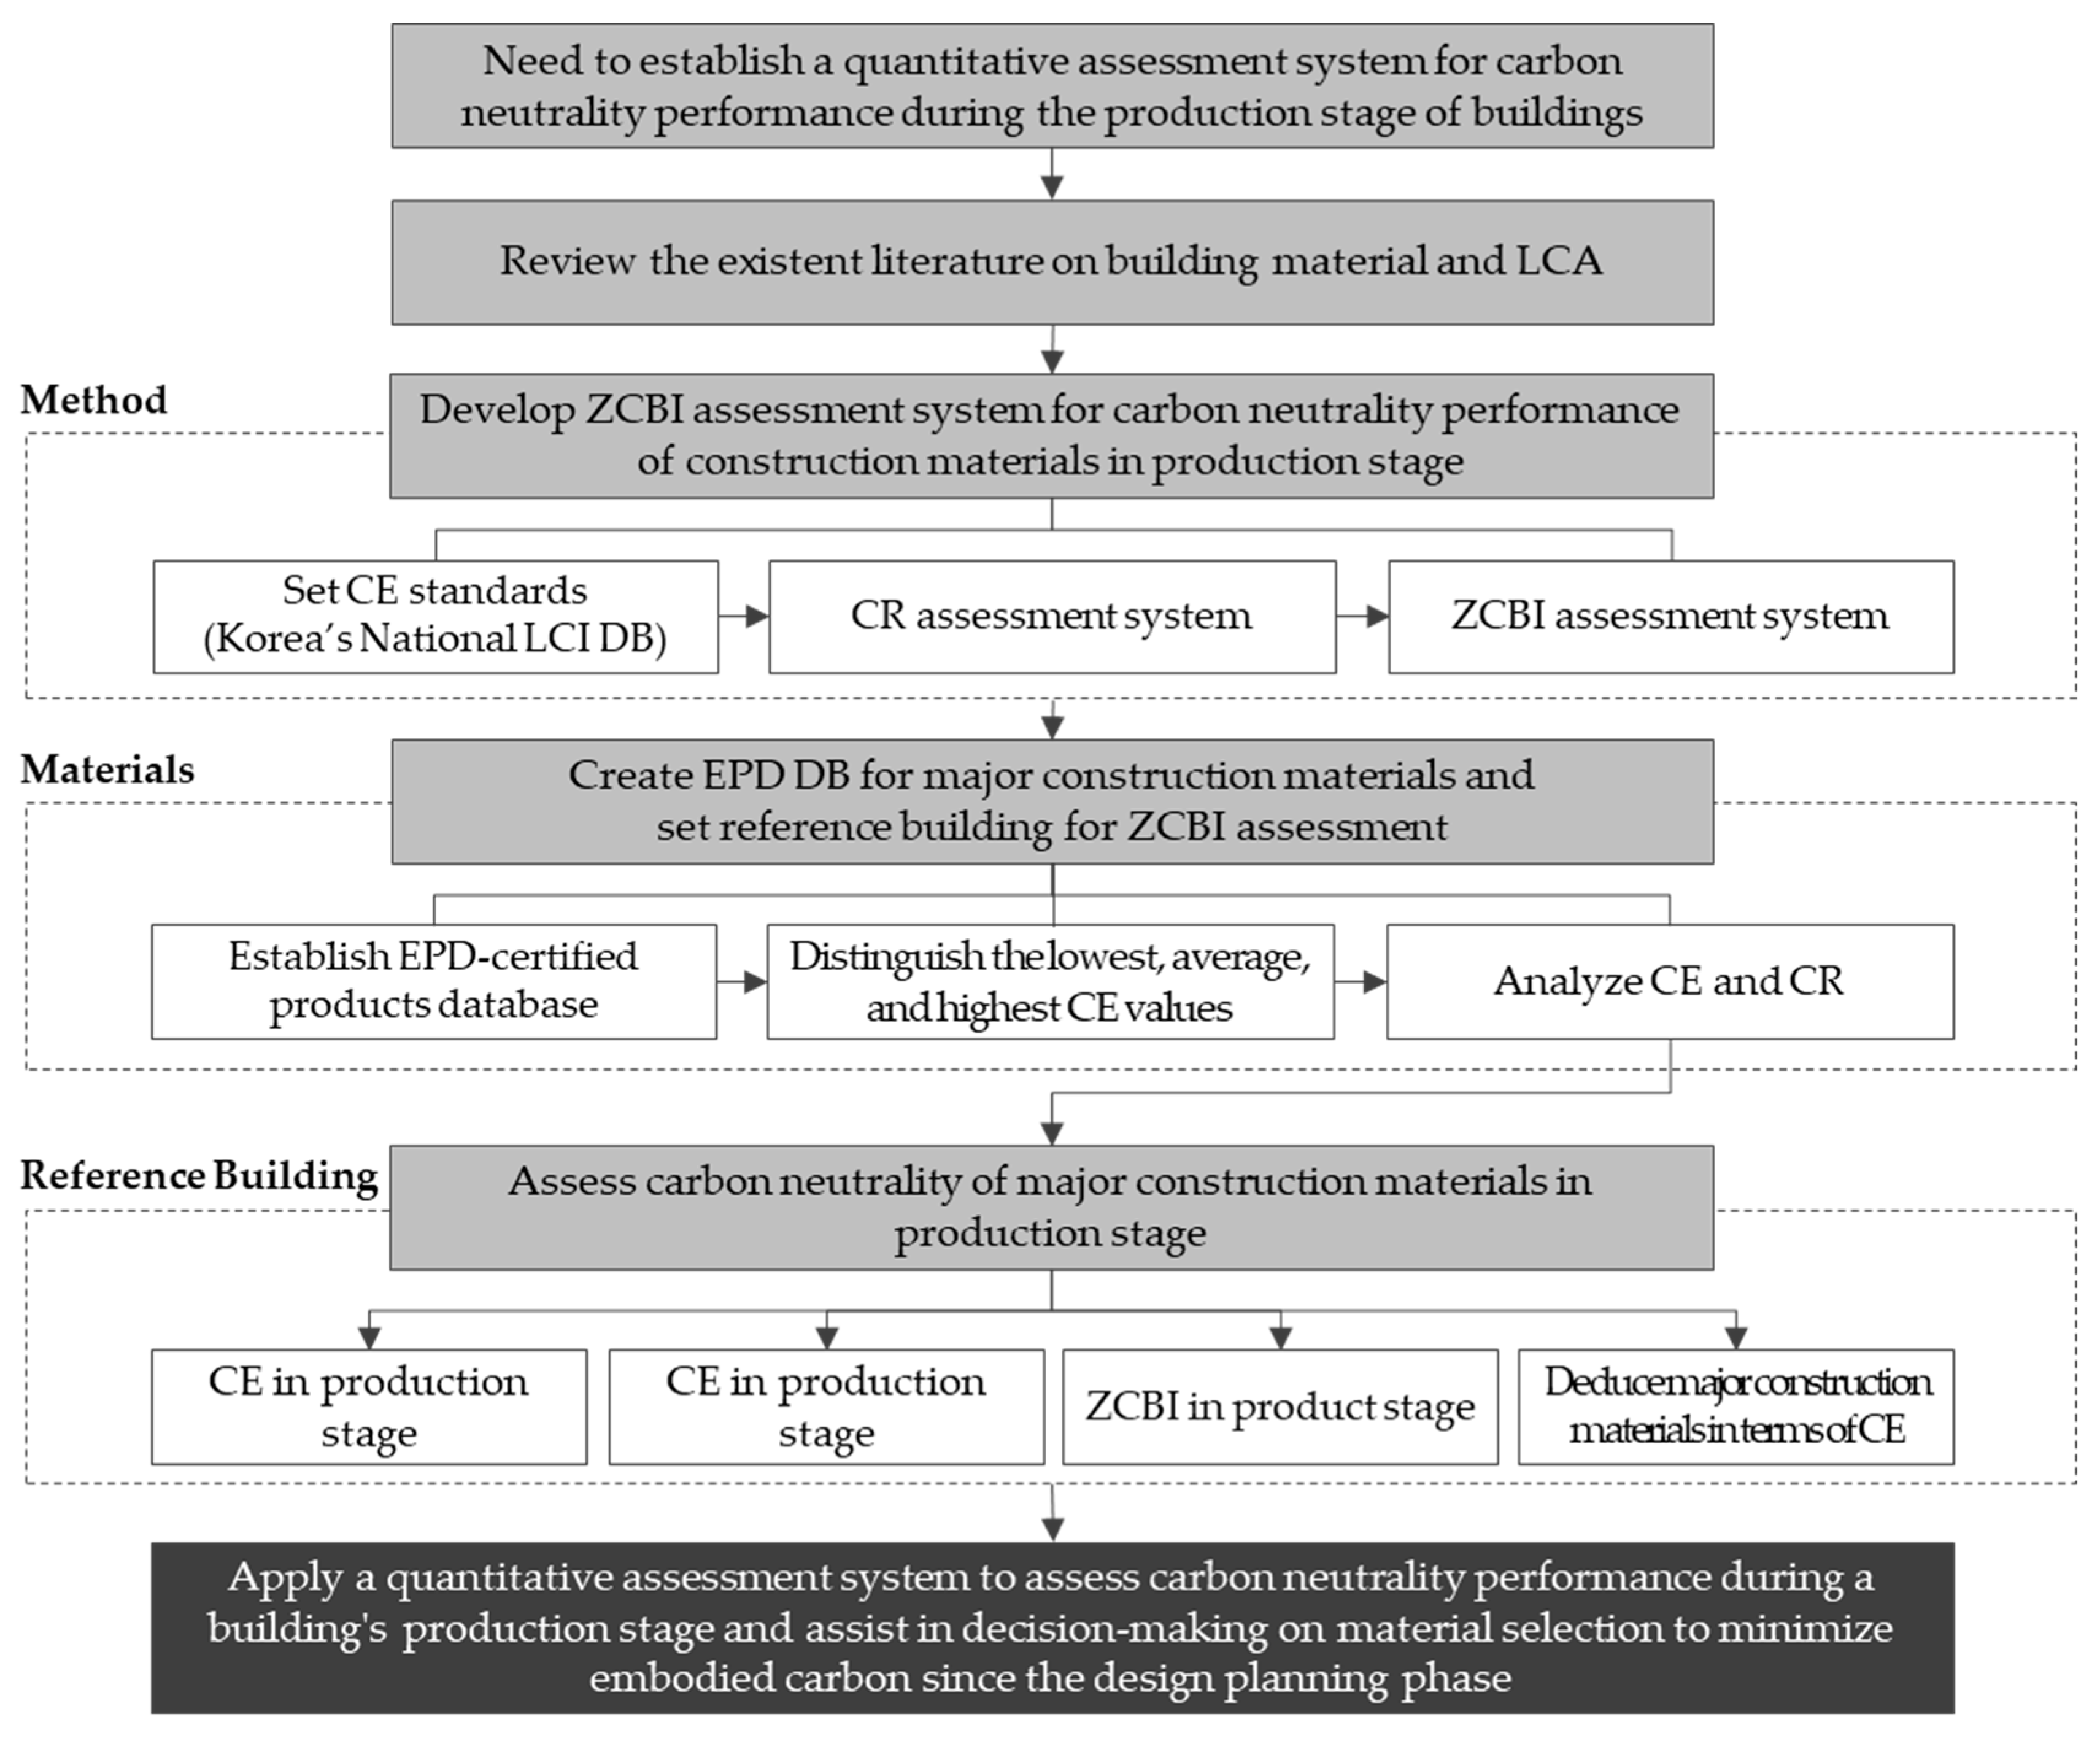
2. Methodology and Flow of Research
3. Literature Review
3.1. Environmental Labeling (International Organization of Standardization (ISO) 14020s)
3.2. Life Cycle Assessment (ISO 14040s)
3.3. National Life Cycle Inventory (LCI) Database
4. Analysis of Zero Carbon Performance in Production Stage
4.1. A1–A3ZCBI Calculation Method
- A1–A3ZCBI: Zero Carbon Building Index in production stage (kgCO2e/m2).
- A1–A3CR: Amount of Carbon Reduction in production stage (kgCO2e/m2).
- CELCI DB: Carbon Emissions in the production stage through Korea’s national LCI database (kgCO2e/m2).
- A1–A3CR: Amount of Carbon Reduction in production stage (kgCO2e/m2).
- CELCI DB: Carbon Emissions in the production stage through Korea’s national LCI database (kgCO2e/m2).
- CEEPD DB: Carbon Emissions in the production stage through Korea’s EPD database (kgCO2e/m2).
4.2. Establishment of EPD Database of Major Materials
5. Construction of a Reference Building
5.1. Establishing Classification Systems
5.2. Setting Input Quantity of Major Construction Materials
5.3. Derivation of Carbon Emissions
6. Assessment of Carbon Neutrality Performance in Production Stage
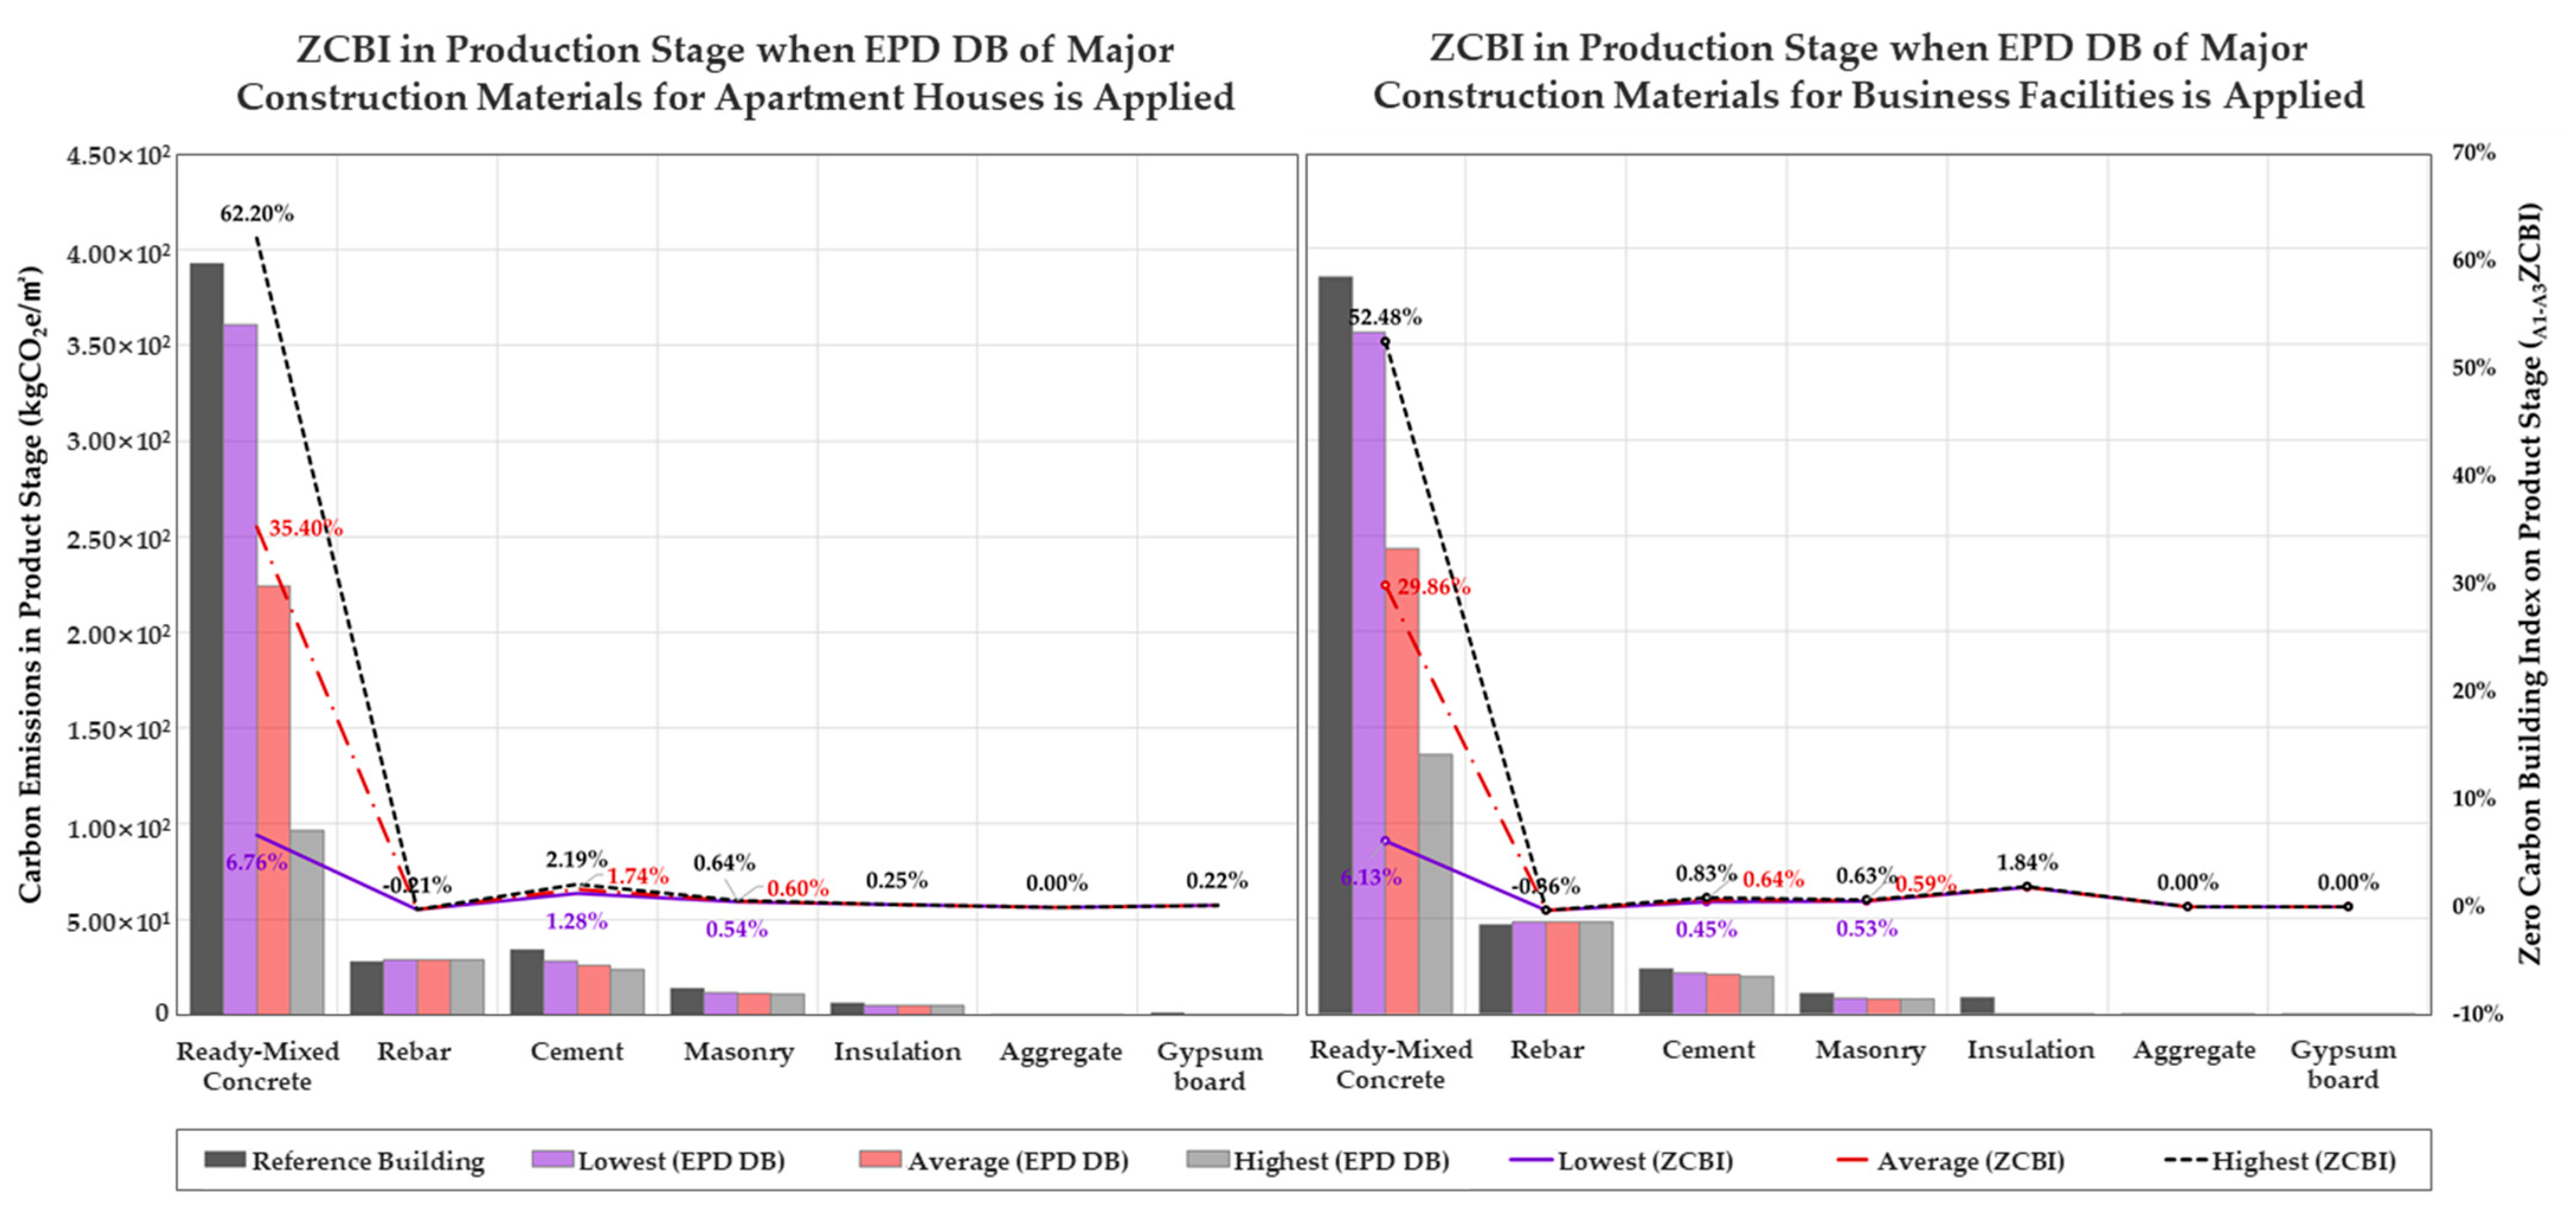
6.1. Derivation of A1–A3ZCBI for Apartment Houses
6.2. Derivation of A1–A3ZCBI for Business Facilities
6.3. Derivation of Major Construction Materials Based on Contribution to Cumulative CE
7. Discussion
8. Conclusions
- The A1–A3ZCBI was introduced to evaluate carbon neutrality performance by assessing A1–A3CE and A1–A3CR during the production stage.
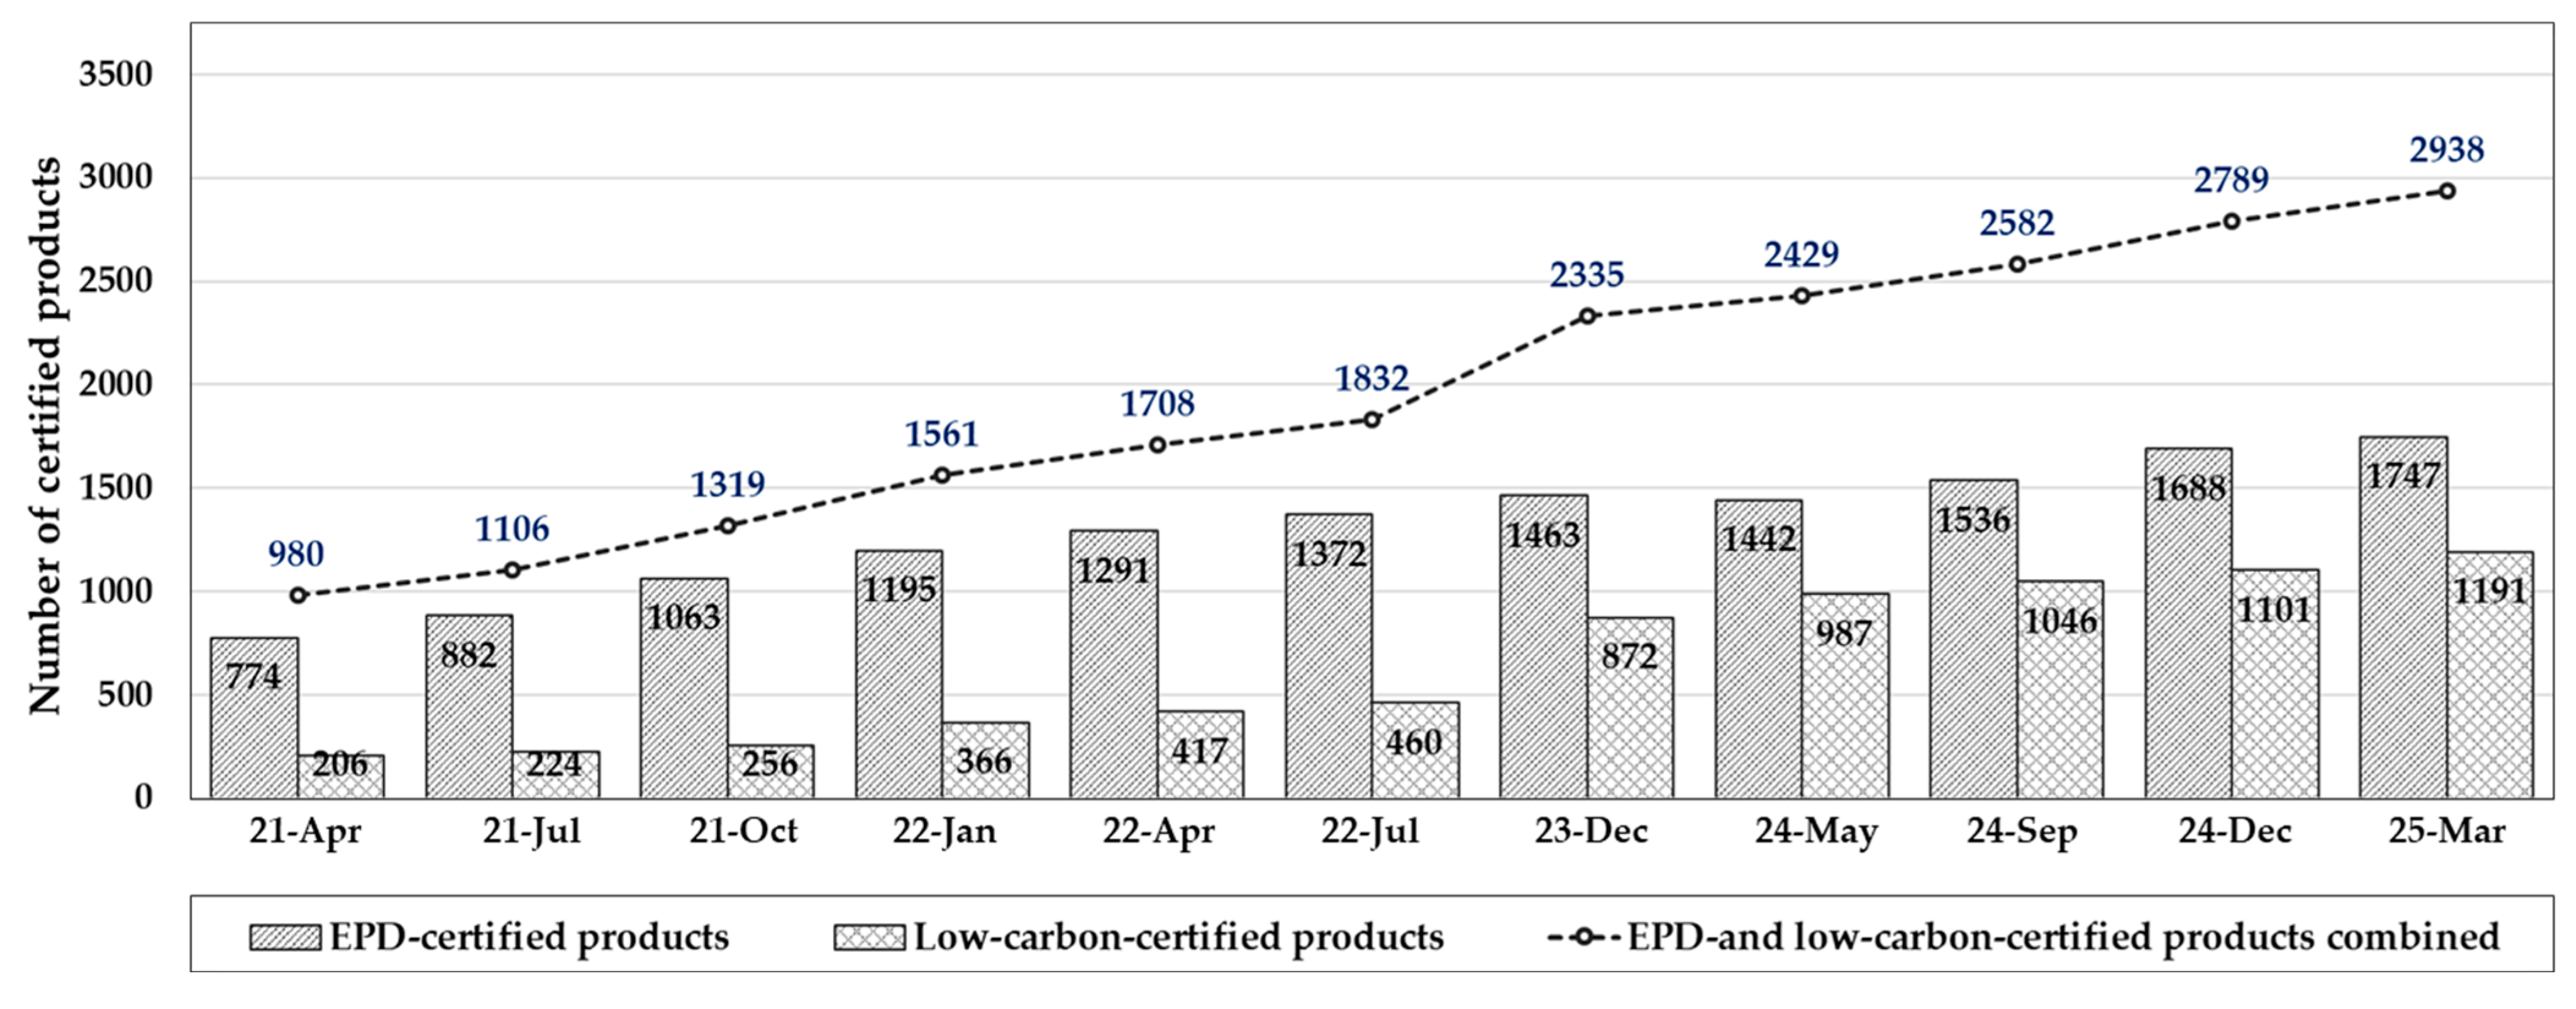
- To analyze the A1–A3CR and A1–A3ZCBI, an EPD database was created for 797 building materials, sourced from 1832 EPD-certified products manufactured in Korea.
- As EPD-certified products exhibit various A1–A3CE values depending on the manufacturer or model within the same product group, the lowest, average, and highest A1–A3CE values were identified for each group. This distinction facilitated decision-making in product selection and analysis of A1–A3CR and A1–A3ZCBI.
- To analyze the proposed A1–A3ZCBI, reference buildings were created based on four classification systems: region, building purpose, structural form, and structural scale.
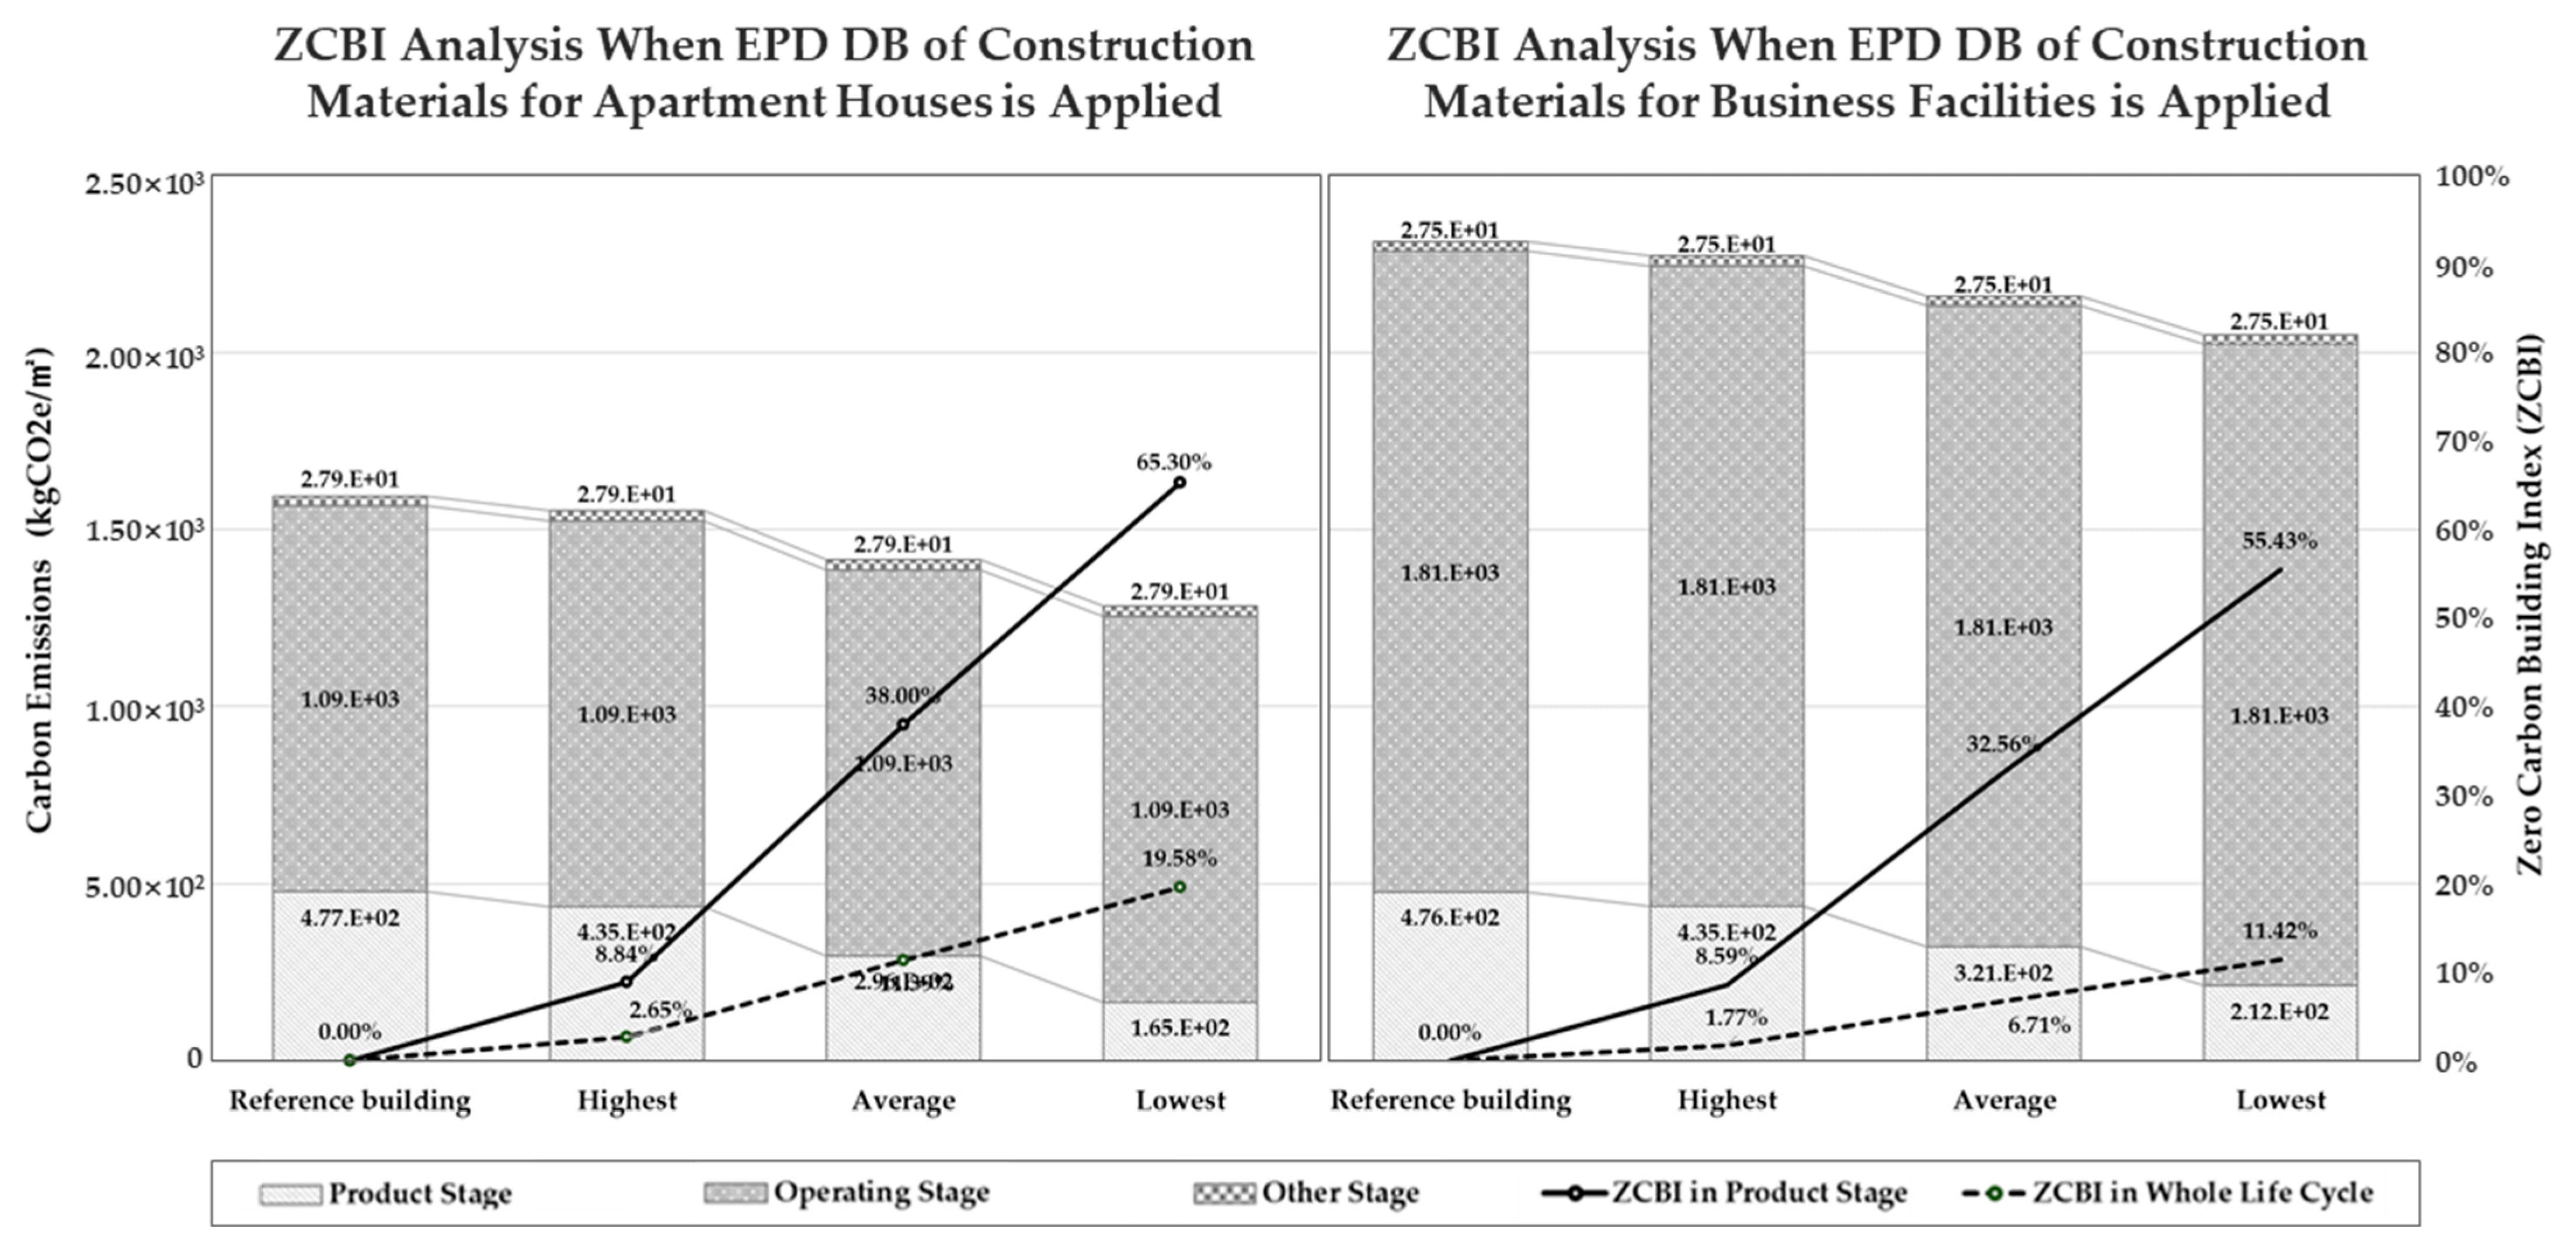
- The A1–A3ZCBI analysis of major construction materials showed that the A1–A3ZCBI ranged from 8.84% to 65.24% for apartment houses and from 8.58% to 55.40% for business facilities. Additionally, the ZCBI across all stages based on A1–A3CR ranged from 2.65% to 19.56% for apartment houses and from 1.77% to 11.42% for business facilities.
- Finally, the key materials contributing to the top 99% of cumulative carbon emissions during the production stage (A1–A3CE) were identified. For both apartment houses and business facilities, these materials, ranked by impact, were ready-mixed concrete, steel, cement, and masonry.
Author Contributions
Funding
Institutional Review Board Statement
Informed Consent Statement
Data Availability Statement
Acknowledgments
Conflicts of Interest
Abbreviations
| A1–A3CE | Carbon Emissions in Production Stage |
| A1–A3CR | Carbon Reduction in Production Stage |
| A1–A3ZCBI | Zero Carbon Building Index in Production Stage |
| CE | Carbon Emission |
| CR | Carbon Reduction |
| ZCBI | Zero Carbon Building Index |
| EPD | Environmental Product Declaration |
| G-SEED | Green Standard for Energy & Environmental Design |
| KEITI | Korea Environmental Industry & Technology Institute |
| KICT | Korea Institute of Civil Engineering and Building Technology |
| LCI | Life Cycle Inventory |
| LCA | Life Cycle Assessment |
References
- Rogelj, J.; Shindell, D.; Jiang, K.; Fifita, S.; Forster, P.; Ginzburg, V.; Handa, C.; Kheshgi, H.; Kobayashi, S.; Kriegler, E.; et al. Mitigation Pathways Compatible with 1.5 C in the Context of Sustainable Development. In Global Warming of 1.5 C. An IPCC Special Report on the Impacts of Global Warming of 1.5 C Above Pre-Industrial Levels and Related Global Greenhouse Gas Emission Pathways, in the Context of Strengthening the Global Response to the Threat of Climate Change, Sustainable Development, and Efforts to Eradicate Poverty; Masson-Delmotte, V., Zhai, P., Pörtner, H.-O., Roberts, D., Skea, J., Shukla, P.R., Pirani, A., Moufouma-Okia, W., Pan, C., Pidcock, R., et al., Eds.; Intergovernmental Panel on Climate Change (IPCC): Geneva, Switzerland, 2018; in press. [Google Scholar]
- Rogelj, J.; Den Elzen, M.; Höhne, N.; Fransen, T.; Fekete, H.; Winkler, H.; Schaeffer, R.; Sha, F.; Riahi, K.; Meinshausen, M. Paris Agreement climate proposals need a boost to keep warming well below 2 °C. Nature 2016, 534, 631–639. [Google Scholar] [CrossRef] [PubMed]
- The Energy Information Administration (EIA). Annual Energy Outlook—Fossil Fuels Remain Dominant Through 2040; EIA: Washington, DC, USA, 2014.
- United Nations. Net Zero Coalition. United Nations Climate Change. 2020. Available online: https://www.un.org/en/climatechange/net-zero-coalition (accessed on 30 March 2025).
- WMO Confirms 2024 as Warmest Year on Record at About 1.55 °C Above Pre-Industrial Level. World Meteorological Organization. 2025. Available online: https://wmo.int/news/media-centre/wmo-confirms-2024-warmest-year-record-about-155degc-above-pre-industrial-level (accessed on 30 March 2025).
- Bevacqua, E.; Schleussner, C.-F.; Zscheischler, J. A year above 1.5 °C signals that Earth is most probably within the 20-year period that will reach the Paris Agreement limit. Nat. Clim. Change 2025, 15, 123–129. [Google Scholar] [CrossRef]
- Ministry of Environment (ME). Discussion on the National Greenhouse Gas Reduction Goals. 2050 Carbon Neutrality Promotion Committee. 2021. Available online: https://www.2050cnc.go.kr/base/board/read?boardManagementNo=4&boardNo=101&page (accessed on 30 March 2024).
- Ministry of Economy and Finance (MOEF). Korean New Deal. Ministry of Economy and Finance. 2020. Available online: https://english.moef.go.kr/pc/selectTbPressCenterDtl.do?boardCd=N0001&seq=4948 (accessed on 30 November 2024).
- Ministry of Environment (ME). Framework Act on Carbon Neutrality and Green Growth for Coping with Climate Crisis; Ministry of Government Legislation: Sejong, Republic of Korea, 2022. Available online: https://law.go.kr/LSW/eng/engLsSc.do?menuId=2§ion=lawNm&query=carbon+neutral&x (accessed on 30 March 2025).
- Wang, S. A Study on Carbon Neutral Building Certification System Based on Building Life Cycle Assessment. Doctoral Thesis, Hanyang University, Seoul, Republic of Korea, 2023. [Google Scholar]
- Kumanayake, R.; Luo, H. A comprehensive review of building lifecycle carbon emissions and assessment methods. Sustain. Struct. 2024, 15, 123–145. [Google Scholar]
- Lee, J.; Woo, J. Green New Deal policy of South Korea: Policy innovation for a sustainability transition. Sustainability 2020, 12, 10191. [Google Scholar] [CrossRef]
- World Green Building Council. Advancing Net Zero: Embodied Carbon; World Green Building Council: London, UK, 2021; Available online: https://worldgbc.org/advancing-net-zero/embodied-carbon/ (accessed on 30 March 2024).
- National Institute of Standards and Technology (NIST). Systematic Review of Embodied Carbon Assessment and Reduction Methodologies; NIST Special Publication 1324; National Institute of Standards and Technology: Gaithersburg, MD, USA, 2024. Available online: https://nvlpubs.nist.gov/nistpubs/SpecialPublications/NIST.SP.1324.pdf (accessed on 30 March 2025).
- Röck, M.; Saade, M.R.M.; Balouktsi, M.; Nygaard Rasmussen, F.; Birgisdottir, H.; Frischknecht, R.; Habert, G.; Lützkendorf, T.; Passer, A. Embodied GHG Emissions of Buildings—The Hidden Challenge for Effective Climate Change Mitigation. Appl. Energy 2020, 258, 114107. [Google Scholar] [CrossRef]
- Chen, C.; Zhao, Z.; Xiao, J.; Tiong, R. A Conceptual Framework for Estimating Building Embodied Carbon Based on Digital Twin Technology and Life Cycle Assessment. Sustainability 2021, 13, 13875. [Google Scholar] [CrossRef]
- Korea Environmental Industry and Technology Institute (KEITI). EPD Certification Status. KEITI EcoSquare. 2025. Available online: https://ecosq.or.kr/websquare.do#w2xPath=/ui/cer/ic/oh/ICOH110M01.xml&valVl (accessed on 30 April 2025).
- Korea Institute of Civil Engineering and Building Technology (KICT). Green Standard for Energy and Environmental Design (G-SEED) Manual. KITC G-SEED Website. 2025. Available online: http://www.gseed.or.kr/greenCommentary.do (accessed on 31 December 2024).
- Korea Environmental Industry and Technology Institute (KEITI). Introduction to the LCI Database. KEITI EcoSquare. 2025. Available online: https://ecosq.or.kr/websquare.do#w2xPath=/ui/cer/ic/oh/ICOH110M01.xml (accessed on 30 April 2025).
- Smith, A.; Johnson, L.; Brown, R. The Role of Environmental Product Declarations in the Decarbonization of the Construction Industry. Energies 2023, 18, 1308. [Google Scholar]
- Wang, S.J.; Tae, S.H.; Kim, R.H. Development of a Green Building Materials Integrated Platform Based on Materials and Resources in G-SEED in South Korea. Sustainability 2019, 11, 6532. [Google Scholar] [CrossRef]
- Minkov, N.; Lehmann, A.; Winter, L.; Finkbeiner, M. Characterization of environmental labels beyond the criteria of ISO 14020-series. Int. J. Life Cycle Assess. 2019, 24, 840–855. [Google Scholar] [CrossRef]
- ISO 14020; Environmental Statements and Programes for Products—Principles and General Requirements. International Organization for Standardization: Geneva, Switzerland, 2022.
- ISO 14021; Environmental Labels and Declarations—Self-Declared Environmental Claims (Type II Environmental Labelling). International Organization for Standardization: Geneva, Switzerland, 2016.
- ISO 14024:1999; Environmental Labels and Declarations-Type I Environmental Labelling-Principles and Procedures. International Organization for Standardization (ISO): Geneva, Switzerland, 1999.
- ISO 14025; Environmental Labels and Declarations—Type III Environmental Declarations—Principles and Procedures. International Organization for Standardization: Geneva, Switzerland, 2006.
- Huang, L.; Solangi, Y.A.; Magazzino, C.; Solangi, S.A. Evaluating the efficiency of green innovation and marketing strategies for long-term sustainability in the context of environmental labeling. J. Clean. Prod. 2024, 450, 141870. [Google Scholar] [CrossRef]
- Kuznetsova, M.; Kuznetsov, A. Ecolabeling as a policy instrument for more sustainable development. Sustainability 2021, 13, 9581. [Google Scholar] [CrossRef]
- Nikolay, M.; Vanessa, B.; Matthias, F. Characterization of the cradle to cradle certified™ products program in the context of eco-labels and environmental declarations. Sustainability 2018, 10, 738. [Google Scholar] [CrossRef]
- Korea Environmental Industry and Technology Institute (KEITI). Maximum Allowable Carbon Emissions Standard. KEITI EcoSquare. 2025. Available online: https://ecosq.or.kr/websquare.do#w2xPath=/ui/cer/ic/oh/ICOH110M03.xml&valVl (accessed on 30 April 2025).
- ISO 14040; Environmental Management—Life Cycle Assessment—Principles and Framework. International Organization for Standardization: Geneva, Switzerland, 2006.
- ISO 14044:2006/Amd 2:2020; Environmental Management—Life Cycle Assessment—Requirements and Guidelines. International Organization for Standardization: Geneva, Switzerland, 2020.
- Korea Institute of Civil Engineering and Building Technology (KICT). Life Cycle Assessment (LCA) Preparation Guideline; Green Standard for Energy and Environmental Design (G-SEED) Manual; KITC: Goyang, Republic of Korea, 2018. [Google Scholar]
- Kim, H.; Tae, S.; Kim, R. The Study on Environmental Impacts of Building Using Life Cycle Assessment of G-SEED. Korean J. Life Cycle Assess. 2018, 19, 15–20. [Google Scholar] [CrossRef]
- Roh, S.J.; Tae, S.H.; Suk, S.J.; Ford, G. Evaluating the embodied environmental impacts of major building tasks and materials of apartment buildings in Korea. Renew. Sustain. Energy Revs 2017, 73, 135–144. [Google Scholar] [CrossRef]
- Takano, A.; Winter, S.; Hughes, M.; Linkosalmi, L. Comparison of life cycle assessment databases: A case study on building assessment. Build. Environ. 2014, 79, 20–30. [Google Scholar] [CrossRef]
- Lasvaux, S.; Habert, G.; Peuportier, B.; Chevalier, J. Comparison of generic and product-specific Life Cycle Assessment databases: Application to construction materials used in building LCA studies. Int. J. Life Cycle Assess. 2015, 20, 1473–1490. [Google Scholar] [CrossRef]
- Martínez-Rocamora, A.; Solís-Guzmán, J.; Marrero, M. LCA databases focused on construction materials: A review. Renew. Sustain. Energy Rev. 2016, 58, 565–573. [Google Scholar] [CrossRef]
- Mohebbi, G.; Bahadori-Jahromi, A.; Ferri, M.; Mylona, A. The Role of Embodied Carbon Databases in the Accuracy of Life Cycle Assessment (LCA) Calculations for the Embodied Carbon of Buildings. Sustainability 2021, 13, 7988. [Google Scholar] [CrossRef]
- Jang, H.J.; Wang, S.J.; Tae, S.H.; Zheng, P.F. Establishment of an Environmental Impact Factor Database for Building Materials to Support Building Life Cycle Assessments in China. Buildings 2024, 14, 228. [Google Scholar] [CrossRef]
- Zheng, J.-F.; Lu, Z.-P.; Ding, Y.; Guo, Z.-Z.; Zhou, S.-X. Management of Carbon Emissions Throughout the Building Life Cycle Based on the Analytic Hierarchy Process. Buildings 2025, 15, 592. [Google Scholar] [CrossRef]
- Ministry of Environment (ME). National LCI DB Development Guideline; ME: Sejong, Republic of Korea, 2025. Available online: https://ecosq.or.kr/websquare.do#w2xPath=/ui/com/nn/oe/NNOE100M02.xml&tmpltNo=BBS0085&bbsSn=5050&twdcvlnTaskSeCd=&tabId=tabs&menuSn=80010104&lgcyTabId=tabs&lgcyPageIdx=0&lgcyTwdcvlnBbsLclsfCd=&lgcyRecsroomMclsfCd=&lgcySrchCondt=SRCH_ALL&lgcySrchCondtCn=LCI (accessed on 30 April 2025).
- Kim, H.S. Proposal of a Methodology for Evaluating the Life Cycle Assessment Using the Standard Quantity of Building Materials Based on Probabilistic Analysis Techniques. Master’s Thesis, Hanyang University, Seoul, Republic of Korea, 2022. [Google Scholar]

| Standard | Year (yyyy.mm) | Environmental Labeling |
|---|---|---|
| ISO 14020 [23] | 2000.09 | Environmental Labels and Declarations (general principle) |
| ISO 14021 [24] | 1999.09 | Type II (self-environmental claim) |
| ISO 14024 [25] | 1999.04 | Type I |
| ISO 14025 [26] | 2006.07 | Type III |
| Year | Authors | Main Contents | Differences in This Study |
|---|---|---|---|
| 2015 | Lasvaux et al. [37] | Compared and analyzed data developed in France with data from Europe. | Previous studies had limitations in the number of materials analyzed and lacked a methodology for deriving comparative results across actual buildings. |
| 2016 | A. Martínez-Rocamora et al. [38] | Established criteria for selecting LCA databases when inconsistencies exist between the database and building conditions. | Although selection criteria have been suggested, no study has proposed constructing a database that satisfies those criteria and allows for application to real building cases. |
| 2021 | Mohebbi, G et al. [39] | Proposed carbon input calculation criteria within the UK context. | While UK data are available, they lack comprehensive coverage of materials used throughout the full construction process. |
| 2024 | H.J Jang et al. [40] | Developed and improved an environmental impact database for construction materials in China. | Lacked the concept of a reference building and evaluation methodology, making it impossible to estimate carbon reduction (CR) potential. |
| 2025 | Jie-Fu Zheng et al. [41] | Proposed an evaluation model for managing whole-process carbon emissions (CE) in buildings. | Did not present a structured database or a quantitative method for estimating carbon reduction (CR) performance. |
| Construction Materials | Detail | Unit | Carbon Emissions (CE) | Construction Materials | Detail | Unit | Carbon Emissions (CE) |
|---|---|---|---|---|---|---|---|
| Ready-mixed concrete | 18 MPa | m3 | 4.09 × 10² | Insulator | Expanded polystyrene (EPS) | kg | 1.96 × 100 |
| 24 MPa | m3 | 4.14 × 10² | Extruded polystyrene (XPS) | kg | 3.28 × 100 | ||
| 27 Mpa | m3 | 4.14 × 10² | Glass wool | ton | 1.90 × 10² | ||
| Masonry | Concrete brick | kg | 1.23 × 10⁻¹ | Cement | Cement | ton | 1.06 × 10³ |
| Autoclaved lightweight concrete (ALC) block | kg | 6.57 × 10⁻¹ | White Portland Cement | kg | 1.22 × 100 | ||
| Aggregate | Sand | m3 | 3.87 × 100 | Mortar | kg | 4.31 × 10⁻¹ | |
| Gravel | m3 | 1.13 × 101 | Gypsum board | Square edge-type board | ton | 1.38 × 10² | |
| Rebar | - | kg | 4.38 × 10⁻¹ | Fire protection | ton | 1.38 × 10³ | |
| Tile | - | kg | 3.53 × 10⁻¹ | Glass | Double-glazed Glass | m2 | 2.24 × 101 |
| Stone | Granite | m3 | 2.90 × 10⁻¹ | Tempered Glass | m2 | 1.0 × 100 | |
| Artificial marble | kg | 1.64 × 101 | Plate glass | ton | 7.89 × 10² |
| Category | Ready-Mixed Concrete | Rebar | Masonry | Insulation | Aggregate | Stone | Cement | Gypsum Board | Total |
|---|---|---|---|---|---|---|---|---|---|
| Total certified products | 770 | 2 | 4 | 11 | 0 | 0 | 7 | 3 | 797 |
| EPD-certified | 610 | 2 | 4 | 8 | 0 | 0 | 7 | 1 | 632 |
| Low-carbon certified | 160 | 0 | 0 | 3 | 0 | 0 | 0 | 2 | 165 |
| Unit conversion | m2 > ton | kg > ton | m2 > ton | m2 > ton | - | - | kg > ton | m2 > ton | ton |
| Major Materials | Detailed Specification | Certifications | Lowest (1) | Average (2) | Highest (3) |
|---|---|---|---|---|---|
| Ready-mixed concrete | 18 MPa | 12 | 1.08 × 10² | 1.91 × 10² | 2.72 × 10² |
| 21 MPa | 163 | 1.12 × 10² | 2.25 × 10² | 3.22 × 10² | |
| 24 MPa | 214 | 1.01 × 10² | 2.39 × 10² | 3.87 × 10² | |
| 27 MPa | 164 | 1.59 × 10² | 2.71 × 10² | 3.88 × 10² | |
| 30 MPa | 132 | 1.70 × 10² | 2.83 × 10² | 4.05 × 10² | |
| 35 MPa | 63 | 1.67 × 10² | 2.99 × 10² | 3.95 × 10² | |
| 40 MPa | 22 | 2.67 × 10² | 3.73 × 10² | 3.73 × 10² | |
| Rebar | Steel bars for reinforced concrete (RC) | 2 | 4.54 × 10⁻¹ | N/A | N/A |
| Masonry | Concrete brick | N/A | N/A | N/A | N/A |
| ALC block | 4 | 2.77 × 10² | 3.03 × 10² | 3.37 × 10² | |
| Insulation | Fiber insulation | 3 | 4.68 × 100 | 5.43 × 100 | 6.19 × 100 |
| EPS | 3 | 2.40 × 10² | 3.36 × 100 | 4.64 × 100 | |
| XPS | N/A | N/A | N/A | N/A | |
| Aggregate | Sand | N/A | N/A | N/A | N/A |
| Gravel | N/A | N/A | N/A | N/A | |
| Stone | Granite | N/A | N/A | N/A | N/A |
| Cement | Cement | 4 | 8.83 × 10² | 9.24 × 10² | 9.65 × 10² |
| Mortar | 3 | 1.99 × 10⁻¹ | 2.41 × 10⁻¹ | 2.83 × 10⁻¹ | |
| Gypsum board | Square edge-type board | 3 | 5.92 × 10⁻¹ | 6.62 × 10⁻¹ | 7.03 × 10⁻¹ |
| Classification System | Utilized Data | Analysis Result | Selection Result |
|---|---|---|---|
| Region | Green Standard for Energy and Environmental Design (G-SEED) certification |
| Capital area (Seoul, Gyeonggi, Incheon) |
| Building purpose | G-SEED certification |
| Residential: Apartment houses Non-residential: Business facilities |
| Structural form | G-SEED life cycle assessment (LCA) certification |
| RC structure |
| Structural scale | G-SEED LCA certification |
| Total floor area, 99,119.31 m2 Total floor area, 19,275.24 m2 |
| Building Lifespan | G-SEED LCA guideline |
| 50 years |
| Major Construction Materials | Apartment House (RC) | Business Facility (RC) | General Building (RC) | Major Construction Materials | Apartment House (RC) | Business Facility (RC) | General Building (RC) |
|---|---|---|---|---|---|---|---|
| Ready-mixed concrete | 2184.72 | 2141.75 | 1869.92 | Cement | 50.88 | 22.43 | 18.42 |
| Rebar | 63.64 | 106.73 | 84.58 | Stone | 2.43 | 7.82 | 2.92 |
| Section steel | 0.00 | 0.00 | 1.19 | Aggregate | 43.46 | 46.87 | 79.53 |
| Glass | 8.22 | 6.23 | 8.56 | Wood | 1.36 | 0.89 | 0.00 |
| Masonry | 88.49 | 63.10 | 53.27 | Paint | 2.77 | 1.41 | 1.03 |
| Insulation | 2.22 | 2.89 | 2.30 | Iron | 0.50 | 1.36 | 4.23 |
| Gypsum board | 7.75 | 5.15 | 4.84 | Tile | 7.13 | 4.03 | 5.08 |
| No. | Major Construction Materials | Specification | Unit | Input Quantity for Apartment Houses | Input Quantity for Business Facilities |
|---|---|---|---|---|---|
| 1 | Ready-mixed concrete | 18 MPa | ton | 13,640.91 | 1910.76 |
| 24 MPa | ton | 202,906.35 | 7835.24 | ||
| 27 MPa | ton | N/A | 31,536.25 | ||
| 2 | Rebar | Steel bars for RC | ton | 6307.93 | 2057.22 |
| 3 | Masonry | Concrete brick | ton | 7211.30 | 924.88 |
| Autoclaved aerated concrete block | ton | 1535.54 | 291.37 | ||
| 4 | Insulation | Fiber insulation | ton | N/A | 9.98 |
| EPS | ton | 59.87 | 45.73 | ||
| XPS | ton | 156.66 | N/A | ||
| 5 | Aggregate | Sand | ton | 4307.71 | 793.37 |
| Gravel | ton | N/A | 110.05 | ||
| 6 | Stone | Granite | ton | N/A | 150.73 |
| 7 | Cement | Cement | ton | 1945.07 | 432.34 |
| Mortar | ton | 3098.10 | N/A | ||
| 8 | Gypsum board | Square edge-type board | ton | 768.17 | N/A |
| Total | ton | 241,937.61 | 46,097.92 | ||
| System Boundary | Apartment Houses | Business Facilities | ||||
|---|---|---|---|---|---|---|
| Carbon Emissions (CE) | Ratio | Carbon Emissions (CE) | Ratio | |||
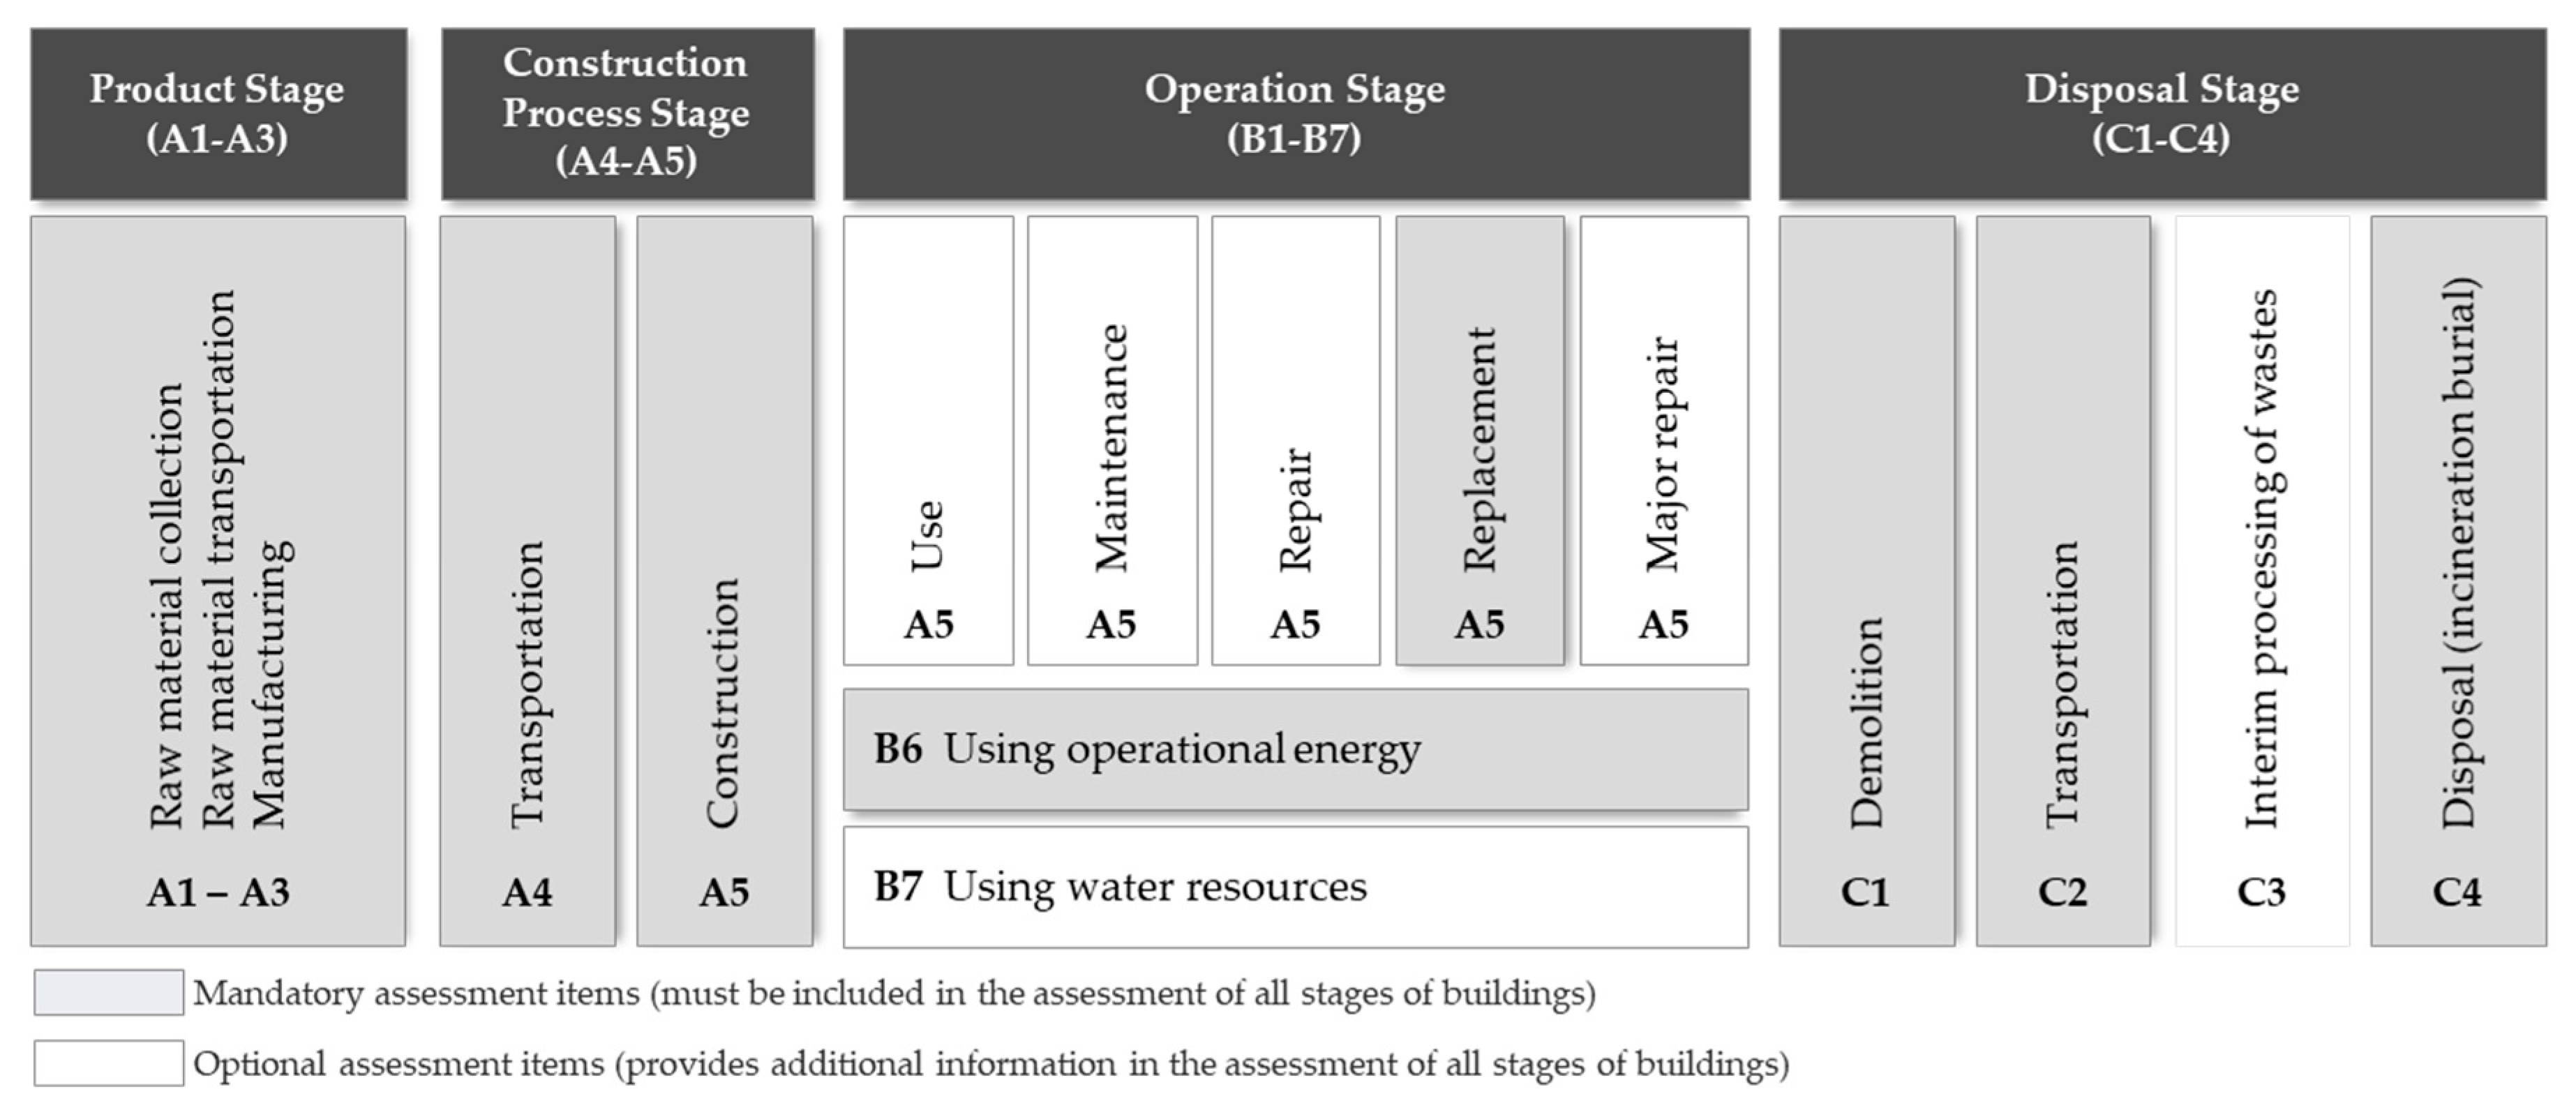
| Production stage | A1–A3 | Production | 4.77 × 10² | 29.90% | 4.76 × 10² | 20.57% |
| Construction stage | A4 | Transportation | 1.92 × 101 | 1.20% | 1.88 × 101 | 0.81% |
| A5 | Construction | 5.89 × 100 | 0.37% | 6.04 × 100 | 0.26% | |
| Operation stage | B4 | Replacement | 1.09 × 10³ | 68.35% | 1.81 × 10³ | 78.25% |
| Disposal stage | C1 | Demolition | 2.41 × 100 | 0.15% | 2.36 × 100 | 0.10% |
| C2 | Transportation | 5.95 × 10⁻³ | 0.00% | 5.55 × 10⁻³ | 0.00% | |
| C4 | Disposal | 4.35 × 10⁻¹ | 0.03% | 2.46 × 10⁻¹ | 0.01% | |
| Total | 1.59 × 10³ | 100% | 2.31 × 10³ | 100% | ||
| Apartment Houses | |||||||||||
|---|---|---|---|---|---|---|---|---|---|---|---|
| Category | Reference Building | Lowest (1) | Average (2) | Highest (3) | |||||||
| Major Materials | Specification | CE | CE | CR | A1–A3ZCBI | CE | CR | A1–A3ZCBI | CE | CR | A1–A3ZCBI |
| (A) | (B) | (C) = (A) − (B) | (C)÷(A) | (D) | (E) = (A) − (D) | (E)÷(A) | (F) | (G) = (A) − (F) | (G)÷(A) | ||
| Ready-mixed concrete | 18 MPa | 2.45 × 101 | 6.47 × 100 | 1.80 × 101 | 3.78% | 1.14 × 101 | 1.31 × 101 | 2.74% | 1.63 × 101 | 8.21 × 100 | 1.72% |
| 24 MPa | 3.68 × 10² | 8.99 × 101 | 2.79 × 10² | 58.42% | 2.13 × 10² | 1.56 × 10² | 32.66% | 3.44 × 10² | 2.40 × 101 | 5.04% | |
| Rebar | Steel bars for RC | 2.79 × 10² | 2.89 × 101 | −1.02 × 100 | −0.21% | 2.89 × 101 | −1.02 × 100 | −0.21% | 2.89 × 101 | −1.02 × 100 | −0.21% |
| Masonry | Concrete brick | 8.88 × 100 | 8.88 × 100 | N/A | N/A | 8.88 × 100 | N/A | N/A | 8.88 × 100 | N/A | N/A |
| ALC block | 5.30 × 100 | 2.23 × 100 | 3.06 × 100 | 0.64% | 2.44 × 100 | 2.85 × 100 | 0.60% | 2.72 × 100 | 2.58 × 100 | 0.54% | |
| Insulation | EPS | 1.18 × 100 | 1.45 × 10⁻³ | 1.18 × 100 | 0.25% | 2.03 × 10⁻³ | 1.18 × 100 | 0.25% | 2.80 × 10⁻³ | 1.18 × 100 | 0.25% |
| XPS | 5.18 × 100 | 5.18 × 100 | N/A | N/A | 5.18 × 100 | N/A | N/A | 5.18 × 100 | N/A | N/A | |
| Gypsum board | Square edge-type board | 1.07 × 100 | 5.44 × 10⁻⁴ | N/A | N/A | 3.53 × 10⁻³ | N/A | N/A | 5.45 × 10⁻³ | N/A | N/A |
| Cement | Cement | 2.08 × 101 | 1.73 × 101 | 1.07 × 100 | 0.22% | 1.81 × 101 | 1.07 × 100 | 0.22% | 1.89 × 101 | 1.06 × 100 | 0.22% |
| Mortar | 1.35 × 101 | 6.49 × 100 | 3.47 × 100 | 0.73% | 7.86 × 100 | 2.67 × 100 | 0.56% | 9.23 × 100 | 1.86 × 100 | 0.39% | |
| Aggregate | Sand | 1.05 × 10⁻¹ | 1.05 × 10⁻¹ | 6.98 × 100 | 1.46% | 1.05 × 10⁻¹ | 5.61 × 100 | 1.18% | 1.05 × 10⁻¹ | 4.24 × 100 | 0.89% |
| Total | 4.77 × 10² | 1.65 × 10² | 3.11 × 10² | 65.30% | 2.96 × 10² | 1.81 × 10² | 38.00% | 4.35 × 10² | 4.21 × 101 | 8.84% | |
| Business Facilities | |||||||||||
| Ready-mixed concrete | 18 MPa | 1.76 × 101 | 4.66 × 100 | 1.30 × 101 | 2.73% | 8.24 × 100 | 5.91 × 100 | 1.24% | 1.17 × 101 | 5.91 × 100 | 1.24% |
| 24 MPa | 7.32 × 101 | 1.79 × 101 | 5.53 × 101 | 11.63% | 4.22 × 101 | 4.77 × 100 | 1.00% | 6.84 × 101 | 4.77 × 100 | 1.00% | |
| 27 MPa | 2.95 × 10² | 1.13 × 10² | 1.81 × 10² | 38.13% | 1.93 × 10² | 1.85 × 101 | 3.89% | 2.76 × 10² | 1.85 × 101 | 3.89% | |
| Rebar | Steel bars for RC | 4.67 × 101 | 4.85 × 101 | −1.71 × 100 | −0.36% | 4.85 × 101 | −1.71 × 100 | −0.36% | 4.85 × 101 | −1.71 × 100 | −0.36% |
| Masonry | Concrete brick | 5.85 × 100 | 5.85 × 100 | N/A | N/A | 5.85 × 100 | N/A | N/A | 5.85 × 100 | N/A | N/A |
| ALC block | 5.17 × 100 | 2.18 × 100 | 2.99 × 100 | 0.63% | 2.38 × 100 | 2.52 × 100 | 0.53% | 2.65 × 100 | 2.52 × 100 | 0.53% | |
| Insulation | Glass wool 48K | 1.01 × 100 | 2.50 × 10⁻² | 9.90 × 10⁻¹ | 0.21% | 2.90 × 10⁻² | 9.82 × 10⁻¹ | 0.21% | 3.31 × 10⁻² | 9.82 × 10⁻¹ | 0.21% |
| EPS | 7.78 × 100 | 9.53 × 10⁻³ | 7.77 × 100 | 1.63% | 1.33 × 10⁻² | 7.76 × 100 | 1.63% | 1.84 × 10⁻² | 7.76 × 100 | 1.63% | |
| Cement | Cement | 2.38 × 101 | 1.98 × 101 | 3.97 × 100 | 0.83% | 2.07 × 101 | 2.13 × 100 | 0.45% | 2.16 × 101 | 2.13 × 100 | 0.45% |
| Aggregate | Sand | 9.92 × 10⁻² | 9.92 × 10⁻² | N/A | N/A | 9.92 × 10⁻² | N/A | N/A | 9.92 × 10⁻² | N/A | N/A |
| Gravel | 1.38 × 10⁻² | 1.38 × 10⁻² | N/A | N/A | 1.38 × 10⁻² | N/A | N/A | 1.38 × 10⁻² | N/A | N/A | |
| Stone | Granite | 1.88 × 10⁻² | 1.88 × 10⁻² | N/A | N/A | 1.88 × 10⁻² | N/A | N/A | 1.88 × 10⁻² | N/A | N/A |
| Total | 4.76 × 10² | 2.12 × 10² | 2.64 × 10² | 55.43% | 3.21 × 10² | 1.55 × 10² | 32.56% | 4.35 × 10² | 4.09 × 101 | 8.59% | |
| Use | Major Materials | Cumulative A1–A3CE Contribution | Lowest | Average | Highest | |||
|---|---|---|---|---|---|---|---|---|
| CR | A1–A3ZCBI | CR | A1–A3ZCBI | CR | A1–A3ZCBI | |||
| Apartment houses | Ready-Mixed Concrete | 74.98% | 2.97 × 10² | 62.27% | 1.68 × 10² | 35.35% | 3.25 × 101 | 6.83% |
| Rebar | 10.48% | −1.00 × 100 | −0.21% | −1.00 × 100 | −0.21% | −1.00 × 100 | −0.21% | |
| Cement | 9.00% | 1.08 × 101 | 2.25% | 8.62 × 100 | 1.81% | 6.50 × 100 | 1.36% | |
| Masonry | 4.59% | 3.06 × 100 | 0.64% | 2.85 × 100 | 0.60% | 2.58 × 100 | 0.54% | |
| Total | 99.08% | 3.10 × 10² | 64.95% | 1.78 × 10² | 37.55% | 4.06 × 101 | 8.52% | |
| Business facilities | Ready-Mixed Concrete | 71.70% | 3.17 × 10² | 67.10% | 1.43 × 10² | 30.31% | 3.00 × 101 | 6.21% |
| Rebar | 17.36% | −1.70 × 100 | −0.36% | −1.70 × 100 | −0.36% | −1.70 × 100 | −0.36% | |
| Cement | 7.53% | 4.00 × 100 | 0.84% | 3.05 × 100 | 0.65% | 2.13 × 100 | 0.45% | |
| Masonry | 3.12% | 2.98 × 100 | 0.63% | 2.78 × 100 | 0.59% | 2.51 × 100 | 3.84% | |
| Total | 99.71% | 3.22 × 10² | 68.21% | 1.47 × 10² | 31.19% | 3.29 × 101 | 10.14% | |
Disclaimer/Publisher’s Note: The statements, opinions and data contained in all publications are solely those of the individual author(s) and contributor(s) and not of MDPI and/or the editor(s). MDPI and/or the editor(s) disclaim responsibility for any injury to people or property resulting from any ideas, methods, instructions or products referred to in the content. |
© 2025 by the authors. Licensee MDPI, Basel, Switzerland. This article is an open access article distributed under the terms and conditions of the Creative Commons Attribution (CC BY) license (https://creativecommons.org/licenses/by/4.0/).
Share and Cite
Wang, S.; Tae, S. Assessment of Carbon Neutrality Performance of Buildings Using EPD-Certified Korean Construction Materials. Appl. Sci. 2025, 15, 6533. https://doi.org/10.3390/app15126533
Wang S, Tae S. Assessment of Carbon Neutrality Performance of Buildings Using EPD-Certified Korean Construction Materials. Applied Sciences. 2025; 15(12):6533. https://doi.org/10.3390/app15126533
Chicago/Turabian StyleWang, Seongjo, and Sungho Tae. 2025. "Assessment of Carbon Neutrality Performance of Buildings Using EPD-Certified Korean Construction Materials" Applied Sciences 15, no. 12: 6533. https://doi.org/10.3390/app15126533
APA StyleWang, S., & Tae, S. (2025). Assessment of Carbon Neutrality Performance of Buildings Using EPD-Certified Korean Construction Materials. Applied Sciences, 15(12), 6533. https://doi.org/10.3390/app15126533