1. Introduction
Boxing has a rich Olympic history and a large professional following worldwide. Athletes must develop physical strength and technical and tactical skills to reach a competitive level. In this context, the main factors determining a boxer’s performance include aerobic and anaerobic capacity, strength, endurance, and speed [
1]. Aerobic capacity, enabling sustained performance during prolonged low- to moderate-intensity exertion, and anaerobic capacity, facilitating short-duration, high-intensity efforts, collectively underpin the physiological demands of boxing; therefore, an optimal balance between these two capacities is essential to achieve peak performance in the sport [
2]. In boxing, athletes expend short bursts of high-intensity physical effort. During each round of a match, fighters aim to gain an advantage over their opponent through rapid and explosive movements. Such actions require the activation of the anaerobic energy system [
3]. Studies have highlighted the significant impact of anaerobic endurance on boxing performance. In addition, boxers must have sufficient aerobic capacity to replenish their rapidly depleting energy reserves during the match. However, short rest periods (usually 1 min or less) do not allow for complete recovery. Therefore, increasing anaerobic endurance becomes critical in accelerating recovery between high-intensity movements, especially with brief rest intervals [
4].
In a study conducted by Loturco et al. (2016) [
5], VO
2 uptake in experienced male boxers during laboratory-based sparring and pad work tests was found to range between 41 and 43 mL·kg
−1·min
−1, which corresponded to approximately 70% of the boxers’ VO
2 peak. These findings highlight the importance of aerobic and anaerobic capacity to meet the demands of boxing. Additionally, a boxer’s ability to quickly transition to high-intensity movements during a competition is directly linked to their anaerobic endurance levels [
6]. Boxing is characterized by speed, endurance, and powerful punches. Punching strength is one of the key factors that can directly impact the outcome of a fight. Davis et al. (2018) [
7] emphasized that the ability to generate high levels of muscular strength is essential for success in boxing. In this context, strength training helps boxers develop explosive power and increases their overall endurance [
8]. Furthermore, high muscular strength allows fighters to improve their endurance levels, enabling them to perform effectively throughout each match phase [
9]. Although research on the factors determining boxing performance has been relatively limited in the literature [
3], recent studies in this field have significantly increased. In particular, biomechanical analyses of the technical aspects of boxing, such as punch kinematics and load performance, have contributed to a better understanding of boxing performance and the optimization of training programs [
10]. Recent research indicates that the most critical factors determining punching performance are the speed and acceleration of the punch [
11].
From a biomechanical perspective, the efficient execution of a boxing movement depends on the synchronized action of both the upper and lower body. This requires the smooth transfer of force between body segments. Specifically, a kinetic chain starts from the feet and continues through the hips, torso, and arms. Boxers must effectively utilize this kinetic chain to increase punch speed, which properly integrates lower-body strength, especially leg power and hip rotation, into the movement [
12]. This way, boxers can generate explosive power, enhancing the speed and acceleration of their punches. However, not only is biomechanical force transfer essential, but correct motor control processes also play a significant role. Neural motor control facilitates coordination between muscles and joints, enabling boxers to execute precise kinematic movement patterns and increasing the effectiveness of punches [
13]. Motor control theories help us understand how movements in boxing are learned and optimized. In particular, transformation and input–output models explain how boxers give rapid and accurate motor responses as they develop their technical performance. These models contribute to automating movements at a conscious level, allowing boxers to adapt more efficiently during training [
14]. In boxing, the effective execution of technical movements relies on fundamental physical parameters such as speed, force transfer, and mass movement [
15]. The success of the punching movement requires the complex coordination between different regions of the body. This coordination facilitates the transfer of force between muscles and joints, ensuring the smooth operation of the kinetic chain [
16]. This force transfer must be optimized for an effective punch, allowing the boxer to accelerate their movement and enhance explosive power.
Dynamic sports like boxing involve fundamental physical principles such as speed, force, and mass displacement to correctly apply biomechanical and technical movements. The punching action requires the synchronized functioning of various joint groups, including the shoulder, elbow, hip, legs, and arms. This multi-joint coordination ensures effective force transmission along the kinetic chain, making the boxer’s movements efficient [
17]. The force transfer between body segments directly influences the punch’s speed and explosive power [
18]. The increase in biomechanical force must be appropriately transferred to the body in alignment with the boxer’s movement pattern [
19]. In particular, “optimal power load” defines the load intensity, allowing athletes to express their maximum strength. This load is the ideal intensity for enhancing speed, strength, and explosive power levels in boxing training [
20]. For professional boxers, proper load use increases training efficiency and improves technical movement quality, leading to higher performance levels [
21].
On the other hand, in sports that require speed, strength, and explosiveness, such as boxing, the effective execution of technical movements is based on the biomechanical and physiological demands specific to the sport. Training programs aimed at improving boxing performance should focus on strength development and increasing the speed and explosiveness of movements. In this context, bench press (BP) and plyometric training are critical in helping boxers develop strength and speed. Recent studies have examined the impact of bench press on boxing performance and have found a strong relationship between BP and punch velocity (PV_max). For instance, Stanley et al. (2018) [
22] highlighted that BP training significantly improved boxers’ maximum punch speed. Similarly, Connor and Egan (2019) [
15] reported that boxers with stronger BP performance achieved higher punch speeds, indicating a significant positive correlation between these two factors. BP training is an effective method for enhancing both speed and strength in boxers.
Plyometric training effectively enhances performance in sports where explosive strength is crucial, such as boxing. Plyometric exercises are based on the principle of rapidly stretching muscles followed by an immediate contraction to generate force. This type of training helps boxers increase their explosive power, allowing them to throw faster and more powerful punches [
23]. For instance, exercises that involve jumping, acceleration, sudden stops, and changes in speed help accelerate the force transfer between body segments, thereby enhancing the speed and impact of punches. Additionally, plyometric exercises improve lower-body strength and hip rotation, facilitating more efficient force transfer to the upper body and directly contributing to increased punch speed [
24]. In boxing, the training load intensity must align with specific parameters to enhance performance through speed. A study on the impact of load intensity in bench press (BP) on punch velocity found that boxers should train with a load of 80% of their one-repetition maximum (1RM) to effectively transfer punch speed [
25]. Similarly, plyometric training should be applied with an optimal load intensity to increase maximal strength and explosive velocity. Training with these intensities optimizes the force transfer between body segments and improves training efficiency. Improving boxing performance is not limited to developing technical skills alone; physical parameters such as strength, speed, and explosiveness also play a crucial role. Bench press and plyometric training are practical tools for enhancing these parameters. While bench press optimizes the relationship between strength and speed, plyometric exercises increase boxers’ explosive power, improving the speed and impact of their technical movements [
26]. Therefore, combining both types of training may serve as a significant strategy to enhance boxing performance.
This study examines the effects of two different plyometric training programs on straight punch impact force, cardiovascular fitness, and muscle strength in national-level boxers over an 8-week preparatory period.
The study hypotheses are as follows:
H1. Plyometric training significantly improves straight punch impact force, cardiovascular fitness, and upper-body strength in elite boxers.
H2. Different plyometric training protocols (PSJ vs. PRJ) result in differential improvements in the aforementioned performance parameters.
While the physiological and biomechanical demands of boxing have been explored in prior studies, existing research has often treated plyometric interventions as a monolithic training category or examined their effects in other sports contexts. Critically, no study to date has directly compared the effects of two distinct lower-body plyometric protocols—Plyometric Stair Jump (PSJ) and Plyometric Reaction Box Jump (PRJ)—on boxing-specific performance variables, such as punch impact force and upper-body strength. This constitutes a meaningful research gap, especially considering the sport-specific neuromuscular coordination required for transferring lower-limb force into effective upper-body striking.
Moreover, many prior investigations have either generalized plyometric effects across diverse athletic populations or failed to isolate boxing-specific training adaptations. As such, the problem lies not only in the scarcity of comparative studies within boxing, but also in the lack of a targeted investigation into how different modalities of plyometric training affect the force transmission along the kinetic chain and impact punching efficacy. This limits the translation of existing findings into boxing-specific training strategies. The present study addresses these limitations by employing a randomized design with a homogenous sample of national-level male boxers and implementing two differentiated training interventions over a controlled 8-week preparatory period. By aligning biomechanical, physiological, and performance-based outcome measures—including straight punch impact force, cardiovascular fitness (Yo-Yo IR2, VO2max), and upper-body strength (bench press 1RM and bar velocity)—this study creates a comprehensive evaluation framework for plyometric efficacy in boxing.
Furthermore, this research applies load-specific and velocity-sensitive assessments, addressing another common shortcoming in earlier work that relied heavily on general strength or endurance measures without considering load–velocity profiles relevant to explosive performance. In sum, this study is distinguished by the following: its exclusive focus on boxing, rather than extrapolating from general athletic samples; its direct comparison of two plyometric modalities, addressing an explicit gap in the literature; its multifactorial approach that integrates physiological, biomechanical, and performance variables; and its aim to produce practical, evidence-based guidelines for strength and conditioning coaches aiming to enhance punch performance through modality-specific plyometric training.
By situating plyometric interventions within the specific movement and energy demands of boxing, this study makes a novel contribution to both the academic literature and applied training practices in combat sports.
2. Materials and Methods
2.1. Experimental Approach to the Problem
A quasi-experimental randomized controlled trial study design was employed to examine the effects of two different plyometric strength training interventions on cardiovascular endurance, muscular strength, punch speed, and impact force over an eight-week preparatory period. During the 2022–2023 competitive season, national-level professional boxers were evaluated at two time points: pre-intervention (1 June 2022; day 1) and post-intervention (1 August 2022; final day of the preparatory phase). To ensure adequate recovery, testing was conducted on two consecutive days at each time point. One day prior to the initial assessments, participants were informed of the potential risks of the study and their voluntary participation rights, and written informed consent was obtained. On day one, body composition and resting heart rate were measured at 10:00 AM, followed by the Yo-Yo Intermittent Recovery Test Level 2 (Yo-Yo IR2) to assess cardiovascular endurance, conducted indoors at noon. On day two, punch velocity (PVmax) at various submaximal intensities was assessed at 10:00 AM, and one-repetition maximum (1RM) bench press strength was measured at noon in a fitness facility. All participants were familiarized with the exercises and testing protocols prior to the experimental period. All assessments were carried out in the same training facilities used regularly by the participants, under controlled indoor conditions (temperature: 23 °C; relative humidity: 67%). The warm-up protocol on the first testing day followed the recommendations of the 1RM test protocol and was conducted according to Lenetsky et al. (2013) [
21], and submaximal bench press velocity was evaluated following the procedure described by Sayers et al. (2018) [
27].
Plyometric Training Description
To clarify biomechanical distinctions between the two protocols, the Plyometric Reaction Box Jump (PRJ) consisted of countermovement jumps onto a 40–60 cm plyometric box in response to an auditory cue, focusing on reactive strength and fast SSC engagement. In contrast, the Plyometric Stair Jump (PSJ) required a single-effort jump over 5–7 stairs, emphasizing horizontal displacement, power output, and lower-limb propulsion mechanics. These variations are crucial in targeting different neuromuscular characteristics [
28,
29].
2.2. Participants
Using the G*Power program (Version 3.0, University of Dusseldorf, Düsseldorf, Germany;), an a priori power analysis was conducted to determine the required sample size, with α set at 0.05 and power (1-β) set at 0.80. The analysis revealed that a total sample size of 13 participants would be sufficient to detect significant differences, with an actual achieved power of 0.82 in the current study. Twenty professional male boxers voluntarily participated (mean age 22.64 ± 3.12 years, training experience 5.11 ± 0.88 years, body weight 70.20 ± 10.13 kg, body height 184.28 ± 5.38 cm), divided into two groups:
- -
Group 1—Plyometric Stair Jump (PSJ): 10 subjects; age mean ± SD 23 ± 3.56 years (range 18–27), training experience mean ± SD 6.11 ± 0.72 years (range 4.7–7).
- -
Group 2—Plyometric Reaction Box Jump (PRJ): 10 subjects; age mean ± SD 24.4 ± 2.63 years (range 19–28), training experience mean ± SD 6.13 ± 0.60 years (range 5–6.8).
While the sample size met the power analysis requirements, it remained modest, and the study cohort consisted exclusively of elite male boxers. Therefore, the generalizability of these findings to other populations—such as female athletes, youth boxers, or amateur practitioners—should be approached with caution. Future research should consider larger and more diverse samples to enhance the external validity of the results.
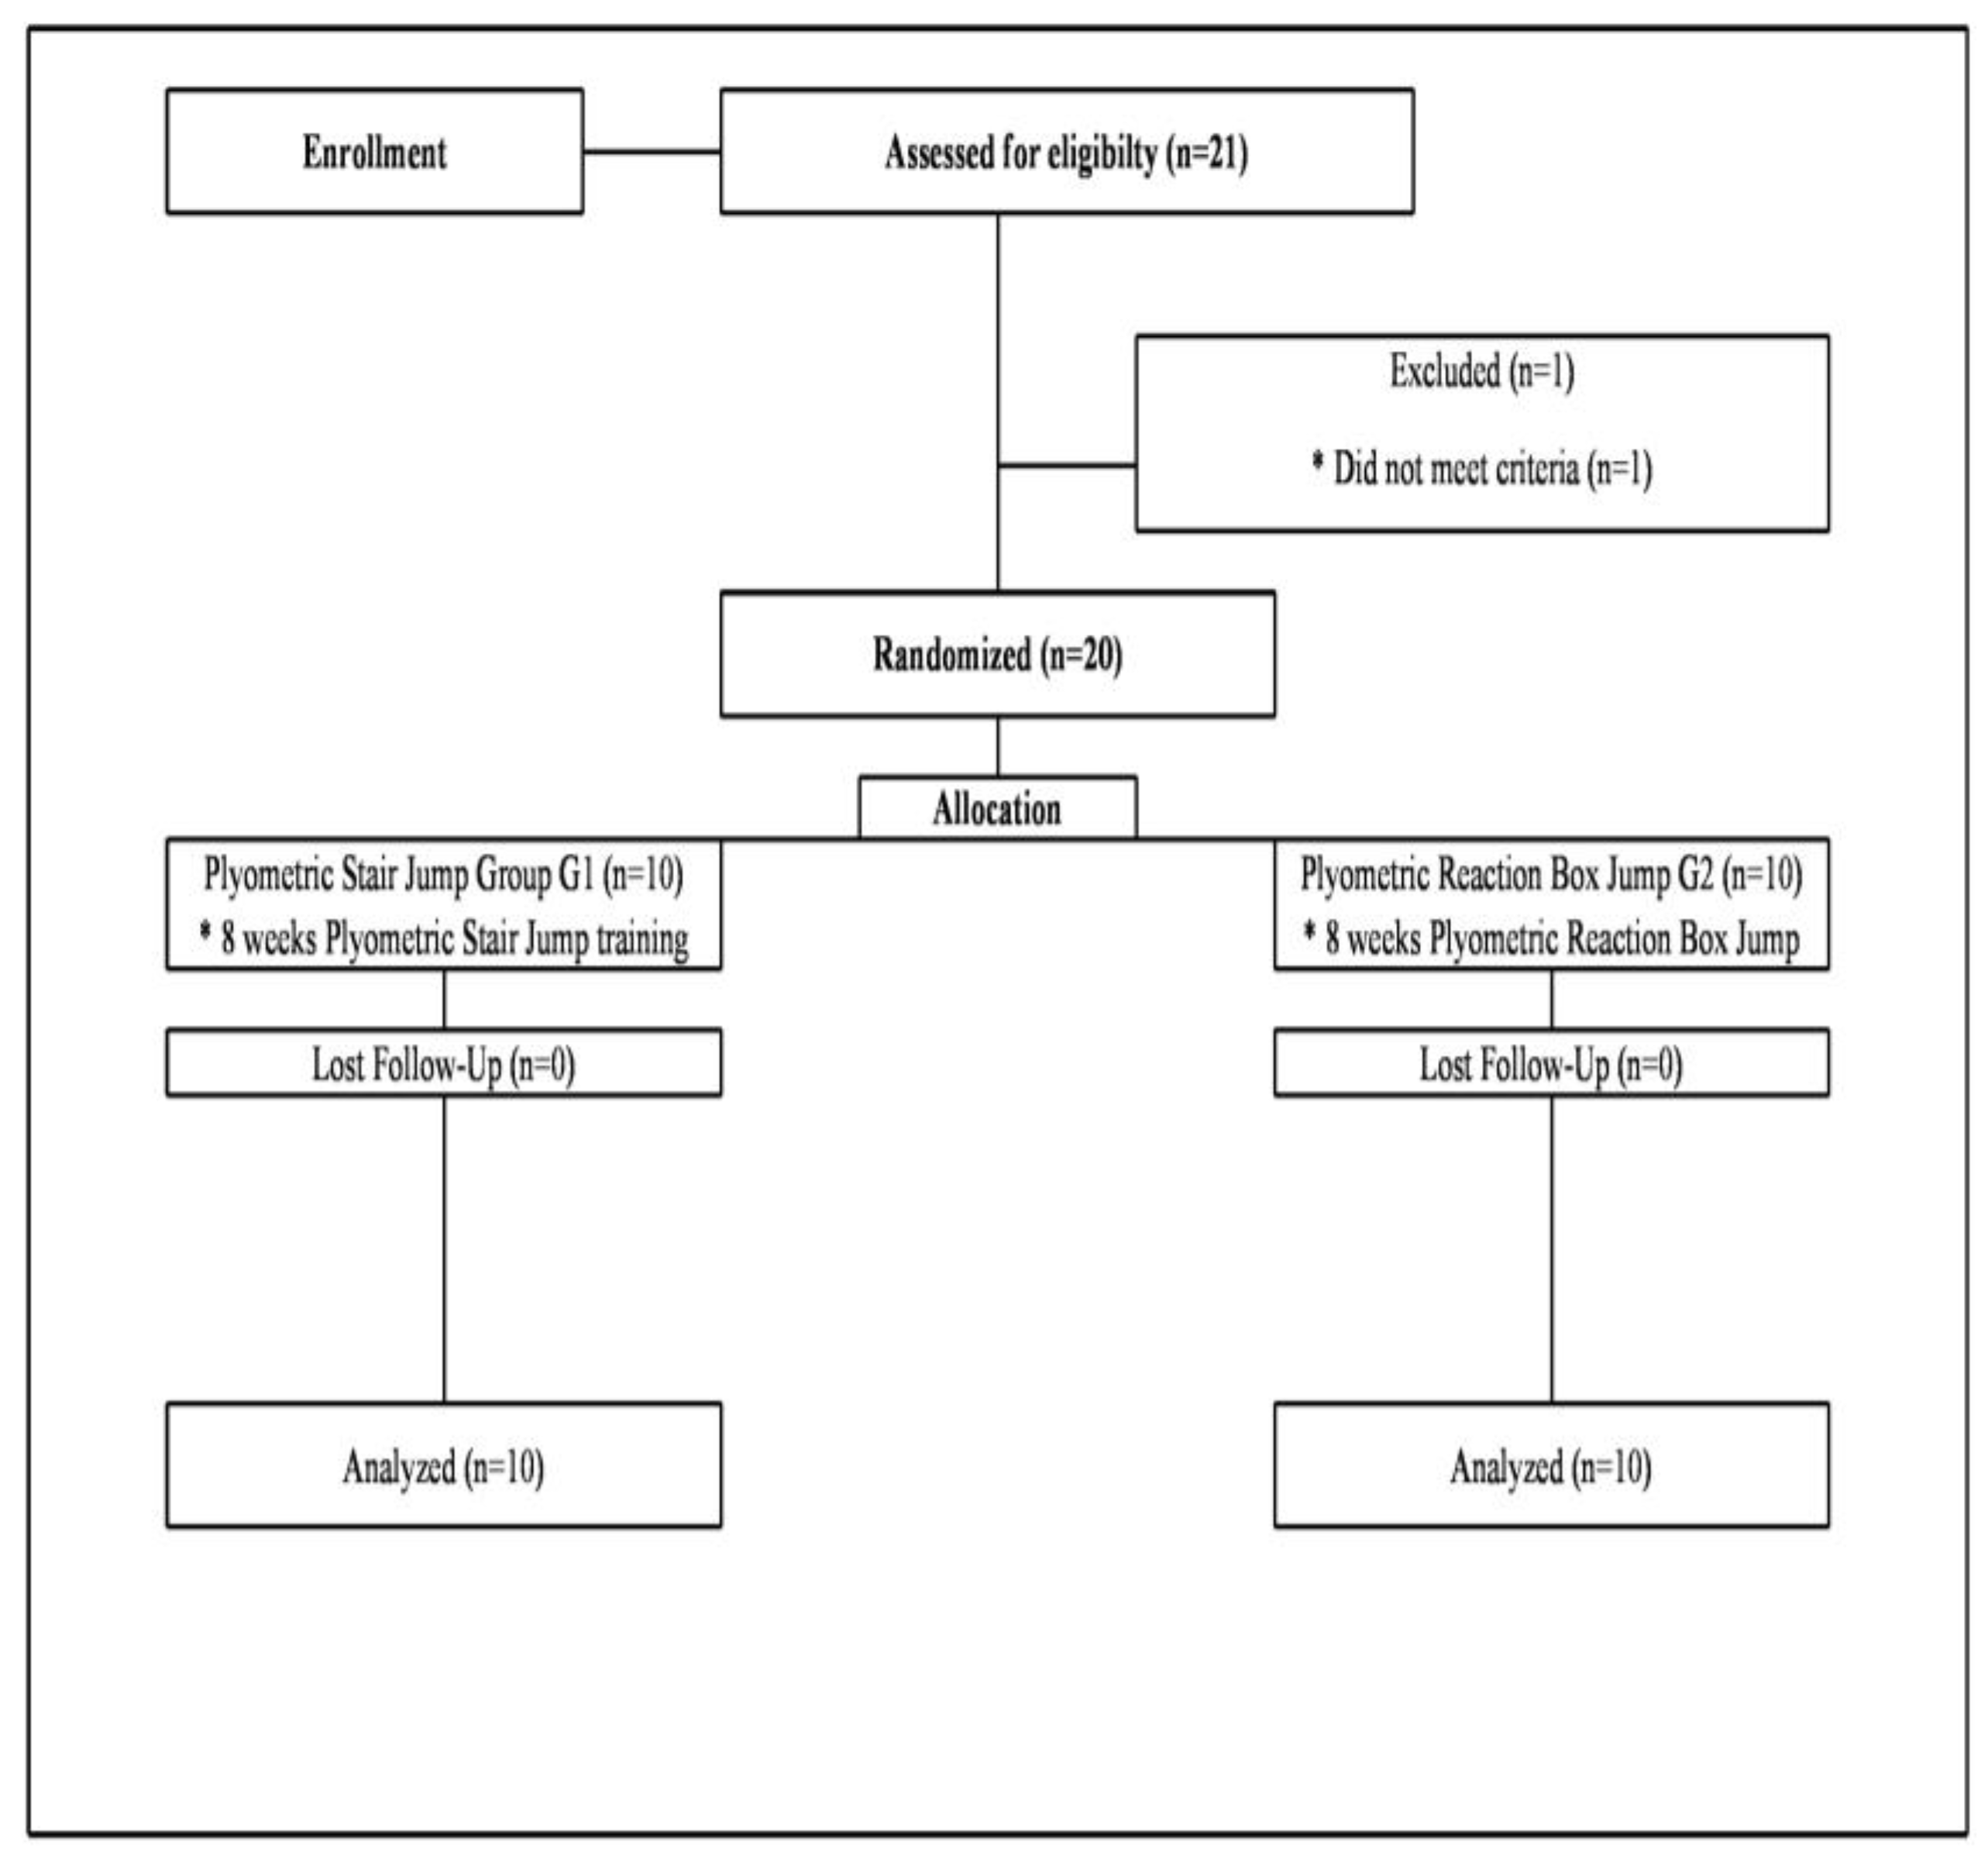
Initially, a total of 21 national-level professional boxers were recruited for the study. The participants held competitive status, were members of the national team, and had achieved gold and bronze medals in national championships. Prior to the study, all athletes received comprehensive written and verbal explanations regarding the study procedures, and written informed consent was obtained. Furthermore, all participants underwent medical examinations at a fully equipped hospital, confirming the absence of medication use, substance influence, or any cardiovascular or metabolic conditions that could impede full participation. Inclusion criteria required that participants (a) had competed as professional boxers in national matches for a minimum of five years, and (b) had engaged in regular boxing training for at least five years, supplemented by at least two years of strength and power training. During the screening process, one participant was excluded due to various reasons such as injury or incompatibility. Consequently, the final sample size included in the analyses was 20. These 20 participants were randomly assigned to two groups using a computer-generated randomization method: the Plyometric Stair Jump group (
n = 10) and the Plyometric Reaction Box Jump group (
n = 10) (see
Figure 1). The randomization process was employed to prevent bias and ensure comparable groups, thereby enhancing the internal validity and reliability of the study results [
30].
The demographic and training characteristics of the groups were as follows: The Stair Jump group had a mean age of 23.00 ± 3.56 years (range 18–27) and a training experience of 6.11 ± 0.72 years (range 4.7–7). The Reaction Box Jump group had a mean age of 24.40 ± 2.63 years (range 19–28) and a training experience of 6.13 ± 0.60 years (range 5–6.8). The normal distribution of age and training experience was confirmed through appropriate statistical tests in both groups. This rigorous participant selection, thorough health screening, and systematic randomization process supported the methodological rigor and reproducibility of this study.
2.3. Research Design
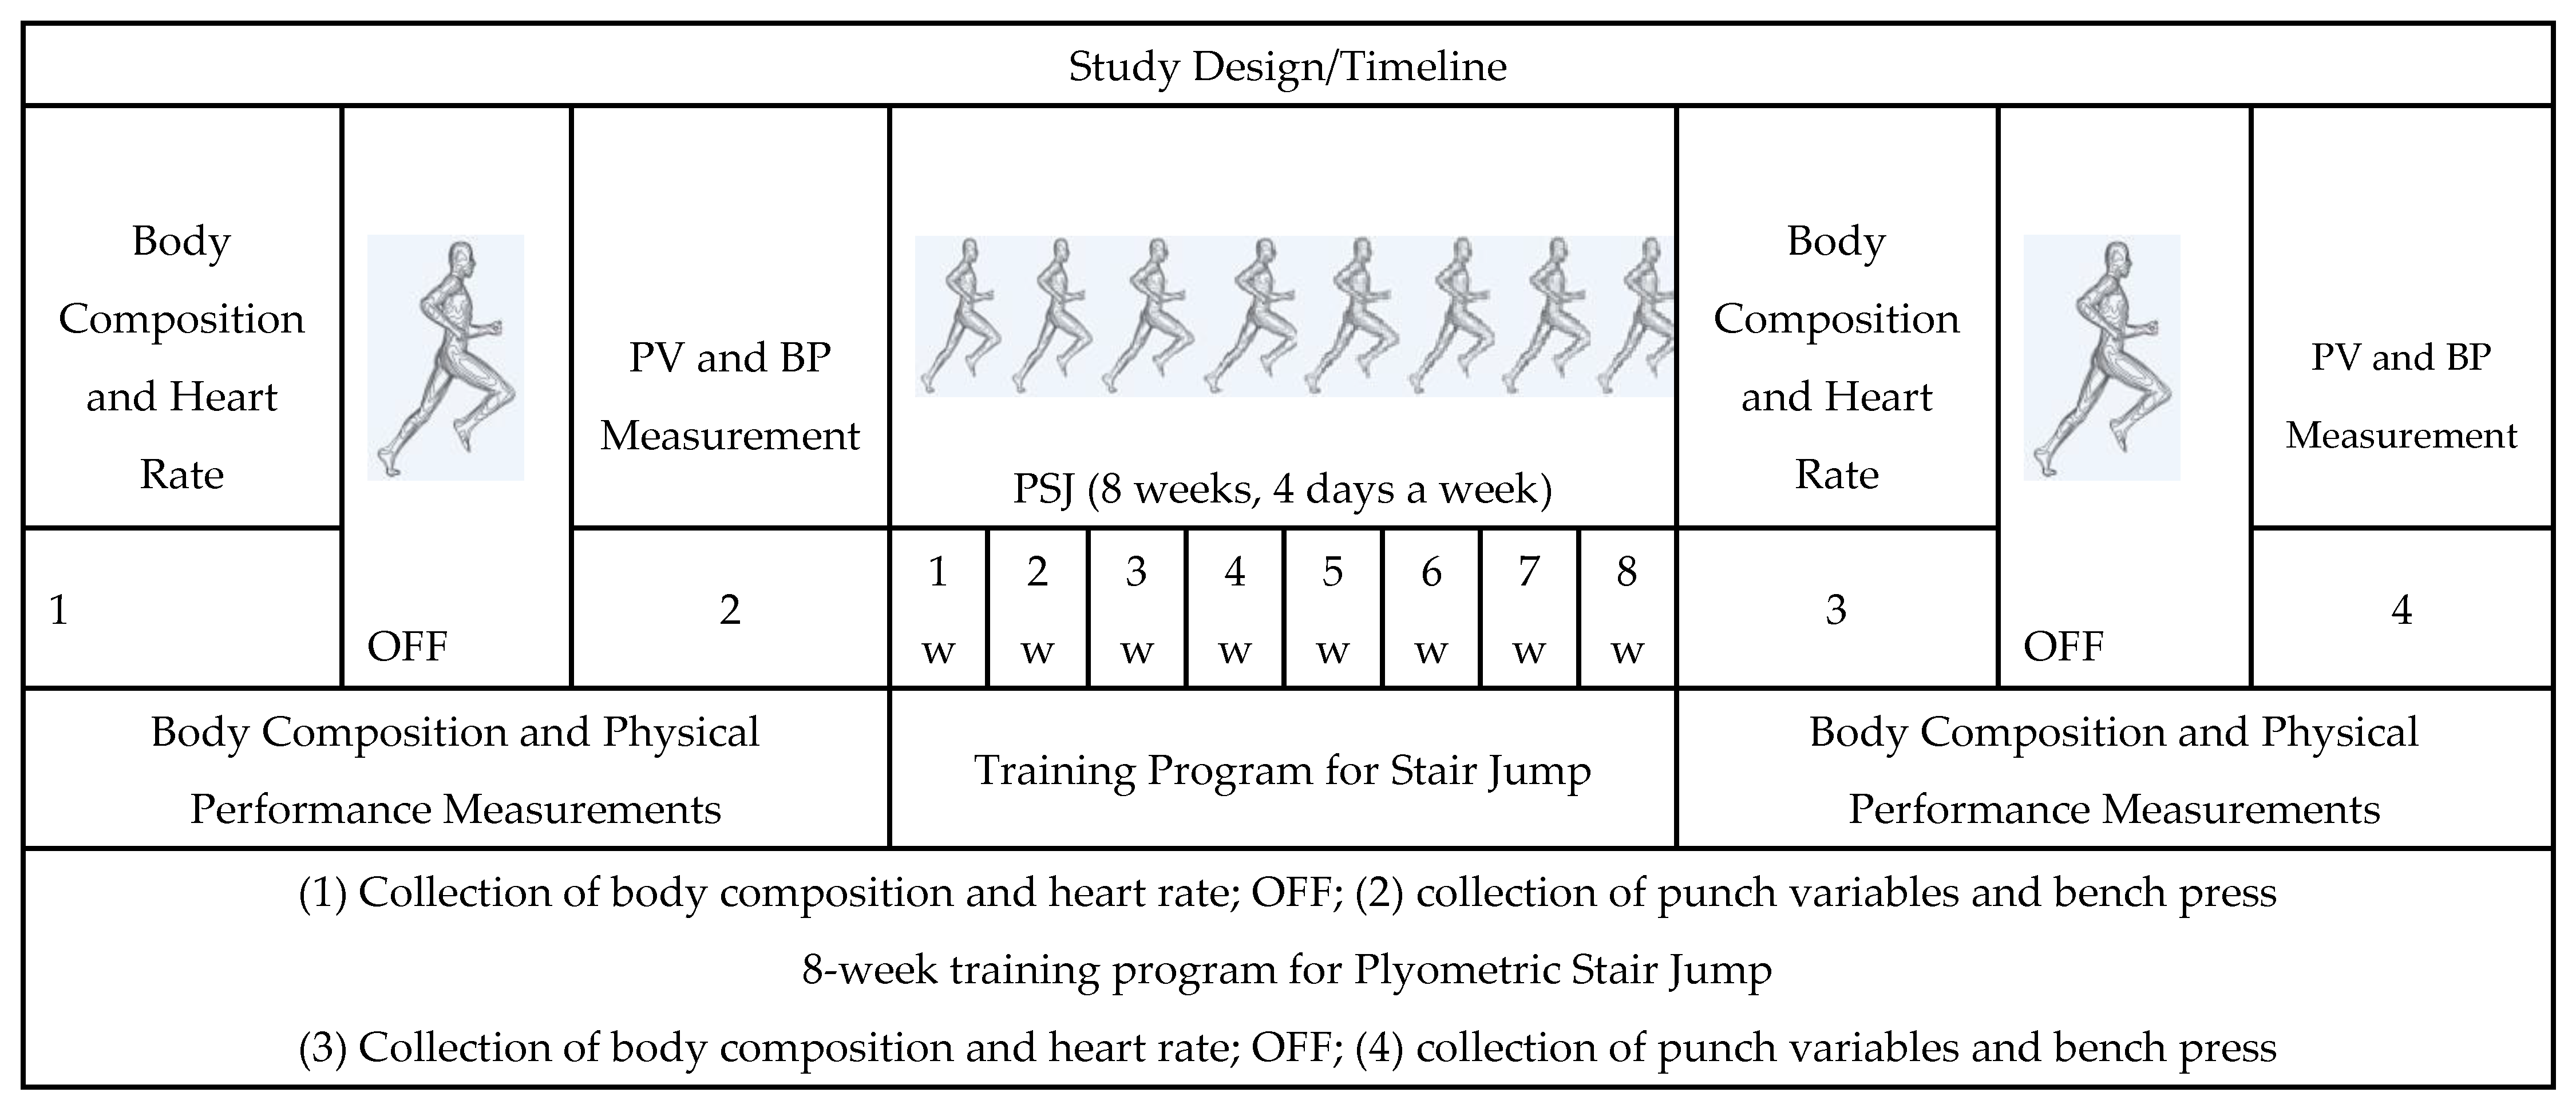
This study employed a pre-test–post-test group design, as shown in
Table 1 and
Figure 2. The plyometric intervention lasted 8 weeks (32 sessions) and was conducted during the preparatory phase of the athletes’ 32-week competitive season. The participants were randomly assigned to two groups. Group 1, the Plyometric Stair Jump group, consisted of ten male boxers, while Group 2, the Plyometric Reaction Box Jump group, also included ten male boxers. Before commencing training, the Plyometric Stair Jump and Plyometric Reaction Box Jump groups underwent a test involving rapidly kicking as many times as possible within 10 s. Athletes trained for 32 weeks during the pre-season and competition period of the 2022–2023 season (see
Table 2 and
Table 3). In the 33rd week, both groups were retested to measure their ability to execute as many rapid punches as possible within 10 s. The reliability score for this test was determined to be 0.87, and content validity was confirmed through face validity [
31]. The procedures adhered to the latest version of the Declaration of Helsinki and were approved by the ethical committee of Atatürk University Faculty of Sports Sciences, Turkey (RefNo Numbered E-70400699-050.02.04-2200097297, decision 37, dated 2022/3).
Training Intensity (%HRmax): Indicates the training load based on the percentage of maximal heart rate (HRmax). Maximal heart rate is commonly estimated using the following:
Training intensity during exercise is expressed as the percentage of this maximal value:
For example, for a 60–80% intensity range: Target HR Zone = [HRmax × 0.60, HRmax × 0.80]
Recovery HR Zone (bpm): Represents the expected heart rate range during recovery intervals between sets or repetitions. This zone is generally lower than the target zone and typically corresponds to approximately 40–50% of HRmax.
Session Type: Characterizes the nature and metabolic demand of the training session based on intensity and exercise modality. For example:
This classification is based on heart rate intensity and reflects the training’s physiological focus.
2.3.1. Training Intensity and Temporal Characteristics of Plyometric Sessions
Table 2 and
Table 3 present the structured weekly progression of two distinct plyometric training modalities: Stair Jumps and Reaction Box Jumps. Each training session is systematically designed with respect to repetition count, number of sets, estimated training intensity expressed as a percentage of maximum heart rate (%HRmax), and the corresponding heart rate zones for both the training and recovery phases. The inclusion of training type classifications for each session addresses concerns regarding the ambiguity in describing training intensity. By categorizing each session as aerobic, moderate, or high intensity, this approach provides a clearer delineation of the physiological demands and objectives associated with each workload. In
Table 2, the Stair Jump protocol demonstrates a gradual increase in load parameters (repetitions, sets, %HRmax) from week 1 through week 8. The program transitions from low-intensity aerobic sessions (60% HRmax) during the initial week to high-intensity plyometric exercises (85% HRmax) in the later weeks. Each progression week corresponds with increases in heart rate training zones and session difficulty. This design facilitates a progressive overload strategy, while maintaining recovery heart rate zones below 110 bpm, thereby supporting adequate cardiovascular recovery. Similarly,
Table 3 illustrates the progression of the Plyometric Reaction Box Jump program. Its structure parallels the Stair Jump protocol but begins at a slightly higher initial intensity (70% HRmax), reflecting the greater neuromuscular demands of the exercise. Heart rate zones are systematically aligned with session intensity to preserve cardiovascular efficiency while promoting neuromuscular adaptation. Session classifications are clearly defined to elucidate training objectives and targeted physiological adaptations. All training sessions are conducted under real-time heart rate monitoring using Polar multi RS800 CX (Finland) chest strap sensors. These sensors enable continuous data recording at 1 s intervals throughout each session and transmit the data via Bluetooth to a central recording device. To ensure that participants remain within their designated target heart rate zones during both the active and recovery phases, the monitoring process is supervised by a coach or an exercise physiologist. Additionally, session-specific average heart rate values are calculated after each session to determine the effective cardiovascular load. These values are then aggregated on a weekly basis to compute the average training intensity at the microcycle level. This approach enables the precise quantification of internal load levels and physiological adaptation trends in response to training. The implementation of this method ensures that training intensity prescriptions based on %HRmax are both accurate and individually regulated, thereby enhancing the internal validity of the training intervention. Furthermore, the weekly heart-rate-based load progression is carefully structured in accordance with the principles of progressive overload and recovery. This design minimizes the risk of overtraining while maximizing neuromuscular and cardiovascular adaptations.
2.3.2. Detailed Description of the Time Structure
Each training session was designed to last between approximately 30 and 45 min. The majority of this total duration consisted of active exercise periods. The active training time varied between 15 and 25 min, depending on the weekly progression in sets and repetitions. Intra-set rest intervals were set between 30 and 60 s to allow sufficient muscular recovery while maintaining high metabolic stress. Inter-set rest periods ranged from 2 to 3 min, providing adequate recovery for the cardiovascular and central nervous systems. This approach helped preserve training intensity, prevented performance decrements, and supported neuromuscular adaptations. Additionally, heart rate (HR) zones for both the training and recovery phases were closely monitored to ensure safety and effectiveness. In the Plyometric Stair Jump program, the recovery HR zone was set between 100 and 110 bpm, whereas in the Reaction Box Jump program, it ranged between 110 and 120 bpm. These recovery zones aligned with target exercise intensities ranging from 60% to 85% of maximum heart rate (%HRmax). This framework prevented excessive cardiovascular overload while enabling an effective training dosage. In summary, the time structure of the training sessions—including total session duration, active exercise time, and intra-set and inter-set rest periods—was systematically and carefully planned to deliver an effective physiological training stimulus. This design contributed significantly to the safe and sustainable application of the plyometric training protocols.
2.4. Procedures
Subjects were evaluated over two days at the onset of the pre-season preparation phase and again over two days after the eight-week preparation period. All assessments were conducted between 10:00 AM and 12:00 PM. On the first day, measurements of body composition and heart rate were taken, along with YIRT2 max VO2 assessments. BP PVmax and BP 1RM maximal measurements were performed on the second day.
2.4.1. Body Composition Assessment
This study utilized the Inbody 270 body composition analyzer (Inbody Co. Ltd., Seoul, Republic of Korea), a specialized medical device employing the quantitative bioelectric impedance method for body composition assessment. This method relies on the conductivity of muscle tissue. Body height was measured using a Soehnle electronic ultrasonic height measuring device (Soehnle, Backnang, Germany), which utilizes ultrasound measurements facilitated by a built-in tilt sensor for precision. Height data from the measuring device is transmitted to the computer program Lookin’Body 120, included in the package with the Inbody 270 device. This mat, measuring 700 × 500 × 5 mm, is equipped with 2304 pressure sensors on its active surface and is a diagnostic tool for evaluating feet under static and dynamic conditions. The sensors on the mat collect measurements for 20 s and transfer them to the computer via the Biomech Studio program (Biomech Studio 2.0 Manual, Letsens Group, Letsens S.R.L., Castel Maggiore, Italy). The mat allows for the measurement of various stabilometric variables, including height (cm), mass (BM [kg]), and body fat percentage (BFP [%]) [
32].
Reliability: Body composition was measured using the Inbody 270 analyzer (Inbody Co. Ltd., Seoul, Republic of Korea), which utilizes a multi-frequency bioelectrical impedance method known for its high reproducibility. Height was measured via a Soehnle ultrasonic device (Soehnle, Germany) with automated data transfer to Lookin’Body 120 software. Reliability for these devices is supported by previous studies indicating high test–retest reliability (ICC > 0.90) in athletic populations.
2.4.2. One-Repetition Maximum Bench Press Test
A structured, progressive loading protocol was employed to evaluate maximum dynamic strength in the bench press exercise, following established procedures for the BP-1RM test [
33]. Participants started with a warm-up set of 5 repetitions at 40–50% of their estimated one-repetition maximum (1RM). After a rest for 3 min, they performed up to five attempts with loads of 70%, 80%, 90%, and 95% of their estimated 1RM to determine their true BP-1RM, defined as the maximum weight lifted with proper technique [
34]. A 3 min rest interval was provided between all attempts to ensure full recovery and optimal performance. The test was conducted on a Smith machine from Hammer-Strength Equipment (Franklin Park, IL, USA). Participants were instructed to control the eccentric phase, pausing briefly with the bar in light contact with the chest to minimize the rebound effect and enhance result consistency [
35].
In the concentric phase, athletes exerted maximal force. A T-Force linear velocity transducer (Dynamic Measurement System; Ergotech Consulting S.L., Murcia, Spain) affixed to the barbell captured the mean propulsive velocity (MPV) and tracked the proportion of the propulsive phase during the concentric movement at a sampling rate of 1000 Hz [
36]. Proprietary software automatically identified the braking phase when acceleration dropped to roughly 29.8 m/s
2. BP-1RM values were adjusted according to each participant’s body mass for individual comparability. In addition, the MPV associated with BP-1RM and the percentage of BP-1RM load at which the movement became entirely propulsive, termed BPT-1RM, were analyzed to provide further insights into the athletes’ power generation during peak lifts [
37,
38].
Reliability: A standardized protocol following NSCA guidelines was used. A Smith machine (Hammer-Strength) and a T-Force linear velocity transducer (1000 Hz) were employed to collect data on BP-1RM and mean propulsive velocity. The BP-1RM test demonstrates excellent test–retest reliability in strength-trained athletes (ICC: 0.92–0.97; CV: 2.4–3.9%) [
29,
39]. A 3 min rest interval between sets ensured recovery and measurement consistency.
2.4.3. Maximum Punching Velocity Evaluation
To assess maximum punching velocity (PV_max), both rear arm (RA) and lead arm (LA) punches were analyzed using the validated Tendopower analyzer (Sorinex Technologies, Burton on Trent, UK). The device recorded punch velocity data at a high sampling frequency of 1000 Hz to capture rapid movement dynamics accurately. A fourth-order, zero-lag Butterworth low-pass filter with a cutoff frequency of 12 Hz was applied to the raw data to reduce high-frequency noise while preserving the essential components of punch velocity signals, consistent with standard biomechanical data processing practices [
40,
41]. The cutoff frequency was chosen based on prior research demonstrating that upper-limb movement frequencies during punching generally do not exceed 15 Hz [
42], thereby minimizing the attenuation of true peak velocities. Before testing, participants completed a standardized warm-up consisting of 20 shadow punches followed by introductory punches on the Hardcore heavy bag (Charlie Equipment, Madrid, Spain) [
43]. To capture punch velocity, an accelerometer was securely affixed to the wrist inside the boxing glove using a Velcro strap, ensuring minimal movement artifacts. Each boxer executed three maximal-effort repetitions of both RA and LA punches. Reliability analyses within this sample revealed intraclass correlation coefficients (ICCs) of 0.898 for LA PV_max and 0.910 for RA PV_max, indicating excellent test–retest reliability [
44]. These results align with previous validation studies confirming the Tendopower system’s accuracy and precision in measuring punch velocity in boxing [
45]. The application of this validated sensor technology and data processing method provided accurate and reproducible PV_max measurements, which are essential for evaluating punch effectiveness, a critical determinant of competitive success in boxing [
46].
Reliability: Both lead arm (LA) and rear arm (RA) PVmax were evaluated using the validated Tendopower analyzer (Sorinex Technologies, UK). Each punch was repeated three times. The accelerometer recorded punch velocity at a 1000 Hz sampling rate. Within this cohort, test–retest reliability was ICC = 0.898 for LA and ICC = 0.910 for RA, indicating strong internal consistency [
21].
2.4.4. Yo-Yo Intermittent Recovery Tests
The Yo-Yo Intermittent Recovery Tests were tailored to match boxers’ specific physical and physiological demands. Specifically, the second iteration of the test (YIRT2) was developed with elite athletes in mind. The testing protocol involved marking out a running area with 20 m lines and positioning a recovery zone 5 m away from the starting line. YIRT2 began with a running speed of 13 km/h, with subsequent speed increments as determined by the protocol. If participants failed to cover a distance of 40 m despite receiving a signal during both tests and repeated this scenario twice consecutively, the test was concluded, and the distance covered was recorded as the test performance (Michailidis., 2020) [
47]. The reliability of the Yo-Yo YIRT2 has been previously validated, with an intraclass correlation coefficient (ICC) of 0.98 and a coefficient of variation (CV) of 3.5%, signifying high reliability and consistency in the outcomes [
48,
49].
Maximal oxygen consumption (VO
2 Max) was estimated using the following formula [
41]:
Reliability: Designed to assess high-intensity intermittent endurance in athletes, the YIRT2 was implemented with speed increments starting at 13 km/h. Performance was determined by the total distance covered. The test is known for its excellent reliability in elite populations (ICC = 0.98; CV = 3.5%) [
21]. VO
2 max was estimated using a validated regression formula.
2.4.5. Maximal Heart Rate (HR Max)
The relationship between maximal heart rate (HR max) and boxing is integral to understanding how cardiovascular and aerobic fitness influence performance in this high-intensity sport. HR max is defined as the highest heart rate an individual can achieve during maximal physical exertion, and it is often used as a benchmark to assess cardiovascular capacity and physical endurance [
50]. In boxing, which involves short bursts of intense activity followed by brief rest periods, understanding HR max is crucial for evaluating the ability of boxers to perform under pressure and sustain high-intensity efforts during matches. Boxing relies heavily on anaerobic power, speed, and strength, but the cardiovascular system plays a pivotal role in sustaining performance across multiple rounds. The HR max provides insight into an athlete’s ability to recover quickly between rounds and continue to perform at a high level [
51]. Studies have shown that boxing, as an intermittent exercise involving rapid bursts of movement, places significant demands on both aerobic and anaerobic systems. Athletes with a higher HR max recover faster between these bursts, leading to greater endurance during prolonged bouts [
52]. Furthermore, boxers often train to improve their HR max in a conditioning program that includes aerobic and anaerobic exercises. Research has highlighted that improved HR max correlates with increased endurance, better stamina, and more efficient energy utilization during high-intensity efforts such as punches, footwork, and defensive movements [
53].
A higher HR max indicates a more robust cardiovascular system, essential for maintaining performance under the stress of continuous and intense movements in the ring. The relationship between HR max and boxing performance can be summarized as follows: boxers with higher HR max values tend to exhibit better overall physical conditioning, which is critical for sustaining punching power, movement speed, and reaction time during competitive bouts. Thus, HR max is a key physiological marker for boxers to track and improve upon to enhance their performance in the ring. Heart rate data for athletes was recorded using the Polar heart rate monitor (Polar RS800 multi CX, Kempele, Finland), which was worn on the athletes’ arms.
Reliability: HRmax was measured using the Polar RS800 multi CX heart rate monitor (Polar, Finland), known for high measurement accuracy. HRmax is a key physiological indicator of cardiovascular capacity and recovery ability. Previous research supports its reliability in sports settings (ICC > 0.90) [
54].
Summary of Test–Retest Reliability
All physical performance tests employed in this study are supported by high reliability metrics based on previous validation in elite or similarly trained athletic populations. Reliability coefficients (ICC and CV) were reported directly from the present data (e.g., PVmax) where feasible. These methodological refinements address concerns regarding replicability and internal validity raised by the reviewer and enhance the robustness of the study outcomes.
2.5. Statistical Analyses
This study presented data as means and standard deviation (SD). The normal distribution of all variables was assessed using the Shapiro–Wilk test, which indicated that all variables followed a normal distribution (p > 0.05). Therefore, a paired measurements t-test was employed for each group’s final and initial test comparisons, and an independent Student T-test was utilized to compare variables between groups. The significance level was set at p ≤ 0.05, and all statistical analyses were conducted using IBM SPSS Statistical Analysis software (v.29, IBM Company, Armonk, NY, USA). Statistical Interpretation of Skewness: Values between −2 and +2 indicate that the data have a normal degree of asymmetry. Statistical Interpretation of Kurtosis: Values between −7 and +7 suggest that the data exhibit a normal level of tail distributions. Statistical Interpretation of Shapiro–Wilk Test: A p-value greater than 0.05 indicates that the data are normally distributed, which supports the use of Student’s t-test. Cohen’s d is a measure of effect size that quantifies the difference between two means relative to the pooled standard deviation. Interpretation of Cohen’s d: small effect d < 0.2, medium effect d < 0.5, large effect d < 0.8, and very large effect d > 0.8.
3. Results
This study’s data are presented in
Table 4 as means and standard deviation (SD). The normal distribution of all variables was assessed using the Shapiro–Wilk test, which indicated that all variables followed a normal distribution (
p > 0.05). Analyzing the results, we find that all body composition parameters recorded lower values in the final tests than in the initial. The results of both groups highlight that the training process positively affected body parameters and influenced body composition parameters. The Skewness values ranged between −0.575 and 1.684, respectively, and the Kurtosis values ranged between −0.708 and 4.111, reflecting a normal data asymmetry.
The results in
Table 5 reflect that the differences between the initial and final testing, for all body composition parameters of the study groups, were statistically significant, where
p < 0.001. The decrease in body mass values (ΔX = −8.950) and body fat percentage (ΔX = −4.640) were greater compared to the decreases in the body parameters of Group 1—Plyometric Stair Jump group. The values of the mean differences fell between the lower and upper limits of the 95% CI for all parameters of the groups. The Cohen’s d values were negative, falling between −2.362 and −1.622, which highlighted a very large negative effect, indicating the positive impact of the training programs on body composition parameters.
The analysis between the study groups in
Table 6 shows that the differences were not statistically significant for height and body mass at the two tests. The percentage of body fat was statistically significant at the final test, at
p = 0.019, but between the initial tests of the groups, the difference was statistically insignificant, at
p > 0.05. Cohen’s values highlighted a small effect for body mass with d < 0.3, but for fat mass at the initial test, the effect size was large with d = 0.646, and it was very large at the final test, with d > 0.8.
The results in
Table 7 show a normal distribution of the data according to the Shapiro–Wilk values, with
p > 0.05. Analyzing the Skewness and Kurtosis values, we find a symmetrical distribution of the results. Also, analyzing the mean values between the tests, we find that the final test results are higher than the initial test for all fitness parameters of the study groups.
In
Table 8, we have highlighted the differences between the tests for each study group. Analyzing the results, we find that Group 1—Plyometric Stair Jump group recorded superior progress compared to Group 2—Plyometric Reaction Box Jump group, in the parameters of physical fitness: one-repetition maximum bench press test (BP 1RM) (ΔX = 24.360), maximum punching velocity (PVmax)—rear arm (RA)(ΔX = 2.570), Yo-Yo Intermittent Recovery Tests—Distance (ΔX = 0.705), Yo-Yo Intermittent Recovery Tests—VO2max (ΔX = 5.920), and maximal heart rate (HR max) (ΔX = 25.700). All the average differences recorded were statistically significant, with
p < 0.001 for both groups. The progress recorded between the tests fell between the two limits of the 95% CI. The Cohen’s d values of Group 1—Plyometric Stair Jump fell between 1.895 and 0.973, which reflected very large effect sizes; it can be considered that the experimental program implemented in the study was efficient. Group 2—Plyometric Reaction Box Jump group also recorded Cohen’s d > 0.8 values, reflecting the large sizes of all fitness parameters. Analyzing Cohen’s values, we found that for Group 1—Plyometric Stair Jump group, the experimental program produced superior effects compared to Group 2—Plyometric Reaction Box Jump group.
In
Table 9, we find that the differences between the study groups were statistically significant (
p < 0.05) for the final testing of all fitness parameters. In contrast, for the initial testing, we find that the results were statistically insignificant (
p > 0.05) for all parameters, with one exception for the one-repetition maximum bench press test (BP 1RM) (
p = 0.021). The difference in the means between the groups was more significant for the final testing compared to the initial testing for all fitness parameters. Cohen’s d values evidenced very large effect sizes for the final testing for all parameters (d > 0.8); for the initial testing, the effect size varied, being small, with d < 0.3, for Yo-Yo Intermittent Recovery Tests—Distance, Yo-Yo Intermittent Recovery Tests–VO2max, and maximal heart rate (HR max); for the other fitness parameters, the effect was large; the exception was for the one-repetition maximum bench press test (BP 1RM), where d = −0.975, which was a very large negative effect size.
4. Discussion
This study investigated the effects of different plyometric training protocols on body composition in professional boxers. Following eight weeks of training using Plyometric Stair Jump (PSJ) and Plyometric Reaction Box Jump (PRJ) protocols, significant reductions in both body weight and body fat percentage were observed in both groups. These findings suggest that plyometric training contributes not only to performance enhancement but also to improvements in body composition. The results are consistent with the existing literature, supporting the effectiveness of plyometric exercises, particularly in reducing body fat and achieving an optimal body composition. This section aims to interpret the current findings in light of previous research, discuss the possible physiological mechanisms underlying the results, and consider their practical implications.
4.1. Body Composition
The findings of this study underscore the positive effects of plyometric training on body composition among professional boxers. After eight weeks of training, both the Plyometric Stair Jump (PSJ) and Plyometric Reaction Box Jump (PRJ) groups exhibited statistically significant reductions in body weight and body fat percentage. More notably, the PSJ group experienced a greater reduction in body weight, indicating that this training modality may be more effective in improving body composition parameters. These results are consistent with those of Behrens et al. (2016) [
55], who reported that Plyometric Jump Training (PJT) can significantly improve lean mass and reduce fat mass, particularly among young male athletes. Their meta-analysis highlighted the versatility of PJT in eliciting adaptations related to muscular development and metabolic efficiency. Furthermore, de Villarreal et al. (2009) [
56] demonstrated that plyometric training is at least as effective as complex training in enhancing strength and power, and may yield superior results in maximal strength development when external load is applied. The observed reductions in body fat percentage are especially important in sports like boxing, where strength-to-weight ratio, agility, and speed are critical for performance. A lower body fat percentage improves relative strength and energy efficiency, allowing athletes to generate more power with less physiological load. These benefits are primarily attributed to neuromuscular adaptations induced by the stretch-shortening cycle (SSC), which plyometric exercises are specifically designed to exploit [
52].
Moreover, beyond compositional changes, plyometric training is associated with muscular architecture and power output enhancements. According to Buchheit and Laursen (2013) [
57], such adaptations can also contribute to increased maximal oxygen consumption (VO
2max), endurance, and overall athletic functionality. These improvements may offer competitive advantages and contribute to injury prevention and long-term athletic development. In summary, the current study reinforces the value of plyometric training as an effective strategy for optimizing body composition and athletic performance in elite combat athletes. These findings support integrating structured plyometric protocols—especially stair jump variations—into boxing-specific training programs. The present study’s findings reaffirm the efficacy of plyometric training in enhancing body composition. The Plyometric Stair Jump (PSJ) and Plyometric Reaction Box Jump (PRJ) groups demonstrated statistically significant improvements in body weight and body fat percentage following the eight-week intervention. These results underscore the role of plyometric training as a performance-enhancing modality and an effective method for body composition regulation. Consistent with the prior literature, plyometric training reduced fat mass while promoting lean muscle development and improving athletic performance [
58].
In this study, a significant reduction in body weight and fat percentage was observed following the 8-week plyometric training program. However, due to the lack of comprehensive data on participants’ dietary habits, weekly routine boxing training, and in-season weight management strategies, attributing these changes solely to the plyometric training should be approached with caution. As noted in the literature, changes in athletes’ performance and physical composition often result from the interaction of multiple factors [
59]. Therefore, future research is recommended to examine diet and other training loads under controlled conditions.
4.2. One-Repetition Maximum Bench Press
Beyond body composition, this study also evaluated the effects of PSJ and PRJ training protocols on upper-body maximal strength, as measured by the 1RM bench press test. Significant improvements in 1RM values were observed in both groups after the training period, suggesting that plyometric training may contribute to the neuromuscular adaptations associated with maximal force production. Although both groups showed comparable overall improvements, the PSJ group achieved more pronounced post-intervention gains, despite a lower initial performance level. This trend may be attributed to the nature of the PSJ protocol, which emphasizes explosive power development through the utilization of the stretch-shortening cycle (SSC) [
60,
61]. The PSJ exercises likely rapidly enhanced the participants’ ability to generate force, particularly during the eccentric–concentric transition phase. This increased muscle recruitment and acceleration of contraction speed may have translated into improved upper-body strength. In contrast, the PRJ group, which engaged in reactive strength training involving high-velocity box jumps, likely experienced accelerated neural adaptations. This aligns with findings by Marshall et al. (2011) [
61], who reported that high-speed resistance training enhances neuromuscular efficiency and improves the rate of force development. The performance gains observed in both groups suggest that strength increases following plyometric training are closely linked to neuromuscular adaptations. Plyometric exercise is known to improve intermuscular coordination, increase motor unit recruitment, and enhance the firing frequency of fast-twitch muscle fibers [
62]. These neural adaptations contribute to stronger and more efficient muscle contractions, thereby elevating maximal force output. Furthermore, the PSJ protocol’s emphasis on eccentric loading and rapid concentric rebound may have provided a more potent stimulus for enhancing explosive strength. This is particularly beneficial for sports requiring rapid force generation, such as boxing. Conversely, the PRJ protocol appears to have contributed to gains in reactive strength through the optimization of neuromuscular timing and coordination. While both protocols targeted distinct aspects of force production, the more pronounced improvement in the PSJ group suggested a superior impact on eccentric strength and power output. In conclusion, the findings support the use of both PSJ and PRJ protocols as effective plyometric training modalities for improving body composition and maximal upper-body strength. The results highlight the importance of exercise specificity in targeting different neuromuscular adaptations and underscore the value of plyometric training in sport-specific strength development programs.
This study highlights that plyometric training is an effective form of non-weighted strength training and an essential tool for enhancing athletic performance. The impact of plyometric exercises on various strength components, such as faster force production, reactive strength capacity, and concentric force enhancement, encourages athletes and coaches to utilize these types of training, particularly in sports requiring explosive power and strength development [
63]. The findings of this study confirm the positive effects of plyometric training on 1RM bench press performance. However, it would also be essential to examine the impact of such training on lower-body strength and other performance metrics. Future research should include studies conducted on different age groups and genders. Additionally, it would be valuable to determine the long-term effects of plyometric training and test the impact of varying training combinations on strength. In conclusion, both plyometric training protocols have effectively increased 1RM bench press performance. These findings suggest that plyometric training is crucial for athletic strength development and can enhance force production capacity through neuromuscular adaptations. Future studies should explore the broader impacts of such training on other performance parameters and overall athletic performance.
4.3. Maximum Punching Velocity
On the other hand, regarding the changes in PVmax (m·s
−1) values, the results of this study demonstrate significant increases in PVmax (m·s
−1) following plyometric training interventions. These increases were observed in the Plyometric Stair Jump (PSJ) and Plyometric Reaction Box Jump (PRJ) training groups, with differences in the magnitude of change between the two groups. When examining the effects of plyometric training on biomechanical speed, explosive power, and athletic performance, significant increases in PVmax values for both the right and left arms were observed in the PSJ group. These results indicate that the PSJ group showed more significant increases in PVmax for both arms, which can be attributed to the stair jump exercises’ explosive, fast movements. Plyometric Stair Jump (PSJ) exercises are known for their high acceleration and rapid force development, and they promote extensive explosive power development through high-intensity plyometric actions. Loturco et al. (2018) [
38] emphasized that plyometric exercises, mainly multi-directional jumps and sprints, significantly improve maximum power output by enhancing muscle coordination and developing muscle elasticity. In this context, the higher PVmax increase observed in the PSJ group supported the effectiveness of the training method in developing explosive power. In the PRJ group, however, the reaction box jump exercises focused mainly on developing reactive strength, and such training improved muscle elasticity and acceleration capacity, thus enhancing speed development. Nevertheless, the PRJ group showed smaller increases compared to the PSJ group. This could be due to the reaction box jump exercises’ emphasis on shorter duration acceleration and force development. Kimm and Thiel (2015) [
64] found that reactive exercises improve the stretch-shortening cycle (SSC) by facilitating rapid muscle contractions. However, their effects are more limited compared to movements that require high acceleration and vertical jumping, such as stair jumps. Looking at the biomechanical speed recovery and power development, the PSJ group exhibited higher PVmax values for both arms. These findings suggest that PSJ training efficiently developed arm strength and speed. The more significant increases observed in the PSJ group can be explained by the nature of the exercises, which focus on developing explosive power. Furthermore, PRJ training’s primary focus on reaction time may have limited the extent of acceleration and force increases.
Regarding the statistical significance of the motor control results and the reliability of the outcomes, the increase in PVmax values was statistically significant in both training groups. This indicates that the training interventions had a reliable and considerable effect on both groups. Loturco et al. (2014) [
65] reported that plyometric training generally leads to reliable and significant improvements in performance factors such as strength, speed, and explosive power. The obtained
p-values suggest that the findings were not random and reflected actual enhancements. These results highlight the impact of plyometric training on speed and explosive power development. PSJ training is more effective for speed and strength development, while PRJ training suits sports requiring reaction and acceleration. This suggests that both training types can be used to achieve specific performance goals. In the literature, plyometric training improves explosive power, speed, and strength development. Exercises like stair jumps help accelerate speed by targeting large muscle groups. These findings align with foundational studies in the literature, such as those of Lenetsky et al. (2013) [
21], which show that plyometric training facilitates muscle operation at maximum speed and enhances body speed. PRJ training, on the other hand, is emphasized in the literature for its role in developing reactive strength and improving acceleration. Another study pointed out that reactive strength is adequate for short sprints and acceleration [
66]. These findings suggest that both types of plyometric training are effective for athletes targeting speed and strength development. PSJ may be a more suitable option for situations where speed and strength need to be developed, while PRJ training may be more effective for athletes seeking to improve acceleration and reaction times. In conclusion, the training type should be tailored to the athletes’ needs and performance goals.
4.4. Yo-Yo Intermittent Recovery/Max VO2
When examining the effects of different plyometric training protocols on boxers’ endurance and cardiopulmonary performance, the results indicate that both the Plyometric Stair Jump (PSJ) and Plyometric Reaction Box Jump (PRJ) training groups showed significant improvements in endurance distance (m) and max VO
2 (mL/kg/min) values after an 8-week training period. These findings highlight that plyometric training impacts strength, explosive power, cardiovascular capacity, and endurance. The endurance distance (m) data revealed significant improvements in the PSJ and PRJ training groups. The results demonstrate that both the Plyometric Stair Jump (PSJ) and Plyometric Reaction Box Jump (PRJ) groups experienced significant improvements in endurance distance and maximal oxygen uptake (max VO
2) following the 8-week intervention, underscoring the effectiveness of plyometric training in enhancing endurance and cardiopulmonary function. These findings align with previous research indicating that plyometric exercises improve aerobic capacity by enhancing muscle oxygen utilization and increasing the oxygen transport capacity of muscles [
53,
67,
68]). The observed increase in max VO
2 further reflects beneficial cardiopulmonary adaptations, including improved oxygen delivery and energy metabolism efficiency [
69,
70,
71,
72].
Although plyometric training is traditionally associated with improvements in anaerobic power and explosive strength, the current findings highlight its broader impact on aerobic endurance performance. This dual effect is particularly valuable in sports such as boxing, where athletes must sustain high-intensity efforts over extended periods while maintaining explosive power. Plyometric training enhances both aerobic and anaerobic energy systems, improving oxygen delivery to muscles and optimizing energy production pathways. Consequently, it offers a comprehensive training approach to improve both strength and endurance capacities, which are critical for competitive success in explosive sports.
Furthermore, the physiological benefits of plyometric training extend beyond boxing and are applicable to a variety of sports that require a combination of strength, power, and endurance. Plyometric exercises have been shown to enhance aerobic and anaerobic energy systems, improve oxygen delivery to muscles, and optimize overall energy metabolism. Consequently, these adaptations can contribute to improved performance in explosive and endurance-based sports such as basketball, soccer, and track and field events. Expanding the discussion to include these broader sporting contexts highlights the versatility and practical relevance of plyometric training across different athletic disciplines [
73].
In summary, the findings from this study suggest that plyometric training can significantly improve both endurance and cardiopulmonary performance in athletes. Specifically, plyometric exercises increased the endurance distance and max VO2 values, indicating improvements in aerobic capacity and energy metabolism. While the effects of plyometric training on strength and explosive power are well-documented, this study highlights that it also positively impacts endurance, making it an effective method for enhancing overall athletic performance, especially in sports that require both explosive power and sustained endurance, like boxing. However, it is essential to note that training frequency, duration, and protocol variations could yield different results. As such, careful consideration of training parameters is critical for optimizing the benefits of plyometric training for endurance and cardiopulmonary performance.
4.5. Limitations
There are several limitations to this study. First, the research was conducted exclusively on professional boxers, which limits the generalizability of the findings to athletes from other sports disciplines. Extending the study to include different sports would help determine whether plyometric training produces similar effects across various athletic contexts. Additionally, the study only examined an eight-week training period, so the long-term effects of plyometric training remain unknown. Future research should explore the sustainability and long-term benefits of plyometric training over extended periods. Another important limitation is the relatively small sample size, with only 10 athletes per group, which may have reduced the statistical power and affected the reliability of the results. Increasing the sample size in future studies could enhance the robustness of the findings and improve their applicability. Furthermore, this study focused solely on physical performance parameters, without considering psychological factors such as motivation, mental state, or recovery, which may also influence training outcomes. Incorporating these variables could provide a more comprehensive understanding of the effects of plyometric training.
One of the primary limitations of this study is the absence of a non-intervention control group. While both intervention groups demonstrated improvements in key performance metrics, it is not possible to definitively attribute these changes solely to the plyometric training protocols. Given that participants continued their regular boxing sessions and were in the preparatory phase of their competitive season, adaptations may also reflect the cumulative effects of overall training load, seasonal progression, or natural performance fluctuations. Additionally, participants’ prior training experience (average > 5 years) may have influenced their responsiveness to the intervention. Future studies should consider including a true control group and more closely monitoring external variables such as training volume, intensity, and competition calendar to better isolate the effects of specific interventions.


 ,
, 

