Abstract
In this study, the development and validation of a 35th percentile female multi-body head–neck model are presented to study whiplash-related disorders in rear-end impacts. The volunteer sled tests conducted by the Japan Automobile Research Institute (JARI) with an impact velocity of 7.9 km/h have been utilized for the validation process. The proposed method in the development of the female multi-body head-neck model is characterized by its simplicity, efficiency, and capability of the biofidelic responses. Compared to the volunteer response corridors, the model has maximum absolute errors of 3.67 mm and 2.45 deg in head translational and head angular displacements, respectively, in the most optimum solution. The outcomes demonstrate that this head-neck model for a 35th-percentile female can give a high level of accuracy in rear impact simulations.
1. Introduction
Whiplash is a neck disorder typically occurring in rear-end collisions at low speeds [1]. According to a recent study covering three different databases in the US between 2010 and 2014, there occur about 869,000 neck injuries in traffic crashes each year, of which 96.7% are whiplash-related disorders; the remaining injuries are fractures, dislocations, and injuries to the intervertebral discs and the spinal cord [1]. Whiplash involves soft-tissue damage to the cervical spine without bone fractures. Whiplash occurs when components such as muscles, facet joints, and intervertebral discs are under stress. To better understand the injury mechanisms of whiplash, experimental studies have been performed with cadavers, human volunteers, and crash test dummies. These studies were limited due to safety concerns or the absence of living tissue [2].
Conversely, computational methods are a very useful tool to study injury mechanisms. Finite element (FE) modeling, multi-body modeling, or a combination of both of these methods can be applied to build head-neck models. Considering the existing literature, FE models outnumber multi-body models. FE models demand a large amount of power and give more information on tissue deformations and the mechanisms of injury. On the other hand, multi-body models can simulate successfully and inexpensively the responses such as forces, moments, and kinematics of the human body subjected to impact loads while decreasing the time for the design of the human-body models and protection systems. Numerous anatomical details can also be incorporated in multi-body dynamic models. For instance, in multi-body models of the head-and-neck complex, the head and the cervical vertebrae can be modeled as rigid bodies, whereas the soft tissues can be modeled using springs and dampers [3,4].
Over the past three decades, the literature has seen the introduction of several multi-body head-neck models. These multi-body models [5] have been built for different purposes. Chancey et al. [6] created a neck model using data from a human cadaver and the MR images of a male human volunteer to generate biofidelic responses for the muscles. This model was used to define the range of tolerance to tensile loading. van der Horst [7] improved de Jager’s male model [8] and embedded it into a human-body model. This model gave more realistic muscle force lines and was validated for lateral, frontal, and rear impact loadings.
Galbusera et al. [9] model was designed only for the vertebrae between C2–C7 with the aid of computed tomography images. The model was then used to simulate the flexion-extension motion of the cervical spine for disc prosthesis. In the model, the stiffness of the springs was considered linear, and the stiffness coefficients were taken from the literature based on experiments conducted with human cadaver cervical spines. Also, the viscoelastic behavior was neglected. In Ahn et al. [10], the vertebrae between C2 and T1 were modeled. The vertebra geometries were obtained from the tomography images of a female subject who was 59 years old. The intervertebral disc joints having nonlinear viscoelastic properties were used. The disc stiffnesses were lumped at a single point between each pair of vertebrae. The objective was to estimate the kinematics and the dynamics of the cadaver cervical spine. This model is very limited because it was developed by using the data from a 59-year-old female only. Hence, the model does not represent the general population.
van Lopik [2] built a model of the head, neck, and the first thoracic vertebra, including the soft tissues using the multi-body dynamics method. Nonlinear viscoelastic material was used for the intervertebral discs. The developed male model was able to simulate the local and global motion of the head relative to the upper torso. de Jongh et al. [11] created a whole head-neck model to estimate the wear in cervical disc implants. This model was designed by utilizing computed tomography scans of a 24-year-old volunteer with 1.80 m of height and 90 kg of mass. Each vertebra had a simple geometry, and intervertebral discs were represented by passive elements.
In Huber’s study [12], the aim was to create a model to predict the motion of the cervical spine, define the tissue loads, and maintain the balance of the head–neck. This model was evaluated by using only three volunteers who did not have neck pain. Happee et al. [13] created a model that included seven vertebrae, a head, and T1 (the first thoracic vertebra). This model was evaluated using experimental data to examine the motion of the trunk and the motion of the head under gravity.
Starting from the mid-1990s, Jakobsson et al. [14] developed a male multi-body head–neck model, working only in the sagittal plane. de Jager [8] model was the first detailed male head–neck model, which included soft tissues that were lumped into the intervertebral joints. This model was improved for frontal and lateral impacts. van Kroonenberg et al. [15] developed this model further for rear-end impacts. Linder [16] built a computational male dummy for rear impacts; this model was validated against volunteer data and used in the development of the BioRID dummy. Muscle substitutes with tuned elastic stiffness and damping properties provided better responses.
Himmetoglu [3] designed a biofidelic 50th percentile male multi-body head–neck model to be used in rear impact simulations, and this model was verified successfully using volunteer data. The head–neck models have been developed mostly for the 50th percentile male in crash safety studies. Even though women are more vulnerable to soft tissue injuries to the cervical spine, no comparable modeling efforts have been addressed for females until the start of the ADSEAT project [17] about 15 years ago.
The injury risk is a serious concern for women. Females are susceptible to higher injury risk and they have higher injury risk in all categories, except mortal injuries [18]. Recent research indicates that females aged between 20 and 30 are more prone to die in comparison to males in the same age range in road traffic accidents [19]. Furthermore, the risk of calamitous injury was found to be 22 percent higher for women, based on the Fatality Analysis Reporting System database [20].
Gender is one of the important risk factors for whiplash-associated disorders. Researchers indicate that females are at a significantly higher risk of sustaining whiplash compared to males, even under similar crash conditions, and these studies also reveal that the risk for females is three times that of males in equivalent conditions [17,18].
The differences in the morphology of the head–neck complex between females and males could explain the higher risk of whiplash for females. The neck anthropometry is the most significant difference between genders. Studies have shown that females have weaker neck muscles, and the reflexes of the muscles are faster [18]. Furthermore, females generally have smaller necks and vertebral body sizes with respect to their head size in comparison to males. According to the Harty et al. study [21], due to the larger vertebral dimensions, males have better intervertebral coupling stability. Females show a greater range of extension-flexion motion. Also, dynamic tests have revealed a more prominent S-shaped curve in the female neck in comparison to males [17]. A finite element dummy model for an average female (50th percentile female) was developed 10 years ago for better protection of females in rear impacts [22,23].
Crash test dummies were designed to set out for the variation in stature and weight of the population. The hybrid III 50th percentile male, the 95th percentile male, and the 5th percentile female are used in frontal impact tests. Based on Schneider et al. study [24], the height and mass of the 5th percentile female are 151.1 cm and 47.3 kg, respectively. This mass and stature are similar to those of a 12-year-old girl in the Swedish population [18].
To address the gender problem, the first rear impact computational dummy for an average female has been developed [22]. Carlsson et al. [22] developed a finite element model of the 50th percentile female dummy for rear impacts which is called EvaRID and this is the first female dummy to be used in rear impact simulations. EvaRID is based on literature data and scaled from the average male rear impact dummy, the BioRID II dummy. The physical properties of the female dummy were based on literature data as well. The mass and stature of EvaRID was set as 62.3 kg and 161.8 cm, respectively [22]. The mechanical properties of the neck (i.e., damping and stiffness) were scaled to 70% of those of the BioRID II dummy as an initial estimate. In EvaRID, the masses of the body segments were determined using uniform density approximation. This dummy is valuable, but some updates, such as joint stiffness, were necessary considering its responses in the validation tests.
Östh et al. [25] built a finite element model representing the 50th percentile female head and neck comprising a ligamentous cervical spine with a rigid head and Hill-type muscle elements. The rear-impact simulations did not incorporate muscle activation.
Human head–neck models must provide biofidelic responses to be effective. Therefore, these models must be validated against volunteer responses [26]. Linder et al. [27] determined the responses of both genders in rear impact tests using volunteers. Carlsson et al. [17] also examined the dynamic kinematic responses of female and male volunteers in equivalent rear impact conditions.
In light of all this information, the differences due to gender have been examined and problems addressed for about two decades. Most previous studies were based on the 5th percentile female, which was scaled from male models. Therefore, the female population is not represented efficiently, and the injury risk for females is still a great concern in rear impact conditions. In the last seven years, state-of-the-art female models have been developed comprising 50th percentile female finite element human-body models and 50th percentile female physical dummies. These female models are aimed to be used primarily for rear impact testing, as described in the following four paragraphs.
Putra [28] worked on the 50th percentile female finite element human-body model ViVA OpenHBM built at the Chalmers University of Technology, Gothenburg, Sweden. ViVA OpenHBM model is an average female with a stature of 161.6 cm and a mass of 60.8 kg. In his research, different control strategies in muscle activation were studied together with the optimization of control gains to match volunteer response data obtained from the Japan Automobile Research Institute, Tsukuba, Ibaraki, Japan (JARI) rear impact tests [29]. Although the height of the volunteers was similar to that of the ViVA OpenHBM model, the volunteers were 12 kg lighter, thus, the volunteers did not exactly represent an average female. Furthermore, only two volunteers were available to validate the female model, which was a shortcoming. There were considerable differences between the model and volunteer displacements; the slopes of the displacement curves were not in agreement as well. Hence, the female model needed improvement. In a follow-up study [30], the ViVA OpenHBM female FE model was improved by better tuning the parallel damping element in the Hill muscle model; consequently, they obtained better agreement with the volunteer kinematics. In this follow-up study, the aim was to validate the female model against volunteer data at three different severities; however, they did not present the displacements of the volunteers versus the female model at the highest severity test with a delta velocity of 10 km/h.
In the latest research on EvaRID [31] (which is a finite element dummy model for the average female), four different real-world crash pulses were applied to the same seat in order to investigate the differences in the responses of EvaRID and BioRID II FE models. In this reconstruction of four different accidents, the injury criteria values were lower for EvaRID in contrast to BioRID II, even though the female occupants had experienced more severe whiplash symptoms than the male occupants in the corresponding real-world accidents. It was concluded that the neck and torso of BioRID II were more susceptible to extension because of their size and mass; hence, it was suggested that lower injury criteria thresholds should be used for EvaRID. This study has limitations, considering that the investigation of only four accident reconstructions might not be enough to draw general conclusions. In the real-world case, the posture of the occupants with respect to the seat could vary.
A prototype physical dummy called BioRID P50F has recently been designed [32] to represent an average female based on the body parts of the average male dummy BioRID II. An experimental seat with a head restraint was utilized to compare the responses of BioRID P50F with those of the female volunteers. The spine stiffness of BioRID P50F is roughly 70% of that of the BioRID II dummy, though this scale varies between different parts of the dummy. The validation tests revealed that the BioRID P50F dummy needed more improvements to increase its biofidelity since there were significant differences between the kinematics of the dummy and the volunteers.
Lately, the Seat Evaluation Tools (SET) [33] have been developed, which are the physical dummies for an average female and male (SET 50F and SET 50M, respectively) as a continuation of the ViVA and ViVA II projects. These physical dummies are designed to be used for rear impact testing. The design of BioRID II and BioRID P50F dummies are the basis of the average female prototype dummy SET 50F. The neck of SET 50F is composed of three vertebrae, allowing motion in the sagittal plane only, whereas the lumbar and thoracic spine designs allow motion in the lateral direction and in the sagittal plane together with axial rotation. The responses of SET 50F were compared to those of female volunteers by using volunteer data from an earlier study [34]. It was observed that the responses of the SET 50F dummy were out of the volunteer response corridors significantly regarding T1 angular displacement, head relative to T1 angular displacement, T1 x-displacement, and head relative to T1 x-displacement. The simpler neck design with three vertebrae could be improved together with a reassessment of the abdominal design of the dummy in order to achieve better agreement with the volunteer data.
In light of the past and recent studies on female human-body and dummy models, it can be concluded that developing a female model requires a very long time (more than 15 years), and it is very hard to match model responses with those of the volunteers. The state-of-the-art female models for rear impact testing represent an average female (50th percentile) only. Hence, it is required to extend the range of female models to cover other percentiles. Besides, the computational female models are finite element models only. Hence, a multi-body female model would be a good contribution to the literature since such a model would accelerate the development of seat and head restraint systems for the protection of females.
Therefore, the main contribution of this research is the development of a computationally efficient 35th percentile female multi-body head–neck model for the first time in the literature, which can be used as the head–neck section of a 35th percentile female human-body model in rear impact simulations. The derived mechanical properties of the model obtained through calibration and validation provide a very useful and valuable dataset for the design of future female dummies. The presented literature review indicates that female models with higher biofidelity are required, and the female head–neck model developed in this study provides highly biofidelic responses. The model is validated successfully using the data from the Japan Automobile Research Institute, Tsukuba, Ibaraki, Japan (JARI) volunteer tests [29], which involved 35th percentile female subjects. The female model presented in this study is thoroughly validated for the first time in the literature by using female volunteer data from rear impact tests with the highest severity (delta velocity of 10 km/h). This study is from the PhD thesis of the first author of this paper.
2. Volunteer Test
Three healthy 35th percentile (in terms of height and mass) female volunteers were subjected to rear impacts in the JARI tests [29]. The average stature and mass were 160.6 cm and 50 kg, respectively, and the average age was 22.5 years. Figure 1 provides an illustration of the inclined sled apparatus used in these tests. A rigid seat that had no head restraint was used, and the bottom of the sled had an angle of 10 deg from the horizontal. The seatback angle was 20 deg from the vertical.
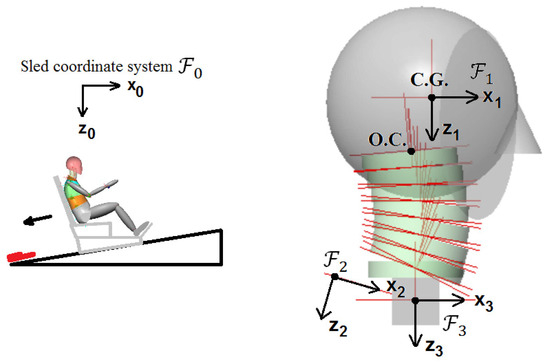
Figure 1.
Volunteer test set-up.
To simulate rear-end impacts, the sled was released from the top of the inclined rails, and a hydraulic damper at the bottom was used for deceleration. The delta-V (change in velocity) and the peak acceleration of the sled were 10 km/h and 37 m/s2, respectively, as a result of the impact. The sled impact velocity was 7.9 km/h. The set-up was constructed to simulate rear-end collisions at low speeds with the resulting crash pulse illustrated in Figure 2 [29].
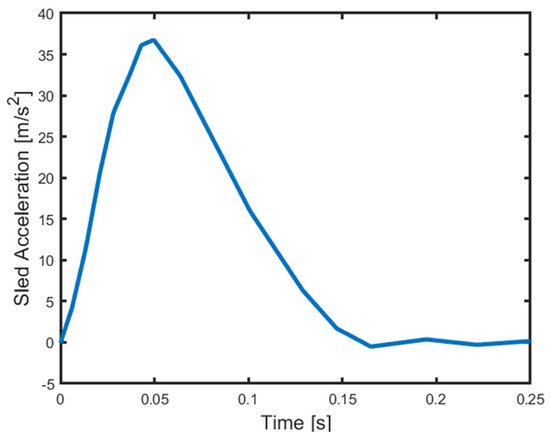
Figure 2.
Average sled acceleration [29].
During the experiments, volunteers assumed a normal seating position on the rigid seat, as shown in Figure 1. Two biaxial accelerometers were secured to the head rig in order to record the acceleration of the head center of gravity (C.G.). To find the T1 accelerations, another biaxial accelerometer was adhered to the skin surface over the T1 vertebra. Target markers were attached to the upper sternum, iliac crest, auditory canal, and skin surface over the T1, and a high-speed video camera tracked the motion of the volunteers.
The sled coordinate system, which is attached to the sled, is denoted by as shown in Figure 1 and its axis is parallel to the ground (i.e., horizontal). The head anatomical coordinate system is denoted by . The head anatomical coordinate system was attached to the head with its origin at the head center of gravity, whose axis is positive towards the front, being parallel to the Frankfort line, while its axis is positive in the downward direction. The T1 accelerometer coordinate system is denoted by whose axis is on the skin lying on the spinous process of T1. The T1 anatomical coordinate system (denoted by in Figure 1) was located such that its origin was at the center of T1, and the center was defined between the T1 and sternum skin markers. In the T1 anatomical coordinate system, the axis signifies forward; the axis was defined along a line passing through the occipital condyles (O.C.) and oriented downward in the initial condition of the volunteer before the impact, as shown in Figure 1. The coordinate systems and move almost together with T1.
3. Model Details
The stature and mass of the female model are selected as 160 cm and 50 kg, respectively, with a body mass index of 20 kg/m2 to be in agreement with those of the volunteers in Sato et al. [29] study. The inertial properties and geometrical features of the model are based on several studies from the literature, such as Chalmers University of Technology (ViVA project) and University of Michigan Transportation Research Institute, Ann Arbor, MI, USA (UMTRI) studies [22,35,36].
Based on Gordon’s study [37], the 35th percentile female has a stature of 160.32 cm and a mass of 56 kg. Using this percentile, the head circumference, head breadth, head length, and neck circumference can be defined as 54.06 cm, 14.25 cm, 18.48 cm, and 30.91 cm, respectively [37]. The neck length is calculated as 10.25 cm. Also, in this study, constant density is assumed, and the density is selected as 0.91 g/cm3 to be in agreement with the published data [22]. The head mass is defined as 3.47 kg, and its center of gravity is determined by applying uniform mass distribution [22].
The female model developed in this study has a head, a neck with seven cervical vertebrae (namely C1 to C7 from top to bottom) and T1, as represented in Figure 3 and Figure 4. The configuration of the cervical vertebrae is derived from Klinich’s study [38], and an arc is created to define this configuration corresponding to the head–neck posture in a typical automotive seating position. The arc shown in Figure 3 with a radius of 228.75 mm and a sector angle of 25.96° was drawn in between O.C. (occipital condyles) and the lower end plate of C7, which approximates the curvature of the geometry of the cervical spine. The head and T1 anatomical coordinate systems used in the simulation model are shown in Figure 3. In the simulation model, the sled coordinate system, which is attached to the sled, has its axis towards the left parallel to the ground, and its axis is upward and vertical to the ground, which can be inferred from Figure 3; hence, the sled coordinate system is parallel to the head and T1 anatomical coordinate systems in the initial configuration as shown in Figure 3.
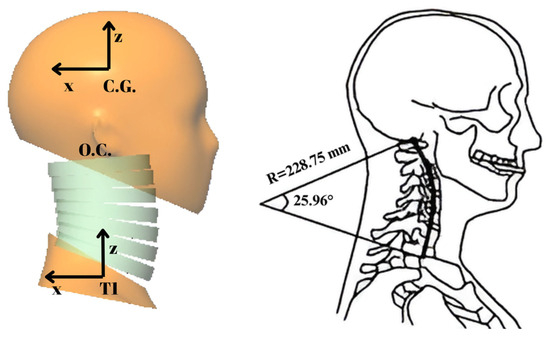
Figure 3.
The initial configuration of the head–neck model and the arc that approximates the initial configuration of the neck (adapted and modified from [16,27]).
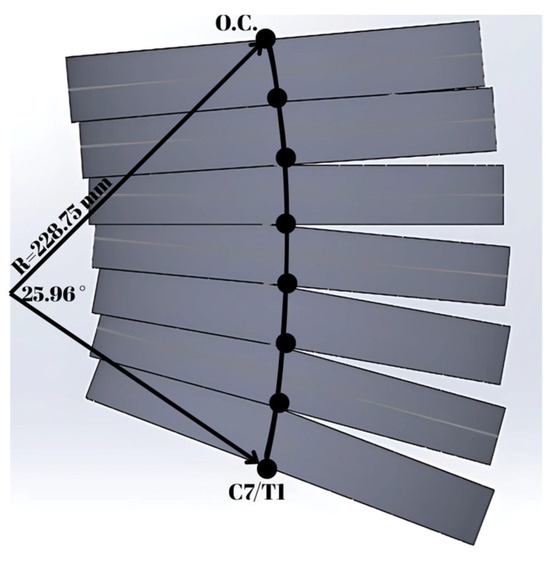
Figure 4.
The solid model of the cervical spine.
With this arc, each vertebra and the surrounding soft tissues are modeled to have the geometry of a disc, and this arc divides these neck segments (i.e., discs) in half. The radius of the female neck disc is 4.92 cm, and the radius of the arc is 228.75 mm, as shown in Figure 4. The relative orientation between the discs was derived from the Himmetoglu study [3]. Based on the neck geometry, the height of each vertebra was calculated; according to this, the first two vertebrae have a height of 14.5 mm, and the rest have a height of 14.4 mm. From the EvaRID data [22], the mass of the neck was found to be 0.663 kg, and the masses of the vertebrae are proportional to their heights. The inertial properties and relative orientations are shown in Table 1, where C0 represents the head. For the vertebrae from C1 to C6, the relative orientation corresponds to the angle of the corresponding vertebra relative to the vertebra below. The relative orientation of the head (C0) corresponds to the angle of the head anatomical coordinate system with respect to the C1 vertebra, as shown in Figure 3. The relative orientation of the vertebra C7 corresponds to the angle of C7 relative to the T1 anatomical coordinate system in Figure 3. In Table 1, the mass of the T1 vertebra is immaterial since, in the simulation, the T1 motion is specified as a function of time.

Table 1.
The inertial properties and relative orientations of the female head–neck model.
The initial velocities of the head–neck system with respect to the sled coordinate system are given in Table 1, and it is considered that the whole head–neck system has the same velocity as the sled impact velocity before impact. The 35th percentile female head–neck model is built by using the multi-body dynamics software MSC Visual Nastran 4D 2001 R2. Revolute motors connect each pair of vertebrae, and these motors produce resistive torques similar to rotational springs and rotational dampers. The head–neck model is designed to allow motion in the sagittal plane only in the same way as the BioRID II dummy. The initial posture of the head–neck is a typical driving posture in which the head looks forward, as shown in Figure 3. The intervertebral joints are located at the intersections of the neck segments and the drawn arc, as shown in Figure 4. These segments have uniform density distribution, which is a viable approximation as applied successfully in other studies [3,22].
The variation of torque as a function of intervertebral angular displacement is shown in Figure 5, where these torque values represent the rotational stiffness of each intervertebral joint. Figure 5 represents the quasi-static response of the neck without muscle activation. In Figure 5, the angles in the horizontal axis correspond to angular displacements at the intervertebral joints, which are measured from the initial configuration of the neck depicted in Figure 3 and Figure 4. In all intervertebral joints, the same stiffness function is used for simplicity. In accordance with the EvaRID average female model [22], rotational stiffness values were scaled from those of the average male model in Himmetoglu studies [3,26]. The average male model’s torque values were first multiplied by 0.65 or 0.40, which was followed by re-shaping and fine-tuning the torque–angle curve. Figure 5 displays the torque–angle curves with scale factors 0.65 and 0.40, which provided biofidelic responses during the validation process. Details of model validation and the sensitivity of the model to scale factors are explained in Section 4 and in the discussion.
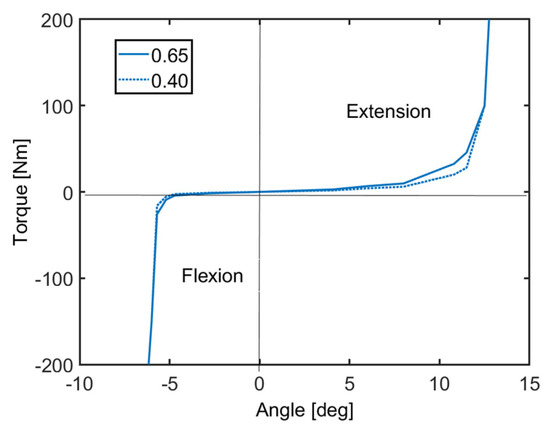
Figure 5.
Rotational stiffness of the intervertebral joints.
The revolute motors at the intervertebral joints also incorporate viscous damping. The viscous damping coefficient varies with time, as shown in Figure 6. This damping function simulates both the viscoelastic behavior of soft tissues and the effects of active muscle contraction. The damping function has a great role in the simulation of active muscle response, and it is essential to reduce head rotation. The damping function in Figure 6 is an example from the simulations which were run to validate the head–neck model in this study. According to Figure 6, between 0 and 80 ms, active muscle response does not occur. Around 80 ms, the reflex of active muscle contraction begins. The maximum response occurs around 120 ms and remains until 150 ms. After this time, discharge of the muscles decreases until 180 ms and is maintained afterwards. The damping function variation, as shown in Figure 6, follows the pattern of electromyography (EMG) activity of the dominant muscles activated in rear impact conditions. This approach was successfully applied and validated in the former studies by Himmetoglu [3,4,26].
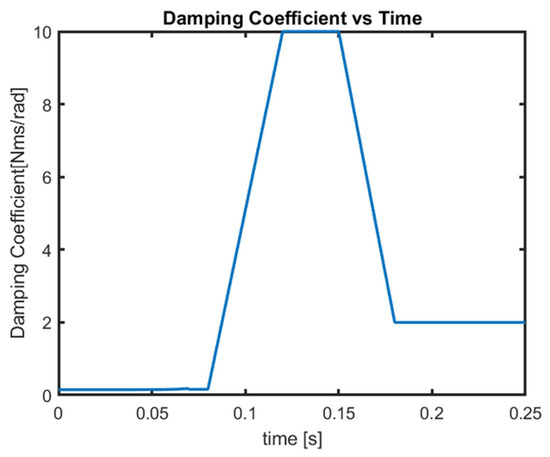
Figure 6.
Damping coefficient variation.
In all intervertebral joints, the same damping function is used for simplicity. Furthermore, the range of motion (RoM) of the head–neck system is also an important issue. In the literature research [39], there are several studies on RoM. Indeed, the age, gender, posture, and the number of volunteers are important factors. Swinkels et al. [40] categorized 200 female and 200 male volunteers with respect to their age in the neutral sitting posture and as a result of this study, RoM decreased with age rather than gender. For this reason, the RoM of this model was selected to be the same as documented in [40] for the female head–neck model developed in this study. As seen in Figure 5, the torque values increase sharply at the end of flexion and extension RoMs. It must be noted that the flexion and extension RoMs of the developed model are with respect to the posture of the cervical spine in the typical automotive seating position [38].
4. Validation of the Model
The motion of T1, which is given as an input to the model, was used to validate the model against the volunteer data, as explained in Section 2. This T1 motion refers to the angular acceleration of T1 and the translational acceleration of the origin of the T1 accelerometer coordinate system. The T1 accelerometer coordinate system is shown in Figure 1. Figure 7 presents the average values of T1 accelerations recorded in the volunteer tests. The average angular displacement of T1, which is provided in the volunteer test results [29], was digitized to fit a not-a-knot cubic spline, which was differentiated twice and then filtered according to the SAEJ211 filter [41] together with the smoothing spline function of the Matlab R2014a software. The mean values of accelerations presented in Figure 7 were given as inputs for the T1 motion.
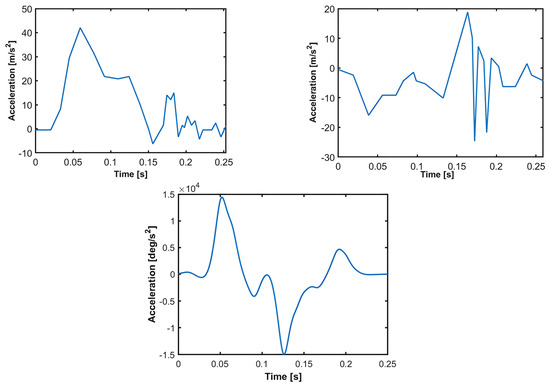
Figure 7.
T1 average accelerations as measured in the T1 accelerometer coordinate system. T1 acceleration in x-direction (top left figure). T1 acceleration in z-direction (top right figure). T1 angular acceleration (bottom figure).
At the start of the impact, when time equals zero, the picture of one female volunteer [29] indicates that the head is flexed slightly with respect to T1, which is different from the initial configuration given in Figure 3. However, this initial flexion is not quantified in reference [29], from which the volunteer data is obtained. During the validations, it was observed that this initial flexion significantly affected the response of the model and provided better agreement with the volunteer motion. Therefore, during the validation and fine-tuning of the model, two different postures of the female head–neck system are considered, which are shown in Figure 8, where the head is flexed by 8 deg or 16 deg with respect to T1. In order to determine a natural and realistic posture of the cervical spine, a separate simulation was run in which T1 was fixed, and the head was allowed to fall under gravity without any reflex muscle activation. When the head flexion relative to T1 reached 8 deg or 16 deg, the posture of the cervical spine and the head were recorded to be used as the initial configuration in the subsequent impact simulation.
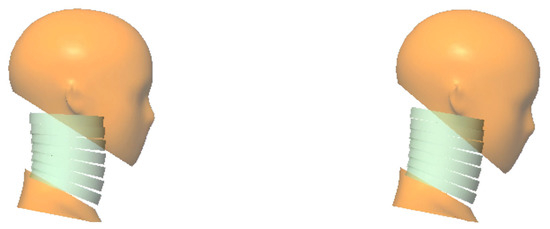
Figure 8.
The posture of the head–neck model at the start of the impact with the head flexed relative to T1 by 8 deg (left figure) and by 16 deg (right figure).
The muscle activity of the volunteers is not reported in reference [29]. Therefore, at the start of the impact, it is not known how tense or how relaxed the volunteers were. Hence, during the validation of the head–neck model, the viscous damping function, which mimics the muscle activity pattern, is varied in accordance with the EMG signal shapes recorded from volunteer tests in the literature [42,43,44,45,46,47,48,49]. Five cases are presented that produce similar biofidelic behavior regarding the motion of the 35th percentile female model. These five cases are highlights from the validation and calibration of the model. The damping functions for cases 1 to 5 are displayed in Figure 9. In cases 1, 2, and 4, the initial head flexion prior to impact is 16 deg. In cases 3 and 5, the head is flexed by 8 deg before the impact. In cases 1, 2, 3, and 4, the scale factor for the stiffness function is 0.65, whereas for case 5, this scale factor is 0.40, as specified in Figure 5.
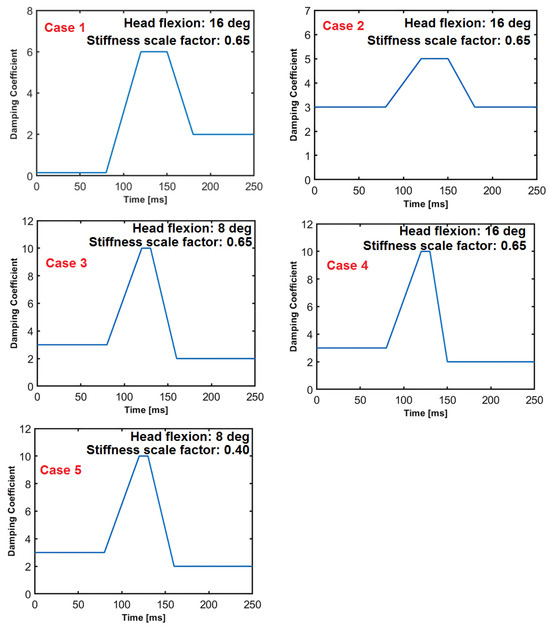
Figure 9.
The damping functions at the intervertebral joints, cases 1 to 5.
Reference [29] provides the responses of the volunteers, which are displayed as top and bottom limits. Several responses of the volunteers and the female head–neck model have been examined to validate the model. In the plots showing the responses of the volunteers together with those of the female head–neck model, the displacements of the center of T1 are shown with respect to the sled expressed in the sled frame (see Figure 1 and Figure 10). Similarly, the head C.G. displacements are shown with respect to the sled expressed in the sled frame . The rotational displacements of the head and T1 are shown with respect to the sled around the axis of the sled frame. The point at which the sled acceleration started to increase was designated as time zero. The coordinate systems for the volunteer test (Figure 1) and the model (Figure 3) are not the same. Therefore, using coordinate transformation, the model responses are expressed in the coordinate systems of the volunteer test. In the plots displaying the responses of the volunteers together with those of the female head–neck model, the coordinate systems used in the volunteer test are used as depicted in Figure 1. The corridors (top and bottom limits) for the volunteer responses are established as the average response ± one standard deviation.
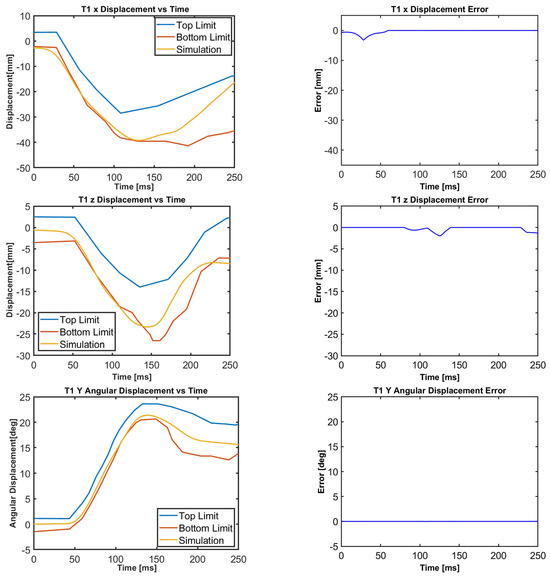
Figure 10.
T1 translational and rotational displacements for all cases.
The motion of the female head–neck model, together with the volunteer response corridors, is displayed in Figure 10, Figure 11, Figure 12, Figure 13, Figure 14 and Figure 15. For all cases, the translational and rotational displacements of T1, as shown in Figure 10, are the same because the T1 motion is specified in terms of accelerations. Next to the volunteer and model responses, the corresponding error graphs are plotted. At each time instant, the error is set to zero if the model (simulation) response falls within the corridors. If the model displacement is lower than that of the volunteer bottom limit, there occurs minus error, which is obtained by subtracting the model displacement from that of the volunteer bottom limit. If the model displacement is higher than that of the volunteer top limit, there occurs plus error, which is obtained by subtracting the model displacement from that of the volunteer top limit.
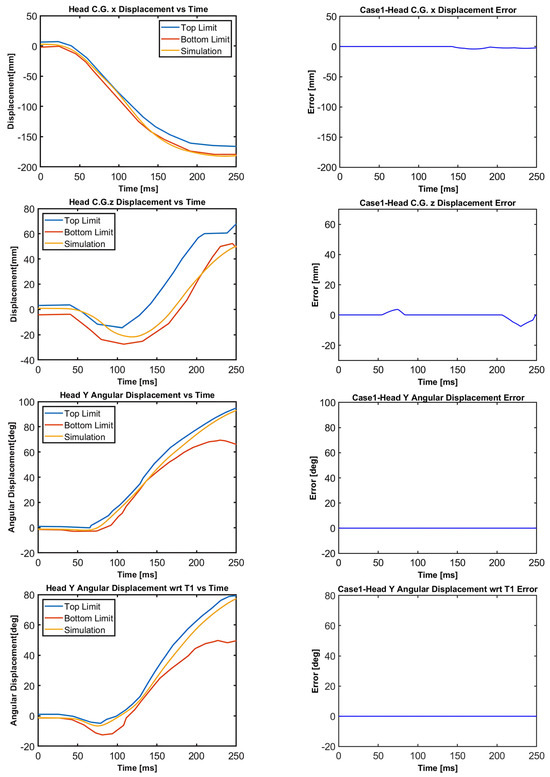
Figure 11.
Case 1: Head C.G. displacements and head rotational displacements.
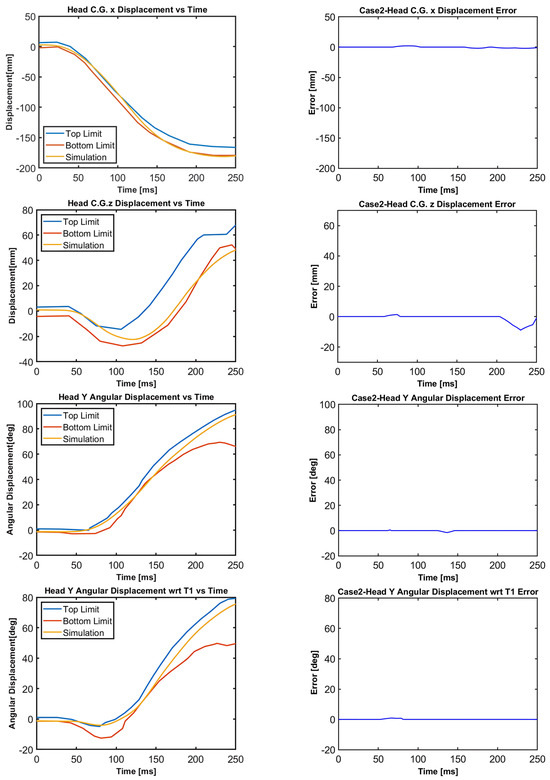
Figure 12.
Case 2: Head C.G. displacements and head rotational displacements.
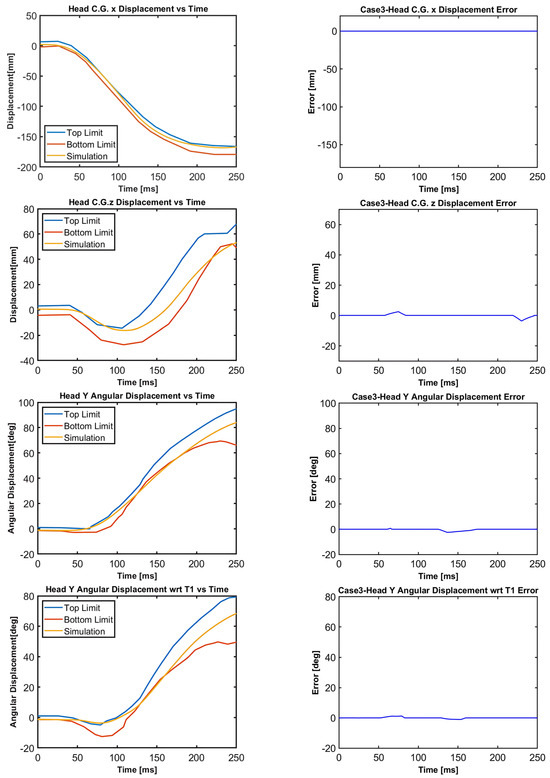
Figure 13.
Case 3: Head C.G. displacements and head rotational displacements.
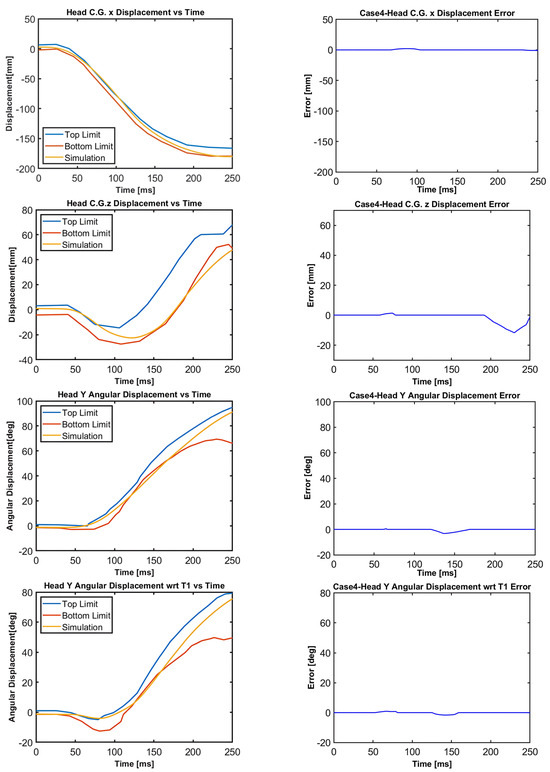
Figure 14.
Case 4: Head C.G. displacements and head rotational displacements.
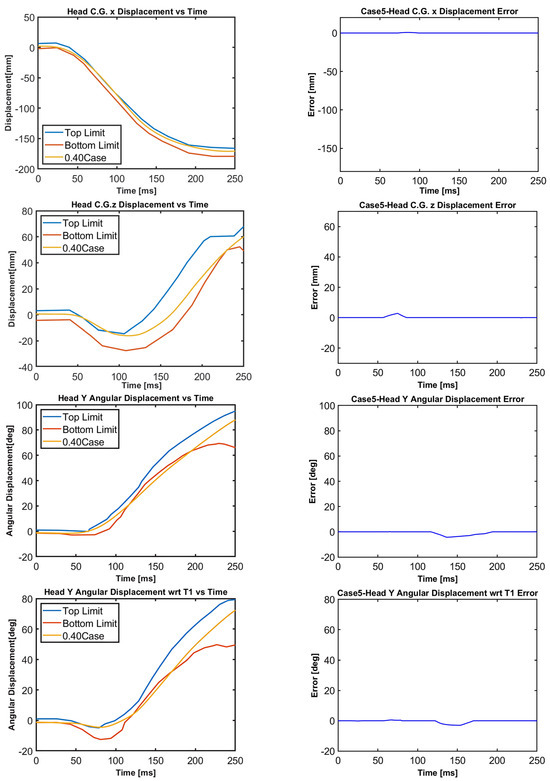
Figure 15.
Case 5: Head C.G. displacements and head rotational displacements.
5. Error Analysis and Validation Metrics
Figure 10, Figure 11, Figure 12, Figure 13, Figure 14 and Figure 15 demonstrate that the model’s responses closely align with the volunteer data, falling within the top and bottom limits (i.e., the corridors) mostly. Figure 10 indicates that the maximum absolute errors in T1 x-displacement, T1 z-displacement, and T1 angular displacement are 3.22 mm, 1.97 mm, and 0.03 deg, respectively. Considering all cases, the maximum absolute errors for head x and z displacements are lower than 1.17 cm, whereas the maximum absolute errors for head angular displacements are lower than 4.30 deg, as shown in Figure 16.
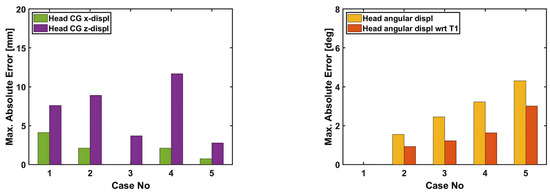
Figure 16.
Maximum absolute errors in the displacements of the head–neck model.
Although in all cases, the head–neck model shows similar biofidelic responses, there are some differences that should be addressed. Cases 3 and 5 provide lower errors in head C.G. translation (i.e., x and z displacements) compared to the other cases. On the other hand, errors in head angular displacements increase from Case 1 to Case 5, as depicted in Figure 16. In order to quantify the success rate of each case, two validation metrics (or scores) are formed using the basic principles of statistics and numerical analysis. The first metric is the average Euclidean norm (2-norm) of error denoted by and in (1) and (2) for head translation and head rotation, respectively. The Euclidean norm of the error vectors is divided by to get an average norm of error where is the duration of the simulation, which is 250 ms in this study. In (1), Exi and correspond to the errors in head x and head z displacements at each time instant, respectively, which are plotted in Figure 11, Figure 12, Figure 13, Figure 14 and Figure 15 with a time step of 1 ms. Similarly, in (2), and correspond to the errors in head angular displacement and head angular displacement with respect to T1 at each time instant, respectively.
Figure 17 presents the average Euclidean norm of error for head translation and rotation separately for all cases. The average Euclidean norm of error for head translation is lowest for case 5, whereas case 1 has the lowest average Euclidean norm of error for head rotation. In order to obtain an overall score, another metric is formed, which takes into account both head translation and rotation in a single equation. Since translation and rotation are defined by different variables with different units, their corresponding errors need to be normalized so that they can be added. The suggested metric is the overall normalized score obtained by adding the normalized scores and which are based on translation and rotation, respectively, as expressed in Equations (3)–(6) in the following pages.
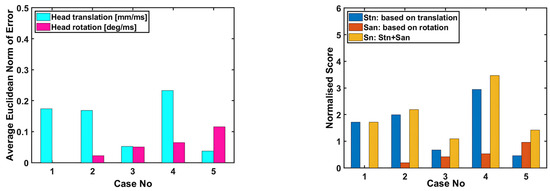
Figure 17.
The applied validation metrics (or scores) for the head–neck model.
Let , , , and be the error vectors for head C.G. x-displacement, head C.G. z-displacement, head angular displacement, and head angular displacement with respect to T1, respectively. These error vectors are plotted in Figure 11, Figure 12, Figure 13, Figure 14 and Figure 15. Next, the mean response curves of the volunteers are determined, which are obtained by taking the average of the top and bottom limits of the volunteer response corridors. Let , , , and be the vectors corresponding to the mean responses of the volunteers for head C.G. x-displacement, head C.G. z-displacement, head angular displacement, and head angular displacement with respect to T1, respectively. The absolute values of these mean response vectors are evaluated, and then their corresponding mean values are calculated, which are used to normalize the error vectors as expressed in (3) and (4). The normalized error vectors are denoted by , , and .
Similar to Equations (1) and (2), the Euclidean norm of the normalized error vectors is calculated for head translation and head rotation as expressed in (5). is the normalized score for head translation, which is equal to the Euclidean norm of the normalized error vectors regarding head translation. is the normalized score for head rotation, which is equal to the Euclidean norm of the normalized error vectors regarding head rotation. The overall normalized score is obtained by adding and as given in (6).
As shown in Figure 17, the normalized score for head translation is the lowest for case 5, whereas the normalized score for head rotation is the lowest for case 1. The lower the normalized score, the higher the success rate is. In terms of the overall normalized score , case 3 has the lowest score, followed by case 5, whereas case 4 has the highest score.
6. Discussions
The 35th percentile female multi-body head–neck model introduced in this study is representative of the three volunteers in terms of mass and stature. The volunteers were 22 and 23 years old. The volunteers’ stature varied between 154 cm and 166 cm, whereas their mass varied between 46 kg and 53 kg. Hence, the stature and mass of the female model in this study are selected to be 160 cm and 50 kg, respectively. The translational and angular displacements of the volunteers were provided in reference [29] in the form of average response ± one standard deviation. The top and bottom limits of volunteer motion correspond to the response corridors of the volunteers, as presented in Figure 10, Figure 11, Figure 12, Figure 13, Figure 14 and Figure 15.
The results indicate that the model responses are in quite good agreement with those of the volunteers in terms of rotational and translational displacements of the head and T1. The shapes of the volunteer response curves agree quite well with the model responses. Five different simulations (cases) are presented, which demonstrate the biofidelic responses of the model in all cases. These five cases are highlights from a series of simulations run during the calibration of the model. Figure 18 presents the motion sequence of the head–neck model for case 4 that obtains the highest normalized score (i.e., relatively lower success rate). In Figure 19, the motion sequence for case 3 is shown in gray color and superimposed on case 4 for comparison. Case 3 gets the lowest normalized score (i.e., relatively higher success rate). Therefore, case 3 represents the most optimum solution at the end of the calibration and validation process.
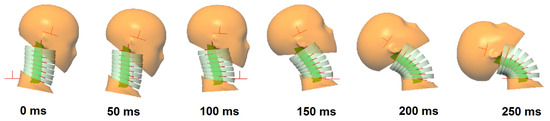
Figure 18.
The motion sequence of the female head–neck model during impact for case 4.
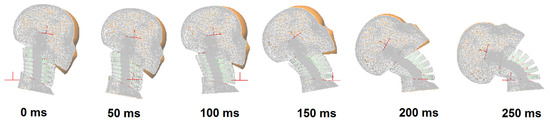
Figure 19.
The motion sequence of the female head–neck model during impact for case 3 superimposed on case 4. The motion sequence for case 3 is displayed in gray color.
There are some limitations, uncertainties, and difficulties during the validation of the model against volunteer data. First of all, the number of volunteers is limited; hence, the volunteer response corridors are very narrow in some phases of the motion. It is not easy to find and persuade female volunteers to participate in these types of impact tests, which involve no head restraint. When there is no head restraint, the motion of the head-and-neck complex can be observed for a larger range of motion; thus, such tests provide valuable data for researchers. The impact severity of these tests is not low, which can potentially lead to neck pain for 2 days [29], considering that the head rotates with respect to the upper torso by an amount of 75 deg from its initial orientation, as shown in Figure 19. Therefore, the number of volunteer impact tests is scarce in the literature due to health and ethical issues. A larger set of volunteers would lead to a model which could simulate the responses of a wider range of populations with similar mass and stature. However, with the modeling and validation approach utilized in this study, the head–neck model can be updated and calibrated again when new volunteer data becomes available.
The individual responses of the volunteers, muscle EMG activities, and the pre-impact velocities of the head–neck system were also not provided in the volunteer data. The amount of pre-impact head–neck flexion, as seen in the picture of one female volunteer, was also not documented. It is clear from daily life experience that the pre-impact velocities of the head–neck system, the initial head–neck flexion, and the corresponding intervertebral angles before the impact are voluntary and variable due to pre-impact volitional control of humans [50]. These factors affect the kinematics observed during the impact phase. Another point is that there exist volunteer responses outside of the response corridors (i.e., top and bottom limits) since the available data only show an average ± one standard deviation of the volunteer responses. It is thought that there is no ideal average volunteer response to define because some parts of the volunteer response can be closer to the top limit, and some parts of the response can be closer to the bottom limit of the corridors. Therefore, it is believed by the authors that biofidelity evaluation should be mostly based on engineering judgment and expert opinion in the end [51,52].
It is a well-known fact that it is quite difficult to successfully validate human-body models (even the most sophisticated ones) against volunteer responses, as documented in the references [46,47,48,49,50,51,52,53]. Considering the published literature [53,54,55,56,57,58,59], the female head–neck model presented in this paper shows superior accuracy and highly biofidelic responses. Moreover, since multi-body modeling technique is used, the model is computationally efficient. A typical laptop computer with 4 CPU requires only about 35 s to simulate a 250 ms motion of the developed head–neck model together with its animation.
The model has the capability of mimicking or simulating active muscle response by utilizing damping functions, which can be easily tuned for varying degrees of muscle activation levels once relevant volunteer data is available. This modeling approach has been successfully applied in other studies by Himmetoglu [3,4]. Considering the time-varying damping functions which mimic muscle activity patterns, the model utilizes open-loop control in essence. It should be noted that the presented head–neck model is to be used for dynamic impact applications only.
The rotational stiffness and rotational damping functions embedded into the intervertebral joints are calibrated through a process of fine-tuning during validation by running simulations in series. There are several constraints on building the model and calibrating the system as follows. Firstly, the model must be biofidelic, have correct anthropometry, correct range of motion, and posture; thus, it must mimic the biomechanical impact response of female volunteers. The torque–angle curves in the stiffness function must be monotonic such that it becomes viable to build a physical counterpart of the model in the form of a dummy. Furthermore, the damping functions must be constructed in such a way that they follow realistic EMG signal shapes to mimic muscle activity patterns. Hence, the calibration and validation of the model is not purely a mathematical approach; it requires a true interpretation of human dynamic response to impact. In tuning the model properties, the number of simulations to be run is restricted wisely for computational efficiency based on engineering judgment and experience of the authors in human motion simulation.
A sensitivity analysis for case 3 is also performed to see the effects of the scale factors used in shaping the torque–angle curve in the stiffness function shown in Figure 5. The results of this sensitivity analysis are presented in Appendix A. The base value of the scale factor is determined as 0.65, which provided biofidelic behavior in the simulations. For scale factors in between 0.55 and 0.75, the model behavior is robust without showing significant differences in the responses in comparison to the responses with a scale factor of 0.65. When the scale factor is lowered to 0.40 and raised to 0.90, there are appreciable differences in the responses, as shown in Figure A1 in Appendix A. It can be seen that the scale factor used in shaping the torque–angle curves is not the main factor in the responses of the model because the torque–angle curves simulate the quasi-static response of the neck only without muscle activation. Therefore, muscle activation plays a predominant role in the impact response of the head–neck. Muscle activation, which is mimicked by the damping function, is the key to obtaining biofidelic behavior of the model and limit head–neck rotation.
The head–neck model works in the sagittal plane only in the same way as the BioRID II dummy, which is the rear impact dummy used in regulatory tests, consumer tests (such as EuroNCAP), and product development tests [60,61]. Therefore, the female head–neck model introduced in this study can be used in the development of a physical 35th percentile female dummy for rear impact tests. According to accident data [62], low-speed single rear impacts with 50% to 100% overlap represent the most typical rear-end collision scenario; thus, the predominant motion of the head–neck occurs in the sagittal plane. That is why rear impact crash pulses are typically applied only in the longitudinal direction in the development and testing of seats, which leads to the motion of the dummies in the sagittal plane [61].
In the future, the presented head–neck model can be used to develop a full 35th percentile female multi-body human model, which can utilized to investigate whiplash risk in females and aid in the design of adaptive restraint systems for females. This type of model is valuable not only for designing protective systems but also for improving injury criteria for females. As a future work, the presented female head–neck model can be further developed to simulate frontal, lateral, and oblique impacts. This would necessitate the modification of intervertebral joints, whose mechanical properties need to be calibrated with the aid of female volunteer data. The literature unfortunately lacks female volunteer data for different impact directions.
7. Conclusions
The presented 35th percentile female multi-body head–neck model is the first female multi-body model of this size to the best of the author’s knowledge. Although matching volunteer responses with those of the human-body and dummy models is very difficult, as documented by many published papers in the literature, the developed model’s responses confirm its accuracy and ability to generate biofidelic behavior. When compared to current models and dummies, the overall performance of the developed model is superior, considering that the model is only an approximation of a real human. The applied method is straightforward, efficient in terms of computing, and effective. Since the model is both efficient and simple; it can be easily calibrated and tuned to match human response with different muscle activation levels. The model is a practical tool to accelerate the development of seat and head restraint systems for the protection of females.
Author Contributions
Conceptualization, F.N.Ş. and S.H.; methodology, F.N.Ş. and S.H.; software, F.N.Ş. and S.H.; validation, F.N.Ş. and S.H.; formal analysis, F.N.Ş. and S.H.; investigation, F.N.Ş. and S.H.; resources, F.N.Ş. and S.H.; data curation, F.N.Ş. and S.H.; writing—original draft preparation, F.N.Ş. and S.H.; writing—review and editing, F.N.Ş. and S.H.; visualization, F.N.Ş. and S.H.; supervision, S.H.; project administration, S.H.; funding acquisition, F.N.Ş. and S.H. All authors have read and agreed to the published version of the manuscript.
Funding
This research received no external funding.
Institutional Review Board Statement
Not applicable.
Informed Consent Statement
Not applicable.
Data Availability Statement
The data presented in this study are available in the article.
Acknowledgments
The authors thank Oğul Can Üçbaş for his efforts in processing the geometry of the 35th percentile female head.
Conflicts of Interest
The authors declare no conflicts of interest.
Appendix A
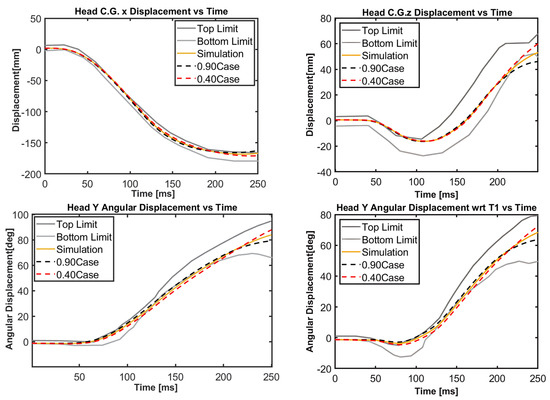
Figure A1.
Sensitivity analysis for case 3 with scale factors 0.40 and 0.90 for the stiffness function. The simulation curve corresponds to the scale factor of 0.65.
References
- Freeman, M.D.; Leith, W.M. Estimating the number of traffic crash-related cervical spine injuries in the United States; An analysis and comparison of national crash and hospital data. Accid. Anal. Prev. 2020, 142, 105571. [Google Scholar] [CrossRef] [PubMed]
- van Lopik, D.W.; Acar, M. Development of a multi-body computational model of human head and neck. Proc. Inst. Mech. Eng. Part K J. Multi-Body Dyn. 2007, 221, 175–197. [Google Scholar] [CrossRef]
- Himmetoglu, S.; Acar, M.; Taylor, A.J.; Bouazza-Marouf, K. A multi-body head-and-neck model for simulation of rear impact in cars. Proc. Inst. Mech. Eng. Part D J. Automob. Eng. 2007, 221, 527–541. [Google Scholar] [CrossRef]
- Himmetoglu, S.; Balci, T.; Aydogan, M. Validation of a Simple Multi-Body Head-and-Neck Model for Efficient Rear Impact Simulations. In Proceedings of the 24th International Scientific Conference. Transport Means 2020, Kaunas, Lithuania, 30 September–2 October 2020; pp. 273–277. [Google Scholar]
- Liang, Z.; Wu, K.; Tian, T.; Mo, F. Human head–neck model and its application thresholds: A narrative review. Int. J. Surg. 2025, 111, 1042–1070. [Google Scholar] [CrossRef]
- Chancey, V.C.; Nightingale, R.W.; Van Ee, C.A.; Knaub, K.E.; Myers, B.S. Improved Estimation of Human Neck Tensile Tolerance: Reducing the range of reported tolerance using anthropometrically correct muscles and optimized physiologic initial conditions. Stapp Car Crash J. 2003, 47, 135–153. [Google Scholar] [CrossRef]
- van der Horst, M.J. Human Head Neck Response in Frontal, Lateral and Rear End Impact Loading: Modelling and Validation. Ph.D. Thesis, Eindhoven University of Technology, Eindhoven, The Netherlands, 2002. [Google Scholar]
- de Jager, M.K.J. Mathematical Head-Neck Models for Acceleration Impacts. Ph.D. Thesis, Eindhoven University of Technology, Eindhoven, The Netherlands, 1996. [Google Scholar]
- Galbusera, F.; Raimondi, M.T.; Assietti, R.; Sassi, M.; Fornari, M. Multibody modeling of the cervical spine in the simulation of flexion-extension after disc arthroplasty. J. Appl. Biomater. Biomech. 2006, 4, 110–119. Available online: https://journals.sagepub.com/doi/10.1177/228080000600400206 (accessed on 7 May 2025).
- Ahn, H.S.; DiAngelo, D.J. Biomechanical testing simulation of a cadaver spine specimen: Development and evaluation study. Spine 2007, 32, E330–E336. [Google Scholar] [CrossRef]
- De Jongh, C.; Basson, A.H.; Scheffer, C. Predictive modelling of cervical disc implant wear. J. Biomech. 2008, 41, 3177–3183. [Google Scholar] [CrossRef]
- Zachary Elijah Huber, B.A. Creation and Evaluation of a Dynamic, EMG-Driven Cervical Spine Model. Master’s Thesis, Ohio State University, Columbus, OH, USA, 2013. [Google Scholar]
- Happee, R.; de Bruijn, E.; Forbes, P.A.; van der Helm, F.C. Dynamic head-neck stabilization and modulation with perturbation bandwidth investigated using a multisegment neuromuscular model. J. Biomech. 2017, 58, 203–211. [Google Scholar] [CrossRef]
- Jakobsson, L.; Norin, H.; Jernström, C.; Svensson, S.-E.; Johnsén, P.; Isaksson-Hellman, I.; Svensson, M.Y. Analysis of different head and neck responses in rear-end car collisions using a new humanlike mathematical model. In Proceedings of the International Research Council on the Biomechanics of Injury conference, Lyon, France, 21–23 September 1994; pp. 109–126. [Google Scholar]
- Van den Kroonenberg, A.; Thunnissen, J.; Wismans, J. A human model for low-severity rear-impacts. In Proceedings of the International Research Council on Biomechanics of Injury, IRCOBI 1997, Hanover, Germany, 24–26 September 1997; pp. 117–132. [Google Scholar]
- Linder, A. A new mathematical neck model for a low-velocity rear-end impact dummy: Evaluation of components influencing head kinematics. Accid. Anal. Prev. 2000, 32, 261–269. [Google Scholar] [CrossRef]
- Carlsson, A.; Linder, A.; Davidsson, J.; Hell, W.; Schick, S.; Svensson, M. Dynamic kinematic responses of female volunteers in rear impacts and comparison to previous male volunteer tests. Traffic Inj. Prev. 2011, 12, 347–357. [Google Scholar] [CrossRef] [PubMed]
- Himmetoglu, S.; Şen, F.N.; Ozer, F.T. Female Modelling and Protection in Road-Traffic Accidents. In Proceedings of the 26th International Scientific Conference. Transport Means 2022, Kaunas, Lithuania, 5–7 October 2022; pp. 308–313. [Google Scholar]
- Abrams, M.Z.; Cameron, R. Female vs. Male Relative Fatality Risk in Fatal Crashes. In Proceedings of the International Research Council on the Biomechanics of Injury, IRCOBI 2020, Munich, Germany, 8–10 September 2020; pp. 47–85. [Google Scholar]
- Booth, G.R.; Cripton, P.A.; Siegmund, G.P. The lack of sex, age, and anthropometric diversity in neck biomechanical data. Front. Bioeng. Biotechnol. 2021, 9, 684217. [Google Scholar] [CrossRef] [PubMed]
- Harty, J.; Quinlan, J.F.; Kennedy, J.; Walsh, M.; O’Byrne, J. Anthropometrical analysis of cervical spine injuries. Injury 2004, 35, 249–252. [Google Scholar] [CrossRef]
- Carlsson, A.; Chang, F.; Lemmen, P.; Kullgren, A.; Schmitt, K.-U.; Linder, A.; Svensson, M.Y. Anthropometric specifications, development, and evaluation of EvaRID—A 50th percentile female rear impact finite element dummy model. Traffic Inj. Prev. 2014, 15, 855–865. [Google Scholar] [CrossRef]
- Brolin, K.; Östh, J.; Svensson, M.; Sato, F.; Ono, K.; Linder, A.; Kullgren, A. Aiming for an average female virtual human body model for seat performance assessment in rear-end impacts. In Proceedings of the 24th International Technical Conference on the Enhanced Safety of Vehicles (ESV), Gothenburg, Sweden, 8–11 June 2015. [Google Scholar]
- Schneider, L.W.; Robbins, D.H.; Pflig, M.A.; Snyder, R.G. Development of Anthropometrically Based Design Specifications for an Advanced Adult Anthropomorphic Dummy Family; University of Michigan Transportation Research Institute: Ann Arbor, MI, USA, 1983. [Google Scholar]
- Östh, J.; Mendoza-Vazquez, M.; Sato, F.; Svensson, M.Y.; Linder, A.; Brolin, K. A female head–neck model for rear impact simulations. J. Biomech. 2017, 51, 49–56. [Google Scholar] [CrossRef]
- Himmetoglu, S. Integration of Muscle Tone into a Multi-Body Head-and-Neck Model for Crash Applications. In Proceedings of the 26th International Scientific Conference Transport Means, Kaunas, Lithuania, 5–7 October 2022; pp. 27–32. [Google Scholar]
- Linder, A.; Carlsson, A.; Svensson, M.Y.; Siegmund, G.P. Dynamic responses of female and male volunteers in rear impacts. Traffic Inj. Prev. 2008, 9, 592–599. [Google Scholar] [CrossRef]
- Putra, I.P.A. An Average Female Head-Neck Finite Element Model with Reflexive Neck Muscles. Master’s Thesis, Licentiate of Engineering, Department of Mechanics and Maritime Sciences, Chalmers University of Technology, Gothenburg, Sweden, 2020. [Google Scholar]
- Sato, F.; Nakajima, T.; Ono, K.; Svensson, M.; Brolin, K.; Kaneoka, K. Dynamic cervical vertebral motion of female and male volunteers and analysis of its interaction with head/neck/torso behavior during low-speed rear impact. In Proceedings of the International Research Council on Biomechanics of Injury, IRCOBI 2014, Berlin, Germany, 10–12 September 2014; pp. 227–249. [Google Scholar]
- Putra, I.P.A.; Iraeus, J.; Sato, F.; Svensson, M.Y.; Thomson, R. Finite element human body models with active reflexive muscles suitable for sex-based whiplash injury prediction. Front. Bioeng. Biotechnol. 2022, 10, 968939. [Google Scholar] [CrossRef]
- Sato, F.; Holmqwist, K.; Linder, A.; Svensson, M.Y.; Kullgren, A.; Tanabe, J.; Yamazaki, K. Average sized male and female rear impact dummy models in simulations of real world cases addressing sensitivity in whiplash associated disorder assessment. In Proceedings of the International Research Council on the Biomechanics of Injury, Antwerp, Belgium, 13–15 September 2017. [Google Scholar]
- Carlsson, A.; Davidsson, J.; Linder, A.; Svensson, M.Y. Design and Evaluation of the Initial 50th Percentile Female Prototype Rear Impact Dummy, BioRID P50F—Indications for the need of an additional dummy size. Front. Bioeng. Biotechnol. 2021, 9, 687058. [Google Scholar] [CrossRef]
- Karemyr, M.; Pettersson, T.; Svensson, M.; Linder, A. Seat Evaluation Tools (SETs): Development of Prototype Concepts of the SETs of an Average Female and Male for Low Severity Rear Impact Crash Testing; Swedish National Road and Transport Research Institute: Linköping, Sweden, 2022. [Google Scholar]
- Linder, A.; Schick, S.; Hell, W.; Svensson, M.Y.; Carlsson, A.; Lemmen, P.; Schmitt, K.U.; Gutsche, A.; Tomasch, E. ADSEAT—Adaptive seat to reduce neck injuries for female and male occupants. Accid. Anal. Prev. 2013, 60, 334–343. [Google Scholar] [CrossRef]
- Young, J.W.; Chandler, R.F.; Snow, C.C.; Robinette, K.M.; Zehner, G.F.; Loftberg, M.S. Anthropometric and Mass Distribution Characteristics of the Adult Female; Federal Aviation Administration, Civil Aerospace Medical Institute: Oklahoma, OK, USA, 1983; p. 103. [Google Scholar]
- Putra, I.P.A.; Iraeus, J.; Sato, F.; Svensson, M.Y.; Linder, A.; Thomson, R. Optimization of female head–neck model with active reflexive cervical muscles in low severity rear impact collisions. Ann. Biomed. Eng. 2021, 49, 115–128. [Google Scholar] [CrossRef]
- Gordon, C.C.; Walker, R.A.; Tebbetts, I.; McConville, J.T.; Bradtmiller, B.; Clauser, C.E.; Churchill, T. 1988 Anthropometric Survey of U.S. Army Personnel: Methods and Summary Statistics; Anthropology Research Project, Inc.: Yellow Springs, OH, USA, 1989; p. 649. [Google Scholar]
- Klinich, K.D.; Ebert, S.M.; Van Ee, C.A.; Flannagan, C.A.C.; Prasad, M.; Reed, M.P.; Schneider, L.W. Cervical Spine Geometry in the Automotive Seated Posture: Variations with Age, Stature, and Gender. Stapp Car Crash J. 2004, 48, 301–330. [Google Scholar] [CrossRef]
- Pan, F.; Arshad, R.; Zander, T.; Reitmaier, S.; Schroll, A.; Schmidt, H. The effect of age and sex on the cervical range of motion–A systematic review and meta-analysis. J. Biomech. 2018, 75, 13–27. [Google Scholar] [CrossRef] [PubMed]
- Swinkels, R.H.M.; Swinkels-Meewisse, E.J.C.M. Normal values for cervical range of motion. Spine 2014, 39, 362–367. [Google Scholar] [CrossRef]
- SAE J211-1; Instrumentation for Impact Test, Part 1. Electronic Instrumentation. Society of Automotive Engineers (SAE): Warrendale, PA, USA, 1995.
- Ono, K.; Kaneoka, K.; Wittek, A.; Kajzer, J. Cervical injury mechanism based on the analysis of human cervical vertebral motion and head-neck-torso kinematics during low speed rear impacts. SAE Trans. 1997, 106, 3859–3876. [Google Scholar]
- Fice, J.B.; Mang, D.W.; Ólafsdóttir, J.M.; Brolin, K.; Cripton, P.A.; Blouin, J.-S.; Siegmund, G.P. Neck muscle and head/neck kinematic responses while bracing against the steering wheel during front and rear impacts. Ann. Biomed. Eng. 2021, 49, 1069–1082. [Google Scholar] [CrossRef]
- Boudreau, S.A.; Falla, D. Chronic neck pain alters muscle activation patterns to sudden movements. Exp. Brain Res. 2014, 232, 2011–2020. [Google Scholar] [CrossRef]
- Siegmund, G.P.; Sanderson, D.J.; Inglis, J.T. Gradation of neck muscle responses and head/neck kinematics to acceleration and speed change in rear-end collisions. Stapp Car Crash J. 2004, 48, 389. [Google Scholar] [CrossRef]
- Han, J.; Lee, J.; Lim, D. Alterations of Muscle Activation and Moment Characteristics at Neck Joint Due to Brake Force Applied to Stationary Lead Vehicle in Low-speed, Rear-End Collision. In Proceedings of the International Research Council on Biomechanics of Injury, IRCOBI 2016, Malaga, Spain, 14–16 September 2016; pp. 286–287. [Google Scholar]
- Fice, J.B.; Mang, D.W.; Ólafsdóttir, J.M.; Brolin, K.; Cripton, P.A.; Blouin, J.-S.; Siegmund, G.P. Head/Neck Kinematics and Muscle Responses for Relaxed Drivers and Passengers in Frontal and Rear Impacts. In Proceedings of the International Research Council on Biomechanics of Injury, IRCOBI 2019, Florence, Italy, 11–13 September 2019; pp. 121–122. [Google Scholar]
- Ejima, S.; Zama, Y.; Satou, F.; Holcombe, S.; Ono, K.; Kaneoka, K.; Shiina, I. Prediction of the physical motion of the human body based on muscle activity during pre-impact braking. In Proceedings of the International Research Council on Biomechanics of Injury, IRCOBI 2008, Bern, Switzerland, 17–19 September 2008; pp. 163–175. [Google Scholar]
- Kingma, H.; Patijn, J.; de Jong, I.; Slangen, R.; Gosens, H.; Stevens, J.; Dekker, A.; Lansbergen, M.; vd Horst, M.; Wismans, J. Impact of muscle contraction upon head stabilisation during forward acceleration. Int. Musculoskelet. Med. 2009, 31, 101–114. [Google Scholar] [CrossRef]
- Larsson, E.; Iraeus, J.; Davidsson, J. Investigating sources for variability in volunteer kinematics in a braking maneuver, a sensitivity analysis with an active human body model. Front. Bioeng. Biotechnol. 2023, 11, 1–16. [Google Scholar] [CrossRef]
- Schwer, L.E. Validation metrics for response histories: Perspectives and case studies. Eng. Comput. 2007, 23, 295–309. [Google Scholar] [CrossRef]
- Parent, D.; Craig, M.; Moorhouse, K. Biofidelity Evaluation of the THOR and Hybrid III 50th Percentile Male Frontal Impact Anthropomorphic Test Devices. Stapp Car Crash J. 2017, 61, 227–276. [Google Scholar] [CrossRef] [PubMed]
- Putra, I.P.A.; Iraeus, J.; Thomson, R.; Svensson, M.Y.; Linder, A.; Sato, F. Comparison of control strategies for the cervical muscles of an average female head-neck finite element model. Traffic Inj. Prev. 2019, 20, S116–S122. [Google Scholar] [CrossRef] [PubMed]
- Devane, K.; Johnson, D.; Gayzik, F.S. Validation of a simplified human body model in relaxed and braced conditions in low-speed frontal sled tests. Traffic Inj. Prev. 2019, 20, 832–837. [Google Scholar] [CrossRef] [PubMed]
- Schwartz, D.; Guleyupoglu, B.; Koya, B.; Stitzel, J.D.; Gayzik, F.S. Development of a computationally efficient full human body finite element model. Traffic Inj. Prev. 2015, 16, S49–S56. [Google Scholar] [CrossRef]
- Östh, J.; Mendoza-Vazquez, M.; Linder, A.; Svensson, M.Y.; Brolin, K. The VIVA OpenHBM finite element 50th percentile female occupant model: Whole body model development and kinematic validation. In Proceedings of the International Research Council on Biomechanics of Injury, IRCOBI 2017, Antwerp, Belgium, 13–15 September 2017; pp. 443–466. [Google Scholar]
- Devane, K.; Chan, H.; Albert, D.; Kemper, A.; Gayzik, F.S. Implementation and calibration of active small female and average male human body models using low-speed frontal sled tests. Traffic Inj. Prev. 2022, 23, S44–S49. [Google Scholar] [CrossRef]
- Iwamoto, M.; Nakahira, Y.; Kimpara, H. Development and validation of the total human model for safety (THUMS) toward further understanding of occupant injury mechanisms in precrash and during crash. Traffic Inj. Prev. 2015, 16, S36–S48. [Google Scholar] [CrossRef]
- Barker, J.B.; Cronin, D.S. Multilevel validation of a male neck finite element model with active musculature. J. Biomech. Eng. 2021, 143, 011004. [Google Scholar] [CrossRef]
- Davidsson, J.; Ono, K.; Inami, S.; Svensson, M.Y.; Lövsund, P. A Comparison between Volunteer BioRID P3 and Hybrid III Performance in Rear Impacts. In Proceedings of the 1999 IRCOBI Conference, Sitges, Spain, 23–24 September 1999; pp. 165–178. [Google Scholar]
- EuroNCAP. European New Car Assessment Programme–The Dynamic Assessment of Car Seats for Neck Injury Protection Testing Protocol, Version 4.1.1; EuroNCAP: Leuven, Belgium, 2021; 54p. [Google Scholar]
- Eis, V.; Sferco, R.; Fay, P.A. A detailed analysis of the characteristics of European rear impacts. In Proceedings of the 19th International Technical Conference on the Enhanced Safety of Vehicles (ESV), Washington, DC, USA, 6–9 June 2005. [Google Scholar]
Disclaimer/Publisher’s Note: The statements, opinions and data contained in all publications are solely those of the individual author(s) and contributor(s) and not of MDPI and/or the editor(s). MDPI and/or the editor(s) disclaim responsibility for any injury to people or property resulting from any ideas, methods, instructions or products referred to in the content. |
© 2025 by the authors. Licensee MDPI, Basel, Switzerland. This article is an open access article distributed under the terms and conditions of the Creative Commons Attribution (CC BY) license (https://creativecommons.org/licenses/by/4.0/).