Abstract
The iron and steel industry generates large quantities of iron-bearing dust (IBD), contributing to resource inefficiency and environmental concerns. This study investigates heating methods and the use of organic solid waste, specifically waste tire carbon (WTC), as a reductant for the recovery of Fe from sintering machine tail dust (SMTD) and steelmaking gravity dust. The results indicate that the optimal reduction conditions occurred at 1000 °C, with a 2:1 ratio of SMTD to WTC, and 0% O2 holding for 45 min. WTC is the best material, and heating methods affect it limitedly. The leaching behavior of seven metals was measured, showing an increase in the leaching of Ca and Al compared to the raw materials. The study shows that WTC provides a promising alternative reductant for IBD reduction, offering an energy-saving and low-carbon alternative to conventional fossil fuel injections in blast furnaces. The risk of Cr leaching should be paid attention to while enhancing Fe recovery.
1. Introduction
IBD is a solid waste generated during the steel production process. It is produced by collecting particulate emissions from exhaust gases through dry dust collectors. Depending on the point of origin, it can be classified into various types, such as feedstock dust, hot gravity dust, and furnace dust [1]. The TFe content in it is relatively high, ranging from 30% to 70%. Additionally, the production yield is significant, accounting for approximately 10% of crude steel output [2]. Based on China’s crude steel production of 1.029 billion tons in 2023, the annual generation of IBD exceeds 100 million tons, with an estimated recoverable iron content of 30 to 70 million tons. This represents economic benefits worth billions. Besides its high TFe content, IBD also contains hazardous elements such as Cr and Pb, typically present in the form of oxides or sulfides. If not treated promptly, the large-scale accumulation of it poses significant environmental risks, including occupying valuable space, generating fugitive dust, and causing the leaching of harmful elements, all of which can result in severe environmental pollution.
The treatment of IBD aims primarily at removing harmful elements and extracting valuable metals. The treatment methods can be divided into three types: physical methods, hydrometallurgical methods, and pyrometallurgical methods. Physical methods use magnetic separation or mechanical separation to sort different elements such as Fe, Zn, and C [3]. However, the treatment efficiency is relatively low [4]. Hydrometallurgical methods mainly target dust with a high Zn content, using acidic or alkaline leaching agents to extract Zn, with a relatively low utilization efficiency for Fe [2]. Pyrometallurgical methods involve directly processing the raw material or pelletizing it before placing it in furnaces such as blast furnaces, converters, or rotary kilns. Under high temperature and the action of reducing agents, valuable elements are reduced. This method is widely used due to its broad applicability to raw materials and high metal recovery rates [2].
In pyrometallurgical reduction, reaction temperature and duration are the most critical factors influencing metal recovery efficiency. Experimental results vary widely across studies. For example, Wang S. et al. achieved an Mn reduction rate of 96.8% using corn straw to reduce soft manganese ore at 600 °C for 90 min [5]. Zhou, T. et al. reached 95.26% Fe reduction using hydrogen on high-purity iron concentrate at 575 °C for 60 min [6], with both demonstrating high efficiency at relatively low temperatures. In contrast, Zheng H. et al. recovered 86% Cu from copper slag using rubber seed oil at 1350 °C within 4 min, indicating high efficiency at high temperature over a short duration [7]. Wei R. et al. studied the temperature characteristics of hydrogen and the carbon reduction of iron oxide with three biomass types, identifying 806–822 K as the characteristic temperature for gas-based reduction and 1116–1132 K for carbon reduction [8].
In the selection of furnace types, the blast furnace has a relatively higher furnace start-up rate in domestic enterprises, at 73.44%, and does not require the pelletizing step for charging materials as in the case of the converter [9]. There has been extensive research on the reduction of IBD in blast furnaces. Researchers typically use vertical furnaces to simulate blast furnaces and study the effects of reduction temperature, time, types of reducing agents, and their mixing ratios on the iron reduction rate.
However, air or oxygen is injected into blast furnaces to maintain temperature, with the oxygen content ranging from 21% (air) to 100% (pure oxygen), though the average O2 level inside the furnace remains below 10%. Increasing O2 content enhances fuel utilization. Industrial data from a modified blast furnace by Chaofeng Y. shows that raising the enrichment level from 2.24% to 3.75% reduced the energy consumption per ton of pig iron by 2.85% [10]. However, further research beyond numerical simulation is needed to clarify how the oxygen content affects ore reduction [11,12]. Additionally, microwave heating, a new heating method following traditional electric heating, can enhance the reduction of Fe through the interaction between the H-field and Fe3O4 [13].
Using WTC as a reductant instead of fossil fuels to recover valuable Fe from iron-rich dust presents considerable economic and environmental benefits. In the context of vehicle electrification and scrappage reforms, China produces over 10 million tons of WT annually, ranking first globally. Like IBD, WT represents a critical industrial solid waste. Extensive studies have been conducted on the pyrolysis of WT, showing that the resulting oil can be used as fuel, while its rubber and carbon black components give a resulting char energy content comparable to pulverized coal, with a carbon content above 70%, making it a promising reductant [14,15,16].
Currently, WTC is primarily used in asphalt modification, rubber reinforcement, adsorptive activated carbon, and electrode materials, with limited research on its application as a reductant. Chengkang Y. et al. found that WTC initiates the reduction of iron–zinc dust at 407 °C, doing so earlier and more effectively than coke powder [17].
This study uses SMTD and SGD with a high Fe content as examples and applies WTC derived from waste tires as the reductant to investigates the basic conditions for Fe reduction while considering the environmental benefits of the progressively developed microwave heating method and reduction residue. After determining the optimal iron reduction conditions, different controls, including microwave reduction, WT reduction, and CC reduction, were added. The leaching rates of heavy metals before and after reduction for each group were compared, with the aim of drawing relatively universal conclusions and providing a reference for the green application of IBD.
2. Materials and Methods
2.1. Materials
The two kinds of IBD used in this experiment, separately, were SMTD and SDG, sourced from a steel plant. The three kinds of reductant used in this experiment separately were WT, WTC, and CC. WT was sourced from a recycling facility with 1–3 mm particle size, partially made into WTC. CC was standard commercial coke. All samples were dried, and all except WC were sieved through a 40-mesh screen. Ultimate analysis (C, H, N, and S) of the samples was measured with an elemental analyzer (Thermo Scientific Flash 2000, Waltham, MA, USA), and the chemical composition of the IBD was determined by X-ray fluorescence spectroscopy (XRF) analysis tested by Beijing Chenfei Technologies (Beijing, China), with a titration method tested by Changsha Research Institute of Mining and Metallurgy Co., Ltd. (Changsha, China) to measure the various valence state Fe contents.
As illustrated in Table 1 and Table 2, samples contained few harmful nonmetallic elements (N, S, Cl, P). The C content of CC was the highest among the reductants, ca. 88.53%, while WTC had the lowest, ca. 67.87%. The TFe content in IBD was abundant with varying valence states, and in SDG, iron predominantly existed in the divalent form. ca. 27.88%.

Table 1.
Elemental analysis of raw materials (wt%).
Table 2.
Chemical composition analysis of the IBD (wt%).
X-ray diffraction (XRD) was used in this study to analyze phase changes and the crystallinity of the samples before and after reaction. Measurements were performed using an X’Pert Pro MPD diffractometer (Malvern PANalytical, Malvern, UK) with a voltage of 40 kV, current of 40 mA, scanning range from 10 to 90°, and a scan rate of 8° per minute. The analysis of Figure 1 indicates that iron in SMTD and SGD primarily exists in the forms of Fe2O3 and Fe3O4, with no significant peaks of MFe observed, consistent with the results shown in Table 2. SMGD contains a strongly magnetic spinel phase MgFe2O4 [18], while the iron in SDG is primarily in the form of Fe3O4, with a relatively high Fe²⁺ content, aligning with the 27.88% reported in Table 2. SGD is produced from the basic oxygen steelmaking process, resulting in relatively high contents of FeO and CaO, with CaO primarily existing in the forms of lime, calcite, and dolomite [19,20]. The strongest diffraction peak of free calcium oxide (f-CaO) is observed at 2θ = 38° [21].
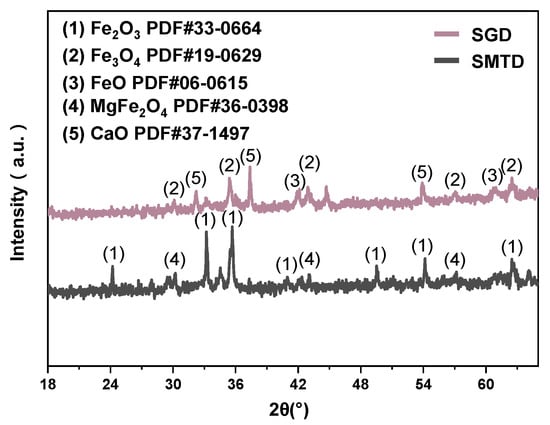
Figure 1.
XRD spectrum of the IBD.
2.2. Experimental Equipment and Methods
The expected blast furnace feed location for the reduction of IBD using organic solid waste is shown in Figure 2a. The high-temperature reduction experiments were conducted in a homemade vertical furnace, as shown in Figure 2b, and a microwave furnace, as shown in Figure 2c. During the experiments in the vertical furnace, the temperature was climbed up to the set temperature (700 °C, 800 °C, 900 °C, 1000 °C, 1100 °C), with the material temperature monitored by a thermocouple (temperature deviation less than 3 °C) under mixed N2 and O2 flow (50 mL/min), and the O2 proportion was adjusted (0%, 2%, 4%, 6%, 8%). A total of 6 g of material was used, comprising a mixture of IBD and reductant in different ratios (1:1, 2:1, 4:1, 9:1, 14:1), and placed in a crucible suspended in the furnace (or preloaded in the furnace and heated at 10 °C/min to the target temperature) for different holding times (15 min, 30 min, 45 min, 60 min, 90 min). The reacted gas was discharged from the bottom of the furnace, condensed with −10 °C anhydrous ethanol, and collected in a gas bag. After the reaction, the system cooled naturally under nitrogen protection. The heating rate under this rapid heating scenario reached 111.5 to 687.1 °C/min. The optimal group was conducted in the microwave furnace as comparation, with the same conditions but placed in a SiC crucible and heated by microwave. The temperature was increased at a rate of 10 °C/min to the target value with less than 1 °C deviation.
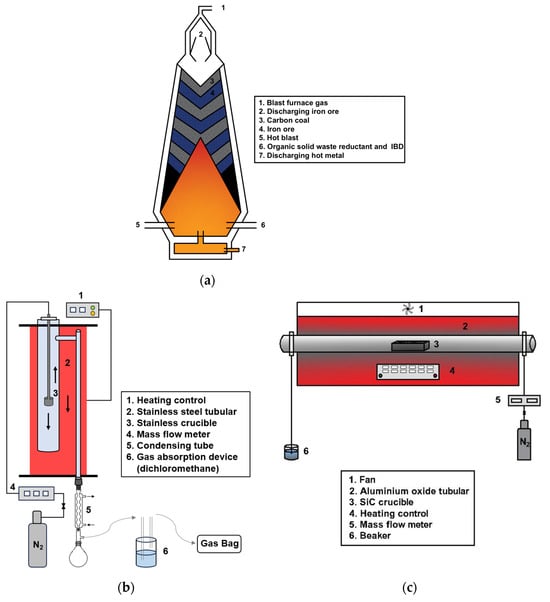
Figure 2.
Material input schematic and experimental instrument: (a) Material input schematic; (b) vertical furnace; (c) microwave furnace.
2.3. Analytical Method
2.3.1. Thermal Analysis
The thermal analysis included TG-DTG experiments and pyrolysis kinetic analysis. The former were conducted using a thermogravimetric analyzer (STA 499F3, Netzsch, Selb, Germany) and a mass spectrometer (Netzsch QMS 403C Aeolos) to reveal the weight loss of samples. Approximately 50 mg of the raw material was placed in an alumina crucible on the reaction platform. The reactor was programmed to ramp from 50 °C to 1100 °C at a rate of 10 °C/min and was held for 20 min with Ar as the background gas at 30 mL/min.
The pyrolysis kinetic analysis was based on the OFW mode [22,23,24]. The reaction order was n = 1. The activation energy Ea and pre-exponential factor A were calculated from the slope and intercept of the fitted line obtained by plotting lnβ against 1000/T.
2.3.2. GC Experiments
The GC experiments were conducted using a GC9790II Plus (Zhejiang Fuli Analytical Instrument Co., Ltd., Taizhou, China) gas chromatograph equipped with a hydrogen flame detector (FID), a thermal conductivity detector (TCD), a 5A molecular sieve, and a Porapak Q column. Based on the different ion numbers and thermal conductivity properties of the various gas components during combustion, the detectors convert the concentration and mass changes in each component gas into electrical signals. The generated chromatographic profile allows for qualitative and quantitative evaluations based on retention time, peak height, and peak area.
2.3.3. TCLP Experiments
The leaching rate of heavy metals in the samples was measured by TCLP. An extraction fluid of acetic acid with a pH value of 2.88 ± 0.05 was prepared in advance. The tests were conducted at a solid/liquid ratio of 1:20 by wight. Batches were placed in a constant temperature shaker at 300 rpm for 18 h. Afterward, it was centrifuged at 4000× g rpm for 30 min, and the supernatant was collected through filtration using a 45 μm water membrane filter into a centrifuge tube. A suitable amount of filtrate was transferred into a digestion tube and heated at a rate of 10 °C/min from 20 °C to 180 °C, maintaining for 30 min. Nitric acid was continuously added until the filtrate became colorless and transparent. After filtration through a 45 μm organic membrane, the sample was diluted for analysis. The leaching concentrations of seven heavy metal elements (Fe, Ca, Mg, Al, Cu, Zn, Cr) in the sample were measured using an Inductively Coupled Plasma Mass Spectrometer (ICP-MS; Optima 7000D, Perkin Elmer, Waltham, MA, USA).
3. Results
3.1. Characteristics of Raw Materials
Through TG-DTG experiments, both types of IBD are relatively stable at high temperatures, showing two-stage weight loss, with only 3–4% total weight loss at 1100 °C. As shown in Figure 3a, for SMTD, the main phase is α-Fe2O3, which can stably exist below 1200 °C [25]. Stage I (50–196.2 °C), with a weight loss of 0.83%, occurs primarily due to the volatilization of SO3 and free water. The S in SMTD can be incorporated into liquid-phase or solid-phase particles, forming stable substances, partly in the form of SO3 [26], and the MgFe2O4 it contains can adsorb some moisture from the environment, with both substances volatilizing at low temperatures. Stage II (569.5–750.5 °C), peaking at 733.5 °C, with a weight loss of 1.81%, is consistent with the decomposition of CaCO3 [27,28]. The peak may not appear in the spectrum due to its content being below the XRD detection limit [29]. For SGD, Stage I (357.9–461.7 °C), with a weight loss of 1.78%, corresponds to the decomposition of a small amount of Ca(OH)2 formed by the absorption of water by CaO [21]. Stage II (571.4–722.1 °C) is essentially consistent with SMTD, with the peak weight loss rate temperature at 672.7 °C and a weight loss of 1.02%. As for the reductant in Figure 3b, WT starts to lose weight at the lowest temperature, beginning at 170.46 °C. This process can be divided into two types: the volatilization of oil content and the subsequent decomposition of the elastomer [30]. This weight loss occurs in three stages: Stage I (170.46–298.60 °C), peaking at 265.39 °C with a total weight loss of 6.58%, corresponds to the volatilization of moisture and light volatile substances [31]. Stage II (298.60–474.92 °C), peaking at 415.94 °C with a cumulative weight loss of 56.72%, corresponds to the decomposition of natural rubber and partial synthetic rubber (SBR cracking and dehydrogenation to form styrene and butadiene monomers) [32,33]. Stage III (474.92–603.49 °C), characterized by two smaller peaks, resulting in a cumulative weight loss of 88.11%, corresponds to the decomposition of synthetic rubbers such as styrene–butadiene rubber and butyl rubber [32]. Due to the incorporation of additives (such as Zn, Fe, Si, S, etc.) during the tire manufacturing process, a residual ash content of approximately 10% is typically observed [34]. Since the yield of carbon and gases from waste tires remains relatively constant at temperatures above 500 °C, and the carbon conversion rate peaks at 600 °C [35], WTC is produced by calcining WT at 600 °C for 30 min. During the formation process of WTC, some pyrolytic tar adheres to the surface, leading to secondary reactions such as tar conversion to carbon during thermal degradation [36,37]. As a result, a 10.0% weight loss is observed between 600 and 1000 °C. The C/H ratio for CC is 79.04, significantly higher than WTC’s 41.90, indicating a greater degree of unsaturation and more complete reactions with a cumulative weight loss of 86.47% [38].
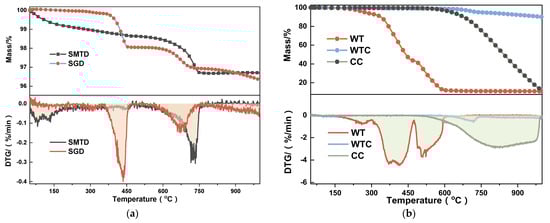
Figure 3.
TG-DTG of raw materials: (a) IBD; (b) reductant.
As shown in Figure 4, neglecting the volatilization of simple components below 200 °C, the correlation coefficients between the fitted curves and the actual calculated values for each reaction stage are generally above 0.96. The R2 value for WTC is above 0.632, which also satisfies the condition that the confidence level for the univariate linear regression is greater than 95% when the number of data points N = 10 [39]. Therefore, assuming a reaction order of n = 1 is feasible.
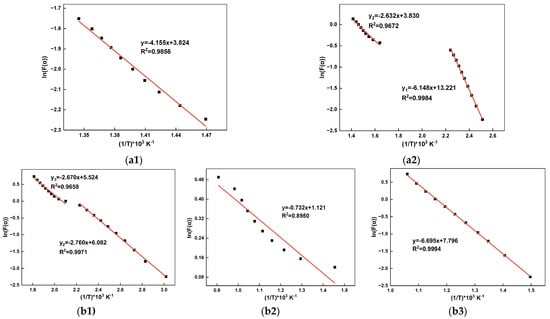
Figure 4.
Kinetic fitting curves of raw materials: (a) IBD: (a1) SMTD, (a2) SGD; (b) reductant: (b1) WT, (b2) WTC, (b3) CC.
The corresponding values of A and Ea for each stage were calculated, with the results shown in Table 3. In this study, the Ea of IBD is relatively smaller than in other literature, which may be attributed to the fact that it has been pretreated and sieved, resulting in a higher fine particle fraction and larger specific surface area [40]. Different WT, due to varying component ratios, may also exhibit different Ea [22]. For WTC, since the reacting substance is surface tar and there are no rate-controlling steps such as diffusion or desorption, the Ea is the smallest [41].
Table 3.
Pyrolysis kinetic parameters of raw materials.
Based on the SEM results, the particle size, shape, and dimensions of the IBD are quite similar, both consisting of irregular block-like particles with lengths under 20 μm. SMTD exhibits more pronounced edges, and as shown in Figure 5(a2), the surface is covered with smaller particles of a uniform size, ranging from 20 to 30 nm, consistent with MgFe2O4 [42]. SGD appears looser in structure with spherical particles of less than 250 nm in diameter, possibly f-CaO, consistent with the results shown in Table 2 and Figure 1.
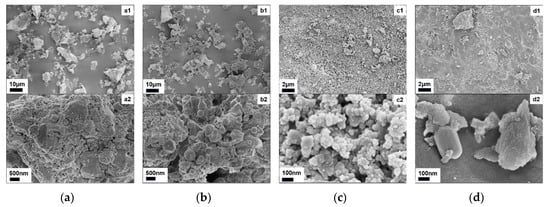
Figure 5.
SEM image of raw materials: (a) SMTD: (a1) ×1k, (a2) ×16k; (b) SGD: (b1) ×1k, (b2) ×16k; (c) WTC: (c1) ×5k, (c2) ×100k; (d) CC: (d1) ×5k, (d2) ×100k.
WTC and CC exhibit similar morphologies, with a relatively uniform distribution and few distinct block-like particles. CC is denser, exhibiting a congealed-like structure. From Figure 5(c2), blocky particles with a width of up to 100 nm and dense surface striations are visible. WTC consists of irregular spherical particles with sizes smaller than 50 nm that aggregate to form clusters, with noticeable gaps extending inward, characteristic of carbon black. This structure corresponds to carbon black, which then adheres to form a more three-dimensional carbon black structure [43].
3.2. Optimal Reaction Conditions for Iron Reduction
Under the same conditions, the reduction pathway of iron oxides with carbon as the temperature increases is as follows: Fe2O3 → Fe3O4 → FeO → MFe [44]. From Figure 6a, it can be seen that when the SMTD /WTC is 1:1, with a protective N2 flow rate of 50 mL/min and a reduction temperature of 700 °C, iron oxide is completely reduced to Fe3O4 after 60 min of reaction. When the reduction temperature is raised to 800 °C, FeO starts to appear. As the temperature increases, the sample is further reduced. At 900 °C, the FeO content increases and is further reduced to MFe, accompanied by the appearance of sulfides such as FeS and ZnS. According to Table 2, the Ca content in SMTD is 11.75%. At this temperature, CaCO3 has already decomposed to form CaO, and above 935 °C, the reaction is represented by Equation (2) [45], consistent with Figure 6(a5), where ZnS is converted to CaS, and the iron phase exists entirely as MFe. The FeS-CaS reaction process is shown in Equations (3)–(5).
ZnS + CaO + C = Zn + CaS + CO
FeO + C = Fe + CO
FeS + CO = Fe + COS
CaO + COS = CaS + CO2
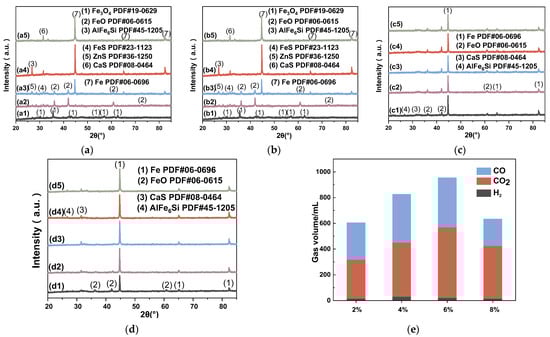
Figure 6.
Reduction of samples under different conditions: (a) XRD spectrum of different temperature: (a1) 700 °C, (a2) 800 °C, (a3) 900 °C, (a4) 1000 °C, (a5) 1100 °C; (b) XRD spectrum of different carbon ratio: (b1) 1:1, (b2) 2:1, (b3) 4:1, (b4) 9:1, (b5) 14:1; (c) XRD spectrum of different oxygen ratio: (c1) 0%, (c2) 2%, (c3) 4%, (c4) 6%, (c5) 8%; (d) XRD spectrum of different reaction time: (d1) 15 min, (d2) 30 min, (d3) 45 min, (d4) 60 min, (d5) 90 min; (e) GC results of different oxygen ratio.
Due to the stability of CaS as a sulfide [46], it remains present even when the reaction temperature increases to 1100 °C. Additionally, the Al0.5Fe3Si0.5 phase (labeled as AlFe6Si) found in the reduction residue belongs to the τ-phase of the Al-Fe-Si ternary system and is Fe-rich. This ternary phase forms during natural cooling following the reduction reaction. Similarly, Guojun M.A. et al. [47] also identified this compound with 52% Fe content during the carbothermal reduction of fly ash. The natural cooling process, categorized as a semi-rapid solidification (cooling rate between 100–103 K/s), produces dispersed AlFe6Si metastable phase particles, which are unstable at high temperatures [48]. Thus, as the reaction temperature increases to 1100 °C, this phase disappears. Considering both the energy loss and Fe reduction efficiency, 1000 °C is identified as the optimal reaction temperature.
From Figure 6b, it can be seen that when the SMTD/WTC is 1:1 and 2:1, there is little difference in material morphology, with MFe primarily present, along with CaS and AlFe6Si. When the mixing ratio is 4:1, unreacted FeO begins to appear. As the ratio increases to 9:1 and 14:1, the FeO phase becomes more pronounced, while the Fe phase weakens. Due to the insufficient amount of C, there is not enough COS to react with MFe, resulting in the disappearance of the CaS and AlFe6Si phases. Considering both the reduction effectiveness and resource usage, 2:1 is identified as the optimal mixing ratio.
As shown in Figure 6c, it is evident that when the O2 content is between 0 and 8%, under the same conditions (reaction temperature 900 °C, reaction time 60 min, mixing ratio 2:1), the XRD patterns of the reaction residues are almost identical, showing no significant differences. The dominant phase is iron, with a small amount of incompletely reduced FeO, accompanied by CaS and AlFe6Si phases. This suggests that a low-O2 environment (<8%) in an operational blast furnace will not significantly affect iron reduction. For large-scale reaction systems, as the O2 content increases, the reducing atmosphere is enhanced. This leads to a decrease in the amount of carbon used in direct reduction reactions, while the carbon combustion rate increases. These two effects counterbalance each other, resulting in a maximum carbon utilization efficiency at an O2 supply rate of 19 Nm3/kg [49]. Additionally, Figure 6e shows that during the redox reaction between SMTD and WTC, the generated gases are primarily CO, CO2, and minor H2. When the O2 content is between 2 and 6%, as the O2 content increases, more carbon participates in the reduction reaction, leading to more CO2 production and an overall increase in the total gas volume. The highest amount of H2 is observed at 4% O2. When the O2 content further increases to 8%, the reducing atmosphere is slightly disrupted, reducing the production of CO and CO2, and thus the total gas volume decreases. However, this phenomenon is not significantly reflected in the XRD patterns. The O2 content (0–8%) does not significantly impact the reduction effectiveness of the iron-bearing dust.
From Figure 6d, it can be seen that under suitable conditions, when the reaction time is 15 min, significant MFe formation is already observed in the reduced residues. When the reaction time is 45 min, the iron phase in SMTD can be almost completely reduced to MFe. A similar study shows that extending the reaction time by 30 min can increase the iron reduction rate by more than 30% [50]. Considering the reduction effectiveness, reduction efficiency, and energy consumption, 45 min is identified as the optimal reaction time.
In summary, the optimal reaction conditions for reducing SMTD with WTC are a temperature of 1000 °C, a mixing ratio of SMTD to WTC of 2:1, 0% O2 content, and a reduction time of 45 min. The reduction process is illustrated in Figure 7.
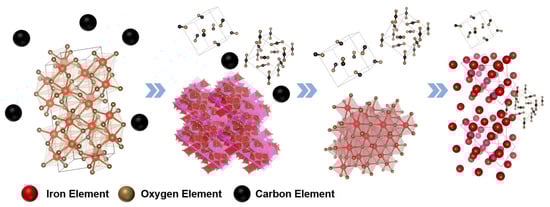
Figure 7.
Schematic diagram of the WTC reduction process of SMTD.
3.3. Comparison of Reduction Methods
The XRD spectrum of the reduction residues obtained under different heating methods shown in Figure 8a indicate that there is little difference in the reduction effects of the heating methods. The degree of reduction in all groups is high, with no iron–oxygen phases detected. The rapid reaction at high temperatures (1000 °C) diminishes the influence of the heating method on the reduction process [51]. From Figure 8b, the raw materials affect the phase composition of the residue. The reduction effects of different reductants vary, with the reduction effect having the following order: WTC > WT > CC. The WTC-reduced residue contains no iron–oxygen phases, which is due to the small weight loss during the pyrolysis of WTC, allowing the remaining carbon to fully participate in the redox reaction with Fe. WT and CC exhibit a weight loss of over 85% during pyrolysis, resulting in incomplete reduction reactions, and the residues contain relatively high amounts of FeO. When IBD is replaced by SDG, the lower Si and Al contents in the SDG lead to the substitution of AlFe6Si in the reduced residue by CaS and CaO. Additionally, several other minor peaks are observed, but the iron phase is fully reduced to MFe, further supporting the reduction effectiveness of WTC.
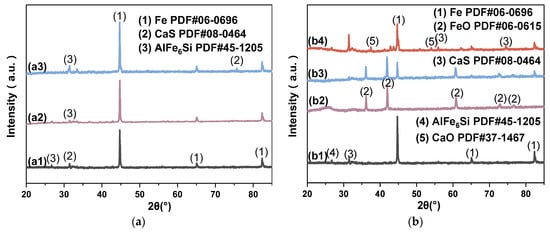
Figure 8.
XRD spectrum of reduced residue in different conditions: (a) Heating methods: (a1) PH, (a2) FH, (a3) MH; (b) different materials: (b1) OO (FH), (b2) CC-A, (b3) WT-A, (b4) SGD-A.
From the SEM images, the metal substances encapsulated in the slag phase can be observed. As shown in Figure 9a–c, the metal appears as spherical particles, which correspond to the MFe formed after reduction [52,53]. The particle size of MFe follows the order MH > FH > PH, with a size difference of approximately 200 nm. The higher heating rate of FH leads to a higher carbon gasification rate, resulting in a looser slag phase. MH exhibits a “lens effect”, which promotes the directional migration of MFe, forming larger metal particles, and this can be seen as significant cavities formed by WTC consumption [54].
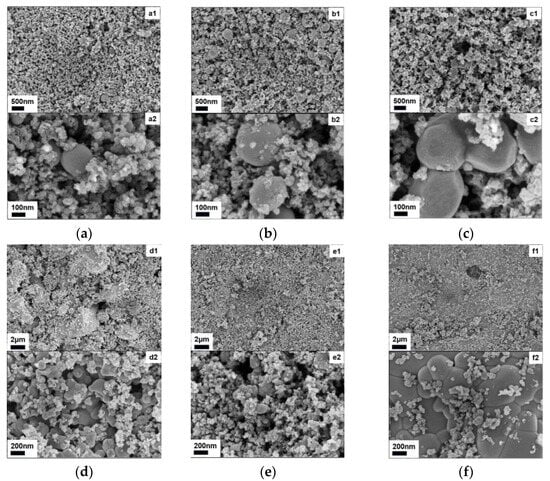
Figure 9.
SEM image of reduced residues in different conditions: (a–c) heating methods: (a) PH: (a1) ×16k, (a2) ×100k; (b) FH: (b1) ×16k, (b2) ×100k; (c) MH: (c1) ×16k, (c2) ×100k; (d–f) different materials: (d) CC-A: (d1) ×5k, (d2) ×50k; (e) SGD-A: (e1) ×5k, (e2) ×50k; (f) WT-A: (f1) ×5k, (f2) ×50k.
In Figure 9d–f, the morphology of the SGD-A reduced residue is similar to that in Figure 9a–c, with the best reduction effect, consistent with the results in Figure 8b. The morphologies of CC-A and WT-A residues are more irregular, indicating the incomplete reduction of wüstite, with the wüstite formed by WT-A being larger. When the metal phase surfaces in Figure 9 are magnified, fine striations can be observed, which are dendritic structures formed during the cooling process [55].
Overall, the reduction process of SMTD using WTC, WT, and CC can be divided into three stages: decomposition, reduction, and cooling. With increasing temperature, SMTD undergoes dehydration and SO3 release, and CaCO3 decomposes to CaO. The three reductants decompose into various hydrocarbons to varying degrees. As the temperature continues to rise, low-melting phases become molten, and solid C along with organic compounds (primarily in WT and CC) begin to reduce Fe3O4 from Fe2O3, accompanied by CO generation. These reductive agents (solid C, CO, and organics) together facilitate further reduction to FeO. At this stage, carbon from WT and CC is largely consumed or volatilized, while WTC retains residual carbon, allowing the further reduction of Fe2⁺ to Mfe. Meanwhile, reactive metals such as Mg and Zn are reduced to their elemental forms, and sufficient reduction may lead to CaS formation. Due to uniform material distribution, Fe phases in the residue are evenly dispersed. During rapid cooling, part of the residue forms AlFe6Si, and dendritic cracks appear in metallic particles. A similar process occurs in the reduction of SGD.
3.4. Leaching of Heavy Metals
The TCLP results are shown in Figure 10, where labels 1 and 2 represent the raw materials and the residues after the reaction, respectively. The effect of different heating methods and raw materials on the leaching levels of various metals varies. The heating method has little effect on the leaching levels of six metals except for Al. After the reduction reaction, the leaching amount of Ca significantly increases, while those of Mg and Zn significantly decrease. The IBD raw materials contain a certain amount of CaCO3, which exhibits lower leachability under acidic conditions compared to CaO [56]. During the high-temperature carbothermal reduction process, CaCO3 partially decomposes into more leachable CaO, leading to an overall increase in Ca leaching from the residue. Notably, the SGD-A1 group, with a higher f-CaO content, showed greater Ca leaching than other materials. Mg and Zn can volatilize in metal form during the carbothermic reduction process [57,58]. A higher reduction degree promotes more complete conversion to their elemental forms, resulting in lower leaching concentrations. Given its higher activity, Mg shows a more pronounced difference in leaching before and after the reaction. For Al, it forms AlFe₆Si with Fe and Si. Since Fe-Al-Si is a negative deviation system with Fe having the largest negative deviation, it can increase the activity of Al [59]. When the reduction reaction is relatively complete and the Mfe content is high, the activity of Al in the multicomponent system approaches that of metallic Al. However, since the temperature is below 1600 °C, most of the aluminum phases remain inert, mainly existing in an amorphous form, which has higher solubility than crystalline phases [60,61]. Consequently, the higher Mfe content in the residue corresponds to increased Al leachability. Figure 10a shows the Al leaching differences before and after reduction and indicates the order of reduction degree as FH > MH > PH. In Figure 10b, the FH2 group, which has the highest Mfe content, exhibits the highest leaching of Al, further confirming this point.
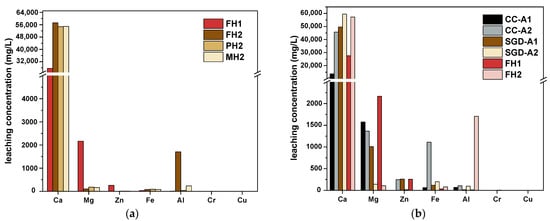
Figure 10.
TCLP leaching level of seven kinds of metals from reduced residues: (a) heating methods; (b) different materials.
The leaching level of MFe is very low, while the leaching amount of FeO increases over time [62]. In Figure 10b, since Fe in CC-A and SGD-A is mostly reduced only to FeO, the Fe leaching amount is higher than that in FH2, with the order being CC-A > SGD-A > FH2, which is inverse to the reduction degree of Fe.
As shown in Table 4, it is worth noting that although the leaching amounts of Cr and Cu in the raw materials are relatively low, their leaching levels in the reduced residues still show a slight increase. Furthermore, the leaching amount of Cr in all experimental groups exceeds the standards [63], with an average post-reduction increase of 117.60%. In contrast, Cu and Zn are within the permissible limits. Therefore, the residues after the reaction still require a further removal of Cr before they can be safely utilized. Given the presence of Al, Si, and Ca in the residue, geopolymerization can be considered after the magnetic separation of Fe. This allows Cr ions to undergo ion exchange with Na⁺ and Ca2⁺, leading to their immobilization [64].
Table 4.
Leaching quantity of Zn, Cr, Cu (mg/L).
4. Discussion
This study employed a custom vertical furnace reactor to closely simulate the high-temperature conditions of a blast furnace. It focused on the influence of varying oxygen concentrations caused by blast air on the reduction efficiency of Fe. The optimal conditions for reducing SMTD using WTC were explored, and the reduction performance of different heating methods and feedstocks was compared. Heavy metal leaching from the residues was also examined to assess potential environmental impacts. The conclusions are as follows:
- 1.
- Reduction conditions: The optimal conditions for reducing Fe to MFe are 1000 °C, with a mass ratio of SMTD to WTC of 2:1, and 0% O2, for a reaction time of 45 min. Under these conditions, the replacement of IBD with SGD ensures that all Fe phases detected by XRD are in the MFe form, without affecting Fe reduction under typical blast furnace oxygen injection rates of 0–8%;
- 2.
- Effects of reductants: The reduction efficiency follows the order: WTC > CC > WT. Although WTC has 20.66% lower carbon content than CC, its higher saturation, smaller TG weight loss, and a surface tar Ea of only 5.79 kJ/mol contribute to a faster reaction rate. Additionally, the carbon black structure is more three-dimensional;
- 3.
- Effects of heating methods: The three heating methods (PH, FH, MH) have little impact on Fe reduction. Among them, the higher heating rate of FH results in a faster carbon gasification rate, making the FH residue more uniformly loose. MH exhibits a more concentrated reaction zone, leading to larger metal particle sizes;
- 4.
- TCLP results: Sufficient carbon thermal reduction significantly suppresses the leaching of Mg and Zn while promoting the leaching of Ca and Al. It also promotes the Cr leaching of 117.60%. The reduced residues require further processing to remove Cr to meet environmental safety standards.
Author Contributions
Conceptualization, F.L. and M.Z.; methodology, M.Z.; formal analysis, M.Z.; investigation, C.L.; resources, F.L.; data curation, M.Z.; writing—original draft preparation, M.Z.; writing—review and editing, M.Z.; supervision, F.L. All authors have read and agreed to the published version of the manuscript.
Funding
This research was supported by the National Natural Science Foundation of China (52376205) and Young Scientific and Technological Talents (Level Two) in Tianjin (QN20230228).
Institutional Review Board Statement
Not applicable.
Informed Consent Statement
Not applicable.
Data Availability Statement
The original contributions presented in this study are included in the article. Further inquiries can be directed to the corresponding author.
Conflicts of Interest
The authors declare no conflicts of interest. The funders had no role in the design of the study; in the collection, analyses, or interpretation of data; in the writing of the manuscript; or in the decision to publish the results.
Abbreviations
The following abbreviations are used in this manuscript:
| SMTD | sintering machine tail dust |
| SGD | steelmaking gravity dust |
| IBD | iron-bearing dust |
| CC | carbon coke |
| WT | waste tire |
| WTC | waste tire carbon |
| TFe | total iron |
| MFe | metallic iron |
| FH | flash heating group |
| PH | programmed heating group |
| MH | microwaved heating group |
| OO | the optimal group |
| CC-A | reduced group using CC as alternative material |
| WT-A | reduced group using WT as alternative material |
| SGD-A | reduced group using SGD as alternative material |
References
- Dianyin, Z.; Huadong, G.; Chun, X. The Principle of Recycled Utilization of Metallurgical Waste Slag. In Recycling and Utilization Technology of Metallurgical Waste Slag, 1st ed.; Kefa, C., Ed.; Chemical Industry Press Co., Ltd.: Beijing, China, 2017; p. 366. [Google Scholar]
- Canbin, L. Exploitation of Composite Binder Used for Cold-Pressed Carbon-Iron-Bearing Dust and Sludge Pellets and Its Mechanism. Master’s Thesis, Anhui University of Technology, Ma’anshan, China, 2022. [Google Scholar]
- Jinxia, Z.; Fusheng, N.; Zhishuai, X. Research on the separation technology of iron, carbon, and zinc from metallurgical iron-bearing dust in the steel industry. Min. Mach. 2014, 42, 97–102. [Google Scholar]
- Shang, H.; Li, H.; Wei, R.; Long, H.; Li, K.; Liu, W. Present situation and prospect of iron and steel dust and sludge utilization technology. Iron Steel 2019, 54, 9–17. [Google Scholar]
- Wang, S.Y.; Zhang, R.L.; Wu, A.J.; Zhang, W.; Yang, R.X.; Gao, Y.F.; Pan, W. Reduction of high-grade pyrolusite by pyrolyzed biomass in vacuum. J. Sustain. Metall. 2024, 10, 2621–2629. [Google Scholar] [CrossRef]
- Zhou, T.; Sun, Y.; Han, Y.; Li, Y. Hydrogen-based fluidization direct reduction of high purity iron concentrate: Experimental optimization and mechanism analysis. Miner. Eng. 2025, 227, 109273. [Google Scholar] [CrossRef]
- Zheng, H.; Li, B.; Zhou, H.; Wei, Y.; Wang, H. Dilution of copper slag under reduction of rubber seed oil. Chin. J. Process Eng. 2019, 19, 589–596. [Google Scholar]
- Wei, R.; Cang, D.; Bai, Y.; Huang, D.; Liu, X. Reduction characteristics of iron oxide by different biomass. J. lron Steel Res. 2020, 32, 186–194. [Google Scholar]
- CEIC. Available online: https://www.ceicdata.com/zh-hans/china/custeel-steel-factory-blast--electric-furnace-operating-rate-and-capacity-utilization-rate/cn-operating-rate-steel-factory-blast-furnace (accessed on 16 April 2025).
- Chaofeng, Y. Study on energy saving effect of oxygen-rich blast furnace. Shanxi Metall. 2024, 47, 199–201. [Google Scholar]
- Zhengming, Y.; Chou, Z.; Zheng, Z. Numerical Simulation of Blast Furnace Gas and Coke Oven Gas Combustion under Different Oxygen Enrichment Conditions. J. Eng. Therm. Energy Power 2022, 37, 84–91. [Google Scholar]
- Zhang, H.J.; Wang, J.S.; An, X.W.; Zuo, X.J.; Xue, Q.G. Reduction behavior of pellet under simulated oxygen blast furnace condition. J. Iron Steel Res. Int. 2015, 22, 115–120. [Google Scholar] [CrossRef]
- Fukushima, J.; Takizawa, H. In situ spectroscopic analysis of the carbothermal reduction process of iron oxides during microwave irradiation. Metals 2018, 8, 49. [Google Scholar] [CrossRef]
- Shengzhen, L.; Jin, Y.; Xiaoman, J.; Wei, L.; Xingmeng, Y. Research progress on the resource utilization of carbon black fromwaste tire pyrolysis. New Chem. Mater. 2024, 52, 231–236. [Google Scholar]
- Long, H.M.; Wei, R.F.; Li, N.; Zhou, D.; Meng, Q.M.; Li, J.X. Disposal of city combustible solid waste by blast furnace. Iron Steel 2018, 53, 1–9. [Google Scholar]
- Pyshyev, S.; Korchak, B.; Miroshnichenko, D.; Lebedev, V.; Yasinska, A.; Lypko, Y. Obtaining new materials from liquid pyrolysis products of used tires for waste valorization. Sustainability 2025, 17, 3919. [Google Scholar] [CrossRef]
- Chengkang, Y.; Chunlong, F.; Hexi, Z.; Xiangyang, X.; Long, D.; Lixin, Q.; Cheng, P.; Hongming, L. Pyrolytic carbon characteristics and iron oxidereduction ability of waste tire. Chin. Metall. 2025, 35, 1–14. [Google Scholar]
- Xue, P.; He, D.; Xu, A.; Yang, Q. Formation of MgFe2O4 and recycling of iron from modified BOF slag by magnetic separation. Iron Steel 2017, 52, 104–110. [Google Scholar]
- Hongyu, H. Study on the Mechanism of Material Metabolism and Emission Inventory of Iron-Containing Dust Sludge in the Process of Resource Extraction. Master’s Thesis, Central South University, Changsha, China, 2023. [Google Scholar]
- Zhiran, L.; Ding, L.; Jinmei, L. Analysis of issues and countermeasures in the recycling and utilization of iron-bearing dust in the steel industry. In Proceedings of the Annual Meeting of Chinese Society for Environmental Sciences, Kunming, China, 1 August 2013. [Google Scholar]
- Ning, S.; Jianghua, L.; Liang, Z. Determination of free calcium oxide in steel slag by thermogravimetry. Phys. Exam. Test. 2019, 37, 25–28. [Google Scholar]
- Xia, Y.; Yu, Y.; Cong, Z.; Shaobo, O.; Jun, W.; Liqing, L. Kinetic and thermodynamic characteristics in scrap tyres pyrolysis process and components analysis of pyrolysis oil. Low-Carbon Chem. Chem. Eng. 2023, 48, 36–45. [Google Scholar]
- Nisar, J.; Ali, G.; Shah, A.; Farooqi, Z.H.; Khan, R.A.; Iqbal, M.; Gul, M. Pyrolysis of waste tire rubber: A comparative kinetic study using different models. Energe Sources Part A 2020, 46, 12710–12720. [Google Scholar] [CrossRef]
- Fawei, L.; Fa, Z.; Jiantao, L.; Yahui, L.; Xuefeng, S.; Chengjun, X.; Wenchen, M.; Guanyi, Chen. Comparing pyrolysis characteristics of Daqing multi-source oil sludge. Chem. Ind. Eng. Prog. 2021, 40, 421–433. [Google Scholar]
- Ovčačíková, H.; Vlček, J.; Klárová, M.; Topinková, M. Metallurgy dusts as a pigment for glazes and engobes. Ceram. Int. 2017, 43, 7789–7796. [Google Scholar] [CrossRef]
- Guoliang, L.; Haiying, L.; Aimin, J. Research on collaborative treatment of fine particles in sintering smoke. Energy Conserv. 2024, 43, 70–72. [Google Scholar]
- Jianfang, W. Study on the Synergistic Cementing Mechanism of CaO/SiO2/Al2O3/CaSO4·2H2O/Fe2O3/MgO Multi-Component Blending and the Co-Blending of Multi-Solid Waste. Ph.D. Dissertation, Shanxi University, Taiyuan, China, 2023. [Google Scholar]
- Danuka, W.W.M.D.; Timo, F.; Mamdouh, O. The reduction reaction behavior of steelmaking dusts with lignin under different atmospheres. Materials 2024, 17, 3106. [Google Scholar] [CrossRef]
- Kontoyannis, C.G. Calcium carbonate phase analysis using XRD and FT-Raman spectroscopy. Analysis 2000, 125, 251–255. [Google Scholar] [CrossRef]
- Edward, L.E.M.; Danny, C.K.K.; Gordon, M. Production of active carbons from waste tires—A review. Carbon 2004, 42, 2789–2805. [Google Scholar]
- Chen, G.; Sun, B.; Li, J.; Lin, F.; Xiang, L.; Yan, B. Products distribution and pollutants releasing characteristics during pyrolysis of waste tires under different thermal process. J. Hazard. Mater. 2022, 424, 127351. [Google Scholar] [CrossRef] [PubMed]
- Miao, L. Experimental Study on Migration Characteristics of Nitrogen, Sulfur and Chlorine During Pyrolysis of Waste Tire. Master’s Thesis, Tianjin University, Tianjin, China, 2020. [Google Scholar]
- Menares, T.; Herrera, J.; Romero, R.; Osorio, P.; Arteaga-Pérez, L.E. Waste tires pyrolysis kinetics and reaction mechanisms explained by TGA and Py-GC/MS under kinetically-controlled regime. Waste Manag. 2020, 102, 21–29. [Google Scholar] [CrossRef]
- Dan, P.; Siguang, H.; Guanming, Z.; Tao, Y.; Wenzheng, M.; Shulian, L.; Shaoming, F.; Shide, W. Research progress on recycle utilization of pyrolytic carbon from waste tires. J. Light Ind. 2022, 37, 119–126. [Google Scholar]
- Einara, B.M.; Daniel, T.P.; João, A.D.C. Energetic valorization of waste tires. Renew. Sustain. Energy Rev. 2017, 68, 306–315. [Google Scholar]
- Pingan, H. Study on Preparation of Carbon Black by Pyrolysis of Waste Tire and Ball Milling Modification. Mater’s Thesis, Zhejiang University, Xiamen, China, 2022. [Google Scholar]
- Martínez, J.D.; Murillo, R.; García, T.; Arauzo, I. Thermodynamic analysis for syngas production from volatiles released in waste tire pyrolysis. Energy Convers. Manag. 2014, 81, 338–353. [Google Scholar] [CrossRef]
- Boyu, Q. Kinetic Analysis of Waste Tire Pyrolysis. Mater’s Thesis, Dalian University of Technology, Dalian, China, 2021. [Google Scholar]
- Minbo, C. Misunderstanding about the correlation coefficient R in statistical data processing. Chemistry 2011, 74, 387–395. [Google Scholar]
- Haiyang, W.; Jianlaing, Z.; Guangwei, W. Feasibility research of injection of BF dust into melter gasifier of COREX. Iron Steel 2017, 52, 29–34. [Google Scholar]
- Baetzold, R.C.; Somorjai, G.A. Preexponential factors in surface reactions. J. Catal. 1976, 45, 94–105. [Google Scholar] [CrossRef]
- Xuesong, W.; Jiaqin, Y.; Xiaoxi, W.; Lemei, Y.; Bing, H. Preparation of nano-MgFe2O4 by microemulsion-precipitation method and its characterization. Bull. Chin. Ceram. Soc. 2001, 3, 58–61. [Google Scholar]
- Zengbin, W. Study on Characteristics and Adsorption Performance of Non-Activated Tire-Based Pyrolytic Char. Mater’s Thesis, Suzhou University of Science and Technology, Suzhou, China, 2014. [Google Scholar]
- Jin, J. Kinetics and Mechanisms of Coke and Iron Ore on the Coupling Reaction and Their Evaluating Indexes. Ph.D. Dissertation, University of Science and Technology Liaoning, Anshan, China, 2023. [Google Scholar]
- Changwei, L.; Jikun, W. Direct reduction of zinc sulfide concentrate for zinc volatilization. Nonferrous Met. 1995, 4, 5–6+4. [Google Scholar]
- En, T. Fundamental Research to Obtain Nugget Iron from Iron-Bearing Solid Waste Through Rotary Hearth Furnace. Ph.D. Dissertation, Wuhan University of Science and Technology, Wuhan, China, 2019. [Google Scholar]
- Guojun, M.; Yibiao, J.; Dabin, Y. Production of Si-Al-Fe alloy with carbothermal reduction of coal fly ash. Adv. Mater. Res. 2011, 1335, 1808–1811. [Google Scholar]
- Yanhua, Z. Study on Phases Formation and Crystallization Kinetics of Non-Equilibrium Solidified Alloys. Ph.D. Dissertation, Tianjin University, Tianjin, China, 2008. [Google Scholar]
- Liu, L.; Kuang, S.; Guo, B.; Yu, A. Optimization of ironmaking blast furnace operations using an integrated mathematical model. Chem. Ing. Tech. 2022, 95, 219–233. [Google Scholar] [CrossRef]
- Zhucheng, H.; Jianjia, H.; Yixin, L.; Yang, S. Study on direct reduction of iron concentrate by biomass. J. Cent. South Univ. 2023, 54, 1230–1239. [Google Scholar]
- Hammam, A.; Li, Y.; Nie, H.; Zan, L.; Ding, W.; Ge, Y.; Li, M.; Omran, M.; Yu, Y. Isothermal and non-isothermal reduction behaviors of iron ore compacts in pure hydrogen atmosphere and kinetic analysis. Mining Metall. Explor. 2021, 38, 81–93. [Google Scholar] [CrossRef]
- Xiaoming, L.; Yi, L.; Xiangdong, X. Particle growth characteristics of metallic iron in direct coal-based reduction of nickel slag. Iron Steel 2020, 55, 104–109. [Google Scholar]
- Sun, Y.S.; Han, Y.X.; Gao, P.; Wang, Z.H.; Ren, D.Z. Recovery of iron from high phosphorus oolitic iron ore using coal-based reduction followed by magnetic separation. Int. J. Min. Met. Mater. 2013, 20, 411–419. [Google Scholar] [CrossRef]
- Ye, Q.; Peng, Z.; Li, G.; Lee, J.; Liu, Y.; Liu, M.; Wang, L.; Rao, M.; Zhang, Y.; Jiang, T. Microwave-assisted reduction of electric arc furnace dust with biochar: An examination of transition of heating mechanism. ACS Sustain. Chem. Eng. 2019, 7, 9515–9524. [Google Scholar] [CrossRef]
- Liyong, X. Kinetics Study on Decomposition and Reduction Behavior of In-Flight Fine Iron Ore Particles. Ph.D. Dissertation, Northeastern University, Shenyang, China, 2020. [Google Scholar]
- Mahedi, M.; Cetin, B. Carbonation based leaching assessment of recycled concrete aggregates. Chemosphere 2020, 250, 126307. [Google Scholar] [CrossRef] [PubMed]
- Zhaoming, L.; Jinping, F. Volatilization behavior and microstructure properties of Mg, Zn in AZ31 during vacuum melt. J. North Univ. China Nat. Sci. Ed. 2007, 05, 462–466. [Google Scholar]
- Zhiwei, M. Zinc Leach Residue Treated by Carbothermal Reduction and High Value Utilization of ZnO Smoke. Master’s Thesis, Lanzhou University of Technology, Lanzhou, China, 2020. [Google Scholar]
- Xixian, W. Activity calculation of each component in Al Si Fe ternary system. Chin. J. Nonferrous Met. 1999, 3, 627–630. [Google Scholar]
- Qirun, Y.; Bengen, G.; Yongchun, Z.; Junying, Z. Carbothermal reduction of Si-Al-Fe-Ca quaternary system in a high-silica coal. J. Fuel Chem. Technol. 2017, 45, 1296–1302. [Google Scholar]
- Habibi, H.; Piruzian, D.; Shakibania, S.; Pourkarimi, Z.; Mokmeli, M. The effect of carbothermal reduction on the physical and chemical separation of the red mud components. Miner. Eng. 2021, 173, 107–216. [Google Scholar] [CrossRef]
- Hou, X.; Shi, Y.; Wang, X.; Tang, Y.; Wu, M.; Zhan, H. Selective leaching of inert mineral product and the RO phase in steel slag with acetum to improve total Fe content. Materials 2022, 15, 1242. [Google Scholar] [CrossRef]
- GB 5058.3-2007; Identification Standards for Hazardous Wastes. Chinese Academy of Environmental Sciences: Beijing, China, 2007. Available online: https://www.mee.gov.cn/ywgz/fgbz/bz/bzwb/gthw/wxfwjbffbz/200705/W020120104532752182600.pdf (accessed on 16 April 2025).
- Shuai, C. Study on the Preparation of Oily Sludge-Based Geopolymerand Solidification/Stabilization of Cd2+, Cu2+ and Cr3+. Master’s Thesis, Anhui University of Technology, Ma’anshan, China, 2023. [Google Scholar]
Disclaimer/Publisher’s Note: The statements, opinions and data contained in all publications are solely those of the individual author(s) and contributor(s) and not of MDPI and/or the editor(s). MDPI and/or the editor(s) disclaim responsibility for any injury to people or property resulting from any ideas, methods, instructions or products referred to in the content. |
© 2025 by the authors. Licensee MDPI, Basel, Switzerland. This article is an open access article distributed under the terms and conditions of the Creative Commons Attribution (CC BY) license (https://creativecommons.org/licenses/by/4.0/).