
A Novel Overload Control Algorithm for Distributed Control Systems to Enhance Reliability in Industrial Automation †

Abstract
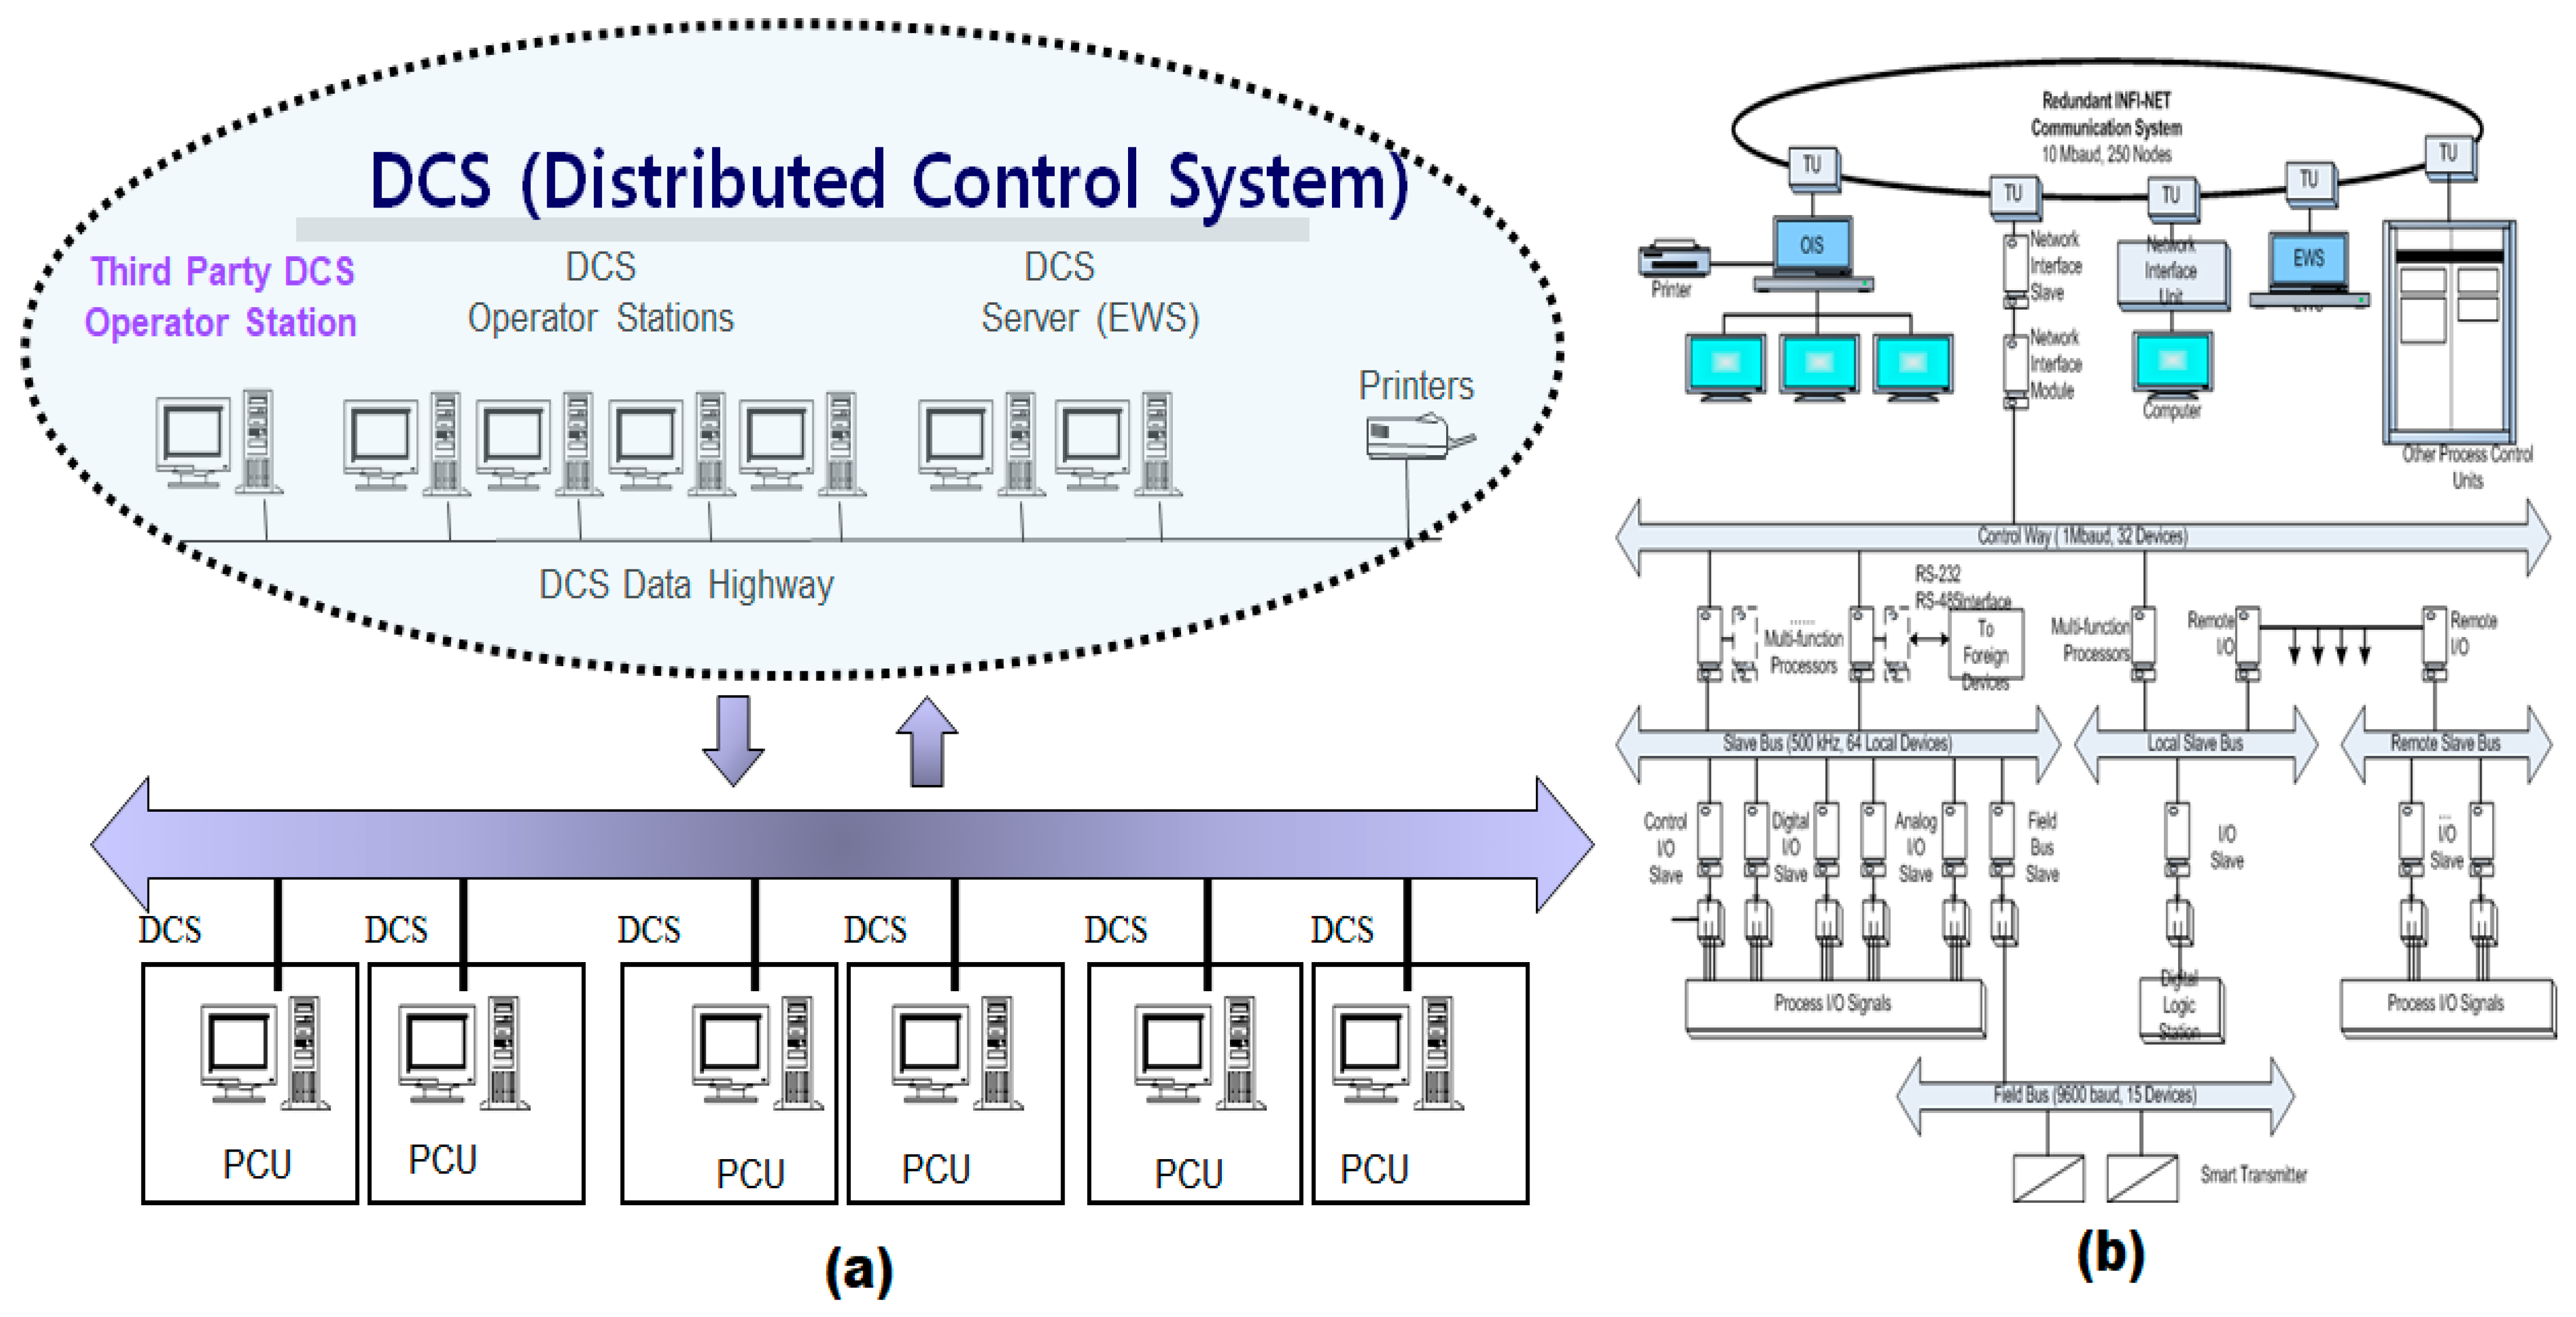
1. Introduction
- i.
- Proposal of a real-time overload detection and mitigation algorithm that enhances the stability and reliability of DCS.
- ii.
- Introduction of a modular, multi-functional logic processor (MFP) to improve fault tolerance and load balancing and ensure optimal resource utilization while maintaining operational efficiency.
- iii.
- Application of the proposed overload detection algorithm and MFP to a real-world denitrification process in a thermoelectric power plant.
- iv.
- Simulations and empirical testing to demonstrate the superiority of the proposed approach over traditional overload control mechanisms.
2. New Logic Processor Design
2.1. Hardware Characteristics
2.2. Software Characteristics
3. Proposed Overload Control Algorithm
4. Optimal Utilization
5. Topology and Overload Detection
5.1. Proposed Protocol
5.2. Overload Detection Results
- i.
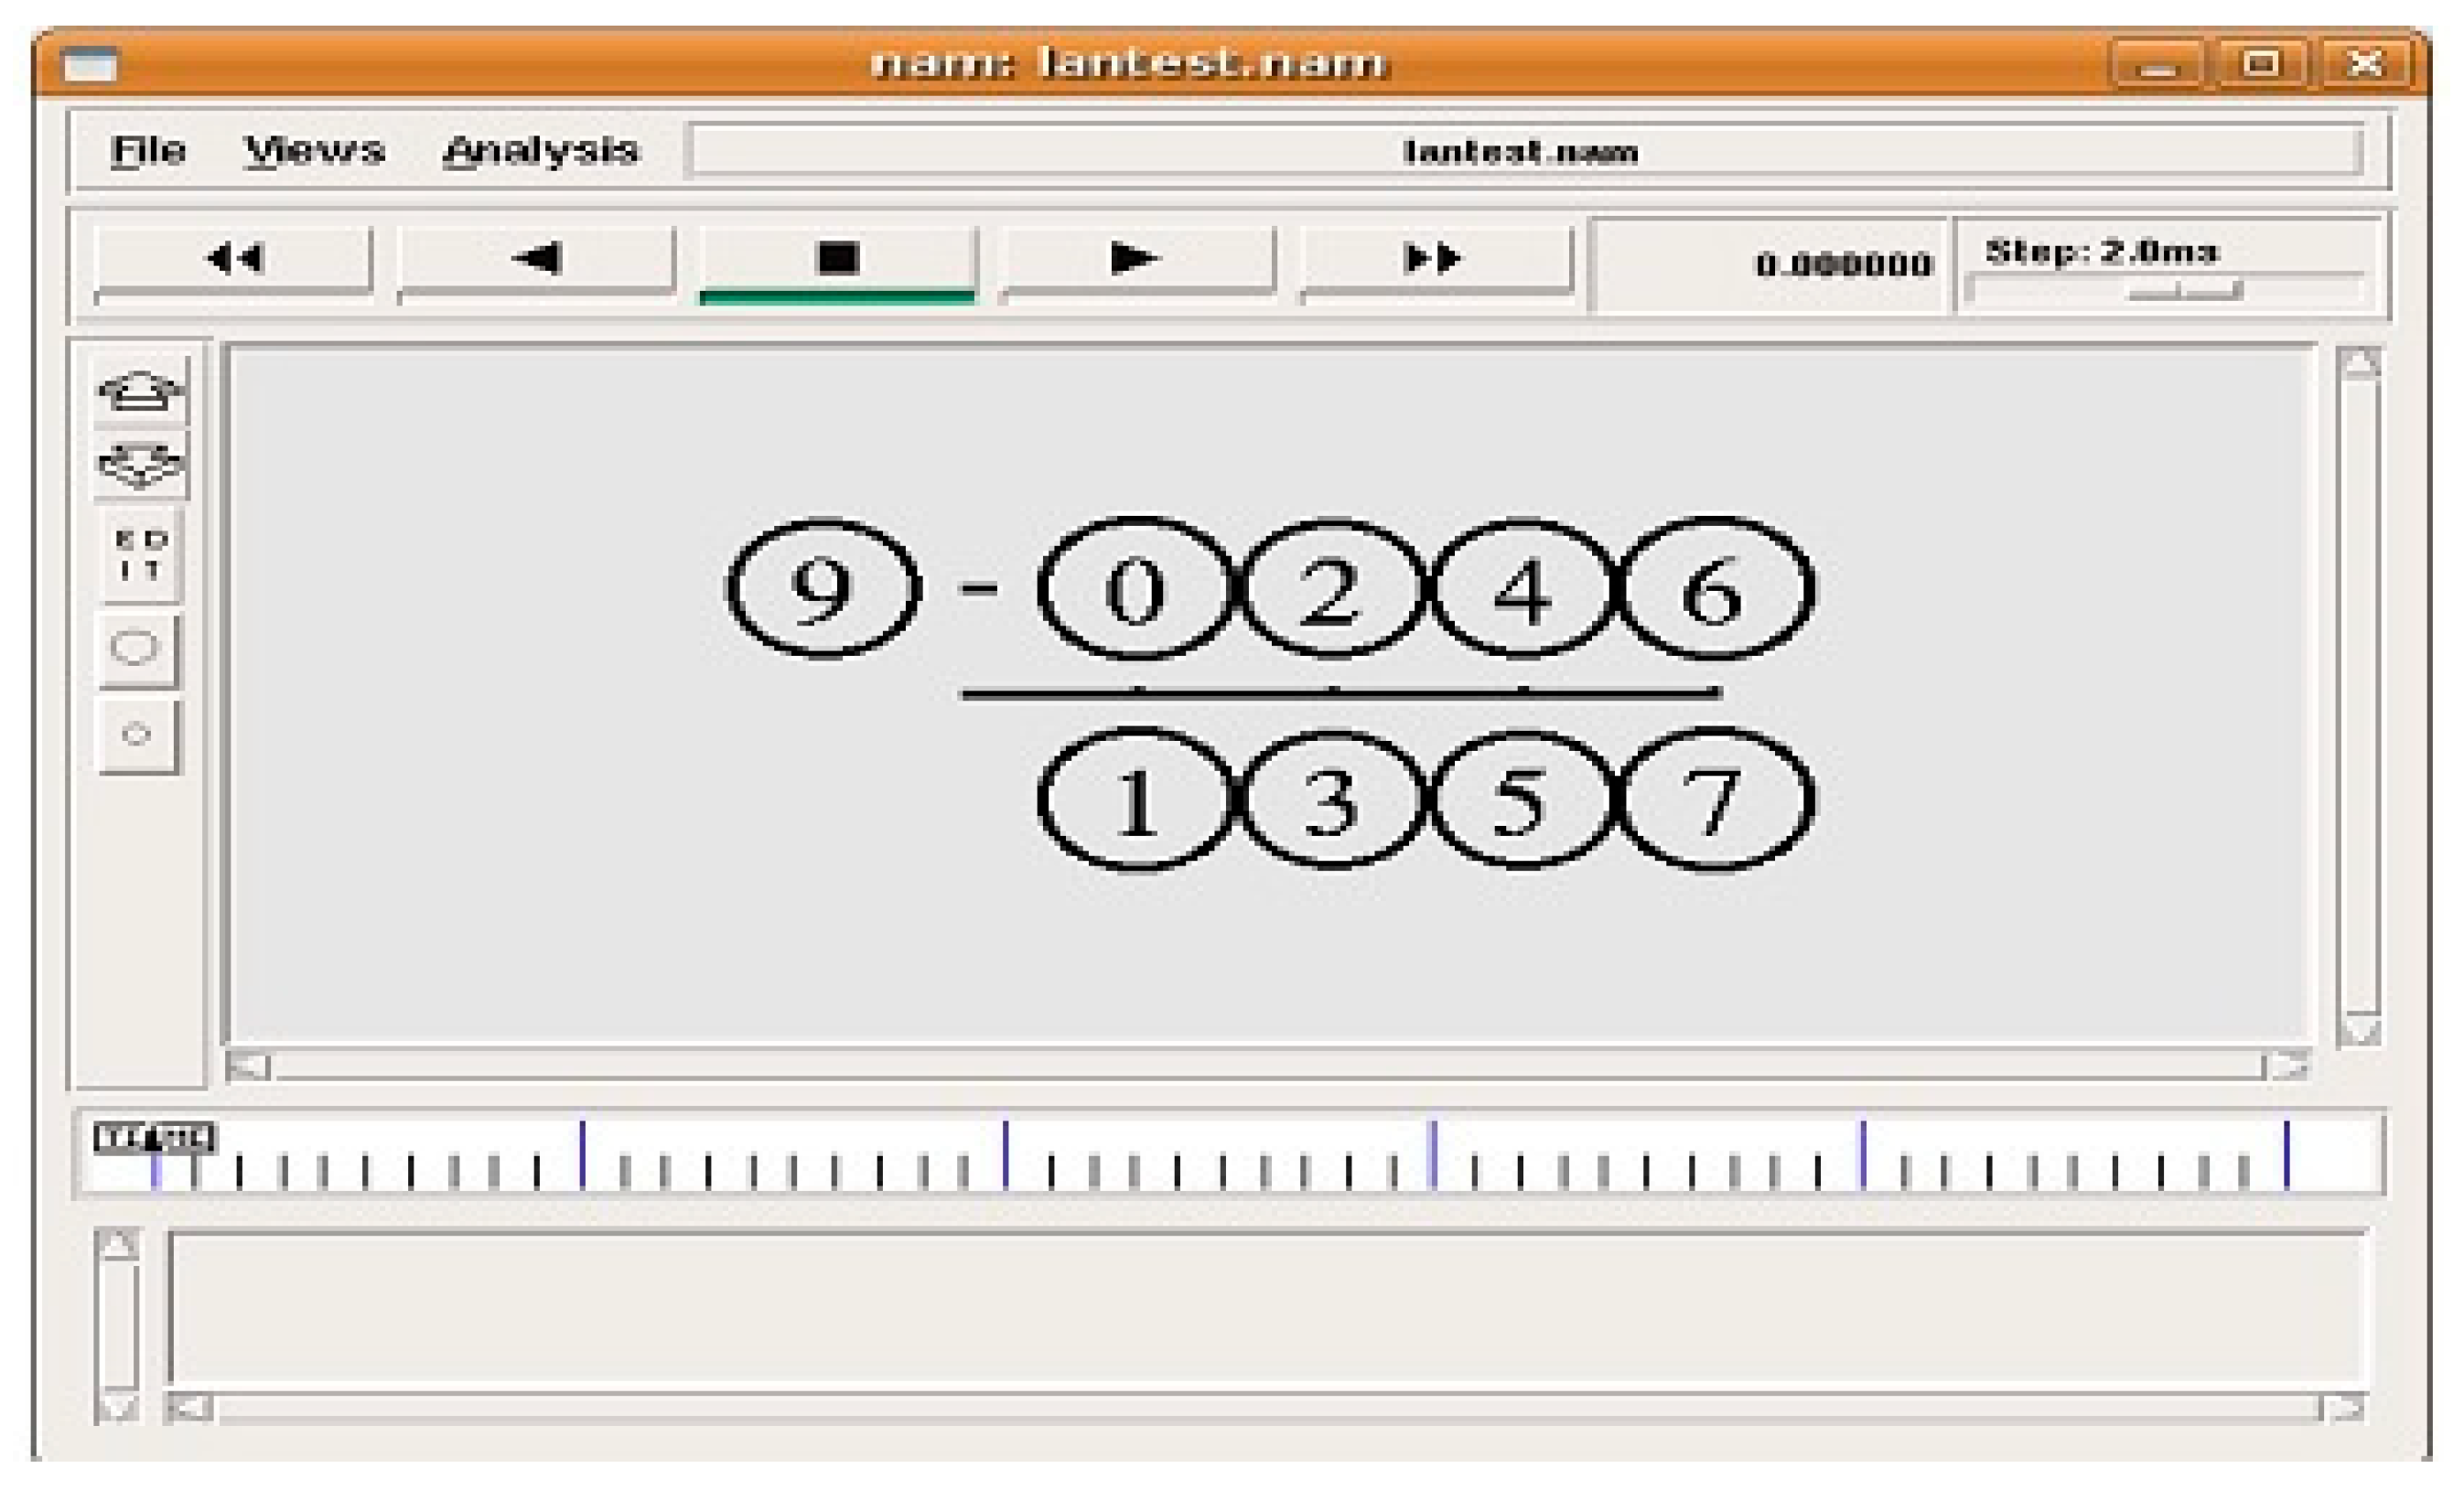
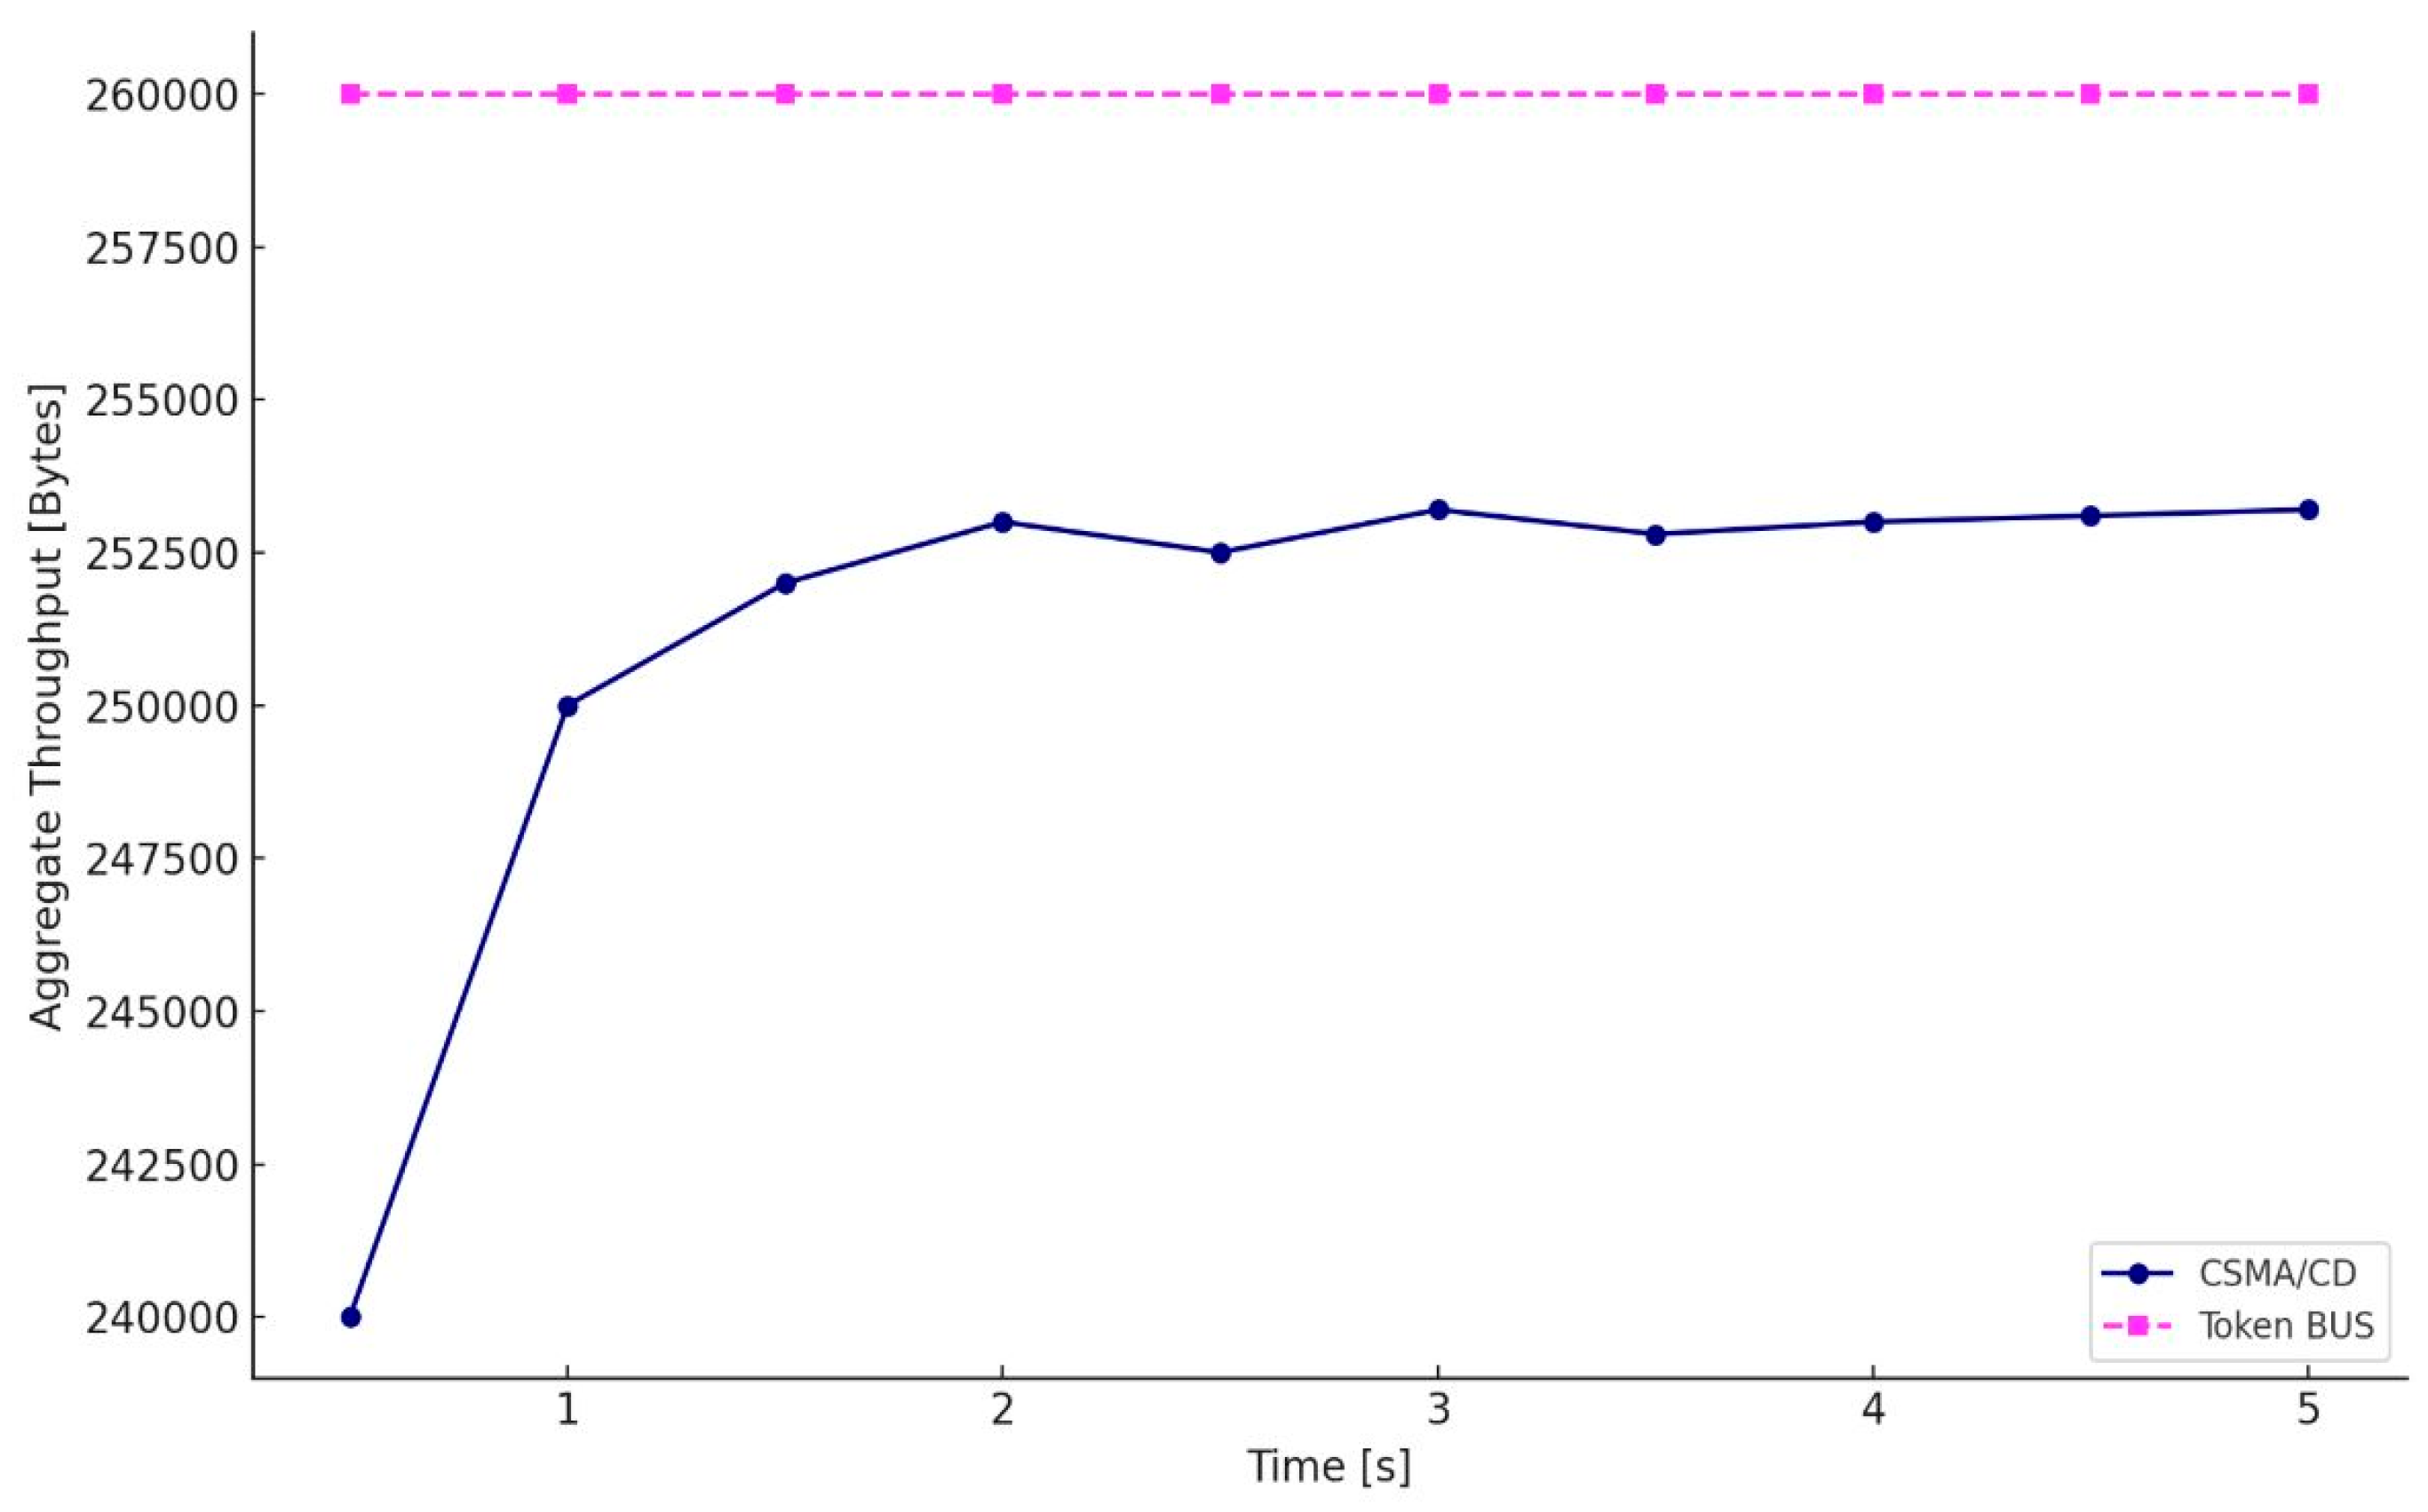
- The Token Bus protocol is employed as the underlying communication mechanism to enhance both the determinism and stability of internal DCS communications, which is critical for maintaining synchronization and reliability in real-time control environments.
- ii.
- DCS architectures utilize a variety of function codes, each performing discrete control operations. When instantiated, each function code is dynamically assigned a unique block number. For example, if a particular function code is invoked ten times, it is assigned block numbers sequentially from 1 to 10.
- iii.
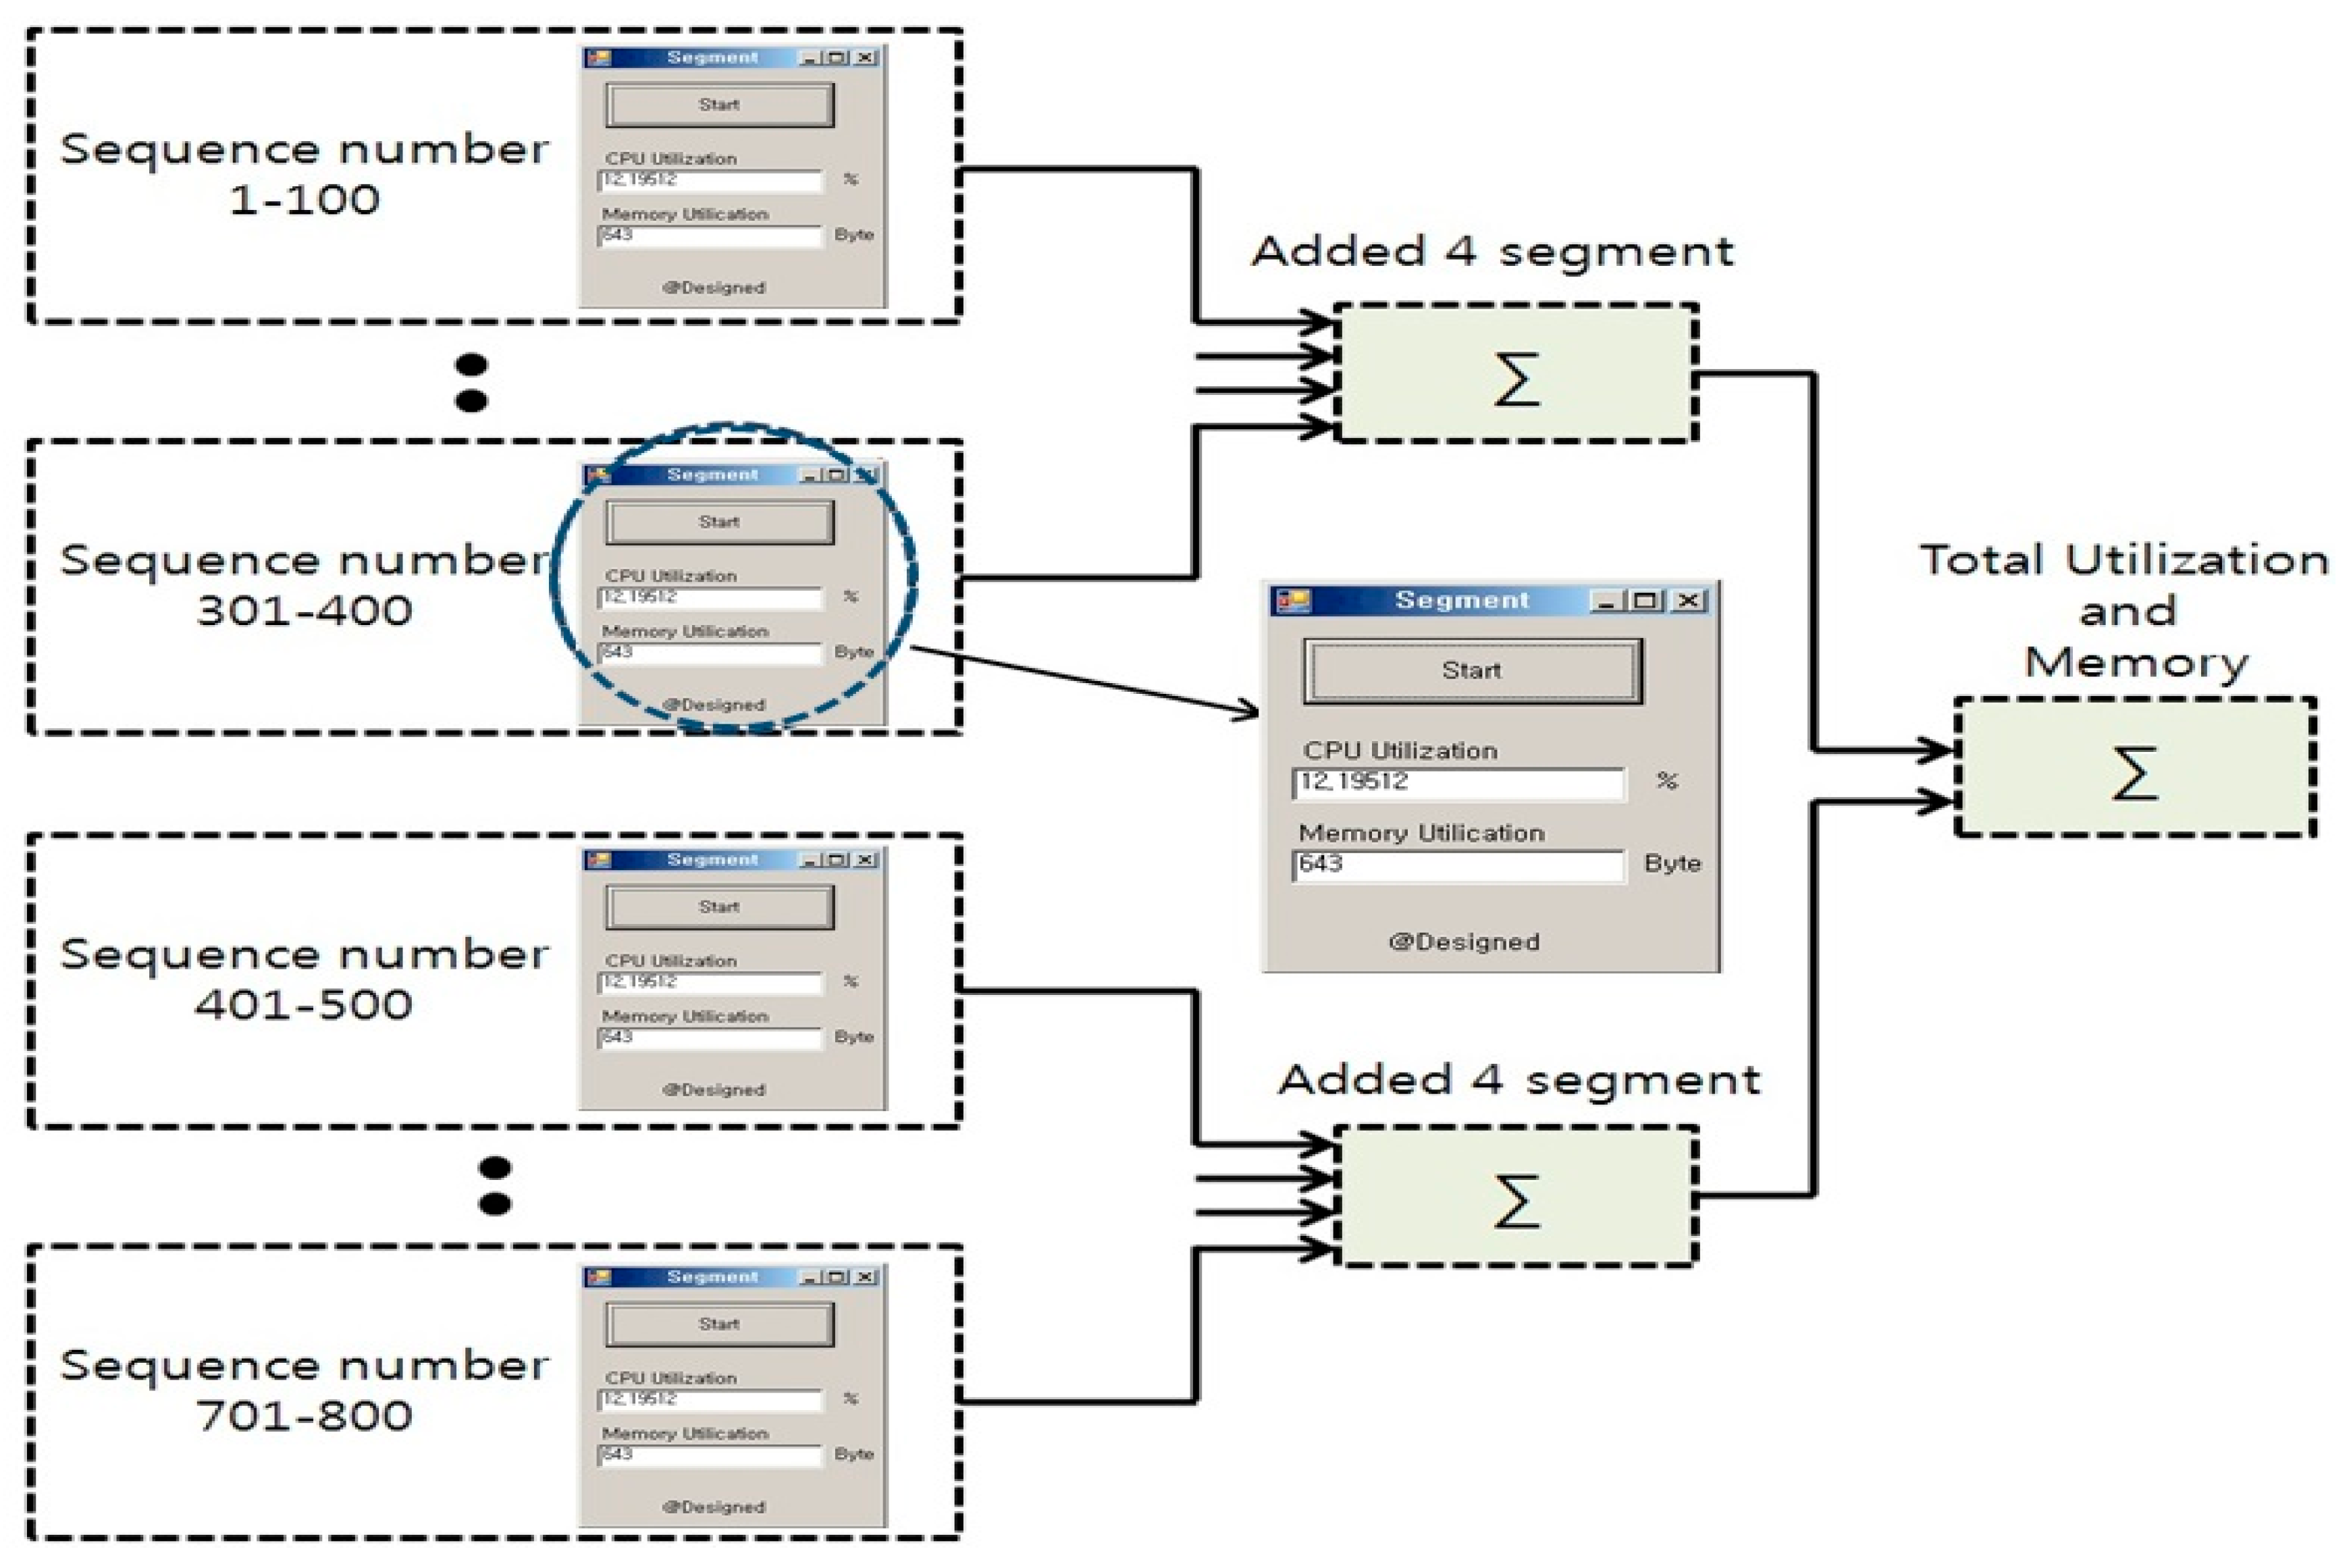
- These assigned block numbers are systematically partitioned into eight logical groups based on their expected execution times. This classification facilitates balanced load analysis and enables the mapping of grouped block executions to discrete processing pathways.
- iv.
- Each group is subsequently interfaced with a dedicated NFP segment, allowing for real-time monitoring and isolation of computational loads associated with each group.
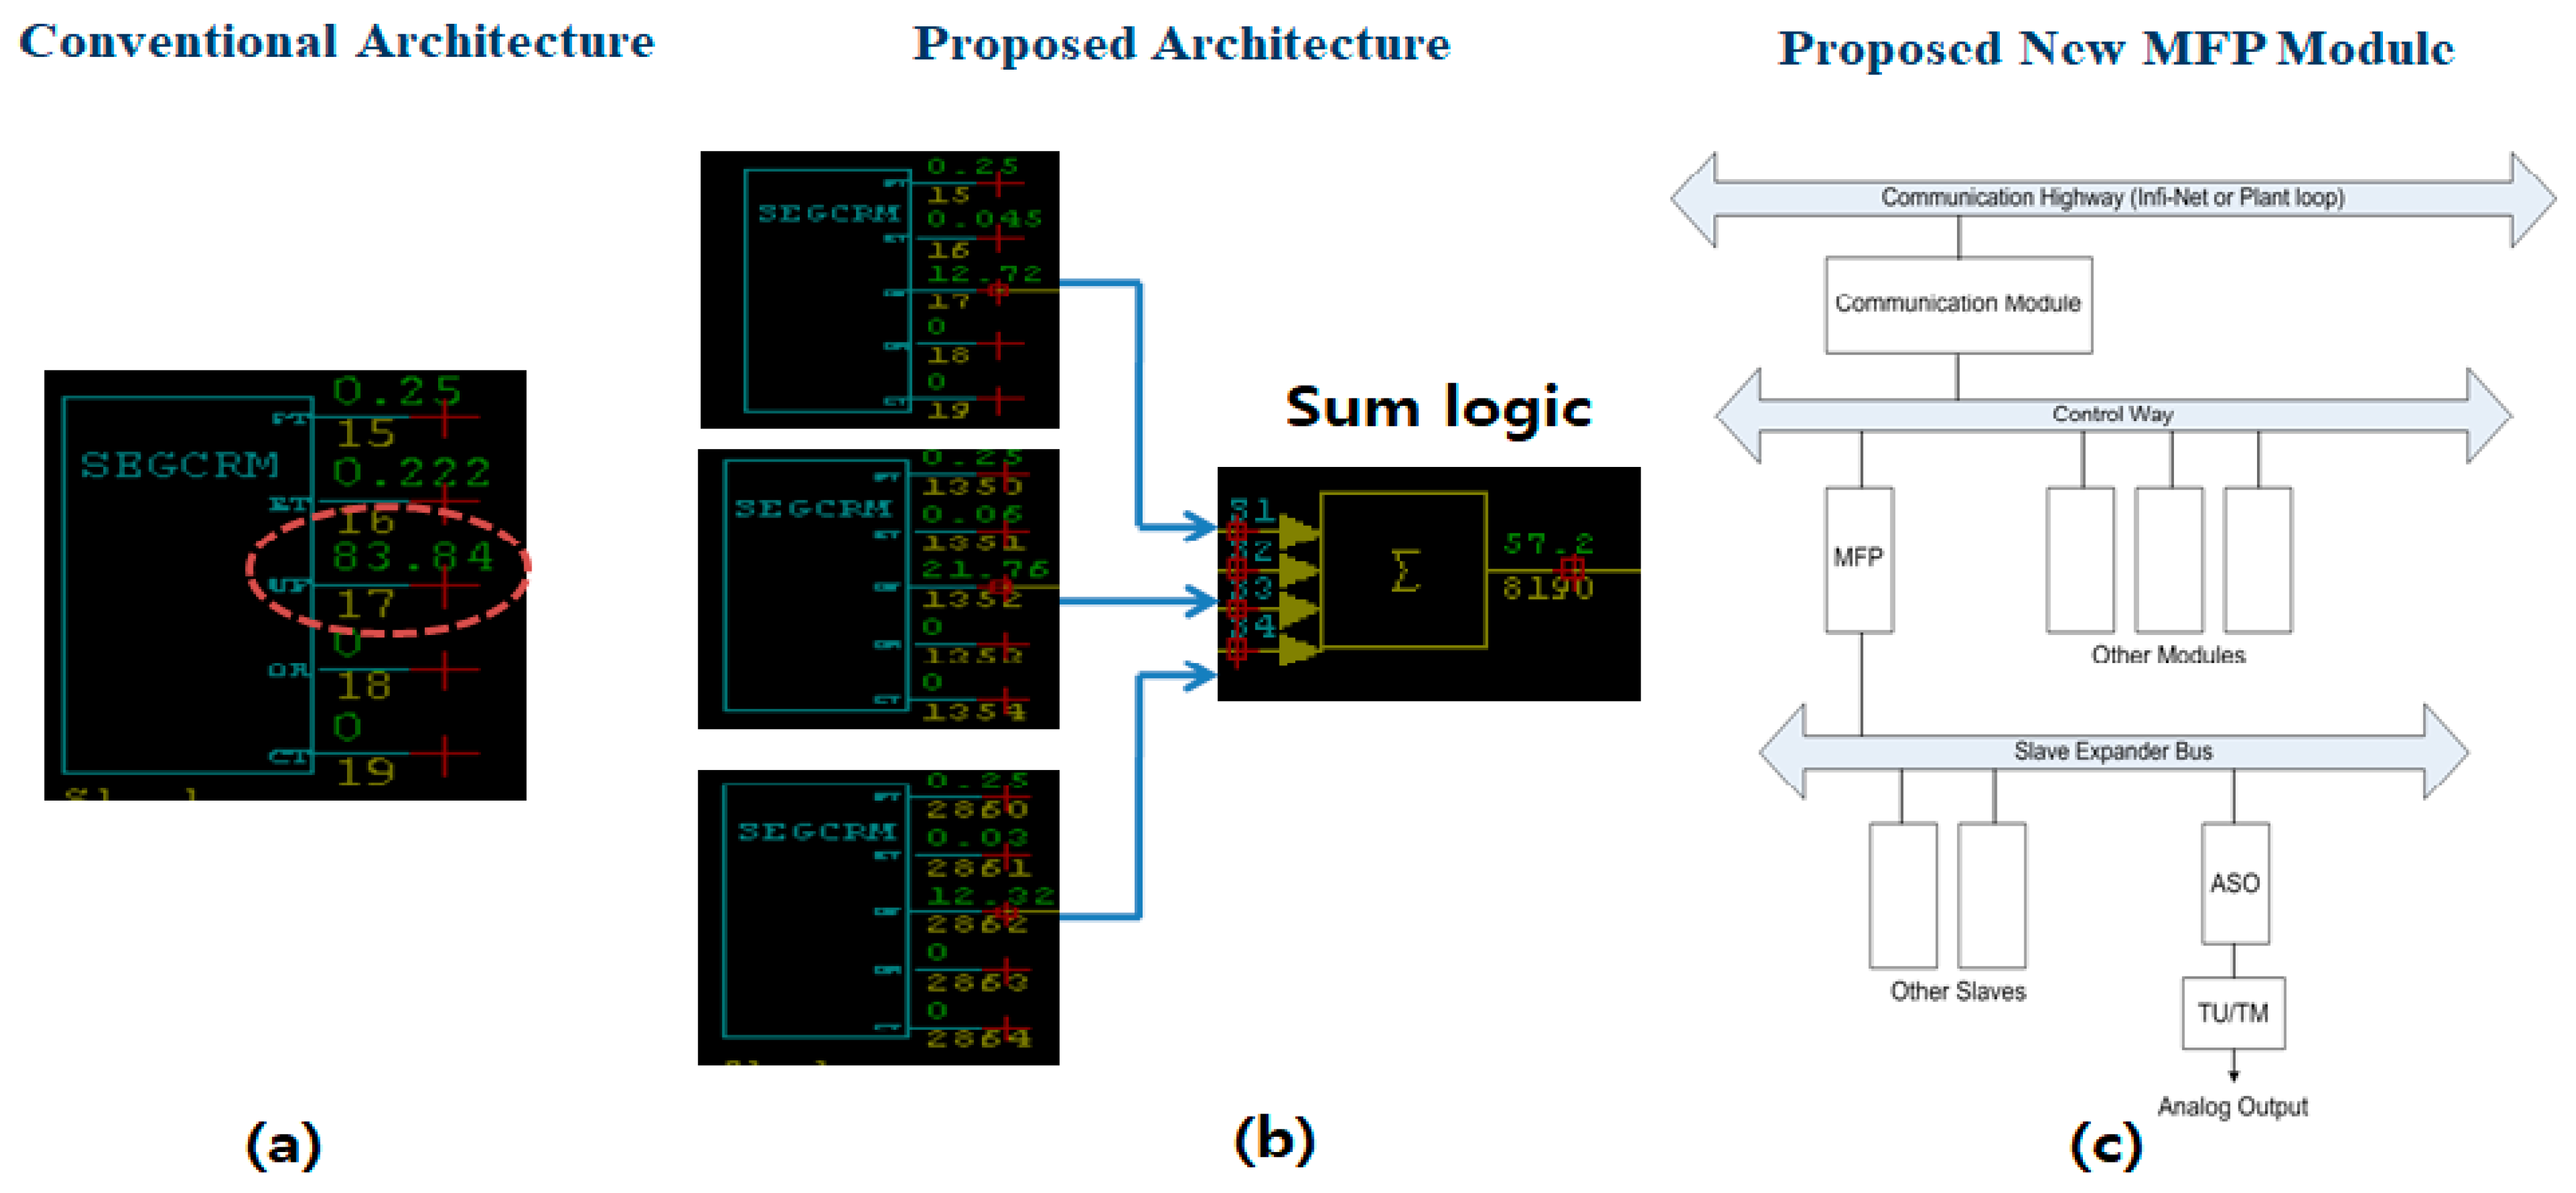
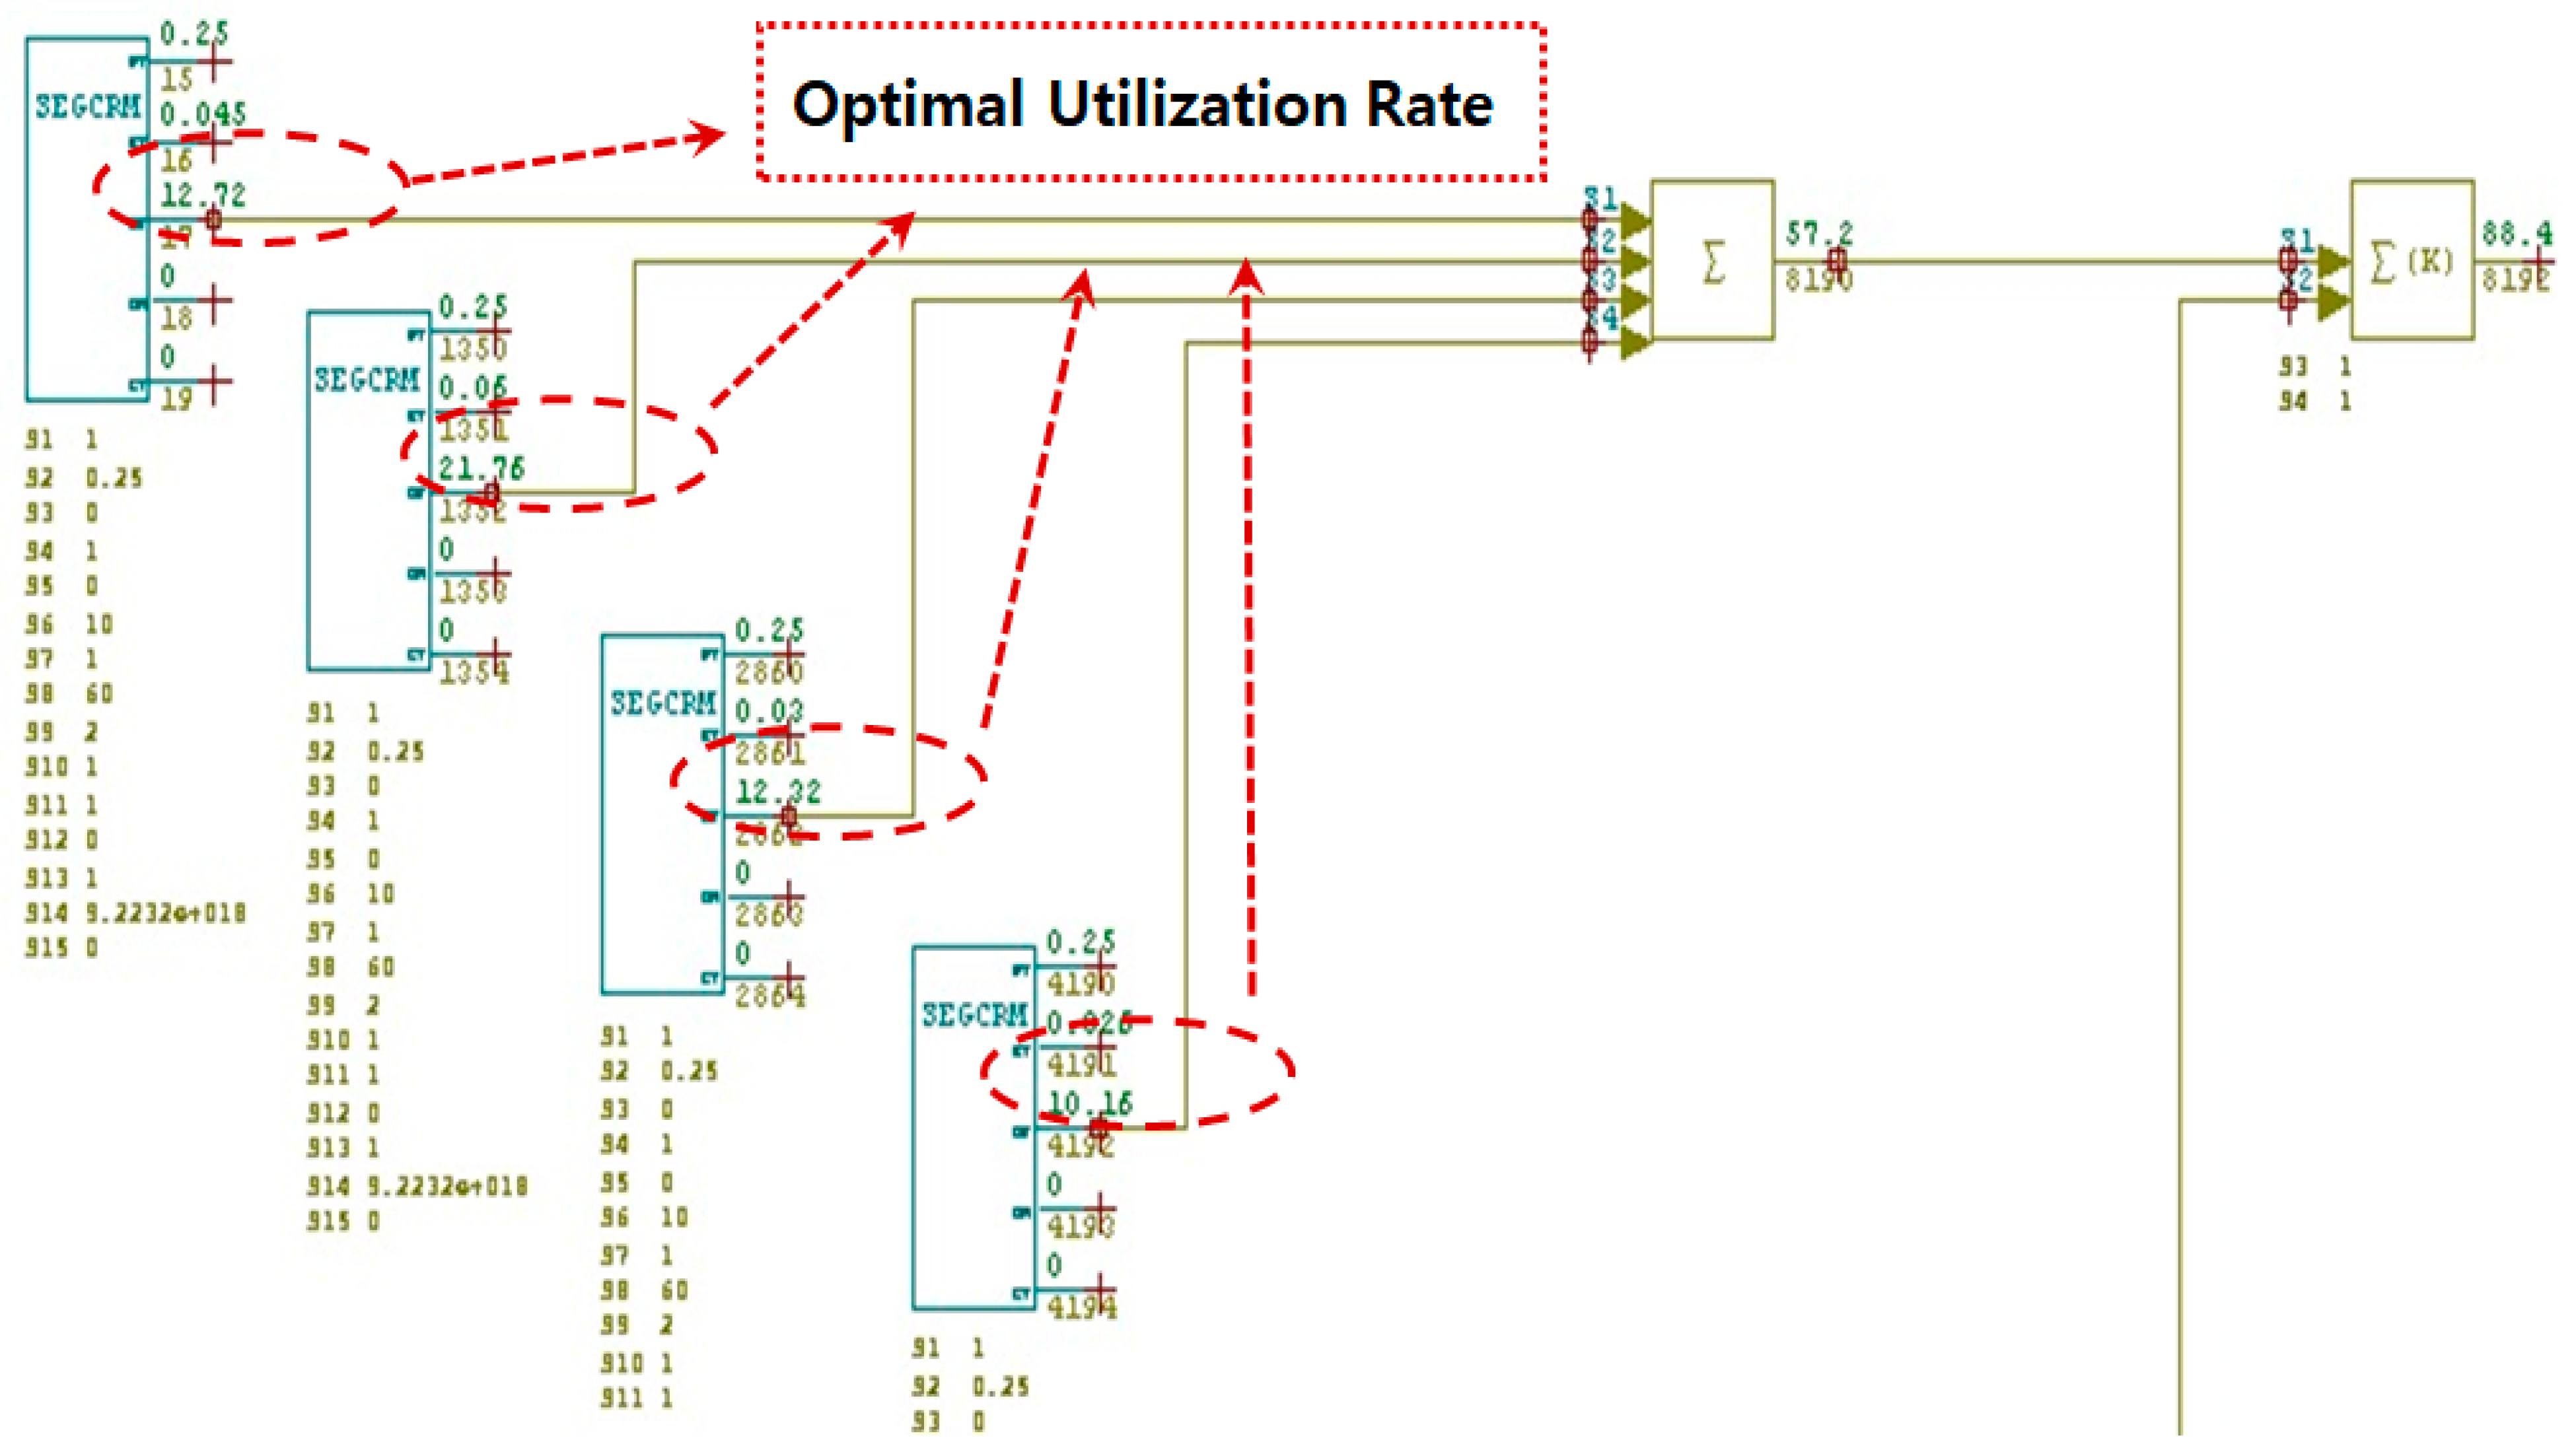
- v.
- Finally, the outputs of the NFP segments are aggregated via three summation logic units to compute total utilization across grouped segments, enabling the detection of overload conditions with higher specificity and temporal accuracy (as shown in Figure 9).
6. Conclusions
Funding
Institutional Review Board Statement
Informed Consent Statement
Data Availability Statement
Acknowledgments
Conflicts of Interest
Abbreviations
| DCS | distributed control system |
| AFP | analog function processor |
| CFP | compressed function processor |
| EWS | engineering workstation |
| MFP | multi-functional processor |
| TUD | Trend-based Utilization Detection |
| RLE | Run-Length Encoding Compression |
| NFP | non-functional processor |
| ADC | analog-to-digital converter |
| BRC | bridge controller card |
| CPSP | Centralized Periodic Status Ping |
| ICMP | Internet Control Message Protocol |
| FTAS | Fixed Threshold Alarm System |
| CBLA | Conventional Byte-Level Allocation |
| NBNS | NetBIOS Name Service |
| TDLP | Token-based Distributed Load Polling |
References
- Ting, H.; Wu, Z.; Li, D.; Jihong, W. Active disturbance rejection control of large-scale coal fired plant process for flexible operation. In Modeling, Identification, and Control for Cyber-Physical Systems Towards Industry 4.0; Academic Press: Cambridge, MA, USA, 2024; pp. 385–413. [Google Scholar]
- Hemeida, A.M.; El-Sadek, M.Z.; Younies, S.A. Distributed control system approach for a unified power system. In Proceedings of the 39th International Universities Power Engineering Conference, Bristol, UK, 6–8 September 2004; pp. 304–307. [Google Scholar]
- Available online: https://new.abb.com/control-systems/service/offerings/extensions-upgrades-and-retrofits/abb-system-evolution/symphony-harmony-system-evolution (accessed on 5 May 2025).
- Canonico, R.; Sperlì, G. Industrial cyber-physical systems protection: A methodological review. Comput. Secur. 2023, 135, 103531. [Google Scholar] [CrossRef]
- Paul, B.; Sarker, A.; Abhi, S.H.; Das, S.K.; Ali, F.; Islam, M.; Islam, R.; Moyeen, S.I.; Badal, F.R.; Ahamed, H.; et al. Potential smart grid vulnerabilities to cyber-attacks: Current threats and existing mitigation strategies. Heliyon 2024, 10, e37980. [Google Scholar] [CrossRef] [PubMed]
- Sudarshan, V.; Seider, W.D.; Patel, A.J.; Oktem, U.G.; Arbogast, J.E. Alarm rationalization and dynamic risk analyses for rare abnormal events. Comput. Chem. Eng. 2024, 184, 108633. [Google Scholar] [CrossRef]
- Xiao, L.; Sun, W.; Chang, S.; Lu, C.; Jiang, R. Research on the construction of a blockchain-based industrial product full life cycle information traceability system. Appl. Sci. 2024, 14, 4569. [Google Scholar] [CrossRef]
- Beak, S.; Lee, W.; Hieu, B.V.; Choi, S.; Lee, E.; Jeong, T. Control Logic Based on Optimal Communication Protocol for Investing of the Overload on DCS Systems. In Proceedings of the 2010 Spring Conference, Jeju, Republic of Korea, 24–26 June 2010; Korean Society for Internet Information: Seoul, Republic of Korea, 2010. [Google Scholar]
- Beak, S.; Lee, W.; Jeong, T. A study on Optimal Scalable Logics and Overload of DCS Main Controller Project. In Korea Western Power Co. Project Final Report; Korea Western Power Co.: Taean, Republic of Korea, 2010. [Google Scholar]
- Jabbar, H.; Song, Y.; Jeong, T. RF Energy Harvesting System and Circuits for Charging of Mobile Devices. IEEE Trans. Consum. Electron. 2010, 56, 247–253. [Google Scholar] [CrossRef]
- Jeong, T. Energy Charging and Harvesting Circuits Design in Bluetooth Environment for Smart Phone. IET Sci. Meas. Technol. 2013, 7, 201–205. [Google Scholar] [CrossRef]
- Jabber, H.; Lee, S.; Jeong, T. Energy Harvesting Technique by using Novel Voltage Multiplier Circuits and Passive Devices. IEICE Trans. Electron. 2013, E96.C, 726–729. [Google Scholar] [CrossRef]
- Fairhurst, G. Carrier Sense Multiple Access with Collision Detection (CSMA/CD). 2004. Available online: https://www.erg.abdn.ac.uk/users/gorry/course/lan-pages/csma-cd.html (accessed on 5 May 2025).
- Vargas, J.V.C.; Souza, J.A.; Hovsapian, R.; Ordonez, J.C.; Chalfant, J. ESRDC ship notional baseline medium voltage direct current (MVDC) architecture thermal simulation and visualization. In Proceedings of the GCMS’11: Proceedings of the 2011 Grand Challenges on Modeling and Simulation Conference, Hague, The Netherlands, 27–30 June 2011; pp. 150–160. [Google Scholar]
- Ivanov, S.; Herms, A.; Lukas, G. Experimental validation of the ns-2 wireless model using simulation, emulation, and real network. In Proceedings of the Communication in Distributed Systems-15. ITG/GI Symposium, Bern, Switzerland, 26 February–2 March 2007; pp. 1–12. [Google Scholar]
- Espina, J.; Falck, T.; Panousopoulou, A.; Schmitt, L.; Mülhens, O.; Yang, G.Z. Network topologies, communication protocols, and standards. In Body Sensor Networks; Springer: London, UK, 2014; pp. 189–236. [Google Scholar]
- Barrett, C.L.; Drozda, M.; Marathe, A.; Marathe, M.V. Analyzing interaction between network protocols, topology and traffic in wireless radio networks. In Proceedings of the 2003 IEEE Wireless Communications and Networking, 2003. WCNC 2003, New Orleans, LA, USA, 16–20 March 2003; IEEE: Piscataway, NJ, USA, 2003; Volume 3, pp. 1760–1766. [Google Scholar]
- Mohapatra, S.; Kanungo, P. Performance analysis of AODV, DSR, OLSR and DSDV routing protocols using NS2 Simulator. Procedia Eng. 2012, 30, 69–76. [Google Scholar] [CrossRef]
- Sen, S.; Roy Choudhury, R.; Nelakuditi, S. CSMA/CN: Carrier sense multiple access with collision notification. In Proceedings of the MobiCom’10: Proceedings of the Sixteenth Annual International Conference on Mobile computing and Networking, Chicago, IL, USA, 20–24 September 2010; pp. 25–36. [Google Scholar]
- Briscoe, B.; Brunstrom, A.; Petlund, A.; Hayes, D.; Ros, D.; Tsang, I.-J.; Gjessing, S.; Fairhurst, G.; Griwodz, C.; Welzl, M. Reducing internet latency: A survey of techniques and their merits. IEEE Commun. Surv. Tutor. 2014, 18, 2149–2196. [Google Scholar] [CrossRef]
- Salah, K.; El-Badawi, K.; Haidari, F. Performance analysis and comparison of interrupt-handling schemes in gigabit networks. Comput. Commun. 2007, 30, 3425–3441. [Google Scholar] [CrossRef]
- Primadianto, A.; Lu, C.N. A review on distribution system state estimation. IEEE Trans. Power Syst. 2016, 32, 3875–3883. [Google Scholar] [CrossRef]
- Cintuglu, M.H.; Mohammed, O.A.; Akkaya, K.; Uluagac, A.S. A survey on smart grid cyber-physical system testbeds. IEEE Commun. Surv. Tutor. 2016, 19, 446–464. [Google Scholar] [CrossRef]
- Banerjee, U.; Vashishtha, A.; Saxena, M. Evaluation of the Capabilities of WireShark as a tool for Intrusion Detection. Int. J. Comput. Appl. 2010, 6, 1–5. [Google Scholar] [CrossRef]
- Mahmood, A.; Hameed, R.A.A.; Farooq, H. An intelligent overload detection and response mechanism for industrial control systems. IEEE Access 2021, 9, 54761–54775. [Google Scholar]
- Thomesse, J.P. Fieldbus technology in industrial automation. Proc. IEEE 2005, 93, 1073–1101. [Google Scholar] [CrossRef]
- Obaidat, M.S.; Boudriga, N.A. Handbook of Green Information and Communication Systems; Academic Press: Cambridge, MA, USA, 2013. [Google Scholar]
- Razavi, B. Principles of Data Conversion System Design; IEEE Press: Piscataway, NJ, USA, 2013. [Google Scholar]
- Issariyakul, T.; Hossain, E. Introduction to Network Simulator NS2; Springer: Berlin/Heidelberg, Germany, 2012. [Google Scholar] [CrossRef]
- Marwedel, P. Embedded System Design, 2nd ed.; Springer: Berlin/Heidelberg, Germany, 2011. [Google Scholar]


| Specifications | MFP (Multi-Functional Processor) Module | BRC (Bridge Controller Card) Module |
|---|---|---|
| Microprocessor | 32 bit | 32 bit |
| NVRAM | 64 K Byte | 1 M Byte |
| RAM | 256 K Byte | 2 M Byte |
| Power consumption | 5 V/2 A | 5 V/2 A |
| Function Code | NVRAM (Bytes) | RAM (Bytes) | Execution Time (in μsec) |
|---|---|---|---|
| 1 | 46 | 88 | 38 |
| 2 | 12 | 40 | 17 |
| 82 | 64 | 260 | 0 |
| 100 | 40 | 144 | 185 |
| 242 | 84 | 338 | 300 |
| Equation | Conventional Compression Algorithm 2(n − 1) | Proposed Algorithm 2(n − 1)(d + 1) |
|---|---|---|
| Calculation | 2(n − 1) = 2(8 − 1) | 2(n − 1)(d + 1) = [2(8 − 1)(3 + 1)]/8 |
| Total memory | 14 byte | 7 byte |
| Bit | Conventional ADC | AFP | Efficiency (%) | ||
|---|---|---|---|---|---|
| # of Comparator | Power (mW) | # of Comparator | Power (mW) | ||
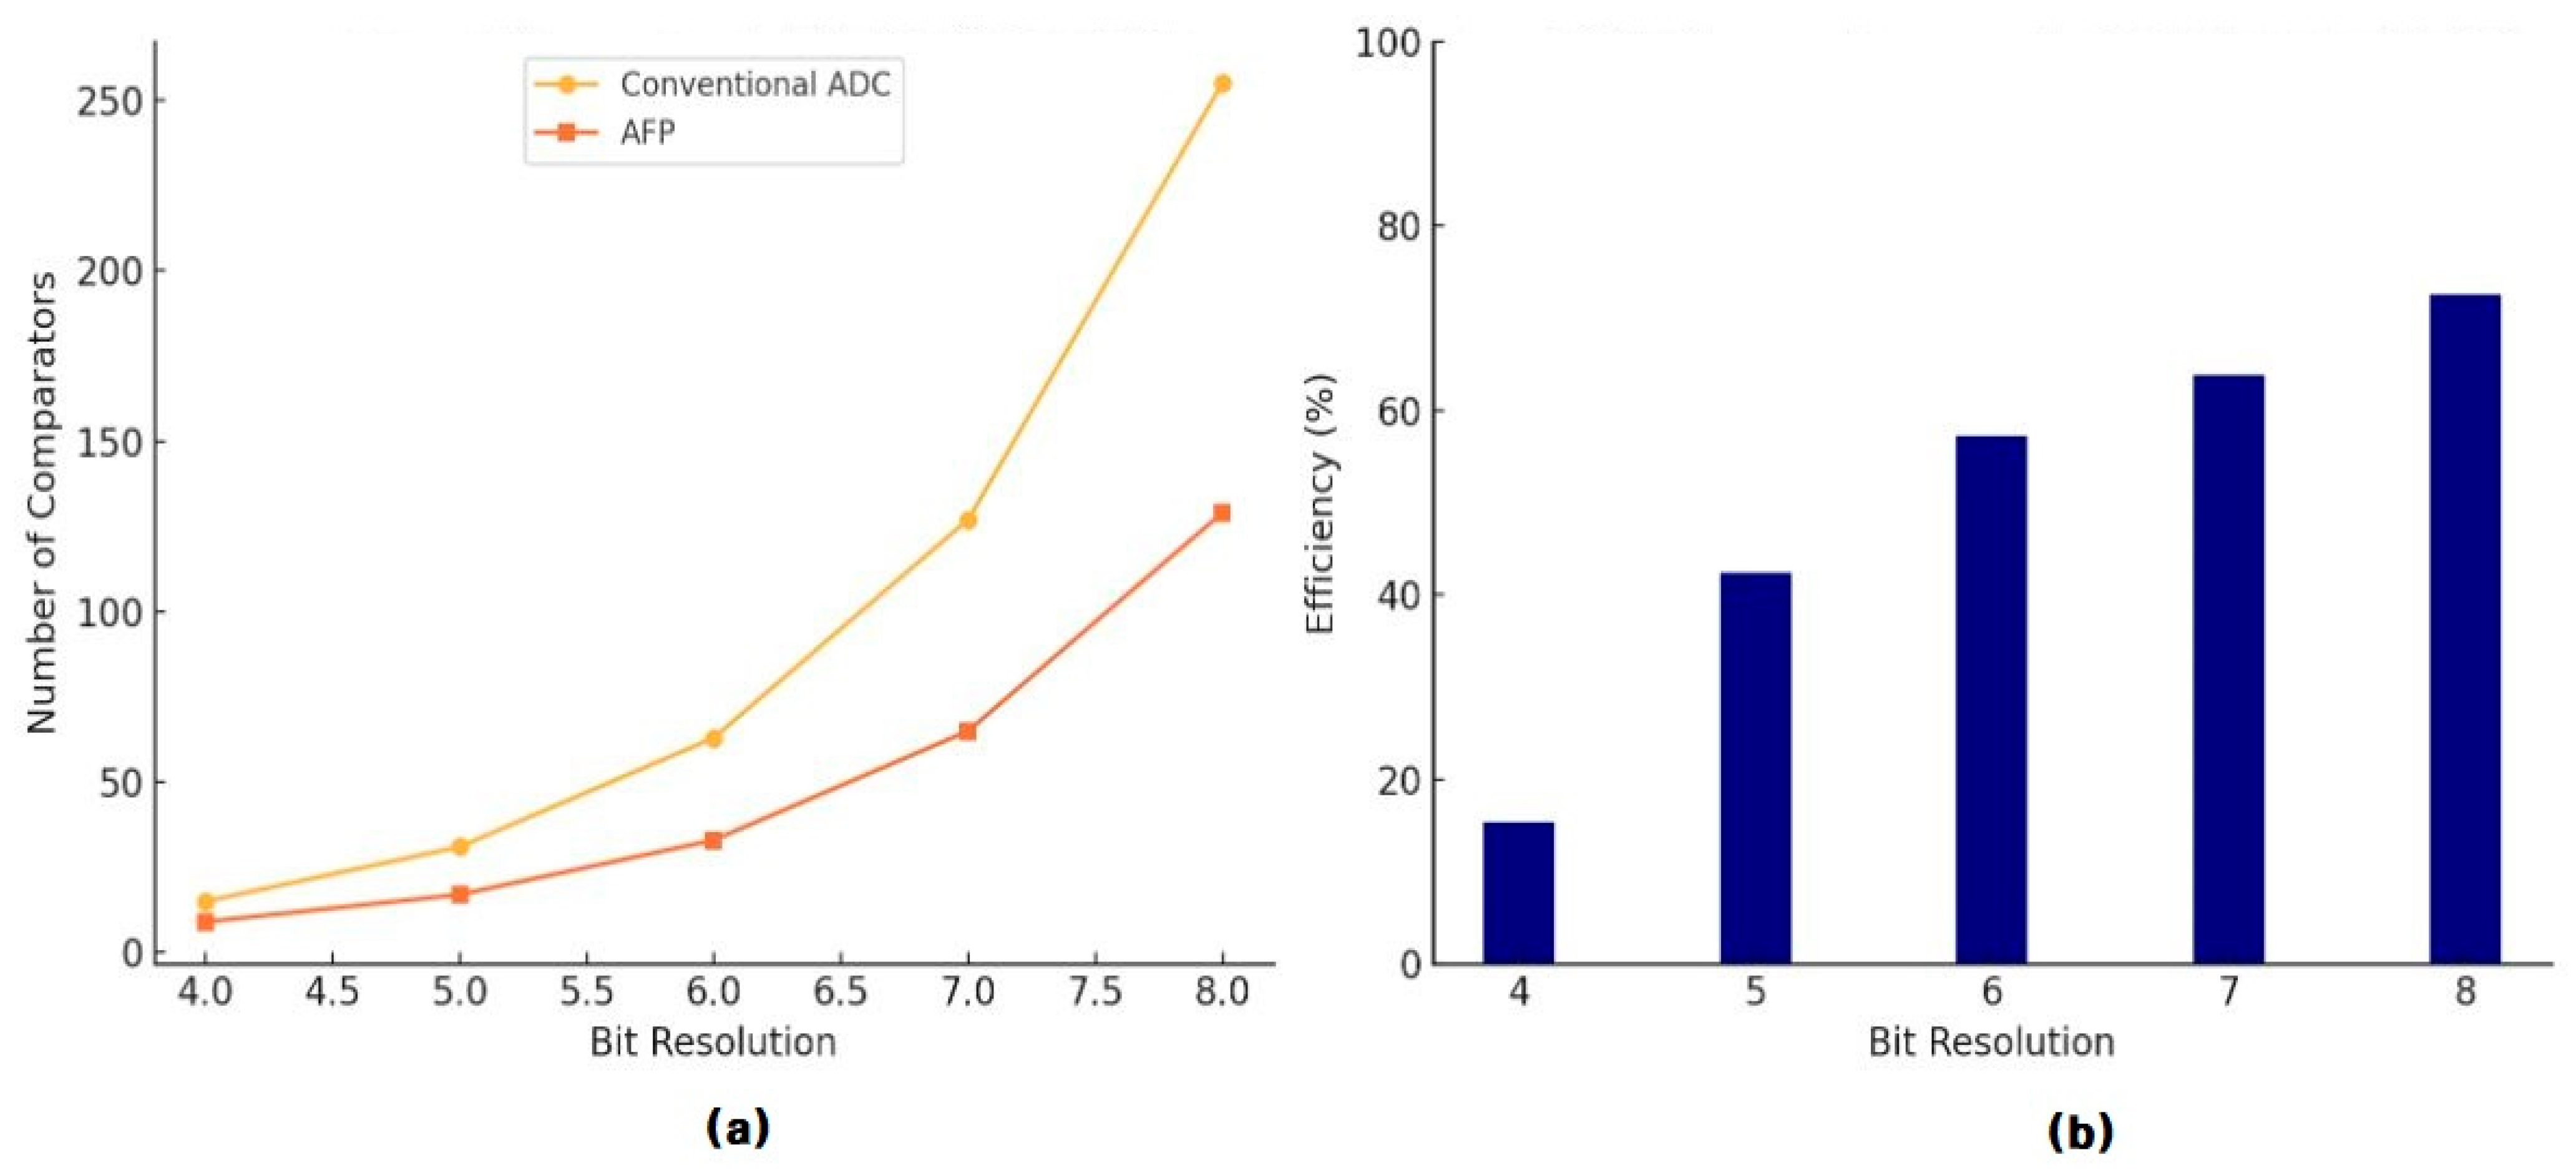
| 4b | 15 | 16.94 | 9 | 16.94 | 15.38 |
| 5b | 31 | 23.01 | 17 | 23.01 | 42.37 |
| 6b | 63 | 34.05 | 33 | 34.05 | 57.20 |
| 7b | 127 | 57.46 | 65 | 57.46 | 63.86 |
| 8b | 255 | 87.32 | 129 | 87.32 | 72.58 |
| Bench Marking Metric | FTAS | TUD | Proposed Method (NFP + CFP + AFP) | Improvement Rate |
|---|---|---|---|---|
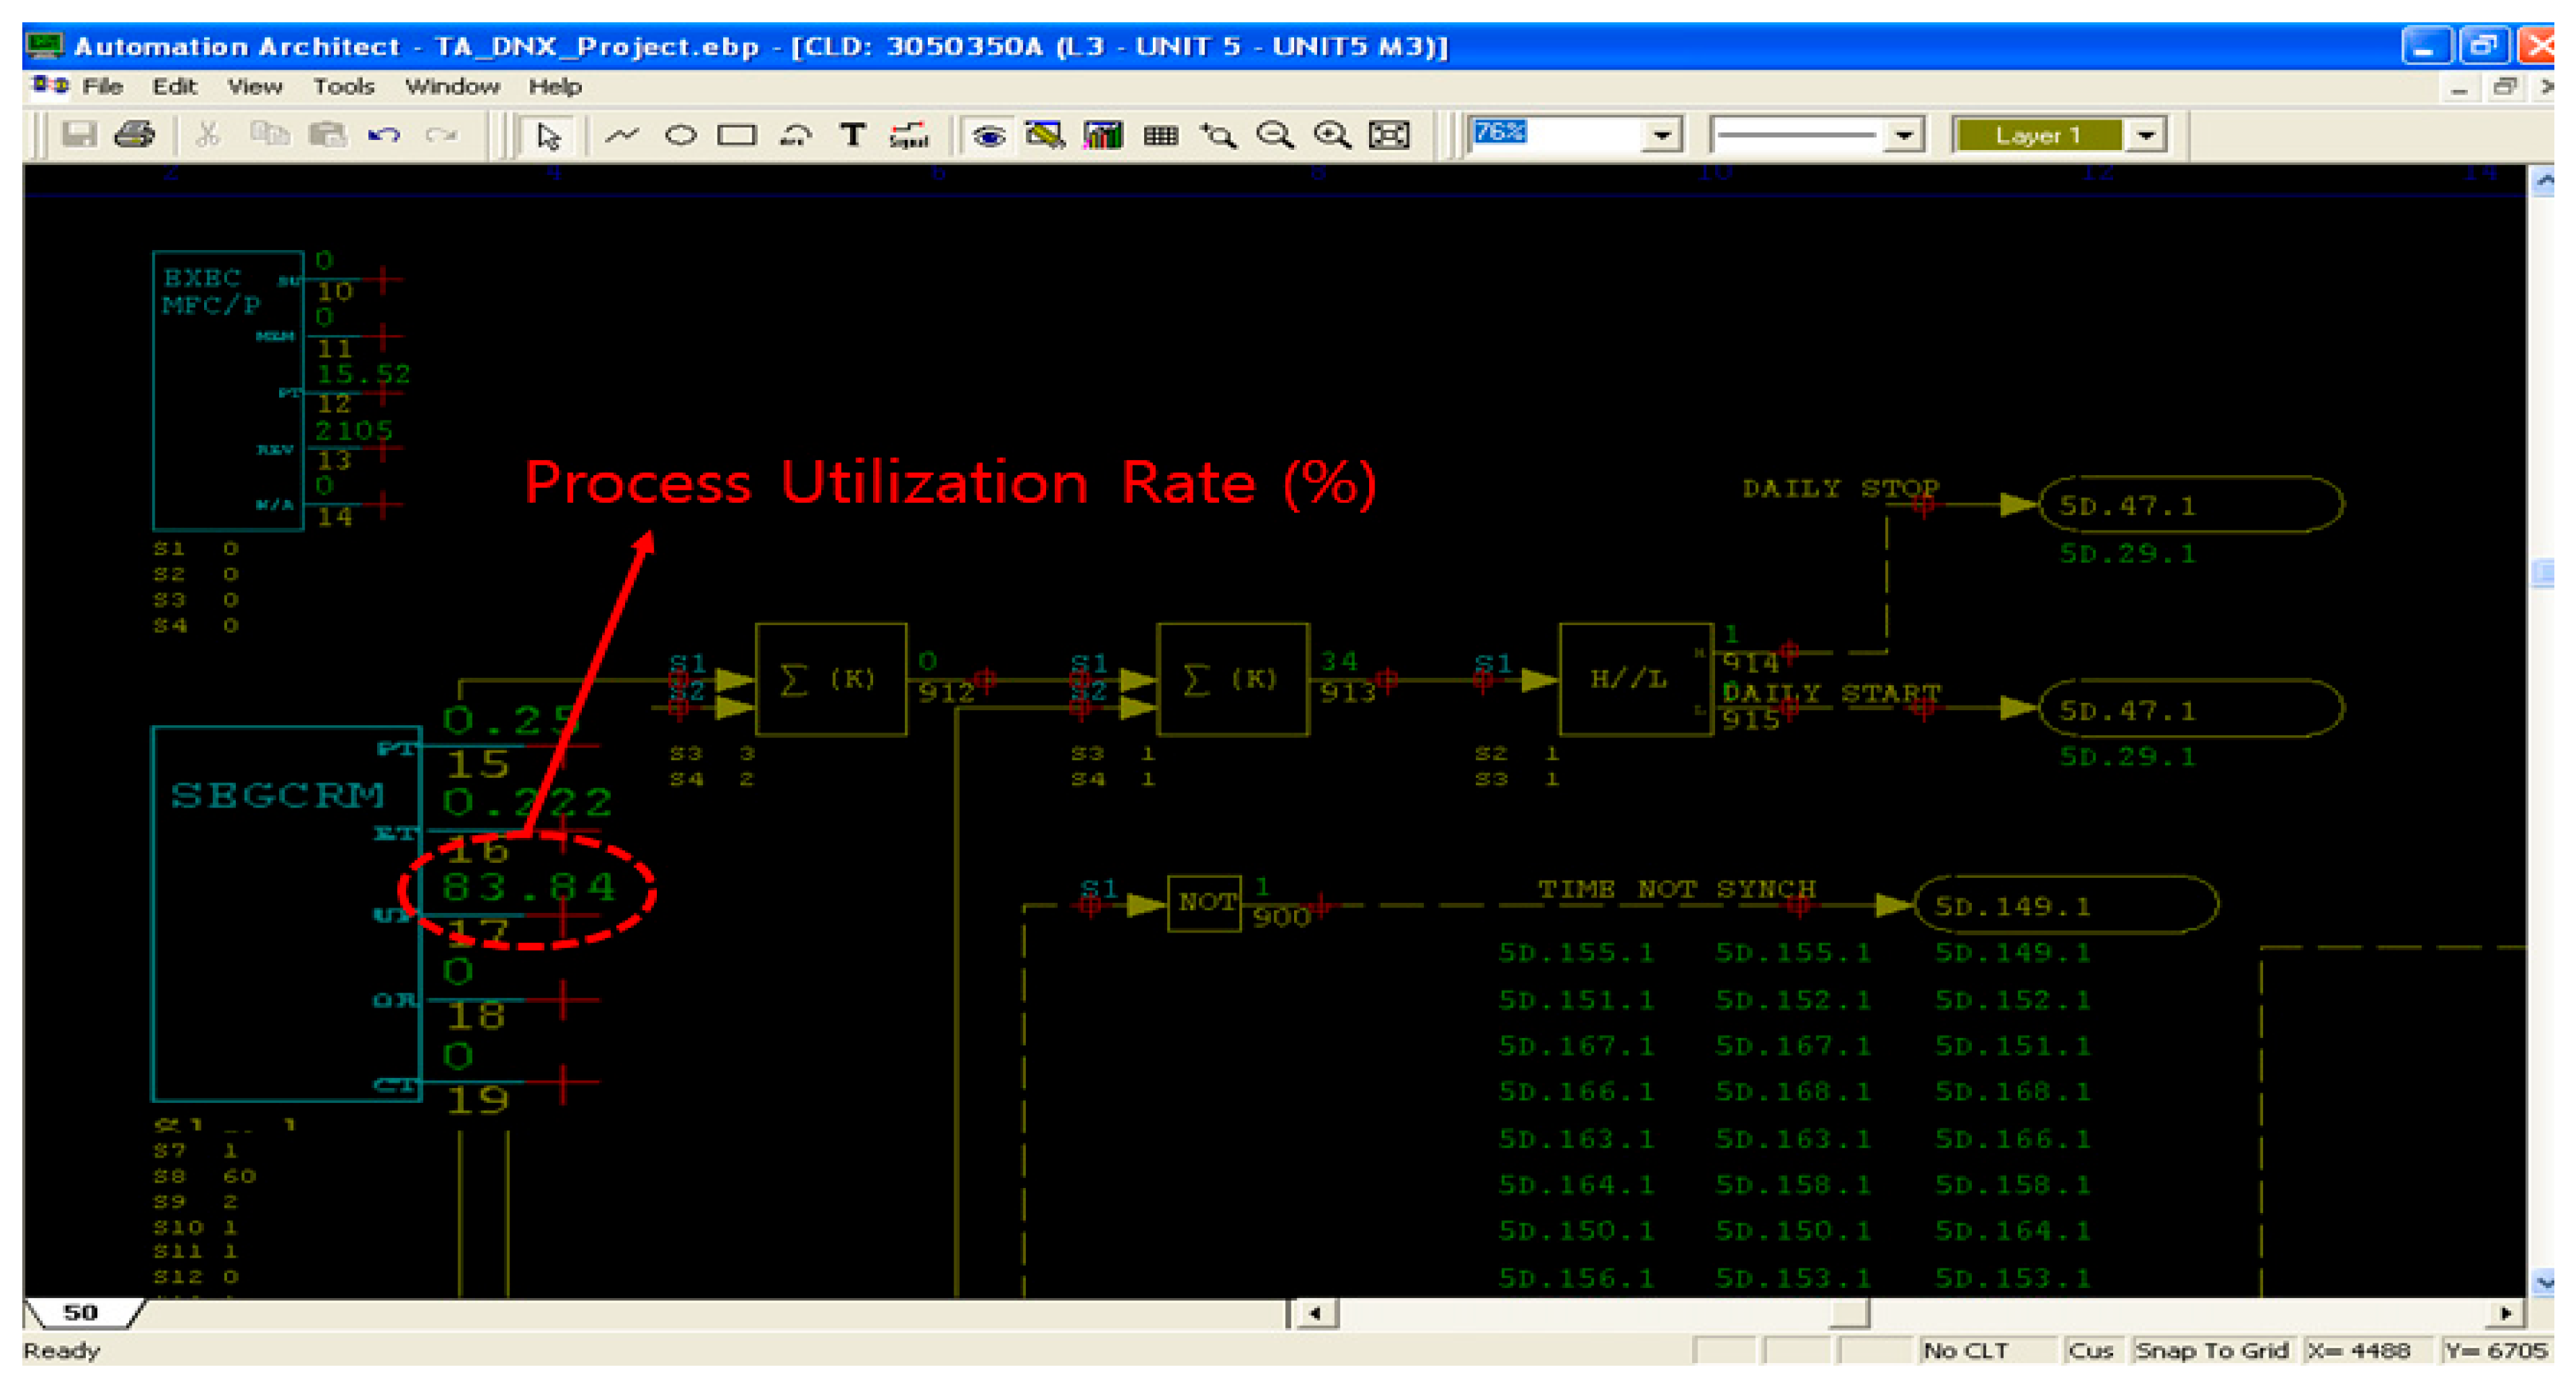
| CPU Utilization (%) | FTAS: 83.84 | TUD: 76.5 | 57.2 | +31.7% |
| Memory Usage (RAM, bytes) | CBLA: 338 | RLE: 296 | 260 | −23.1% |
| Execution Latency (μs) | RLE-based: 300 | Symbol Table: 255 | 185 | −38.3% |
| ADC Comparator Count (8-bit) | Full-Flash: 255 | Subranged: 160 | 129 | −49.4% |
| ADC Power Consumption (8-bit, mW) | Full-Flash: 87.32 | Subranged: 87.32 | 87.32 | Same |
Disclaimer/Publisher’s Note: The statements, opinions and data contained in all publications are solely those of the individual author(s) and contributor(s) and not of MDPI and/or the editor(s). MDPI and/or the editor(s) disclaim responsibility for any injury to people or property resulting from any ideas, methods, instructions or products referred to in the content. |
© 2025 by the author. Licensee MDPI, Basel, Switzerland. This article is an open access article distributed under the terms and conditions of the Creative Commons Attribution (CC BY) license (https://creativecommons.org/licenses/by/4.0/).
Share and Cite
Jeong, T. A Novel Overload Control Algorithm for Distributed Control Systems to Enhance Reliability in Industrial Automation. Appl. Sci. 2025, 15, 5766. https://doi.org/10.3390/app15105766
Jeong T. A Novel Overload Control Algorithm for Distributed Control Systems to Enhance Reliability in Industrial Automation. Applied Sciences. 2025; 15(10):5766. https://doi.org/10.3390/app15105766
Chicago/Turabian StyleJeong, Taikyeong. 2025. "A Novel Overload Control Algorithm for Distributed Control Systems to Enhance Reliability in Industrial Automation" Applied Sciences 15, no. 10: 5766. https://doi.org/10.3390/app15105766
APA StyleJeong, T. (2025). A Novel Overload Control Algorithm for Distributed Control Systems to Enhance Reliability in Industrial Automation. Applied Sciences, 15(10), 5766. https://doi.org/10.3390/app15105766