Article

Application of Mathematical Models for Blood Flow in Aorta and Right Coronary Artery

by
Monica Minniti
,
Vera Gramigna
*,†,
Arrigo Palumbo
and
Gionata Fragomeni
Department of Medical and Surgical Sciences, University “Magna Graecia”, Viale Europa, 88100 Catanzaro, Italy
*
Author to whom correspondence should be addressed.
These authors contributed equally to this work.
Appl. Sci. 2025, 15(10), 5748; https://doi.org/10.3390/app15105748
Submission received: 13 March 2025 / Revised: 24 April 2025 / Accepted: 15 May 2025 / Published: 21 May 2025
(This article belongs to the Special Issue Biomechanics of Soft and Hard Tissues)

Abstract

:
Cardiovascular diseases represent one of the leading causes of mortality worldwide, underscoring the need for accurate simulations of blood flow to improve diagnosis and treatment. This study examines blood flow dynamics in two different vascular structures—the aorta and the right coronary artery (RCA)—using Computational Fluid Dynamics (CFD). Utilizing COMSOL Multiphysics®, various mathematical models were applied to simulate blood flow under physiological conditions, assuming a steady-flow regime. These models include both Newtonian and non-Newtonian approaches, such as the Carreau and Casson models, as well as viscoelastic frameworks like Oldroyd-B, Giesekus, and FENE-P. Key metrics—such as velocity fields, pressure distributions, and error analysis—were evaluated to determine which model most accurately describes hemodynamic behavior in large vessels like the aorta and in smaller and more complex vessels like the RCA. The results highlight the importance of shear-thinning and viscoelastic properties in small vessels like the RCA, which contrasts with the predominantly Newtonian behavior observed in the aorta. While computational challenges remain, this study contributes to a deeper understanding of blood rheology, enhancing the accuracy of cardiovascular simulations and offering valuable insights for diagnosing and managing vascular diseases.

1. Introduction

Understanding the dynamics of blood flow in the human cardiovascular system is essential for advancing medical research and improving the diagnosis and treatment of vascular diseases. Blood, a complex non-Newtonian fluid, exhibits unique rheological behaviors that significantly influence its movement through vessels of varying sizes and geometries. This is particularly important in large arteries like the aorta and smaller vessels such as the right coronary artery (RCA), where variations in vessel structure and blood properties play a critical role in health outcomes. Computational fluid dynamics (CFD) has become a powerful tool to simulate these flows, offering detailed insights into hemodynamic phenomena that are difficult to capture through experimental methods alone.
The current state of research emphasizes the significance of accurately modeling blood flow, as it directly relates to the understanding of various cardiovascular diseases, such as atherosclerosis, aneurysms, and coronary artery disease. Previous studies [1,2,3,4,5,6,7,8,9,10] have applied both Newtonian and non-Newtonian fluid models to simulate blood flow, with non-Newtonian models—such as shear-thinning (Carreau, Casson) and viscoelastic frameworks (Oldroyd-B, Giesekus, FENE-P)—offering more accurate representations of real physiological conditions. While these models provide improved insights, they also come with challenges in terms of computational cost and complexity. Moreover, controversies persist regarding the optimal model choice, especially in regions where large variations in shear rates and vessel geometries exist.
While previous studies [1,2,3,4,5,6,7,8,9,10] have contributed significantly to the understanding of blood rheology and its role in hemodynamics, many present specific limitations. Some works focus primarily on theoretical models [2,4,8], lacking direct application to real vascular geometries. Others investigate isolated anatomical regions or pathological conditions without systematically comparing multiple rheological models [3,5,7]. Additionally, studies that explore viscoelastic properties often do so in vitro [9] or within simplified frameworks such as the Windkessel model [10], without evaluating spatial flow dynamics in anatomically accurate structures like the aorta and RCA. These gaps underscore the need for an integrative CFD analysis that compares both Newtonian and non-Newtonian models—including viscoelastic ones—across different vascular scales and geometries.
This study aims to investigate blood flow in the aorta and the RCA using COMSOL Multiphysics®, comparing Newtonian and non-Newtonian models to evaluate their effectiveness in replicating physiological conditions. By analyzing differences in flow behaviors, such as velocity profiles, pressure distributions, and shear stress dynamics, the research seeks to improve understanding of how blood interacts with complex vascular environments. These findings have the potential to inform the identification of risk factors for vascular diseases, and contribute to the development of more accurate diagnostic tools and personalized therapeutic strategies.
In conclusion, this study underscores the importance of selecting the appropriate model in CFD simulations to achieve accurate predictions of blood flow. It highlights the need for continued exploration in the field to refine our understanding of hemodynamics and support advancements in cardiovascular healthcare.

2. Materials and Methods

This study employed a range of mathematical models to describe the rheological behavior of blood, focusing on both Newtonian and non-Newtonian properties. These models were selected to represent the specific characteristics of blood flow under varying conditions, and each was implemented with sufficient detail to allow replication by others in the field.

2.1. Mathematical Models

  • Newtonian Model: Assumes a constant viscosity irrespective of the shear rate. This model is suitable for large-caliber vessels like the aorta, where shear rates are high, and blood behaves nearly like a Newtonian fluid [2,3,4]. The Newtonian model simplifies calculations, making it computationally efficient but less accurate for small or highly deformable vessels.
  • Non-Newtonian Shear-Thinning Models:
    • Carreau Model: An empirical model that describes the decrease in viscosity with increasing shear rates. It captures the Newtonian plateaus at low and high shear rates and the intermediate pseudoplastic region. The Carreau model is expressed as follows:
      μ ( γ ˙ ) = μ + ( μ 0 μ ) 1 + ( λ γ ˙ ) 2 n 1 2
      where μ : viscosity at infinite shear rate (in Pa · s ), μ 0 : viscosity at zero shear rate (in Pa · s ), λ : relaxation time of the fluid (in seconds, s ), γ ˙ : shear rate (in s 1 ), and n: power-law index (dimensionless), which determines the degree of shear-thinning behavior. For n = 1 , the fluid behaves as a Newtonian fluid.
      The fluid behavior depends on the value of γ ˙ relative to 1 λ :
      If γ ˙ 1 λ , the fluid behaves as a Newtonian fluid.
      If γ ˙ 1 λ , the fluid exhibits power-law fluid behavior.
      The parameter values of the Carreau Model can be considered as follows (as reported in Fernandes et al. [6]):
      μ = 0.0035   Pa · s , μ 0 = 0.056   Pa · s , λ = 3.313   s , n = 0.3568 .
    • Casson Model: Incorporates a yield stress ( τ y ) below which the fluid does not flow. It is particularly suited for blood, considering the aggregation of red blood cells at low shear rates. Additionally, it predicts viscosity changes due to hematocrit (Hct) variations.
      The model is described by the following equations:
      μ = τ y γ ˙ + 2 τ y   N γ ˙ + N 2
      N = μ p 8 1 Hct
      where μ : dynamic viscosity (in Pa · s ), τ y : yield stress, the minimum stress required for the fluid to flow (in Pa ), γ ˙ : shear rate (in s 1 ), N : a parameter related to viscosity changes due to hematocrit variations (dimensionless), μ p : plasma viscosity, a constant property of the plasma (in Pa · s ), and Hct: hematocrit, the volume fraction of red blood cells in the blood (dimensionless, typically expressed as a percentage).
      The parameter values for this model, as reported in Fernandes et al. [6], are as follows:
      τ y = 0.625   Hct , Hct = 0.4 , μ p = 0.00145   Pa · s .
      Here, τ y is linearly proportional to Hct and the Hct value is 40% of blood volume.
      This model effectively captures the non-Newtonian behavior of blood and accounts for the effects of both yield stress and hematocrit on viscosity.
  • Viscoelastic Models [6]:
    • Oldroyd-B Model: The model describes blood as a viscoelastic fluid, combining a Newtonian solvent with elastic polymer-like components. Despite its computational simplicity, it lacks precision in capturing shear-thinning effects. The governing equation is given as follows:
      τ + λ 1 τ t = η 0 γ ˙ + λ 2 γ ˙ t
      where τ represents the stress tensor, λ 1 is the relaxation time, λ 2 is the retardation time, η 0 is the zero-shear viscosity, and γ ˙ denotes the shear rate. This model provides a basic framework for studying viscoelastic behaviors in complex fluids such as blood.
    • Giesekus Model: A nonlinear extension of the Oldroyd-B model, the Giesekus model incorporates a mobility parameter ( α ) to account for shear-thinning and elastic behaviors, making it more realistic for describing blood flow in geometrically complex vessels. The governing equation is expressed as follows:
      τ + λ 1 τ t L · τ τ · L T + α λ 1 η 0 τ · τ = η 0 γ ˙ ,
      where α is the mobility parameter ( 0 α 1 ), L represents the velocity gradient, τ is the stress tensor, λ 1 is the relaxation time, η 0 is the zero-shear viscosity, and γ ˙ denotes the shear rate.
    • FENE-P Model (Finitely Extensible Nonlinear Elastic—Peterlin): Based on molecular theory, it describes the elasticity of long polymer chains while incorporating a finite extensibility factor. This makes it particularly suitable for modeling high-stress conditions, such as blood flow through stenosed arteries or within mechanical circulatory devices. The governing equation is expressed as follows:
      τ + λ τ t L · τ τ · L T = η 0 γ ˙ ( f ) + λ η 0 η p ( f τ ) ,
      where f is the finite extensibility factor (set to 100), η p is the polymer viscosity, η 0 is the zero-shear viscosity (set to 0.03 Pa·s), and λ is the relaxation time (set to 0.001 s). The FENE-P model captures the nonlinear elastic behavior of polymers, making it highly effective for applications involving significant stress and deformation.
These models were implemented in COMSOL Multiphysics® (Version 6.3) software [11], allowing for detailed simulations of blood flow in both large (aorta) and small (right coronary artery, RCA) vessels. The ability of each model to replicate shear stress, velocity profiles, and pressure distributions was systematically analyzed, highlighting their respective strengths and limitations.

2.2. Geometric Models

The two vessels considered in our study are very different from each other in terms of size: the aorta, being the main vessel of the human body, has a diameter that typically varies between 20 and 30 mm, while the right coronary artery has a diameter significantly smaller, usually between 2 and 5 mm. This difference in size reflects their different functions: the aorta is responsible for distributing oxygenated blood throughout the body, while the RCA is responsible for supplying blood to the heart muscle. Finally, the geometry and flexibility of the coronary artery may vary (both inter- and intra-patient) more pronouncedly than that of the aorta. The coronary arteries therefore have a smaller diameter, more pronounced curvature compared to the aorta, and greater anatomical variability, factors which could give rise to shear-thinning behavior (reduction in viscosity with increasing shear rate) and other typical effects of non-Newtonian fluids. In contrast, the aorta, being a vessel of large diameter and having a more laminar flow, tends to behave like a Newtonian fluid, whose viscosity remains constant and proportional to the shear stress. This difference in rheological behavior between coronary arteries and the aorta is crucial for understanding blood flow dynamics and the clinical implications associated with cardiovascular disease.
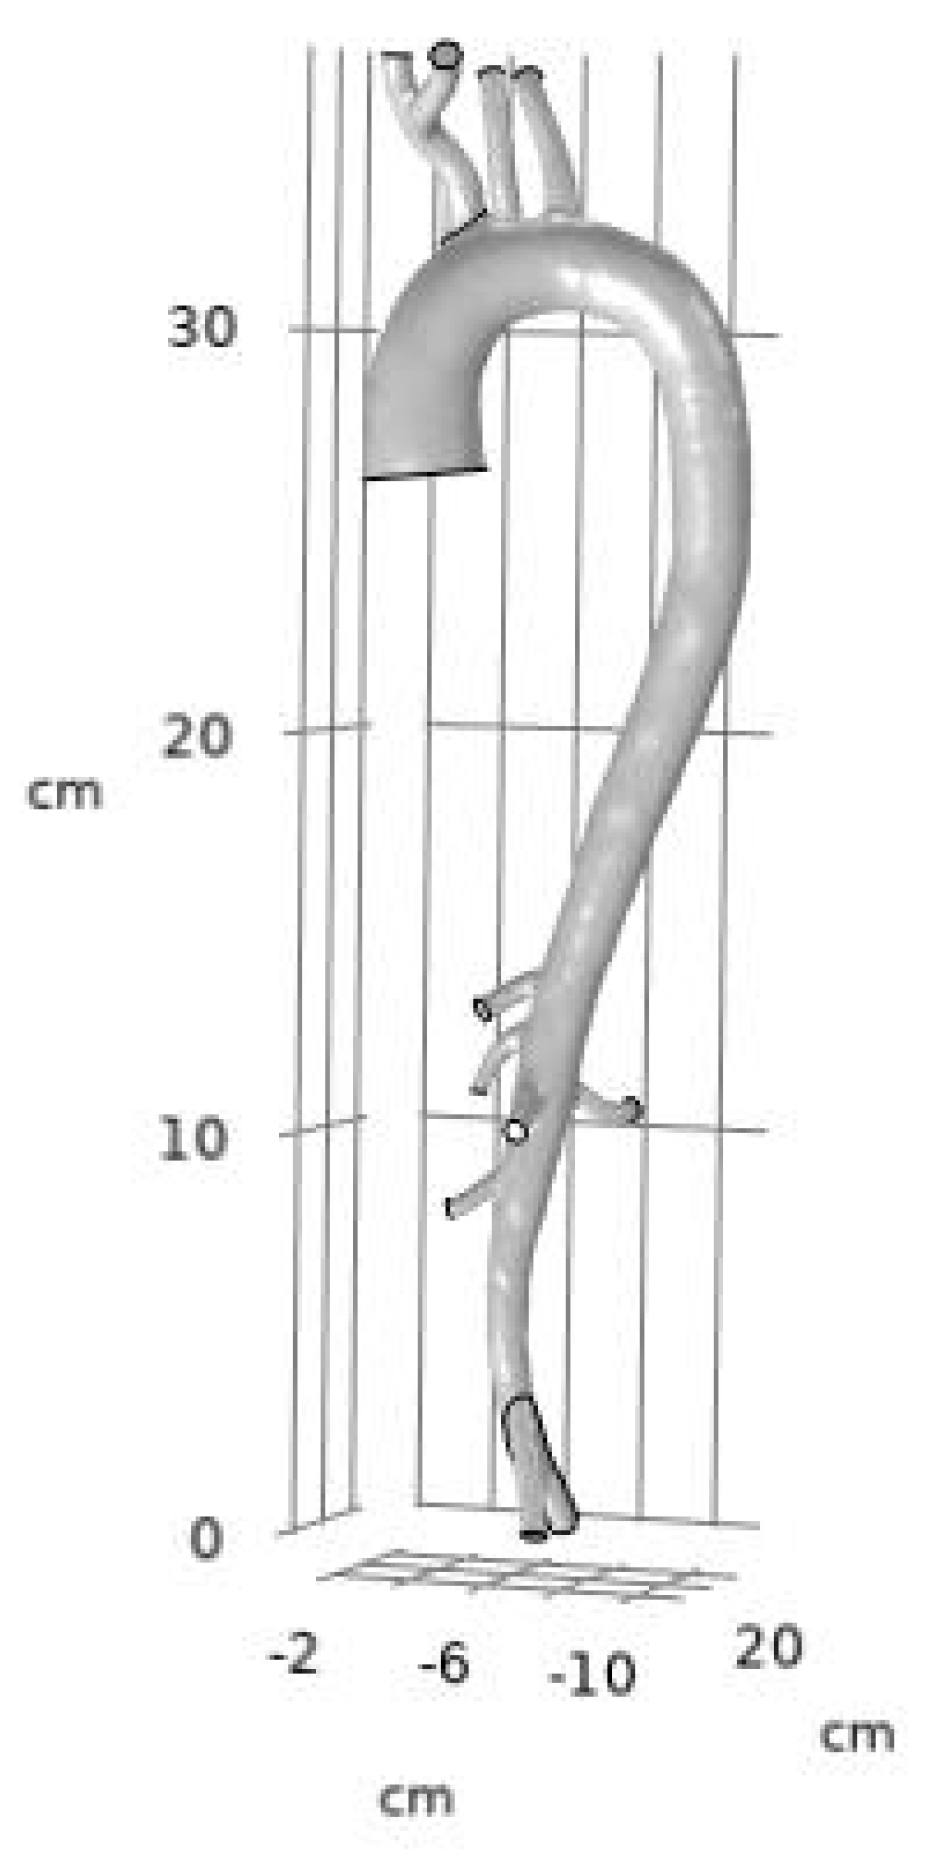
  • Three-Dimensional Geometric Model of the Aorta:
The geometric model used, developed by Caruso et al. [12], represents a specific aorta of a 50-year-old woman (height 160 cm), obtained from a CT scan performed for clinical purposes. The DICOM image sequence included 512 slices in the axial plane, 416 in the sagittal plane, and 88 in the coronal plane, with an in-plane resolution of 0.9375 × 0.9375 mm and a slice thickness of 1.4 mm. Written patient consent was obtained for the use of the medical images in the study, and this patient was chosen because she did not present any aortic diseases, such as aneurysms or dissections. The aorta was reconstructed through a segmentation process using the open-source software 3D Slicer. Subsequently, a reverse engineering algorithm was applied to obtain a more accurate virtual 3D model, suitable for computational analysis. The final model (shown in Figure 1) includes the ascending aorta, the aortic arch, the major vessels, and the descending trunk with abdominal vessels, and extends to the iliac arteries. The diameter of the aorta in the descending trunk is approximately 21 mm at the level of the aortic arch and 16 mm at the level of the renal arteries.
  • Three-Dimensional Geometric Model of the RCA:
The 3D model of the right coronary artery, developed by Caruso et al. [13], is specific to a 64-year-old male patient and was obtained using a series of angiograms acquired during a standard angiography performed for clinical purposes. Written consent was obtained for the use of the medical images. Since the coronary arteries are compressed by the contraction of the cardiac muscle during systole, myocardial perfusion primarily occurs during the diastolic phase, when the muscle relaxes. For this reason, the geometric model was reconstructed considering the end of diastole. The true curvature of the vessel was obtained by combining the centerline path from the LAO (Left Anterior Oblique) and RAO (Right Anterior Oblique) views. The variation in diameter was modeled assuming a circular shape. Moreover, in order to obtain the real anatomy of the vessel, the known caliber of the catheter (6 Fr) was used, so the others measurements were obtained by means of a proportion. The RCA model (shown in Figure 2) includes the proximal segment, the mid-segment, and the distal segment (collateral branches were neglected).

2.3. Boundary Conditions

We defined the boundary conditions that, together with the initial conditions set to define the starting state of the fluid (blood) in the computational domain, were fundamental to ensure that the simulation was well posed and could proceed with the iterative process for solving the system of equations until convergence was reached. A no-slip condition was imposed on the walls, meaning zero velocity at these surfaces [14,15]. The rigid wall assumption causes small errors in the estimation of the fluid dynamic parameters. However, this should not influence our results, because the general flow characteristics remain similar [16,17]. Furthermore, the level of uncertainty in the patient-specific domain for vascular tissue, as well as the significant increase in computational costs of fluid–structure interaction (FSI) simulations, make this approximation currently the best compromise between accuracy and efficiency for clinical purposes [18,19,20]. In some cases, the stiffness of the vessels is increased so significantly that the hypothesis of a rigid wall may be valid.
For steady-state simulations, the maximum value of the pulsatile flow rate (corresponding to the systolic peak) was applied at the inlet, while pressure was specified at the outlet. Specifically:
  • Aorta: At t = 0.13   s , the inlet flow rate is Q in = 450   mL / s = 450 × 10 6   m 3 / s [21], and the outlet pressure is P out = 70   mmHg = 9332.54   Pa [22].
  • RCA: At t = 0.2   s , the inlet flow rate is Q in = 2.25   mL / s = 2.25 × 10 6   m 3 / s [23], and the outlet pressure is P out = 133   mmHg = 17 , 731.83   Pa [24].

2.4. Simulation Details

In this study, COMSOL Multiphysics® 6.3 was used to simulate blood flow dynamics in the aorta and RCA. To discretize the computational domain, tetrahedral elements were employed, automatically generated by the software’s default settings. Mesh quality was visually inspected to ensure the absence of distorted cells, which could compromise solution reliability. Both for the aorta and for the RCA, the mesh consisted of approximately 450k elements. Refinement was increased near walls, outlets, and geometric transitions to improve accuracy.
For the viscoelastic FENE-P model in the aorta, additional refinement was applied below the renal artery to address issues in this critical area, using the “Size” tool to enhance mesh density. The final simulations used a physics-controlled “fine” mesh size, balancing accuracy and computational efficiency. The solvers employed were GMRES for the aorta and both PARDISO and GMRES for the RCA, with convergence achieved at a residual error tolerance of 10 6 . The computational times required for solving the Navier–Stokes equations varied across models: aorta simulations took at least twice as long as RCA simulations and were even more computationally intensive for viscoelastic models.
To solve the Navier–Stokes equations, the following choices were made: the Pardiso solver with a pivoting perturbation of 1.0 × 10 13 , the P1–P1 finite element method for spatial discretization with linear elements for both velocity components and the pressure field, and the P1–P2 finite element method for viscoelastic simulations to ensure greater accuracy and stability in capturing complex flow behaviors.

2.5. Algorithm for Calculating the Error

Once the geometrical models were imported into COMSOL, various measurements were performed, including volume (over the entire domain) and surface areas (including individual inlet and outlet surfaces, such as the aorta, for which the total area was obtained by summing 12 different sections, as shown in Figure 1). These measurements allowed us to calculate the true theoretical values a priori, therefore defined “calculated”—for example, by calculating the average velocity at the inlet and outlet surface as the flow rate divided by the corresponding cross-sectional area.
The relative error for each quantity was then computed by comparing the values obtained post-processing from the software (derived from the CFD simulation and therefore called “simulated”, reported in Section 3 as Derived Values) with the true theoretical values (calculated beforehand based on the geometry or values set such as the inlet flow rate and the outlet pressure).The relative error was therefore calculated as follows:
E r = simulated value calculated value calculated value
Relative errors for the aorta and RCA are presented in Section 3.

3. Results

In this section, we present the simulation results obtained using COMSOL post-processing tools, focusing on the velocity field under the assumption of rigid vessel walls (no fluid–structure interaction). Several studies have investigated the impact of arterial geometry and treatment approaches on hemodynamics using computational fluid dynamics (CFD) simulations, highlighting the relevance of flow distribution and wall shear stress parameters [25,26,27].

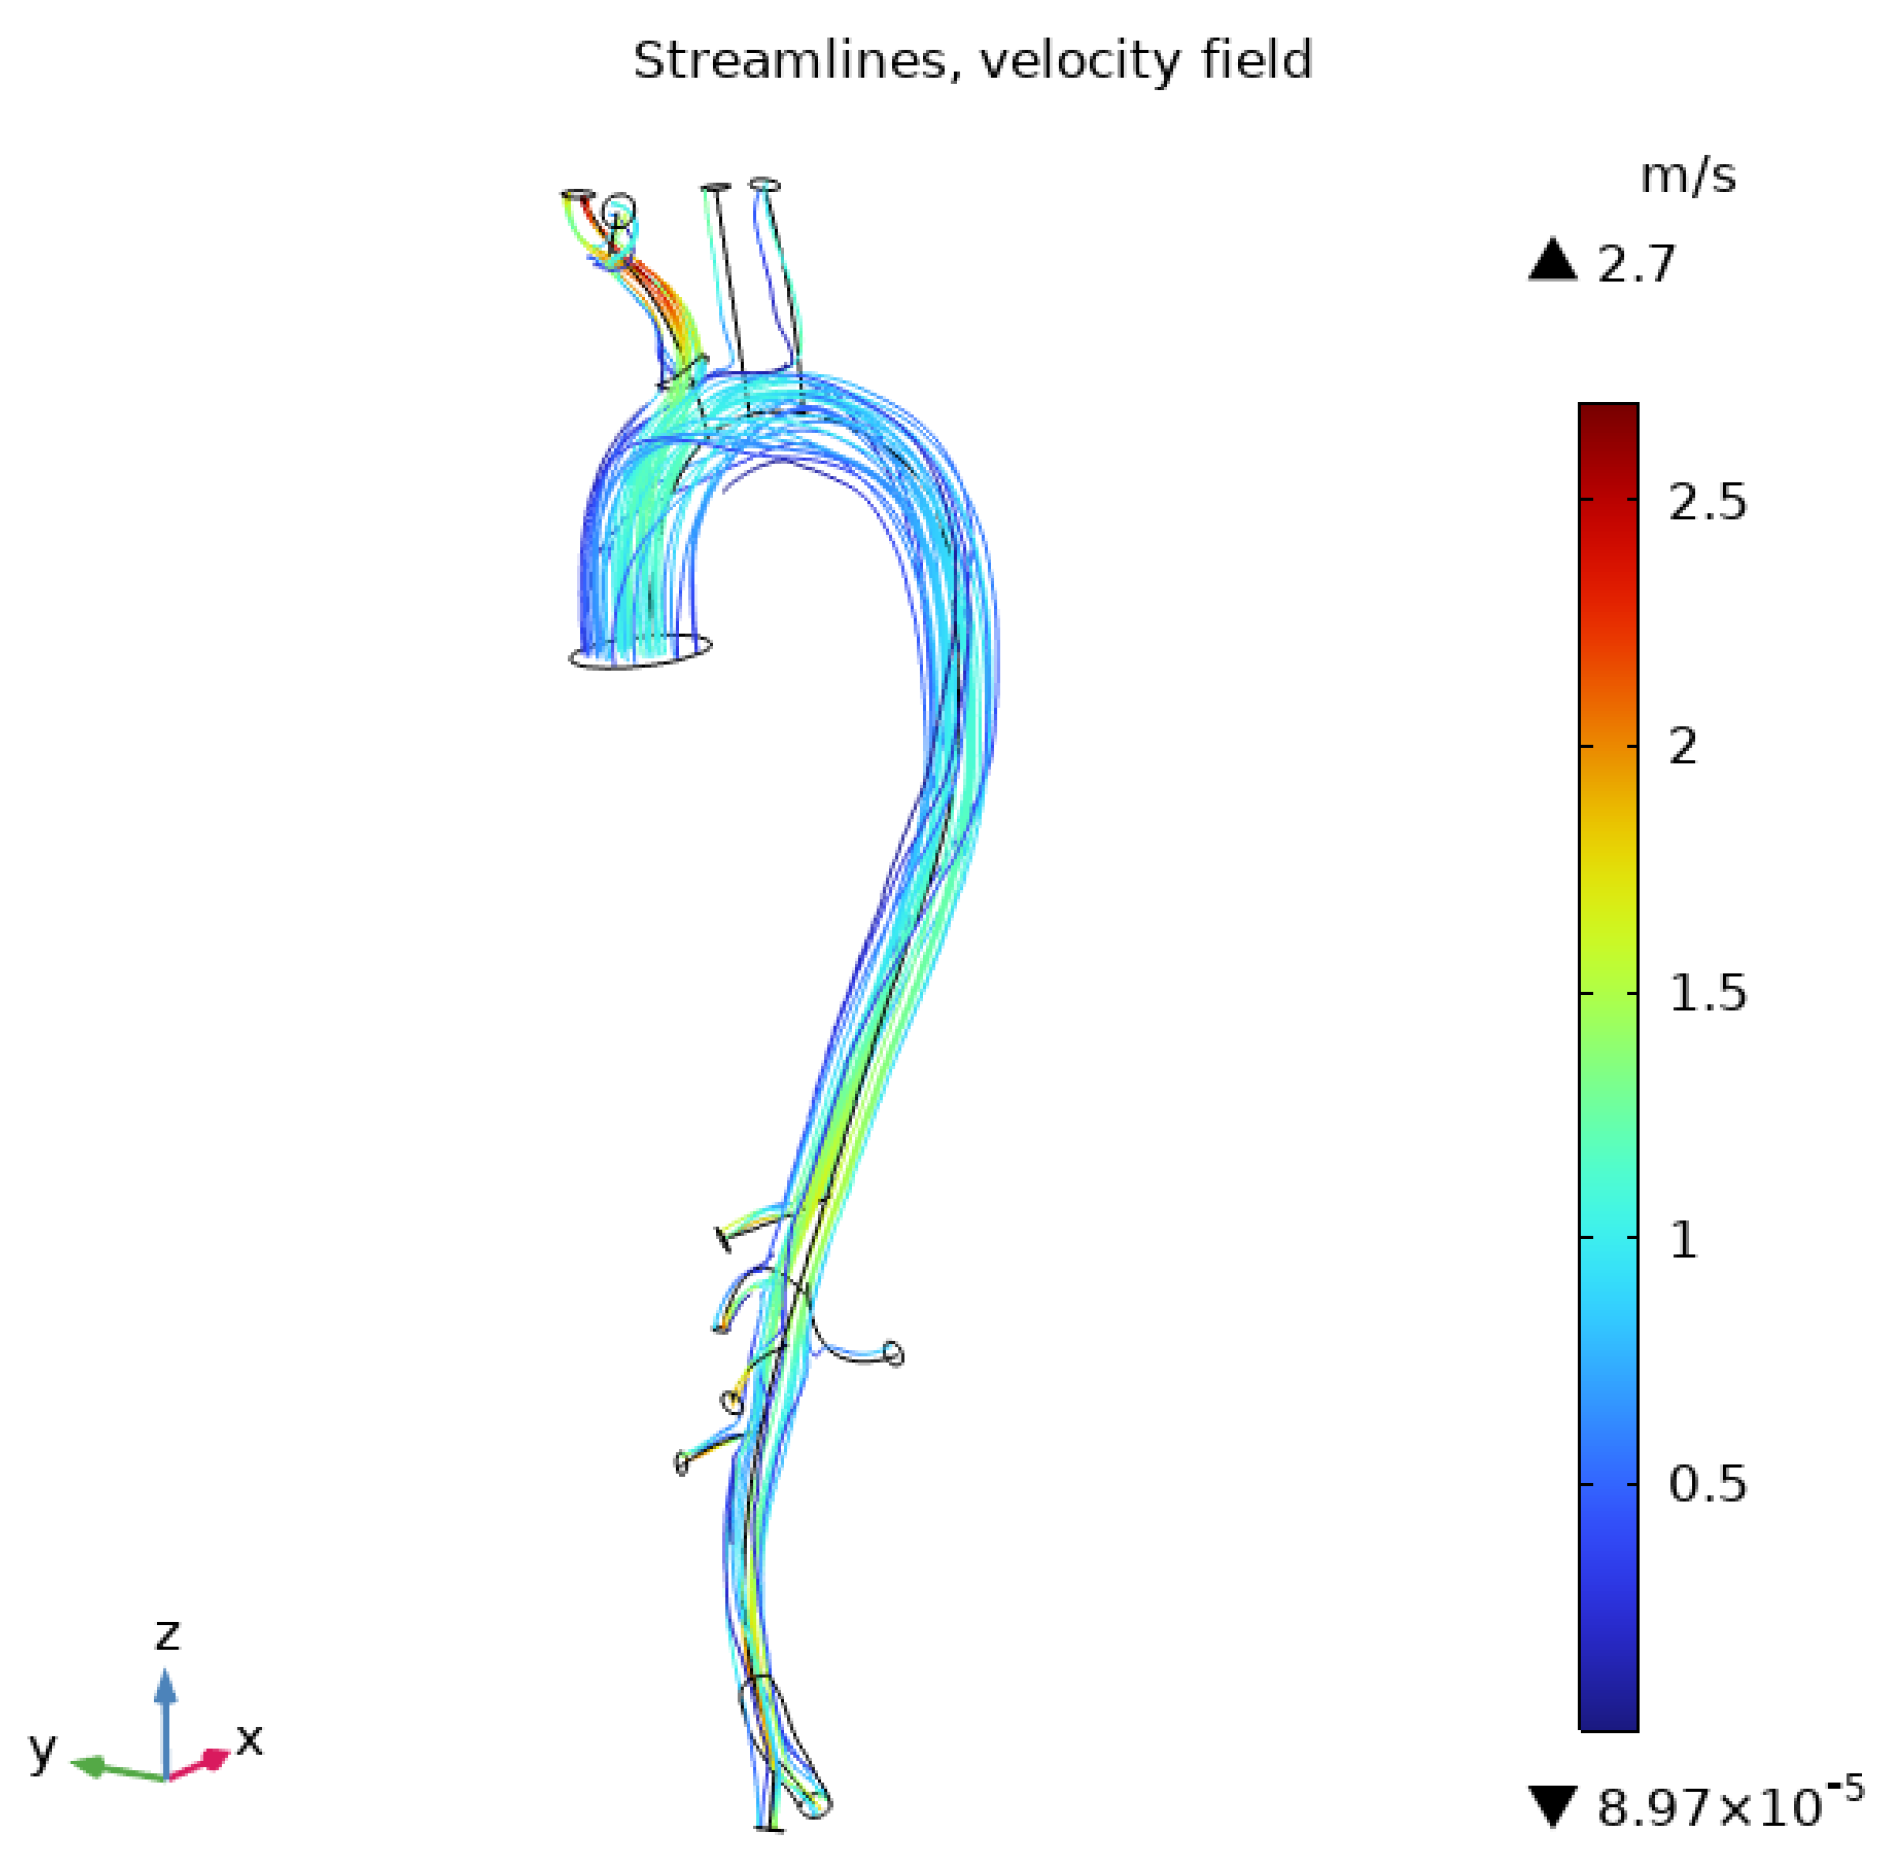
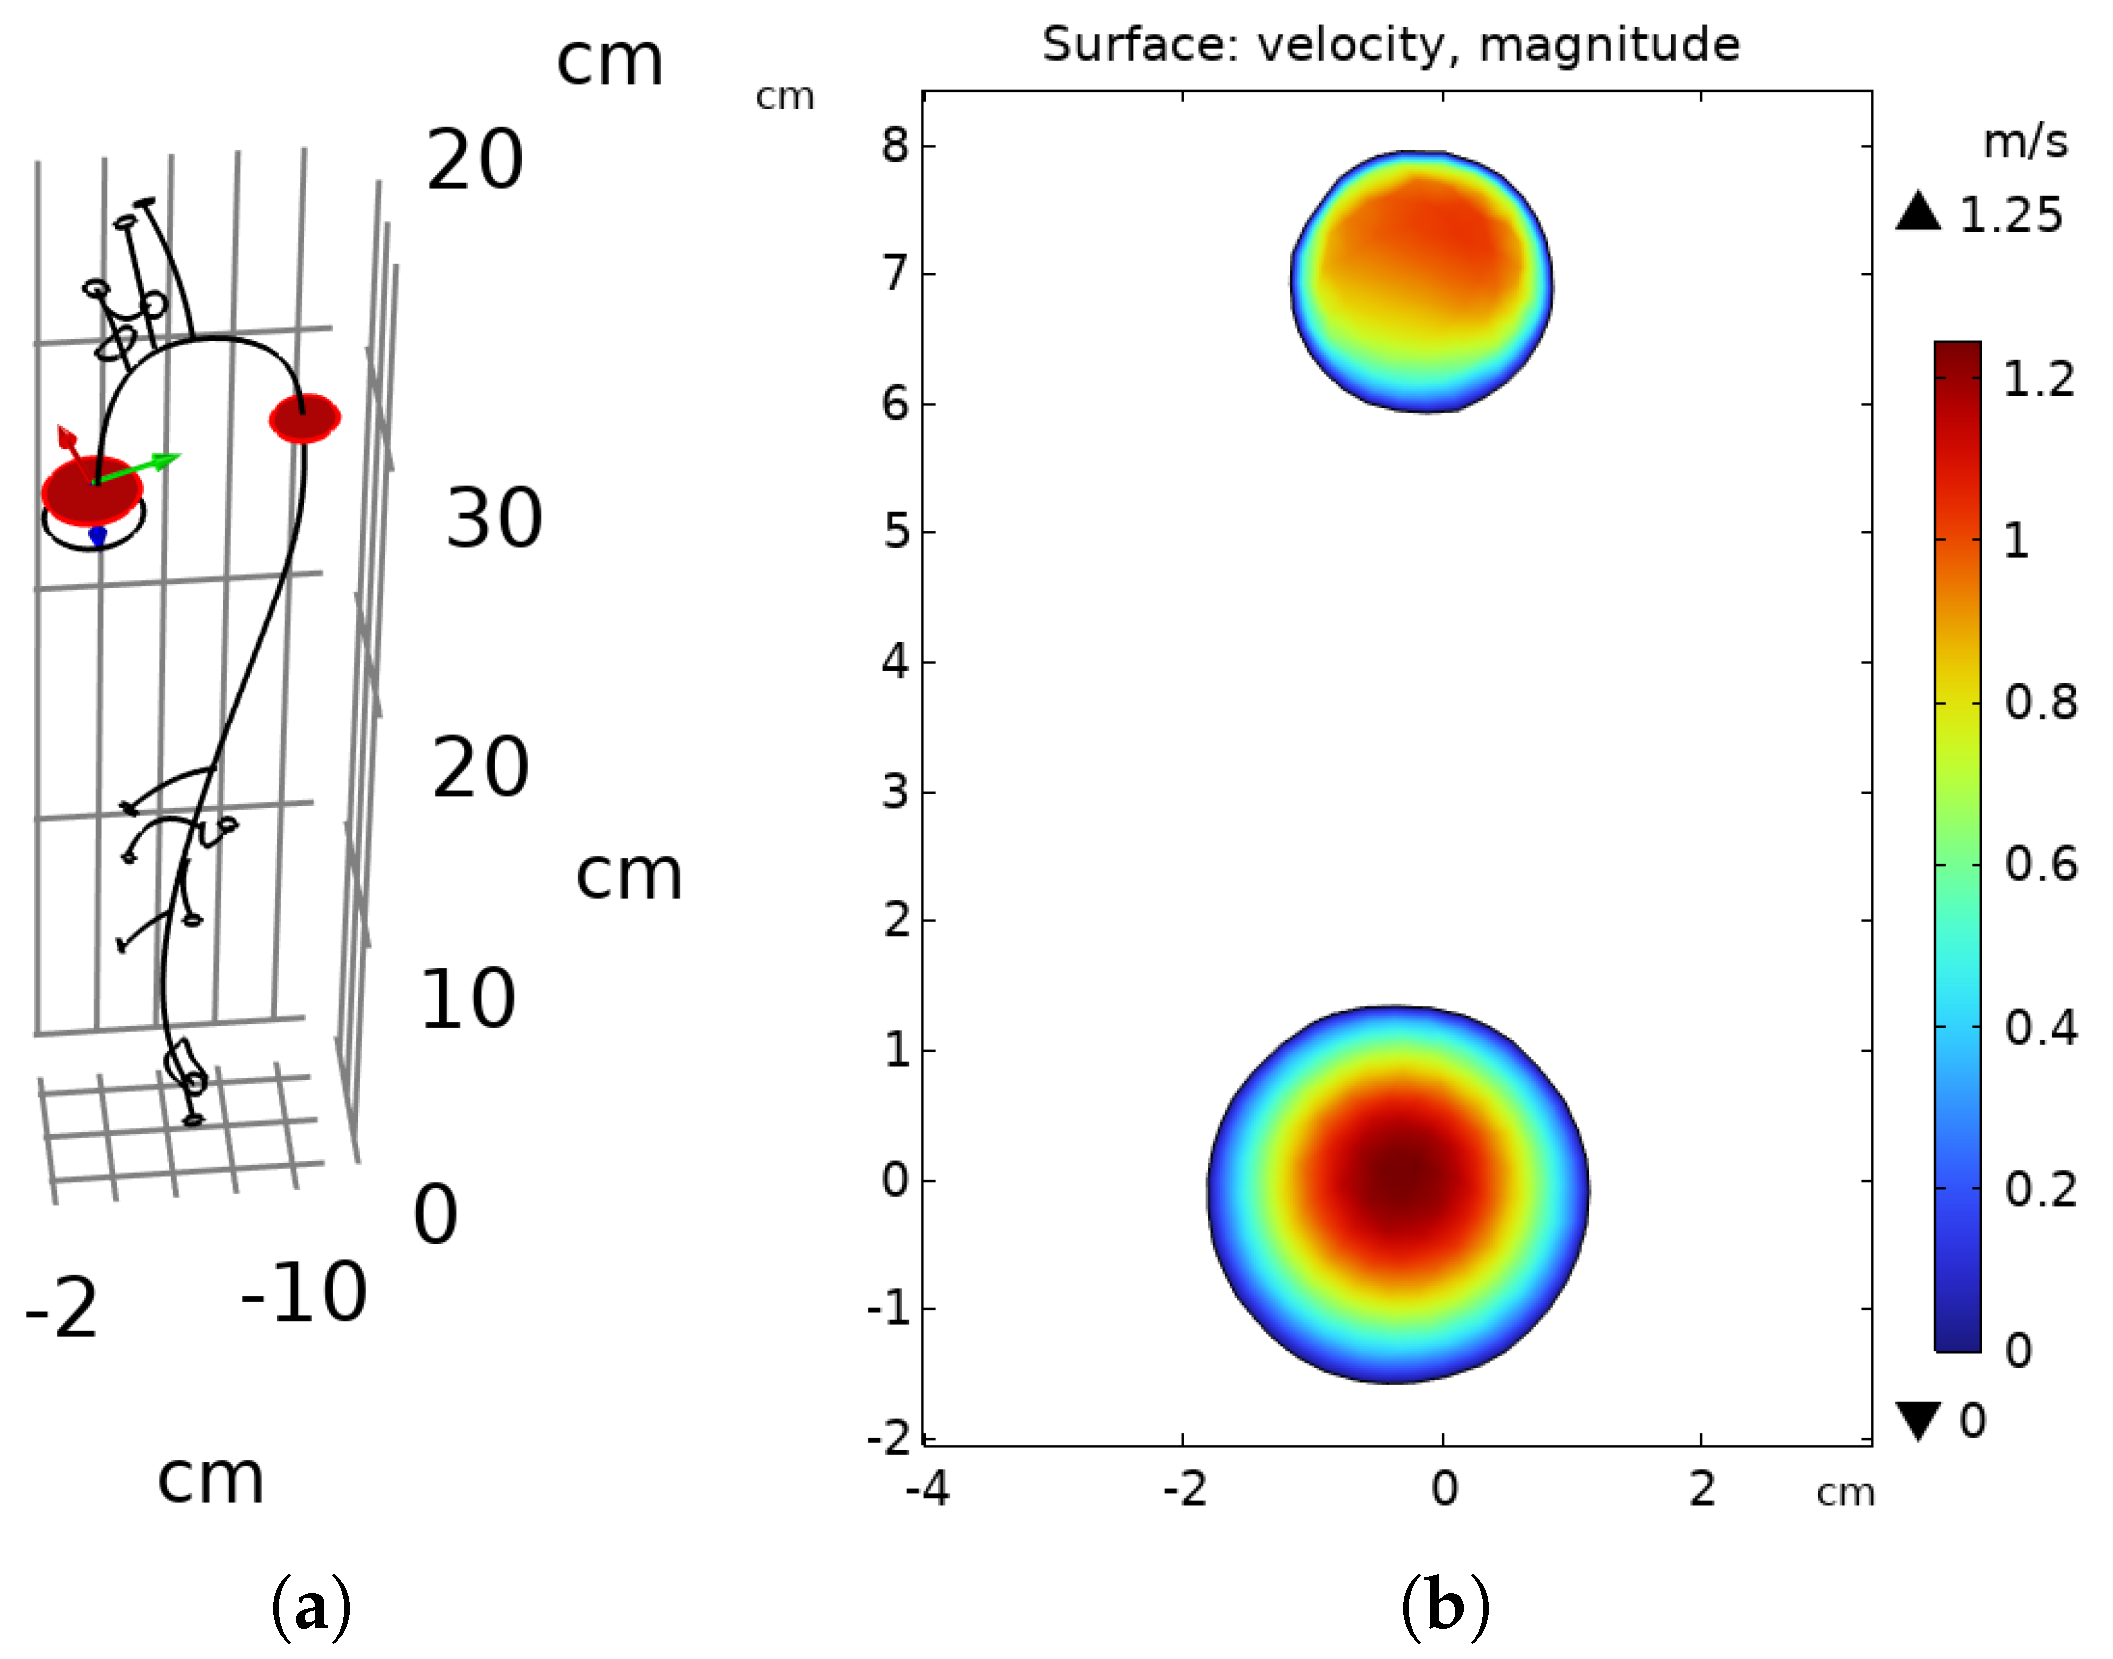
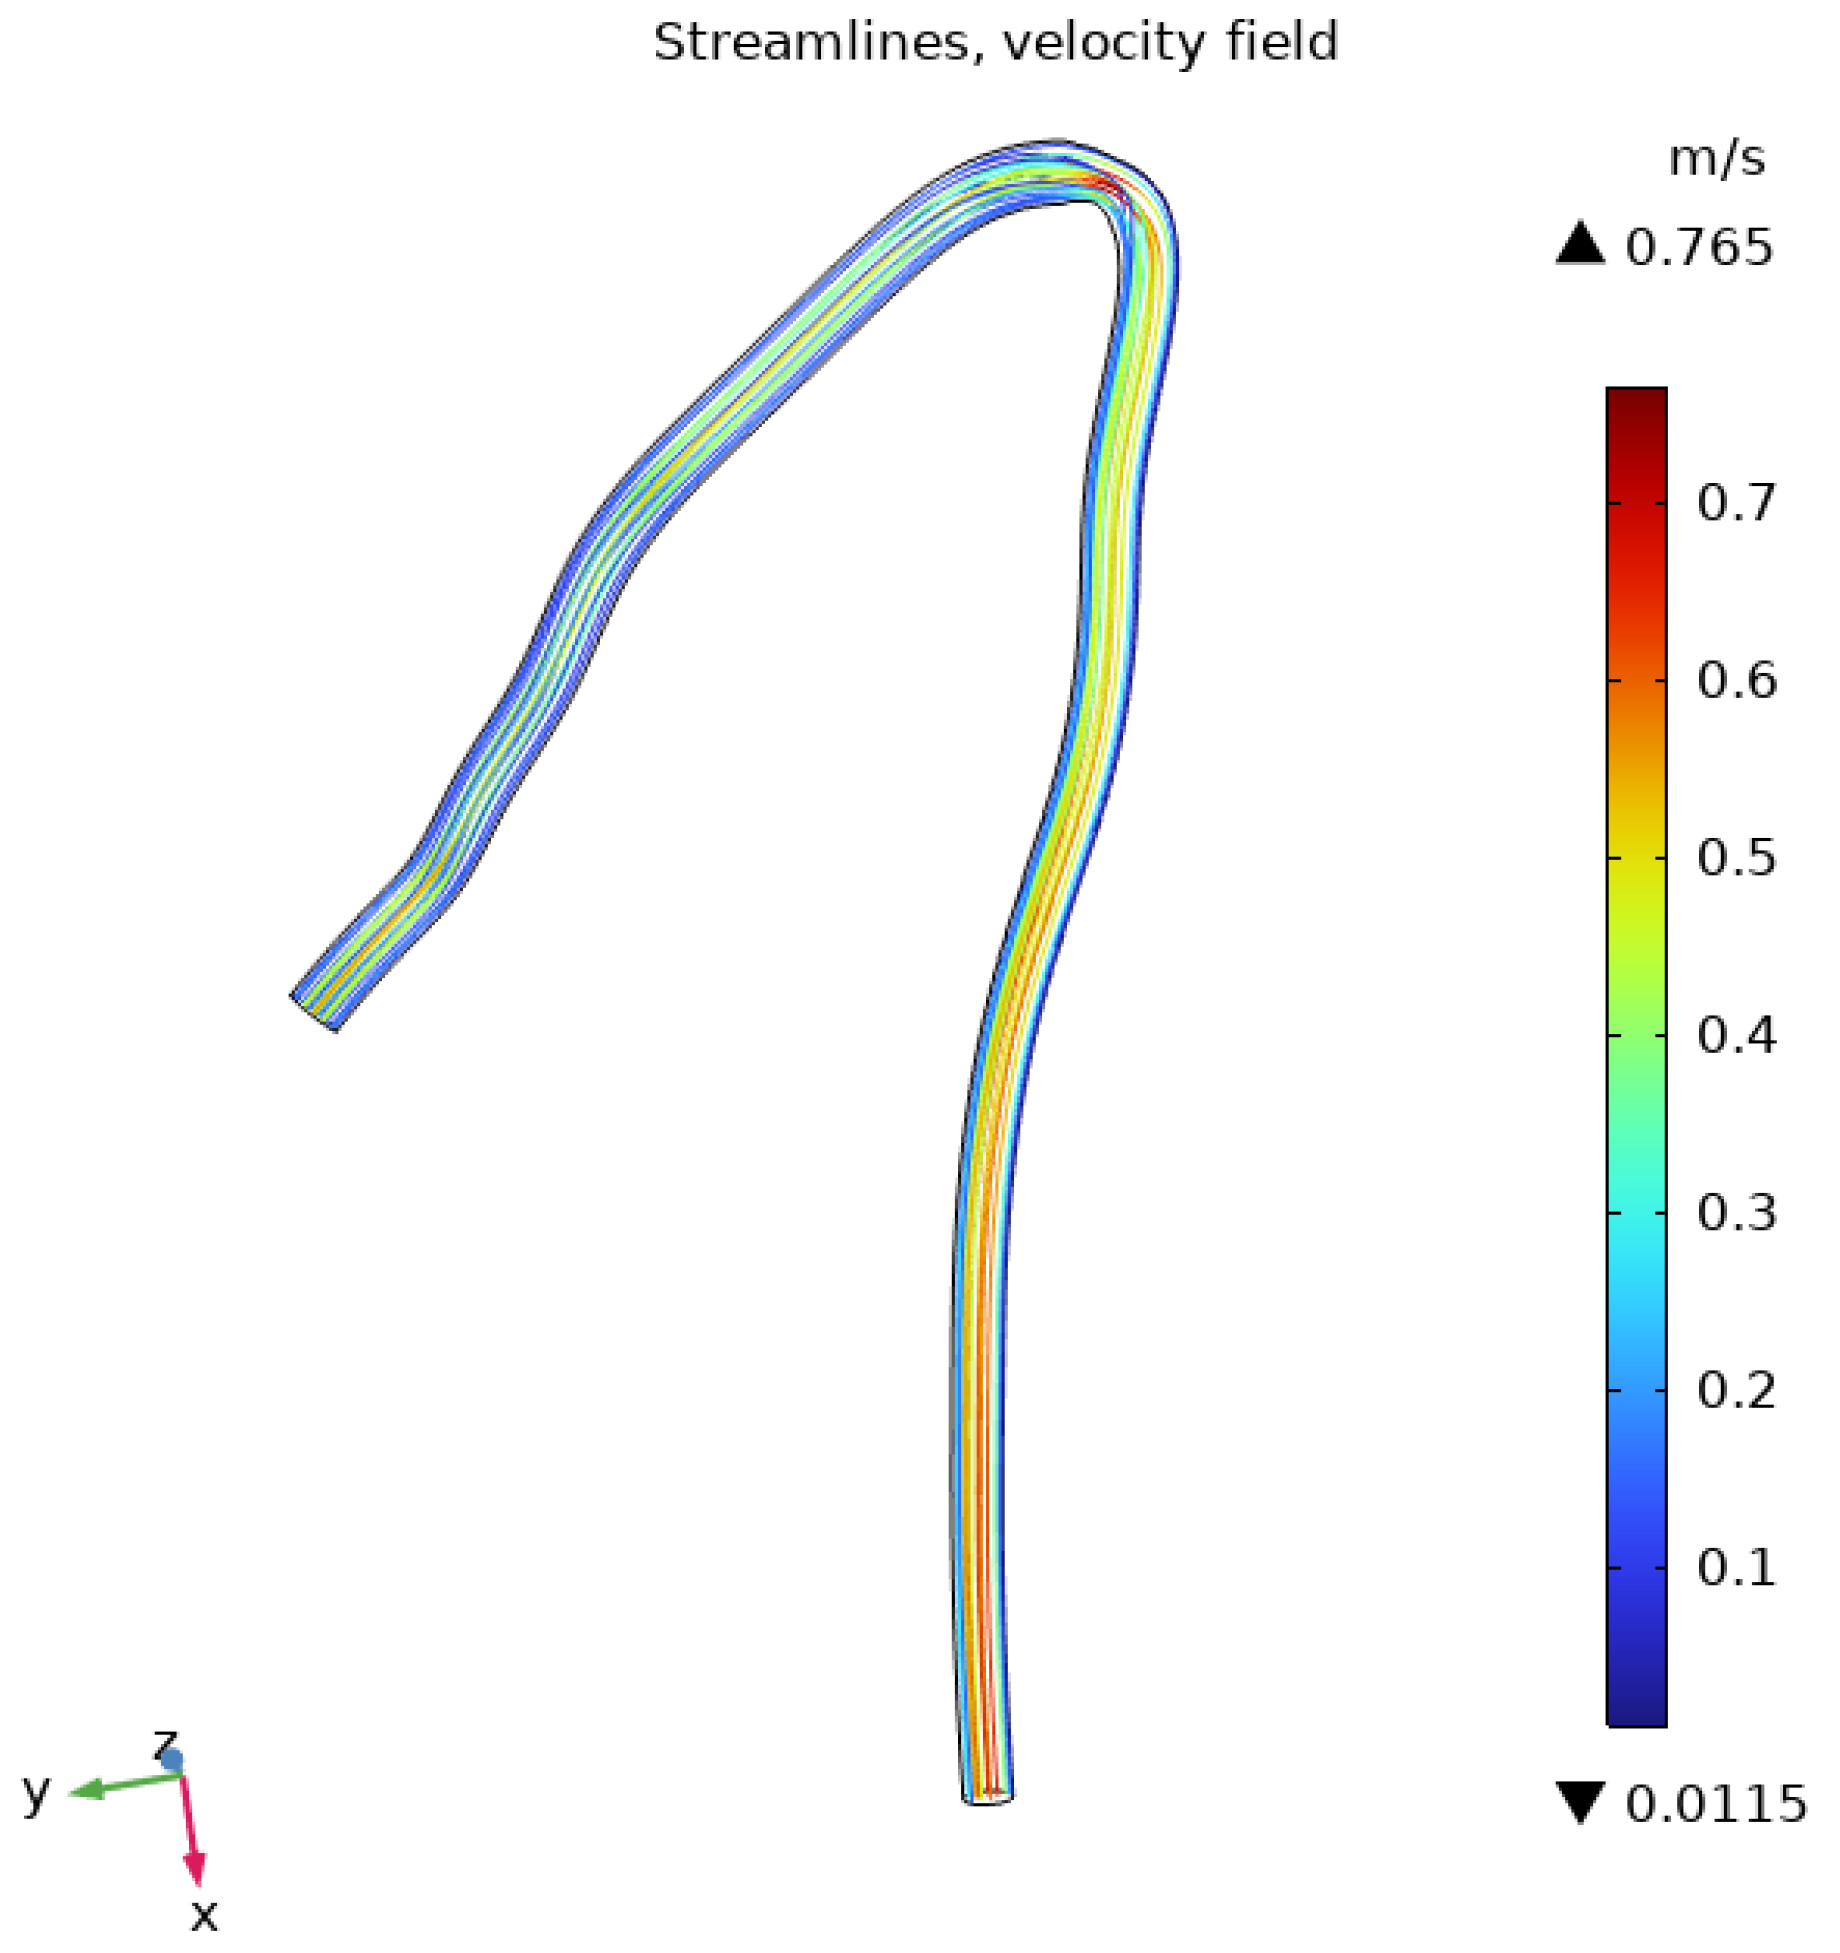
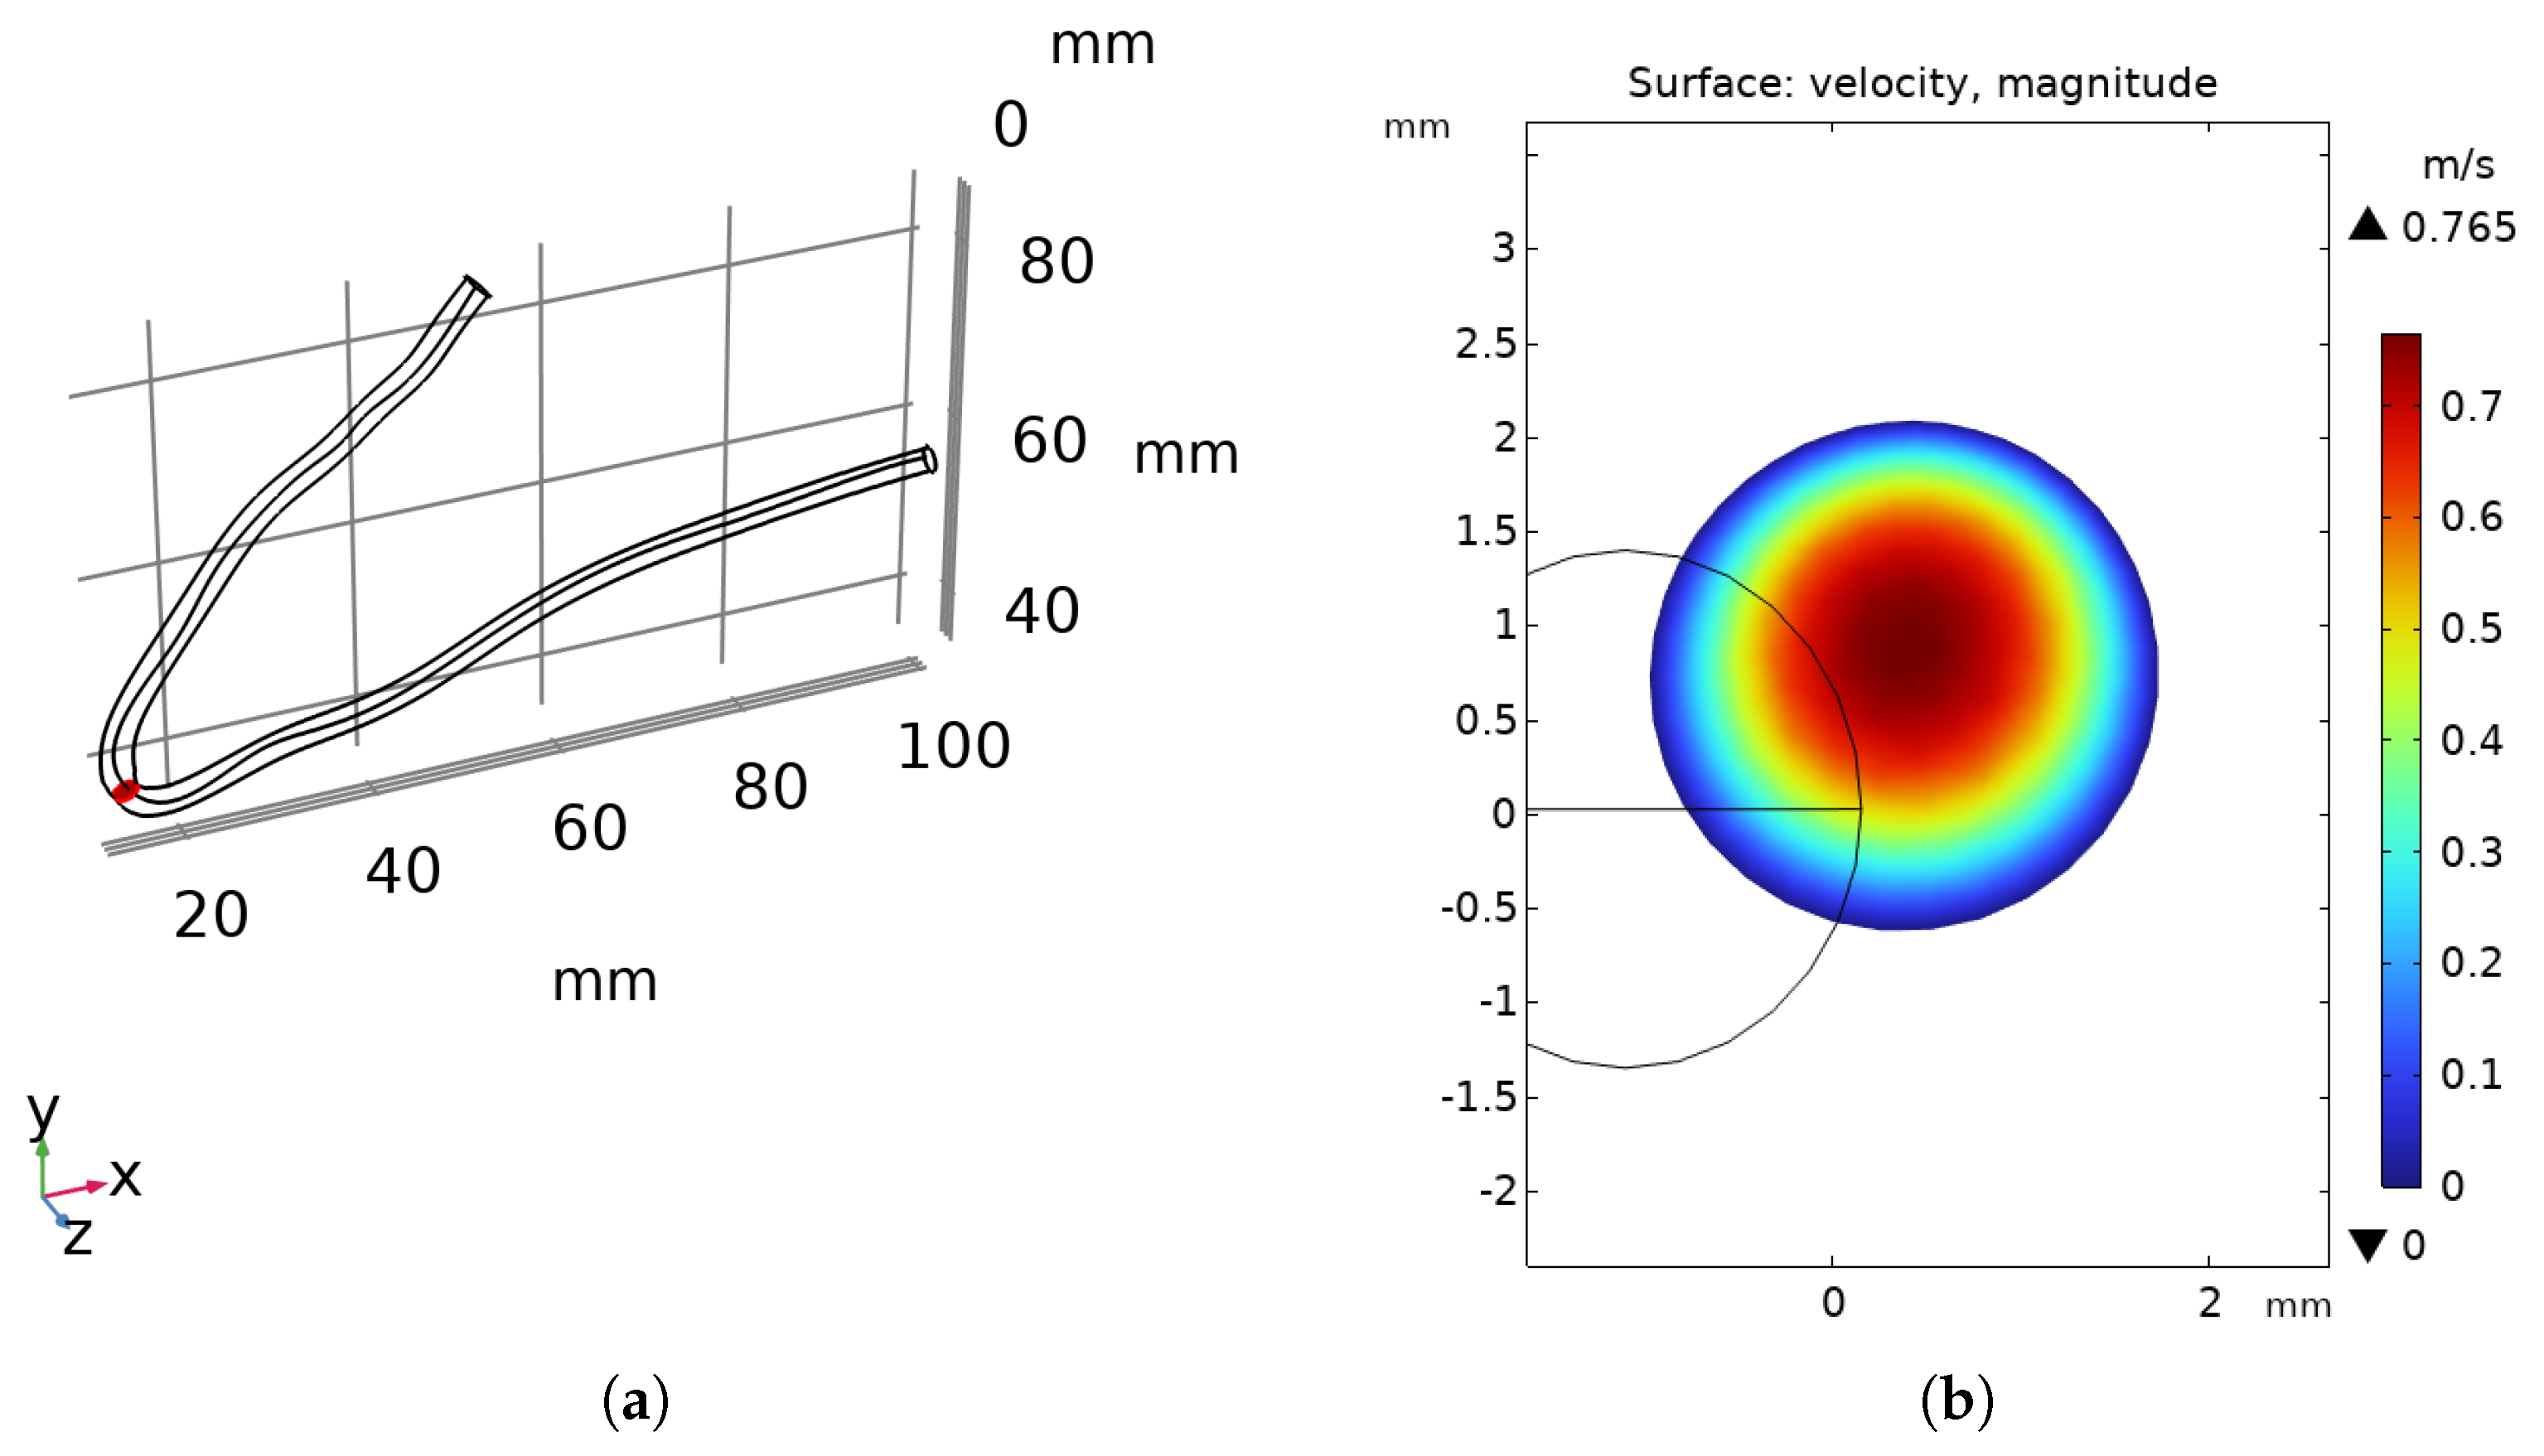
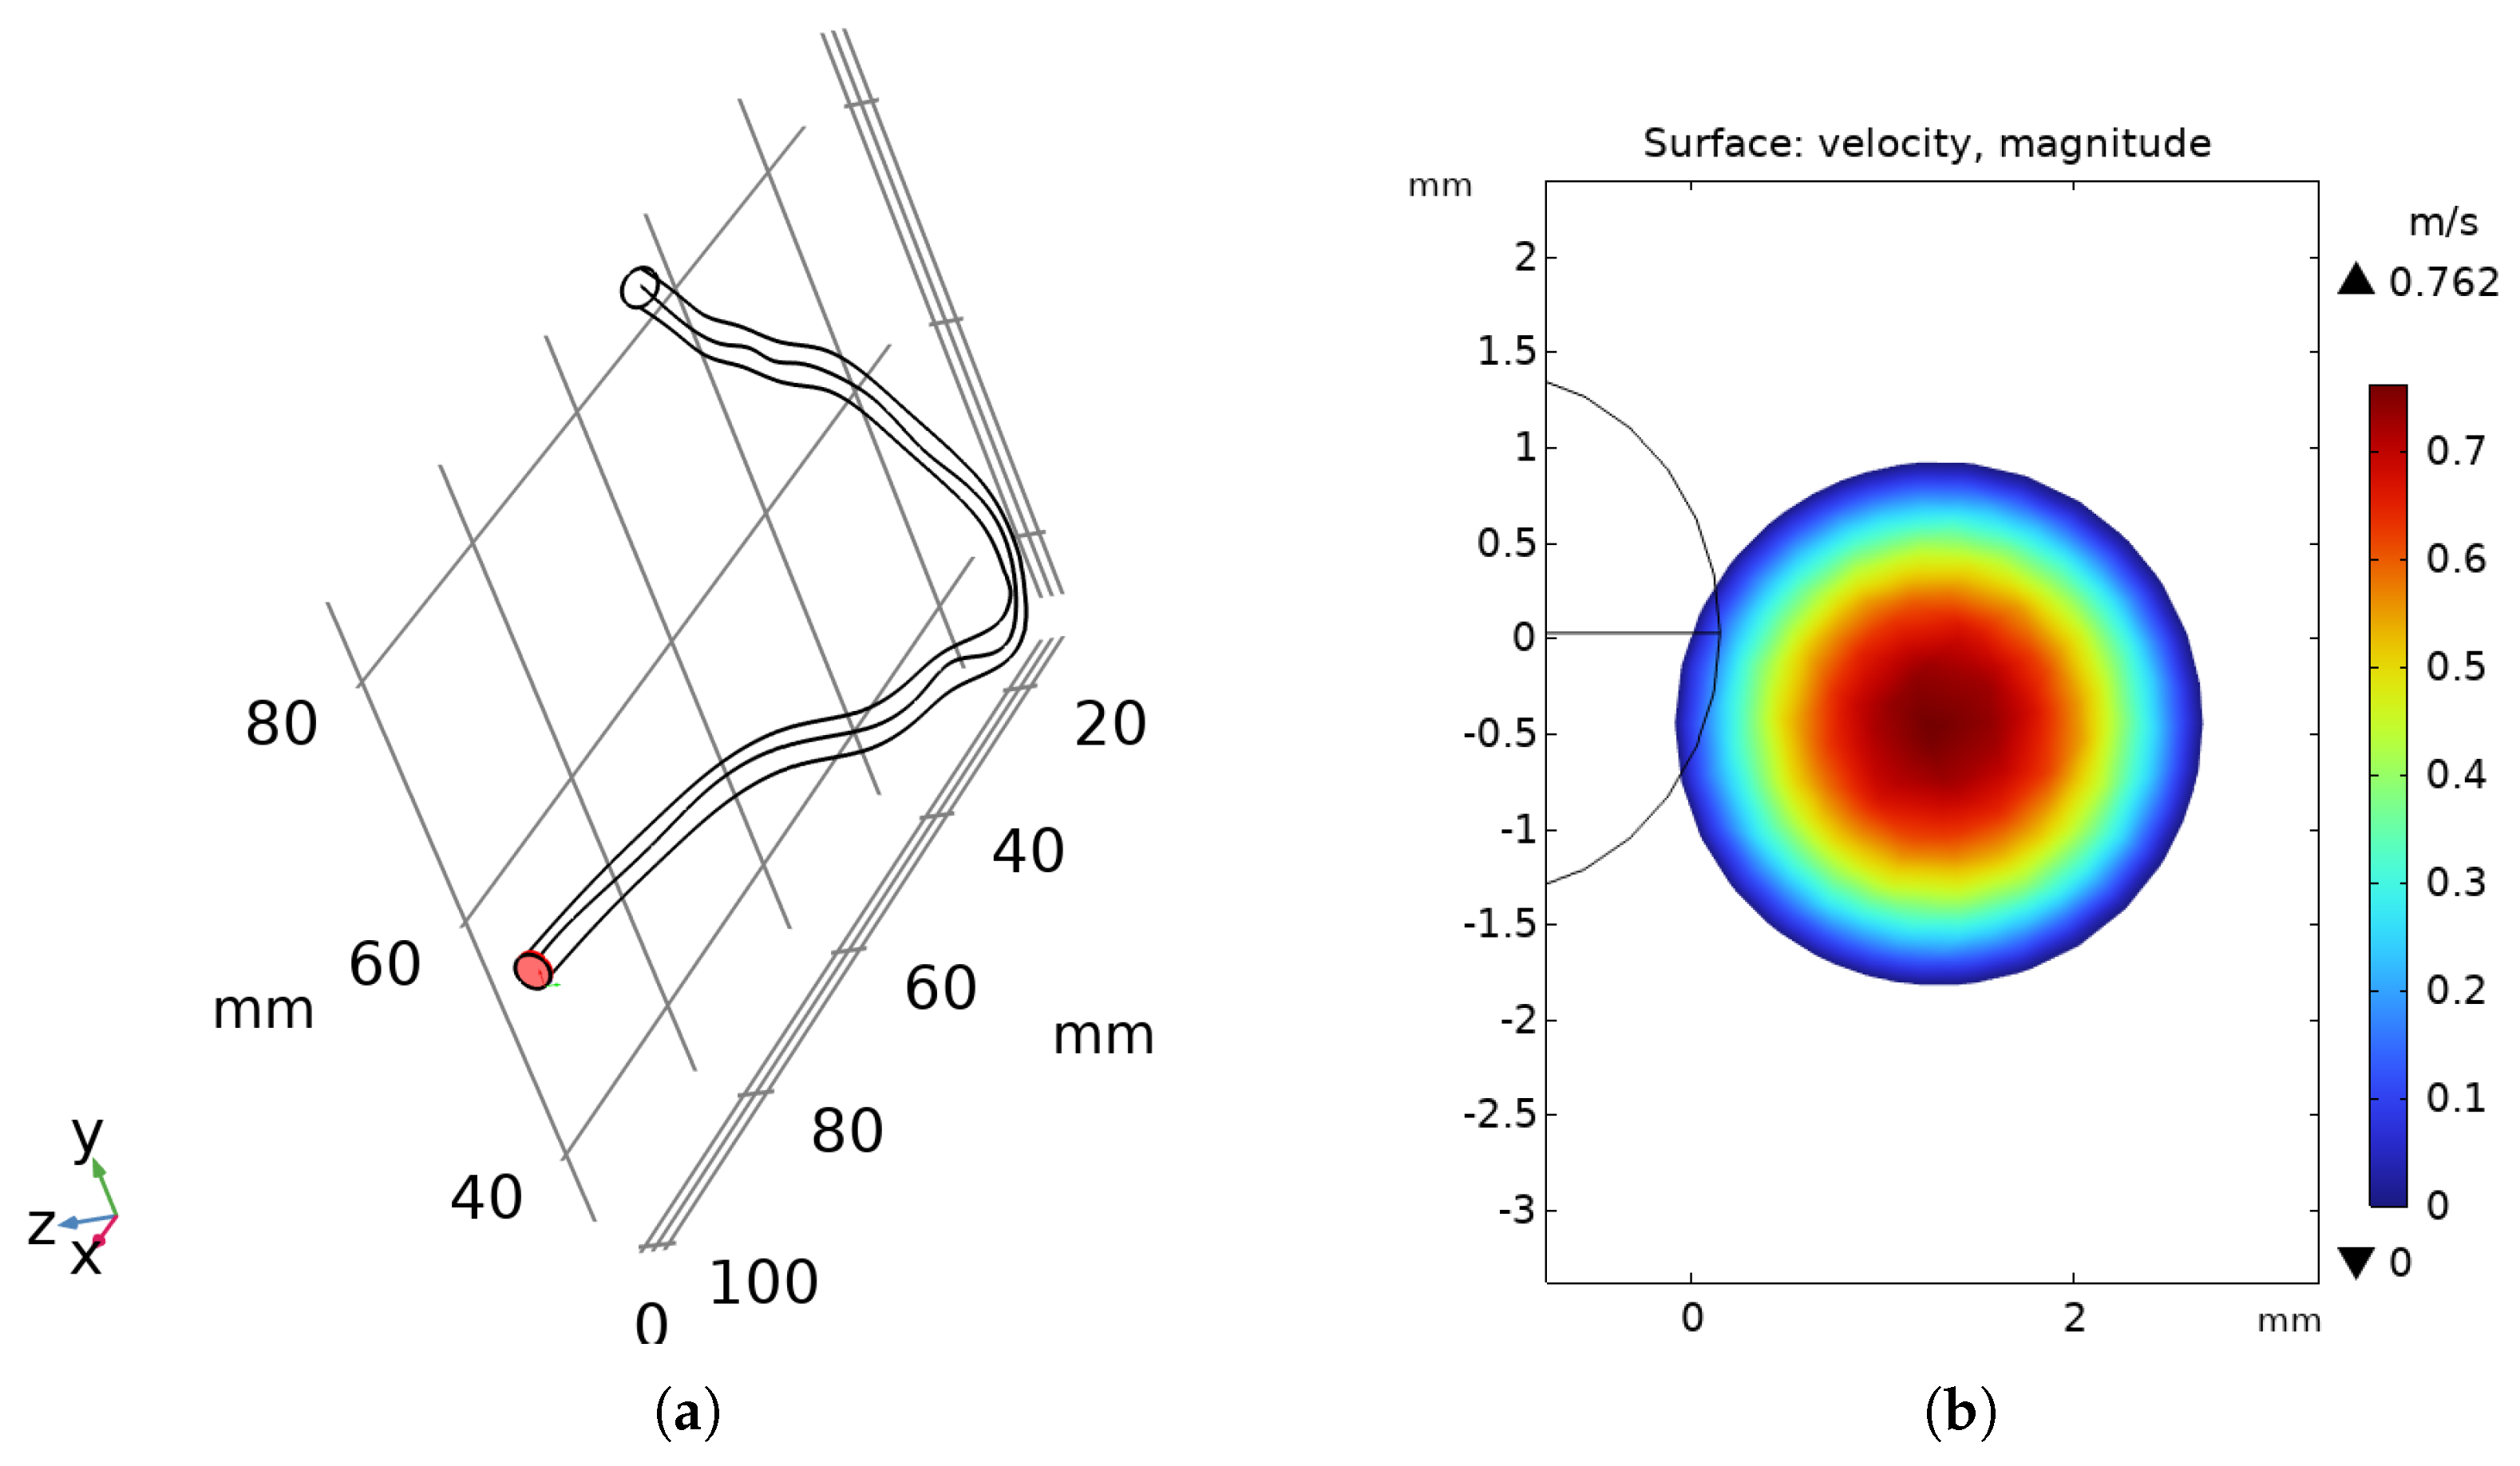
3.1. Flow Behavior in the Aorta

We focused on the visualization of streamlines, as shown in Figure 3. In particular, it provides a detailed and intuitive representation of the velocity field intensity distribution along the yz-plane. The highest velocities are observed at the center of the epiaortic branches, with a maximum velocity of 2.7 m/s reached within the right carotid artery, originating from the brachiocephalic artery. Significant velocities are also present in the lower outlet branches, particularly in the renal and mesenteric arteries.
Figure 3 illustrates the streamlines of the flow considering the Newtonian model, confirming that the flow remains laminar under these physiological conditions.
A cutting plane (shown in Figure 4a) was created near the inlet section, which also intersects the descending aorta just downstream of the aortic arch, and in these sections, velocity was observed (Figure 4b).
As shown in Figure 4b, the maximum velocity is observed at the center of the vessel, where the velocity gradient is minimal, resulting in low shear rate values. Conversely, near the vessel walls, the velocity rapidly decreases to zero, creating steep velocity gradients that correspond to higher shear rate values. This distribution is consistent with the typical laminar flow profile, where shear stress is predominantly concentrated in the peripheral regions of the lumen.
Observations are similar in the epiaortic branches, as shown in Figure 5, still considering the Newtonian model.
The same procedure was then followed for the other five models as well. In Figure 6, for example, we can see the velocities reached within the epiaortic vessels for each model. Compared to the Newtonian model, the shear-thinning models underestimate the maximum velocity, while the viscoelastic models overestimate it. The exact opposite occurs for the shear rate.
All the post-processing values were derived from the software: for example, the average speeds (on the input and output surfaces), the flow rates, etc., which are reported in Table 1. Then, following the algorithm described in Section 2.5, the relative error was calculated for each model. Relative errors are reported in Table 2.

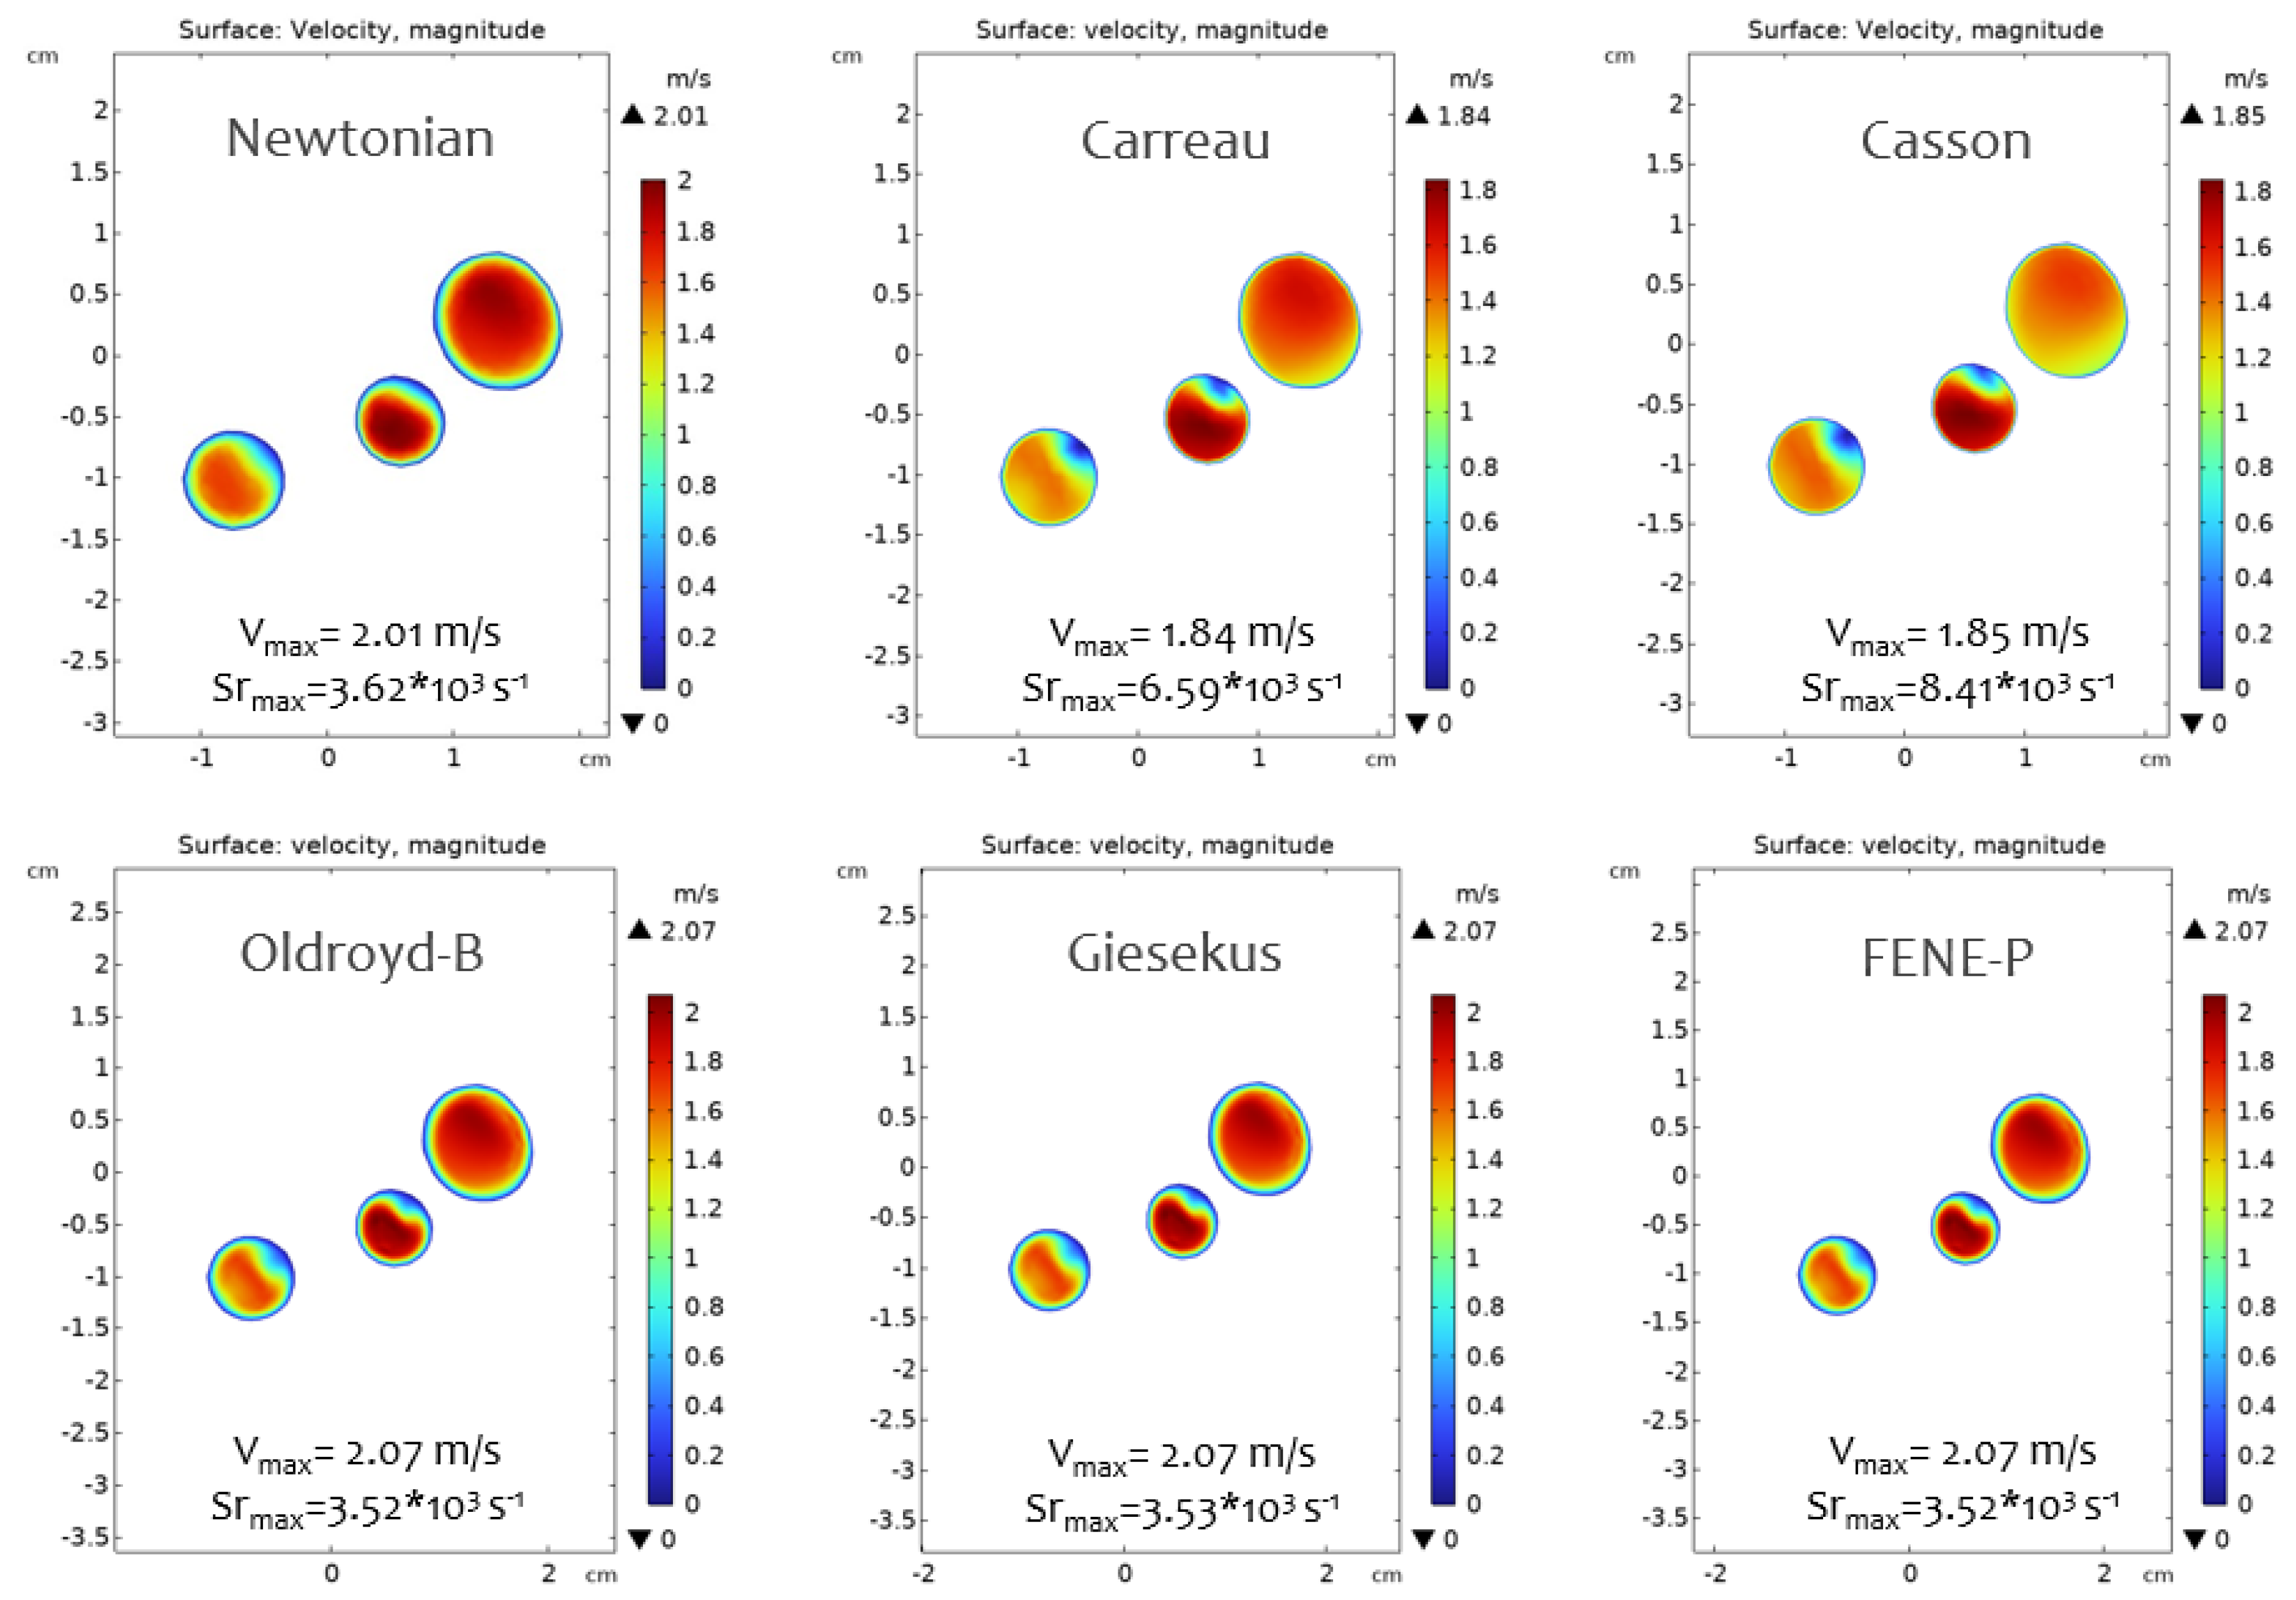
3.2. Flow Behavior in the RCA

The same analysis was performed on the coronary model. From the streamlines (Figure 7), related to the Newtonian model, it is evident that the highest velocities are reached at the point of maximum curvature and at the outlet. Note how the flow is laminar under these physiological conditions.
The velocity magnitude was analyzed in greater detail at the section corresponding to the maximum curvature (Figure 8) and the outlet section (Figure 9).
The same procedure was followed for the other five models as well. In Figure 10, for example, we can see the velocities reached in the outlet section for each model. Compared to the Newtonian model, the shear-thinning models underestimate the maximum velocity, while the viscoelastic models overestimate it. The exact opposite occurs for the shear rate.
Then all the post-processing values were derived from the software and the relative error was calculated for each model. Relative errors are reported in Table 3.

4. Discussion

The results of this study suggest that the Newtonian approximation is suitable for modeling flow in large-caliber vessels, such as the aorta. The Newtonian model showed the highest accuracy for aortic flow, with a relative error of 1.1%, and significantly shorter simulation times compared to more complex models. This confirms that the Newtonian approximation is adequate for large-caliber vessels. In contrast, while the Casson model produced a similar error to the Newtonian model, it required simulation times approximately five times longer.
Viscoelastic models did not show any advantage in simulations of aortic flow, where the flow is more stable and the viscoelastic behavior of blood has a lesser impact. However, for smaller caliber vessels, such as the right coronary artery (RCA), having more variable geometry and flexibility and being subjected to less stable flow conditions, viscoelastic models proved more accurate. This aligns with findings from earlier work [6], which showed that viscoelastic models are better suited for capturing complex fluid dynamics in smaller vessels.
For coronary flow, shear-thinning models represent a viable alternative, offering a good balance between computational efficiency and accuracy. These models provide valuable insights into the non-Newtonian nature of blood flow, supporting previous studies that have emphasized their utility in simulating real-world fluid dynamics. The shear-thinning behavior is particularly relevant in microvascular and pathological flow conditions, where blood exhibits significant changes in viscosity under varying shear rates.
From the perspective of our working hypothesis, the findings confirm that model selection depends not only on the vessel size but also on the specific characteristics of the blood flow. Our results are consistent with the hypothesis that more complex models, while computationally demanding, yield more accurate predictions for smaller vessels and pathological states.
The broader implications of these findings extend to clinical applications, where accurate flow models are crucial for simulating pathological conditions, such as atherosclerosis, and for planning personalized treatment strategies. Future research should focus on developing hybrid models that integrate the strengths of various approaches, such as combining Newtonian and non-Newtonian elements, to improve model accuracy while maintaining computational feasibility.
While numerical errors such as discretization and truncation are inherent to any finite element-based simulation, the observed variation in relative errors across rheological models is not random. On the contrary, it reflects the degree of alignment between the model’s theoretical assumptions and the hemodynamic conditions of the specific vascular region. For instance, the superior performance of viscoelastic models in the RCA suggests that these formulations are better suited to capturing flow behaviors in small-caliber, tortuous vessels under non-uniform conditions. Therefore, beyond pure accuracy, the error distribution itself becomes a useful indicator of model suitability—offering a comparative understanding of when and where each rheological approach is most effective. This interpretation complements the working hypothesis and supports the idea that model selection should be context-driven, based on anatomical and physiological relevance as much as on numerical output.
As discussed in Section 2.3 regarding the boundary conditions, the current simulations assume rigid vessel walls, which simplifies the computational setup, making this approximation a reasonable compromise between accuracy and efficiency for current clinical applications. We reiterate that in some cases, particularly when vascular stiffness is markedly increased, this assumption may be entirely valid. Nevertheless, we acknowledge that arterial walls exhibit elastic and viscoelastic behavior, particularly in large vessels such as the aorta, and incorporating FSI models in future studies would enable a more physiologically accurate representation of hemodynamic behavior. Therefore, in this study, we adopted the rigid wall assumption and used COMSOL Multiphysics® to focus on isolating and comparing the effects of different rheological models on blood flow under controlled, physiologically realistic conditions. Although this approach does not include direct experimental validation, it allows for a systematic and reproducible comparison across models, which is a critical step in understanding their relative predictive behavior. The rigid wall approximation is widely accepted in preliminary CFD studies, particularly when vessel wall properties are uncertain or patient-specific data are unavailable. It also offers a favorable balance between computational efficiency and physiological realism, especially in scenarios where increased vascular stiffness justifies this simplification. Furthermore, although the graphical outputs generated by COMSOL Multiphysics® are primarily intended for visualization, they are grounded in numerically robust solutions of the governing equations and can provide meaningful qualitative and quantitative insight when interpreted in conjunction with detailed numerical data. Accordingly, the simulation framework employed—despite its inherent simplifications—represents a methodologically sound and computationally efficient platform for the systematic comparison of rheological models under physiologically motivated boundary conditions.
Finally, it should be noted that the model is steady-flow but arterial flows are not quasi-stationary—i.e., the flow field at an instant of a cardiac cycle is not the same as a steady flow at that instantaneous flow rate. The flow differs on acceleration and deceleration. This represents a limitation.
An additional limitation of this study is the lack of direct experimental validation (e.g., by Doppler ultrasound or MRI) for the specific vascular geometries analyzed. However, an indirect validation strategy was adopted, comparing the simulation results with theoretical values based on physiological data available in the literature. This approach, commonly used in similar CFD studies, provided good agreement and supports the reliability of the simulation results.

5. Conclusions

This study demonstrates the applicability and potential of computational fluid dynamics and distributed parameter modeling in providing insights into the hemodynamic environment of the human aorta and the right coronary artery. By integrating patient-specific geometries with physiologically consistent boundary conditions, we were able to estimate key indicators such as pressure drops, velocity profiles, and wall shear stress in a realistic manner. The most significant physical outcome of this work lies in the ability of these models to predict local flow behaviors that may be linked to the onset and progression of cardiovascular diseases, particularly in regions prone to disturbed flow. This capability not only reinforces the role of mathematical modeling in preclinical assessments but also supports its translational potential in personalized medicine. The agreement between model outputs and known physiological ranges supports the reliability of the simulations and encourages further validation with clinical data.
The study explores how different rheological models influence simulation outcomes under controlled and physiologically realistic conditions. The use of the “theoretical values”—derived from the imposed boundary conditions and literature-based parameters—was intended as a benchmark for internal consistency. So, the comparison across models serves as a relative performance evaluation under consistent computational settings. The authors do not claim to establish absolute accuracy without validation against experimental or gold-standard numerical data, hence the need for future studies to incorporate MRI-based or particle image velocimetry (PIV) datasets for proper model validation [28,29,30].

Author Contributions

Conceptualization, M.M., V.G. and G.F.; methodology, M.M., V.G., A.P. and G.F.; software, M.M., V.G., A.P. and G.F.; validation, G.F.; formal analysis, M.M., V.G. and G.F.; investigation, M.M., V.G. and G.F.; resources, G.F.; data curation, M.M., V.G. and G.F.; writing—original draft preparation, M.M., V.G. and G.F.; writing—review and editing, A.P. and M.M.; visualization, M.M., V.G. and G.F.; supervision, V.G. and G.F.; project administration, G.F.; funding acquisition, G.F. All authors have read and agreed to the published version of the manuscript.

Funding

This research received no external funding.

Institutional Review Board Statement

Not applicable.

Informed Consent Statement

Not applicable.

Data Availability Statement

The original contributions presented in the study are included in the article, further inquiries can be directed to the corresponding author.

Conflicts of Interest

The authors declare no conflicts of interest.

References

  1. Kim, Y.; Park, J.; Kim, M. Diagnostic approaches for inherited hemolytic anemia in the genetic era. Blood Res. 2017, 52, 84–94. [Google Scholar] [CrossRef] [PubMed]
  2. Formaggia, L.; Perktold, K.; Quarteroni, A. Basic mathematical models and motivations. In Cardiovascular Mathematics: Modeling and Simulation of the Circulatory System; Quarteroni, A., Formaggia, L., Veneziani, A., Eds.; Springer: Milan, Italy, 2009; pp. 47–75. [Google Scholar]
  3. Piatti, F.; Belkacemi, D.; Caimi, A.; Sturla, F.; Greiser, A.; Pluchinotta, F.; Redaelli, A. On the potential of 4D Flow in guiding CFD analyses: A case study of aortic coarctation. In Proceedings of the VII Meeting Italian Chapter of the European Society of Biomechanics (ESB-ITA 2017), Rome, Italy, 28–29 September 2017; pp. 28–29. [Google Scholar]
  4. Ramakrishnan, K.; Shailendhra, K. Hydromagnetic blood flow through a uniform channel with permeable walls covered by porous media of finite thickness. J. Appl. Fluid Mech. 2013, 6, 39–47. [Google Scholar]
  5. Hoque, K.E.; Ferdows, M.; Sawall, S.; Tzirtzilakis, E.E.; Xenos, M.A. The impact of hemodynamic factors in a coronary main artery to detect the atherosclerotic severity: Single and multiple sequential stenosis cases. Phys. Fluids 2021, 33, 31903. [Google Scholar] [CrossRef]
  6. Fernandes, M.; Sousa, L.C.; António, C.C.; Pinto, S.I.S. Accuracy and temporal analysis of non-Newtonian models of blood in the computational FFR—Numerical implementation. Int. J. Non-Linear Mech. 2024, 161, 104683. [Google Scholar] [CrossRef]
  7. Rafiei, A.; Saidi, M. Numerical evaluation on blood rheological behavior in a realistic model of aneurysmal coronary artery. Comput. Methods Biomech. Biomed. Eng. 2021, 6, 579–596. [Google Scholar]
  8. Yilmaz, F.; Gundogdu, M.Y. A Critical Review on Blood Flow in Large Arteries: Relevance to Blood Rheology, Viscosity Models, and Physiologic Conditions. Korea-Aust. Rheol. J. 2008, 20, 197–211. [Google Scholar]
  9. Campo-Deaño, L.; Dullens, R.; Aarts, D.G.; Pinho, F.T.; Oliveira, M.S. Viscoelasticity of blood and viscoelastic blood analogues for use in polydimethylsiloxane in vitro models of the circulatory system. Biomicrofluidics 2013, 7, 034102. [Google Scholar] [CrossRef]
  10. Fernandes, M.; Sousa, L.C.; António, C.A.C.; Pinto, S.I. Modeling the Five-Element Windkessel Model with simultaneous utilization of blood viscoelastic properties for FFR achievement: A proof-of-concept study. Mathematics 2023, 11, 4877. [Google Scholar] [CrossRef]
  11. Comsol. COMSOL-Software for Multiphysics Simulation. Available online: https://www.comsol.com/ (accessed on 10 February 2025).
  12. Caruso, M.V.; Renzulli, A.; Fragomeni, G. Influence of IABP-Induced Abdominal Occlusions on Aortic Hemodynamics: A Patient-Specific Computational Evaluation. ASAIO J. 2017, 63, 161–167. [Google Scholar] [CrossRef]
  13. Caruso, M.V.; De Rosa, S.; Indolfi, C.; Fragomeni, G. Computational analysis of stenosis geometry effects on right coronary hemodynamics. In Proceedings of the Engineering in Medicine and Biology Society (EMBC), 2015 37th Annual International Conference of the IEEE, Milan, Italy, 25–29 August 2015; pp. 981–984. [Google Scholar]
  14. Belkacemi, D.; Al-Rawi, M.; Abbes, M.T.; Laribi, B. Flow behaviour and wall shear stress derivatives in abdominal aortic aneurysm models: A detailed CFD analysis into asymmetry effect. CFD Lett. 2022, 14, 60–74. [Google Scholar] [CrossRef]
  15. Caruso, M.V.; Gramigna, V.; Fragomeni, G. A CFD investigation of intra-aortic balloon pump assist ratio effects on aortic hemodynamics. Biocybern. Biomed. Eng. 2019, 39, 224–233. [Google Scholar] [CrossRef]
  16. Perinajová, R.; Juffermans, J.F.; Westenberg, J.J.M.; van der Palen, R.L.; van den Boogaard, P.J.; Lamb, H.J.; Kenjereš, S. Geometrically induced wall shear stress variability in CFD-MRI coupled simulations of blood flow in the thoracic aortas. Comput. Biol. Med. 2021, 133, 104385. [Google Scholar] [CrossRef]
  17. Friedman, M.H.; Bargeron, C.B.; Duncan, D.D. Effects of arterial compliance and non-Newtonian rheology on correlations between intimal thickness and wall shear. J. Biomech. Eng. 1992, 114, 317. [Google Scholar] [CrossRef]
  18. Brown, A.G.; Shi, Y.; Marzo, A.; Staicu, C.; Valverde, I.; Beerbaum, P.; Lawford, P.V.; Hose, D.R. Accuracy vs computational time: Translating aortic simulations to the clinic. J. Biomech. 2012, 45, 516–523. [Google Scholar] [CrossRef]
  19. Suo, J.; Oshinski, J.; Giddens, D.P. Effects of wall motion and compliance on flow patterns in the ascending aorta. J. Biomech. Eng. 2003, 125, 347–354. [Google Scholar]
  20. Romarowski, R.M.; Lefieux, A.; Morganti, S.; Veneziani, A.; Auricchio, F. Patient-specific CFD modelling in the thoracic aorta with PC-MRI-based boundary conditions: A least-square three-element Windkessel approach. Int. J. Numer. Methods Biomed. Eng. 2018, 34, e3134. [Google Scholar] [CrossRef]
  21. Qiao, Y.; Mao, L.; Ding, Y.; Zhu, T.; Luo, K.; Fan, J. Fluid-structure interaction: Insights into biomechanical implications of endograft after thoracic endovascular aortic repair. Comput. Biol. Med. 2021, 138, 104882. [Google Scholar] [CrossRef]
  22. Xi, Y.; Li, Y.; Wang, H.; Sun, A.; Deng, X.; Chen, Z.; Fan, Y. The impact of ECMO lower limb cannulation on the aortic flow features under differential blood perfusion conditions. Med. Nov. Technol. Devices 2022, 16, 100183. [Google Scholar] [CrossRef]
  23. Hsiao, H.-M.; Lee, K.H.; Liao, Y.C.; Cheng, Y.C. Hemodynamic simulation of Intra-stent Blood Flow. Procedia Eng. 2012, 36, 128–136. [Google Scholar] [CrossRef]
  24. Hoque, K.E.; Wu, P.; Li, Z.; Zhao, X. The effect of hemodynamic parameters in patient-based coronary artery models with serial stenoses: Normal and hypertension cases. Comput. Methods Biomech. Biomed. Eng. 2020, 23, 1001–1008. [Google Scholar] [CrossRef]
  25. Gramigna, V.; Caruso, M.V.; Fragomeni, G. A computational fluid dynamics study to compare two types of arterial cannulae for cardiopulmonary bypass. Fluids 2023, 8, 302. [Google Scholar] [CrossRef]
  26. Wen, J.; Zhang, X.; Li, Y.; Sun, Q. A computational simulation of the effect of hybrid treatment for thoracoabdominal aortic aneurysm on the hemodynamics of the abdominal aorta. Sci. Rep. 2016, 6, 23801. [Google Scholar] [CrossRef] [PubMed]
  27. Buradi, A.; Mahalingam, A. Effect of stenosis severity on wall shear stress-based hemodynamic descriptors using multiphase mixture theory. J. Appl. Fluid Mech. 2018, 11, 1497–1509. [Google Scholar] [CrossRef]
  28. Miyazaki, S.; Itatani, K.; Furusawa, T.; Nishino, T.; Sugiyama, M.; Takehara, Y.; Yasukochi, S. Validation of numerical simulation methods in aortic arch using 4D Flow MRI. Heart Vessels. 2017, 32, 1032–1044. [Google Scholar] [CrossRef]
  29. Xie, X.; Li, N.; Yu, T.; Pu, W.; Lin, H.; Li, X.; Li, G.; Li, C.; Chen, Y.; Lian, K. Validation of a Novel Computational Fluid Dynamics Based Method for Assessing Intracoronary Flow: Combining Coronary Angiography and Fractional Flow Reserve. In Catheterization and Cardiovascular Interventions: Official Journal of the Society for Cardiac Angiography & Interventions; Wiley: New York, NY, USA, 2025. [Google Scholar]
  30. Caridi, G.C.A.; Torta, E.; Mazzi, V.; Chiastra, C.; Audenino, A.L.; Morbiducci, U.; Gallo, D. Smartphone-based particle image velocimetry for cardiovascular flows applications: A focus on coronary arteries. Front. Bioeng. Biotechnol. 2022, 10, 1011806. [Google Scholar] [CrossRef]
Figure 1. Aorta - 3D geometric model.
Applsci 15 05748 g001
Figure 2. RCA - 3D geometric model.
Applsci 15 05748 g002
Figure 3. Aorta - Newtonian model: streamlines.
Applsci 15 05748 g003
Figure 4. Aorta - Newtonian model: (a) Cut plane, inlet. (b) Velocity magnitude.
Applsci 15 05748 g004
Figure 5. Aorta - Newtonian model: (a) Cut plane, epiaortic branches. (b) Velocity magnitude.
Applsci 15 05748 g005
Figure 6. Aorta models - epiaortic branches.
Applsci 15 05748 g006
Figure 7. RCA - Newtonian model: streamlines.
Applsci 15 05748 g007
Figure 8. RCA - Newtonian model: (a) Cut plane, maximum curvature. (b) Velocity magnitude.
Applsci 15 05748 g008
Figure 9. RCA - Newtonian model: (a) Cut plane, outlet. (b) Velocity magnitude.
Applsci 15 05748 g009
Figure 10. RCA models - outlet section.
Applsci 15 05748 g010
Table 1. Derived values.
ParameterValueUnit
vel (line average)1.25080m/s
volume-averaged velocity0.84300m/s
surface-averaged velocity (in)0.61699m/s
surface-averaged velocity (out)1.45420m/s
volume-averaged pressure12,679.00Pa
surface-averaged pressure (in)13,600.00Pa
surface-averaged pressure (out)9372.50Pa
Qin4.50 ×  10 4 m 3 /s
Qout4.61 ×  10 4 m 3 /s
Table 2. Relative error—AORTA.
ParameterTrue ValueNewtonianCarreauCassonOldroyd-BGiesekusFENE-P
Average velocity on surface (in)0.617 m/s0.0000.0000.0000.0000.0000.000
Average velocity on surface (out)1.417 m/s0.0250.0280.0270.0290.0290.029
Average pressure on surface (out)9332.54 Pa0.0040.0020.0020.0020.0020.002
Qin4.50 ×  10 4   m 3 /s0.0000.0000.0000.0000.0000.000
Qout4.50 ×  10 4   m 3 /s0.0250.0280.0260.0420.0290.042
Avg Relative Error 1 0.0110.0120.0110.0150.0120.015
1 Highlighted in bold for each model, which serves as a key comparative indicator.
Table 3. Relative error—RCA.
ParameterTrue ValueNewtonianCarreauCassonOldroyd-BGiesekusFENE-P
Average velocity on volume0.34300 m/s0.1180.1100.1090.1100.1100.108
Average velocity on surface (in)0.29338 m/s0.0080.0120.0140.0080.0080.012
Average velocity on surface (out)0.39355 m/s0.0230.0280.0350.0220.0220.021
Average pressure on surface (out)17,731.83 Pa0.0010.0000.0000.0000.0000.000
Qin2.25 ×  10 6   m 3 /s0.0000.0000.0000.0000.0000.000
Qout2.25 ×  10 6   m 3 /s0.0250.0000.0000.0060.0060.007
Avg Relative Error 1 0.0260.0250.0260.0240.0240.025
1 Highlighted in bold for each model, which serves as a key comparative indicator.
Disclaimer/Publisher’s Note: The statements, opinions and data contained in all publications are solely those of the individual author(s) and contributor(s) and not of MDPI and/or the editor(s). MDPI and/or the editor(s) disclaim responsibility for any injury to people or property resulting from any ideas, methods, instructions or products referred to in the content.

