

Zinc-Decorated and Nitrogen-Functionalized Hierarchical Porous Carbons for Carbon Dioxide Capture

Abstract
1. Introduction
2. Materials and Methods
2.1. Chemicals
2.2. Synthesis and Carbonization of ZIF-8 Polyhedrons
2.3. Characterizations
2.4. CO2 Adsorption Experiments
3. Results and Discussion
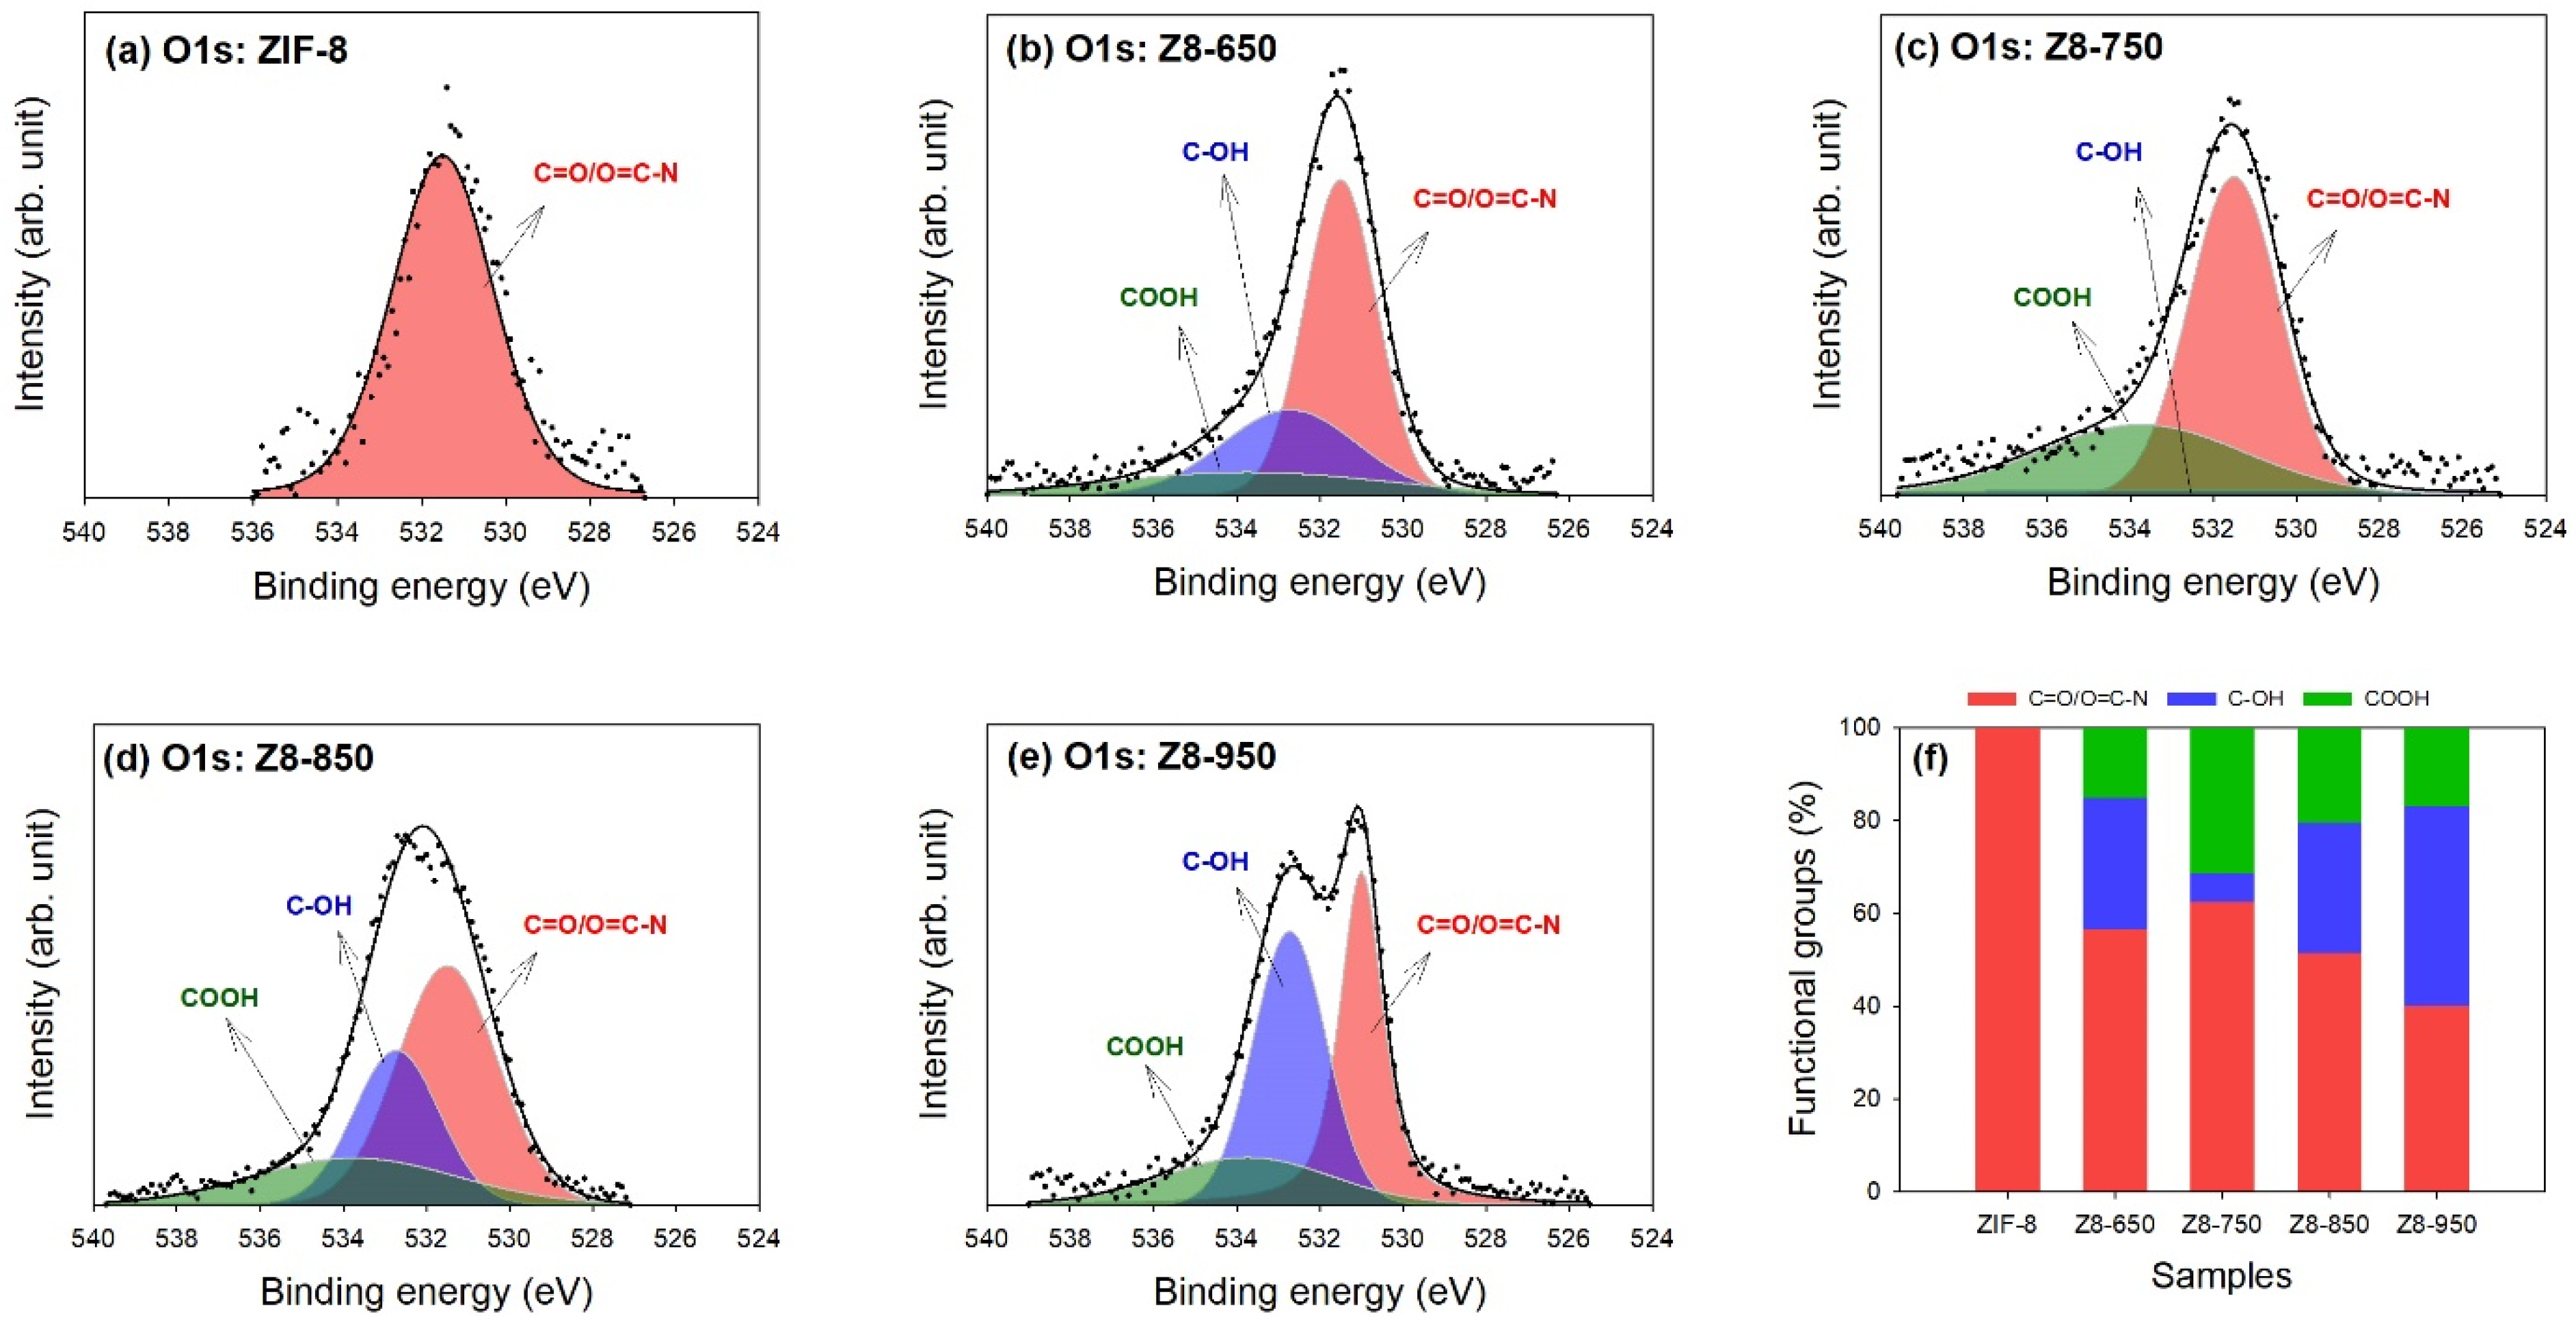
3.1. Characterization of ZIF-8 and Its Derived Carbons
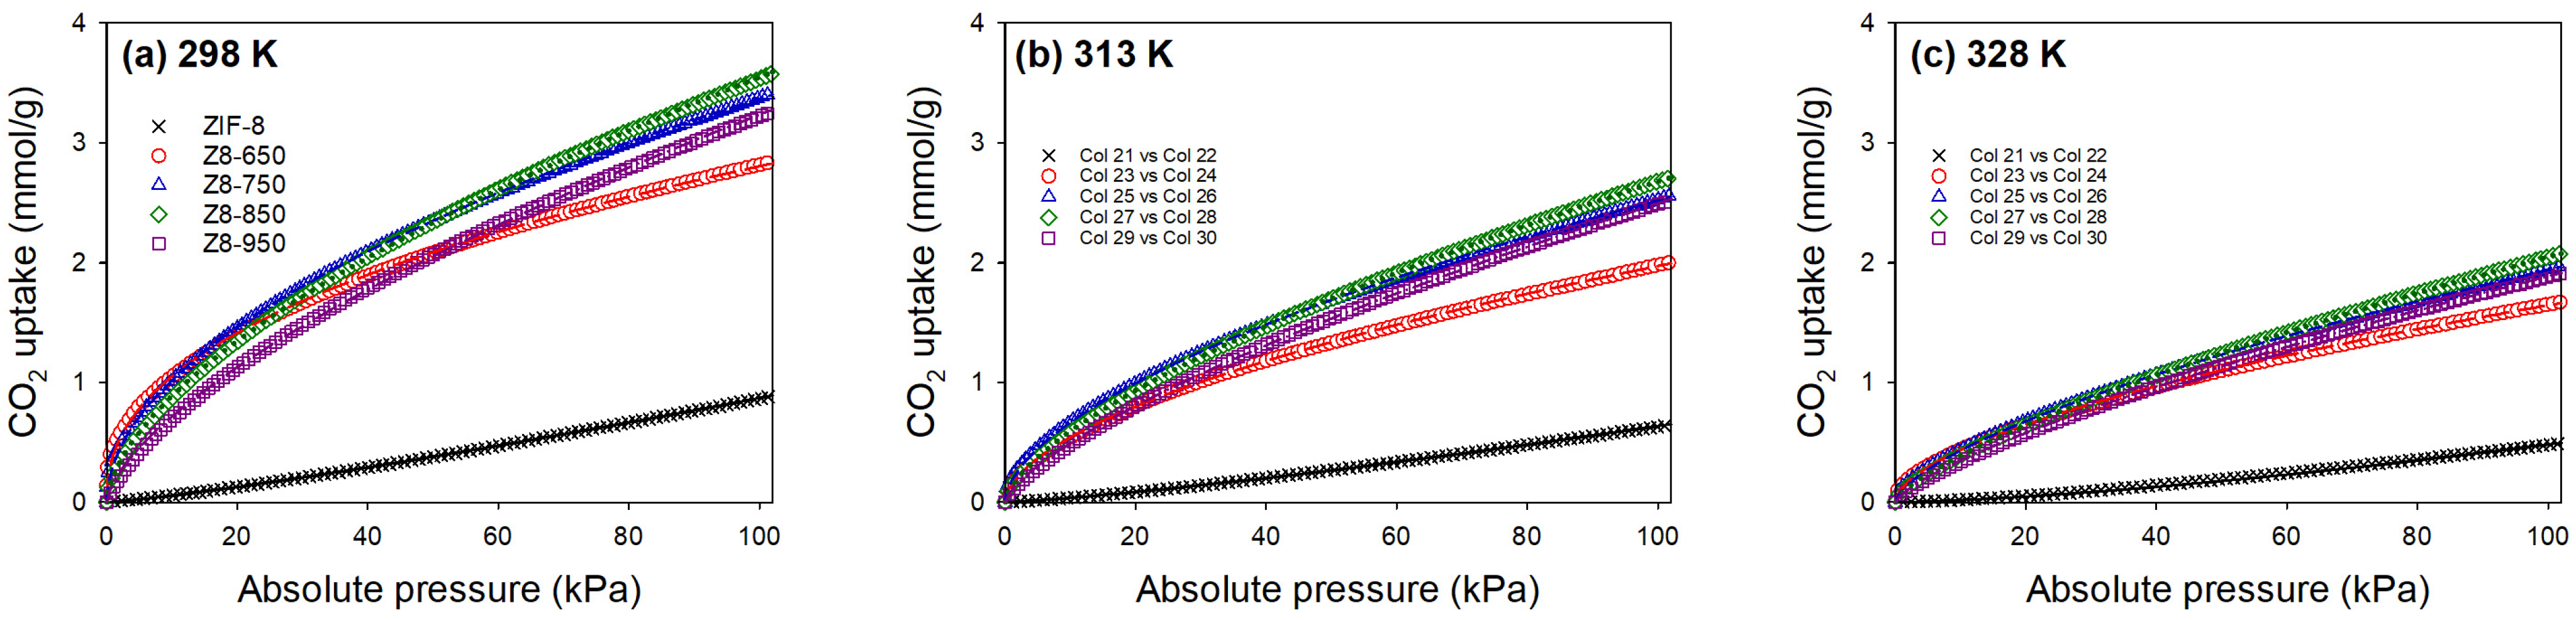
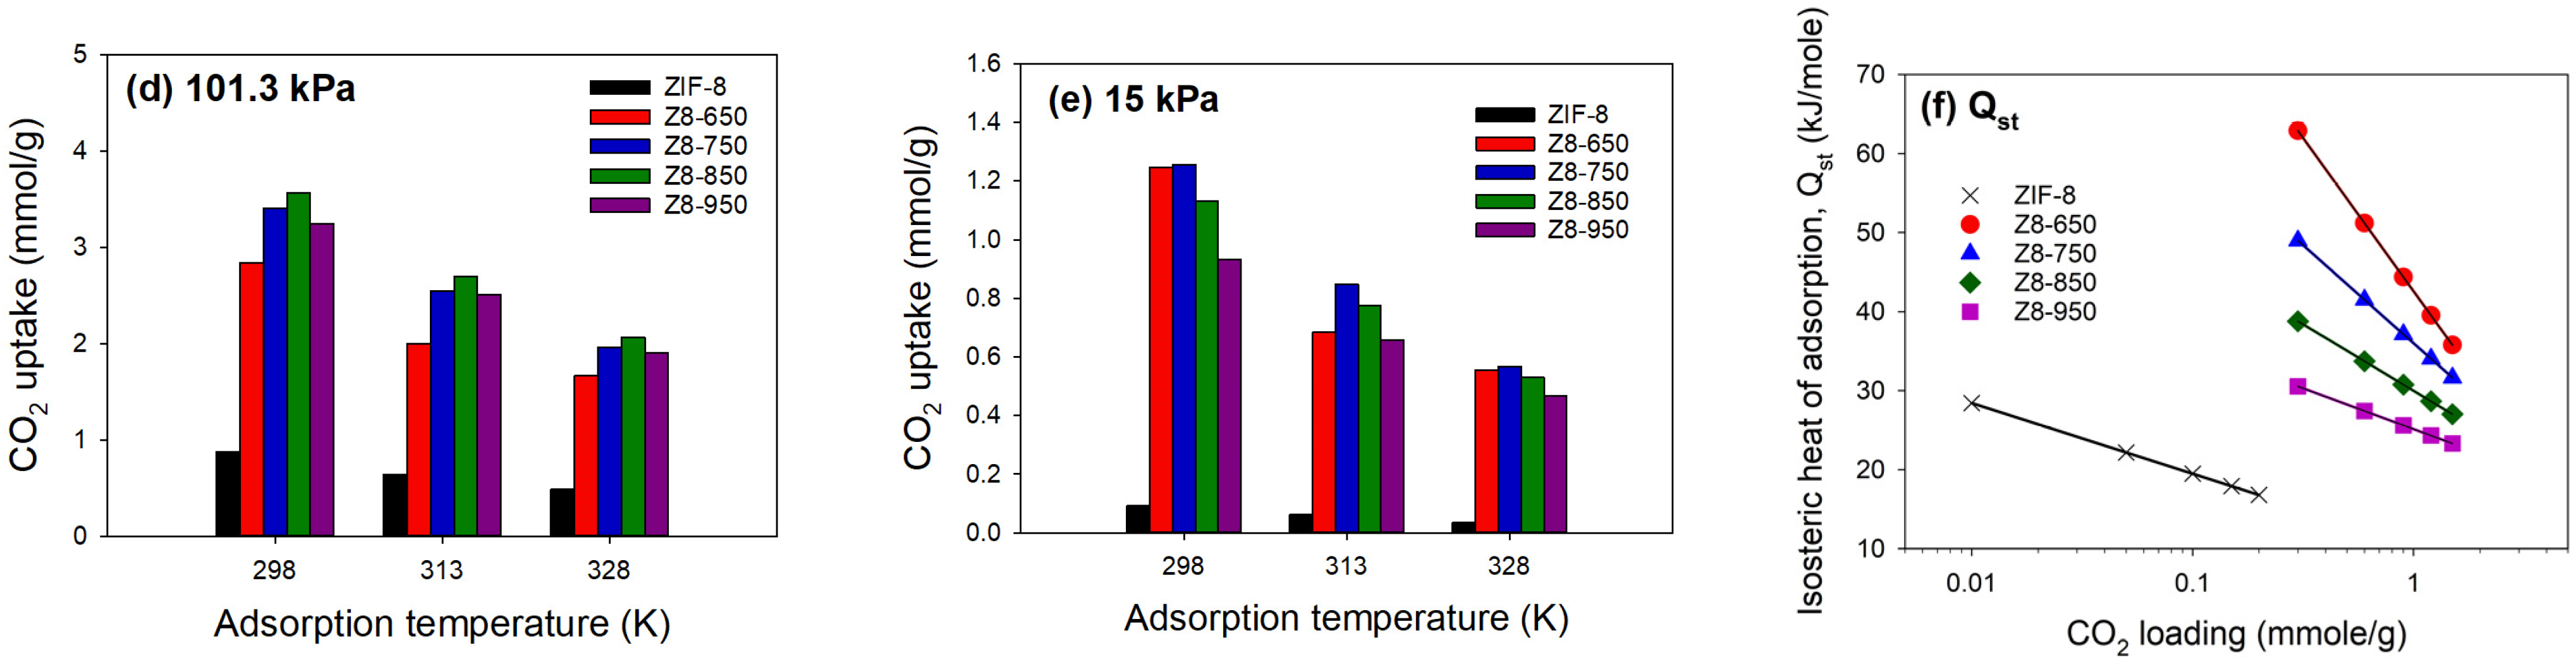
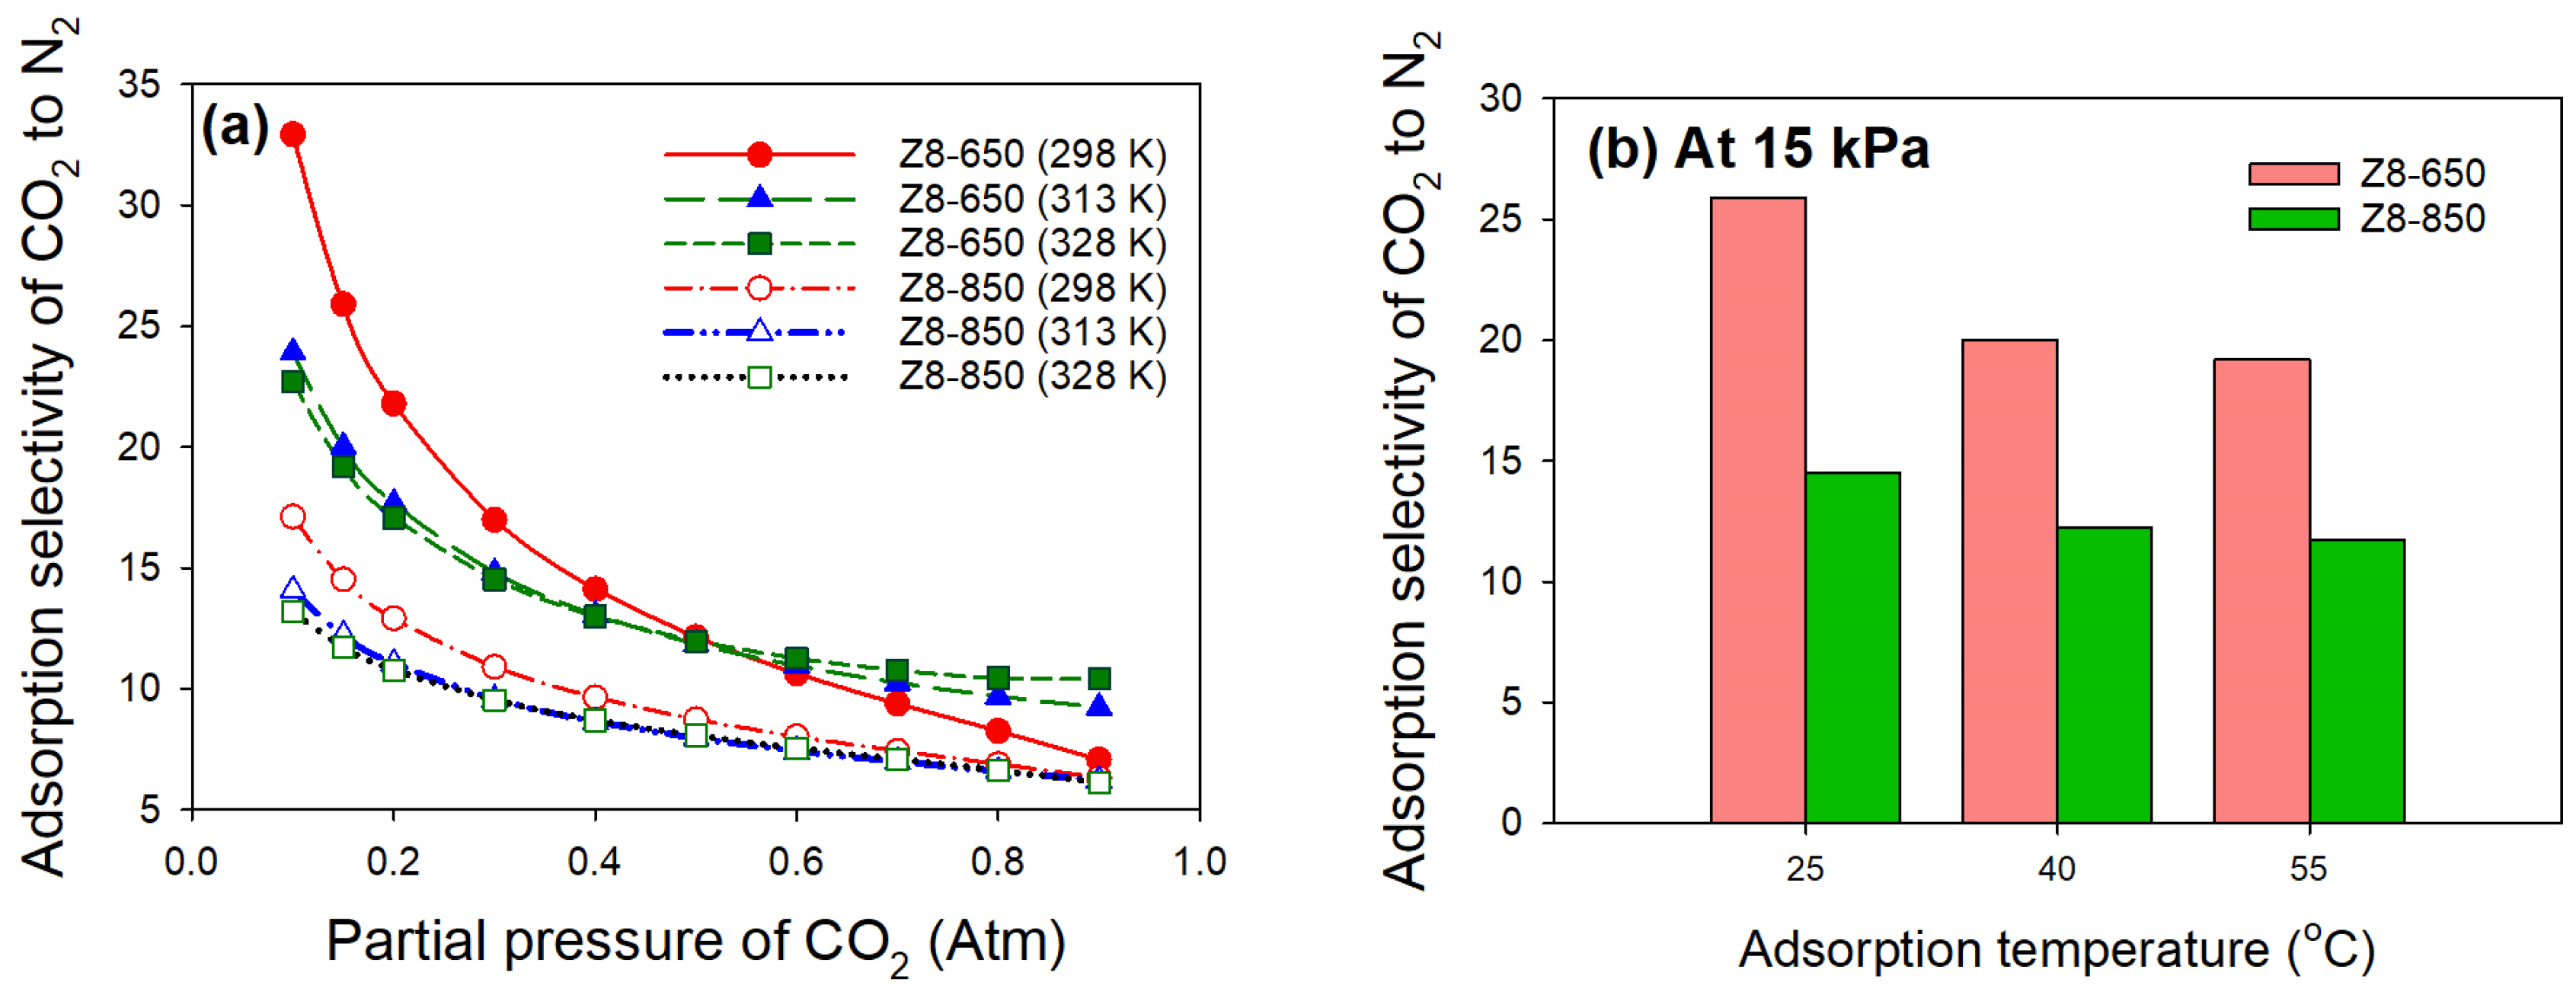
3.2. CO2 Adsorption
4. Conclusions
Author Contributions
Funding
Institutional Review Board Statement
Informed Consent Statement
Data Availability Statement
Acknowledgments
Conflicts of Interest
References
- Phan, A.; Doonan, C.J.; Uribe-Romo, F.J.; Knobler, C.B.; O’Keeffe, M.; Yaghi, O.M. Synthesis, structure, and carbon dioxide capture properties of zeolitic imidazolate frameworks. Acc. Chem. Res. 2010, 43, 58–67. [Google Scholar] [CrossRef]
- Gadipelli, S.; Guo, Z.X. Tuning of ZIF-derived carbon with high activity, nitrogen functionality, and yield—A case for superior CO2 capture. ChemSusChe 2015, 8, 2123–2132. [Google Scholar] [CrossRef]
- Gong, X.; Wang, Y.; Kuang, T. ZIF-8-based membranes for carbon dioxide capture and separation. ACS Sustain. Chem. Eng. 2017, 5, 11204–11214. [Google Scholar] [CrossRef]
- Hu, X.; Radosz, M.; Cychosz, K.A.; Thommes, M. CO2-filling capacity and selectivity of carbon nanopores: Synthesis, texture, and pore-size distribution from quenched-solid density functional theory (QSDFT). Environ. Sci. Technol. 2011, 45, 7068–7074. [Google Scholar] [CrossRef]
- Presser, V.; McDonough, J.; Yeon, S.H.; Gogotsi, Y. Effect of pore size on carbon dioxide sorption by carbide derived carbon. Energ. Environ. Sci. 2011, 4, 3059–3066. [Google Scholar] [CrossRef]
- Ma, X.; Li, L.; Wang, S.; Lu, M.; Li, H.; Ma, W.; Keener, T.C. Ammonia-treated porous carbon derived from ZIF-8 for enhanced CO2 adsorption. Appl. Surf. Sci. 2016, 369, 390–397. [Google Scholar] [CrossRef]
- Darunte, L.A.; Oetomo, A.D.; Walton, K.S.; Sholl, D.S.; Jones, C.W. Direct air capture of CO2 using amine functionalized MIL-101(Cr). ACS Sustain. Chem. Eng. 2016, 4, 5761–5768. [Google Scholar] [CrossRef]
- Mirqasemi, M.S.; Homayoonfal, M.; Rezakazemi, M. Zeolitic imidazolate framework membranes for gas and water purification. Environ. Chem. Lett. 2020, 18, 1–52. [Google Scholar] [CrossRef]
- Tian, T.; Wharmby, M.T.; Parra, J.B.; Aniac, C.O.; Fairen-Jimenez, D. Role of crystal size on swing-effect and adsorption induced structure transition of ZIF-8. Dalton Trans. 2016, 45, 6893–6900. [Google Scholar] [CrossRef]
- Park, K.S.; Ni, Z.; Côté, A.P.; Choi, J.Y.; Huang, R.; Uribe-Romo, F.J.; Chae, H.K.; O’Keeffe, M.; Yaghi, O.M. Exceptional chemical and thermal stability of zeolitic imidazolate frameworks. Proc. Natl. Acad. Sci. USA 2006, 103, 10186–10191. [Google Scholar] [CrossRef]
- Bhattacharjee, S.; Jang, M.S.; Kwon, H.J.; Ahn, W.S. Zeolitic imidazolate frameworks: Synthesis, functionalization, and catalytic/adsorption applications. Catal. Surv. Asia 2014, 18, 101–127. [Google Scholar] [CrossRef]
- Breck, D.W. Zeolite Molecular Sieves; Wiley: New York, NY, USA, 1974; pp. 593–724. [Google Scholar]
- Scholes, C.A.; Kentish, S.E.; Stevens, G.W. Carbon dioxide separation through polymeric membrane systems for flue gas applications. Recent Pat. Chem. Eng. 2008, 1, 52–66. [Google Scholar]
- Banerjee, R.; Phan, A.; Wang, B.; Knobler, C.; Furukawa, H.; O’Keeffe, M.; Yaghi, O.M. High-throughput synthesis of zeolitic imidazolate frameworks and application to CO2 capture. Science 2008, 319, 939–943. [Google Scholar] [CrossRef]
- Tanaka, S.; Tanaka, Y. A simple step toward enhancing hydrothermal stability of ZIF-8. ACS Omega 2019, 4, 19905–19912. [Google Scholar] [CrossRef]
- Torad, N.L.; Hu, M.; Kamachi, Y.; Takai, K.; Imura, M.; Naito, M.; Yamauchi, Y. Facile synthesis of nanoporous carbons with controlled particle sizes by direct carbonization of monodispersed ZIF-8 crystals. Chem. Commun. 2013, 49, 2521–2523. [Google Scholar] [CrossRef]
- Sui, X.L.; Zhang, L.M.; Zhao, L.; Gu, D.M.; Huang, G.S.; Wang, Z.B. Nitrogen-doped graphene aerogel with an open structure assisted by in-situ hydrothermal restructuring of ZIF-8 as excellent Pt catalyst support for methanol electro-oxidation. Int. J. Hydrogen Energy 2018, 43, 21899–21907. [Google Scholar] [CrossRef]
- Lee, Y.R.; Jang, M.S.; Cho, H.Y.; Kwon, H.J.; Kim, S.; Ahn, W.S. ZIF-8: A comparison of synthesis methods. Chem. Eng. J. 2015, 271, 276–280. [Google Scholar] [CrossRef]
- Wang, P.; Liu, J.; Liu, C.; Zheng, B.; Zou, X.; Jia, M.; Zhu, G. Electrochemical synthesisand catalytic properties of encapsulated metal clusters within zeolitic imidazolate frameworks. Chem. Eur. J. 2016, 22, 16613–16620. [Google Scholar] [CrossRef]
- Hwang, S.; Chi, W.S.; Lee, S.J.; Im, S.H.; Kim, J.H.; Kim, J. Hollow ZIF-8 nanoparticles improve the permeability of mixed matrix membranes for CO2/CH4 gas separation. J. Membr. Sci. 2015, 480, 11–19. [Google Scholar] [CrossRef]
- Missaoui, N.; Kahri, H.; Demirci, U.B. Rapid room-temperature synthesis and characterizations of high-surface-area nanoparticles of zeolitic imidazolate framework-8 (ZIF-8) for CO2 and CH4 adsorption. J. Mater. Sci. 2022, 57, 16245–16257. [Google Scholar] [CrossRef]
- Zhang, Z.; Xian, S.; Xia, Q.; Wang, H.; Li, Z.; Li, J. Enhancement of CO2 Adsorption and CO2/N2 Selectivity on ZIF-8 via Postsynthetic Modification. AIChE J. 2013, 59, 2195–2206. [Google Scholar] [CrossRef]
- Zheng, W.; Ding, R.; Yang, K.; Dai, Y.; Yan, X.; He, G. ZIF-8 nanoparticles with tunable size for enhanced CO2 capture of Pebax based MMMs. Sep. Purif. Technol. 2019, 214, 111–119. [Google Scholar] [CrossRef]
- Zhang, Y.; Jia, Y.; Li, M.; Hou, L. Influence of the 2-methylimidazolezinc nitrate hexahydrate molar ratio on the synthesis of zeolitic imidazolate framework-8 crystals at room temperature. Sci. Rep. 2018, 8, 9597. [Google Scholar]
- Mphuthi, L.E.; Erasmus, E.; Langner, E.H.G. Metal exchange of ZIF-8 and ZIF-67 nanoparticles with Fe(II) for enhanced photocatalytic performance. ACS Omega 2021, 6, 31632–31645. [Google Scholar] [CrossRef]
- Ramu, G.; Lee, M.; Jeong, H.K. Effects of zinc salts on the microstructure and performance of zeolitic-imidazolate framework ZIF-8 membranes for propylene/propane separation. Microporous Mesoporous Mater. 2018, 259, 155–162. [Google Scholar] [CrossRef]
- Venna, S.R.; Jasinski, J.B.; Carreon, M.A. Structural evolution of zeolitic imidazolate framework-8. J. Am. Chem. Soc. 2010, 132, 18030–18033. [Google Scholar] [CrossRef]
- Lee, T.; Kim, H.; Cho, W.; Han, D.Y.; Ridwan, M.; Yoon, C.W.; Lee, J.S.; Choi, N.; Ha, K.S.; Yip, A.C.K.; et al. Thermosensitive structural changes and adsorption properties of zeolitic imidazolate framework-8 (ZIF-8). J. Phys. Chem. C 2015, 119, 8226–8237. [Google Scholar] [CrossRef]
- Xiao, Y.; Yang, H.; Bu, X.; Feng, P. ZIF-8 derived carbon materials with multifunctional selective adsorption abilities. Carbon 2021, 176, 421–430. [Google Scholar] [CrossRef]
- Lai, Q.; Zhao, Y.; Liang, Y.; He, J.; Chen, J. In situ confinement pyrolysis transformation of ZIF-8 to nitrogen-enriched meso-microporous carbon frameworks for oxygen reduction. Adv. Funct. Mater. 2016, 26, 8334–8344. [Google Scholar] [CrossRef]
- Liang, H.W.; Zhuang, X.; Brüller, S.; Feng, X.; Müllen, K. Hierarchically porous carbons with optimized nitrogen doping as highly active electrocatalysts for oxygen reduction. Nat. Commun. 2014, 5, 4973. [Google Scholar] [CrossRef]
- Wang, T.; Wang, Y.; Sun, M.; Hanif, A.; Wu, H.; Gu, Q.; Ok, Y.S.; Tsang, D.C.W.; Li, J.; Yu, J.; et al. Thermally treated zeolitic imidazolate framework-8 (ZIF-8) for visible light photocatalytic degradation of gaseous formaldehyde. Chem. Sci. 2020, 11, 6670–6681. [Google Scholar] [CrossRef]
- Gadipelli, S.; Travis, W.; Zhoubc, W.; Guo, Z. A thermally derived and optimized structure from ZIF-8 with giant enhancement in CO2 uptake. Energy Environ. Sci. 2014, 7, 2232–2238. [Google Scholar] [CrossRef]
- Zhu, D.; Jiang, J.; Sun, D.; Qian, X.; Wang, Y.; Li, L.; Wang, Z.; Chai, X.; Gan, L.; Liu, M. A general strategy to synthesize high-level N-doped porous carbons via Schiff-base chemistry for supercapacitors. J. Mater. Chem. A 2018, 6, 12334–12343. [Google Scholar] [CrossRef]
- Abbasi, Z.; Shamsaei, E.; Leong, S.K.; Ladewig, B.; Zhang, X.; Wang, H. Effect of carbonization temperature on adsorption property of ZIF-8 derived nanoporous carbon for water treatment. Microporous Mesoporous Mater. 2016, 236, 28–37. [Google Scholar] [CrossRef]
- Wickramaarachchi, K.; Minakshi, M.; Aravindh, S.A.; Dabare, R.; Gao, X.; Jiang, Z.T.; Wong, K.W. Repurposing N-doped grape marc for the fabrication of supercapacitors with theoretical and machine learning models. Nanomaterials 2022, 12, 1847. [Google Scholar] [CrossRef]
- Vendite, A.C.; Soares, T.A.; Coutinho, K. The effect of surface composition on the selective capture of atmospheric CO2 by ZIF nanoparticles: The case of ZIF-8. J. Chem. Inf. Model. 2022, 62, 6530–6543. [Google Scholar] [CrossRef]
- Hu, Y.; Liu, Z.; Xu, J.; Huang, Y.; Song, Y. Evidence of pressure enhanced CO2 storage in ZIF-8 probed by FTIR spectroscopy. J. Am. Chem. Soc. 2013, 135, 9287–9290. [Google Scholar] [CrossRef]
- Asadi, E.; Ghadimi, A.; Hosseini, S.S.; Sadatnia, B.; Rostamizadeh, M.; Nadeali, A. Surfactant-mediated and wet-impregnation approaches for modification of ZIF-8 nanocrystals: Mixed matrix membranes for CO2/CH4 separation. Microporous Mesoporous Mater. 2022, 329, 111539. [Google Scholar] [CrossRef]
- Meng, S.; Ju, X.; Wang, J.; Cui, B.; Liu, Y.; Ma, H.; Wang, D.; Yang, Z. Development of efficient CO2 adsorbents: Synthesis and performance evaluation of dopamine-modified halloysite nanotubes loaded with ZIF-8. Sep. Purif. Technol. 2025, 357, 130179. [Google Scholar] [CrossRef]
- Cravillon, J.; Munzer, S.; Lohmeier, S.J.; Feldhoff, A.; Huber, K.; Wiebcke, M. Rapid room-temperature synthesis and characterization of nanocrystals of a prototypical zeolitic imidazolate framework. Chem. Mater. 2009, 21, 1410–1412. [Google Scholar] [CrossRef]
- Chiang, Y.C.; Wu, C.Y.; Chen, Y.J. Effects of activation on the properties of electrospun carbon nanofibers and their adsorption performance for carbon dioxide. Sep. Purif. Technol. 2020, 233, 116040. [Google Scholar] [CrossRef]
- Suzuki, M. Adsorption Engineering; Elsevier Science: Amsterdam, The Netherlands, 1990. [Google Scholar]
- Song, X.; Wang, L.; Ma, X.; Zeng, Y. Adsorption equilibrium and thermodynamics of CO2 and CH4 on carbon molecular sieves. Appl. Surf. Sci. 2017, 396, 870–878. [Google Scholar] [CrossRef]
- Raganati, F.; Alfe, M.; Gargiulo, V.; Chirone, R.; Ammendola, P. Isotherms and thermodynamics of CO2 adsorption on a novel carbon-magnetite composite sorbent. Chem. Eng. Res. Des. 2018, 134, 540–552. [Google Scholar] [CrossRef]
- Lee, J.S.; Kim, J.H.; Kim, J.T.; Suh, J.K.; Lee, J.M.; Lee, C.H. Adsorption equilibria of CO2 on zeolite 13X and zeolite X/activated carbon composite. J. Chem. Eng. Data 2002, 47, 1237–1242. [Google Scholar] [CrossRef]
- Xie, X.; Meng, S.; Gan, F.; Dai, Z.; He, J.; Chang, Y.; Jiang, X.; Jin, Z. In-situ co-growth of ZIF-8-derived bio-carbon spheres with meso-macroporous hierarchy for stable and rapid carbon dioxide capture. Appl. Energ. 2024, 376, 124327. [Google Scholar] [CrossRef]
- Jin, R.; Bian, Z.; Li, J.; Ding, M.; Gao, L. ZIF-8 crystal coatings on a polyimide substrate and their catalytic behaviours for the Knoevenagel reaction. Dalton Trans 2013, 42, 3936–3940. [Google Scholar] [CrossRef]
- Panchariya, D.K.; Rai, R.K.; Kumar, E.A.; Singh, S.K. Core−shell zeolitic imidazolate frameworks for enhanced hydrogen storage. ACS Omega 2018, 3, 167–175. [Google Scholar] [CrossRef]
- Li, Z.; An, T.; Yang, J.; Gao, D.; Zhang, H.; Zhang, H. CO2/N2 separation using a ceramic membrane contactor and ZIF-8 in [TEPA][MIm]. Sep. Purif. Technol. 2025, 359, 130525. [Google Scholar] [CrossRef]
- Pelicano, C.M.; Lockman, Z.; Balela, M.D. Zinc oxide nanostructures formed by wet oxidation of Zn foil. Adv. Mater. Res. 2014, 1043, 22–26. [Google Scholar] [CrossRef]
- Zhong, S.; Zhan, C.; Cao, D. Zeolitic imidazolate framework-derived nitrogen-doped porous carbons as high performance supercapacitor electrode materials. Carbon 2015, 85, 51–59. [Google Scholar] [CrossRef]
- Vasireddi, R.; Javvaji, B.; Vardhan, H.; Mahapatra, D.R.; Hegde, G.M. Growth of zinc oxide nanorod structures: Pressure controlled hydrothermal process and growth mechanism. J. Mater. Sci. 2017, 52, 2007–2020. [Google Scholar] [CrossRef]
- Mihelič, A.; Kodre, A.; Arčon, I.; Padežnik Gomilšek, J.; Borowski, M. A double cell for X-ray absorption spectrometry of atomic Zn. Nucl. Instrum. Methods Phys. Res. B 2002, 196, 194–197. [Google Scholar] [CrossRef]
- Graf, N.; Yegen, E.; Gross, T.; Lippitz, A.; Weigel, W.; Krakert, S.; Terfort, A.; Unger, W.E.S. XPS and NEXAFS studies of aliphatic and aromatic amine species on functionalized surfaces. Surf. Sci. 2009, 603, 2849–2860. [Google Scholar] [CrossRef]
- Tuccitto, N.; Riela, L.; Zammataro, A.; Spitaleri, L.; Li-Destri, G.; Sfuncia, G.; Nicotra, G.; Pappalardo, A.; Capizzi, G.; Sfrazzetto, G.T. Functionalized carbon nanoparticle-based sensors for chemical warfare agents. ACS Appl. Nano Mater. 2020, 3, 8182–8191. [Google Scholar] [CrossRef]
- Giofrè, S.V.; Tiecco, M.; Celesti, C.; Patanè, S.; Triolo, C.; Gulino, A.; Spitaleri, L.; Scalese, S.; Scuderi, M.; Iannazzo, D. Eco-friendly 1,3-dipolar cycloaddition reactions on graphene quantum dots in natural deep eutectic solvent. Nanomaterials 2020, 10, 2549. [Google Scholar] [CrossRef]
- Sundaram, M.M.; Appadoo, D. Traditional salt-in-water electrolyte vs. water-in-salt electrolyte with binary metal oxide for symmetric supercapacitors: Capacitive vs. faradaic. Dalton Trans. 2020, 49, 11743–11755. [Google Scholar] [CrossRef]
- Sharma, P.; Minakshi, M.; Whale, J.; Jean-Fulcrand, A.; Garnweitner, G. Effect of the anionic counterpart: Molybdate vs. tungstate in energy storage for pseudo-capacitor applications. Nanomaterials 2021, 11, 580. [Google Scholar] [CrossRef]
- Toth, J. Isotherm equations for monolayer adsorption of gases on heterogeneous solid surfaces. In Fundamentals of Adsorption; Myers, A., Belfort, G., Eds.; Engineering Foundation: New York, NY, USA, 1984; pp. 657–665. [Google Scholar]
- Li, Z.; Cao, Z.; Grande, C.; Zhang, W.; Dou, Y.; Li, X.; Fu, J.; Shezad, N.; Akhtar, F.; Kaiser, A. A phase conversion method to anchor ZIF-8 onto a PAN nanofiber surface for CO2 capture. RSC Adv. 2022, 12, 664–670. [Google Scholar] [CrossRef]
- Åhlén, M.; Jaworski, A.; Strømme, M.; Cheung, O. Selective adsorption of CO2 and SF6 on mixed-linker ZIF-7–8s: The effect of linker substitution on uptake capacity and kinetics. Chem. Eng. J. 2021, 422, 130117. [Google Scholar] [CrossRef]
- Ma, H.; Wang, Z.; Zhang, X.F.; Ding, M.; Yao, J. In situ growth of amino-functionalized ZIF-8 on bacterial cellulose foams for enhanced CO2 adsorption. Carbohydr. Polym. 2021, 270, 118376. [Google Scholar] [CrossRef]
- Wang, B.; Côté, A.P.; Furukawa, H.; O’Keeffe, M.; Yaghi, O.M. Colossal cages in zeolitic imidazolate frameworks as selective carbon dioxide reservoirs. Nature 2008, 453, 207–212. [Google Scholar] [CrossRef] [PubMed]
- Zhang, D.; Zhang, C.; Zhang, X.; Tian, Y.; Cheng, X.; Zhu, X.; Wang, L. Efficient low-pressure CO2 capture via ZIF-8 modified by deep eutectic solvents. Sep. Purif. Technol. 2025, 353, 128359. [Google Scholar] [CrossRef]
- Liu, Q.; Zhang, Z.; Zhang, X.; Chen, J.; Ma, H.; Zheng, L.; Wu, K.; Tai, Y. Construction of heterogeneous FLPs based on ZIF-derived porous carbons for CO2 capture and conversion. Sep. Purifi. Technol. 2025, 362, 131671. [Google Scholar] [CrossRef]


| Parameter | ZIF-8 | Z8-650 | Z8-750 | Z8-850 | Z8-950 |
|---|---|---|---|---|---|
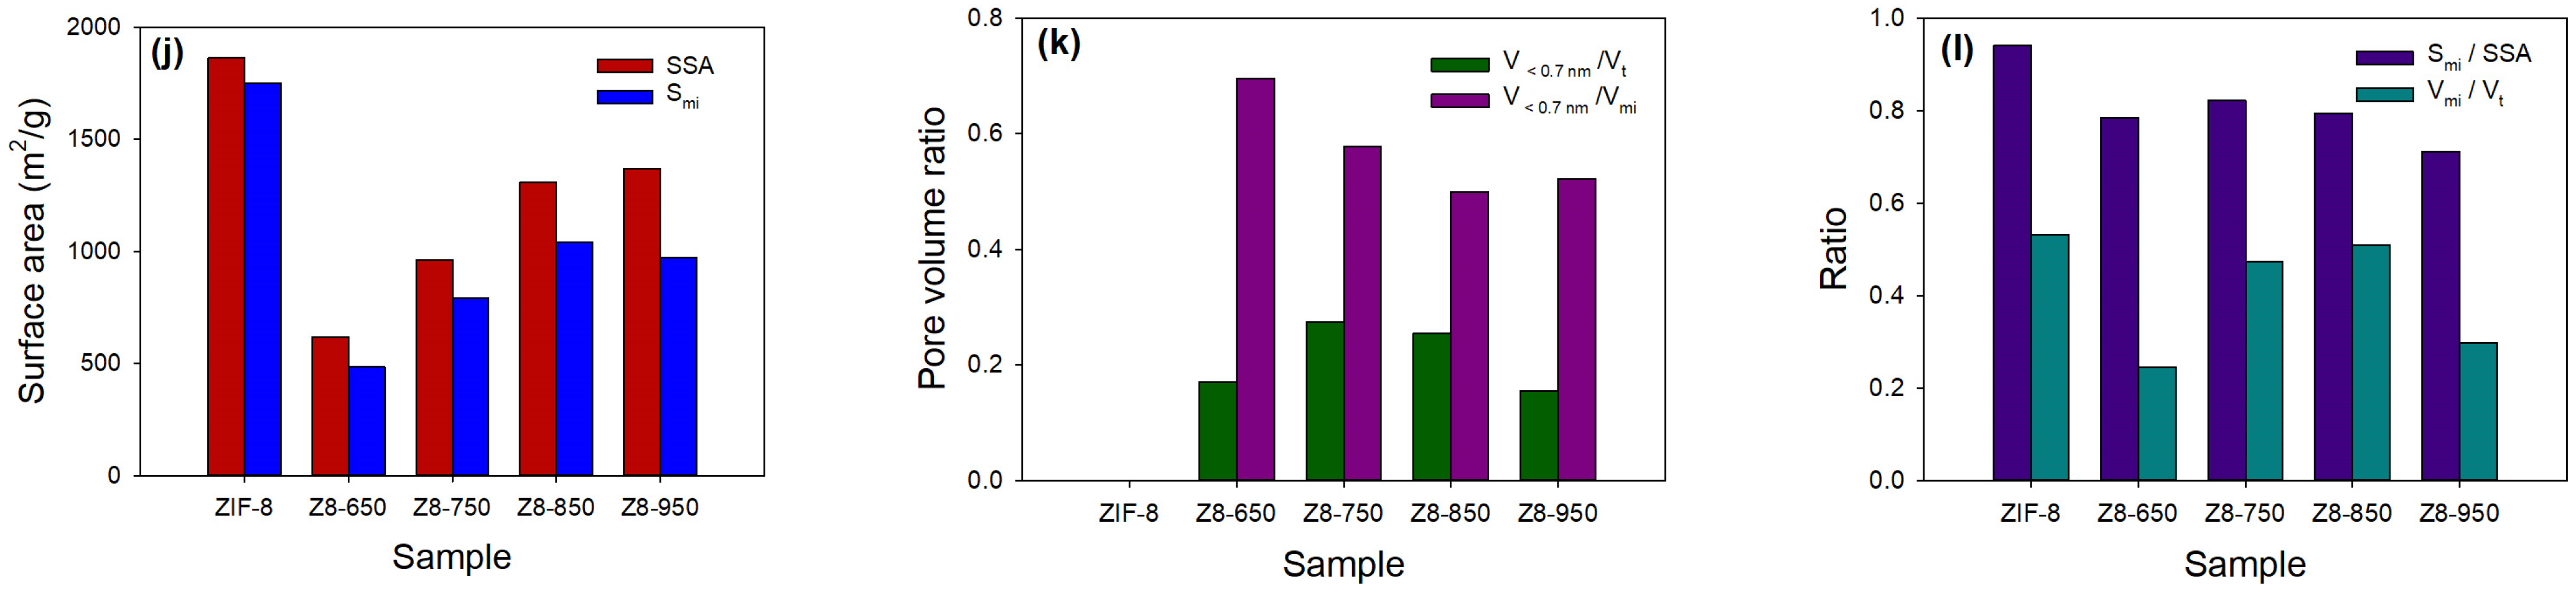
| SSA α (m2/g) | 1862 | 618 | 963 | 1309 | 1369 |
| Smi β (m2/g) | 1750 | 485 | 792 | 1041 | 973 |
| Vt γ (cm3/g) | 1.2186 | 1.0422 | 0.8066 | 1.0153 | 1.8033 |
| Vma φ (cm3/g) | 0.1504 | 0.0867 | 0.1325 | 0.1171 | 0.4259 |
| Vme η (cm3/g) | 0.4213 | 0.7008 | 0.2923 | 0.3810 | 0.8418 |
| Vmi η (cm3/g) | 0.6470 | 0.2546 | 0.3818 | 0.5173 | 0.5355 |
| V<0.7nm η (cm3/g) | 0 | 0.1772 | 0.2207 | 0.2585 | 0.2795 |
| Smi/SSA | 0.94 | 0.78 | 0.82 | 0.79 | 0.71 |
| Vmi/Vt | 0.53 | 0.24 | 0.47 | 0.51 | 0.30 |
| V<0.7nm/Vt | 0 | 0.17 | 0.27 | 0.25 | 0.15 |
| V<0.7nm/Vmi | 0 | 0.70 | 0.58 | 0.50 | 0.52 |
| Sample | Temperature (K) | KF (mmol/g/kPa1/n) | n | G (kJ/mol) | H (kJ/mol) | S (kJ/mol/K) |
|---|---|---|---|---|---|---|
| ZIF-8 | 298 | 0.0035 | 0.84 | −5.64 | −44.27 | −0.130 |
| 313 | 0.0020 | 0.80 | −3.69 | |||
| 328 | 0.0006 | 0.69 | −1.75 | |||
| Z8-650 | 298 | 0.2202 | 1.79 | −16.79 | −31.03 | −0.048 |
| 313 | 0.2294 | 1.96 | −16.08 | |||
| 328 | 0.1153 | 1.62 | −15.36 | |||
| Z8-750 | 298 | 0.3085 | 1.93 | −16.49 | −29.20 | −0.043 |
| 313 | 0.1982 | 1.82 | −15.85 | |||
| 328 | 0.1000 | 1.51 | −15.21 | |||
| Z8-850 | 298 | 0.2393 | 1.66 | −15.66 | −26.88 | −0.038 |
| 313 | 0.1458 | 1.54 | −15.09 | |||
| 328 | 0.0935 | 1.46 | −14.53 | |||
| Z8-950 | 298 | 0.1580 | 1.53 | −14.79 | −21.95 | −0.024 |
| 313 | 0.0978 | 1.42 | −14.43 | |||
| 328 | 0.0639 | 1.36 | −14.07 |
| Material | SBET (m2/g) | CO2 Conc. | Temp. (K) | CO2 Capacity (mmol/g) | Reference |
|---|---|---|---|---|---|
| Z8-850 | 1309 | 15 kPa 101.3 kPa | 298 | 1.13 3.57 | This study |
| Z8-750 | 963 | 15 kPa 101.3 kPa | 298 | 1.26 3.40 | This study |
| ZIF-8 (773 K, 24 h) | 942 | 0.15 bar 1 bar | 298 | 0.4 1.79 | [33] |
| ZIF-8 | 1016 | 1 bar | 298 | 0.60 | [61] |
| ZIF-7-8s | 283 | 1 bar | 293 | 1.44 | [62] |
| ZIF-8 | 1169 | 1 bar | 298 | 1.06 | [63] |
| NH2-ZIF-8 | 886 | 1 bar | 298 | 1.94 | [63] |
| NH2-ZIF-8/bacterial cellulose foams | 455 | 1 bar | 298 | 1.63 | [63] |
| ZIF-100 | 595 | 1 atm | 298 | 0.6 | [64] |
| Deep eutectic solvent-ZIF-8 | 1147 | 1 bar | 293 | 3.03 | [65] |
| KOH-activated ZIF-8 | 2491 | 1 bar | 298 | 1.72 | [66] |
Disclaimer/Publisher’s Note: The statements, opinions and data contained in all publications are solely those of the individual author(s) and contributor(s) and not of MDPI and/or the editor(s). MDPI and/or the editor(s) disclaim responsibility for any injury to people or property resulting from any ideas, methods, instructions or products referred to in the content. |
© 2025 by the authors. Licensee MDPI, Basel, Switzerland. This article is an open access article distributed under the terms and conditions of the Creative Commons Attribution (CC BY) license (https://creativecommons.org/licenses/by/4.0/).
Share and Cite
Chiang, Y.-C.; Chin, W.-T.; Chu, I.-C. Zinc-Decorated and Nitrogen-Functionalized Hierarchical Porous Carbons for Carbon Dioxide Capture. Appl. Sci. 2025, 15, 5743. https://doi.org/10.3390/app15105743
Chiang Y-C, Chin W-T, Chu I-C. Zinc-Decorated and Nitrogen-Functionalized Hierarchical Porous Carbons for Carbon Dioxide Capture. Applied Sciences. 2025; 15(10):5743. https://doi.org/10.3390/app15105743
Chicago/Turabian StyleChiang, Yu-Chun, Wei-Ting Chin, and I-Chang Chu. 2025. "Zinc-Decorated and Nitrogen-Functionalized Hierarchical Porous Carbons for Carbon Dioxide Capture" Applied Sciences 15, no. 10: 5743. https://doi.org/10.3390/app15105743
APA StyleChiang, Y.-C., Chin, W.-T., & Chu, I.-C. (2025). Zinc-Decorated and Nitrogen-Functionalized Hierarchical Porous Carbons for Carbon Dioxide Capture. Applied Sciences, 15(10), 5743. https://doi.org/10.3390/app15105743