Article

Microscopic Pore–Throat Architecture and Fractal Heterogeneity in Tight Sandstone Reservoirs: Insights from the Denglouku Formation, Xujiaweizi Fault Depression

School of Earth Science, Northeast Petroleum University, Daqing 163318, China
*
Authors to whom correspondence should be addressed.
Appl. Sci. 2025, 15(10), 5730; https://doi.org/10.3390/app15105730
Submission received: 17 April 2025 / Revised: 12 May 2025 / Accepted: 15 May 2025 / Published: 20 May 2025

Abstract

:
The heterogeneity of the microscopic pore structure in tight sandstone reservoirs is a key factor limiting the efficient development of natural gas. This study focuses on the tight sandstone of the Denglouku Formation in the Lower Cretaceous region of the Xujiaweizi Fault Depression in the northern Songliao Basin. This research integrates petrographic thin sections, scanning electron microscopy (SEM), high-pressure mercury intrusion experiments, and fractal models to systematically reveal the pore structure characteristics and the response patterns of fractal dimensions in the reservoir. The results indicate that the Denglouku Formation reservoir is a typical tight sandstone reservoir, with pore types mainly consisting of residual intergranular pores and micropores, and throat types dominated by narrow lamellar and tubular structures. The pore–throat structure in the study area exhibited typical three-segment fractal characteristics, reflecting the complexity and multi-scale heterogeneity of the reservoir’s pore–throat system. The higher the fractal dimension, the poorer the storage performance and permeability. By constructing a multivariate classification model including porosity, permeability, displacement pressure, and sorting coefficient, the reservoir was divided into three categories. The results of this study provide a theoretical basis for quantitative classification evaluation and development strategy optimization of the continental tight sandstone reservoirs.

1. Introduction

In recent years, with the increasing global demand for energy, natural gas, as a clean, environmentally friendly, stable, and economical low-carbon fossil fuel, has been playing an irreplaceable role in economic development and energy transition [1,2]. Currently, the growth rate of proven reserves of conventional oil and gas resources is decreasing year by year [3]. Tight sandstone oil and gas, as a very important resource to replace conventional energy, has become the strategic focus of exploration and development in China. Since the discovery of unconventional natural gas in the tight sandstone of the Appalachian Basin in the United States in 1921, more than 70 basins or deep structural areas worldwide have been continuously discovered as natural gas reservoirs with tight sandstone as the reservoir. The development of tight gas in China started relatively late. The distinctive nature of these gas reservoirs compared with conventional hydrocarbon accumulations became scientifically recognized following the 1971 identification of the Zhongba Gas Field within the Sichuan Basin’s western sector. Since the 1990s, multiple tight gas reservoirs have been discovered successively in the Ordos Basin and Turpan-Hami Basin in China, effectively alleviating the supply–demand contradiction of natural gas in China [4,5,6].
Tight sandstone gas and tight gas refer to natural gas reservoirs located within tight sandstone reservoirs [7]. Typically, these reservoirs have a porosity of less than 10% and a matrix permeability under overburden pressure of less than 0.1 × 10⁻³ μm2. Compared with conventional natural gas resources, these reservoirs exhibit high heterogeneity and poor lateral continuity [8]. The micropore structure of the reservoir primarily includes pore size, throat size, and the connectivity of pores and throats (such as pore–throat coordination number and pore–throat ratio), which affect the reservoir’s storage space, porosity, permeability, and other macroscopic physical properties [9]. Pore structure is a critical factor in determining the physical properties of the reservoir and its oil and gas production potential. Therefore, accurately characterizing the micropore structure of tight gas reservoirs is crucial [10,11].
Originating to quantify irregular geometries, dynamic instabilities, and structural complexities, fractal analysis has evolved into a fundamental methodology for deciphering systems governed by scale-invariant patterns [12,13,14]. In geological applications, the integration of fractal theory with seismic data facilitates the more precise first-arrival picking of seismic waves, while its extension to geochemical element distribution analysis demonstrates universal applicability [15]. Fractal dimension serves as a vital parameter for quantifying pore–throat heterogeneity, establishing critical connections between macroscopic reservoir properties and microscopic architectural features [16,17,18,19]. Substantive progress has been achieved through experimental investigations employing high-pressure mercury intrusion (HPMI) and low-temperature nitrogen adsorption (LTNA) techniques, where fractal dimensions effectively quantify the structural complexity of shale pore networks [20]. Comparative HPMI studies of tight sandstone reservoirs across multiple basins reveal distinct fractal signatures within their pore architectures, enabling quantitative heterogeneity assessments [21,22,23,24]. This advancement informed the development of permeability prediction models specifically calibrated for tight sandstone systems [25,26]. However, the universality of such permeability models remains limited, necessitating region-specific model formulations tailored to geological particularities.
Overall, previous studies have conducted detailed research on the lithology, storage space types, and physical properties of the Denglouku Formation reservoir in the Xujiaweizi area of the northern Songliao Basin [27,28]. However, the description of micropore structure features has been relatively sparse. Therefore, this paper conducts a pore structure study of the Denglouku Formation tight sandstone gas reservoir in the Xujiaweizi area, using experimental data from scanning electron microscopy, petrographic thin sections, and high-pressure mercury intrusion. It explores the controlling factors of fractal dimensions and establishes classification and evaluation standards for reservoir pore structures, providing a reference for the development of continental tight gas.

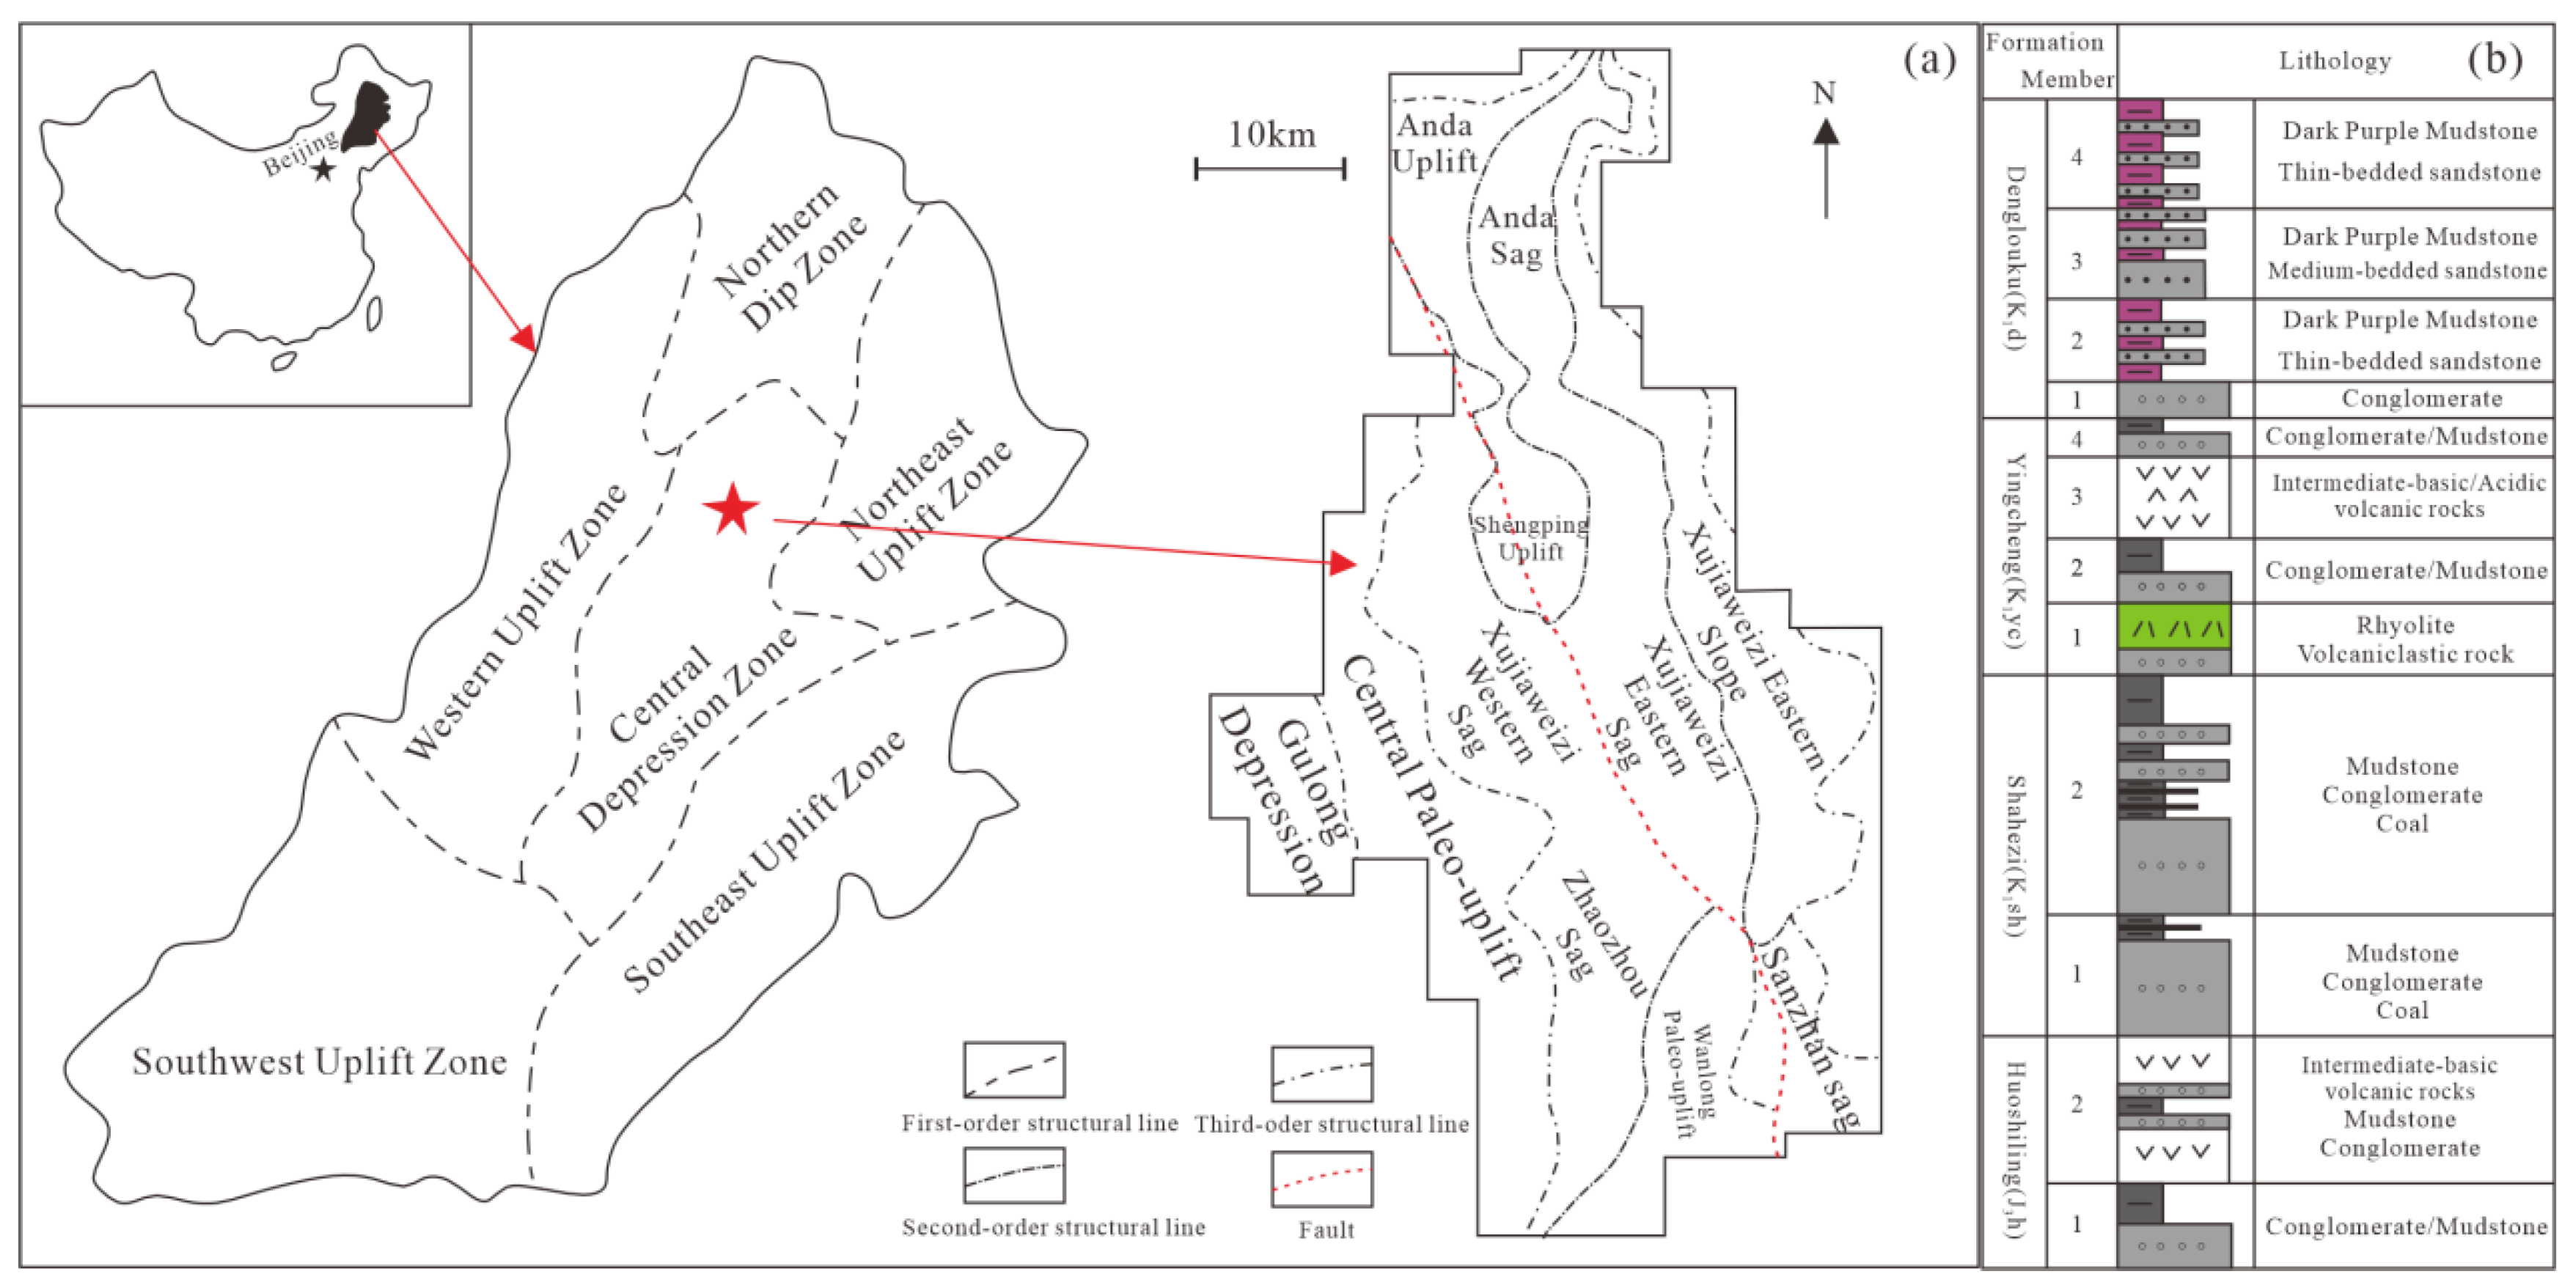
2. Geological Setting

The Songliao Basin is a Mesozoic–Cenozoic basin superimposed on the Paleozoic basement. It has undergone two stages: early intense faulting and later stable subsidence, forming a dual structure of “lower faulted layers + upper sag layers”. The Early Cretaceous was the stage of development for the faulted basin, where the basement underwent NNE- and NNW-trending conjugate faults under near-NS compressional stress, resulting in the formation of six primary structural units within the Songliao Basin: the western faulted zone, the western uplift zone, the central faulted zone, the central uplift zone, the eastern faulted zone, and the southeastern uplift zone [29]. The Xujiaweizi Fault Depression in the study area is located in the central faulted zone of the northern Songliao Basin, covering an area of approximately 3700 km2. It is the primary target area for deep natural gas exploration in the Songliao Basin. Based on the deep structural and stratigraphic characteristics, the area is divided into four structural units: the Xujiaweizi Western Sag, the Anda–Shengping Uplift, the Xujiaweizi eastern Sag, and the Xujiaweizi eastern Slope (Figure 1a).
The subsurface stratigraphic succession within the Xujiaweizi Fault Depression’s deeper intervals encompasses lithologic units stratigraphically underlying the Second Member of the Quentou Formation. This succession is arranged conformably in ascending chronostratigraphic order as follows: the Late Jurassic Huosiling Formation (J3h), succeeded by the Early Cretaceous Shahezi (K1sh), Yingcheng (K1yc), and Denglouku (K1d) Formations, and the first and second sections of the Quentou Formation (K1q). The overall burial depth is generally greater than 2500 m. The target interval in the Lower Cretaceous Denglouku Formation is divided into four sections (Deng 1 to Deng 4), with the lithology dominated by sand-mudstone, and vertically subdivided into four lithological segments: multicolored sandstone and gravel, dark mudstone, massive sandstone, and interbedded sandstone and mudstone (Figure 1b). The area contains abundant oil and gas resources, with multiple tight sandstone gas wells achieving high production, demonstrating strong natural gas exploration potential [30].

3. Sample and Method

3.1. Cast Thin Section

Representative tight sandstone samples were selected from 18 typical wells in the Denglouku Formation of the Xujiaweizi Fault Depression (Table 1). Cast thin sections are the core samples for pore structure analysis, and their preparation requires multiple precise steps to achieve high-fidelity solidification and visualization of the pore network. Standard core samples (approximately 25 mm in diameter) were subjected to oil removal and dehydration treatment: Soxhlet extraction with a toluene–methanol mixture (3:1) for 48 h, followed by gradient heating and enhanced pore contrast with trace fluorescent dye. The cast thin sections were stained and impregnated with epoxy resin and then observed using a Leica DMLP microscope (Leica Microsystems, Wetzlar, Germany). The scanning electron microscope (SEM) used was a Hitachi S-3400N model (Hitachi High Technologies Corporation, Tokyo, Japan). The laboratory temperature was kept at a constant 25 °C with a relative humidity of 40%, meeting the equipment’s normal operating requirements. The microscopic observation experiments were conducted in the Key Laboratory of Shale Oil and Gas Accumulation and Efficient Development in Continental Facies at the School of Earth Sciences, Northeast Petroleum University, Daqing, China. The experiments followed the Chinese National Standard GB/T 17366-1998 [31].

3.2. High-Pressure Mercury Injection

The intricate pore–throat architecture of sedimentary matrices is conceptually framed as an assembly of self-affine capillary clusters exhibiting scale-invariant topological configurations. During mercury injection porosimetry (Hg as non-wetting phase, θ > 90°), interfacial tension forces establish a threshold pressure governing immiscible phase invasion dynamics. The penetration of the non-wetting fluid into the lithic microarchitecture necessitates the attainment of suprathreshold injection pressures (P_c > P_entry) to overcome capillary resistance at meniscus interfaces [32,33]. This additional pressure equals the capillary force, and the amount of mercury injected under this pressure is represented as the corresponding connected pore–throat volume. By recording the injection pressure and the injected mercury volume and based on the relationship between injection pressure and mercury saturation, the capillary pressure curve that characterizes the pore–throat structure is obtained. The pore–throat radius curve is derived from the relationship between capillary pressure and pore–throat radius using the Young–Laplace equation [34].
P c = 2 σ c o s θ r
where Pc is the capillary pressure (MPa); r is the pore–throat radius (μm); θ is the wetting angle (°); and σ is the surface tension (mN/m). Nine sandstone samples were drilled into standard core plugs with a diameter of 2.5 cm and a length of 3 cm. The experiment used the AutoPore IV 9500 mercury intrusion instrument (Micromeritics, Norcross, GA, USA). The mercury intrusion experiment includes pressurization for mercury injection and depressurization for mercury withdrawal. The maximum test pressure is 200 MPa.

3.3. Fractal Model

Fractal theory has been applied to the quantitative study of sandstone reservoir pore structures since the 1980s. The microarchitectural topology of sedimentary pore spaces typically exhibits non-Euclidean geometric properties, manifesting as fractional scaling behaviors with optimal fractal scaling parameters (Df) within the 2.0–3.0 interval. Mathematical modeling reveals an inverse proportionality between Df values approaching theoretical minima (~2.0) and spatial uniformity of hydraulic conduit radii (σd < 1 μm2), whereas Df trending toward the upper asymptotes (~3.0) directly correlates with an exponential enhancement of microstructural anisotropy (β > 0.85) quantified through capillary pressure hysteresis analysis. Therefore, the larger the fractal dimension, the more complex the pore–throat structure of the reservoir, and the stronger the heterogeneity of the reservoir. When the pore–throat radius of tight sandstone exhibits a fractal structure, the number of pore throats with a radius greater than r is denoted as N [35]. The relationship between N and r can be expressed as follows:
N ( > r ) = r r max F ( r ) d r = a r D
In the equation, rmax is the maximum pore–throat radius (μm); F(r) is the pore–throat radius distribution density function; a is the proportional constant [36]. Since the minimum pore–throat radius rmin is much smaller than rmax, the following can be obtained:
S = ( r r min ) 3 D
In the equation, S represents the saturation of the wetted phase corresponding to capillary pressure Pc (%). Assuming that the contact angle (θ) is unaffected by pore–throat size, the fractal equation for the pore–throat radius distribution can be derived as follows:
S = ( P c P min ) D 3
In the equation, Pmin is the capillary pressure corresponding to rmax (MPa). Taking the logarithm of the formula gives the following [37]:
l g ( S ) = ( D 3 ) l g ( P c ) ( D 3 ) l g ( P min )
Based on capillary pressure experimental data, the relationship between lg(S) and lg(Pc) can be determined. In this experiment, air serves as the wetting phase, while mercury acts as the non-wetting phase. Therefore, lg(S) is converted to lg(1 − SHg), where SHg is the mercury saturation. Then, the slope of the relationship trend line of lg(1 − SHg) and lg(Pc) is analyzed, which represents the Hurst exponent H. Finally, the fractal dimension D is calculated as follows:
D = 3 + H
According to fractal theory, pore–throat structure fractals can be categorized into overall fractals and segmented fractals. When the relationship trend line between lg(1 − SHg) and lg(Pc) forms a straight line, it indicates a self-similar fractal distribution. The structures of large and small pore throats are similar, and their fractal dimensions are close [38]. When the relationship trend line of lg(1 − SHg) and lg(Pc) is not a straight line and there is a distinct inflection point in the middle, the line is divided into several straight lines based on the inflection point. The fractal dimensions of pore throats of different sizes are then calculated, and the total fractal dimension of the entire pore–throat structure is obtained by performing a weighted average calculation based on the pore–throat porosity of different sizes. This is used to determine the fractal characteristics of the pore size distribution and pore–throat structure.

4. Results

4.1. Reservoir Physical Properties and Storage Space Characteristics

Based on the measured data from the study area samples and collected physical property data, the porosity range of the Xujiaweizi Fault Depression Denglouku Formation reservoir is 2.0~11.2%, with an average porosity of 5.56%. The permeability range is 0.002~0.865 × 10⁻³ μm2, with an average permeability of 0.054 × 10⁻³ μm2, classifying it as typical tight sandstone. The relationship between the logarithms of porosity and permeability shows a poor linear relationship (R2 = 0.43), reflecting the strong heterogeneity of the reservoir pore structure (Figure 2).
Through the analysis of core samples and scanning electron microscope images from the study area, the Denglouku Formation tight sandstone mainly develops four types of pore structures: residual intergranular pores, intragranular dissolution pores, micropores, and microfractures (Figure 3). The storage space is primarily composed of residual intergranular pores and intragranular dissolution pores, with intragranular dissolution pores mainly including feldspar dissolution pores and lithic dissolution pores. The feldspar particles are completely dissolved to form mold pores. The radii of intergranular pores and intragranular pores are generally less than 10 μm, and the pore radii are mainly distributed between 0.2 and 2.3 μm, indicating a large number of micropores in the reservoir, which are one of the main contributors to porosity. The throat structure in the study area is mainly composed of sheet–like throats and bundle-like throats. These can serve as both fluid storage space and fluid flow channels. The throat radius is generally less than 0.15 μm.

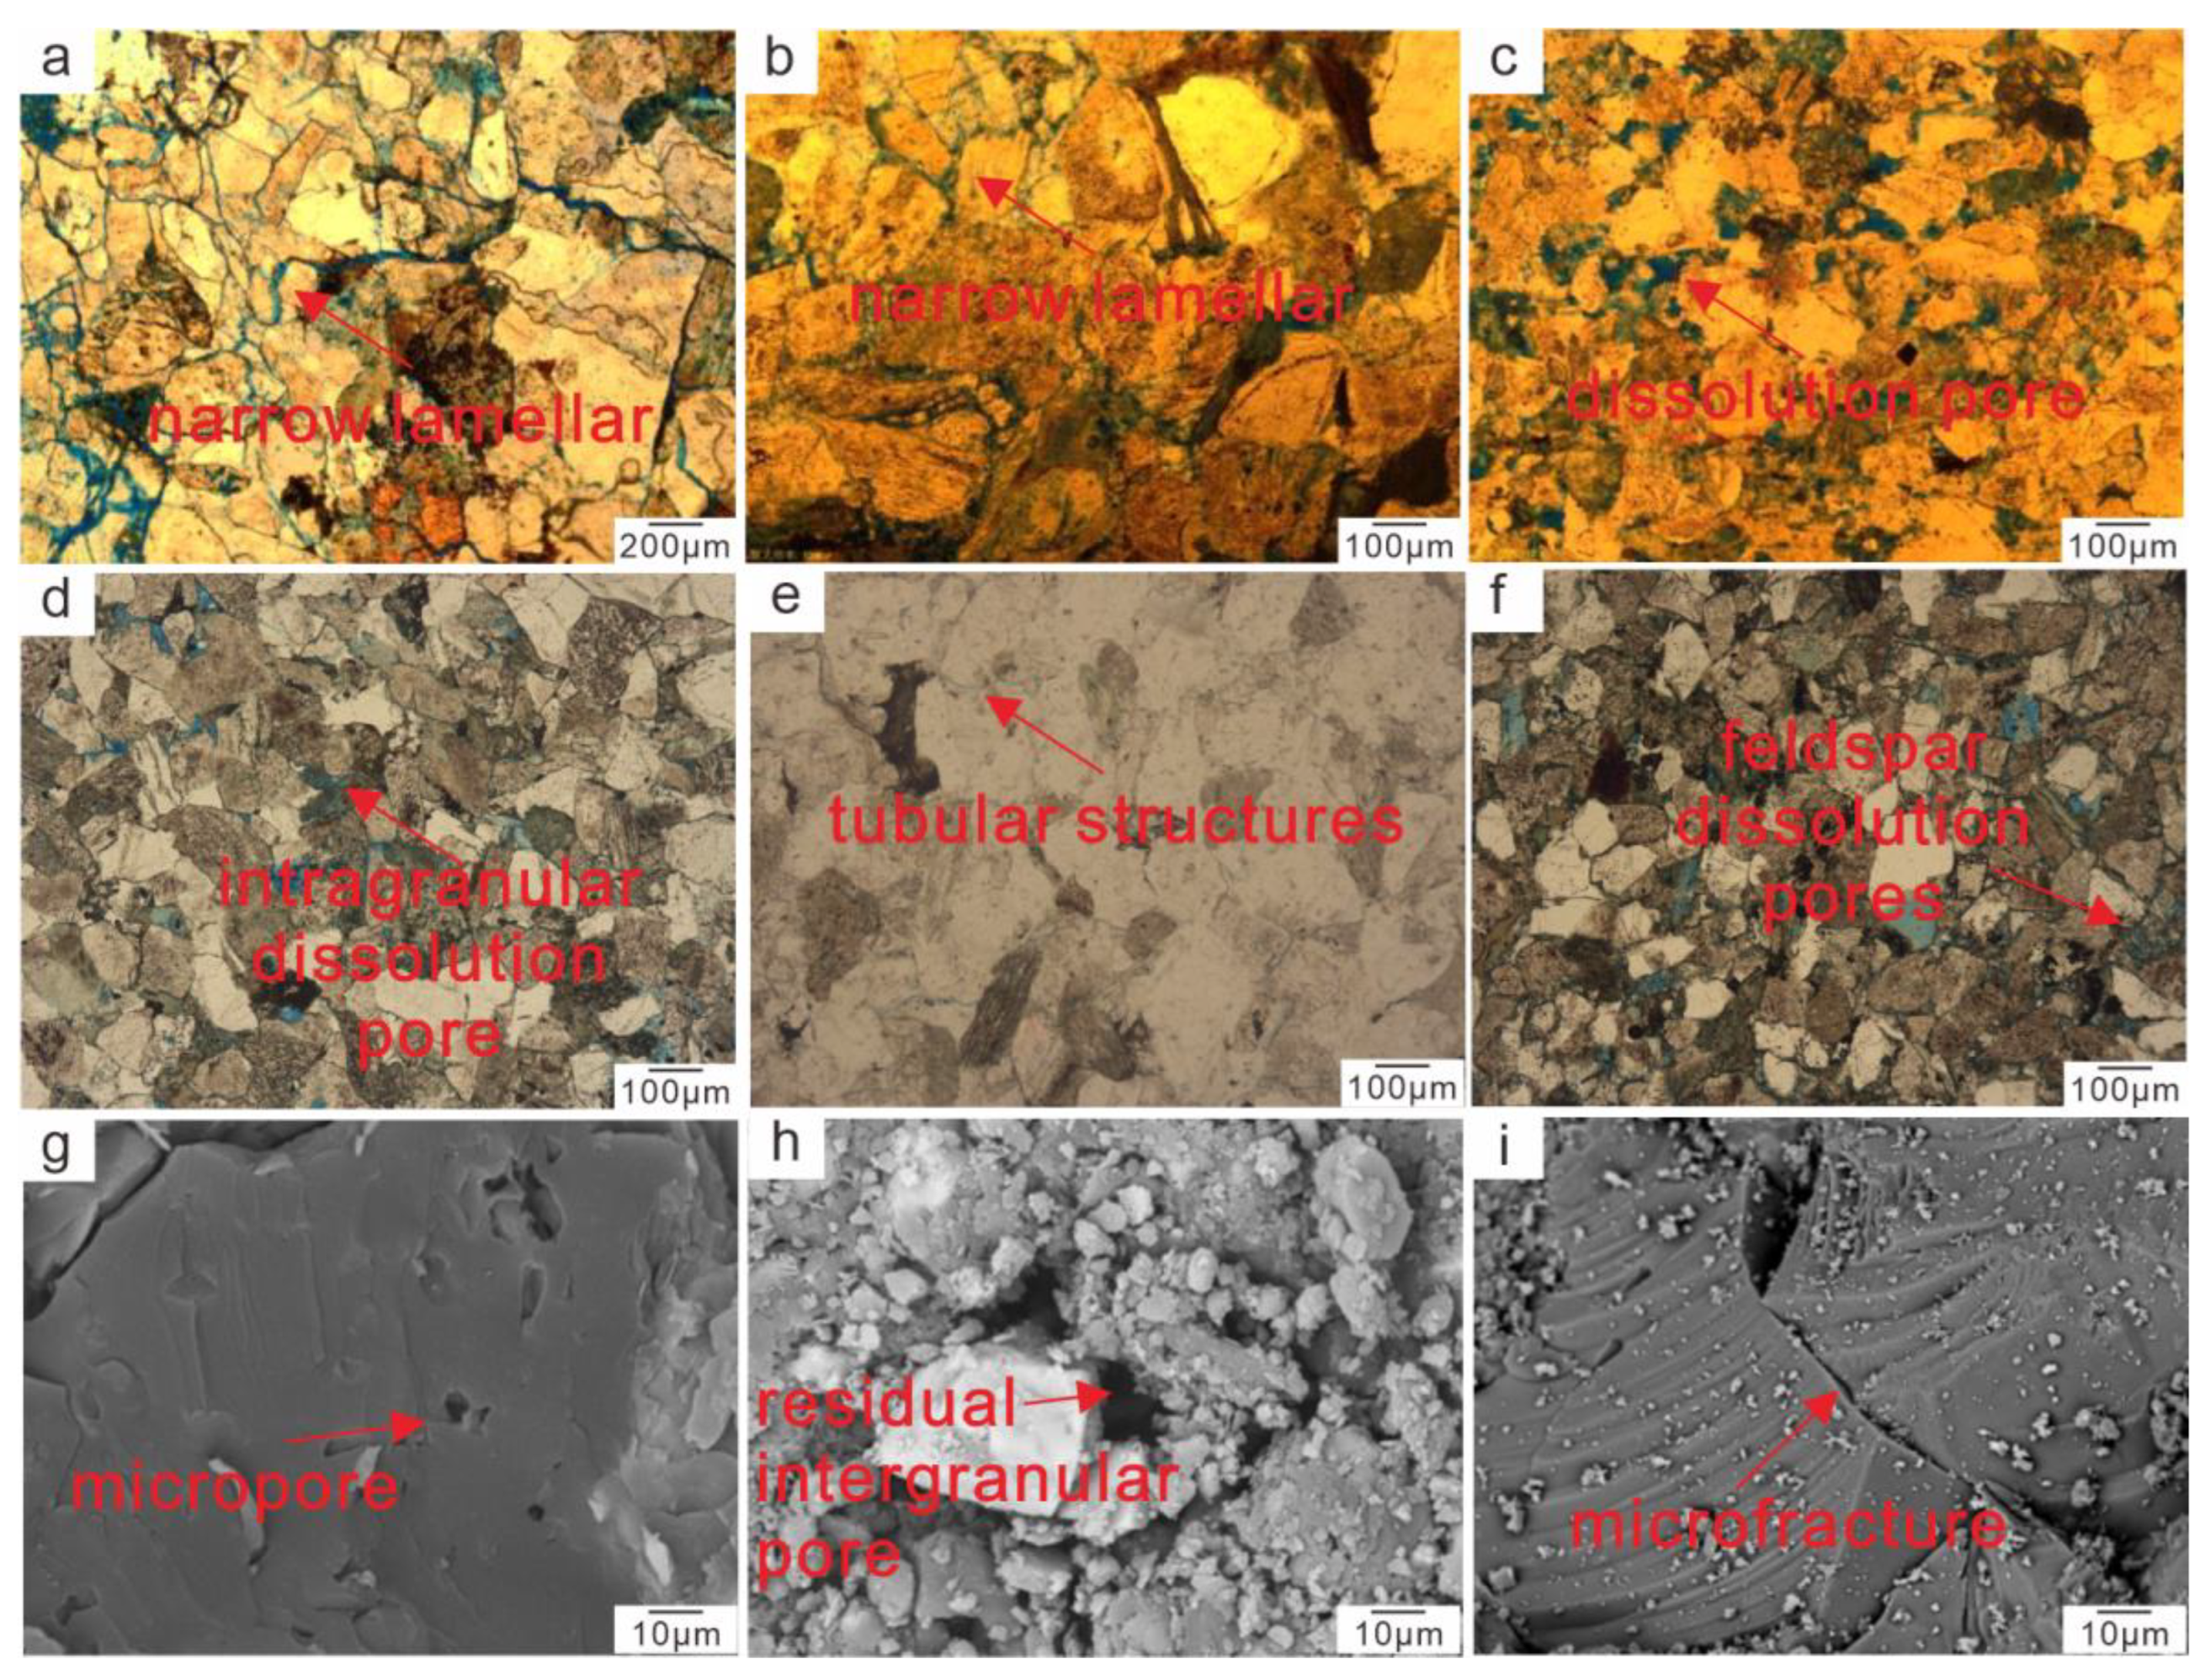
4.2. Microscopic Pore–Throat Structure Characteristics

The mercury injection curve in the high-pressure mercury intrusion experiment reflects the connectivity and distribution of pores and throats. A typical mercury intrusion curve is generally divided into three sections: an initial rising section, a middle stable section, and a final upward bending section [39]. The variation range of each curve parameter is large, indicating strong heterogeneity of the Denglouku Formation tight sandstone reservoir in the study area. Based on the high-pressure mercury intrusion data of 18 representative samples from this test (Table 2), the mercury injection curve can initially show that the pore–throat distribution of the Denglouku Formation tight sandstone reservoir in the study area is relatively heterogeneous.
The pore–throat size distribution in the study area was derived from the high-pressure mercury injection (HPMI) data, as shown in Figure 4. The distribution frequency of all the sample pore throats was primarily unimodal, with the main distribution range of pore throats between 0.01 μm and 1 μm. The pore–throat distribution varies greatly, with an average pore–throat radius distribution range of 0.9–0.013 μm and an average value of 0.32 μm. The median pore–throat radius distribution range was 0.004–0.538 μm, with an average value of 0.12 μm. According to the pore classification standard, the effective pore space types are classified as micropores (≤10 nm), small pores (10–100 nm), mesopores (100 nm–1 μm), and macropores (>1 μm). The Denglouku Formation tight sandstone samples in the study area show almost no development of macropores, with mainly micropores, small pores, and mesopores developed. Through a statistical analysis of the volume fraction and porosity of pore throats with different pore diameters, it was determined that the average volume fractions of mesopores, small pores, and micropores were 16%, 51%, and 33%, respectively, with average porosities of 1.17%, 3.47%, and 1.7%.

4.3. Fractal Characteristics of Tight Sandstone Reservoirs

The high-pressure mercury injection curve allows the derivation of the lg(1-SHg)-logPc relationship scatter plot for the pore–throat structure of tight sandstone. From the fractal curve of typical samples, it can be observed that the fractal curves of the samples have distinct inflection points (Figure 5). The inflection points divide the curve into three segments, and the slopes of the three fractal curves exhibit significant changes, indicating that the pore throats of the reservoir in the study area exhibit three fractal characteristics. A segmented fitting was performed using the least squares method, and the curves of each segment fit well. Other samples also exhibited similar characteristics, with a coefficient of determination (R2) greater than 0.85, indicating that the tight sandstone reservoir samples in the study area have multiple fractal characteristics, which can be characterized using fractal geometry theory.
The fractal dimensions D1, D2, and D3 corresponding to the mesopores, small pores, and micropores are statistically determined based on their respective porosities φ1, φ2, and φ3. From Table 3 and Figure 6, it can be seen that the overall fractal dimension varies between 2 and 3, and the fractal dimensions for each type of pore show a high relationship, with coefficients of determination ranging from 0.8636 to 0.998. Furthermore, based on the average fractal dimensions for each pore type, D1 > D2 > D3, indicating that larger pores are more dispersed, and the reservoir exhibits stronger heterogeneity.
The formula for calculating the fractal dimension of the overall pore throat in the sample is as follows:
D = D 1 φ 1 + D 2 φ 2 + D 3 φ 3 φ 1 + φ 2 + φ 3
In other words, the total fractal dimension D is calculated by applying a weighted average to the porosities of mesopores, small pores, and micropores. Calculations show that the fractal dimension D of tight sandstone samples in the study area falls between 2.484 and 2.973, with an average of 2.8019, suggesting that the reservoirs are overall characterized by strong heterogeneity and intricate pore–throat architectures.

5. Discussion

5.1. The Relationship Between Fractal Dimension, Porosity, and Permeability

The complexity of the reservoir’s pore structure and the heterogeneity of the reservoir are closely related to the fractal dimension of the reservoir, which also has a certain impact on the reservoir’s physical properties. Generally, the larger the fractal dimension D of the reservoir, the stronger the heterogeneity, resulting in lower connectivity, more complex pore–throat structure, and poorer reservoir properties. To specifically study the relationship between fractal dimension, porosity, and permeability, a scatter plot of porosity, permeability, and fractal dimension for the reservoir in the study area was drawn (Figure 7). This study found a certain degree of negative relationship between porosity, permeability, and fractal dimension. As the fractal dimension increased, both porosity and permeability decreased, reflecting that, as the reservoir’s pore structure becomes more complex and heterogeneity increases, the connectivity of the reservoir decreases; its pore-flow capacity weakens; and its physical properties worsen.

5.2. Fractal Dimension and Microscopic Pore–Throat Structure Characteristics

The fractal dimension provides a quantitative measure of the complexity and heterogeneity of pore structures. By calculating the fractal dimension values from mercury injection data, the relationship between fractal dimension and pore structure parameters is systematically explored. By plotting scatter diagrams of fractal dimension versus pore–throat structure parameters, the variation patterns of fractal dimension and the influence of fractal characteristics on pore–throat structure can be determined (Figure 8).
The median pore–throat radius can be approximated as the average pore radius of the sample. It shows a certain negative relationship with the fractal dimension (Figure 8a). As the fractal dimension approaches 3, the median pore–throat radius decreases accordingly. The main reason is that as the median pore–throat radius increases, the pore–throat distribution of the reservoir becomes more concentrated, the pore surface becomes more regular, and the storage space increases, which reduces the complexity of the pore structure, weakens the heterogeneity of the reservoir, and improves the physical properties of the reservoir. The sorting coefficient (also known as the coefficient of variation) better reflects the uniformity of the pore–throat size distribution. The sorting coefficient of the reservoir in the study area’s Denglouku Formation ranges from 1.108 to 3.966, with an average value of 2.403. The sorting coefficient shows a certain positive relationship with the fractal dimension, where a smaller value indicates a more uniform pore–throat distribution. The large variation range of the sorting coefficient in the study area (Figure 8b) indicates that the pore–throat distribution is highly uneven, reflecting the complexity of the reservoir’s pore–throat structure in the study area. The positive and negative values of skewness reflect the skewness of the pore–throat distribution. When the skewness is greater than 0 (positive skew), the pore–throat distribution is biased toward larger pore sizes, and the proportion of larger pore throats is higher. When the skewness is less than 0 (negative skew), the pore–throat distribution is biased toward smaller pore sizes. The skewness in the study area shows a certain degree of negative relationship with the fractal dimension (Figure 8c).
As the fractal dimension approaches 3, the skewness gradually shifts from positive to negative, reflecting that, as the heterogeneity of the reservoir increases, the pore–throat structure gradually shifts from micro–small pore throats dominating, which results in poorer flow capacity. The displacement pressure in the study area shows a certain degree of positive relationship with the fractal dimension (Figure 8d). The larger the fractal dimension, the higher the displacement pressure, indicating that as the pore structure becomes more complex, higher displacement pressure is required. The maximum mercury injection saturation reflects the connectivity between pore throats in the tight sandstone reservoir. The relationship between the maximum mercury injection saturation and the fractal dimension shows a certain degree of negativity (Figure 8e). A certain negative relationship is observed between it and the fractal dimension, indicating that lower fractal dimensions correspond to weaker heterogeneity, simpler pore structures, better reservoir connectivity, and improved physical properties. The mercury withdrawal efficiency reflects the uniformity of the pore–throat distribution and shows a positive relationship with the fractal dimension, although the relationship is relatively weak; as the efficiency increases, the fractal dimension also increases, indicating a highly uneven pore–throat distribution and significantly enhanced reservoir heterogeneity. There is a positive relationship between the mercury withdrawal efficiency and the fractal dimension, although the relationship is relatively weak. As the mercury withdrawal efficiency increases, the fractal dimension also increases, reflecting that the pore–throat distribution of the reservoir is very uneven, and heterogeneity is significantly enhanced.

5.3. Reservoir Classification Based on Mercury Injection and Fractal Dimension

Based on the complexity of the pore–throat structure in tight sandstone reservoirs, a multivariate classification coefficient is used. The fractal dimension and the pore–throat combination types and pore–throat size distribution characteristics are combined to classify the pore structure of the tight sandstone reservoirs in the study area into three categories. The classification method of the multivariate classification coefficient is modified from previous classification methods [40]. In this study, seven parameters, including porosity, permeability, median pore–throat radius, sorting coefficient, displacement pressure, maximum mercury injection saturation, and mercury withdrawal efficiency, were selected for quantitative evaluation. The multivariate classification coefficient for tight reservoirs (Feci) was then constructed as follows:
F e c i = l n φ i φ m a x × K i K m a x × R m i R m m a x × S i S m a x × R H i R H m a x X P i X P m a x × P c d i P c d m a x
where φ i and φ m a x represent porosity and its maximum value; K i and K m a x represent permeability and its maximum value; R m i and R m m a x represent the median pore–throat radius and its maximum value; S i and S m a x represent sorting coefficient and its maximum value; R H i and R H m a x represent maximum mercury injection saturation and its maximum value; X P i and X P m a x represent sorting coefficient and its maximum value; P c d i and P c d m a x represent displacement pressure and its maximum value.
Based on calculations, the multivariate classification coefficient of the tight sandstone reservoirs in the study area ranges from −11.64 to 2.48. As shown in Figure 9, statistical analysis revealed that the interquartile range (25~75%) of the Feci values lies between −6 and 0. Therefore, −6 and 0 were selected as the classification thresholds for the reservoir. Considering additional reservoir parameters, the tight sandstone reservoirs in the study area are classified into three categories (I, II, III) from high to low quality. The classification and evaluation standard for the tight sandstone reservoirs of the Xujiaweizi Fault Depression in the study area was established, considering the distribution of each parameter’s value (Table 4). Type I reservoirs include samples S3, S12, S13, S14, and S16. The reservoir storage space in these reservoirs is mainly composed of small-to-medium intergranular pores and narrow plate-like throat channels, with a small number of dissolution pores and micropores.
Therefore, Type I reservoirs have high storage and flow capacity. Type II reservoirs include samples S1, S2, S4, S6, S7, S12, S15, S17, and S18. These reservoirs are mainly composed of intragranular pores and narrow plate-like throat channels, with a small number of intergranular pores and micropore-level throats. Their storage and flow capacity are lower than those of Type I reservoirs. Type III reservoirs include samples S5, S8, S9, S10, and S11. The pore–throat structure in these reservoirs is mainly composed of micropore-level pores and extremely narrow plate-like or tubular throats, with a small number of small-pore throats. Overall, these reservoirs have lower storage and flow capacity. The classification and evaluation of reservoir pore structure characteristics based on high-pressure mercury injection and combined with classification features provides a quantitative structural classification scheme. This has important theoretical and geological significance for the heterogeneity of tight sandstone micropore structures and quantitative reservoir evaluation.

6. Conclusions

The overall physical properties of the tight sandstone reservoir in the Denglouku Formation of the Xujiayuanzi Fault Depression are relatively poor, with an average porosity of 5.56% and an average permeability of 0.054 × 10⁻³ μm2, typical of tight sandstone reservoirs. The primary pore types include residual intergranular pores, dissolution pores, and intragranular pores. The effective storage space is mainly composed of mesopores, micropores, and small pores, and the throat types are primarily narrow plate-like and tubular.
The distribution frequency of different pore–throat sizes in the tight sandstone reservoir of the Denglouku Formation in the study area varies significantly, showing a multi-peak distribution. The pore structure exhibits distinct fractal classification characteristics, with an average total fractal dimension of 2.8019, indicating that the tight sandstone reservoirs of the Denglouku Formation possess overall complex pore structures and strong heterogeneity.
By integrating the pore structure parameters and the fractal dimensions, the tight sandstone reservoirs in the study area are classified into three types. The better the reservoir quality, the smaller the corresponding fractal dimension, indicating better pore connectivity and homogeneity, with smoother pore–throat surfaces, which are more favorable for oil and gas enrichment. A distinct relationship exists between the fractal dimensions and the reservoir pore structure parameters, establishing fractal dimension as an indispensable metric for systematically evaluating microscopic reservoir heterogeneity. This methodology bears significant implications for advancing hydrocarbon exploration and exploitation strategies within targeted study areas, offering quantitative insights into subsurface architectural complexities critical for development-phase decision-making.

Author Contributions

Conceptualization, Y.Z. and Y.L.; Funding acquisition, Y.Z. and Y.L.; Resources, X.Y.; Formal analysis, J.Y., B.H. and Z.W.; Project administration, Y.Z.; Visualization and Writing—original draft, Z.W.; Writing—review and editing, Z.W., X.Y. and Y.L. All authors have read and agreed to the published version of the manuscript.

Funding

This work was funded by the National Natural Science Foundation of China (Grant No. 42372150), the China Postdoctoral Science Foundation (Grant No. 2022MD723760), and the Heilongjiang Province Postdoctoral Special Funding (Grant No. LBH-TZ2308).

Data Availability Statement

The authors do not have permission to share data due to internal policy.

Conflicts of Interest

The authors declare no conflicts of interest.

References

  1. Zou, C.; Yang, Z.; He, D.; Wei, Y.; Li, J.; Jia, A.; Chen, J.; Zhao, Q.; Li, Y.; Li, J.; et al. Theory, technology and prospects of conventional and unconventional natural gas. Pet. Explor. Dev. 2018, 45, 575–587. [Google Scholar] [CrossRef]
  2. Bai, B.; Zhu, R.; Wu, S.; Cui, J.; Su, L.; Li, T. New micro-throat structural characterization techniques for unconventional tight hydrocarbon reservoir. China Pet. Explor. 2014, 19, 78–86. [Google Scholar]
  3. Zhu, X.M.; Pan, R.; Zhu, S.F.; Wei, W.; Ye, L. Research progress and core issues in tight reservoir exploration. Earth Sci. Front. 2018, 25, 141–146. [Google Scholar]
  4. Sun, L.D.; Zou, C.N.; Jia, A.L.; Wei, Y.; Zhu, R.; Wu, S.; Guo, Z. Development characteristics and orientation of tight oil and gas in China. Pet. Explor. Dev. 2019, 46, 1015–1026. [Google Scholar] [CrossRef]
  5. Lu, Z.; Liu, C.; Zang, Q.; Wu, Y.; Yang, X.; Yang, H.; Zeng, X.; Li, W. High-pressure mercury injection combined with fractal theory to analyze the pore structure of tight sandstone: A case study of the Heshui area in the Ordos Basin. Geol. Sci. Technol. Bull. 2023, 42, 264–273. [Google Scholar]
  6. Zou, C.; Yang, Z.; He, D.; Wei, Y.; Li, J.L.; Jia, A.; Chen, J.; Zhao, Q.; Li, Y.; Li, J.; et al. Theoretical technology and practice of unconventional oil and gas geology. Earth Sci. 2023, 48, 2376–2397. [Google Scholar]
  7. Zhu, R.; Wu, S.; Su, L.; Cui, J.; Mao, Z.; Zhang, X. Problems and Future Works of Porous Texture Characterization of Tight Reservoirs in China. Acta Pet. Sin. 2016, 37, 1323–1336. [Google Scholar]
  8. Yang, Y.; Zhang, H.R.; Yuan, W.; Yang, D.; Hu, D. Fractal Characteristids Comparison and Genesis Conventional Sandstone and Glutenite. Geoscience 2022, 36, 149–158. [Google Scholar]
  9. Lv, T.X.; Zhang, G.Y.; Yi, L.; Li, Z.C.; Song, P.; Li, S. Pore Structure Characteristicsand Fractal Characteristics of Low Permeability Reservoir. Spec. Oil Gas Reserv. 2022, 29, 59–65. [Google Scholar]
  10. Wu, H.; Zhang, C.; Ji, Y.; Liu, R.E.; Cao, S.; Chen, S.; Zhang, Y.; Wang, Y.; Du Wei, L.G. Pore-Throat Size Characterization of Tight Sandstone and Its Control on Reservoir Physical Properties: A Case Study of Yanchang Formation, Eastern Gansu, Ordos Basin. Acta Pet. Sin. 2017, 38, 876–887. [Google Scholar]
  11. Zhang, W.K.; Shi, Z.J.; Tian, Y.M. Characterization of Pore Throat Characteristics of Tight Sandstone by Combined High Pressure Mercury Injection and Constant Velocity Mercury Injection Experiments. Fault-Block Oil Gas Field 2021, 28, 14–20, 32. [Google Scholar]
  12. Chen, C.; Sun, Y. Fractional dimension of the pore-texture in sandstones and its application. Acta Sedimentol. Sin. 1996, 4, 109–114. [Google Scholar]
  13. Zhang, C.M.; Chen, Z.B.; Zhang, Z.S.; Li, J.; Linghu, S.; Sun, B.X. Based on NMR T2 study on pore fractal structure of reservoir rock based on spectrum distribution. J. Oil Gas Technol. 2007, 4, 80–86+166–167. [Google Scholar]
  14. Cheng, G.X.; Liu, Y.R.; Guo, N.; Wang, A.P.; Chang, H.Y.; Zhang, T.J. Fractal characterization of cast thin sections: A case study of Kunbei New Area, Qaidam Basin. Lithol. Reserv. 2016, 28, 72–76, 87. [Google Scholar]
  15. Han, X.J.; Shi, Z.J.; Li, Y.L. An improved algorithm for picking up the first arrival of seismic waves using fractal dimension. Pet. Geophys. Explor. 2002, 60–63, 98. [Google Scholar]
  16. Peng, J.; Han, H.D.; Xia, Q.S.; Li, B. Fractal characteristic of microscopic pore structure of tight sandstone reservoirs in Kalpintag Formation in Shuntuoguole area, Tarim Basin. Pet. Res. 2020, 5, 2096–2495. [Google Scholar] [CrossRef]
  17. Liu, Y.; Pang, X.Q.; Ding, C.; Chen, D.; Li, M. Pore structure and fractal characteristics of Yan 10 tight sandstone reservoir in Wuqi area. Sci. Technol. Eng. 2023, 23, 12474–12483. [Google Scholar]
  18. Wang, W.; Chen, C.B.; Xu, S.; Li, Y.; Zhu, Y.; Huang, X. Fractal characteristics of different scale pore throats and their controlling factors in Yanchang Formation tight sandstone, Ordos Basin. Pet. Exp. Geol. 2022, 44, 33–40. [Google Scholar]
  19. He, W.Z.; Zhong, F.; He, C. Research and application of fractal structure of reservoir rock pores. Nat. Gas Ind. 2000, 67–70, 43. [Google Scholar]
  20. Huang, J.L.; Dong, D.Z.; Li, J.; Hu, J.; Wang, Y. Reservoir fractal characteristies of continentalshale:An example from Triassie Xujiahe Formation shale, Sic huan Basin, China. Nat. Gas Geosci. 2016, 27, 1611–1618. [Google Scholar]
  21. Liu, K.; Shi, W.Z.; Wang, R.; Qin, S. Pore structure fractal characteristics its relationship with reservoir propertics of the first member of lower Shihezi Formation tight sandstone in Hangjinqi area, Ordos Basin. Bullentin Geol. Sci. Technol. 2021, 40, 57–68. [Google Scholar]
  22. Liu, Y.K.; Wang, Y.P.; Tang, H.M. Application of capillary pressure curve and fractal theory in reservoir classification. Lithol. Oil Gas Reserv. 2014, 26, 89–92, 100. [Google Scholar]
  23. Zhao, J.; Huang, Z.L.; Zhang, J.Y.; Deng, G.J.; Xu, M.G. Fractal and grading evaluation of pore structure in tight sandstone reservoirs taking the Huangliu Formation in Ledong District, Yinggehai Basin as an example. J. Sediment. 2024, 42, 295–308. [Google Scholar]
  24. Feng, Z.D.; Zhou, Y.; Wu, W.; Wang, G.X.; Liang, S.Y.; Yu, J. Fractal characteristics of mercury injection in heterogeneous sandstone reservoirs and reservoir evaluation. J. China Univ. Pet. (Nat. Sci. Ed.) 2021, 45, 25–34. [Google Scholar]
  25. Guo, R.L.; Xie, Q.C.; Qu, X.F.; Chu, M.J.; Li, S.T.; Ma, D.X.; Ma, X.F. Fractal characteristics of pore-throat structure and permeability estimation of tight sandstone reservoirs: A case study of Chang 7 of the Upper Triassic Yanchang Formation in Longdong area, Ordos Basin, China. J. Pet. Sci. Eng. 2020, 184, 0920–4105. [Google Scholar] [CrossRef]
  26. Song, Z.Z.; Lu, M.Y.; Zhao, L.B.; Zhang, Y.Q.; He, Y.Y.; Jiang, F.J.; Yang, Z.Z.; Chen, W.Y.; Huo, L.N.; Wang, R. Prediction model of tight sandstone permeability based on fractal theory. Acta Sedimentol. Sin. 2023, 41, 1847–1858. [Google Scholar]
  27. Zhang, J.H.; Fang, W.; Li, J.K.; Huo, Q.L. Deep gases and their genetic types of the Xujiaweizi fault depression zone, Songliao Basin and their contribution. Acta Geol. Sin. 2009, 83, 579–589. [Google Scholar]
  28. Bai, X.F.; Liang, J.P.; Zhang, W.J.; Fu, L.; Peng, J.; Xue, T.; Yang, L.; Liu, J. Geologic conditions, resource potential and exploratory direction of deep gas in the northern Songliao Basin. Nat. Gas Geosci. 2018, 29, 1443–1454. [Google Scholar]
  29. Shao, Z.; Wu, C.; Zhang, D.; Yang, B.Z. Reservoir characteristics and controlling factors of Shahezi Formation in Xujiaweizi Fault Depression, Songliao Basin. Oil Gas Geol. 2019, 40, 101–108. [Google Scholar]
  30. Sun, L.D.; Yang, L.; Li, X.M.; Zhou, X.; Hu, B.; Cai, Z.; Du, Y. Paleoenvironment and Main Controlling Factors of Source Rocks in the Shahezi Formation, Xujiaweizi Fault Depression. Acta Sedimentol. Sin. 2024, 42, 1753–1764. [Google Scholar]
  31. GB/T 17366-1998; National Microbeam Analysis Standardization Technical Committee. Methods of Mineral and Rock Specimen Preparation for EPMA. Standardization Administration of China: Beijing, China, 1988.
  32. Wu, Y.; Liu, C.; Ouyang, S.; Luo, B.; Zhao, D.; Sun, W.; Awan, R.S.; Lu, Z.; Li, G.; Zang, Q. Investigation of Pore-Throat Structure and Fractal Characteristics of Tight Sandstones Using HPMI, CRMI, and NMR Methods: A Case Study of the Lower Shihezi Formation in the Sulige Area, Ordos Basin. J. Pet. Sci. Eng. 2022, 210, 335–348. [Google Scholar] [CrossRef]
  33. Sing, K.S.W. Reporting Physisorption Data for Gas/Solid Systems with Special Reference to the Determination of Surface Area and Porosity (Recommendations 1984); Wiley VCH Verlag GmbH &. Co. KGaA: Hoboken, NJ, USA, 1990. [Google Scholar]
  34. Zhu, Y.Q.; Zhang, H.; Yao, Z.G.; Yin, S. Fractal characteristics and controlling factors of tight and stone reservoirs based on high-pressure mercury injection experiments. Sci. Technol. Eng. 2024, 24, 8419–8428. [Google Scholar]
  35. Li, H.Y.; Pang, Q.; Wei, K.Y.; Zeng, Y.; Cui, Y.; Zhu, Y. The Fractal Characteristics of Pore Structure in Tight Sandstone Reservoirs and Their Impact on Gas Water Permeability: A Case Study of Shanl Member in Tao2 Block, Southeastern Sulige Gas Field. Fault-Block Oil Gas Field 2023, 30, 177–185. [Google Scholar]
  36. Li, P.; Zheng, M.; Bi, H.; Wu, S.; Wang, X. Pore Throt Structure and Fractal Characteristics of Tight Oil Sandstone: A Case Study in the Ordos Basin, China. J. Pet. Sci. Eng. 2017, 149, 665–674. [Google Scholar] [CrossRef]
  37. Mandelbrot, B.B. The Fractal Geometry of Nature; Freeman: New York, NY, USA, 1982; pp. 1–532. [Google Scholar]
  38. Wu, H.; Liu, R.E.; Ji, Y.L.; Zhang, C.; Chen, S.; Zhou, Y.; Du, W.; Zhang, Y.; Wang, Y. Pore throat fractal characteristics of tight gas reservoir and its relationship with seepage: Taking He 8 member of Lower Shihezi Formation in Ordos Basin as an example. Acta Sedimentol. Sin. 2017, 35, 151–162. [Google Scholar]
  39. Wang, W.; Song, Y.J.; Huang, J.; Li, Y.; Chen, Z.; Zhu, Y. Fractal characteristics of pore-throat structure in tight sandstones using high-pressure mercury intrusion porosimetry. Bull. Geol. Sci. Technol. 2021, 40, 22–30. [Google Scholar]
  40. Xu, Y.Q.; He, Y.H.; Bu, G.P.; Chen, L.; Liu, L.; Zhu, Y. Establishment of Classification and Evaluation Criteria for Tight Reservoirs Based on Characteristics of Microscopic Pore Throat Structure and Percolation: A Case Study of Chang 7 Reservoir in Longdong Area Ordos Basin. Pet. Geol. Exp. 2019, 41, 451–460. [Google Scholar]
Figure 1. (a) Location of the Xujiaweizi Fault Depression; (b) comprehensive stratigraphic column of the deep strata in the Xujiaweizi Fault Depression.
Applsci 15 05730 g001
Figure 2. Physical properties of Xujiaweizi Fault Depression Denglouku Formation tight sandstone: (a) porosity distribution frequency histogram; (b) permeability distribution frequency histogram; (c) porosity and permeability cross–plot.
Applsci 15 05730 g002
Figure 3. Pore and throat microscopic features of the Denglouku Formation reservoir in the Xujiaweizi area: (a) Narrow lamellar, S3, 2914.7 m; (b) Narrow lamellar, S1, 2889.8 m; (c) Dissolution pore, S13, 2725.3 m; (d) Intragranular dissolution pore, S12, 2695 m; (e) Tubular structures, S5, 3075.3 m; (f) Feldspar dissolution pores, S15, 3055.5 m; (g) Micropore, S11, 2898.6 m; (h) Residual intergranular pore, S2, 2860.6 m; (i) Microfracture, S8, 3148.4 m.
Applsci 15 05730 g003
Figure 4. High-pressure mercury intrusion pore–throat distribution characteristics of experimental samples in the study area. (a) Capillary pressure versus mercury injection saturation curve; (b) pore diameter distribution curve.
Applsci 15 05730 g004
Figure 5. Fractal characteristic curve of typical sample S12.
Applsci 15 05730 g005
Figure 6. Fractal dimension distribution of micropores, mesopores, and macropores in the study area samples.
Applsci 15 05730 g006
Figure 7. (a) The relationship between fractal dimension and porosity; (b) the relationship between fractal dimension and permeability.
Applsci 15 05730 g007
Figure 8. The relationship between fractal dimension and (a) Pore-throat radius median; (b) Sorting Coefficient; (c) Skewness; (d) Displacement pressure; (e) Maximum mercury injection satu-ration; (f) Withdraw efficiency.
Applsci 15 05730 g008
Figure 9. Scatter plot of the Feci index for each sample overlaid with box plot statistics.
Applsci 15 05730 g009
Table 1. Basic characteristics of selected tight sandstone samples.
Sample NumberFormationDepth
/m
Sample Length
/cm
Sample Diameter
/cm
Porosity
/%
Permeability
/10−3 μm2
S1Denglouku2889.83.2832.5134.40.018
S2Denglouku2860.63.1792.5218.40.053
S3Denglouku2914.73.3752.51490.070
S4Denglouku3025.33.3222.516.20.031
S5Denglouku3075.33.3192.4643.70.010
S6Denglouku3077.53.6692.5143.90.015
S7Denglouku2874.23.062.5135.90.094
S8Denglouku3148.43.3012.5092.70.002
S9Denglouku2958.53.2552.4653.60.017
S10Denglouku2903.12.3972.5154.30.007
S11Denglouku2898.63.4592.51330.023
S12Denglouku26953.1832.51510.9610.166
S13Denglouku2725.33.2022.5079.80.072
S14Denglouku2726.13.362.5179.10.104
S15Denglouku3055.53.1152.525.6280.004
S16Denglouku3100.73.0992.5188.717 0.135
S17Denglouku3021.23.6872.5137.10.048
S18Denglouku2936.33.4032.5147.80.020
Table 2. Pore–throat structure parameters of the Denglouku Formation Reservoir in the study area.
Sample NumberPore–Throat Radius Maximum
/μm
Pore–Throat Radius Average
/μm
Pore–Throat Radius Median
/μm
Sorting CoefficientSkewnessMaximum Mercury Injection Saturation/%Withdrawal Efficience
/%
S11.10.3710.2582.951.671.812.2
S20.250.040.0381.190.6579.18957.453
S31.5150.540.421.1510.39383.10237.587
S41.9150.3030.1472.95−0.47473.15858.316
S50.2880.1260.0043.51−0.50845.81440.761
S61.0670.5060.092.26−0.3753.45561.342
S71.8130.8590.0043.966−0.52772.12172.4
S81.7380.8980.0043.341−0.42734.28777.2
S91.3380.9040.0371.936−0.26939.86151.8
S100.0530.0130.0042.378−0.89761.37946.667
S110.0460.0210.0043.706−0.3963944.1
S120.2880.0950.5381.1080.65190.73823.8
S130.2630.0670.1881.1410.12189.8133.6
S140.1250.0730.0782.0220.58983.29750.334
S150.1240.0660.0733.4850.1671.862.2
S161.5880.2990.1432.7950.19180.25457.6
S171.0880.1320.0282.0860.026773.43134.404
S181.4580.4790.1042.2210.15275.34846.903
Max1.9150.9040.5383.9660.65190.73877.2
Average0.8800.3190.1122.427−0.05567.41450.380
Min0.0460.0130.0041.108−0.89734.28723.8
Table 3. Fractal dimension statistics for different pore types in the study area samples.
Sample NumberMicroporeMesoporeMacroporeD
D1R2φ1D2R2φ2D3R2φ3
S12.34890.99280.112.67150.95653.692.90680.99610.602.6955
S22.99860.98660.222.95830.97830.332.6220.92473.152.6748
S32.42280.99722.802.76260.98094.002.63470.99312.202.6256
S42.99620.96951.032.96830.86364.652.32690.99260.522.9195
S52.99510.93493.472.99340.99573.822.87590.95421.812.9707
S62.98730.99510.522.9890.97381.042.80430.9922.342.8780
S72.96690.8691.062.9930.97163.842.90450.89381.002.9733
S82.99720.8871.562.99230.97043.902.77460.9932.342.9280
S92.99210.89742.742.98970.94644.142.69390.99222.922.9023
S102.99080.87760.422.99350.9511.392.80850.87122.502.8858
S112.99530.95160.752.99810.93030.752.94870.86461.502.9727
S122.690.93210.172.36940.99440.842.52070.99481.692.4840
S132.99680.98220.362.98050.98171.012.330.91922.232.5788
S142.99670.92551.852.86650.90484.372.21130.96832.182.7248
S152.99690.86891.702.98520.89443.762.87190.97541.632.9619
S162.9950.99010.482.66820.9987.812.78240.98010.432.6919
S172.99850.93590.052.79130.98884.702.66160.99640.882.7730
S182.99530.93971.752.75980.99228.552.68550.95670.662.7930
Average2.90890.94071.172.87390.95963.482.68690.95881.702.8019
Table 4. Classification of pore structure in tight sandstones from the Denglouku Formation within the study area.
Pore Structure ClassificationIIIIII
Pore TypologyPredominantly fine-to-medium intergranular pores with minor dissolution poresDominantly intragranular pores with subordinate intergranular poresPrimarily microporous networks with spatially limited dissolution voids
Throat MorphologyNarrow lamellarNarrow lamellarTubular structures
Porosity (%)8.7~10.93.9~7.82.7~5.9
Permeability (mD)0.07~0.170.004~0.050.002~0.09
Median Pore–Throat
Radius (μm)
0.08~0.50.04~0.260.004~0.04
Sorting Coefficient1.1~2.71.2~3.41.9~4.0
Displacement
Pressure (MPa)
1.58~4.143.9~15.77.77~26.0
Maximum Mercury Saturation (%)>8053.5~8034.3~72.1
Mercury Withdrawal Efficiency (%)23.8~57.634.4~62.240.8~77.2
Fractal Dimension2.484~2.7252.67~2.962.88~2.97
Feci>0−6~0−11.6~−6
Sample IDS3, S12, S13, S14, S16S1, S2, S4, S6, S7, S12, S15,
S17, S18
S5, S8, S9, S10, S11
Fractal Fitting Characteristics of Representative SamplesApplsci 15 05730 i001Applsci 15 05730 i002Applsci 15 05730 i003
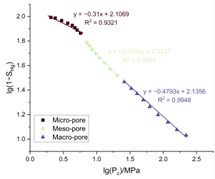
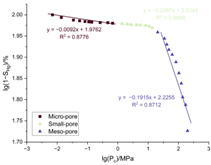
Mercury Intrusion Signature of Representative SamplesApplsci 15 05730 i004Applsci 15 05730 i005Applsci 15 05730 i006
Disclaimer/Publisher’s Note: The statements, opinions and data contained in all publications are solely those of the individual author(s) and contributor(s) and not of MDPI and/or the editor(s). MDPI and/or the editor(s) disclaim responsibility for any injury to people or property resulting from any ideas, methods, instructions or products referred to in the content.

