Article

Network Resource Allocation Method Based on Awareness–Prediction Joint Compensation for Low-Earth-Orbit Satellite Networks

1
State Key Laboratory of Space-Ground Integrated Information Technology, Space Star Technology Co., Ltd., Beijing 100095, China
2
Beijing Institute of Satellite Information Engineering, Beijing 100095, China
*
Author to whom correspondence should be addressed.
Appl. Sci. 2025, 15(10), 5665; https://doi.org/10.3390/app15105665
Submission received: 15 April 2025 / Revised: 16 May 2025 / Accepted: 17 May 2025 / Published: 19 May 2025

Abstract

:
With the continuous expansion of low-Earth-orbit (LEO) satellite networks, the services within these networks have exhibited diverse and differentiated demand characteristics. Due to the limited onboard resources, efficient network resource allocation is required to ensure high-quality network performance. However, the dynamic topology and differentiated resource requirements for diversified services pose great challenges when existing resource awareness or prediction methods are applied to satellite networks, resulting in poor awareness latency and the inaccurate prediction of resource status. To solve these problems, a network resource allocation method based on awareness–prediction joint compensation is proposed. The method utilizes the node awareness latency as a prediction step and employs a long short-term memory model for resource status prediction. A dynamic compensation model is also proposed to compensate for the prediction results, which is achieved by adjusting compensation weights according to the awareness latencies and prediction accuracies. Furthermore, an efficient, accelerated alternating-direction method of multipliers (ADMM) resource allocation algorithm is proposed with the aim of maximizing the satisfaction of service resources requirements. The simulation results indicate that the relative error between the compensation data and onboard resource status does not exceed 5%, and the resource allocation method can improve the service resource coverage by 15.8%, thus improving the evaluation and allocation capabilities of network resources.

1. Introduction

The services in low-Earth-orbit (LEO) satellite networks have diversified with the continuous expansion of these networks and the increase in the associated number of users. The demand for network resources to guarantee network transmission in concurrent, multiservice scenarios has experienced exponential growth [1]. However, the available network resources on the satellite, including bandwidth, computing power, and storage, are severely limited by the harsh space environment, resulting in a bottleneck in network service performance. The varying demands for resources among different services further increase the complexity of network resource management and scheduling [2]. Therefore, it is necessary to utilize network resource allocation technology, in conjunction with the resource demands of services, to jointly optimize the allocation of multi-dimensional network resources and enhance the service capability of LEO satellite networks.
Network resource allocation methods primarily encompass static pre-allocation of resources and dynamic adaptive scheduling of resources. Due to the fixed position of terrestrial network nodes and the stability of links, the method of allocating resources on demand is commonly employed to achieve dynamic resource scheduling, while static pre-allocation is used for special services [3]. However, the topology of satellite networks undergoes dynamic changes, characterized by large inter-satellite distances and poor link stability. As such, the transmission of operational or management commands is subject to large latency and latency deviation, leading to inadequate timeliness in dynamic resource allocation processes, including resource status awareness, decision-making, and the dispatch of commands [4]. The intelligent and dynamic online decision-making approach for terrestrial networks has become ineffective due to the limited computing capabilities on satellites and the complexity of time-varying scenarios. Static resource allocation and resource reservation mechanisms are therefore frequently adopted in satellite networks, helping to guarantee the stable transmission of network services.
The efficient real-time awareness of the resource status of the satellite [5] and the precise prediction of changes in resource status are important prerequisites for network resource allocation. However, the application of terrestrial network awareness and prediction methodologies to satellite networks encounters challenges such as inadequate awareness latency and imprecise resource state predictions, owing to the dynamic characteristics of the network topology and the unpredictability of services. On the one hand, the instability of inter-satellite and satellite–ground links, coupled with the significant distance involved, results in propagation delay, transmission delay, and onboard processing delay at each node as the awareness data traverse multiple nodes within the network [6]. The cumulative effect of these delays leads to a certain degree of awareness latency when the awareness data are relayed back to the ground, meaning that the awareness data received on the ground exhibit lag. On the other hand, satellite network resources exhibit complex temporal and spatial distributions, with resource status characterized by nonlinearity and discontinuity. Furthermore, the operations within the network demonstrate significant randomness, leading to considerable uncertainty in resource variations. The insufficient availability of data to guarantee the robustness and generalization capabilities of prediction models poses challenges in accurately forecasting the resource status. Consequently, developing an efficient network resource awareness method, augmented with precise and agile prediction techniques, is necessary to facilitate accurate and flexible resource allocation.
There have been numerous studies on resource allocation based on satellite network resource awareness and the prediction of network resource status. However, research on these two aspects is often conducted in isolation. In other words, relevant research may solely concentrate on optimizing awareness methods or enhancing prediction accuracy while neglecting the relationship between them. For example, in the case of satellite network awareness technology, the method of [7] employs telemetry technology to perceive the network status in real time and implements dynamic adaptive routing based on the awareness data. However, it fails to take into account the issue of awareness delay during the telemetry process. The volume of awareness transmission data is enhanced by employing dynamic channel allocation, enabling the establishment of an awareness method characterized by low latency and high bandwidth [8]. However, this approach also increases the complexity and awareness overhead of the network. Research on the allocation of network resources has employed intelligent prediction models [9,10], such as RNNs, long short-term memory (LSTM) [11], graph convolutional networks (GCNs) [12], and transfer learning [13], to forecast network traffic or resource status, subsequently making intelligent computing or dynamic allocation decisions based on the predictions. However, due to the limited onboard computing resources, these models struggle to fulfill the dynamic and intricate resource allocation demands of the network in terms of their real-time capability and deployment ability. Reference [14] predicted the computing, storage, and bandwidth resources of onboard control plane units and user plane units using an LSTM in order to improve the dynamic resource allocation capability for network service functions. The authors of [15] proposed a routing strategy based on cache resource awareness and prediction, which can reduce the end-to-end transmission delay by sensing user needs and using cache prediction results for dynamic routing planning. However, unpredictable random events and subsequent data perturbations are prone to arise within the network due to the dynamic and uncertainty of network topology, leading to a decline in the prediction accuracy of the model [16]. Additionally, the sparsity of data and the non-stationarity of time series further impact the authenticity and reliability of the data.
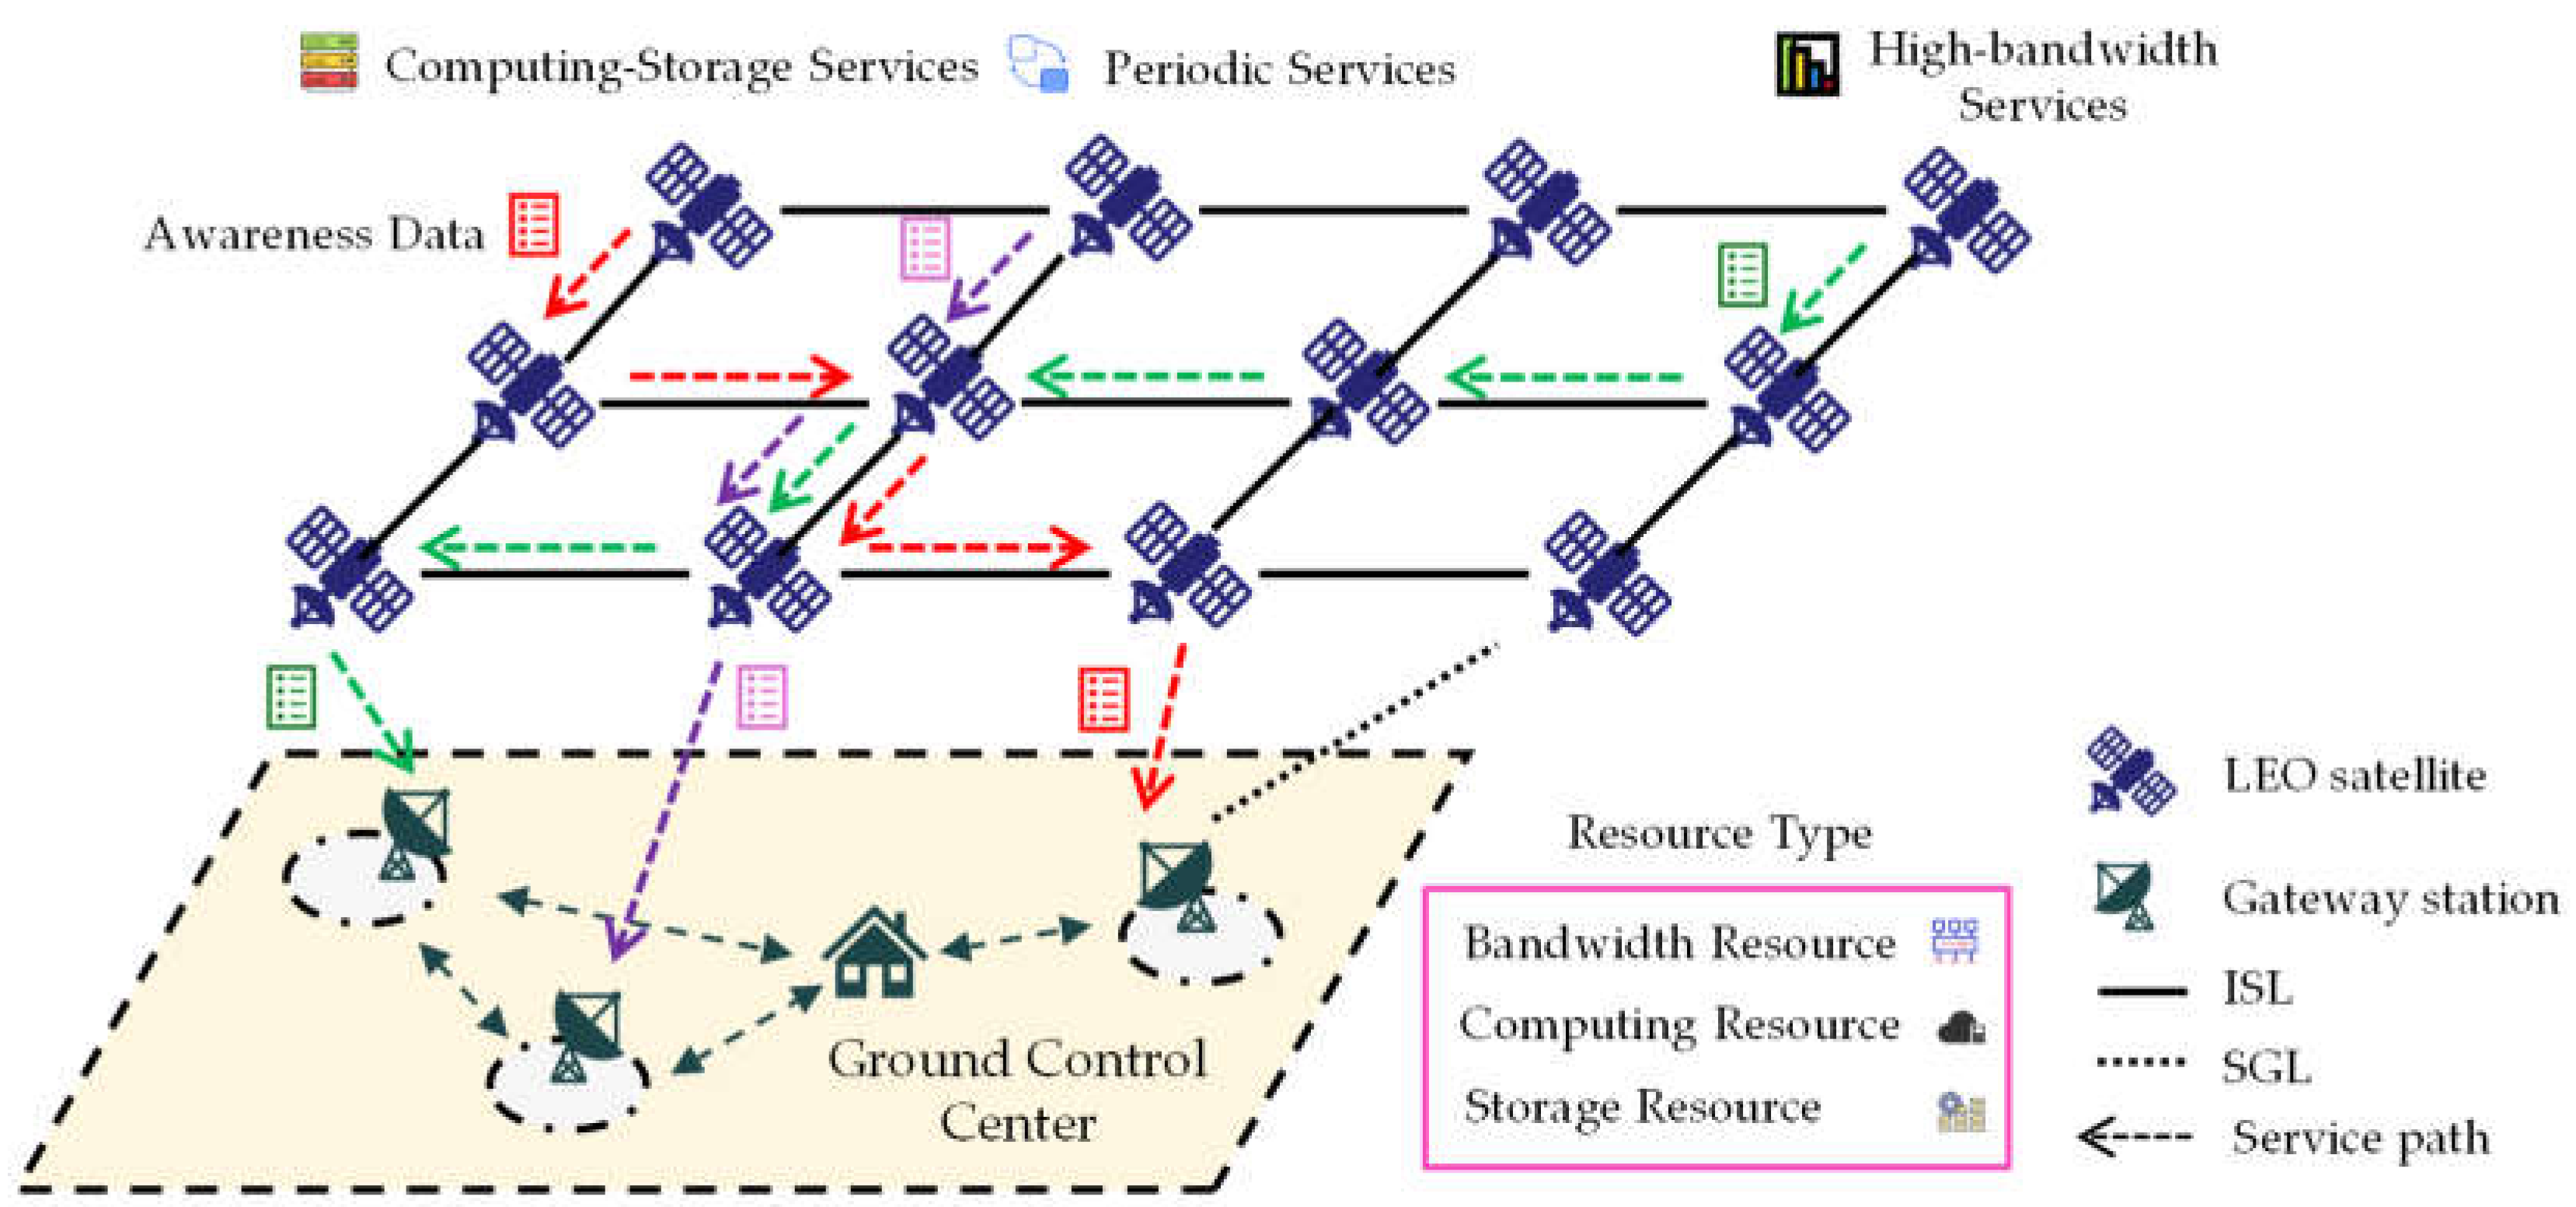
Aiming at the problems of poor awareness latency and low resource prediction accuracy, a network resource allocation method for LEO satellite networks based on awareness–prediction joint compensation (NRA-PPJC) is proposed in this study. This method can be utilized to dynamically compensate for resource prediction results, improve the timeliness and accuracy of data, and build an efficient network resource allocation method. Satellite networks have fewer available open-source resource data than terrestrial networks, while the data gathered by terrestrial networks lack complex and time-evolving characteristics. Therefore, the variations in resource occupancy and release of satellite network resources during the arrival and transmission processes of service were simulated in this work using service arrival models. These simulations were tailored to account for differences in the service generation period, user distributions, and varying resource demands among different types of services. In-band network telemetry (INT) technology was utilized to obtain the resource status of each node. To address the issue of significant awareness latency unique to satellite networks, node resource awareness data were correlated with awareness latency to create a resource dataset that sequences data based on latencies. Using the differentiated awareness delay between nodes as the prediction step size, the LSTM method was employed to flexibly forecast the resource status for various nodes. Furthermore, an awareness–prediction joint compensation model was designed considering the impact of awareness latency between nodes on the timeliness of awareness data, as well as the varying prediction accuracies of various resources. This model assesses the accuracy of awareness data based on the extent of awareness latency and subsequently determines the compensation weights for various resource prediction accuracy scenarios. A dynamic network resource allocation algorithm based on the accelerated alternating direction method of multipliers (ADMM) is proposed, which uses compensation data as an input with the optimization objective of maximizing the service resource coverage ratio (SRCR). Considering the differences in service priorities and resource requirements, the ability of resources between nodes to carry service was calculated, and the local variable initialization process of the ADMM was optimized to reduce search iterations, improve algorithm convergence speed, and achieve efficient network resource allocation.
The main contributions of this paper are as follows:
(1)
A network resource dataset that utilizes the different awareness latencies of each node as its temporal sequence was constructed. The changes in node resource occupancy and release were simulated based on the service arrival models. INT was used for resource awareness, and a dataset was compiled using the corresponding awareness latency as the time interval. The dataset served as the foundation for resource status prediction, data compensation, and resource allocation.
(2)
An awareness–prediction joint compensation model was designed. The LSTM is used to dynamically predict the onboard resource status for each node using the different awareness latencies between nodes as the prediction steps. An innovative method for constructing compensation parameters based on awareness latency and prediction accuracy is also proposed. This approach can compensate for the prediction results based on the resource prediction accuracy combined with awareness data, thereby improving the timeliness and accuracy of the data.
(3)
A dynamic network resource allocation algorithm based on the ADMM is proposed. The initialization process of the ADMM’s local variables was refined based on the actual service carrying capacity of satellites, using compensation data as the input and with the optimization objective of maximizing the SRCR. This enhances the algorithm’s convergence speed and enables efficient resource allocation.
The remainder of this paper is organized as follows: Section 2 introduces the scenario of the LEO satellite network, service model, and resource model. Section 3 introduces resource state awareness based on INT and resource state prediction based on LSTM. Section 4 introduces the awareness–prediction joint compensation model. Section 5 proposes a dynamic network resource allocation algorithm based on accelerated ADMM. Section 6 validates the proposed method through simulation experiments. Section 7 provides a brief summary of the paper.

2. LEO Satellite Network Model

2.1. Satellite Network Scenario

The LEO satellite network scenario is shown in Figure 1. A set of satellite nodes in the network is represented as Sat = { S 1 ,   S 2 , , S N } . The network mainly comprises periodic, high bandwidth, and computing–storage services, which primarily consume satellite bandwidth, computing, and storage resources. The network contains k time slots, and there exists a set of time slots T K = { T 1 ,   T 2 , , T k } , where the time interval between each time slot is Δ T , and the network topology remains fixed within each time slot. The corresponding adjacency matrices Map   =   { M 1 ,   M 2 , . . . M k } are generated for each time slot based on the static topology, and each adjacency matrix encompasses information on inter-satellite link visibility, link distance, and the availability of satellite-to-ground links. Dynamic topology scenarios can therefore be converted into static slices, and services can be deployed within time slots based on the topology at the current moment. A task tuple { Z ,   P Z ,   T Z } is used to represent each service flow, where Z is the set of service identifiers, P Z is the set of service transmission paths, and T Z is the time when the service starts transmitting until it is received at the gateway station.
The satellite transmits service data via the inter-satellite wireless communication link, with the topology remaining unchanged throughout the transmission process. The source and destination nodes of any service in the network are denoted as S a and S b . There are N z satellites on the service transmission path P z , and the propagation delay at the nodes is defined as follows:
t pro i = L i j θ pro ,   i , j P z , z Z ,
where L i j is the inter-satellite distance from node i to node j , and θ pro is the propagation speed, and the value is equal to the speed of light. The time consumed by node i when sending service packets to the next node j is called the transmission delay:
t trans i = E z i φ i ,   z Z ,
where E z i represents the data size sent by each satellite, and φ i is the transmission rate of the switch on each satellite.

2.2. LEO Satellite Network Resources

In the LEO satellite network, each node is a communication satellite that can provide network services such as data forwarding, routing calculation, and data caching based on the services, with the corresponding onboard network resources being bandwidth, computing, and storage resources. There are variations in the scale of onboard resources among different satellites considering the differences in their payload capabilities. Therefore, to better characterize the three types of onboard network resources, the maximum available resources for each satellite node are set at the initial state, specifically R i max = [ B i max ,   C i max ,   S i max ] . Then, a corresponding resource status matrix is generated for each satellite, reflecting the remaining status of onboard resources. Specifically, the remaining bandwidth, computing, and storage resources of the i -th satellite at time t j can be represented as R i t j = [ B i t j , C i t j , S i t j ] . Therefore, there exists a network resource status matrix at time t j for all nodes in the entire network:
R t j = B 1 t j B 2 t j B N t j C 1 t j C 2 t j C N t j S 1 t j S 2 t j S N t j 3 × N ,

2.3. LEO Satellite Network Services

Three typical types of traffic services in LEO satellite networks were selected in order to better simulate the impact of differentiated resource demands between services on the resource variation of nodes—namely, periodic services, high-bandwidth services, and computing–storage services—with the priority of services gradually decreasing. Periodic services refer to periodic requests that are triggered on time based on the laws of topological motion or the repetitive needs of users. Typical services include daily control commands and periodic network data transmissions. Such services have relatively small data volumes and consume bandwidth resources and computing resources on the satellite. The Bernoulli binary distribution was utilized in this work to represent the success rate of a node receiving services within a fixed period [17]. Specifically, services arrive at certain intervals within a certain length of time with a certain probability. High-bandwidth services primarily target scenarios with high data rates and high-capacity transmission requirements. These services involve substantial data volumes and have high-bandwidth resource demands, often resulting in larger transmission delays at nodes. They consume larger amounts of bandwidth resources and some storage resources on the satellite. Typical services include audio and video streaming as well as large-volume image transmission services. The average arrival rate of the service per unit time, the number of service requests, and the observation interval were used as parameters in this work to simulate the probability of service arrival based on the Poisson distribution model [18,19]. Computing storage services rely on the onboard processing and storage capabilities of satellites. Typical application scenarios include satellite protocol acceleration, routing computation, and routing caching, which often consume a significant amount of satellite computing and storage resources. A Gamma model based on the arrival intervals and time scales of service was constructed in this study in order to model the probability of service arrival [20].
After the completion of the service, the resources occupied by the service are gradually released, and the resource consumption of the service does not exceed the maximum available resources of the satellite. Simulations were conducted for the three types of services based on the arrival probability distribution and data characteristics of each type of service. There are total of M services in the network, with the service set denoted as F serv . Among them, the periodic service set is F serv . Among them, the periodic service set is F per , the high-bandwidth service set is F band , and the computing–storage service set is F c - s , with F serv = F per     F band     F c - s and F per     F band     F c - s = . The number of the three types of services are M per , M band , M c - s , and M = M per + M band + M c - s .

3. Network Resource Awareness and Resource Status Prediction

3.1. Network Resource Awareness Based on INT

An awareness method based on INT technology is employed in LEO satellite networks. INT represents a hybrid awareness approach that writes awareness data into the unused fields of the service packet header, thereby enabling the awareness data to be transmitted alongside the service [21], which means the service transmission path can be regarded as the awareness path. Specifically, when the service flows through, the node integrates the status information of the onboard resources and incorporates it into the telemetry data within the service packet header, formatted as metadata [22]. The time consumed by each node when executing the telemetry packet header reading and metadata writing operations is defined as the awareness delay, which is much smaller than the propagation delay and transmission delay. The awareness delay of satellite node i can be therefore set as a fixed value t w i . When the service reaches the target node S b and the satellite arrives above the nearest gateway station, the awareness data and service data are transmitted back to the ground via satellite–ground links (SGLs), and the propagation time of the SGL is as follows:
t re S b = D S b θ pro ,
where D S b is the visible SGL distance from the target node S b to the nearest gateway station, and θ pro is the propagation speed, the value of which is equal to the speed of light. The queuing delay is similar to the on-board awareness delay, which is generally measured in microseconds due to the processing capability of the onboard hardware. In the congestion scenario, it increases to several milliseconds. The queuing delay has less impact than the propagation delay of ISL and SGL, such that it can also be set as a fixed value t Q i . Based on Equations (1) and (2), it can be concluded that for each node along the path, the time consumed for awareness and transmission processes is as follows:
t d S i = t pro S i + t trans S i + t w S i + t Q S i ,   S i P z ,
The accumulated awareness latency generated during the process of each node is as follows:
T d S i = t re S b + j = S i S b t d j ,   S i P z , S b P z ,
The collection of awareness latency from n z nodes on the service path P z received by the ground control center is T d z = { T d S a , T d S a + 1 , , T d S a + n z 2 , T d S b } . Therefore, the awareness latency matrix of each node at different times within the current time slot T k is as follows:
T d t j = T d S 1 ( t 1 ) T d S N ( t 1 ) T d S 1 ( t j ) T d S N ( t j ) , t j T k ,

3.2. Construction of Resource Awareness Dataset

3.2.1. Integration of Awareness Data

INT technology enables refined awareness of the resource status of all nodes in the network, providing data support for resource prediction. Due to the limited number of established LEO satellite networks, there are relatively few available open-source datasets for satellite network node resources. Terrestrial network traffic datasets and network resource datasets do not possess the complex time-varying characteristics and multidimensional heterogeneous features of satellite networks, making them unable to meet the resource prediction requirements in the current LEO satellite network scenarios. Network resource awareness datasets were therefore constructed in this work using simulation methods. The generation process of the awareness datasets is presented in Algorithm 1.
Algorithm 1: Resource awareness dataset generation
Input: The number of the three types of services M per , M band , M c - s ; Time slot T k ; network resource status matrix R i t j ;
1  for i  1 to  M  do
2   Generate corresponding service sets for three types of services based on arrival models and number of services;
3   Generate resource demand vectors F i R = B i , C i , S i for each services;
4  end
5  for j  1 to  k  do
6   Deploy services within the network, confirm the services across each node;
7   Update the on-board resource status based on the corresponding resource requirements of services;
8   Generate a network resource status matrix R i t j for the satellite;
9  end
10   Collect and integrate the on-board status of resources across the entire network at each time slice R t J = R t 1 , R t 2 , , R t j ,   t j T k ;
11   Extract data and construct corresponding resource datasets based on three types of resources in chronological order.
Output: Network resource awareness datasets.

3.2.2. Preprocessing of Dataset

Based on the in-band telemetry awareness method, the frequency of node status up-dates is related not only to the awareness delay on the service path but also to the intensity of the service. On the one hand, a large number of service requests pass through the nodes in certain areas of the network, leading to an increased frequency of awareness at each node. However, in certain areas of the network where the number of service requests is small, there are fewer services passing through the nodes, resulting in a decreased frequency of awareness at each node. On the other hand, at the same node, the frequency of resource awareness also varies across different time slots. The number of service requests passing through the node is higher in the current time slot than other slots, resulting in a larger interval between the awareness data. Therefore, the resource awareness data of the satellite node itself is nonlinear, and the data intervals between nodes are significantly different.
To address the above problems, preprocessing with timestamp synchronization is necessary for the resource status datasets of each node. First, the minimum value T d - min S i of the transmission latency from multiple services is taken as the standard awareness time slice in the dataset, representing the minimum data interval. The dataset is resampled and divided based on the interval, and multiple sets of awareness data in the interval are weighted and fused. Considering the nonlinearity of awareness data in time sequence caused by the sparsity of services and awareness delay caused by the difference of the path length, taking the minimum delay as the acquisition interval can increase the sampling frequency and reduce the data groups in the sampling interval, which can effectively alleviate the problem of data information loss when multiple groups of data are fused in the weighting process. The weighted calculation formula for data fusion to ensure the correlation between sets of data and mitigate the influence of outliers on data weighting is as follows:
x ~ ω t = k = 1 A f ω k x k t ,
where A f is the awareness frequency within the interval T d - min S i . x k t is the awareness data within the corresponding interval, and ω k is the weight corresponding to each data. According to the differences in factors such as nodes and time periods, ω k can be calculated using an exponential amplification weighting model, which is as follows:
ω k = x k t h j = 1 A f x j t h ,
where the weights satisfy the condition that i = 1 A f ω i = 1 , and h represents the weighted amplification coefficient, ranging from 0 to 5. The specific value of h influences the data fusion effect. (1) When h = 0 , the weights degrade to a simple average. (2) When h = 1 , the weights degrade to linear weighting. (3) When h > 1 , higher weights are assigned to high-value data, making them suitable for emphasizing outliers or key values. (4) When 0 < h < 1 , the influence of high-value data is reduced, while the weights of low-value data are enhanced, making them suitable for smoothing noise or mitigating extreme values. The value of h can be dynamically adjusted according to the characteristics of the actual data in order to compensate for correlations between data and prevent excessive information loss. After temporal synchronization, the data are normalized and scaled within the range of [0, 1]. The normalization formula is as follows:
x data = x x min x max x min ,
where x max and x min represent the maximum and minimum values in the fused data, respectively. Although normalization obscures features of data such as multi-peaks and shifts in resources, it preserves the relative positioning of the data. In other words, the model can still capture trends in data changes over time, including linear growth or cyclical fluctuations. More importantly, there exist differences in the dimensions and orders of magnitude among bandwidth, computing, and storage resources. Furthermore, the maximum available resources vary between satellites. Adopting a normalization method therefore facilitates the rapid processing of multi-dimensional data by the model, without the necessity of extensive modifications to training parameters, thereby enhancing the model’s generalization capability.

3.3. Resource State Prediction Based on LSTM

Resource status data exhibit nonlinear characteristics due to dynamic topological features. Traditional regression prediction methods perform poorly on nonlinear data, failing to meet the requirements for both accuracy and real-time performance. However, prediction models based on artificial intelligence can effectively enhance the prediction performance for nonlinear data. Neural networks, such as recurrent neural network models, are commonly used as prediction models, but they encounter the issue of exponentially decaying or growing back-propagated gradients in long time series, leading to problems of gradient vanishing or exploding during the training process [23]. These issues make it difficult for the model to learn the long-term dependencies in sequential data. LSTM, a lightweight intelligent prediction model, introduces cell states and gating mechanisms to discard, retain, and update certain information over long sequences, which effectively addresses the long-term dependency issues arising from cumulative long time series data, achieving the goal of accurate forecasting [24]. Therefore, a resource status prediction algorithm based on LSTM is proposed. This algorithm dynamically predicts the resource status of each node with the prediction step set as the awareness latency.
The dataset contained 500 samples and was divided into three parts in chronological order, with 70% of the data used as the training set, 15% as the validation set, and the remaining 15% as the test set. Input samples for the training set were generated using a sliding window T w , which contains 10 to 15 time slices of perceptual data. The predicted output sequence has a length of a single time slice, and the prediction target is x t . The batch size was set to 32, and the number of epochs was 30. The model consists of an input layer, LSTM layer, and output layer. The dimension of the input layer was set to ( T w , N w ) , and N w is the number of features. The LSTM layer consists of a three-layer structure, with dropout layers placed between them. The output layer consists of a fully connected layer and a regression layer, with the fully connected layer employing a linear activation function. The loss function uses mean squared error as MSE = 1 T k i = 1 T k y i   -   y ^ i 2 . Taking X t as the input, h t - 1 as the hidden state, and the cell state as V t - 1 , the LSTM computation steps are as follows:
f t = σ W f · h t 1 , x t + b f ,
where W f is the weight matrix for the state, b f is the bias vector, and σ ( t ) is the sigmoid function, with output values in the interval [0, 1], indicating which information is discarded in the cell state, retaining a certain proportion [25].
i t = σ W i · h t 1 , x t + b i ,  
C ~ t = tan h W V · h t 1 , x t + b V ,
where tanh is the activation function, W i and W V are the state weight matrices, b i and b V are the bias vectors. The model determines whether the current input information is written to the memory cell. The cell status is updated based on the above results:
V t = f t V t - 1 + i t V ~ t ,
where is the element-wise multiplication function. Then, the output memory cell information is controlled:
y t = σ W o · h t - 1 , x t + b o ,
h t = y t tan h V t ,
where W o is the state weight matrix, and b o is the bias vector.

4. Awareness–Prediction Joint Compensation Methods

LSTM is a traditional resource state prediction approach [23,26]. However, the innovation of this study lies in applying the prediction model to the specific challenges faced by satellite network resource awareness. The issues of varying time intervals in data awareness among nodes and differing prediction step sizes are addressed by dynamically adjusting the prediction step size based on node-aware latency. The prediction accuracy of network resource status based on LSTM varies with the change in the prediction step size. When the awareness latency is high, the error in the resource status prediction results increases. Additionally, the randomness of services and the instability of links in satellite networks lead to significant fluctuations in resource changes, which result in poor data continuity and stability, thereby reducing the prediction accuracy. Specifically, in scenarios characterized by significant resource fluctuations, such as those exhibiting spikes in resource curves, the retention of early growth trends in resources, attributed to the gating mechanism and the cumulative impact of errors, can cause prediction results to diverge substantially from actual values, thereby generating significant errors. Consequently, relying on these predictions can undermine the reliability and precision of the decision-making.
The awareness data also have poor timeliness due to the awareness latency caused by the dynamic topology of LEO satellite networks. Specifically, after the satellite node completes the writing operation of the metadata at time t e , the ground control center can only receive the resource status data after a certain awareness latency T d S i , with the current time being t l =   t e + T d S i . At the current moment, the onboard resources may have already changed, meaning that the awareness data received at the ground control center do not represent the real-time resource status of the node, but rather awareness latency data. The actual resource status on the satellite may fall into one of the following situations. (1) With no new services arriving, the resources occupied by previous services on the satellite remain unreleased. The state of onboard resources unchanged, and the awareness latency data are equivalent to the quantity of onboard resources. (2) With no new services or fewer services arriving, the resources occupied by previous services are significantly released, resulting in an increase in available onboard resources. The quantity of awareness latency data is smaller than the quantity of onboard resources. (3) With the arrival of new services, the resources occupied by previous services have yet to be released, and the quantity of onboard resources is smaller than the awareness latency data. (4) With the arrival of new services, the resources occupied by previous services are released and the onboard resources may not change, or they may be greater or less than that of the awareness latency data.
As shown in Figure 2, both the awareness latency data received on the ground and the resource status prediction results exhibit poor accuracy and timeliness. To address the above problem, a dynamic compensation model based on awareness data and prediction results is proposed. The model dynamically compensates for awareness latency data based on the prediction results and dynamically adjusts the compensation weights for each node according to the awareness latency and prediction accuracy, ensuring that the authenticity and accuracy of the compensated data are closer to the actual onboard resource status.
Specifically, the LSTM-based prediction algorithm uses the awareness latency T d S i as the prediction step length, so the predicted result of node S i for the k -th type of resource status at time t is R ^ S i k t . The actual awareness data received by the ground control center at the current moment for node S i are R S i k ( t     τ ) , where τ is the awareness latency of the node, and τ = T d S i . The dynamic compensation model based on the awareness data and the predicted results is as follows:
R ~ S i k t = γ · R ^ S i k t + 1     γ · R S i k t     τ ,
where γ is the compensation weight, and γ     [ 0 ,   1 ] . Furthermore, the design of γ is based on the awareness latency and the accuracy of the prediction model, and its calculation formula is as follows:
γ = 1 1 + e β · [ ( τ τ 0 ) + μ k · ( 1 δ k ( t ) ) ] ,
where τ is the awareness latency, τ 0 is the awareness latency threshold, β is the latency coefficient, and μ k is the resource type weight. δ k ( t ) is the prediction error of the k -th resource. The impact analysis of each parameter is as follows:
(1)
γ is the weight of the awareness latency data and the prediction results in the compensation process. When γ is large, the credibility of the current awareness data is high, and its weight is relatively large. When γ is small, the prediction results account for a larger proportion in the compensation process, thereby dynamically adjusting the ratio of awareness latency data and prediction results.
(2)
β controls the speed of the change in γ weight, representing the sensitivity to changes in awareness latency and prediction error during the compensation process. When β is large, if τ   -   τ 0 + μ k · δ k t   >   0 , then γ = 1 . If τ   -   τ 0 +   μ k · δ k t   <   0 , then γ = 0 . If τ   -   τ 0 + μ k · δ k t = 0 , then γ     0.5 , and at this point, the weights of awareness latency data and prediction results are the same, independent of the parameters.
(3)
τ 0 is the awareness latency threshold. When τ 0 increases, it enhances the tolerance of the compensation data to latency, meaning that at this time, there is a greater reliance on prediction data. When τ 0 is small, it is more sensitive to awareness latency and relies more on awareness latency data.
(4)
μ k is used to adjust the impact of prediction errors on weights, as there are differences in prediction accuracy when using LSTM models for different types of resources on the satellite. Therefore, if the current resource prediction results are unreliable, the value of μ k can be increased to ensure that the impact of awareness delays is more significant during the weight update process. When μ k is small, it reduces the impact of prediction errors on γ , making the compensation process more reliant on adjusting weights based on latency differences.
(5)
δ k ( t ) is the prediction error for different resource types. When δ k ( t ) is large, the compensation process relies more on awareness latency data. When δ k ( t ) is small, its corrective effect on γ is stronger, and the reliability of the prediction results during the compensation process is higher.
The above compensation model complies with the characteristics of LEO satellite networks. The awareness latency of the node is higher for satellites that are relatively far from the gateway station in the network, and the reliability of the awareness latency data decreases significantly with the increase in latency. At this point, compensation for the awareness latency data can be performed based on the predicted results of the node’s re-sources. The awareness latency is small in the case of satellites in the network that are relatively close to the gateway station. The real-time performance of the awareness data at this time is better, and the error between the actual onboard resource status and the awareness data is smaller, which means the compensation weight of the awareness data is larger. For instance, when the resource state undergoes a sudden peak shift due to services, resulting in a significant prediction error, the accuracy of the awareness data be-comes more pronounced. Consequently, the proportion of awareness data dynamically increases.
There are also differences in the speed and magnitude of changes in the onboard bandwidth, computation, and storage resources in the same node, leading to variation in the prediction accuracy of the LSTM algorithm for three types of resources. Regarding re-source types exhibiting poor prediction accuracy, the impact of prediction results on compensation data can be mitigated through the application of Equation (18). For example, in the scenario where the resource state changes abruptly, the prediction result error is relatively large. Although there is a delay in the awareness data, the error may be relatively small. Therefore, the impact of the awareness data can be improved by adjusting the compensation weight. The compensation effect of the prediction results on data is strengthened for resource types with better prediction results. For instance, the compensation weight of the prediction results can be elevated to bolster the compensating impact of pre-diction results on the data in scenarios with significant delays and substantial awareness data error.

5. Dynamic Network Resource Allocation Algorithm Based on Accelerated ADMM

5.1. LEO Satellite Network Resource Allocation Modeling

After compensation based on Equation (17), the remaining resources of node S i at time t are R ~ S i t = [ B ~ S i t ,   C ~ S i t ,   S ~ S i t ] . In the network, there are periodic services denoted as F per , high-bandwidth services denoted as F b a n d , and computing–storage services denoted as F c - s , with their respective priority weights being { ω Z ,   ω B ,   ω C } . The total resource demands are set as { R Z , R B , R C } for each service, with the corresponding coefficient matrices for bandwidth, computing, and storage resource consumption for each type of service being:
α z β z γ z α b β b γ b α c β c γ c ,
where α i is the bandwidth resource consumption coefficient, β i is the calculation resource consumption coefficient, and γ i is the storage resource consumption coefficient.
The issue of network resource allocation is addressed by maximizing the service re-source coverage ratio (SRCR) in order to maximize fulfillment of resource requirements among various services and enhance the utilization rate of network resources across the entire network. This ensures the highest number of service requests in the network, thereby guaranteeing resource utilization and enhancing network service performance. Considering the limited resources on the satellite and the complex spatial and temporal characteristics of the distribution, maximizing the SRCR can improve the robustness of resource utilization, avoid the reduction in service capacity in other regions due to excessive resource reservation, and ensure the critical coverage of high-priority services. The quantity of resources assigned to each of the three types of services by node S i is { x S i z , x S i b , x S i c } . The optimization objective is to maximize the SRCR, and the optimization objective function is as follows:
max ε SRCR = i = 1 N ω Z · x S i z R Z + ω B · x S i b R B + ω C · x S i c R C
  s . t .   C 1 :   α z · x S i z + α b · x S i b     B ~ S i t ,   i N   C 2 :   β z · x S i z + β c · x S i c     C ~ S i t ,   i N   C 3 :   γ b · x S i b + γ c · x S i c     S ~ S i t ,   i N C 4 :   i = 1 N x S i z     R Z C 5 :   i = 1 N x S i b     R B C 6 :   i = 1 N x S i c     R C ,
where C1 to C3 represent node resource constraints, signifying the individual resource capacity limits of each node. Specifically, the aggregate resources allocated by each node to various services must not surpass its current resource surplus, with bandwidth, computing, and storage resources all subject to these constraints. C4 to C6, on the other hand, represent the resource demand constraints of the entire network, establishing upper limits for the allocation of three types of services across the network to prevent resource wastage or over-allocation.

5.2. Dynamic Solution Algorithm Based on Accelerated ADMM

The optimization model is a multi-objective joint optimization problem. In this section, the ADMM algorithm is introduced to solve the model. The ADMM is an efficient algorithm tailored for large-scale distributed optimization scenarios. It integrates the parallel design of dual decomposition with the rapid convergence properties of the augmented Lagrange method, breaking down complex global optimization problems into multiple simpler sub-problems for resolution. The sub-problems are considerably easier to solve than a joint solution. Efficient global convergence is achieved through alternating optimization and multiplier updates. The ADMM algorithm has the characteristics of rapid convergence in distributed computing, high compatibility under complex constraint conditions, robust parameter performance, and excellent scalability.
In the resource allocation scenario, the algorithm introduces global auxiliary variables h z = i = 1 N x S i z , h b = i = 1 N x S i b , h c = i = 1 N x S i c , and h i ,   i F x , representing the resources allocated by the current node to three types of services. The augmented Lagrange function in the ADMM algorithm is as follows:
min   L ρ = ε SRCR + j z , b , c λ j h j x S i j + ρ 2 h j x S i j 2 = i = 1 N ω Z x S i z R Z + ω B x S i b R B + ω C x S i c R C + j z , b , c λ j h j x S i j + ρ 2 h j x S i j 2 ,
where λ j represents the Lagrange multiplier, which is employed to dynamically facilitate the satisfaction of constraints during the optimization process and is constantly updated. ρ denotes the penalty parameter, which is utilized to expedite the algorithm’s compliance with conditional constraints.
The traditional ADMM algorithm initializes the local variables { x S i z ,   x S i b ,   x S i c } , global variables { h z ,   h b ,   h c } , and Lagrange multipliers { λ z ,   λ b ,   λ c } to zero or randomly, then proceeds through multiple iterations until convergence is achieved. However, initiating each variable’s value at 0 and gradually updating it can not only prolong the convergence time but also introduce oscillations in the local variable update process, subsequently impacting the multiplier update process and compromising accuracy.
To address the aforementioned issues, this section introduces a dynamic initialization approach for local and global variables in the ADMM algorithm that utilizes resource compensation data. The aim of this approach is to expedite the convergence speed of the algorithm and enhance its computational capabilities within large-scale satellite networks. The formula for determining the maximum service capacity of a node is presented as follows:
p S i j = min B ~ S i t α j , C ~ S i t β j , S ~ S i t γ j , j z , b , c ,
where each component represents the actual service capacity of node S i for a specific type of service, and selecting the minimum value refers to opting for the service capacity with the lowest capacity among the various service types corresponding to the remaining resources. Therefore, the initialization process for local variables can be optimized as follows:
x S i j 0 = p S i j i = 1 N p S i j · R j ,   j z , b , c .
Then, the global variable can be initialized as follows:
h j 0 = min i = 1 N x S i j 0 , R j ,   j z , b , c ,
where i = 1 N x S i j 0 is the resource constraint of the nodes, and R j refers to the service requirements of the whole network. The Lagrange multiplier reflects the relationship between local and global variables and is therefore updated with reference to the initial bias between these variables:
λ j 0 = ρ · i = 1 N x S i j 0 h j 0 N .
Its practical significance lies in the fact that when λ j 0   >   0 , the local allocation decreases during the iterative process, whereas when λ j 0   <   0 , it will increase. The specific algorithm flow is shown in Algorithm 2.
Algorithm 2: Dynamic solution algorithm based on accelerated ADMM
Input: Compensation data R ~ S i t ; Network services F x ; The total resource demands for each service type, { R Z , R B , R C } ;
1  for j  1 to  N  do
2   Calculate the maximum service capacity according to Equation (22);
3   Initialize local and global variables according to Equations (23) and (24);
4   Initialize the Lagrange multiplier according to Equation (25);
5  end
6  for j  1 to  N  do (parallel execution)
7  Update the first variable x S i z ( k ) , with fixed x S i b ( k ) ,   x S i c ( k ) and λ j ( k ) ;
8  Update the first variable x S i b ( k ) , with fixed x S i z ( k ) ,   x S i c ( k ) and λ j ( k ) ;
9  Update the first variable x S i c ( k ) , with fixed x S i z ( k ) ,   x S i b ( k ) and λ j ( k ) ;
10   Update λ j ( k ) ;
11   Until the constraint conditions are met and the result converges;
12   end
Output: The optimal allocation scheme { x S i z , x S i b , x S i c } .

6. Simulation Results and Analysis

This paper evaluates the proposed NRA-PPJC method through numerical simulations. A LEO satellite network consisting of 293 nodes is simulated, comprising both polar and inclined orbits. The inclined orbit has an altitude of 550 km and an inclination angle of 50°, with a total of 19 orbital planes, each containing 11 satellites. The polar orbit has an altitude of 560 km and an inclination angle of 86.5°, with a total of 6 orbital planes, each containing 14 satellites. The arrival processes of periodic services, high-bandwidth services, and computing–storage services are simulated in the network. Then, dataset construction and preprocessing of node resource awareness data are also conducted.
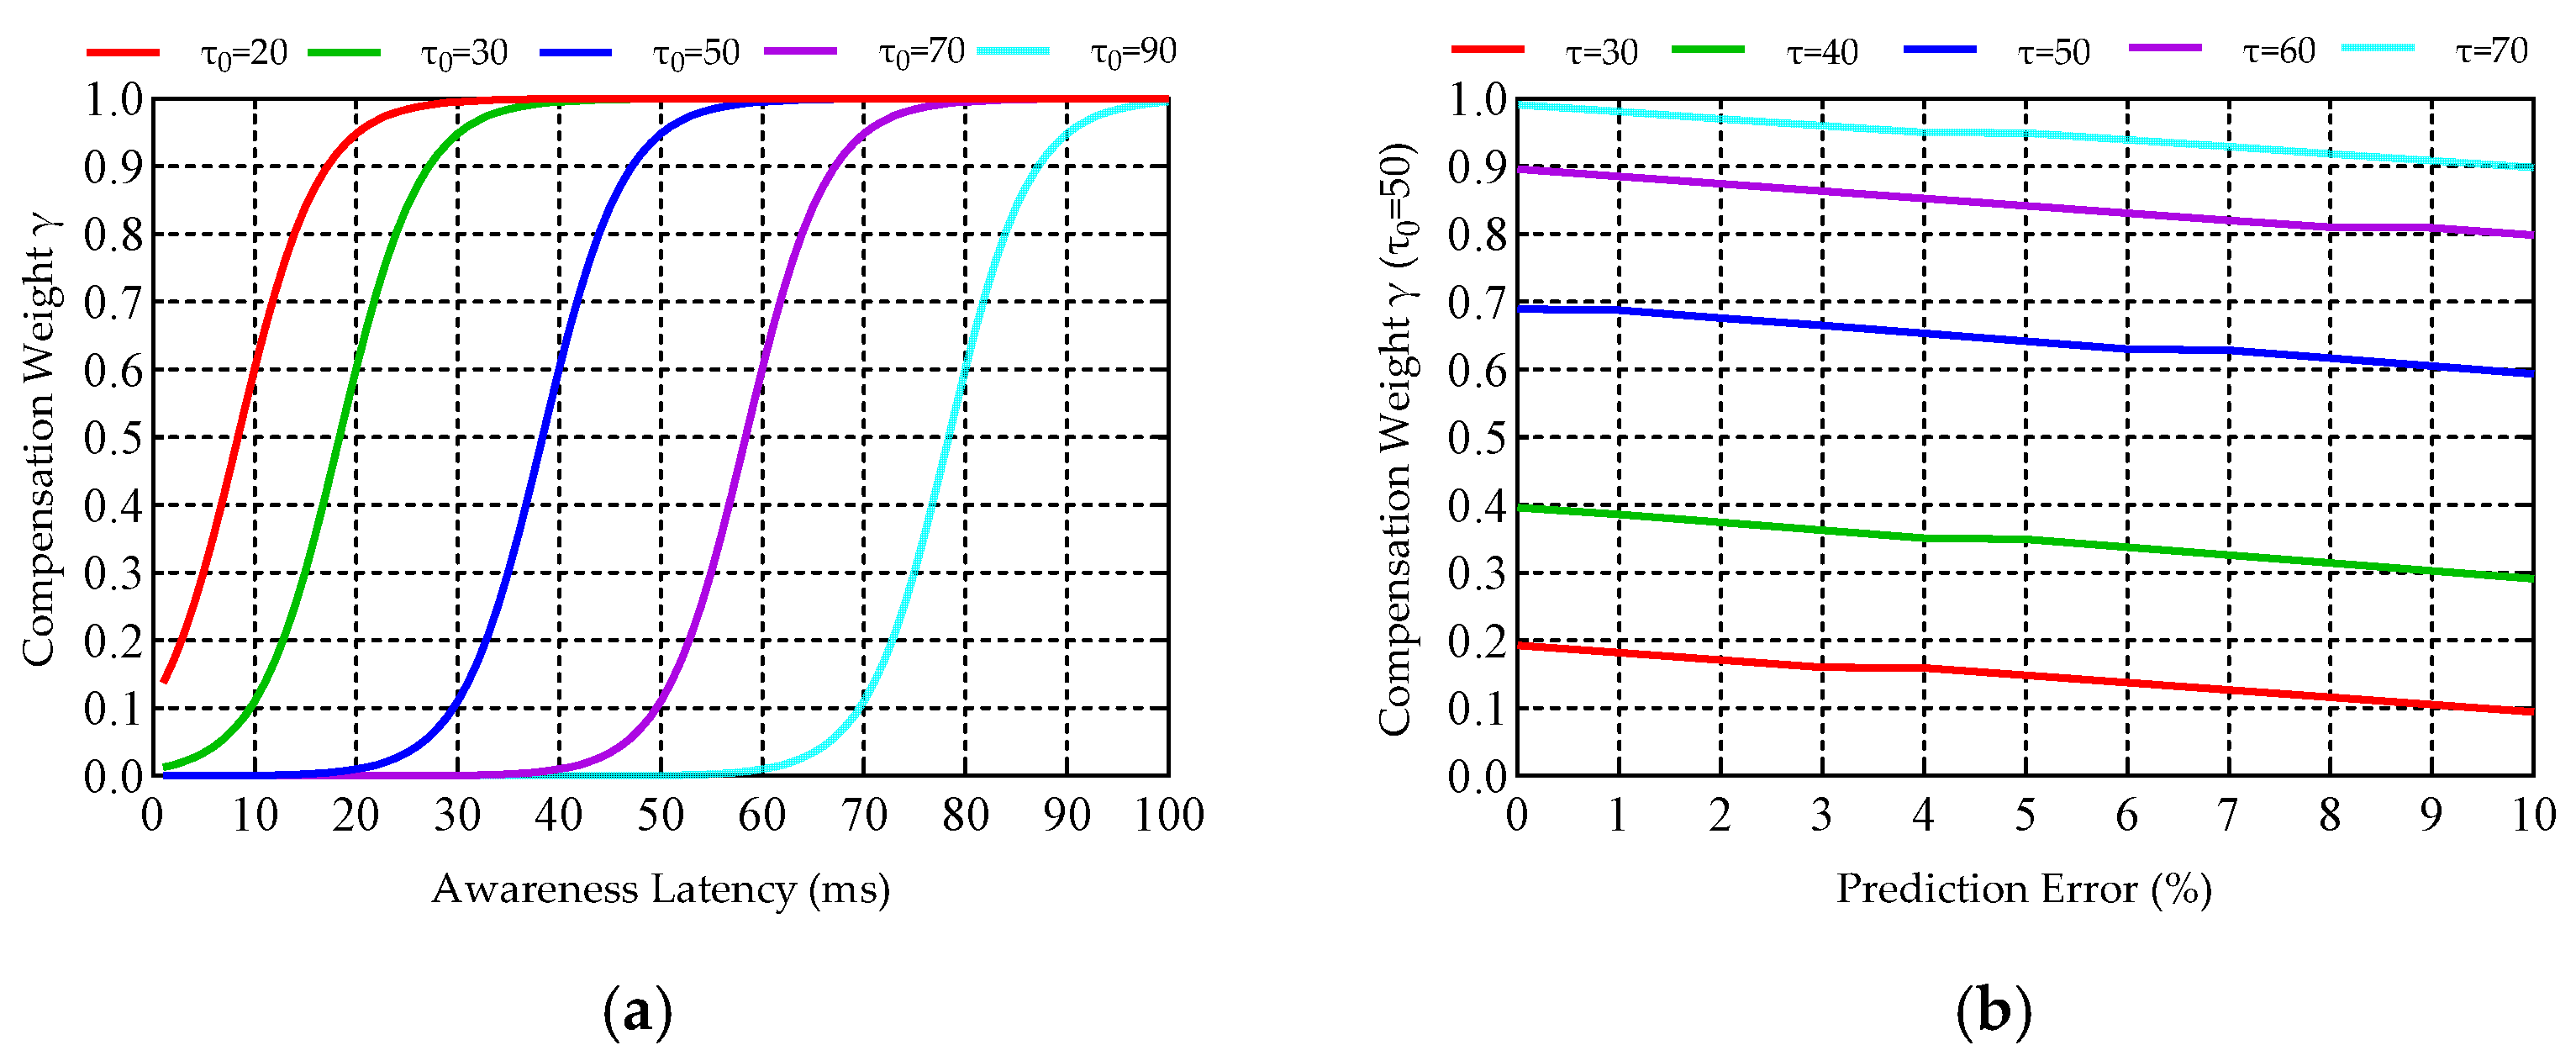
Figure 3 presents a comparison of the robustness evaluation of the awareness–prediction joint compensation method. Figure 3a demonstrates the influence of awareness latency on compensation weights across different awareness latency threshold benchmarks. The prediction error of node resources is fixed at 5%, which is based on the average value of the relative prediction error of node resources in the whole network. It can be seen from the figure that as the awareness latency threshold is set lower, the compensation weight converges to 1 within a shorter awareness latency. This implies that when the awareness latency threshold is small, a smaller awareness latency results in a larger proportion of awareness latency data in the compensation data, and as the awareness latency increases, the proportion of prediction results will also rise.
Figure 3b illustrates the variation in compensation weights in relation to prediction accuracy across different awareness latencies. Since the prediction accuracy of various resource types falls within 10%, the compensation weight will decrease as the prediction error rises, meaning that the proportion of prediction results in the compensation process will decrease accordingly. Moreover, for a fixed awareness latency threshold, the compensation weight increases rapidly as the latency increases, thereby increasing the proportion of prediction results in the compensation process. In summary, the proposed method allows for the adjustment of compensation weights based on prediction accuracy, and it can further undergo dynamic optimization in response to latency, enhancing the robustness of the method in scenarios characterized by high dynamics and varying prediction accuracies.
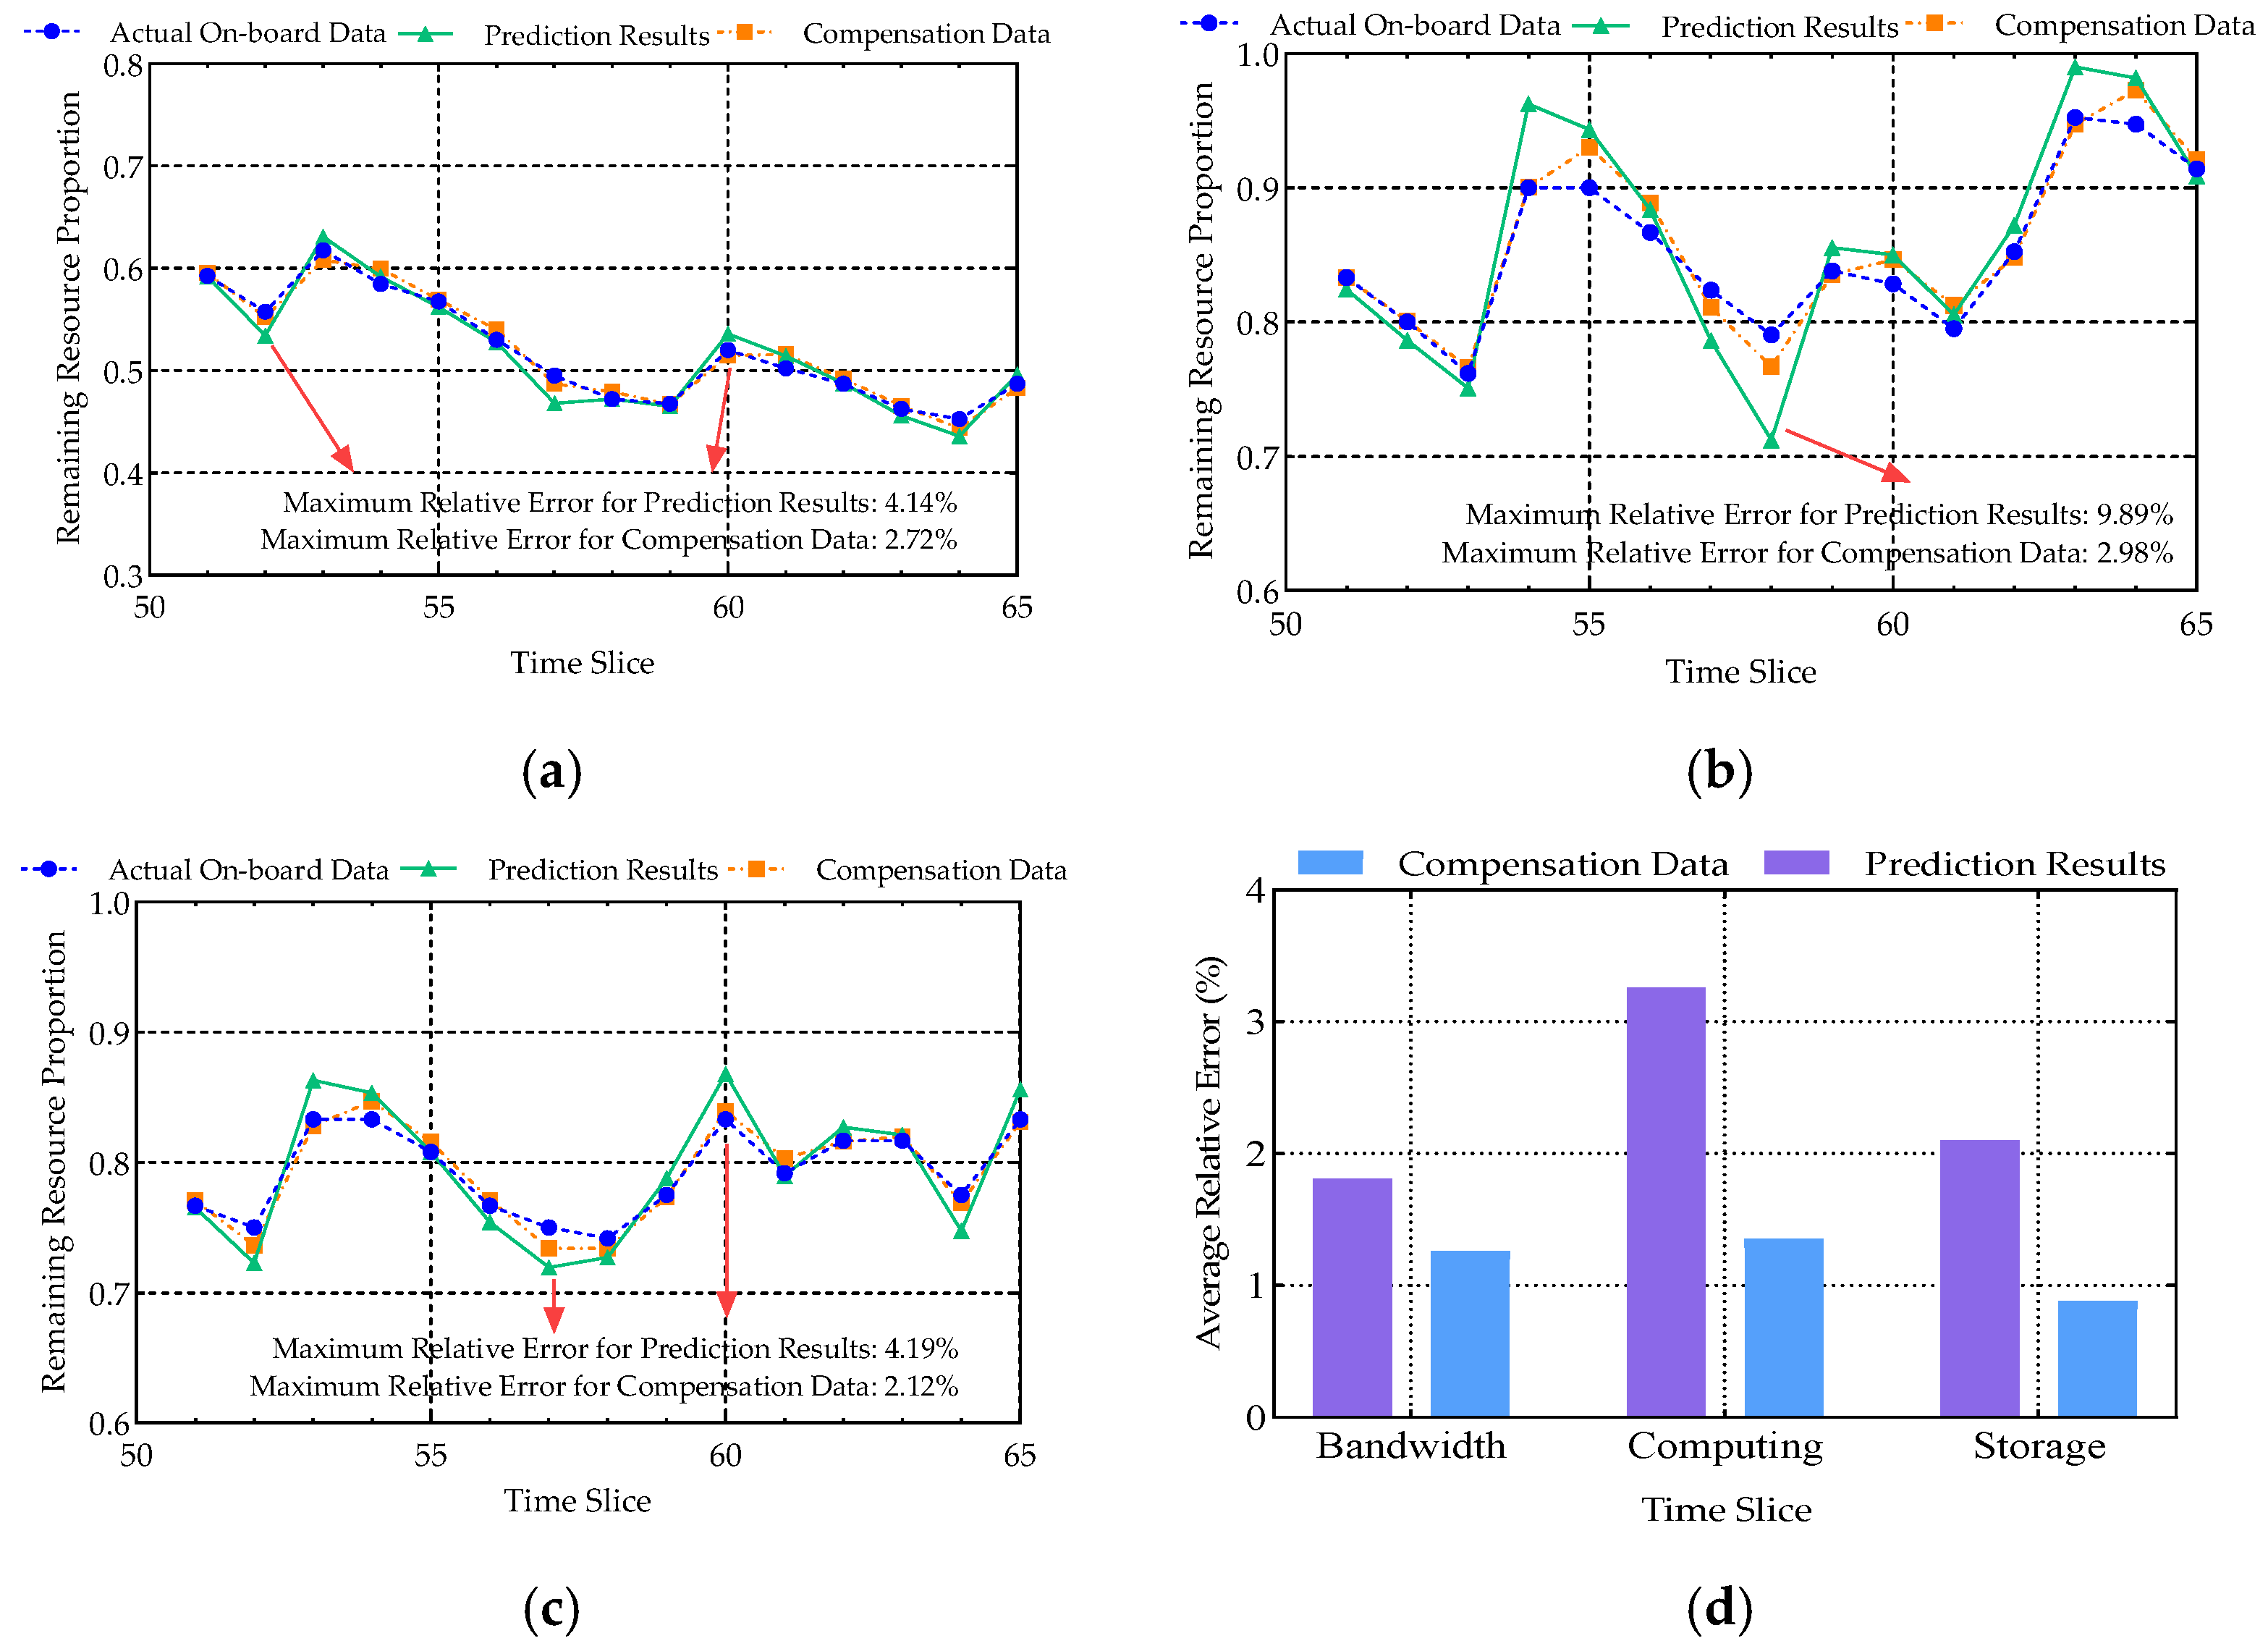
Figure 4 shows comparisons of the compensation data, prediction results, and the awareness data, representing the actual status of onboard resources. Figure 4a shows the comparison for bandwidth resources. It can be seen from the figure that although the bandwidth resources are heavily utilized, the usage of high-bandwidth services is continuous. Therefore, the trend of change is relatively smooth over time. The prediction results based on the LSTM algorithm are close to the actual resource status, with a small error. After the compensation based on the prediction results, the compensation data can fit the actual results. The maximum relative error between prediction results and actual onboard state data is 4.14%, and the error of the compensation data is 2.72%, demonstrating the accuracy and reliability of the proposed algorithm.
Figure 4b shows the comparison for computing resources. It can be seen from the figure that although the resource utilization is relatively low, the speed of resource occupation and release is rapid due to the characteristics of the services. This leads to significant fluctuations in resource trends, which in turn reduces the prediction accuracy. The compensation data fit well with the awareness data. However, the compensation results can reduce some of the prediction errors for the rapidly changing peak areas. The maxi-mum relative error between prediction results and actual onboard state data is 9.89%, and the error of the compensation data is 2.98%, effectively addressing the issue of poor prediction accuracy in dynamic environments.
Figure 4c shows the comparison for storage resources. It can be seen from the figure that the utilization is relatively low. However, the frequency of resource occupation and release is higher than that of computing resources, resulting in many spikes, which also affects the prediction accuracy. The maximum relative error between prediction results and actual onboard state data is 4.19%. This indicates that although spikes can affect ac-curacy, the inherent characteristics of resource occupation and release still allow for better prediction performance than scenarios with rapid fluctuations in computing resources. The compensation data fit well with the awareness data. The maximum relative error be-tween compensation data and actual onboard state data is 2.12%, which effectively enhances the fitting accuracy and improves data reliability.
Figure 4d demonstrates the average relative errors between the prediction results and the actual onboard data as well as the average relative errors of the compensation data. From the graph, it can be seen that the relative errors of the compensation data are consistently smaller than those of the prediction results, suggesting that the compensation model can significantly enhance the accuracy of the data.
To further evaluate the effectiveness of the proposed method, actual awareness data are introduced for testing. Due to the limited availability of open-source satellite network data, a LEO satellite network consisting of 293 satellites was established based on existing systems using container technology. Programmable switches were employed to measure the transmission port rate (TPR) and reception port rate (RPR) per second of device ports in both non-service and high-bandwidth service scenarios, thereby showcasing the actual bandwidth capabilities of the nodes. Especially when there is no traffic passing through, due to the presence of awareness packets or other signals in the network, the node port rate remains small but is not zero.
Figure 5 illustrates the comparison among the actual awareness data, prediction results, and compensation data. The background flow, acting as noise, exhibits a high degree of randomness and is characterized by frequent and significant changes. Regarding the issue of frequent changes, prediction algorithms may produce deteriorated prediction results at peak points, and their prediction performance may be reduced compared to simulated awareness data. This is exemplified in the 57th time slot in Figure 5a, where the error between the predicted result and the actual awareness data is approximately 22.7%. However, after joint compensation, the error between the compensated data and the actual awareness data drops to only 6.8%. For problems involving significant changes, the prediction method will produce significant errors. For instance, in the 57th time slice depicted in Figure 5b, the prediction method exhibits a relative error of 14.5%, whereas the compensated data demonstrates a relative prediction error of only 5.7%. The above analysis indicates that for actual awareness data, prediction algorithms cannot maintain the high prediction accuracy during simulation due to the volatility and randomness inherent in the data. Nevertheless, the joint compensation algorithm presented in this paper has the potential to enhance the accuracy and reliability of the data.
From the Figure 5c,d, it can be seen that the actual awareness data are similar to the simulation results in this article in terms of overall trend. However, spikes are observed at certain time points, indicating sudden increases or decreases in rate. This is due to the protocol acceleration of actual switch hardware or differences in switch output queue management strategies, leading to more complex characteristics of actual awareness data and consequently affecting the corresponding prediction performance. From Figure 5c, the prediction results based on actual measurement data have a large error in the 55th time slot. The relative error of the prediction method is 21.6%, while the relative error of the compensation method is 9.3%, indicating a significant improvement in data accuracy. From Figure 5d, it can be seen that for the time period of 60 to 65, when there is significant fluctuation in the data, the predicted results for the resource situation at the node are opposite to the actual data. However, the compensation method, by comprehensively considering the perception latency data and the predicted results, can not only reduce relative errors but also retain the trend of resource data changes, further improving the reliability of the data and providing support for subsequent resource allocation.
Figure 6 presents a comparison of the SRCR for various datasets following network resource allocation utilizing the accelerated ADMM algorithm. It can be seen from the figure that when the number of service requests is less than 80, the SRCR is 100% in all data scenarios; that is, the service resource requirements in the network can be met at this time. The resource allocation approach, which relies on awareness data, suffers from the inherent latency, resulting in outdated resource status information for certain nodes and consequently rendering some services unable to fulfill their resource coverage needs. Based on the predicted results, the SRCR effect is weaker than that of the compensation data. Due to significant fluctuations in prediction accuracy, the corresponding SRCR also experiences fluctuations, resulting in poor stability of allocation performance. The SRCR based on compensation data aligns closely with the actual onboard data, accurately reflecting node status and capacity and demonstrating an effective SRCR. When the number of service requests reaches 200, the SCRC based on compensation data deviates from the actual onboard data by just 10.2%, representing a 15.8% improvement over the predicted data and a 62% enhancement compared to the awareness data with latency. Consequently, the resource allocation method using compensation data can significantly enhance the efficiency of network resource utilization.
Figure 7 presents a comparison of the SRCR among the proposed NRA-PPJC algorithm and two other algorithms in various service scenarios. The HEAA algorithm [27] is a historical experience average method which uses each node to allocate corresponding resources for services on an average basis according to historical experience. PBRA is a priority-based network resource allocation method [28] which gives precedence to the re-source requirements of high-priority services. It can be seen from the figure that the SRCR of the NRA-PPJC method proposed in this paper is higher than that of the HEAA algorithm because HEAA does not take into account the differences in resource requirements between services, and the average division of resources for each service leads to wasted resources when the number of service requests increases. The PBRA algorithm allocates resources for high-priority services, so when the number of service requests is small, its SRCR is higher than that of the NRA-PPJC algorithm. As the number of service requests grows, despite some nodes having surplus resources, they can no longer fulfill the requirements of additional service demands. The SRCR consequently declines rapidly and may even fall below that of the HEAA algorithm once a specific service threshold is reached. Taking a number of services of 160 as an example, the network experiences a moderate demand pressure for service resources. In comparison to HEAA, the SRCR of NRA-PPJC has an improvement of 20.4% and a 4.17% increase when compared to the PBRA, which means it can effectively allocate based on business resource requirements and onboard resource status.
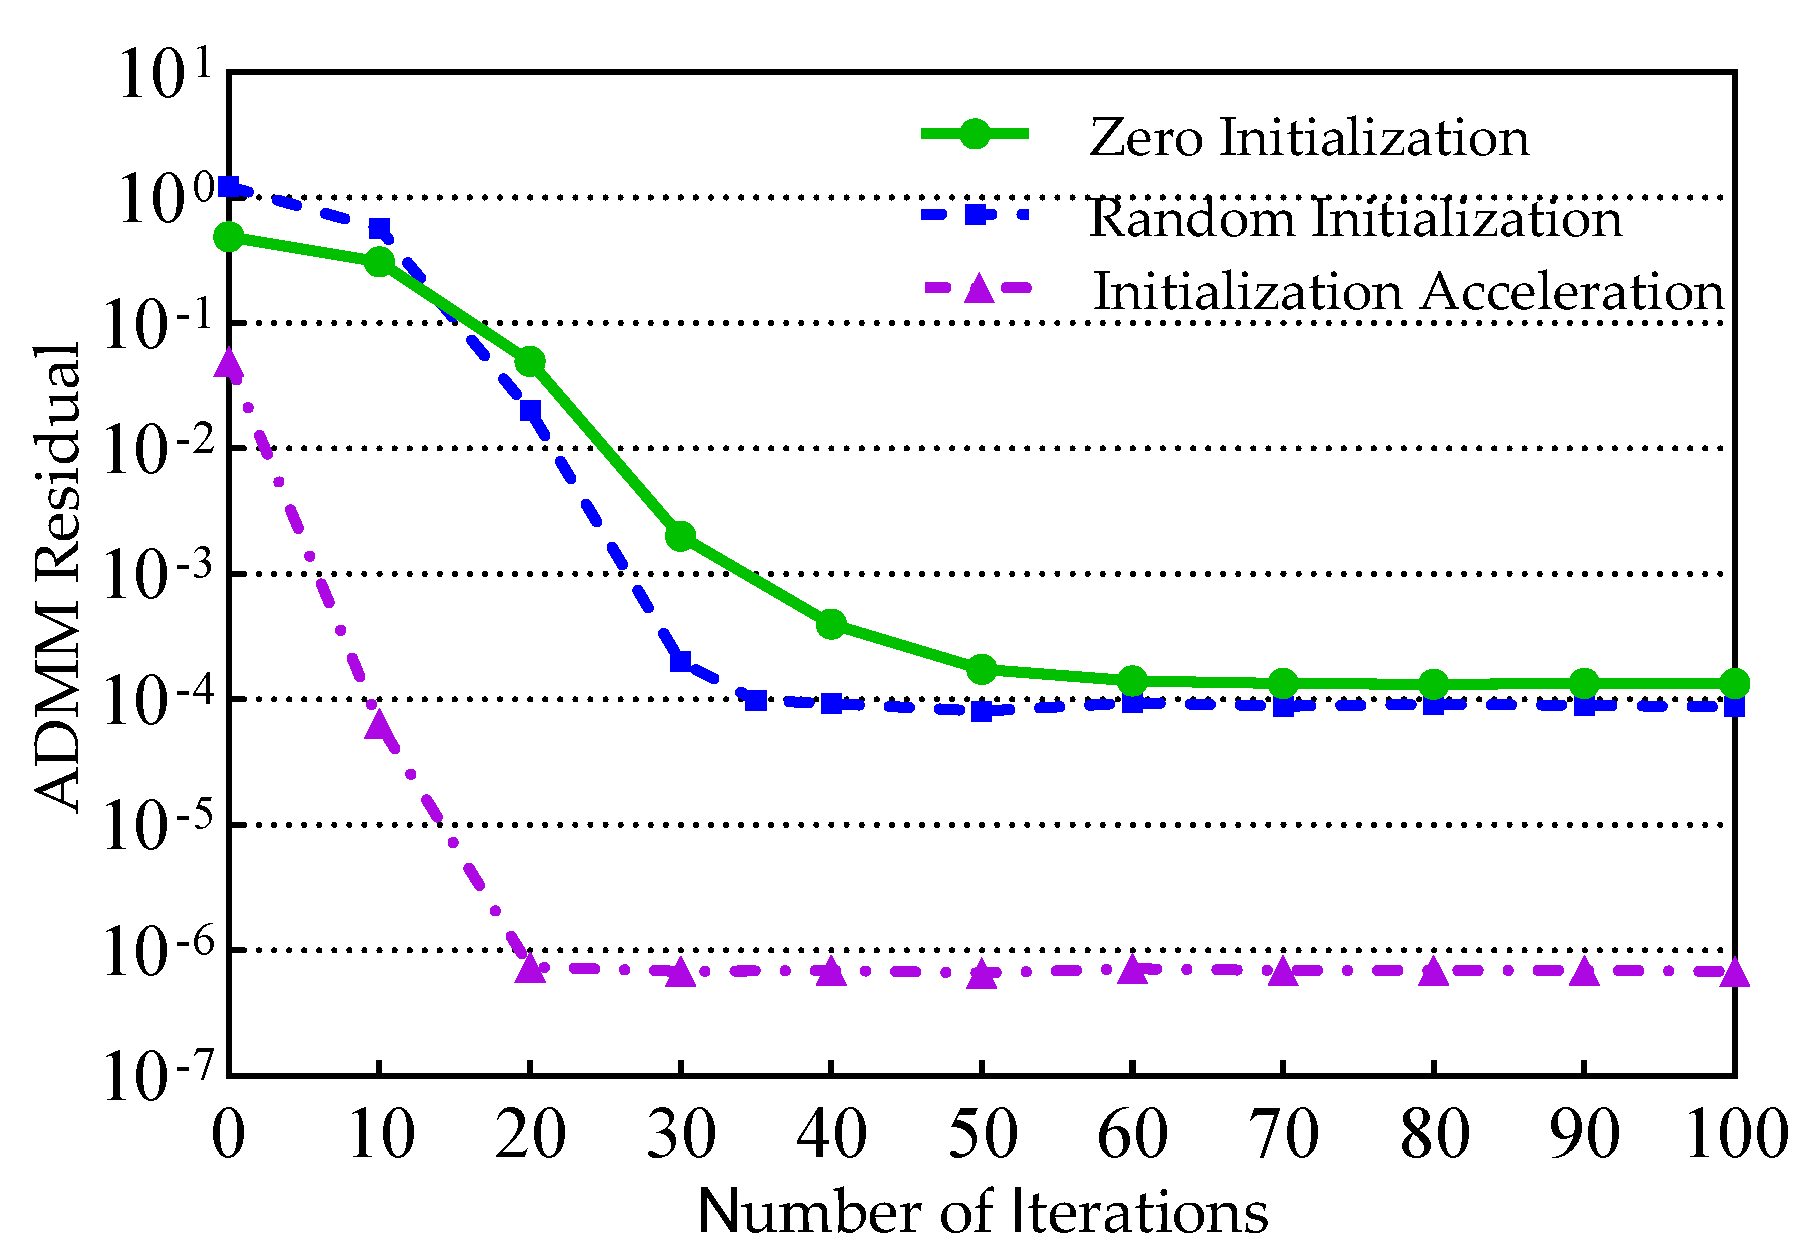
Figure 8 shows the comparison of convergence speed of the proposed ADMM algorithm with other common initialization scenarios. From the graph, it can be seen that both zero initialization and random initialization [29] have residual values greater than those based on the compensation data. Moreover, since the initialization method may initially align local and global variables closer to a local optimal solution, its convergence speed tends to be faster than that of the zero-initialization approach. The dynamic initialization approach proposed in this paper, which is based on compensated data, facilitates the rapid update of local variables, subsequently expediting the convergence of global variables. When compared to the zero-initialization method, this approach enhances convergence speed by 60%, and when compared to the random initialization method, it improves by 41%.

7. Conclusions

A network resource allocation method based on awareness–prediction joint compensation was proposed to address the problem of the low reliability of network resource allocation caused by the poor timeliness of network resource awareness and accuracy of resource status prediction in LEO satellite networks. This method utilizes INT to perceive the status of satellite network resources, taking the awareness latency as the prediction step. The node network resource status prediction model is based on an LSTM. A dynamic compensation model was proposed, which dynamically compensates for prediction results using awareness data based on awareness latency and resource prediction accuracy. Based on compensation data, an accelerated ADMM resource allocation method was proposed to improve the convergence speed of the algorithm and achieve flexible resource allocation. The simulation results demonstrate that the method can minimize the discrepancy between compensation data and the actual onboard resource status, enhance the timeliness and accuracy of the data, and thereby facilitate efficient and reliable network resource allocation.
Further, the method presented in this paper emphasizes the awareness and prediction of resource status on satellites, as well as resource allocation for differentiated services across the entire network. However, considering the dynamics and complexity of constellation topology, we will continue to explore flexible resource allocation method for local areas based on the method in this paper in subsequent research, further improving the practicability and scalability of the algorithm.

Author Contributions

Conceptualization, H.D. and T.D.; methodology, H.D.; software, H.D. and S.W.; validation, H.D. and Z.L.; formal analysis, T.D.; investigation, T.D.; resources, S.W.; data curation, D.Z.; writing—original draft preparation, H.D.; writing—review and editing, Q.Z. and D.Z.; visualization, H.D.; supervision, T.D.; project administration, T.D.; funding acquisition, T.D. All authors have read and agreed to the published version of the manuscript.

Funding

This work was funded in part by the National Natural Science Foundation of China (62331027), and in part by the Young Elite Scientists Sponsorship Program by CAST (2022QNRC001).

Institutional Review Board Statement

Not applicable.

Informed Consent Statement

Not applicable.

Data Availability Statement

The data that support the findings of this study are available from the corresponding author upon reasonable request.

Conflicts of Interest

All authors were employed by the company Space Star Technology Co., Ltd. The authors declare that the research was conducted in the absence of any commercial or financial relationships that could be construed as a potential conflict of interest.

References

  1. Liu, J.J.; Shi, Y.P.; Fadlullah, Z.M. Space-air-ground Integrated network: A survey. IEEE Commun. Surv. Tutor. 2018, 20, 2714–2741. [Google Scholar] [CrossRef]
  2. Vaezi, M.; Azari, A.; Khosravirad, S.R. Cellular, wide-area, and non-terrestrial IoT: A survey on 5G advances and the road toward 6G. IEEE Commun. Surv. Tutor. 2022, 24, 1117–1174. [Google Scholar] [CrossRef]
  3. Mekki, M.; Arora, S.; Ksentini, A. A scalable monitoring framework for network slicing in 5G and beyond mobile networks. IEEE Trans. Netw. Serv. 2021, 19, 413–423. [Google Scholar] [CrossRef]
  4. Mizrahi, T.; Navon, G.; Fioccola, G. AM-PM: Efficient network telemetry using alternate marking. IEEE Netw. 2019, 33, 155–161. [Google Scholar] [CrossRef]
  5. Tang, S.F.; Li, D.Y.; Niu, B. A runtime-programmable selective in-band network telemetry system. IEEE Trans. Netw. Serv. Manag. 2020, 33, 708–721. [Google Scholar] [CrossRef]
  6. Zeng, G.M.; Zhan, Y.F.; Xie, H.R.; Jiang, C.X. Resource allocation for networked telemetry system of mega LEO satellite constellations. IEEE Trans. Commun. 2022, 70, 8215–8228. [Google Scholar] [CrossRef]
  7. Zhang, X.T.; Tao, Y.; Zhang, Q. Satellite local node state awareness and adaptive forwarding routing algorithm. In Proceedings of the International Conference on Optical Communications and Networks (ICOCN), Qufu, China, 23–27 August 2021. [Google Scholar]
  8. Zeng, G.M.; Zhan, Y.F.; Xie, H.R. Channel allocation for mega LEO satellite constellations in the MEO–LEO networked telemetry system. IEEE Internet Things J. 2023, 10, 2545–2556. [Google Scholar] [CrossRef]
  9. Kawamoto, Y.; Takahashi, M.; Verma, S. Traffic-prediction-based dynamic resource control strategy in HAPS-Mounted MEC-assisted satellite communication systems. IEEE Internet Things J. 2024, 11, 13824–13836. [Google Scholar] [CrossRef]
  10. Han, C.; Liu, A.J.; Huo, L.Y. A prediction-based resource matching scheme for rentable LEO satellite communication network. IEEE Commun. Lett. 2020, 24, 414–417. [Google Scholar] [CrossRef]
  11. Cai, J.Y.; Song, S.T.; Zhang, H.P. Satellite network traffic prediction based on LSTM and GAN. In Proceedings of the International Conference on Information Technology, Big Data and Artificial Intelligence (ICIBA), Chongqing, China, 26–28 July 2023. [Google Scholar]
  12. Cong, L.G.; Shi, B.Y.; Di, X.Q. Research on satellite network traffic prediction algorithm based on gray wolf algorithm optimizing GRU and spatiotemporal analysis. In Proceedings of the International Conference on Communication Software and Networks (ICCSN), Shenyang, China, 21–23 July 2023. [Google Scholar]
  13. Tamada, K.; Kawamoto, Y.C.; Kato, N. Bandwidth usage reduction by traffic prediction using transfer learning in satellite communication systems. IEEE Trans. Veh. Technol. 2024, 73, 7459–7463. [Google Scholar] [CrossRef]
  14. Tsegaye, H.B.; Tshakwanda, P.M.; Worku, Y.M. LSTM-based resource prediction for disaggregated RAN in 5G non-terrestrial networks. In Proceedings of the IEEE Virtual Conference on Communications (VCC), New York, NY, USA, 3–5 December 2024. [Google Scholar]
  15. Tang, J.; Li, J.; Zhang, L. Opportunistic Content-Aware Routing in Satellite-Terrestrial Integrated Networks. IEEE Trans. Mob. Comput. 2024, 23, 10460–10474. [Google Scholar] [CrossRef]
  16. Maity, I.; Giambene, G.; Vu, T. Traffic-Aware Resource Management in SDN/NFV-Based Satellite Networks for Remote and Urban Areas. IEEE Trans. Veh. Technol. 2024, 73, 17400–17415. [Google Scholar] [CrossRef]
  17. Guo, J.M.; Yang, L.; Rincon, D. Static placement and dynamic assignment of SDN controllers in LEO satellite networks. IEEE Trans. Netw. Serv. Manag. 2022, 19, 4975–4988. [Google Scholar] [CrossRef]
  18. Bo, L.; Deng, X.H.; Chen, X.C. MEC-Based Dynamic Controller Placement in SD-IoV: A Deep Reinforcement Learning Approach. IEEE Trans. Veh. Technol. 2022, 71, 10044–10058. [Google Scholar]
  19. Su, Z.; Deng, Q.; Hao, J. A study on the collision probability of satellite-based ADS-B messages based on homogeneous Poisson process. Int. J. Aeronaut. Space Sci. 2022, 21, 845–857. [Google Scholar] [CrossRef]
  20. Tiwari, R.; Deshmukh, S. ML based velocity estimator via gamma distributed handover counts in HetNets. In Proceedings of the TENCON 2017—2017 IEEE Region 10 Conference, Penang, Malaysia, 5–8 November 2017. [Google Scholar]
  21. Liu, J.C.; Tao, Z.; Ma, J.J. SDN-based in-band network telemetry for low-orbit satellite networks. In Proceedings of the International Conference on Intelligent Computing and Wireless Optical Communications (ICWOC), Chongqing, China, 16–17 June 2023. [Google Scholar]
  22. Bosshart, P.; Daly, D.; Izzard, M. Programming protocol-independent packet processors. Acm Sigcomm Comput. Commun. Rev. 2013, 44, 87–95. [Google Scholar] [CrossRef]
  23. Hochreiter, S.; Schmidhuber, J. Long short-term memory. Neural Comput. 1997, 9, 1735–1780. [Google Scholar] [CrossRef]
  24. Bengio, Y.; Simard, P.; Frasconi, P. Learning long-term dependencies with gradient descent is difficult. IEEE Trans. Neural Netw. 1994, 5, 157–166. [Google Scholar] [CrossRef]
  25. Greff, K.; Srivastava, R.K.; Koutnik, J. LSTM: A search space odyssey. IEEE Trans. Neural Netw. Learn. Syst. 2016, 28, 2222–2232. [Google Scholar] [CrossRef]
  26. Lecun, Y.; Bengio, Y.; Hinton, G. Deep learning. Nature 2015, 521, 436–444. [Google Scholar] [CrossRef]
  27. Liu, Y.B.; Huo, L.J.; Zhang, X.T. A multi-objective resource pre-allocation scheme using SDN for intelligent transportation system. IEEE Trans. Intell. Transp. Syst. 2024, 25, 571–586. [Google Scholar] [CrossRef]
  28. Cui, Y.P.; Yang, X.S.; He, P. O-RAN slicing for multi-service resource allocation in vehicular networks. IEEE Trans. Veh. Technol. 2023, 73, 9272–9283. [Google Scholar] [CrossRef]
  29. Lu, C.; Feng, J.; Yan, S. A unified alternating direction method of multipliers by majorization minimization. IEEE Trans. Pattern Anal. Mach. Intell. 2017, 40, 527–541. [Google Scholar] [CrossRef] [PubMed]
Figure 1. LEO satellite network scenario.
Applsci 15 05665 g001
Figure 2. Scenario introduction of awareness–prediction joint compensation.
Applsci 15 05665 g002
Figure 3. Comparison of the robustness of the awareness–prediction joint compensation method. (a) Influence of awareness latency on γ ; (b) Influence of prediction error on γ .
Applsci 15 05665 g003
Figure 4. Comparison of the compensation model for the three types of resources. (a) Comparison for bandwidth resources; (b) Comparison for computing resources; (c) Comparison for storage resources; (d) Comparison of average relative error.
Applsci 15 05665 g004
Figure 5. The comparison of different methods under high-bandwidth service scenario. (a) TPR data of non-service; (b) RPR data of non-service; (c) TPR data of high-bandwidth service; (d) RPR data of high-bandwidth service.
Applsci 15 05665 g005
Figure 6. Comparison of SRCR for various datasets.
Applsci 15 05665 g006
Figure 7. Comparison of SRCR for different methods.
Applsci 15 05665 g007
Figure 8. Comparison of convergence speed of proposed ADMM algorithm.
Applsci 15 05665 g008
Disclaimer/Publisher’s Note: The statements, opinions and data contained in all publications are solely those of the individual author(s) and contributor(s) and not of MDPI and/or the editor(s). MDPI and/or the editor(s) disclaim responsibility for any injury to people or property resulting from any ideas, methods, instructions or products referred to in the content.

