Article

Numerical Simulation-Based Study on the Arching Effect in Subsequent Backfill

School of Resources and Safety Engineering, Central South University, Changsha 410083, China
*
Author to whom correspondence should be addressed.
Appl. Sci. 2025, 15(10), 5649; https://doi.org/10.3390/app15105649
Submission received: 3 April 2025 / Revised: 10 May 2025 / Accepted: 16 May 2025 / Published: 19 May 2025

Abstract

:
To explore the influence of the arching effect on stress distribution in jointed backfill structures, this study employs three-dimensional numerical modeling to systematically analyze the mechanical behavior of backfill materials. A finite-difference approach was adopted to establish a representative stope model incorporating interface elements to simulate rock–backfill interactions. The methodology involved parametric studies examining key material properties (internal friction angle, cohesion, elastic modulus, Poisson’s ratio) and geometric configurations, with boundary conditions derived from typical mining scenarios. The results demonstrate that stress distribution follows nonlinear relationships with all investigated parameters. Increasing the internal friction angle and the cohesion reduce internal stresses, though the arch effect exhibits a distinct upper limit. Mechanical properties significantly influence stress transfer characteristics, with the elastic modulus governing stiffness response and the Poisson’s ratio affecting lateral stress development. Geometric parameters control the spatial extent of arching, with larger dimensions modifying the stress redistribution pattern. This research quantitatively establishes the operational limits of arching in backfill structures, providing crucial thresholds to prevent stability risks from overestimating its benefits. The findings offer practical guidelines for optimizing backfill design in deep mining and paste filling applications, contributing both technical solutions for mine safety and fundamental insights for geomechanical theory. The developed methodology serves as a robust framework for future studies on complex backfill behavior under various loading conditions.

1. Introduction

Backfill mining [1,2,3] has obvious advantages over other methods. It can effectively improve the ground pressure conditions in the stope, increase the ore recovery rate, and reduce the ore dilution rate. Furthermore, this mining method realizes the resource utilization of tailings, thereby reducing the land area required for tailings storage and alleviating environmental pollution [4,5,6,7]. In recent years, due to innovative measures such as process separation, backfilling optimization and centralized resource management, the subsequent backfilling mining method has outperformed the traditional backfilling method in terms of operational efficiency, economy, safety, and environmental protection performance.
During the subsequent filling mining process, when the filling body material settles under its own weight, it will have complex interactions with the surrounding rock [8,9,10,11]. This interaction will lead to a redistribution of stress, with a portion of the vertical stress transferring to the surrounding rock interfaces, thereby altering the stress distribution pattern of the filler. Therefore, accurately assessing these stress conditions is crucial for the strength design of fillers, the determination of the retaining wall thickness, and the resolution of related engineering problems [12,13,14,15]. The arch effect is very crucial in the stress distribution of the filling body, which was reflected in previous studies [2,16,17,18].
The analytical solution method can quickly predict the stress distribution inside the backfill material by establishing an accurate mathematical model, and it provides a reliable theoretical basis for the design of strength parameters and stability assessment. The academic community has developed various arch effect stress models, but their applicability and accuracy vary greatly due to differences in basic assumptions, boundary conditions, and parameter selection. In the 21st century, Thomas’s research team developed a more comprehensive mechanical model of filling by incorporating three-dimensional constraint effects and interfacial friction characteristics. These innovations, including the time-varying stress evolution equation and the interface slip correction factor, greatly enhanced the applicability of the theoretical model in engineering. However, due to the increasingly complex geometric shapes of ore bodies, theoretical models are difficult to accurately analyze the stress of on-site engineering, and numerical simulation technology is playing an increasingly crucial role. Among them, the finite element method is applicable to the continuum analysis of the stress–strain evolution of the filling body. This method not only compensates for the limitations of the analysis methods, but also can simulate more realistic and complex operational scenarios. The current strength design of the filling body is often overly conservative due to ignoring the arching effect. In recent years, many scholars have conducted in-depth studies on the arching effect: In the study by Yan [19], theoretical analysis was carried out on the force characteristics of the filling body in the inclined mining area. By considering the difference in the inclination angle of the upper and lower plates and the friction effect at the interface between the surrounding rock and the filling body, an improved analytical model of vertical stress was established. The research results show that the deflection degree of the principal stress direction will significantly affect the stress distribution in the filling body, and this deflection effect presents nonlinear characteristics with the change of stope height. Among the geometric parameters of the stope, the increase of the upper plate inclination angle will weaken the principal stress deflection, thereby reducing the arching effect. The influence of the interfacial friction angle on the arching effect is much greater than that of the cohesion of the filling body. These findings provide a theoretical basis for the optimal design of the filling body under complex geometric conditions, particularly emphasizing that the roughness treatment of the interface should be emphasized in practical engineering. These advancements indicate that the precise characterization of the arch effect is crucial for the optimal design of the filling body. Therefore, in this study, a three-dimensional model of the filling body that conforms to the engineering site was established. Through FLAC3D [20,21,22] numerical simulation, the influence of various parameters on the arching effect was systematically studied. This research aimed to deepen the theoretical understanding of the arch-forming effect of filling bodies and provide a theoretical basis for practical engineering design and construction applications.

2. Research Methods

The numerical simulation in this study was conducted based on the mechanical characteristics of the ore-rock mass and backfill material at Dongguashan Copper Mine, utilizing the Mohr–Coulomb elastoplastic constitutive model in FLAC3D. The primary objective was to investigate the arching effect in subsequent backfilling operations within the mine’s panel stopes. The research systematically examined several critical aspects influencing stress distribution in backfilled stopes. First, the impact of interface elements on stress redistribution was analyzed to understand how numerical contact modeling affects simulation results. Second, parametric studies were performed to evaluate how both backfill material properties and interface parameters influence the stress distribution patterns. Third, the role of the backfill inclination angle in modifying stress distributions was examined to account for non-vertical stope configurations. Finally, these findings were synthesized to develop comprehensive conclusions regarding the fundamental laws governing stress distribution in backfilled mine stopes under arching conditions. This integrated approach provides valuable insights for optimizing backfill design and ensuring stope stability in similar mining operations.

2.1. Reliability Verification of Numerical Simulation of the Arching Effect

Before conducting numerical simulation studies on the arching effect of the filling body, in order to ensure the accuracy of the numerical simulation results, the numerical simulation results were compared and verified by combining the test data of the physical model of the indoor arched effect of relevant scholars [23] and the analytical solution values of the stress of the filling body under the arched effect [24].
Figure 1a is a simplified diagram of the indoor arching effect measurement device. Essentially, this device is a miniature model of a mine stope, made of plexiglass, and equipped with a balance and a load cell to measure the loads transferred to the bottom and walls of the stope, respectively. During the experiment of the indoor physical model, when the stope part is filled to a height of h, the mass of the filling material poured into the stope is m. The readings of the balance and the load cell are mb and ms, respectively. The weight of the filling material is transferred to the bottom of the stope and the stope wall, which is reflected by the measured values mb and ms, respectively, m = mb + ms. Therefore, the weight ratio of the filling material supported at the bottom is mb/m, and the weight ratio supported by the wall is ms/m. When the filler is filled to a height of h, the average vertical normal stress acting on the bottom of the stope is as follows: σV = mbγh/m. Figure 1b shows the corresponding numerical simulation model.
The parameters of the analytical method, numerical simulation, and bulk density method in this section are all consistent with those of the indoor physical model adopted. Among them, the bulk density of the filling body is 1753 kg/m3, the friction angle inside the filling body is 35°, the elastic modulus is 30 MPa, and the Poisson’s ratio is 0.25. The vertical stresses of the filling body were obtained, respectively, by the weight method, analytical solution, and numerical simulation, and compared with the measured parameters of the indoor physical model. The comparison is shown in Figure 2.
As illustrated in Figure 2, the stress comparison obtained from different methods indicates that the numerical simulation results exhibit good agreement with both the laboratory physical model test measurements and the three-dimensional analytical solution calculations. This consistency effectively validates the reliability and rationality of the numerical simulation approach in studying the arching effect of backfill materials.

2.2. Three-Dimensional Model of the Filling Body

The numerical simulation in this study was conducted based on the actual stope parameters from the −730 m level of Dongguashan Copper Mine, with dimensions of 50 m in length, 16 m in width, and 50 m in height. To accurately simulate real mining conditions, a 0.5 m gap was deliberately incorporated between the backfill material and the stope roof in the model, reflecting the common scenario where backfill fails to achieve complete contact with the roof in actual mining operations. The model boundaries were carefully designed to minimize boundary effects, extending to three times the excavation dimensions in all directions. The bottom and surrounding boundaries of the rock mass were fixed to represent geological constraints, resulting in a final model size of 316 m (x) × 350 m (y) × 350 m (z). The finite element mesh consisted of 989,677 elements, with particular attention paid to optimizing element aspect ratios to ensure computational accuracy. A refined mesh was implemented in the excavation zone to better capture stress concentration phenomena, while a coarser mesh was adopted for the outer regions to improve computational efficiency.
The Mohr–Coulomb elastoplastic constitutive model, available in FLAC3D, was selected for this simulation to appropriately represent the mechanical behavior of the rock mass. The complete numerical model configuration is illustrated in Figure 3, providing a clear visualization of the modeling approach and geometric setup [25,26]. This modeling methodology was designed to achieve a balance between computational accuracy and efficiency while maintaining fidelity to actual mining conditions. The careful consideration of boundary conditions, mesh refinement strategies, and material constitutive relationships ensures the reliability of the simulation results for subsequent analysis and interpretation.

2.3. Determination of Rock Mass Mechanical Parameters

The engineering weakening treatment of rock mass strength parameters is a critical step in enhancing the reliability and computational accuracy of rock engineering analyses. In engineering practice, the use of modified strength indices as computational parameters has become a common approach [27,28,29,30]. This parameter modification method not only represents an important research direction in rock mechanics but has also been widely applied in practical engineering. Particularly in cases where in situ testing is difficult to implement, the combination of laboratory rock testing and parameter modification has demonstrated significant engineering value. The M. Georgi method is a reduction method for rock mass strength parameters based on the statistical characteristics of joints and fissures, and it is particularly suitable for the weakening calculation of cohesion (c). This method was proposed by Georgi in the 1990s and is mainly used to solve the problem of determining the strength parameters of rock masses with well-developed joints (such as the surrounding rocks of mines and tunnels with dense fractures) [31]. This study adopts an innovative composite modification method, integrating empirical estimation [32] with the M. Georgi method, to perform weakening treatment on rock mechanical parameters. First, based on extensive expertise from domestic and international specialists, we systematically modified key parameters, including the internal friction angle, elastic modulus (E), and tensile strength. Second, considering the unique characteristics of joint and fracture development in the Dongguashan Copper Mine, we specifically applied the M. Georgi method to modify the rock mass cohesion:
(1)
Modification Method for Internal Friction Angle
The internal friction angle of rock mass exhibits a significant correlation with the intrinsic friction angle of intact rock [33], with typical engineering reduction factors ranging from 0.80 to 0.90. Considering the specific geological conditions of the mine—including the development of structural planes under high in situ stress at depth, the widespread distribution of alteration zones affecting frictional properties, and engineering-induced secondary fracture propagation—a comprehensive analysis integrating numerical simulation and expert judgment was conducted. The study systematically evaluated the reduction factor through numerical modeling and empirical expertise. Simulation results demonstrated that high in situ stress conditions and alteration zones substantially diminish the effective internal friction angle of the rock mass. Furthermore, engineering disturbances, leading to secondary fracturing, exacerbate the degradation of mechanical properties.
(2)
Modification Framework for Deformation Parameters
The deformation characteristics of rock masses are primarily governed by two key parameters: the elastic modulus (E) and the Poisson’s ratio [34]. In this investigation, the Poisson’s ratio was maintained at its original laboratory-determined value to preserve the fundamental deformation behavior of the intact rock. However, the elastic modulus required significant modification to account for the field-scale geological conditions. This adjustment was systematically determined through a multi-factor analysis incorporating both empirical relationships and theoretical frameworks. The modification process considered two critical geological indicators: a structural plane connectivity exceeding 65% and a rock quality designation (RQD) of approximately 55%. These parameters reflect substantial structural discontinuity development and moderate rock mass integrity, respectively. Through rigorous numerical modeling that coupled the Hoek–Brown failure criterion with established empirical relationships, we derived an elastic modulus reduction factor of 0.33. This value resides within the conventional empirical range of 1/3 to 2/3, demonstrating strong agreement between theoretical predictions and practical engineering observations. The technical basis for this modification stems from comprehensive mechanical analyses. The high degree of structural connectivity (>65%) creates pervasive weak planes that dramatically reduce the rock mass’s effective stiffness. Concurrently, the moderate RQD value (≈55%) quantitatively confirms the compromised integrity of the rock mass structure. Our integrated analytical approach, combining the Hoek–Brown criterion with empirical correction methods, provides a robust framework for determining appropriate parameter modifications that balance theoretical soundness with practical applicability in engineering design and stability assessments.
(3)
Reduction of Cohesion
Based on the actual engineering geological conditions and data of the mine, the M. Georgi method was selected to weaken the cohesion (C). According to M. Georgi’s experimental research on over ten types of rocks, the internal friction angle (φ) of intact rock is nearly equal to that of the rock mass. However, there is a significant difference in cohesion (C) between them. Therefore, M. Georgi proposed the following reduction formula (Equation (1)):
C m = C K [ 0.114 e 0.48 ( i 2 ) + 0.02 ]
In the aforementioned formula, i = joint density of the rock mass (here, based on mine data, taken as 1.8 joints/m); Cm = cohesion of the rock mass (MPa); CK = cohesion of the intact rock specimen (MPa). Based on the joint density (1.8 joints/m), the calculated reduction factor for rock cohesion is 0.143. If the empirical method is applied, the reduction factor typically ranges between 1/7 and 1/10 (0.1–0.15). Based on the comprehensive analysis of the results of the empirical method and the M. Georgi method, the reduction coefficient of 0.143 meets the accuracy requirements. Therefore, the polymerization reduction coefficient of 0.143 is selected. In this numerical simulation study, the mechanical parameters of backfill materials were determined by extensively referencing both domestic and international research findings on backfill mechanical properties [35,36]. Additionally, actual in situ strength test data of mine backfill structures were incorporated. The reduced mechanical parameters of the rock mass, as applied in the theoretical calculations and numerical simulations in this study, are summarized in Table 1.

3. Numerical Simulation

In actual mining stopes, the particles at the interface between the backfill and the surrounding rock are not perfectly bonded. Slippage, rolling, or detachment of fragmented particles may occur at the boundary between the backfill material and the fractured edges of the surrounding rock, leading to a weakening of the shear interaction between the two materials.
If the influence of the rock-fill interface is neglected in numerical simulations, the resulting stress distribution will be biased—underestimating the stress on the backfill while overestimating the stress on the surrounding rock. This can lead to an overestimation of the arching effect’s influence on the stope stability. Therefore, before conducting backfill simulations, it is essential to analyze the impact of the rock-fill interface elements on stress distribution in numerical models [36].
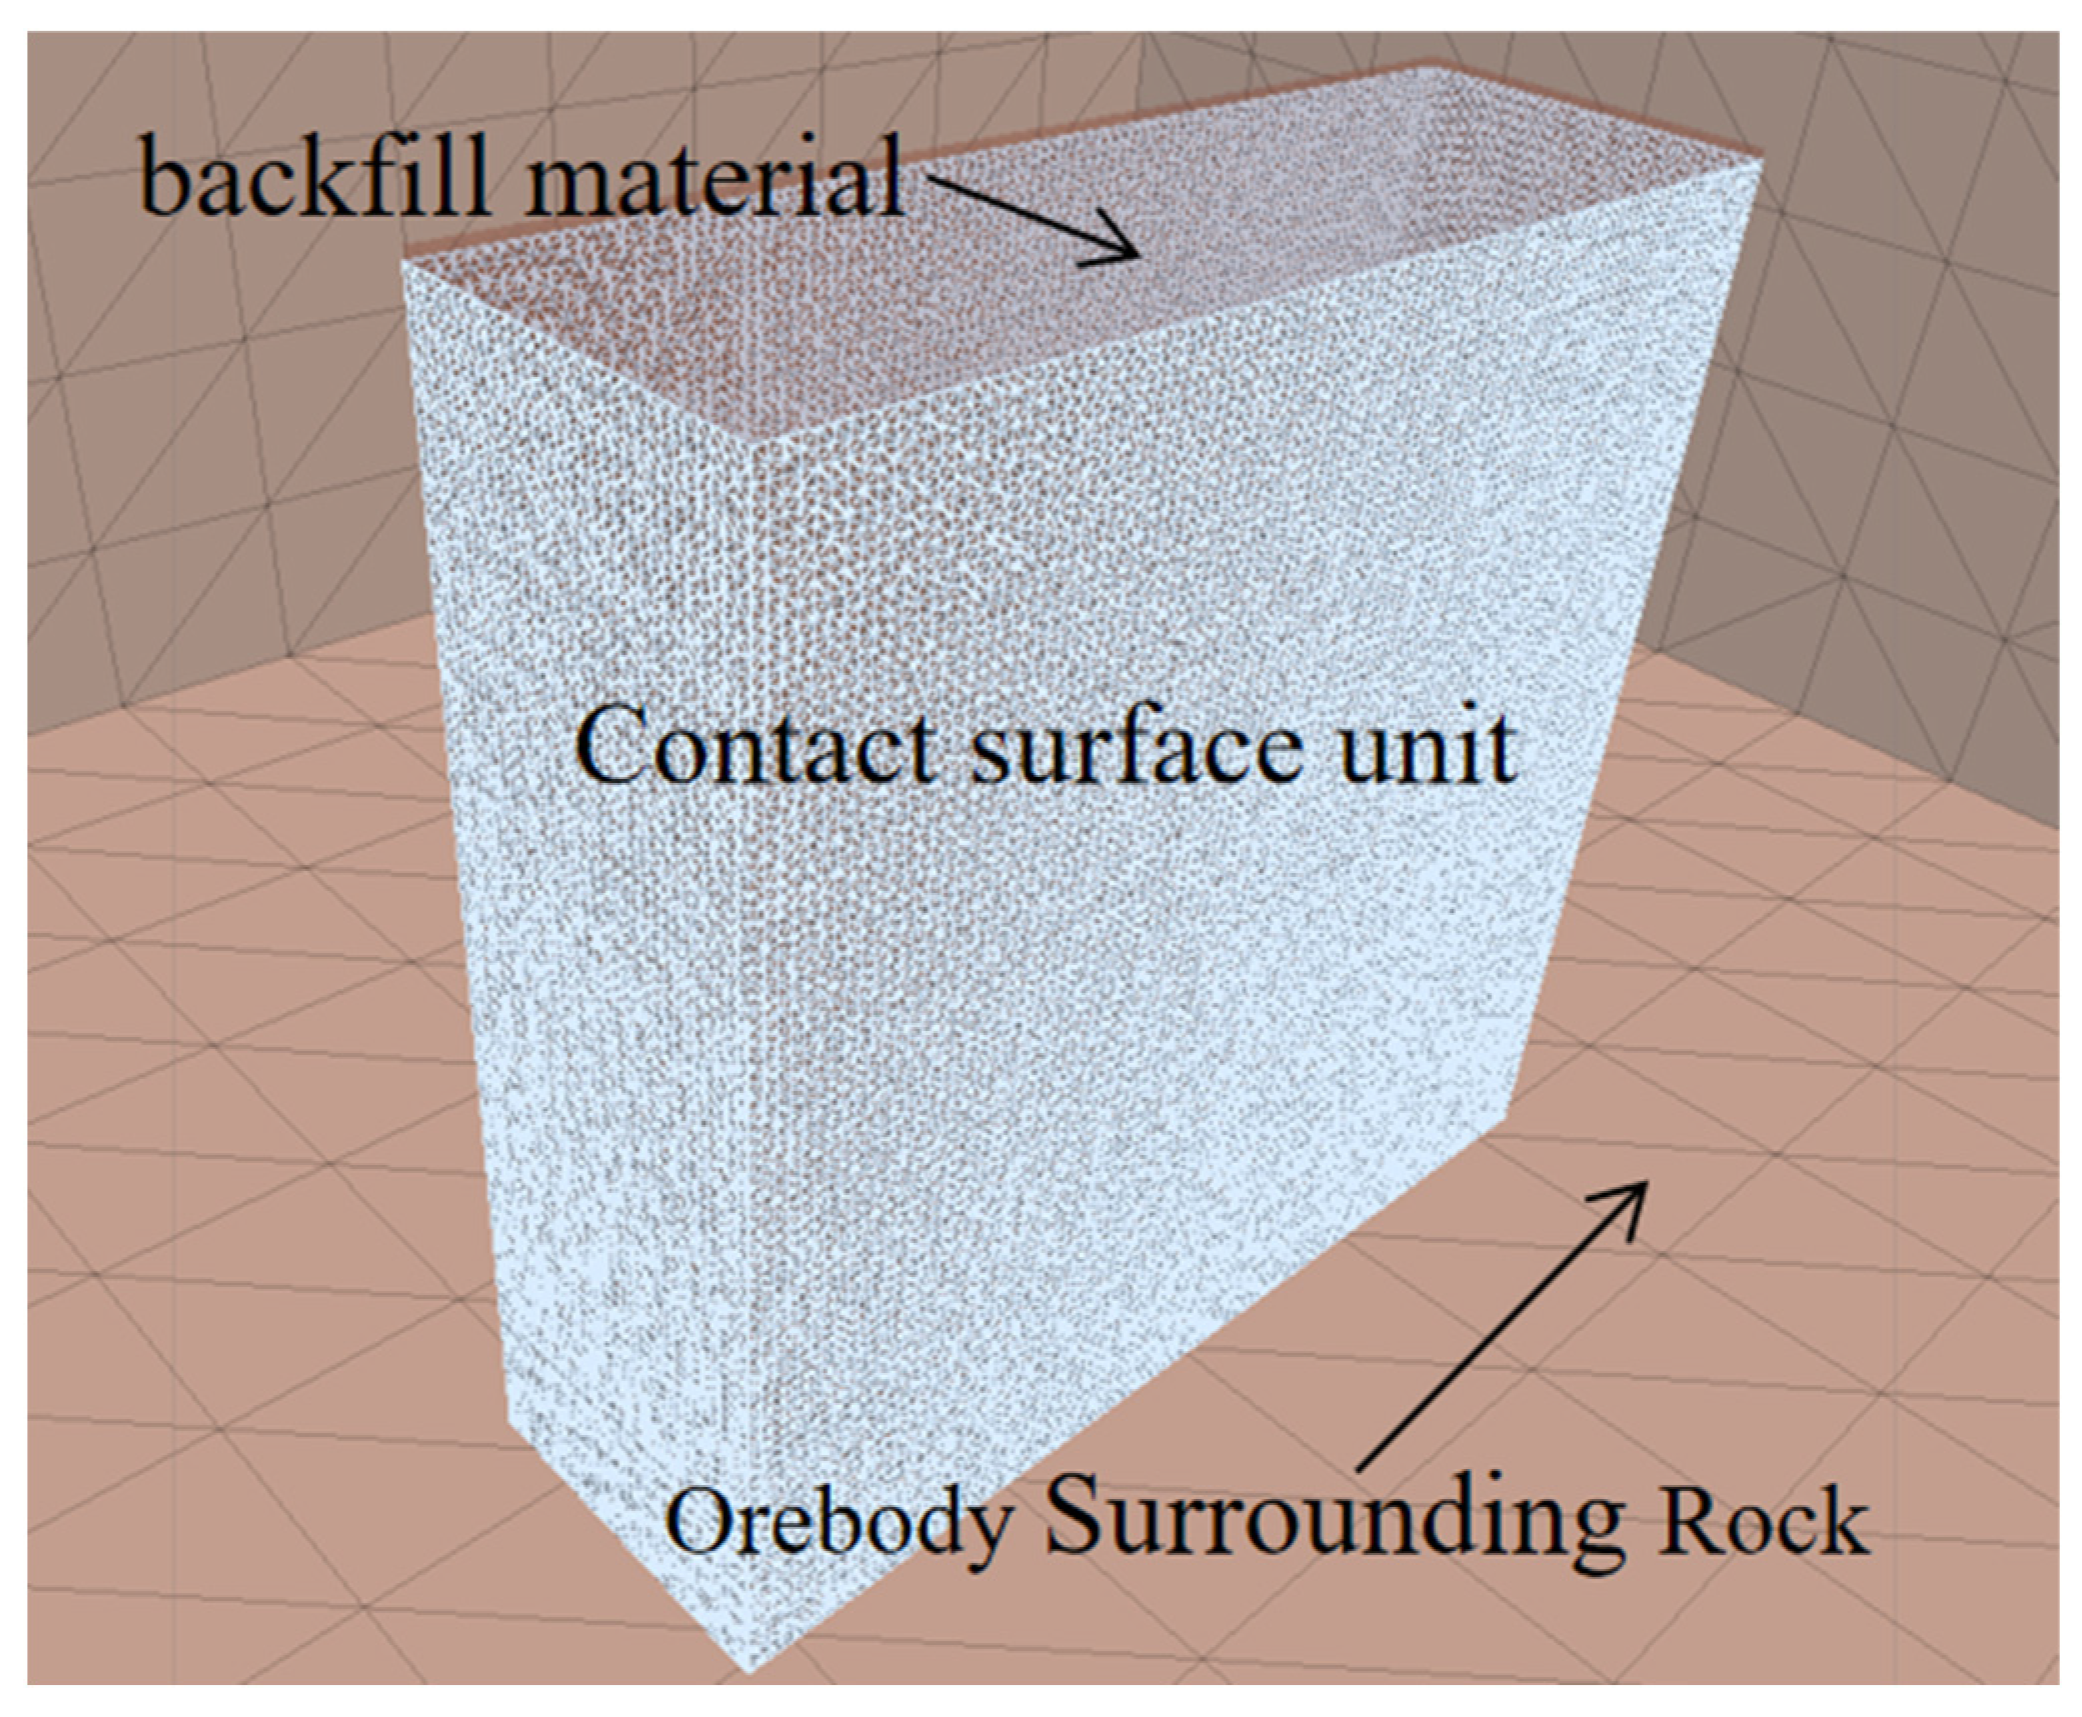
The contact surface element in FLAC3D is an important tool for simulating discontinuous mechanical behavior in geotechnical engineering. It is specifically used to handle the interaction between rock masses and structures, or the mechanical responses of internal structural planes of rock masses such as joints and faults. This unit is capable of precisely simulating various complex behaviors of the contact surface, including nonlinear characteristics such as sliding, opening, and closing.
The working principle of the contact surface unit is based on the Coulomb friction criterion, taking into account both the normal and tangential mechanical responses simultaneously. In the normal direction, it can simulate the pressure transmission under compression and the possible opening under tension. Users can set the tensile strength limit and the initial gap to simulate the actual situation. The tangential behavior follows the Coulomb friction model, controlling the shear resistance through cohesive force and friction angle. In numerical calculation, the software adopts the master-slave surface method for discretization processing, which can accurately calculate the relative displacement of the contact surface and the change of contact force.
These units have extensive application scenarios in engineering practice. For example, when analyzing the interaction between piles and soil, the friction characteristics between the pile body and the surrounding soil can be accurately simulated. When studying tunnel engineering, it can reflect the contact state between the lining structure and the surrounding rock. In slope stability analysis, the sliding behavior of the internal structural planes of the rock mass can be simulated. In addition, when simulating support structures such as anchor rods and soil nails, the interaction between them and rock and soil masses can also be well demonstrated.
The key parameters of the contact surface unit include normal stiffness: the stiffness of the contact surface against compression or separation in the normal direction. Shear stiffness: the stiffness of the contact surface against shear deformation in the tangential direction. Contact surface cohesion: the shear strength of the contact surface when it is not sliding. Contact surface friction angle: the internal friction angle when the contact surface slides determines the shear strength after sliding. The normal and shear stiffness values are calculated using Formula (2) provided in the FLAC3D manual:
k n = k s = 10 × max J + 4 G / 3 Δ z min
Δ z min represents the minimum normal grid size of the contact surface and takes the average or the smaller value of the grid sizes on both sides of the contact surface. The finer the grid and the greater the normal stiffness, the stronger the resistance to intrusion ability of the contact surface will be. Conversely, coarse meshes will lead to insufficient stiffness and may cause unrealistic contact phenomena. However, although a grid size that is too small can improve accuracy, it will significantly increase the computational load. J and G denote the bulk modulus and shear modulus of the backfill, respectively, which can be calculated from the backfill’s elastic modulus (E) and the Poisson’s ratio using Equations (3) and (4):
J = E 3 ( 1 2 μ )
G = E 2 ( 1 + μ )
Applying the above equations, the normal and shear stiffness of the model were calculated as kn = ks = 12.7 GPa/m. In mining engineering, the internal friction angle of interface elements is typically set within the range of 1/2 to 1 times that of the backfill material. For this simulation, a value of δ = 25 was selected. According to the model requirements, the contact surface unit of the surrounding rock-filling body should be inserted as shown in Figure 4.

3.1. Analysis of Backfill Parameters and Interface Elements on Stress Distribution in Backfill Structures
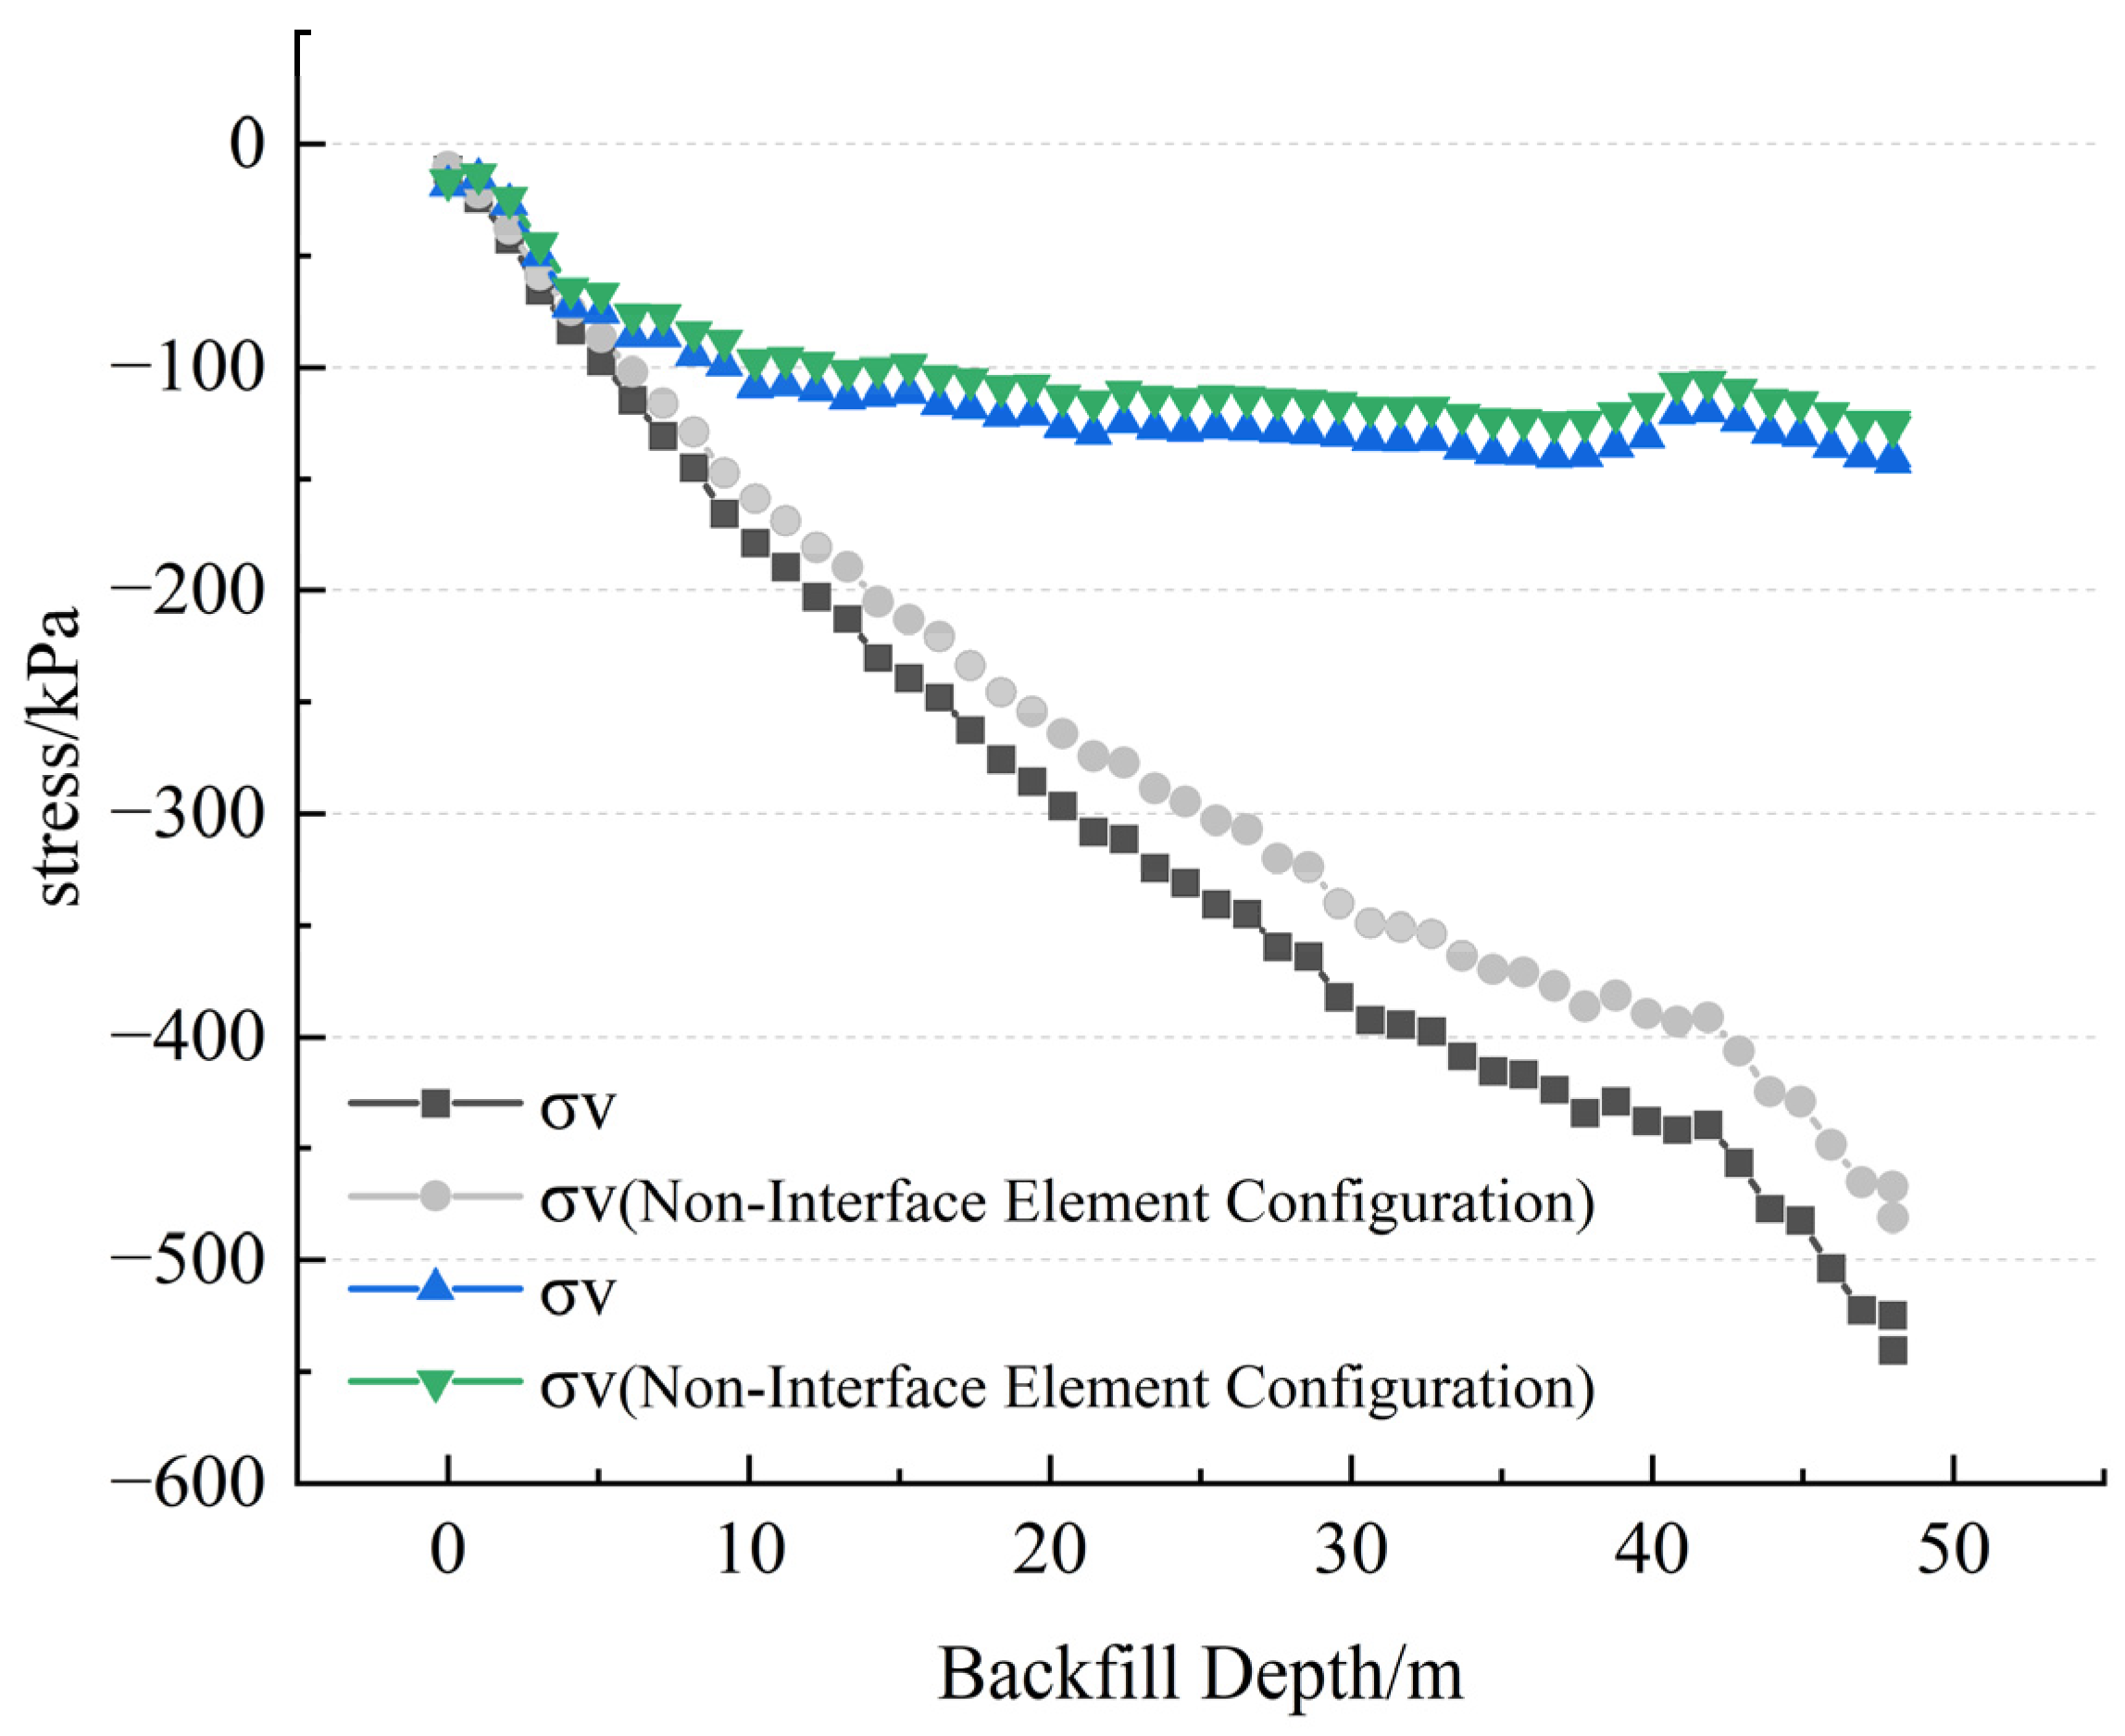
As shown in Figure 5, the comparative analysis of the numerical simulation results indicates that the introduction of the contact surface element has a significant impact on the stress distribution characteristics of the filling body. The FLAC3D numerical simulation results show that under both working conditions, with and without considering the contact surface element, the stress of the filling body presents a distribution law gradually increasing from the top to the bottom. This trend is consistent with the mechanical response of the filling body under the combined action of self-weight stress and surrounding rock constraints in actual engineering. It is worth noting that the stress values calculated by the model introducing the contact surface element are generally higher than those without considering the contact surface, and the stress gradient changes are more significant. This difference mainly stems from the fact that the contact surface unit can more accurately simulate complex mechanical phenomena such as the friction effect, relative slip, and possible separation behavior between the interface of the filling body and the surrounding rock, thereby more truly reflecting the stress distribution characteristics in actual engineering. In contrast, the model that does not consider the contact surface simplifies the interface interaction mechanism, and its calculation results show overly smooth stress distribution characteristics, making it difficult to reflect the stress distribution situation in engineering practice.
As shown in Table 2, in order to investigate the arching effect and stress distribution patterns, this section adopts a controlled, variable approach to study the influence of various parameters—including the cohesion, adhesive force, elastic modulus, and Poisson’s ratio of the backfill, as well as the internal friction angle and cohesion parameters at the backfill-surrounding rock interface—on the stress distribution characteristics of the backfill material.
Among them, φ is the friction angle of the filling body; c is the cohesion of the filling body; E is the elastic modulus of the filling body; μ is the Poisson’s ratio of the filling body; δ is the friction angle of the contact surface between the surrounding rock and the filling body; ck is the cohesion force at the contact surface between the surrounding rock and the filling body; VAR represents the variable in each group. Please refer to Table 3 for the definitions of relevant parameters.

3.2. Analysis of Stress Distribution Patterns with Respect to Backfill Internal Friction Angle

As shown in 
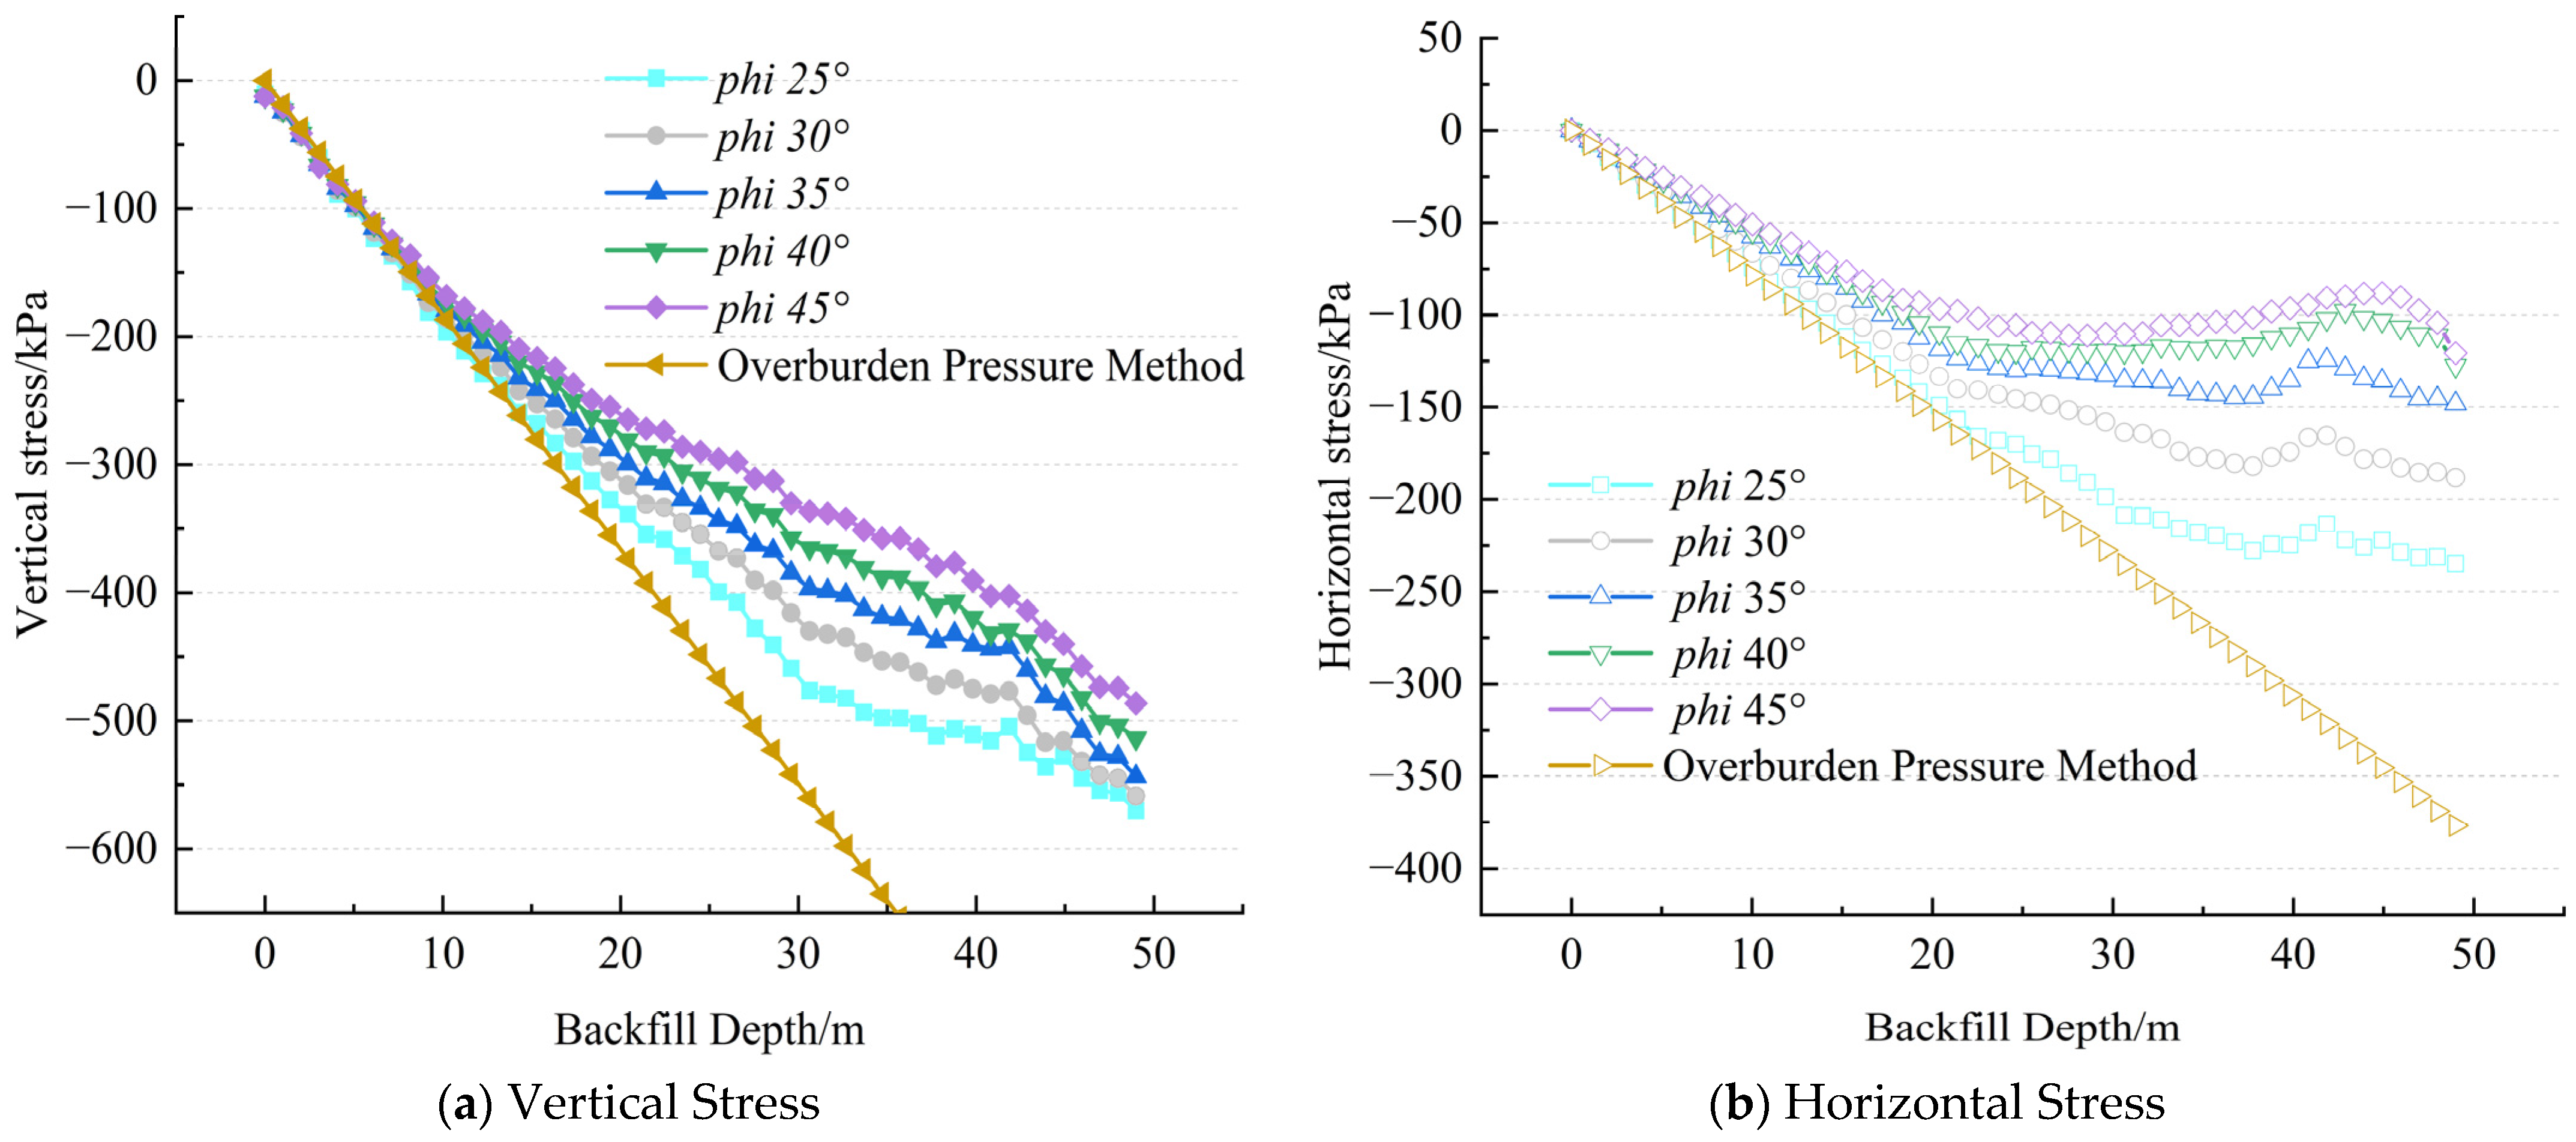
Figure 6, whether it is the vertical stress calculated by the weight method or the stress distribution under different internal friction angles (25°, 30°, 35°, 40°, 45°), the phi in the chart represents the friction angle inside the filling body; their values increase significantly with the increase of the depth of the filling body. This variation law is consistent with the mechanical response characteristics of the filling body under the combined action of its own weight and the surrounding rock in actual engineering.
The vertical stress and horizontal stress values obtained through FLAC3D numerical simulation are both lower than the calculation results of the traditional overweight method. This difference mainly stems from the fact that the overweight method only considers the self-weight effect of the filling body, while ignoring the significant influence of the internal friction angle on the stress distribution. The numerical simulation results show that as the internal friction angle decreases, the stress distribution of the filling body gradually approaches the calculation result of the overweight method. This phenomenon reveals the widespread arching effect in the mining plate area stope, which leads to the redistribution of internal stress in the filling body, thereby forming a characteristic stress transfer phenomenon.
As the friction angle in the filling body gradually increases from 25° to 45°, both the vertical stress and the horizontal stress show a decreasing trend. This phenomenon stems from the fact that an increase in the internal friction angle significantly enhances the friction between the contact surfaces of the filling body, thereby effectively reducing the stress level. It is notable that the sensitivity of stress to the change of the internal friction angle shows a decreasing characteristic: when the internal friction angle increases from 25° to 30°, the vertical stress change amplitude reaches 40.2 kPa; when the internal friction angle increases from 40° to 45°, the variation range decreases to 25.6 kPa. This indicates that within the range of the lower internal friction angle, the stress value is more sensitive to the change of the internal friction angle.
The research results show that the internal friction angle is a key parameter controlling the stress distribution of the filling body. The increase of its value will significantly reduce the stress level of the filling body, and this influence effect is more prominent within the range of low internal friction angles. In engineering practice, by reasonably regulating the internal friction angle, the stress distribution of the filling body can be optimized and its stability can be effectively improved. Although the weight method is simple to calculate, its calculation results are often conservative because the influence of the internal friction angle is not considered. Therefore, in practical engineering applications, the influence of internal friction angles should be comprehensively considered for more precise stress analysis to ensure the safety and reliability of the project.

3.3. Effect of Backfill Cohesion on Stress Distribution

As shown in Figure 7, through the numerical simulation study of the stress distribution at the vertical centerline of the stope filling body, the influence mechanism of the cohesive force on the stress evolution law and arching effect of the filling body was revealed (research conditions: cohesive force at the contact surface = 0, friction angle within the filling body = 35.7°). The results show that the cohesive force, as it is a key parameter controlling the mechanical properties of the filling, then its variation will significantly affect the stress distribution characteristics of the filling body and the development degree of the arching effect.
As the cohesive force gradually increases from 0 kPa to 1000 kpa (0, 10, 20, 30, 100, 500, 1000 kpa), both the vertical stress and the horizontal stress inside the filling body show a significant decreasing trend. In the low cohesion range (0–30 kPa), the stress distribution shows a relatively simple linear characteristic. When the filling depth is within the range of 0–20 m, the stress value is close to the theoretical calculation result of the overburden, which indicates that the arching effect has not been fully developed at this time, and the filling body mainly bears the self-weight stress. When the cohesive force enters the medium–high range (100–1000 kpa), the arching effect is significantly enhanced. The filling body shows good load transfer and stress redistribution capabilities, and the stress value is significantly lower than the calculation result of the overburden.
It is worth noting that when the cohesive force exceeds 500 kPa, the enhancing effect of further increasing the cohesive force on the arching effect tends to level off, and the stress distribution no longer changes significantly. This phenomenon indicates that there is a critical value for the influence of the cohesion force of the filling body on the arch-forming effect. Beyond this value, the contribution of the increase in cohesion force to the arch-forming effect will significantly decrease. This discovery provides an important reference for mine filling engineering: when designing the strength and analyzing the stability of the filling body, it is necessary to fully consider the favorable influence of the arching effect on the stress redistribution, and at the same time avoid overestimating the effect of the cohesive force. In engineering practice, it is recommended to control the cohesion within a reasonable range to achieve the best balance between economy and stability.

3.4. Research and Analysis on the Influence of Backfill Elastic Modulus on Stress Distribution Patterns

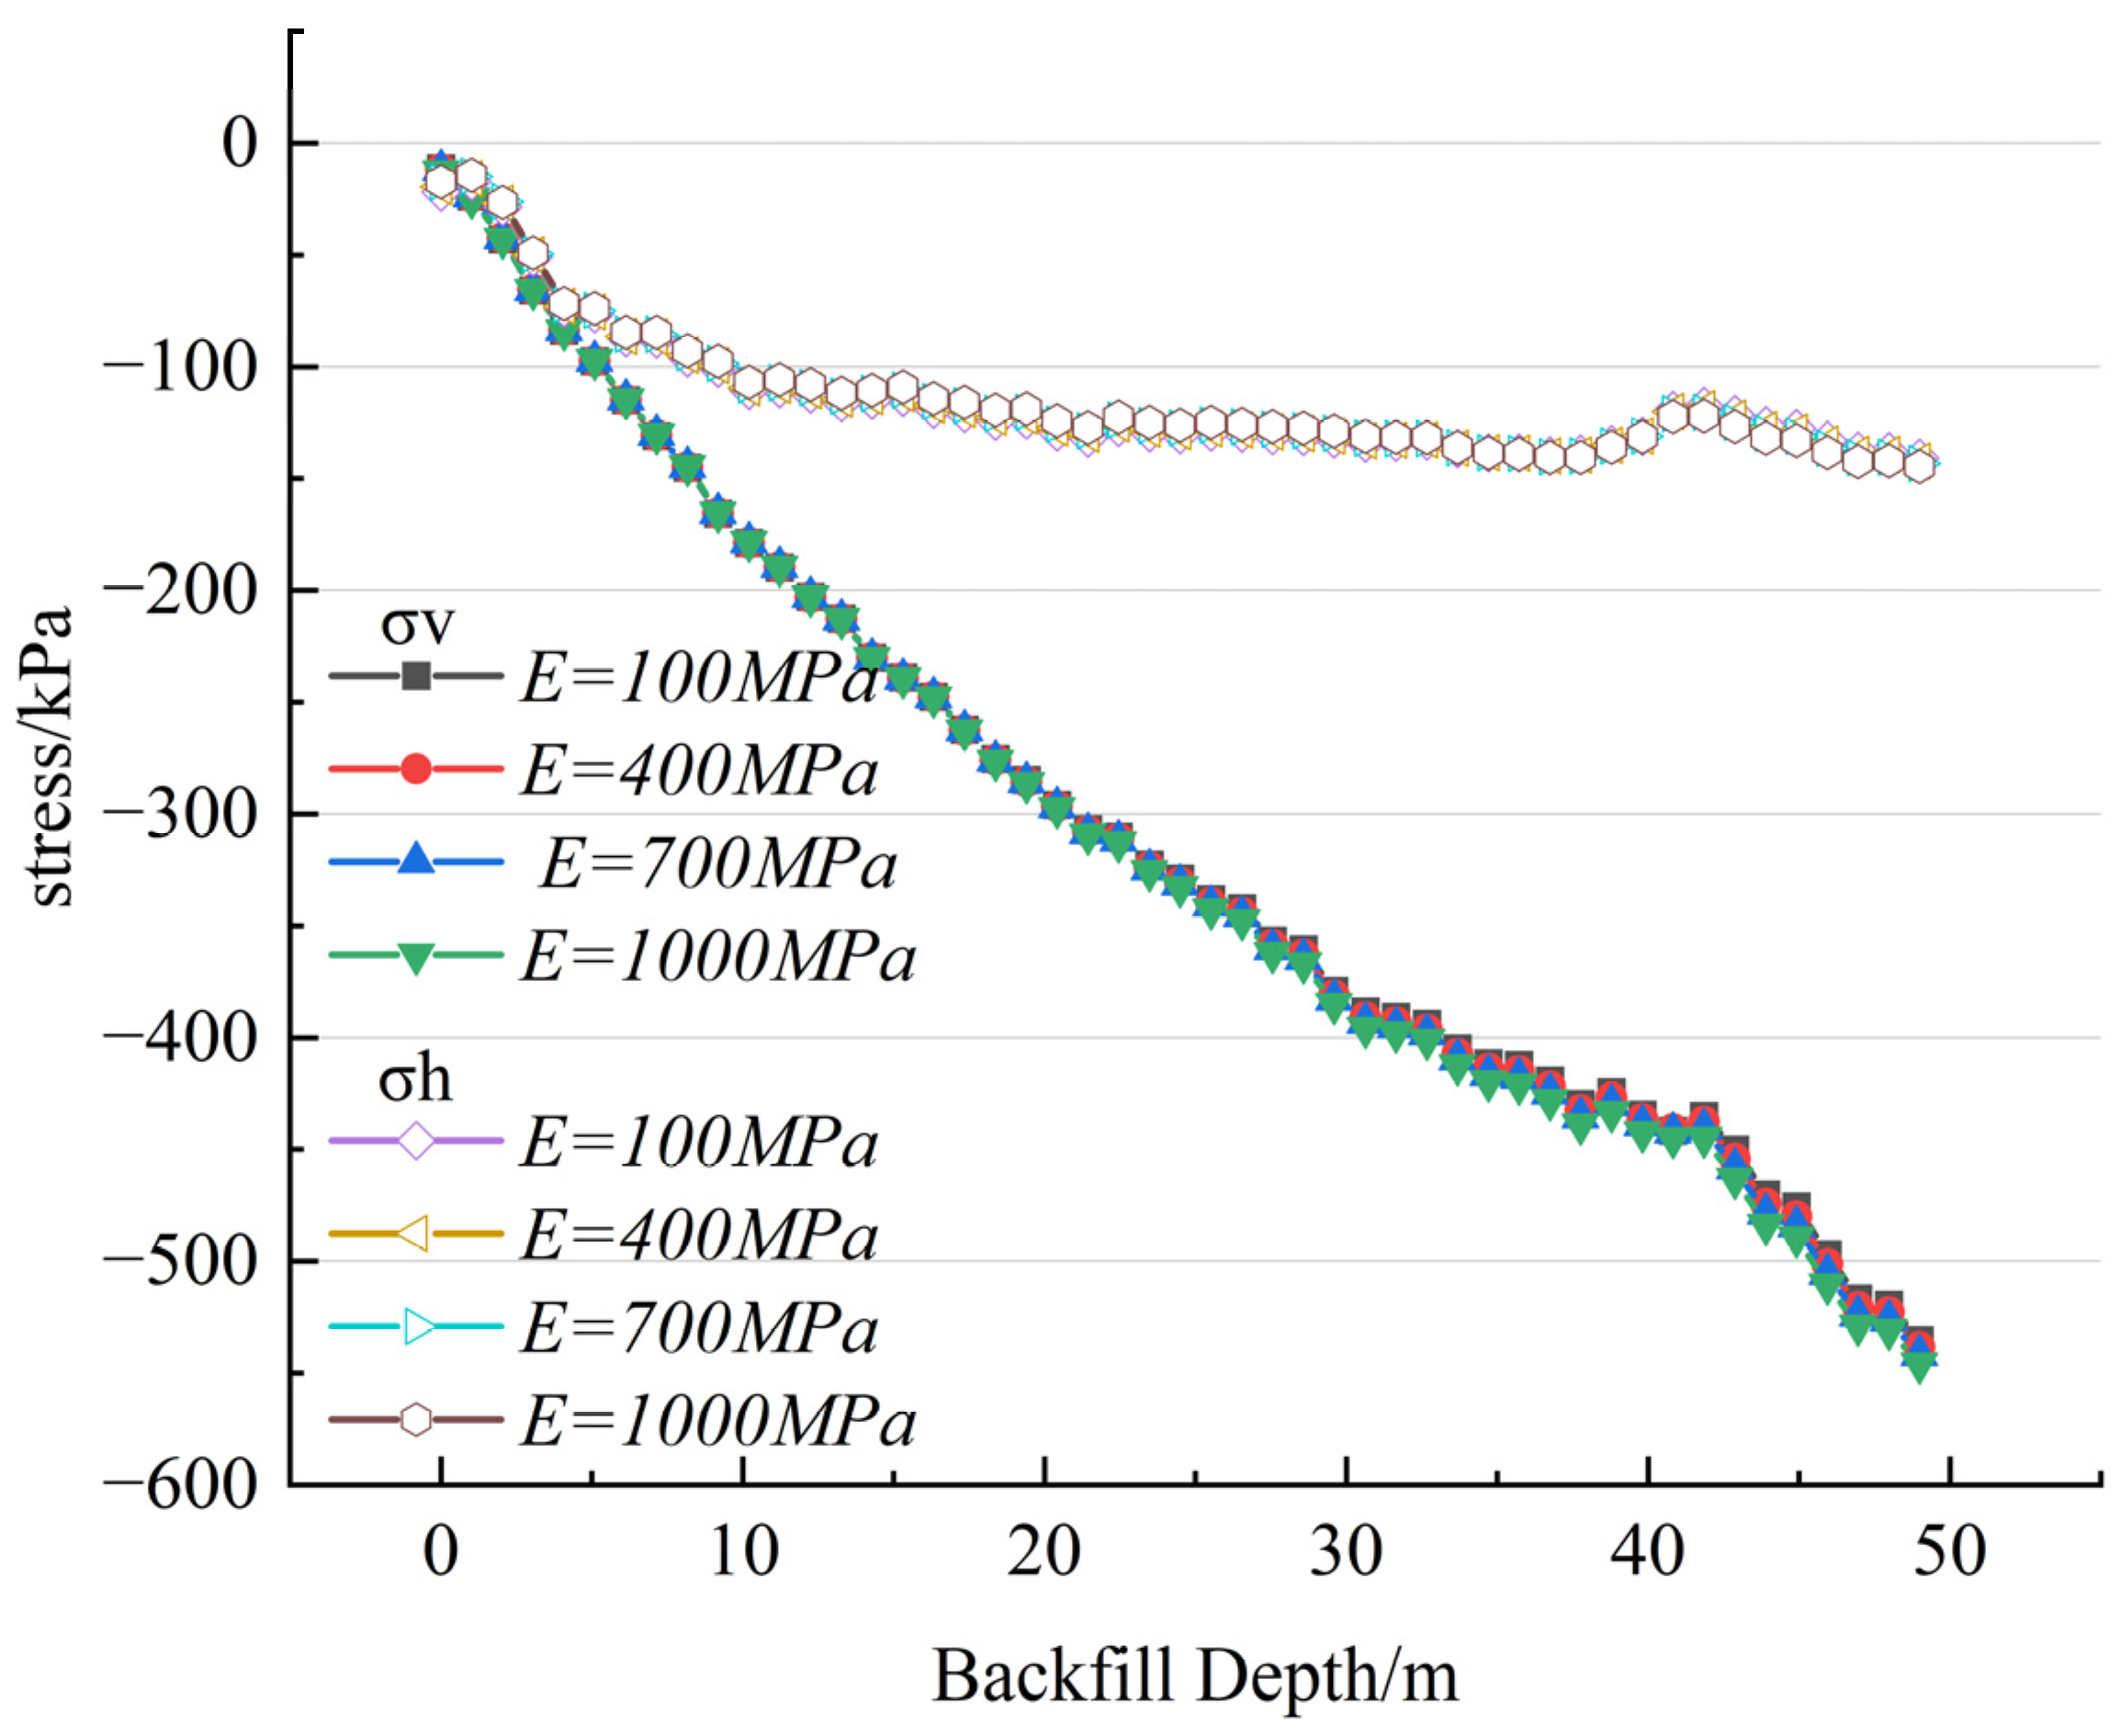
Figure 8 shows the evolution law of the stress at the vertical centerline of the filling body varying with the elastic modulus (100–1000 mpa). The research results show that when the elastic modulus increases from 100 MPa to 1000 MPa, the maximum vertical stress at the bottom of the filling body only slightly increases from 530 kPa to 540 kPa, and the horizontal stress only slightly increases from 140 kPa to 144 kPa. This stress variation amplitude is highly disproportionate to the increase in elastic modulus, fully indicating that the stress of the filling body has a distinct weak sensitivity characteristic to the change in elastic modulus.
Combined with the previous research results, it can be concluded that the stress transfer mechanism of the filling body is mainly controlled by the interfacial friction force and cohesion force, rather than the stiffness characteristics of the filling body itself. This important discovery provides a new theoretical basis for the design of filling engineering: in practical engineering applications, simply increasing the elastic modulus of the filling body cannot effectively improve the arching effect or optimize the stress distribution. Therefore, the focus of engineering design should be placed on reasonably regulating the stiffness of the contact unit to ensure the integrity of the filling body structure. By scientifically matching the elastic modulus with the stiffness of the contact element, it is possible to ensure the safety of the project while achieving efficient utilization of resources and reaching a balance between economic benefits and project quality.

3.5. Research and Analysis of the Influence of Backfill Poisson’s Ratio on Stress Distribution Patterns

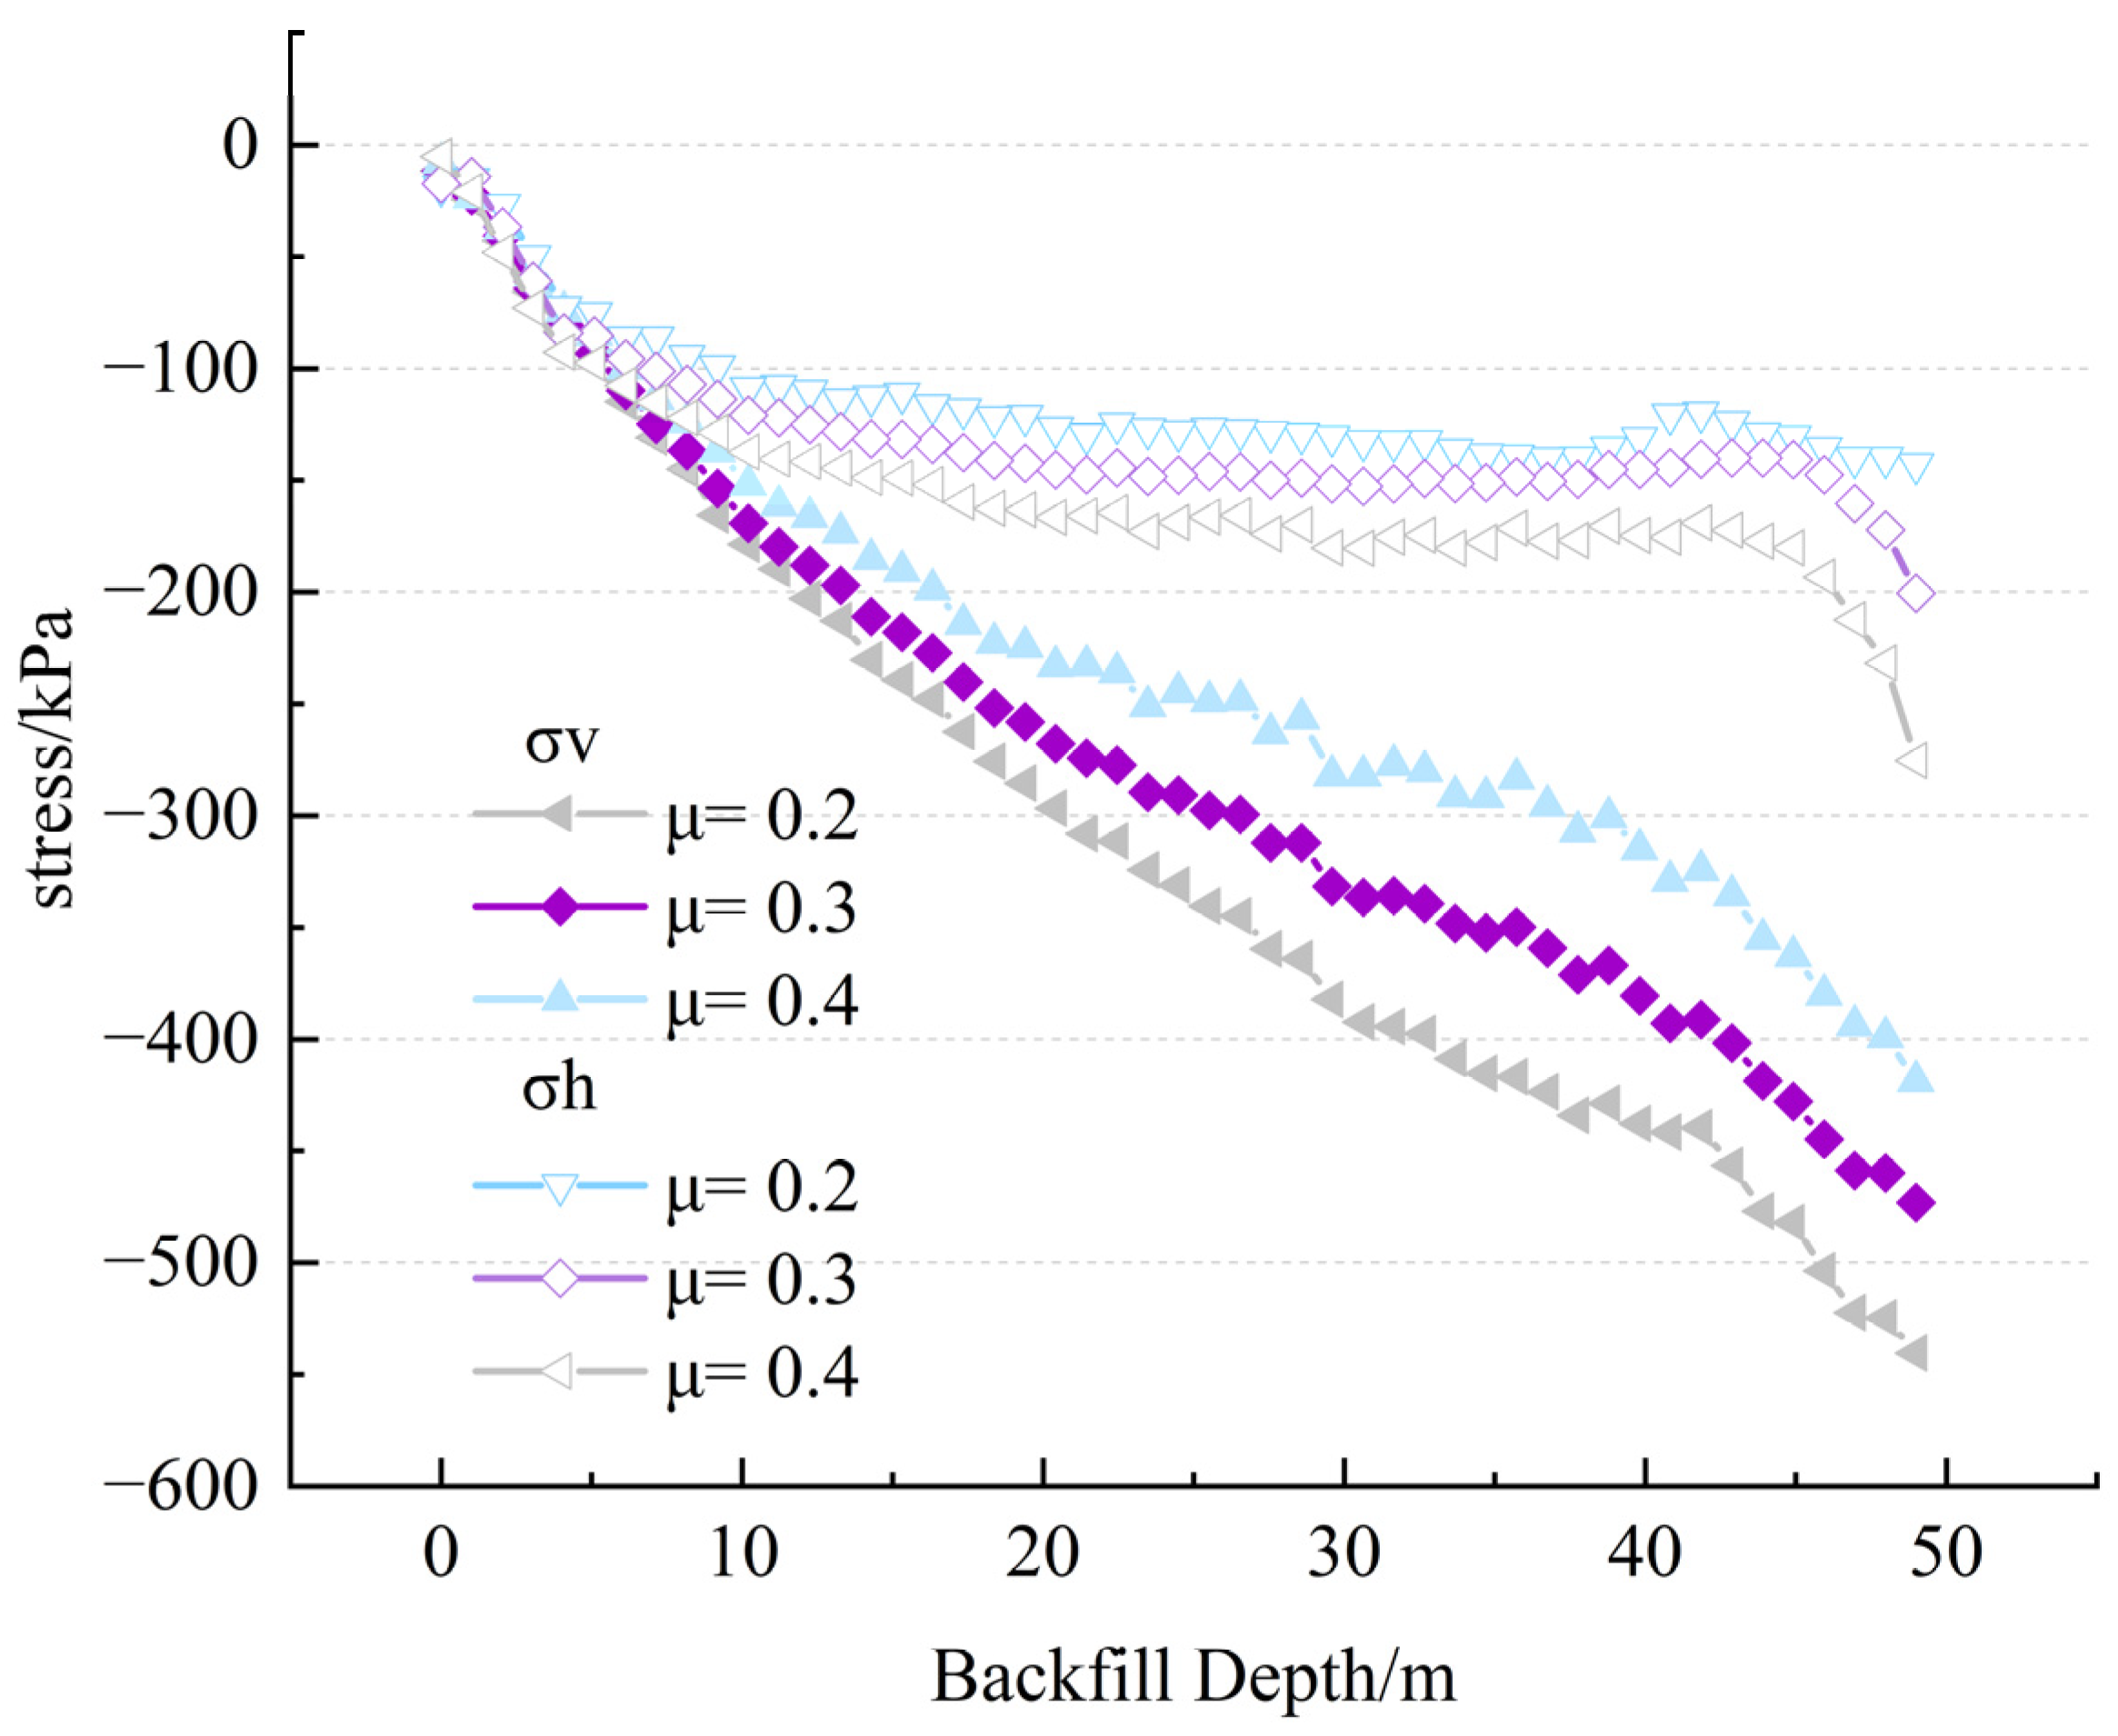
Figure 9 systematically reveals the influence law of Poisson’s ratio on the stress distribution of the filling body. By combining numerical simulation with theoretical analysis, the stress response characteristics of the vertical centerline of the filling body, when the Poisson’s ratio varies within the range of 0.2–0.4, were investigated. Studies show that when the Poisson’s ratio increases from 0.2 to 0.4, the vertical stress of the filling body significantly decreases by 15%, while the horizontal stress increases by approximately 20%, accordingly, presenting an obvious stress redistribution phenomenon.
This variation law can be reasonably explained from the basic theory of material mechanics: Poisson’s ratio, as a key parameter characterizing the lateral deformation characteristics of materials, on increasing leads to an enhanced lateral expansion effect of the filling body under vertical loads, thereby causing a typical response where the horizontal stress increases and the vertical stress decreases. The research results not only verify the significant influence of the Poisson’s ratio on the stress distribution of the filling body, but also emphasize that in the numerical simulation and theoretical analysis of filling engineering, the value of the Poisson’s ratio parameter must be accurately considered. Only by reasonably determining the Poisson’s ratio can the accuracy and reliability of the calculation results be ensured, providing a scientific basis for engineering design and stability assessment.

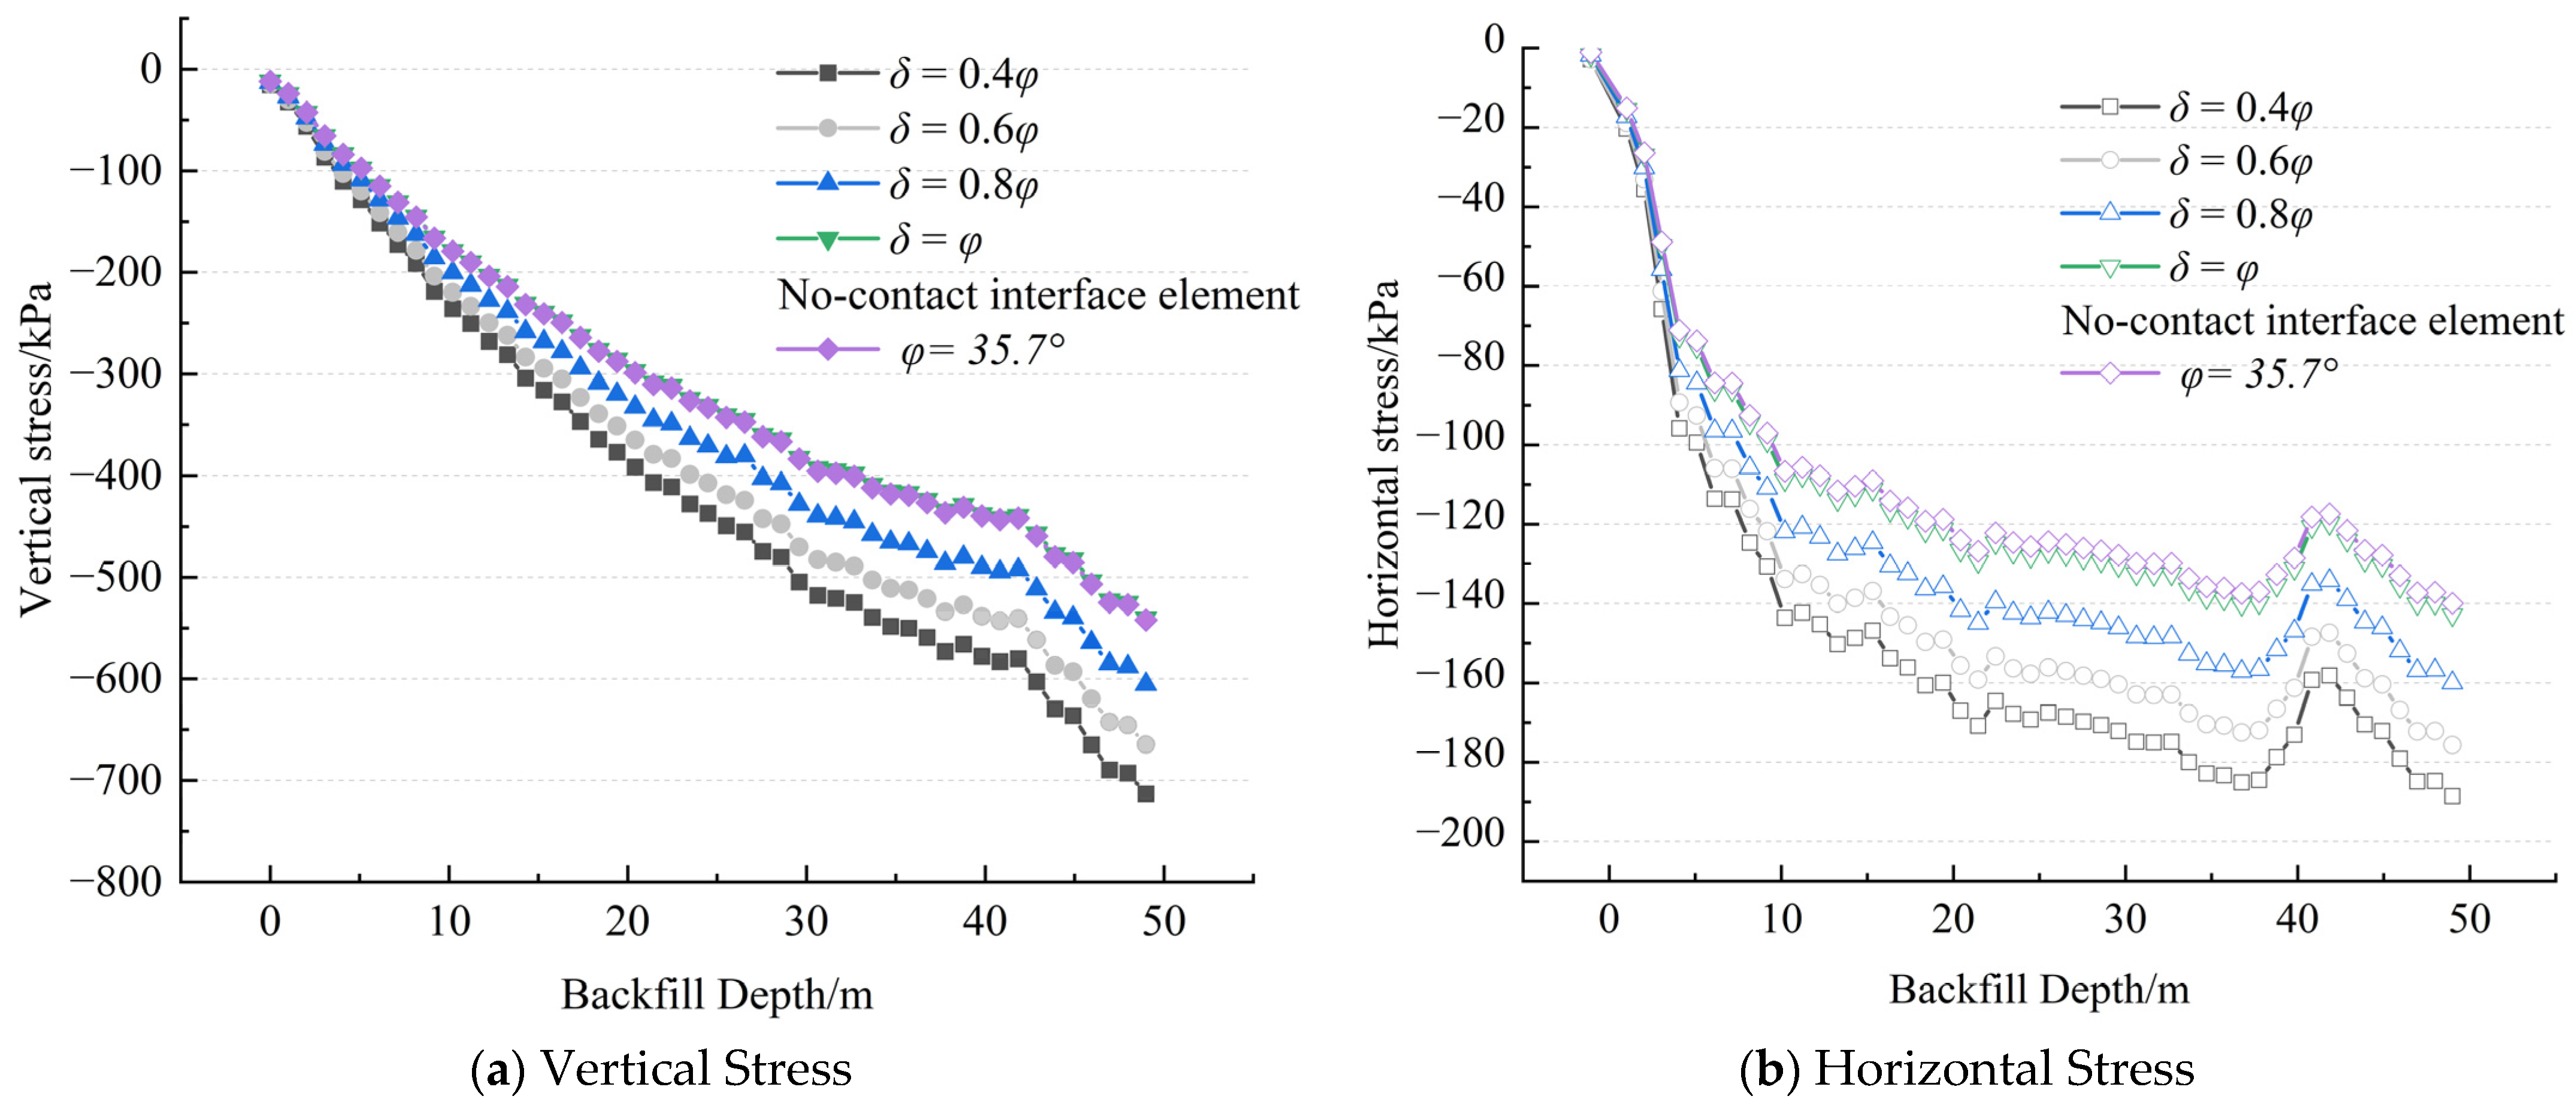
3.6. Study on the Influence of Interface Friction Angle on Stress Distribution Patterns

As shown in Figure 10, this section analyzes the evolution of vertical stress (σv) and horizontal stress (σh) along the central axis of the backfill when the ratio of the interface friction angle to the backfill’s internal friction angle varies between 0.4 and 1.0. Numerical simulation results reveal that when the interface friction angle is smaller than the backfill’s internal friction angle (δ < φ), both vertical and horizontal stresses in the backfill gradually decrease with increasing ratio.
By comparing the working conditions with or without the embedding of the contact unit, it is found that when δ < φ, the stress state of the filling body is mainly affected by δ. When δ = φ, the stress distribution result tends to be consistent with the working conditions without the addition of the contact surface unit. It further indicates that in the stope, in the stope numerical simulation, if the actual friction angle between the surrounding rock and the filling body is less than the internal friction angle of the filling body, a contact surface element needs to be added to the model to accurately reflect the interface mechanical behavior. Otherwise, due to the absence of the contact surface effect, the arching effect during the simulation process will be overestimated, resulting in the stress calculation results of the filling body being significantly lower than the actual value, thereby affecting the reliability of the simulation results.
In-depth analysis indicates that the introduction of the contact element significantly alters the stress response mechanism of the filling body. Under the non-contact unit working condition, the stress distribution is mainly regulated by the arching effect formed by the friction angle (35.7°) within the filling body. After introducing the contact element (with an interface friction angle of 25°), the stress control rights are transferred to the contact interface. Since the friction angle at the interface is significantly lower than that inside the filling body, the arched effect in the contact element model is significantly weakened, and the stress value increases accordingly. This phenomenon clearly reveals the dominant role of the mechanical parameters of the contact interface in stress regulation: When there are contact elements, the interface strength parameters will take priority over the parameters of the filling body itself in determining the stress distribution characteristics. This discovery provides an important basis for understanding the interaction mechanism between the filling body and the surrounding rock, indicating that in engineering practice, the accurate determination and reasonable design of contact interface parameters must be emphasized.

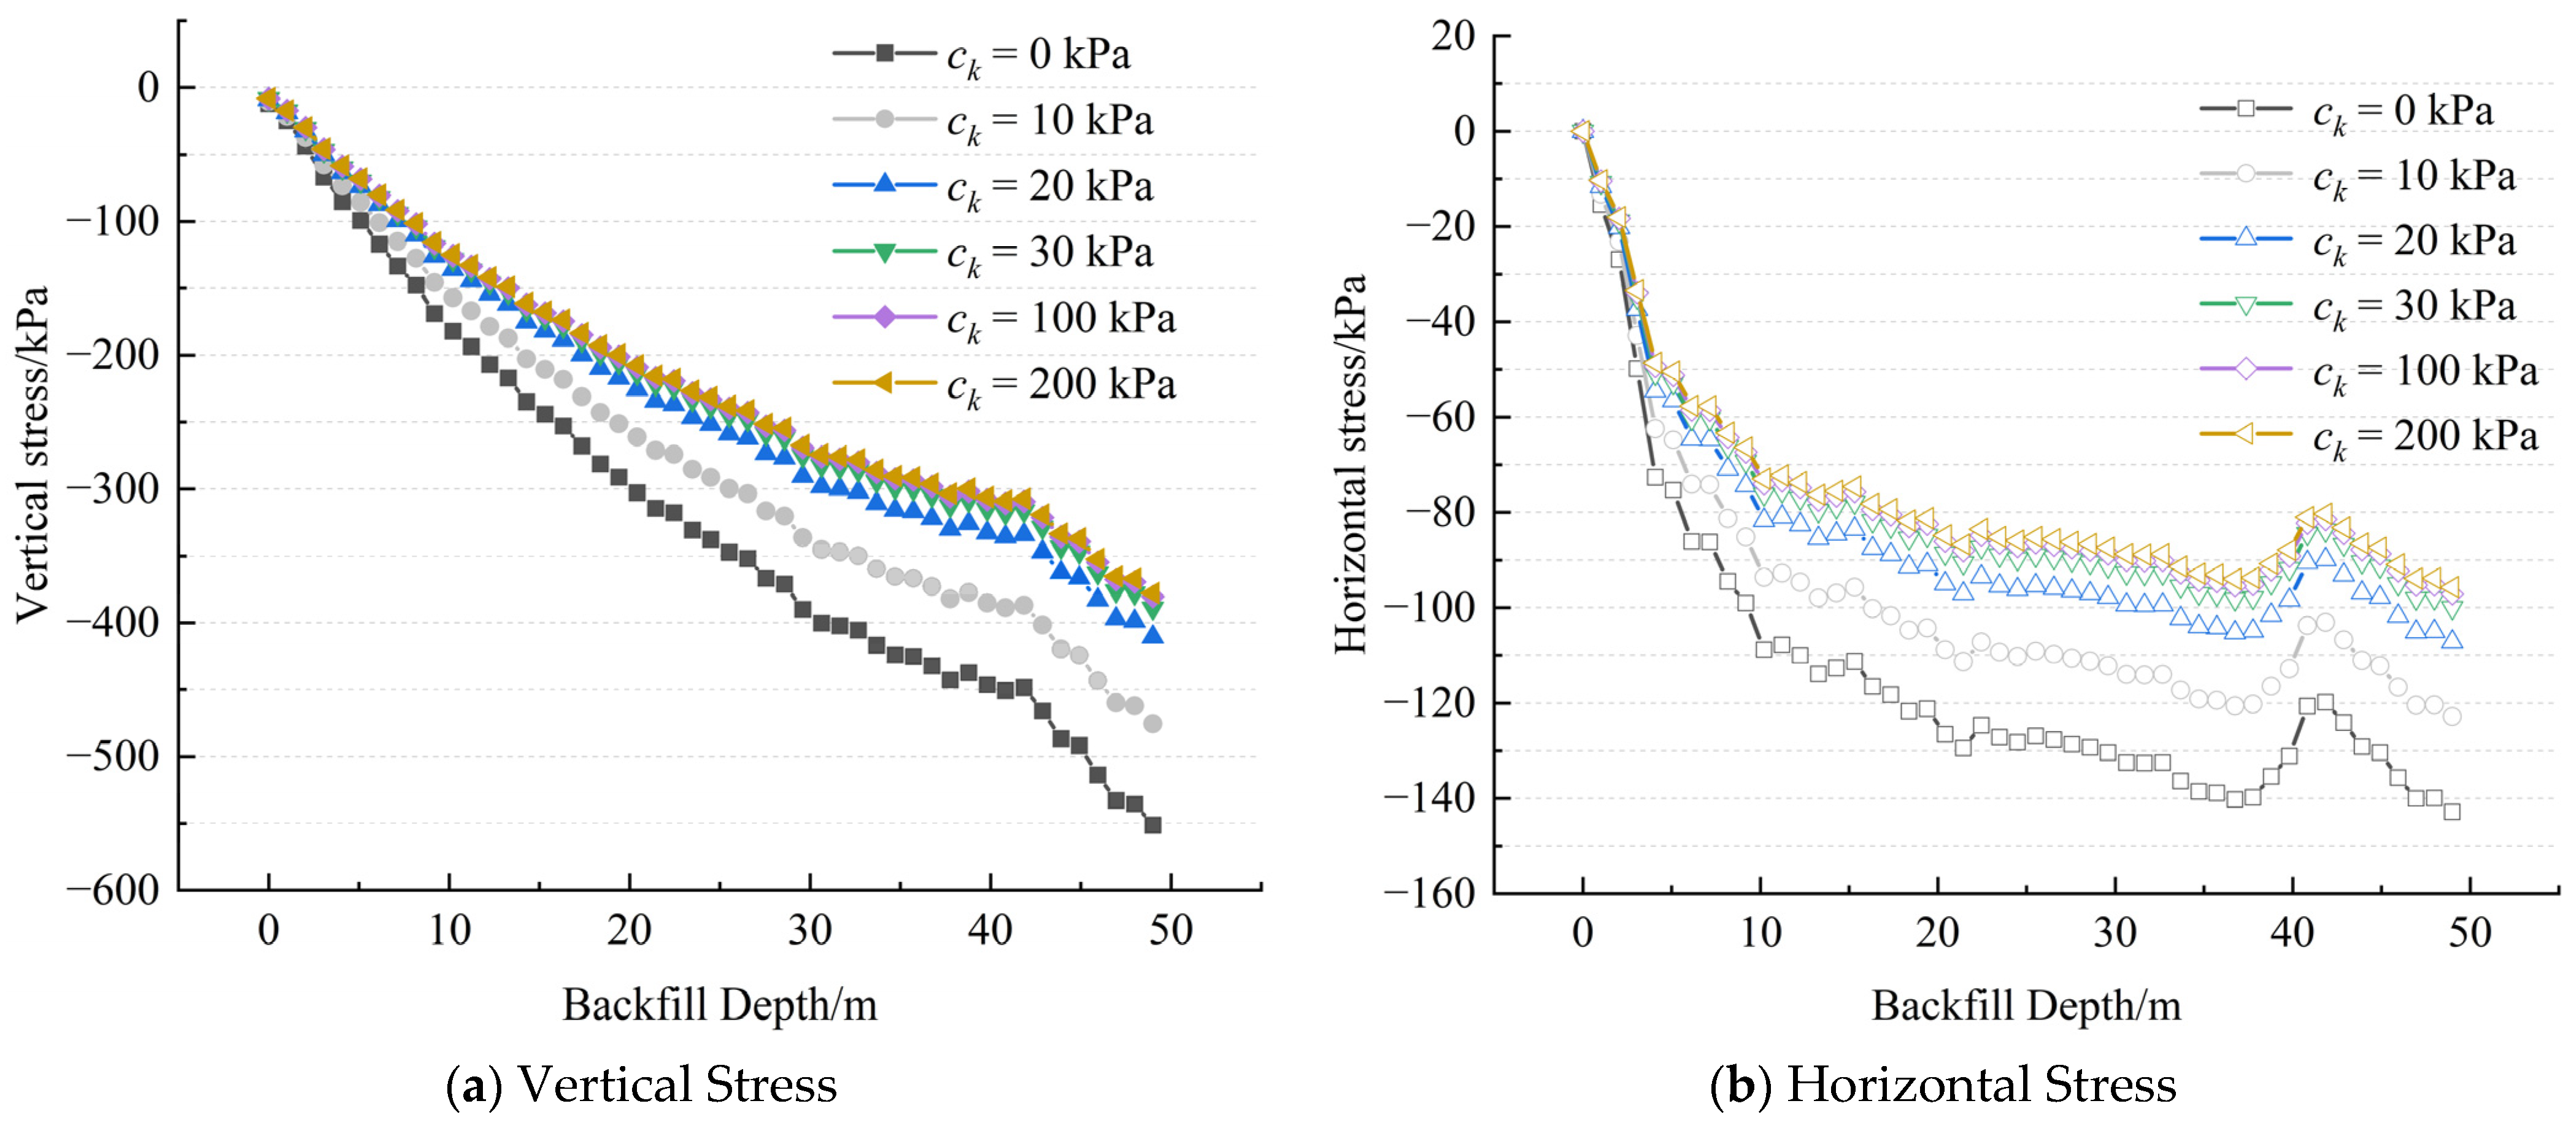
3.7. Analysis of the Influence of Interface Element Cohesion on Stress Distribution Patterns

Figure 11 reveals the regulation law of the cohesive force of the contact surface on the stress distribution of the stope filling body. The research results show that as the cohesion force of the contact surface increases from 0 to 200 kPa, both the vertical stress and the horizontal stress at the vertical centerline of the filling body present a significant decreasing trend. It is notable that this change process shows obvious phased characteristics: when the cohesion is less than 30 kPa, the stress state of the filling body shows strong sensitivity, and both the vertical stress and the horizontal stress fluctuate significantly. When the cohesive force exceeds 30 kPa, although the stress still increases with the increase of depth, its variation range tends to stabilize and no longer shows sharp fluctuations. This phenomenon reveals an important mechanical mechanism: there is a critical threshold effect on the influence of the bonding force of the contact surface on the stress distribution of the filling body. When the bonding force reaches or exceeds the critical value of 30 kPa, its regulatory effect on the stress distribution tends to be saturated. This discovery provides an important theoretical basis for the optimal design of the contact surface between the filling body and the surrounding rock.

4. Analysis of the Influence of Backfill Dip Angle on Stress Distribution

During the process of mining and backfilling in the mine, the stress distribution of the backfill body will directly affect the stability and safety of the stope. Especially in the inclined stope environment, the backfill body is not only affected by its own gravity, but also subjected to the compression of the surrounding rock of the upper plate and the restriction of the surrounding rock of the lower plate, thereby changing its internal stress transmission path and distribution characteristics. At present, there is still a lack of research on the arching effect of inclined filling bodies. The stress distribution law of stress arches under different inclination angles still needs further study.
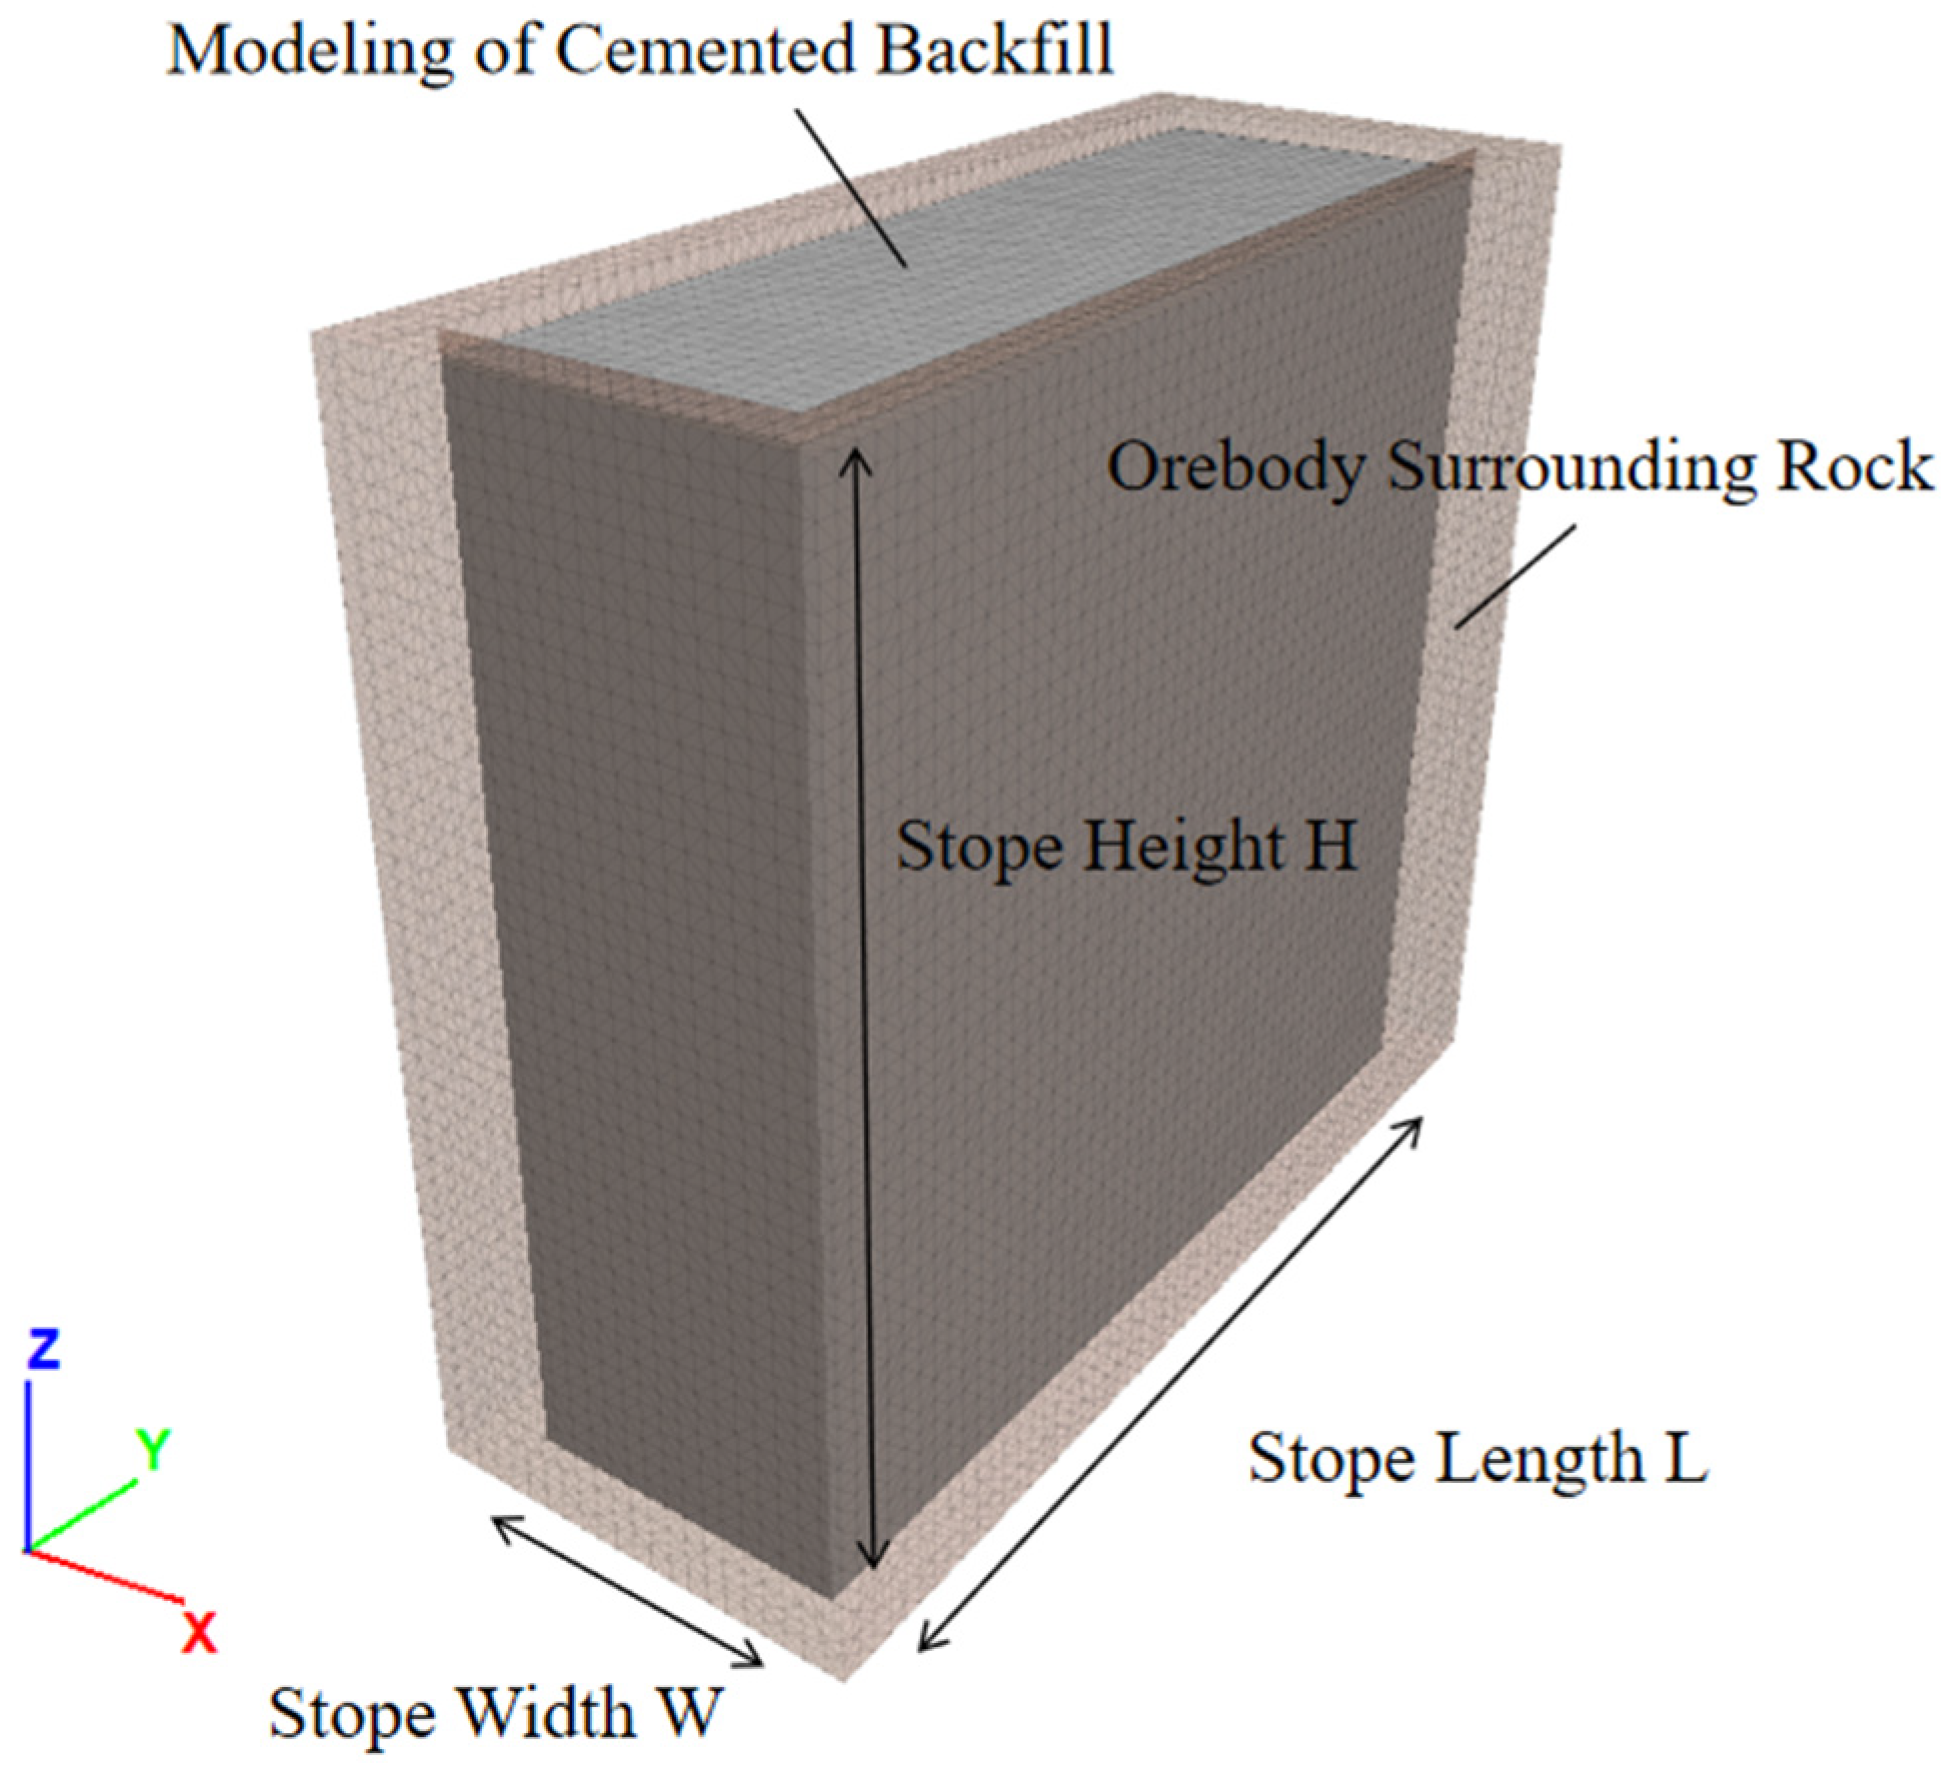
To explore in depth the stress distribution law of inclined filling bodies, with the aid of numerical simulation methods in this section, a systematic study was conducted on the arching effect at different inclinations. Numerical models of filling bodies with inclinations of 45°, 60°, 75°, and 90° were established. The backfill body maintained consistent dimensions (60 m in length, 16 m in width, and 40 m in height) across all analyzed inclination angles The surrounding rock mass was modeled with an excavation influence zone extending three times the backfill dimensions to ensure proper boundary effects. The numerical simulation followed a sequential procedure: (1) initial excavation of the ore body to establish the mining-induced stress field, followed by (2) backfill placement and subsequent stress analysis.
The vertical and horizontal stress distribution characteristics of these models were analyzed. Thus, it demonstrates the law that the change of inclination angle has an impact on the arching effect. The input parameters for the numerical simulation are consistent with those listed in Table 1 of Section 2.2.
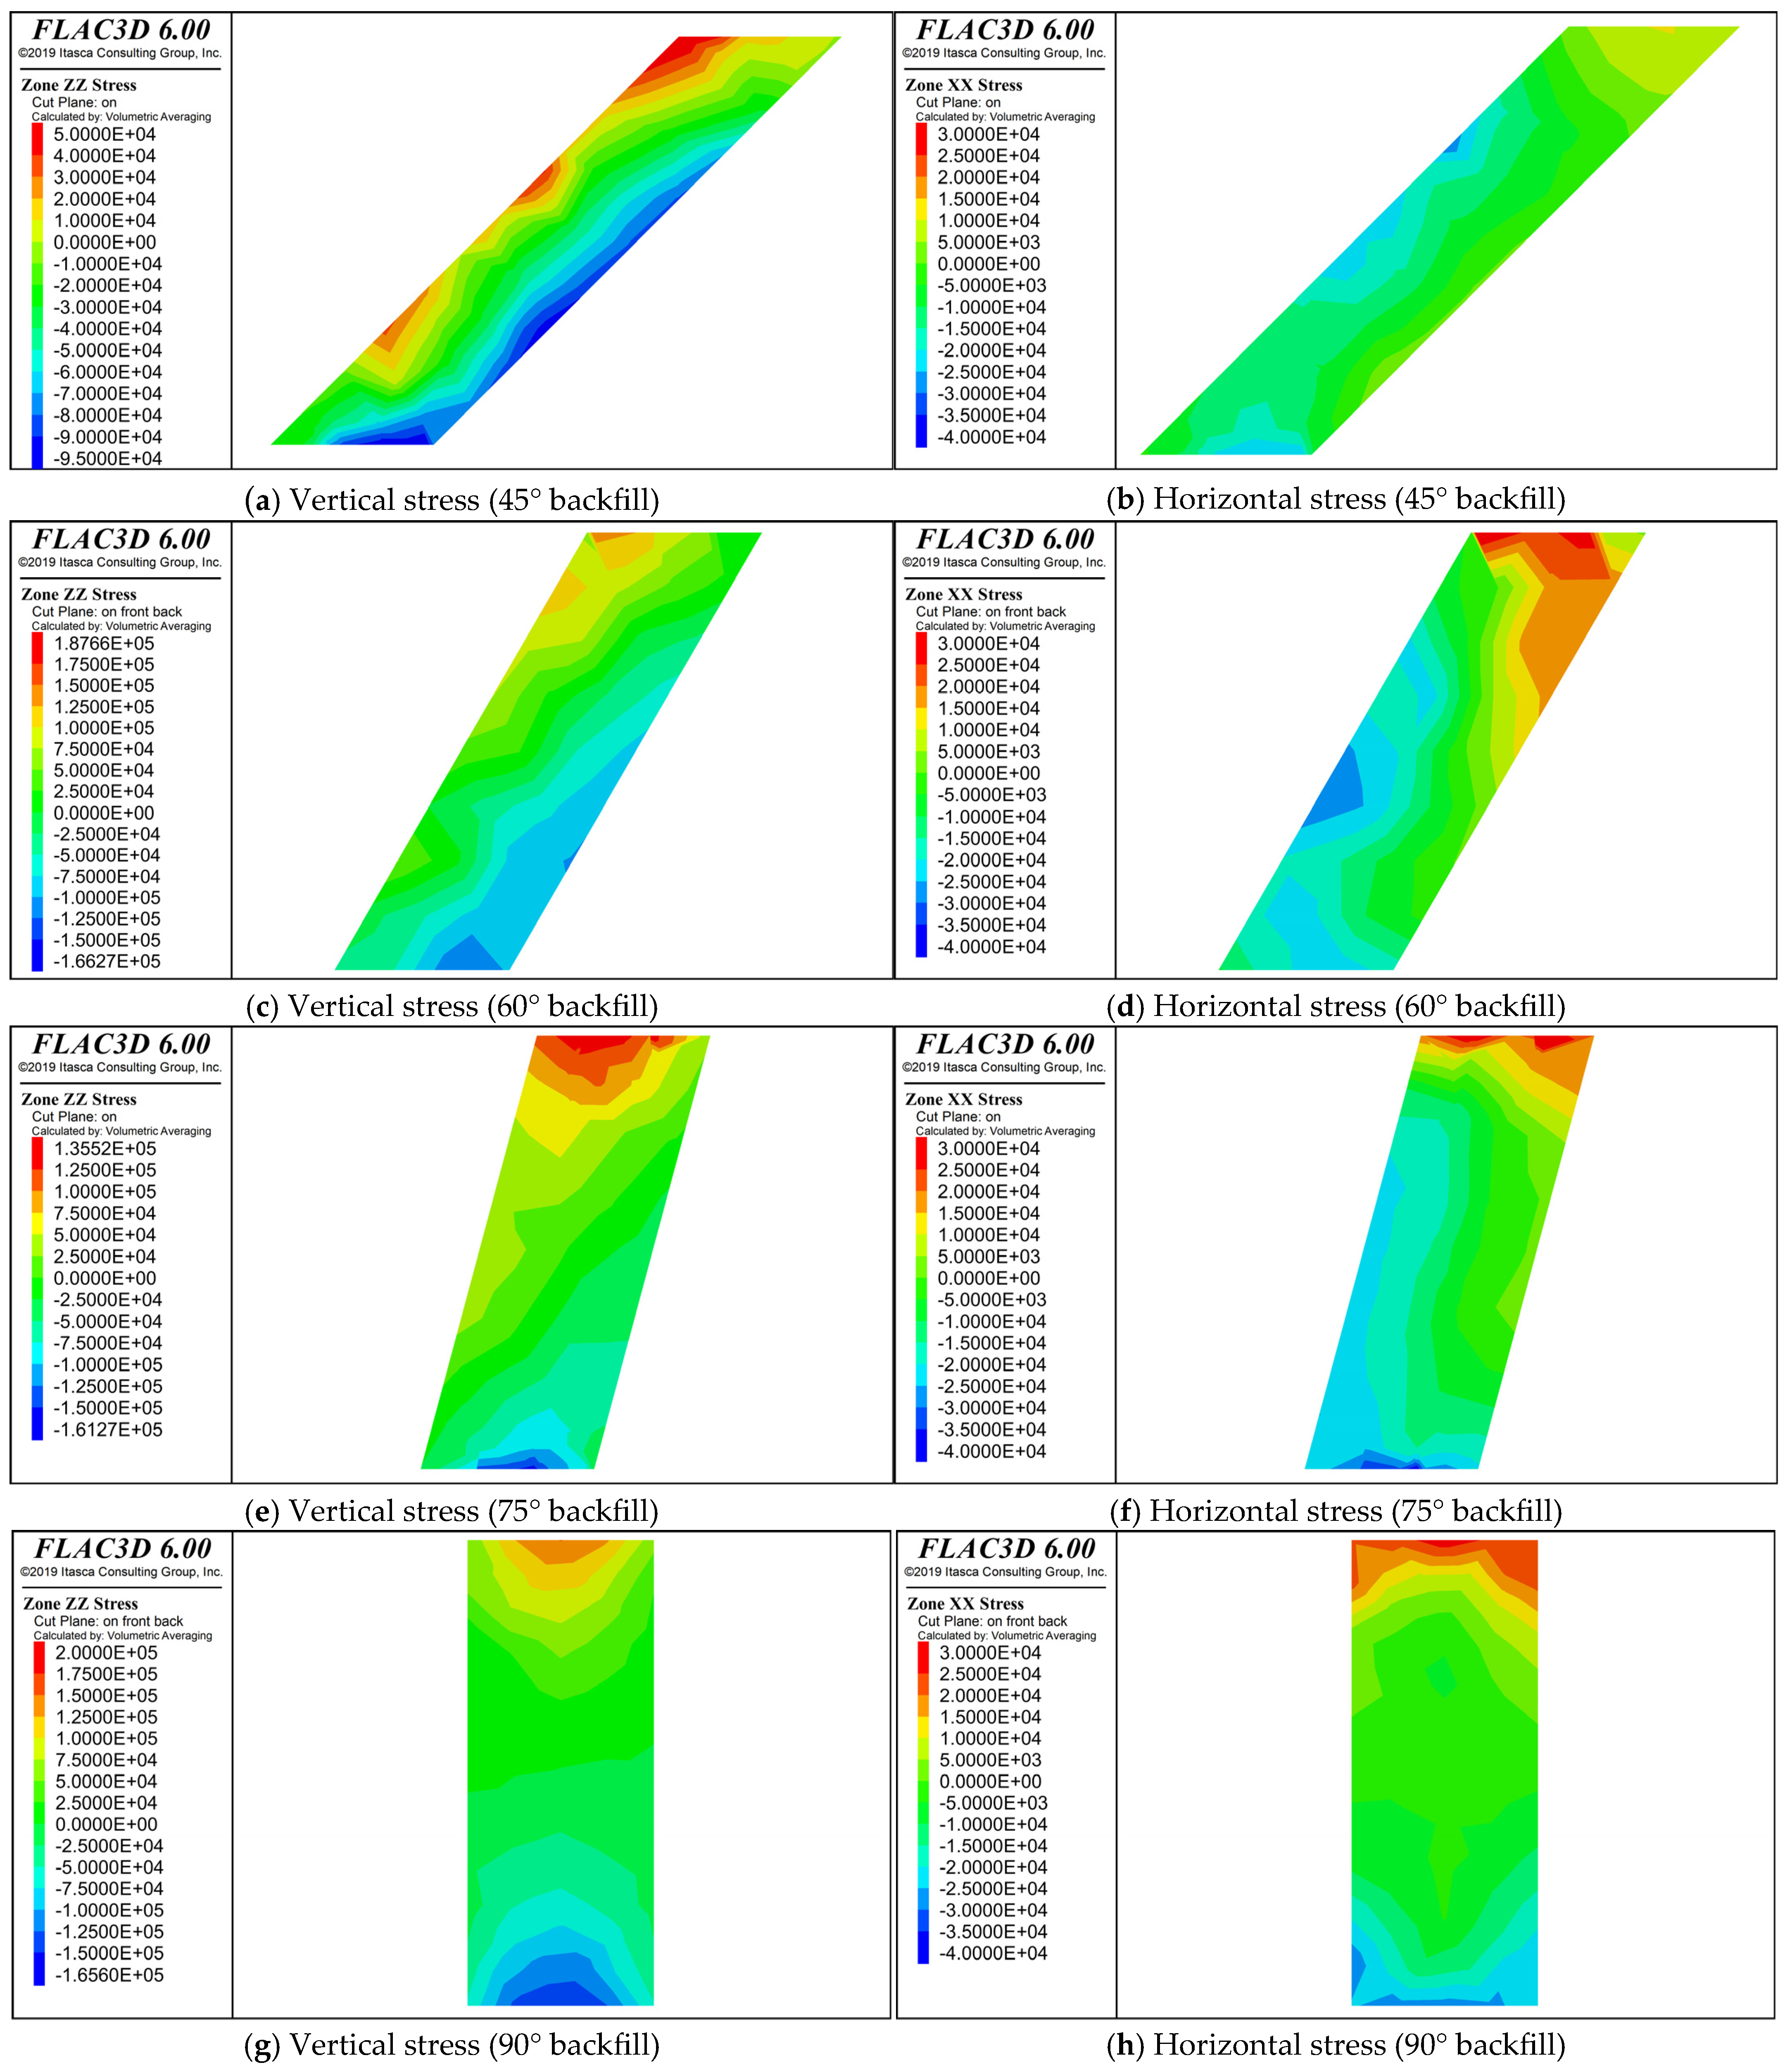
The stress profile obtained by numerical simulation and the comparison of stress values of the filling body at different inclination angles are shown in Figure 12 and Figure 13.
The numerical simulation results in Figure 12 clearly reveal the significant influence of the inclination angle variation of the filling body on the stress distribution. As the inclination angle of the filling body gradually increases from 45° to 60°, 75° and up to 90°, the stress field shows obvious redistribution characteristics: the compressive stress in the lower plate area gradually focuses on the bottom of the filling body, while the tensile stress in the upper plate area significantly migrates to the top. This evolutionary process indicates that the increase in the inclination angle will lead to two key effects: on the one hand, it will significantly intensify the stress concentration phenomenon at the bottom of the filling body; on the other hand, it will form an obvious tensile stress zone in the top area. This stress redistribution characteristic has an important influence on the stability of the filling body, especially under the condition of large inclination angle, the high stress concentration at the bottom and the tensile stress area at the top may become potential dangerous areas.
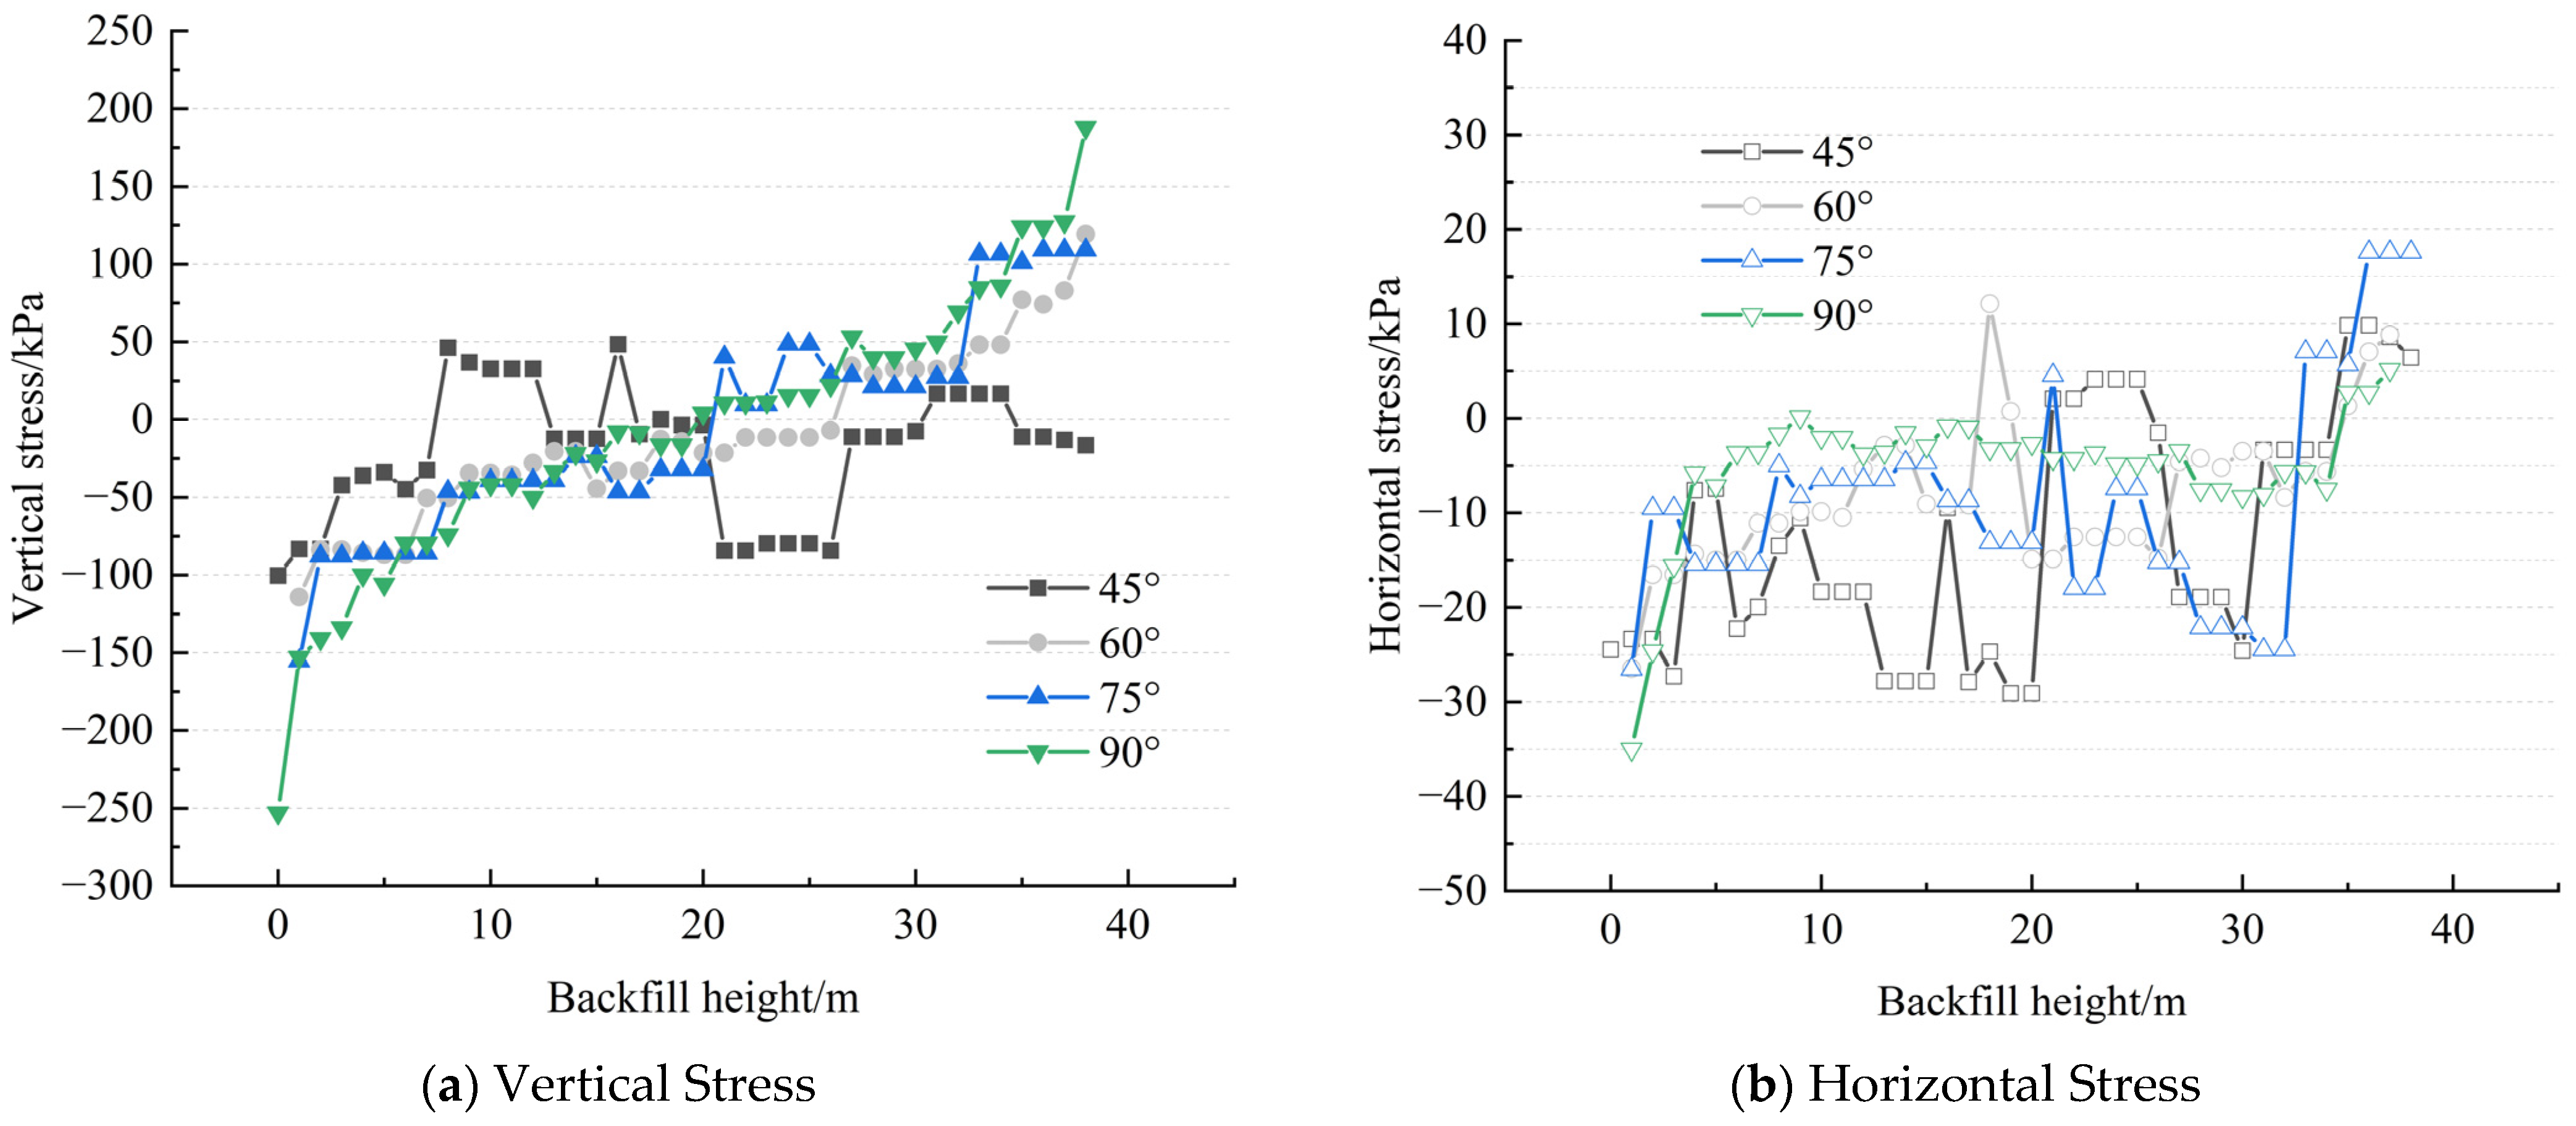
It can be seen from the stress comparison in Figure 13 that when the inclination angle of the filling body increases from 45° to 90°, there is an obvious regular change in the stress distribution at the center of the filling body. In terms of vertical stress data, when the inclination angles of the upper and lower plates of the filling body are 60°, 75°, and 90°, the filling body at a height of 20 m is subjected to compressive stress. However, when the height is greater than 20 m, the center of the filling body gradually changes from compressive stress to tensile stress. Near the height of 20 m, the vertical stress experienced by the filling body due to the arched effect is 0. When the inclination angle of the filling body is 45°, its trend is similar to that of a large inclination angle. Among them, sudden large tensile stress and compressive stress occur at heights of 10 m and 25 m on the image. The main reason is that the stress arch during the stress transfer process between the upper and lower plates affects the stress along the midline of the filling body.
As shown in Figure 13b, the data indicate that the horizontal stress changes gradually from the top to the bottom with the height position: the tensile stress gradually decreases. As the depth continuously descends, the tensile stress reduces to 0 at a certain position and transforms into compressive stress, which continuously increases to the peak. Subsequently, the compressive stress shows a trend of first decreasing and then increasing.
This phenomenon reveals that under the effect of the arching effect, there are areas within the filling body where both the vertical stress and the horizontal stress are zero. It further indicates that the arching effect can effectively transfer and share part of the load and reduce the overall stress level of the filling body. There is a phenomenon of stress concentration in the middle and upper parts of the filling body due to horizontal stress. Therefore, filling materials with better tensile strength should be adopted in the tensile area to prevent tensile failure of the filling body. In actual engineering, stress detection should focus on the bottom of the filling body and the pressure concentration area. The research results can provide a basis for stress monitoring points in actual engineering, offer references for the strength design and optimization of filling bodies, and help reduce the failure risk of mine filling bodies and improve economic benefits.

5. Conclusions

This study systematically investigated the stress distribution characteristics of backfill in complex geological environments using FLAC3D numerical simulations. The main research contents and conclusions are summarized as follows:
(1)
By comparing and analyzing the numerical simulation results with and without contact surface elements, the influence of contact surface elements on the stress distribution of the filling body was studied. The research found that the stress at the junction of the filling body and the surrounding rock after considering the contact surface element was greater than that in the model without adding the contact surface element, and the concentration phenomenon was more obvious. Its stress transmission path is more in line with the actual situation. The friction angle between the filling body and the surrounding rock plays a key role in the arching effect, revealing the necessity of adding the contact surface element in the numerical simulation process. In numerical simulation, the contact surface unit of the surrounding rock of the filling body should be added for simulation to obtain accurate results.
(2)
The influence laws of the parameters of the filling body and the characteristics of the contact surface on the stress distribution were systematically studied. In terms of material parameters: the stress within the filling body is negatively correlated with the friction angle, cohesion, friction angle of the contact surface, and the magnitude of the cohesion of the contact surface. The Poisson’s ratio is negatively and positively correlated with the vertical stress and horizontal stress of the filling body, respectively. The elastic modulus of the filling body has the lowest sensitivity to stress changes.
(3)
The influence mechanism of the inclination angle of the filling body on the stress distribution was explored in depth. The research results show that as the inclination angle of the filling body increases from 45° to 90°, its stress distribution presents obvious spatial reconstruction characteristics: the larger the angle between the upper and lower plates of the filling body, the greater is the transfer degree of the compressive and tensile stresses of the filling body to the positions of the bottom plate and top plate of the filling body. Moreover, there are areas within the filling body where the stress received is 0, and the horizontal stress is prone to stress concentration in the middle and upper sections of the filling body. Through systematic numerical simulation analysis in this study, the stress distribution characteristics of the filling body under different working conditions were revealed, providing a scientific basis for the stability evaluation and structural optimization design of the stope.
The current research mainly focused on the static filling condition, while in the actual mining process, the geometry of the stope and the stress environment will change dynamically with the advancement of mining. In the future, time-series simulations can be carried out to study the dynamic evolution law of the arching effect under multi-step mining conditions, especially to analyze the influence of repeated mining on the long-term stability of the filling body. In addition, the deep mining environment has complex conditions such as high in situ stress and high osmotic pressure. It is necessary to carry out the multi-field coupling analysis of “stress-seepage-damage” to study the differential manifestations of the arch effect under different occurrence environments, providing a more comprehensive theoretical basis for the filling design of deep mines. These research directions will help further improve the theoretical system of filling mining, promote the in-depth transformation of arching effect research results into engineering practice, and provide stronger technical support for the safe and efficient mining of mines.

Author Contributions

Conceptualization, W.W. and X.X.; methodology, W.W. and X.X.; software, W.W.; validation, W.W. and X.X.; formal analysis, W.W.; investigation, W.W.; resources, W.W. and X.X. data curation, W.W.; writing—original draft preparation, W.W.; writing—review and editing, X.X.; visualization, W.W.; supervision, X.X.; project administration, W.W. All authors have read and agreed to the published version of the manuscript.

Funding

This research received no external funding.

Institutional Review Board Statement

Not applicable.

Informed Consent Statement

Not applicable.

Data Availability Statement

The data presented in this study are available upon request from the corresponding author. If any researcher is in need of the data and codes, email: 225512090@csu.edu.cn.

Conflicts of Interest

The authors declare no conflicts of interest.

References

  1. Singh, K.H.; Hedley, D.G.F. Review of Fill Mining Technology in Canada. In Proceedings of the Conference on the Application of Rock Mechanics to Cut and Fill Mining, Luleå, Sweden, 1–3 June 1980; Institution of Mining and Metallurgy: London, UK, 1981; pp. 11–24. [Google Scholar]
  2. Fahey, M.; Helinski, M.; Fourie, A. Some aspects of the mechanics of arching in backfilled stopes. Can. Geotech. J. 2009, 46, 1322–1336. [Google Scholar] [CrossRef]
  3. Xu, H.; Apel, D.B.; Wang, J.; Wei, C.; Pourrahimian, Y. Investigation of backfilling step effects on stope stability. Mining 2021, 1, 155–166. [Google Scholar] [CrossRef]
  4. Xu, D.-M.; Zhan, C.-L.; Liu, H.-X.; Lin, H.-Z. A critical review on environmental implications, recycling strategies, and ecological remediation for mine tailings. Environ. Sci. Pollut. Res. 2019, 26, 35657–35669. [Google Scholar] [CrossRef]
  5. Araujo, F.S.; Taborda-Llano, I.; Nunes, E.B.; Santos, R.M. Recycling and reuse of mine tailings: A review of advancements and their implications. Geosciences 2022, 12, 319. [Google Scholar] [CrossRef]
  6. Edraki, M.; Baumgartl, T.; Manlapig, E.; Bradshaw, D.; Franks, D.M.; Moran, C.J. Designing mine tailings for better environmental, social and economic outcomes: A review of alternative approaches. J. Clean. Prod. 2014, 84, 411–420. [Google Scholar] [CrossRef]
  7. Yilmaz, E.; Koohestani, B.; Cao, S. Recent practices in mine tailings’ recycling and reuse. In Managing Mining and Minerals Processing Wastes; Elsevier: Amsterdam, The Netherlands, 2023; pp. 271–304. [Google Scholar]
  8. Wang, R. Numerical Analyses of the Stability and Geomechanical Behavior of Side-Exposed Backfill Associated with Closure of Rock Walls; Ecole Polytechnique: Montreal, QC, Canada, 2021. [Google Scholar]
  9. Hassani, F.; Mortazavi, A.; Shabani, M. An investigation of mechanisms involved in backfill-rock mass behaviour in narrow vein mining. J. S. Afr. Inst. Min. Metall. 2008, 108, 463–472. [Google Scholar]
  10. Xin, J.; Jiang, Q.; Gong, F.; Liu, L.; Liu, C.; Liu, Q.; Yang, Y.; Chen, P. Mechanical behaviors of backfill-rock composites: Physical shear test and back-analysis. J. Rock Mech. Geotech. Eng. 2024, 16, 807–827. [Google Scholar] [CrossRef]
  11. Wang, X.; Li, Z.; Guo, J.; Lu, C.; Jiang, H.; Mei, J. Experimental and numerical investigations on damage mechanical behaviors of surrounding rock-backfill composite under uniaxial compression. Constr. Build. Mater. 2024, 417, 135210. [Google Scholar] [CrossRef]
  12. Liu, N.; Cui, L.; Wang, Y. Analytical assessment of internal stress in cemented paste backfill. Adv. Mater. Sci. Eng. 2020, 2020, 6666548. [Google Scholar] [CrossRef]
  13. Xu, S.-Y.; Kannangara, K.P.M.; Taciroglu, E. Analysis of the stress distribution across a retaining wall backfill. Comput. Geotech. 2018, 103, 13–25. [Google Scholar] [CrossRef]
  14. Xu, C.; Chen, Q.; Luo, W.; Liang, L. Analytical solution for estimating the stress state in backfill considering patterns of stress distribution. Int. J. Geomech. 2019, 19, 04018189. [Google Scholar] [CrossRef]
  15. Doherty, J.P.; Hasan, A.; Suazo, G.H.; Fourie, A. Investigation of some controllable factors that impact the stress state in cemented paste backfill. Can. Geotech. J. 2015, 52, 1901–1912. [Google Scholar] [CrossRef]
  16. Rao, P.; Chen, Q.; Zhou, Y.; Nimbalkar, S.; Chiaro, G. Determination of active earth pressure on rigid retaining wall considering arching effect in cohesive backfill soil. Int. J. Geomech. 2016, 16, 04015082. [Google Scholar] [CrossRef]
  17. Yan, B.; Zhu, W.; Hou, C.; Guan, K. A three-dimensional analytical solution to the arching effect in inclined backfilled stopes. Geomech. Geoengin. 2019, 14, 136–147. [Google Scholar] [CrossRef]
  18. Zhao, X.; Fourie, A.; Qi, C.-c. An analytical solution for evaluating the safety of an exposed face in a paste backfill stope incorporating the arching phenomenon. Int. J. Miner. Metall. Mater. 2019, 26, 1206–1216. [Google Scholar] [CrossRef]
  19. Yan, B.X.; Zhu, W.C.; Hou, C.; Jia, H.W. Theoretical analysis and numerical simulation comparative study on stress distribution in backfill. J. Northeast. Univ. (Nat. Sci.) 2019, 40, 1773–1778. [Google Scholar]
  20. Vakili, A.; Albrecht, J.; Gibson, W. Mine-scale numerical modelling of longwall operations. In Proceedings of the 2010 Coal Operators’ Conference, Wollongong, Australia, 18–20 February 2010; University of Wollongong: Wollongong, Australia, 2010; pp. 115–124. [Google Scholar]
  21. Purvance, M.D.; Garza-Cruz, T. Using rigid block/FLAC3D coupling in mine-scale simulations. In Proceedings of the 5th International Itasca Symposium, Vienna, Austria, 17–20 February 2020. [Google Scholar]
  22. Hu, B.; Zhang, Q.; Li, S.; Yu, H.; Wang, X.; Wang, H. Application of numerical simulation methods in solving complex mining engineering problems in dingxi mine, China. Minerals 2022, 12, 123. [Google Scholar] [CrossRef]
  23. Pirapakaran, K.; Sivakugan, N. Arching within hydraulic fill stopes. Geotech. Geol. Eng. 2007, 25, 25–35. [Google Scholar] [CrossRef]
  24. Li, L.; Aubertin, M.; Belem, T. Formulation of a three dimensional analytical solution to evaluate stresses in backfilled vertical narrow openings. Can. Geotech. J. 2005, 42, 1705–1717. [Google Scholar] [CrossRef]
  25. Abbasi, B.; Russell, D.; Taghavi, R. FLAC3D Mesh and Zone Quality. In Continuum and Distinct Element Numerical Modeling in Geomechanics—2013; Zhu, H., Detournay, C., Hart, R., Nelson, J., Eds.; Itasca International Inc.: Minneapolis, MN, USA, 2013; p. 11-02. ISBN 978-0-9767577-3-3. [Google Scholar]
  26. Jing, L.; Hudson, J. Numerical methods in rock mechanics. Int. J. Rock Mech. Min. Sci. 2002, 39, 409–427. [Google Scholar] [CrossRef]
  27. Kucewicz, M.; Baranowski, P.; Małachowski, J. Determination and validation of Karagozian-Case Concrete constitutive model parameters for numerical modeling of dolomite rock. Int. J. Rock Mech. Min. Sci. 2020, 129, 104302. [Google Scholar] [CrossRef]
  28. Zhao, W.; Wu, S.-C.; Gao, Y.-T.; Zhou, Y.; Xiao, S. Numerical modeling and mechanical parameters determination of jointed rock mass. Chin. J. Eng. 2015, 37, 1542–1549. [Google Scholar]
  29. Sakhno, I.G.; Molodetskyi, A.V.; Sakhno, S.V. Identification of Material Parameters for Numerical Simulation of the Behavior of Rocks Under True Triaxial Conditions. Sci. Bull. Natl. Min. Univ. 2018, 5, 48–53. [Google Scholar] [CrossRef]
  30. Palmstrøm, A. Characterizing rock masses by the RMi for use in practical rock engineering: Part 1: The development of the Rock Mass index (RMi). Tunn. Undergr. Space Technol. 1996, 11, 175–188. [Google Scholar] [CrossRef]
  31. Zhang, Z.R.; Yang, Y.S.; Zhao, X.Y.; Sheng, Q.; Zhu, Z.Q. Empirical methods for determining deformation parameters of rock masses. Chin. J. Rock Mech. Eng. 2016, 35, 3195–3202. [Google Scholar] [CrossRef]
  32. Rodríguez-Losada, J.; Hernández-Gutiérrez, L.; Olalla, C.; Perucho, A.; Serrano, A.; Eff-Darwich, A. Geomechanical parameters of intact rocks and rock masses from the Canary Islands: Implications on their flank stability. J. Volcanol. Geotherm. Res. 2009, 182, 67–75. [Google Scholar] [CrossRef]
  33. Fan, C.; Yang, P.; Li, L.; Wang, R.; Liu, G.; Yang, X.; Song, W.; Guo, L. Poisson’s ratio of granular materials for Mohr-Coulomb elastoplastic model. Int. J. Min. Reclam. Environ. 2023, 37, 780–804. [Google Scholar] [CrossRef]
  34. Yu, X.; Kemeny, J.; Tan, Y.; Song, W.; Huang, K. Mechanical properties and fracturing of rock-backfill composite specimens under triaxial compression. Constr. Build. Mater. 2021, 304, 124577. [Google Scholar] [CrossRef]
  35. Yin, S.; Wu, A.; Hu, K.; Wang, Y.; Zhang, Y. The effect of solid components on the rheological and mechanical properties of cemented paste backfill. Miner. Eng. 2012, 35, 61–66. [Google Scholar] [CrossRef]
  36. Liu, G.; Li, L.; Yang, X.; Guo, L. Numerical analysis of stress distribution in backfilled stopes considering interfaces between the backfill and rock walls. Int. J. Geomech. 2017, 17, 06016014. [Google Scholar] [CrossRef]
Figure 1. Indoor physical measurement model.
Applsci 15 05649 g001
Figure 2. Vertical stress comparison diagram.
Applsci 15 05649 g002
Figure 3. Numerical simulation schematic of subsequent backfilled stope.
Applsci 15 05649 g003
Figure 4. Backfill-surrounding rock interface element model.
Applsci 15 05649 g004
Figure 5. Comparative analysis of numerical models with and without interface elements.
Applsci 15 05649 g005
Figure 6. Comparative analysis of the influence of internal friction angle on backfill stress distribution.
Applsci 15 05649 g006
Figure 7. Comparative analysis of the influence of cohesion on backfill stress distribution.
Applsci 15 05649 g007
Figure 8. Comparative analysis of the influence of backfill elastic modulus on stress.
Applsci 15 05649 g008
Figure 9. Comparative analysis of the influence of backfill Poisson’s ratio on stress.
Applsci 15 05649 g009
Figure 10. Comparative analysis of the influence of interface element friction angle on stress.
Applsci 15 05649 g010
Figure 11. Comparative analysis of the influence of interface element cohesion on stress distribution.
Applsci 15 05649 g011
Figure 12. Simulation profile of inclined backfill.
Applsci 15 05649 g012
Figure 13. Stress comparison for varied backfill inclinations.
Applsci 15 05649 g013
Table 1. Mechanical parameters of materials used in numerical simulation tests.
Material TypeDensity ρ (kg/m3)Elastic Modulus E (GPa)Poisson’s Ratio μInternal Friction Angle φ (°)Cohesion c (MPa)Tension Strength (MPa)Shear Modulus (GPa)
Copper-bearing Ore Body397034.350.25345.073.693.0613.71
Cemented Backfill18300.5730.2035.70.5460.40.24
Table 2. Combined parameterization scheme for evaluating backfill stress response to material properties and interface elements.
Scheme φ (°) c (kPa) E (MPa) μ δ (°) c k (kPa)
1VAR05730.2250
235.70VAR5730.2250
335.700VAR0.2250
435.700573VAR250
535.7005730.2VAR0
635.702005730.225VAR
Table 3. Glossary of key parameters in FLAC3D numerical simulation of backfill structures.
ParameterSymbolUnitDefinition
Internal Friction Angleφ°The angle representing the shear resistance of the backfill material due to interparticle friction.
CohesioncMPaThe inherent shear strength of the backfill when no normal stress is applied.
Elastic ModulusEGPaMeasures the stiffness of the backfill material under elastic deformation.
Poisson’s Ratioμ Ratio of transverse strain to axial strain when a material is subjected to uniaxial tension or compression.
Interface Friction Angleδ°The friction angle at the contact between backfill and surrounding rock.
Interface CohesionckMPaThe bonding strength at the backfill–rock interface.
Normal StiffnessknGPa/mResistance of the interface to compression/separation.
Shear StiffnessksGPa/mResistance of the interface to tangential sliding.
Disclaimer/Publisher’s Note: The statements, opinions and data contained in all publications are solely those of the individual author(s) and contributor(s) and not of MDPI and/or the editor(s). MDPI and/or the editor(s) disclaim responsibility for any injury to people or property resulting from any ideas, methods, instructions or products referred to in the content.

