
A Cement Bond Quality Prediction Method Based on a Wide and Deep Neural Network Incorporating Embedded Domain Knowledge


Abstract
1. Introduction
2. Methodology
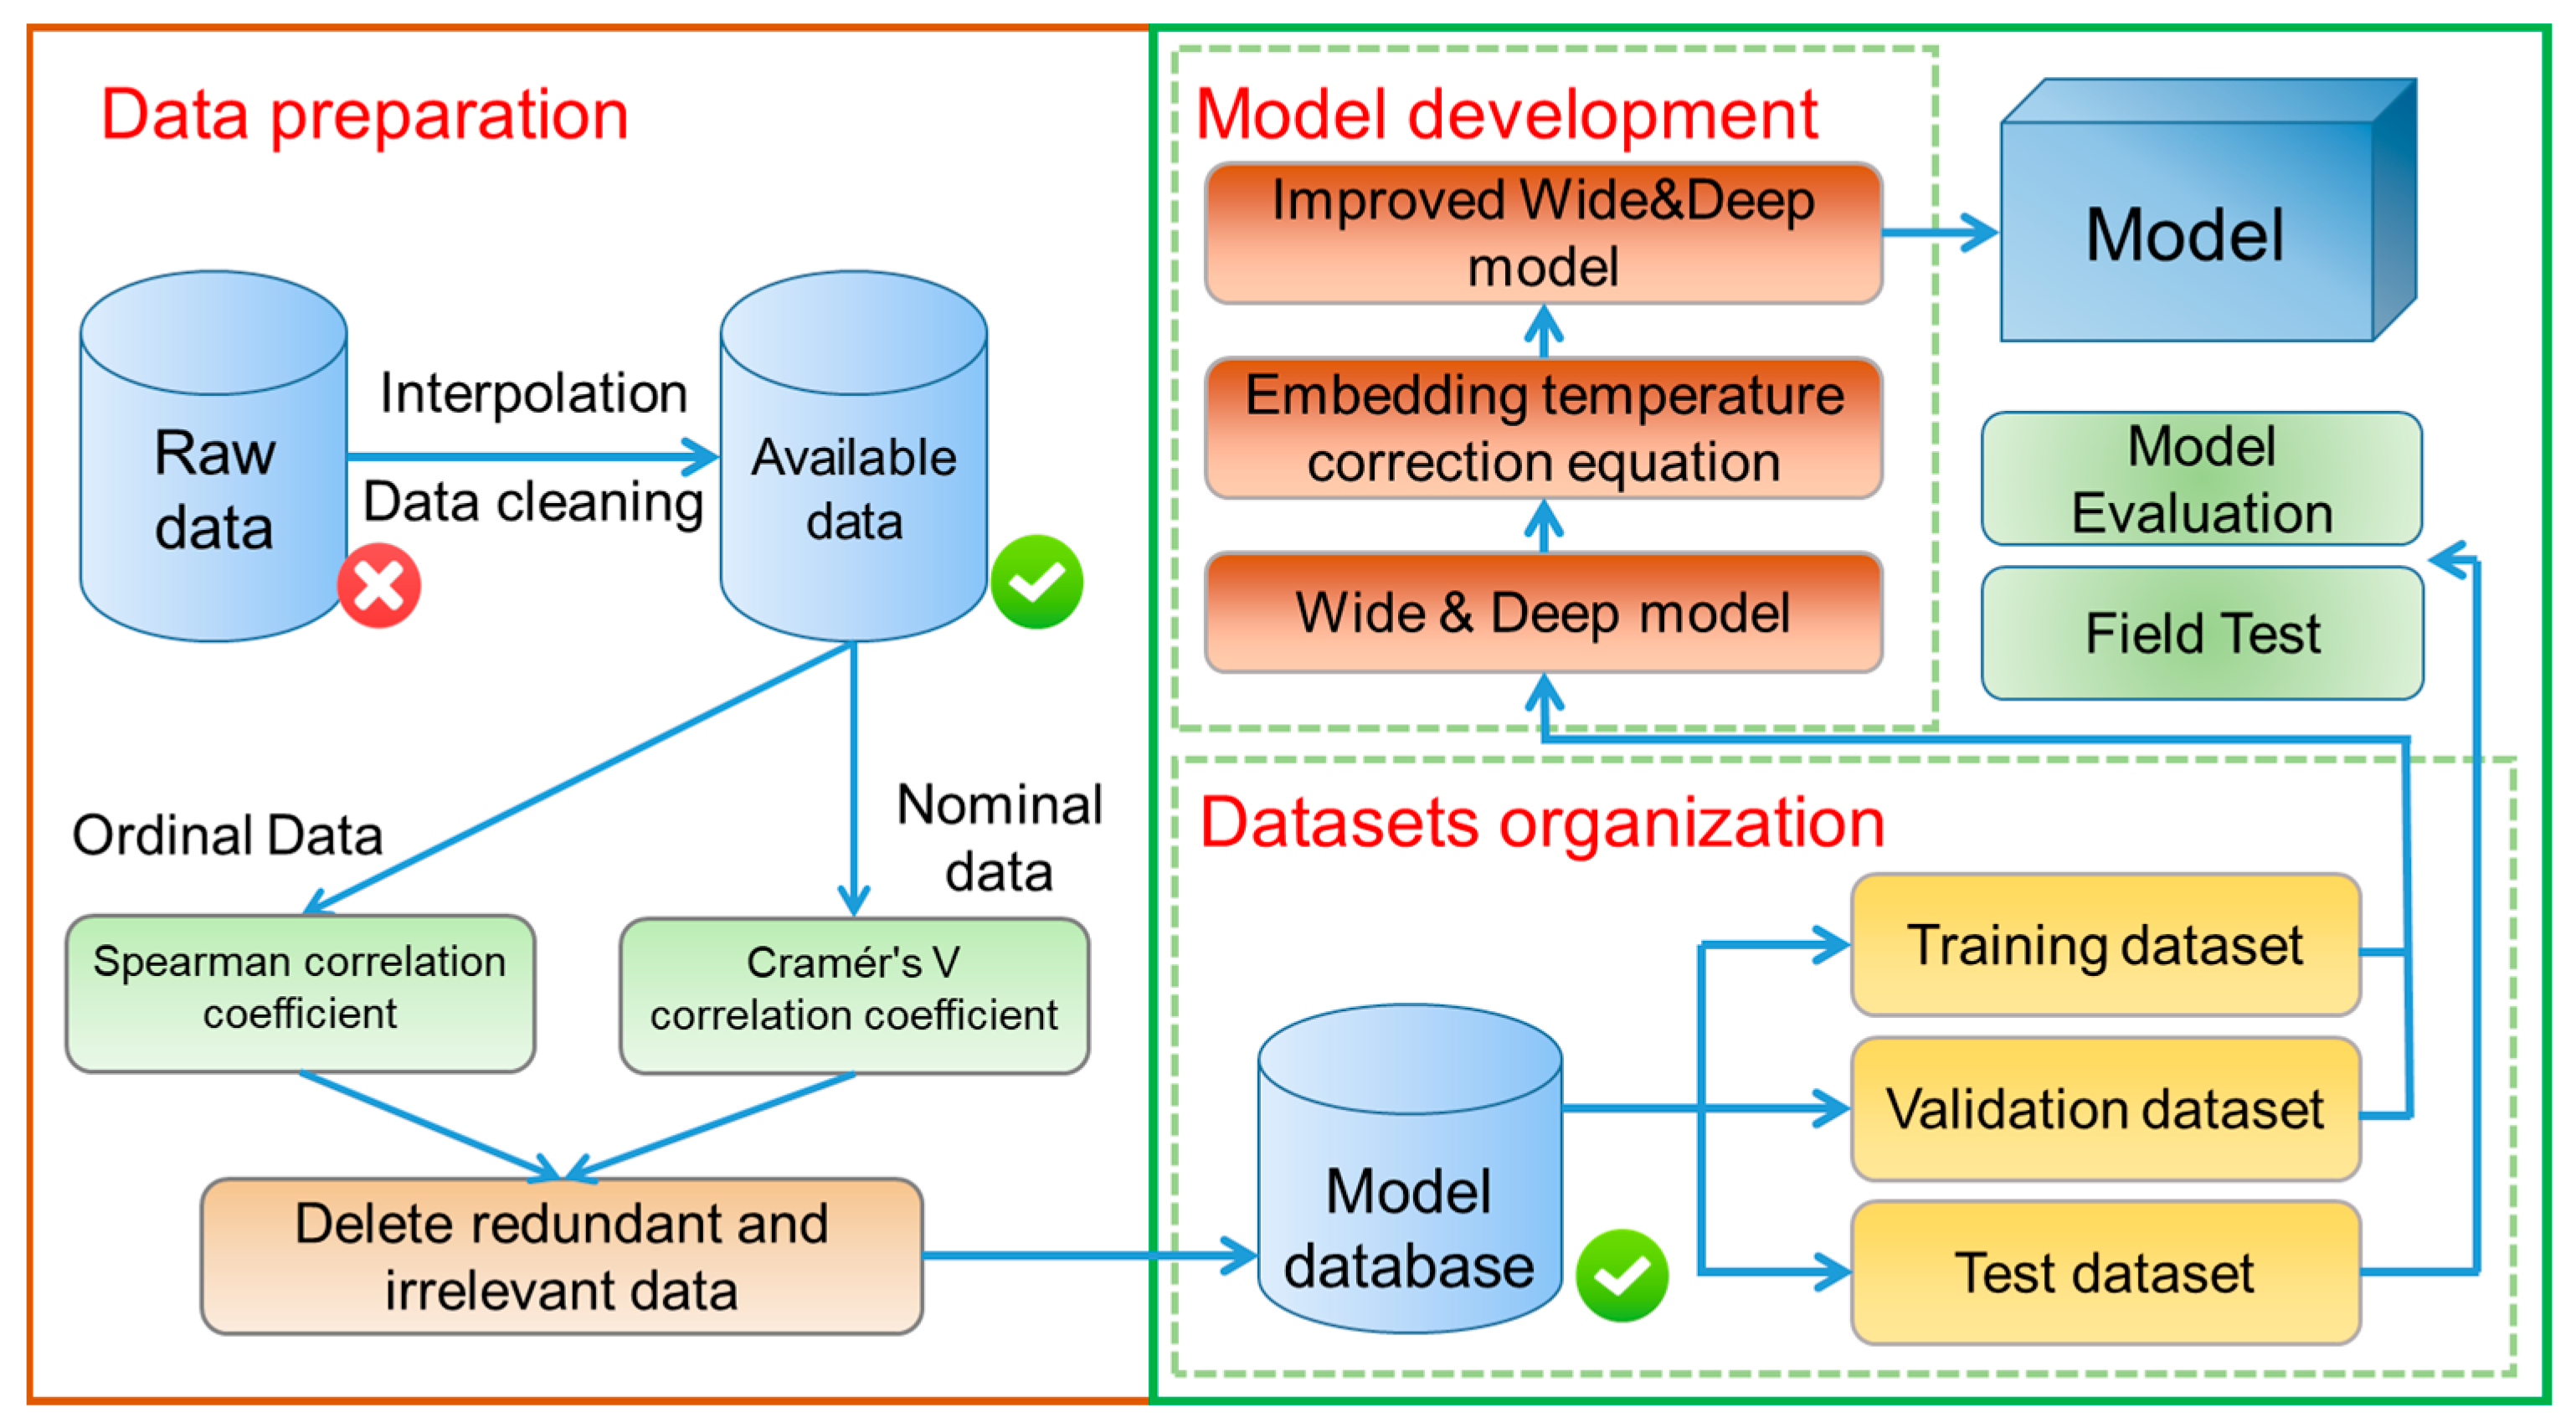
2.1. Data Organization
2.2. Data Preprocessing
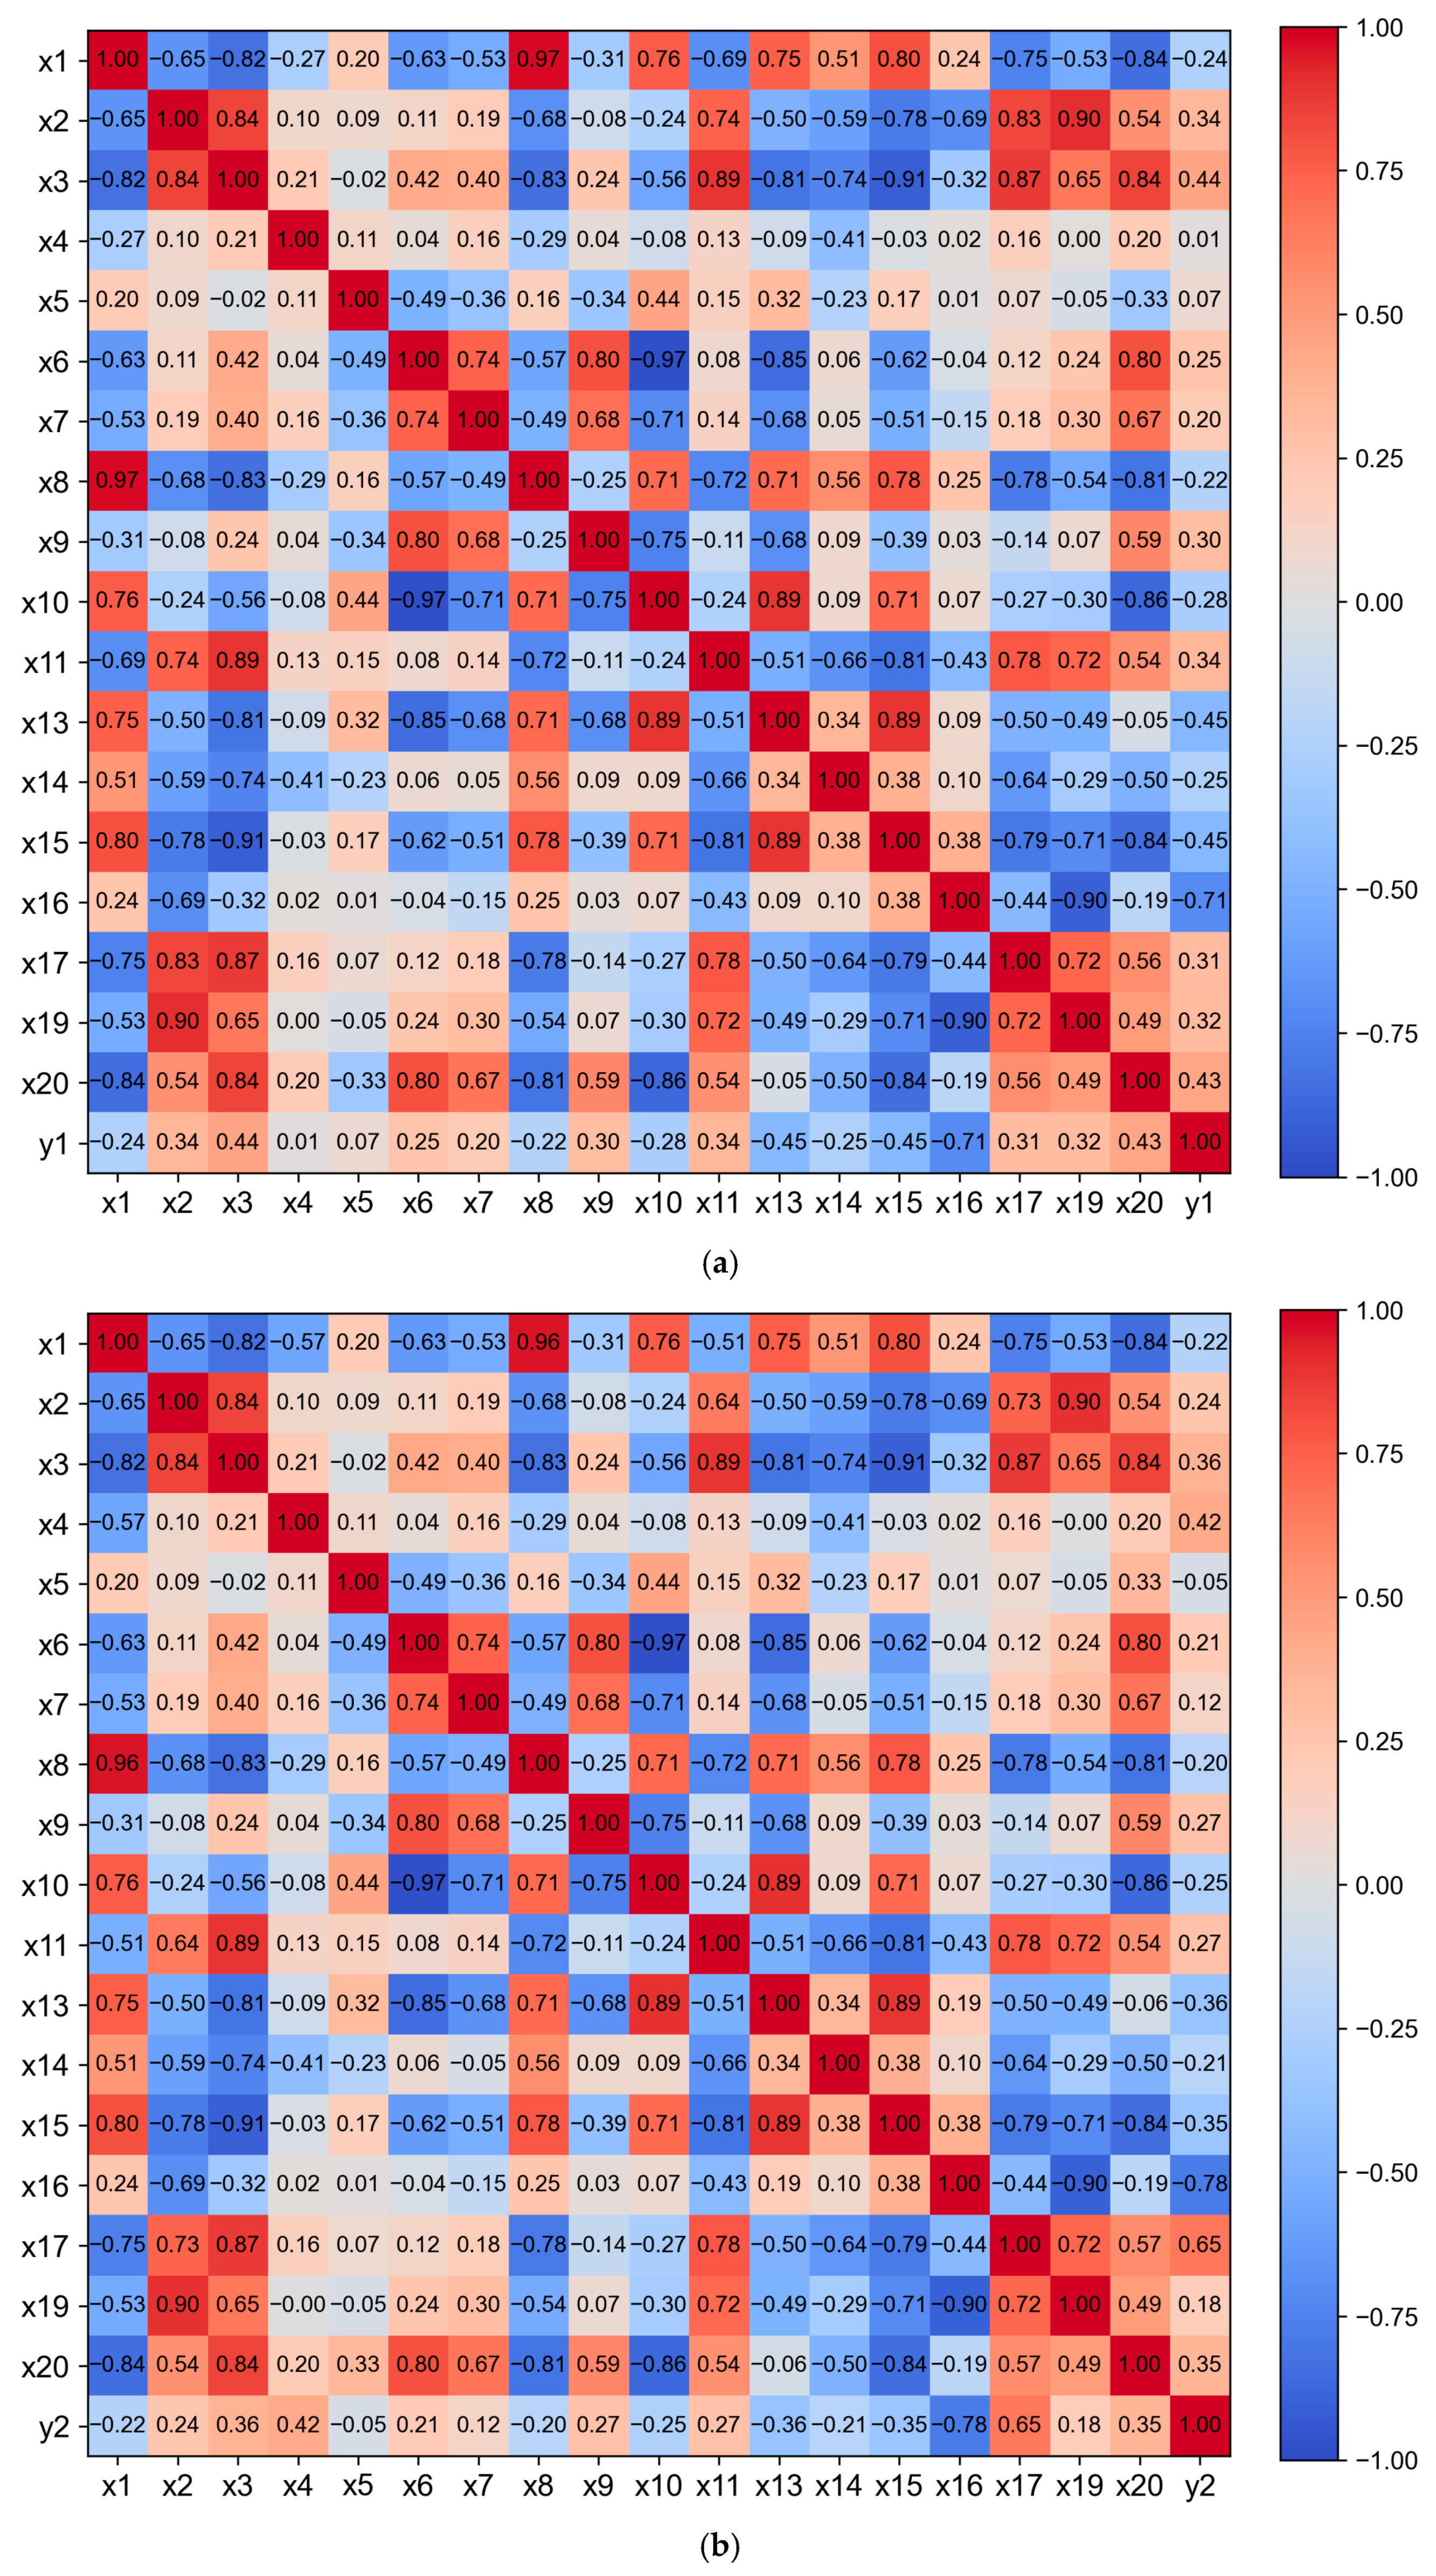
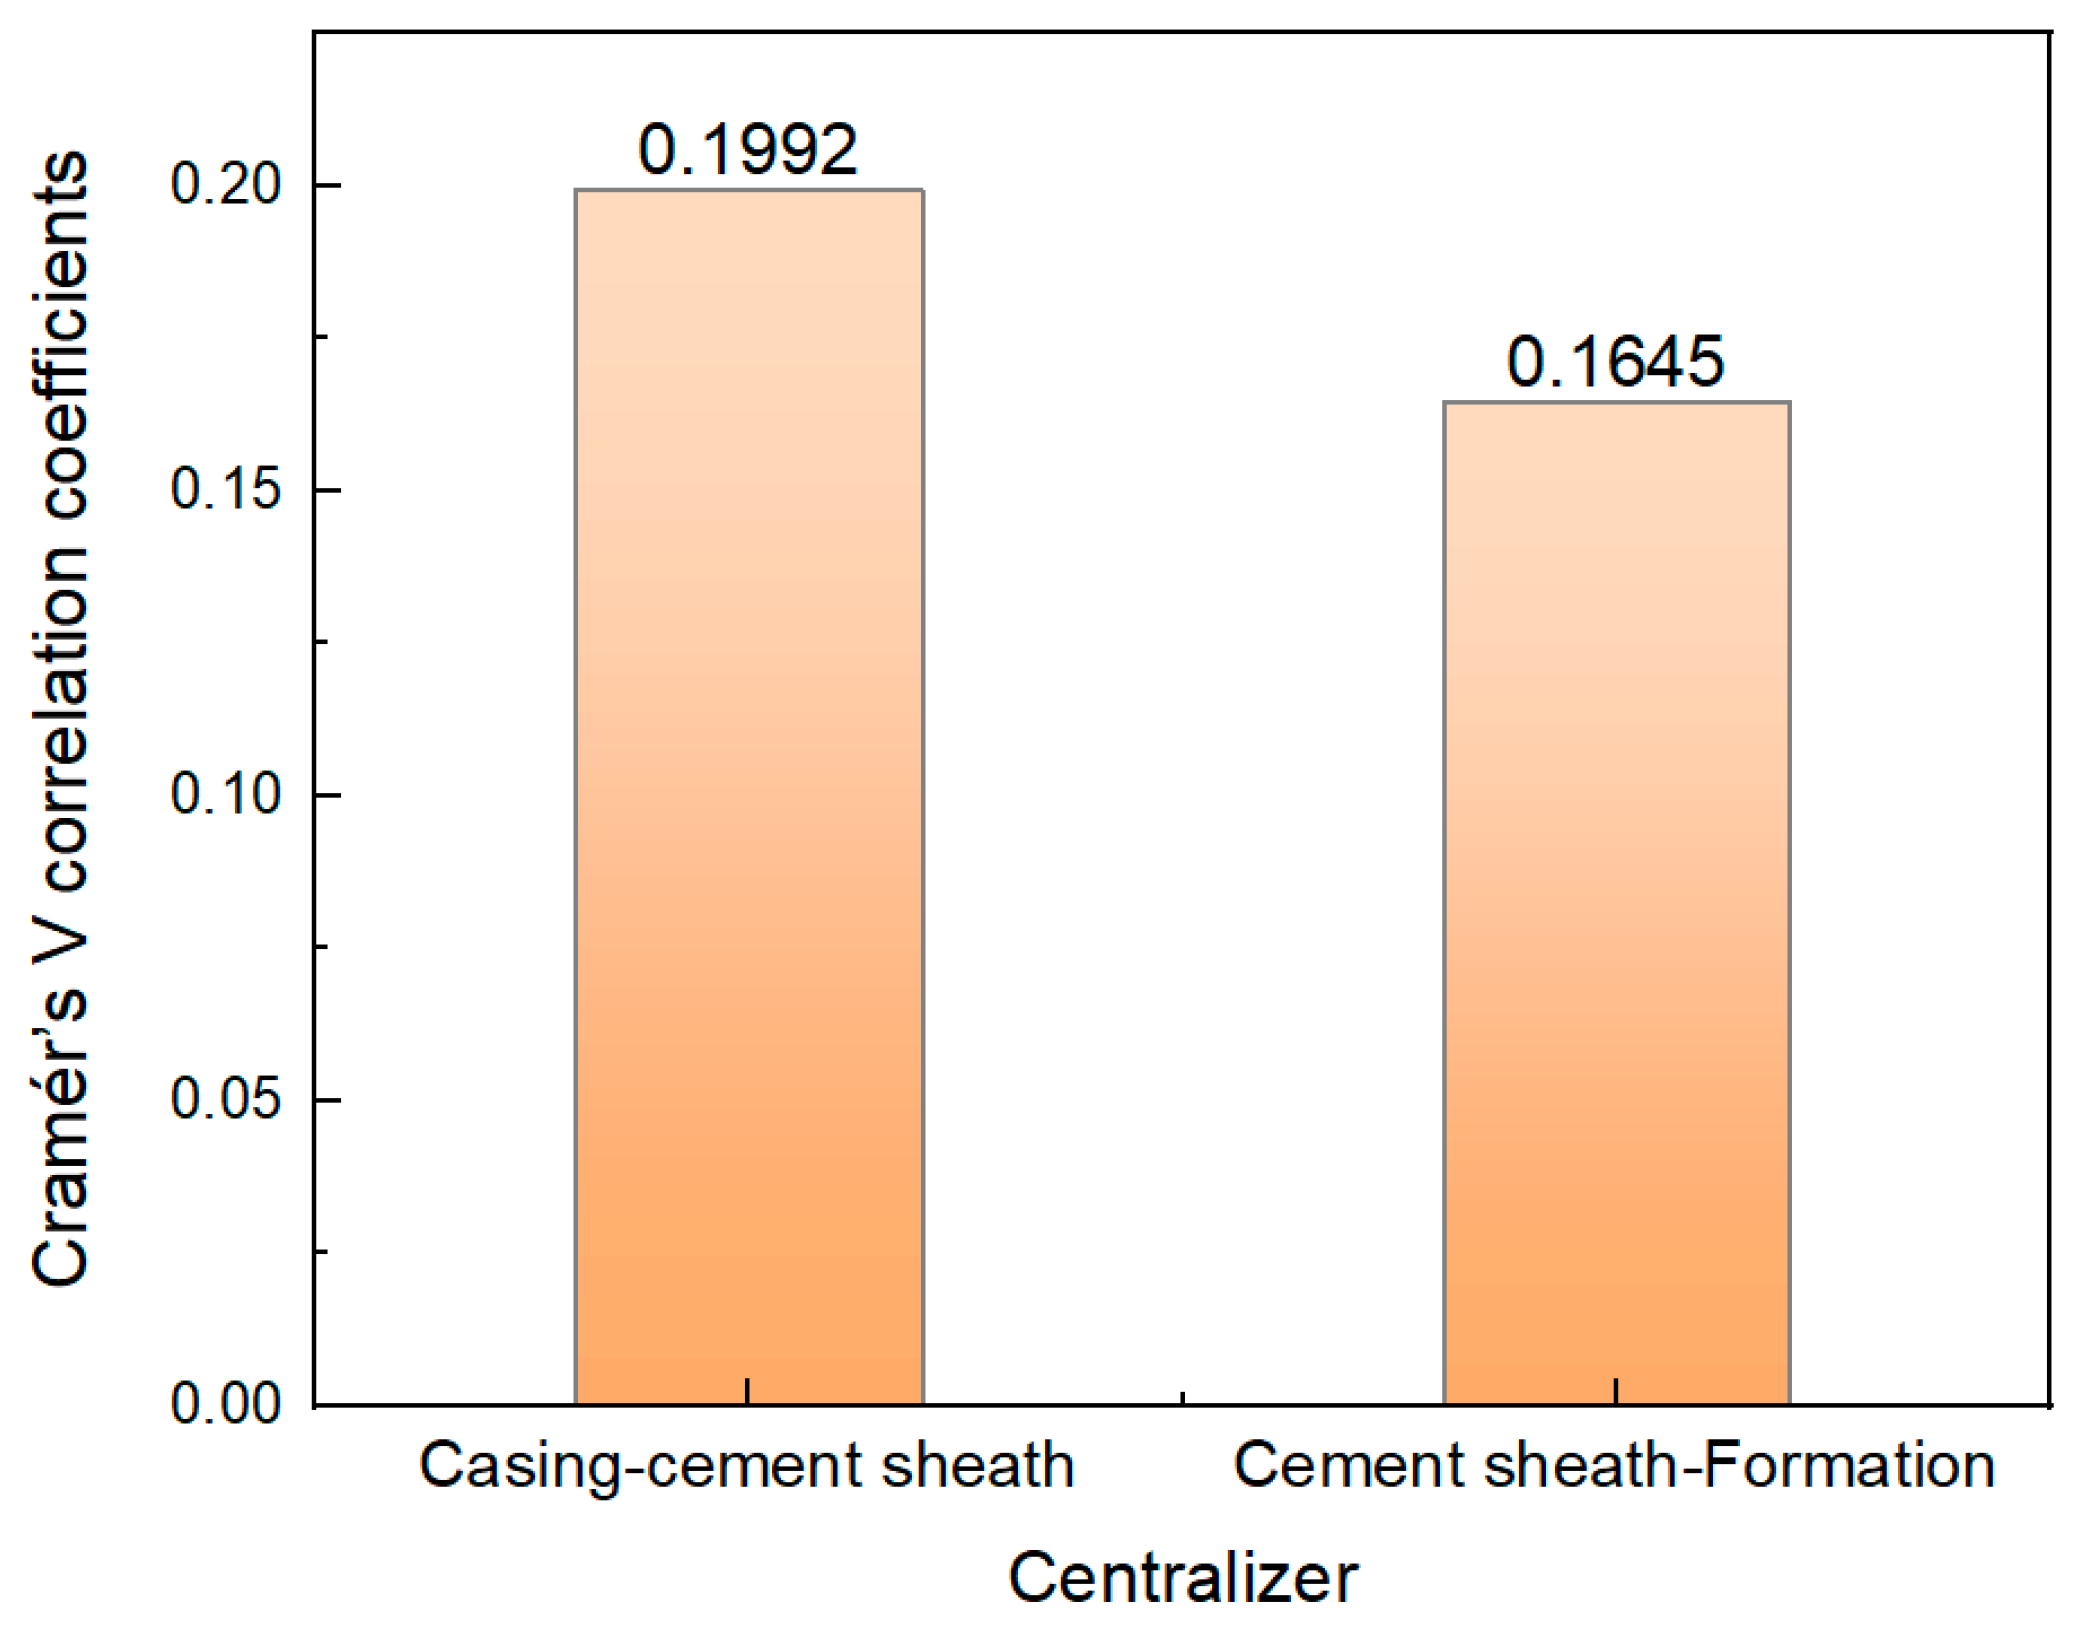
2.3. Feature Selection
2.4. Data Normalization
3. Model Development and Evaluation
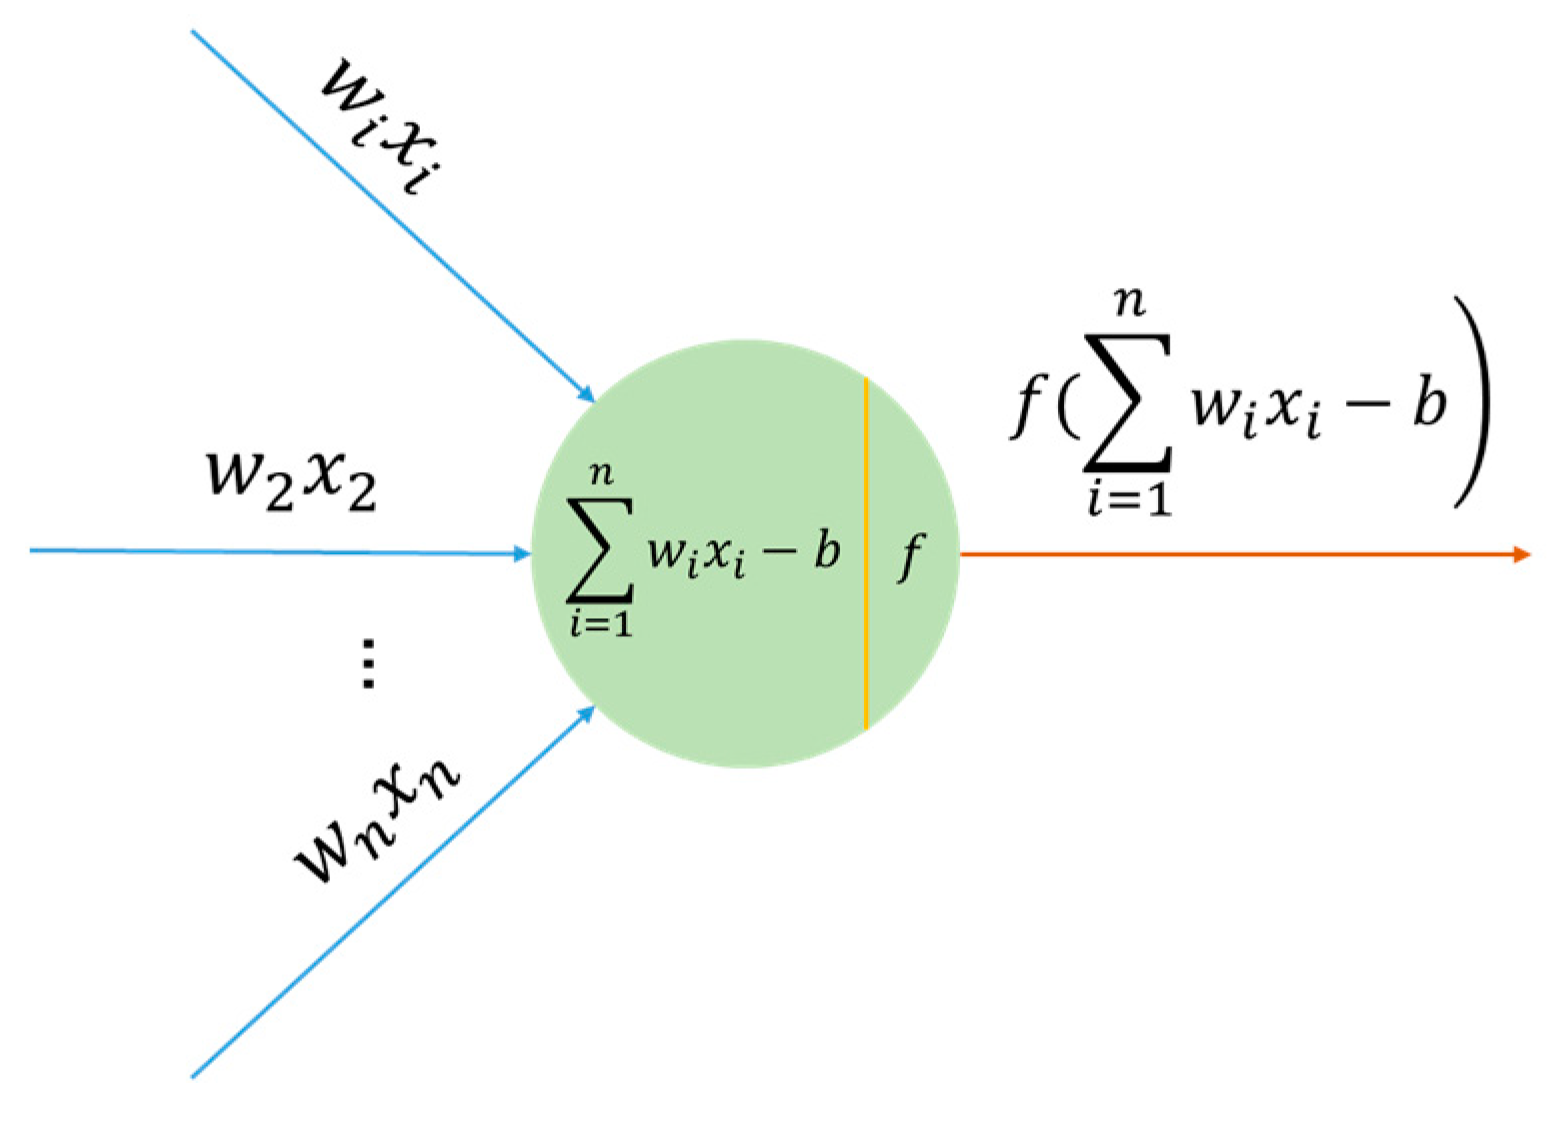
3.1. Principles of Neural Networks
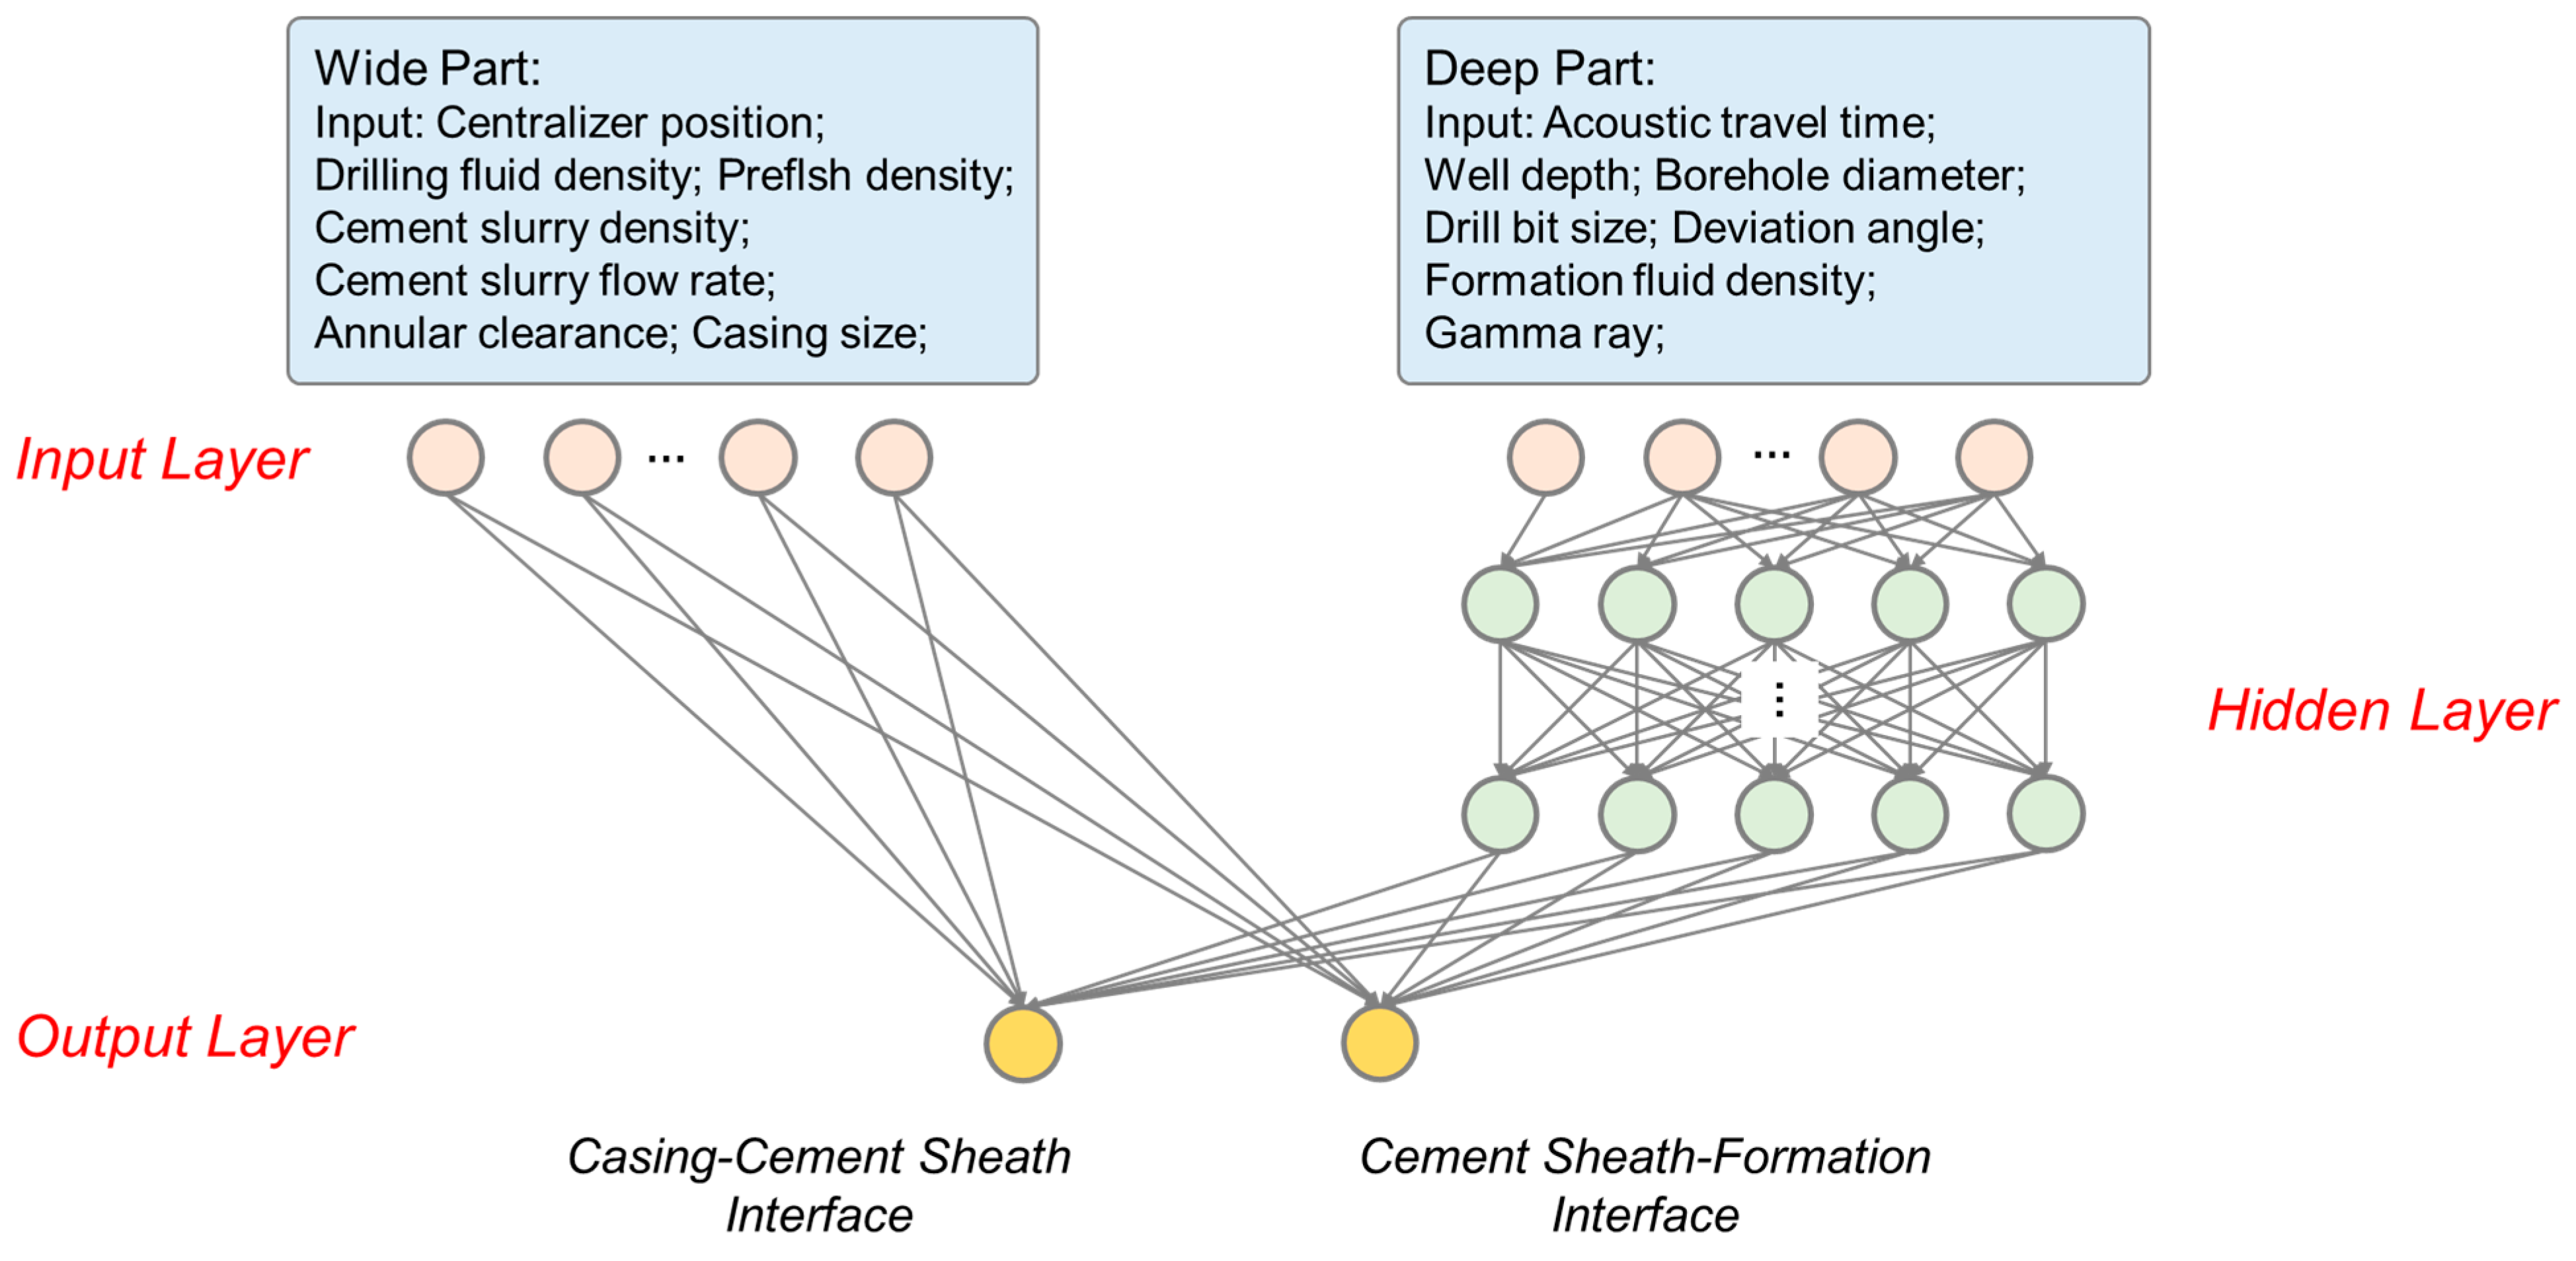
3.2. Model Development
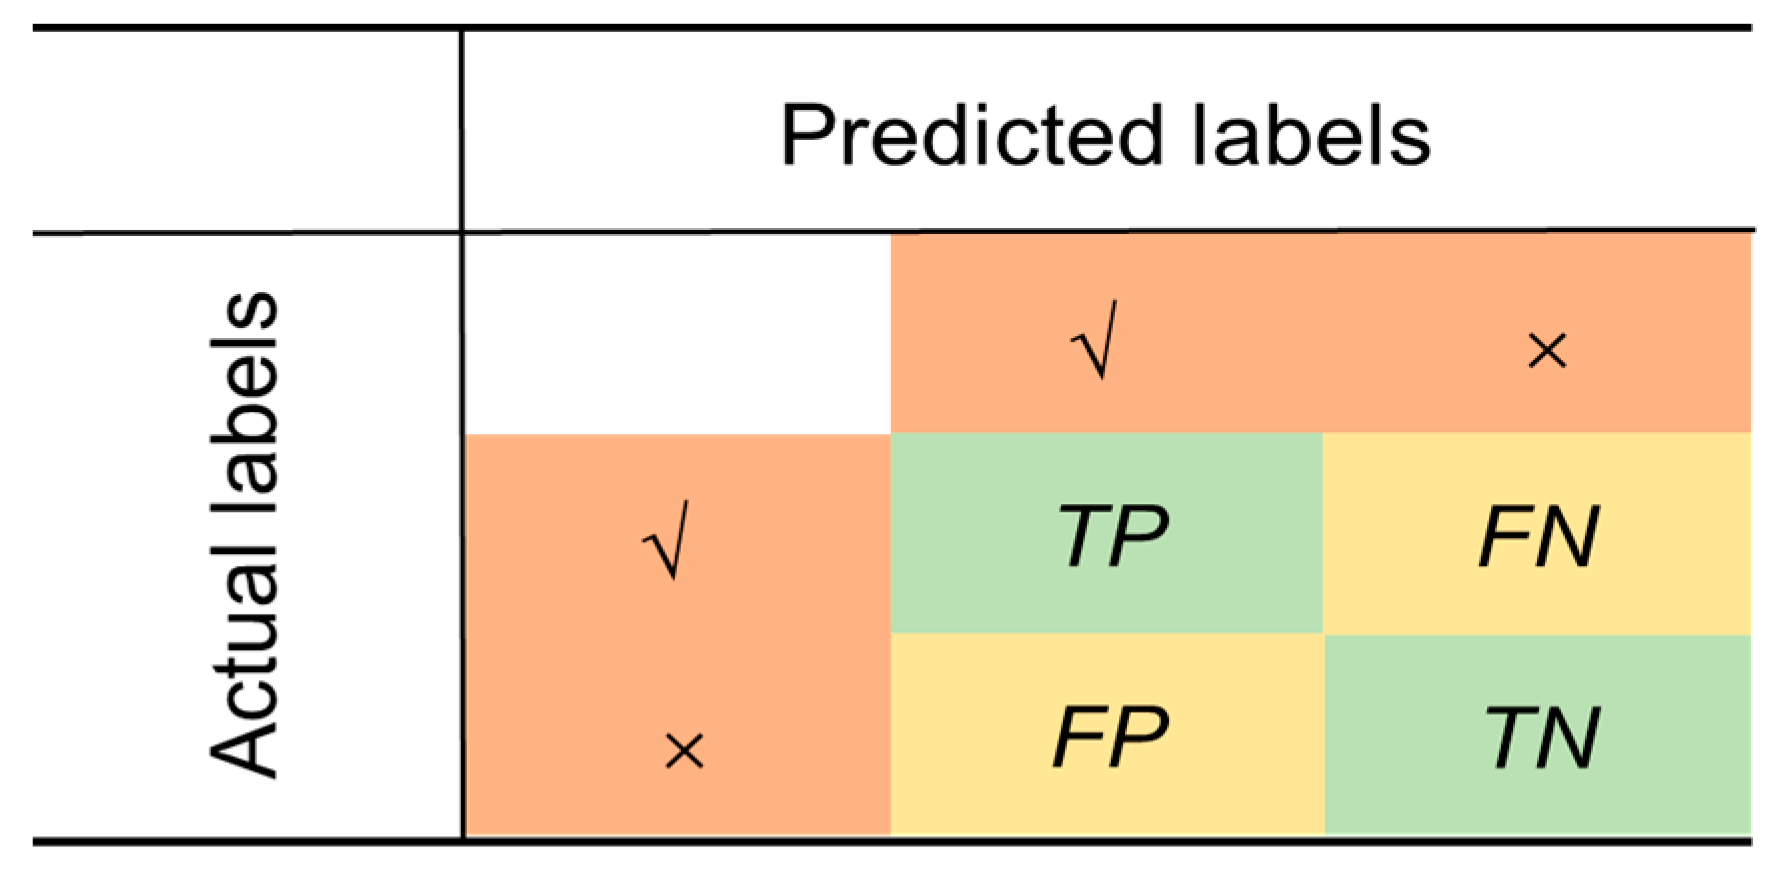
3.3. Model Evaluation Method
4. Result
4.1. Wide and Deep Neural Network
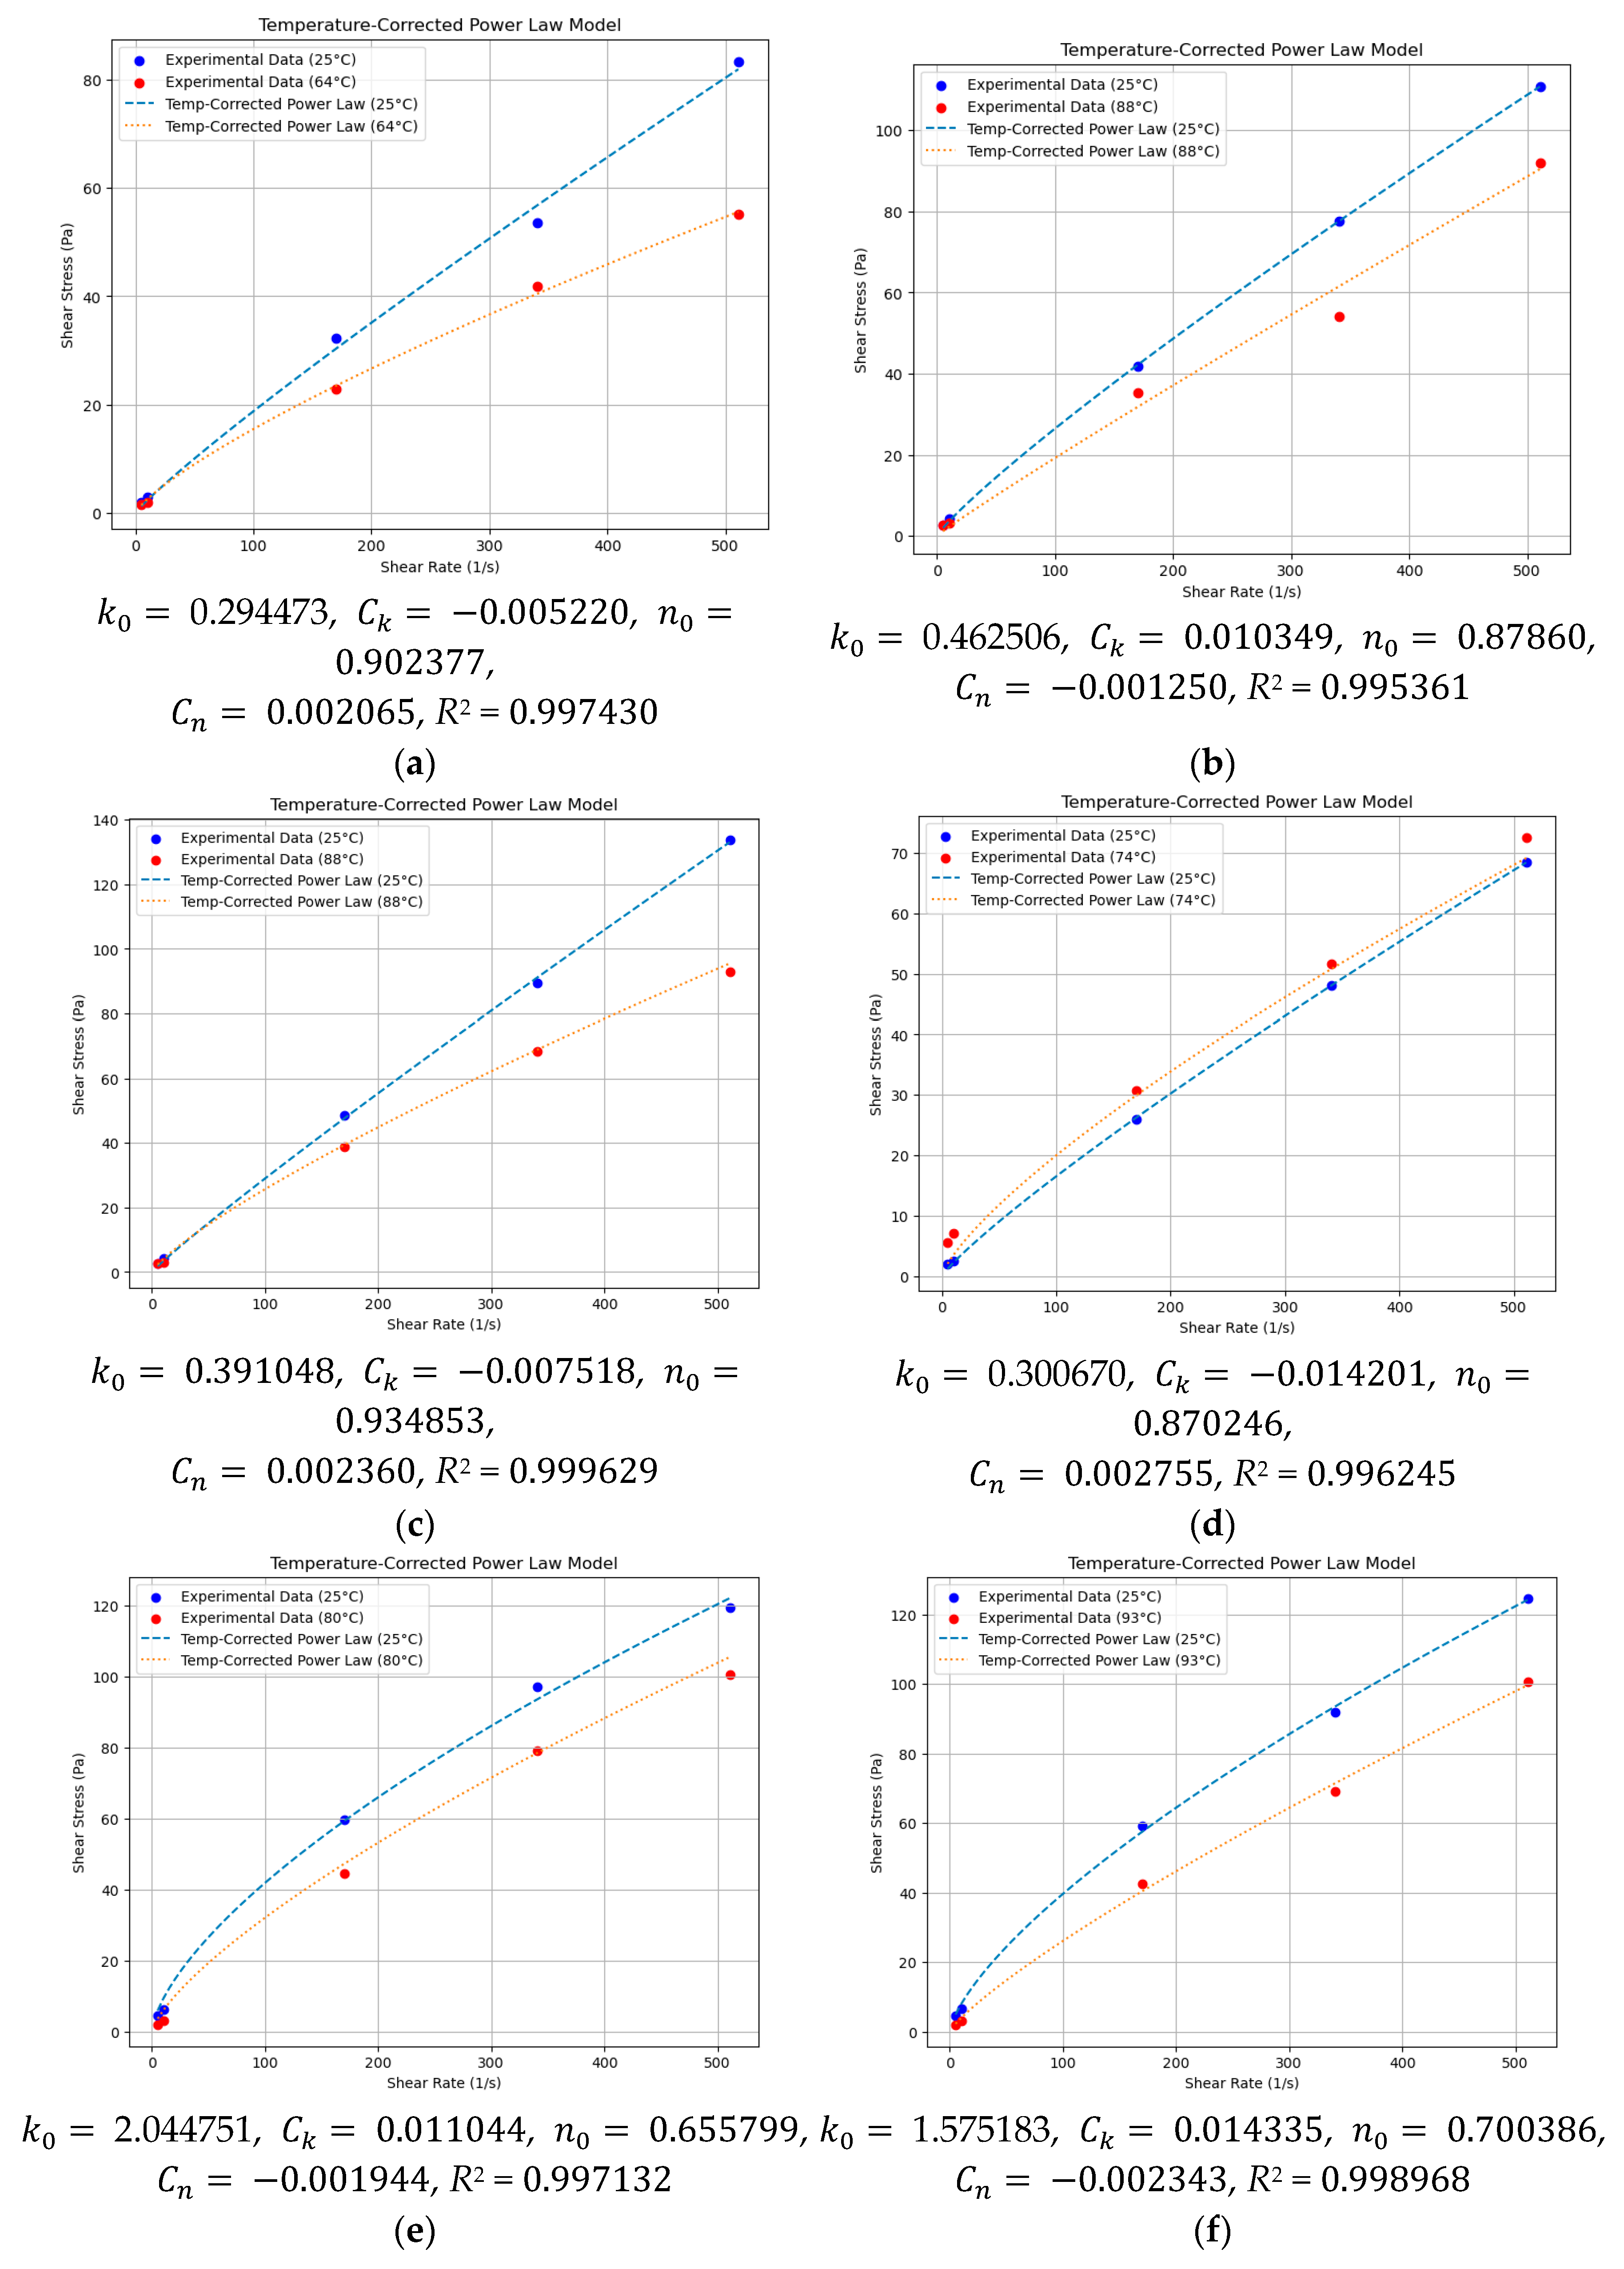
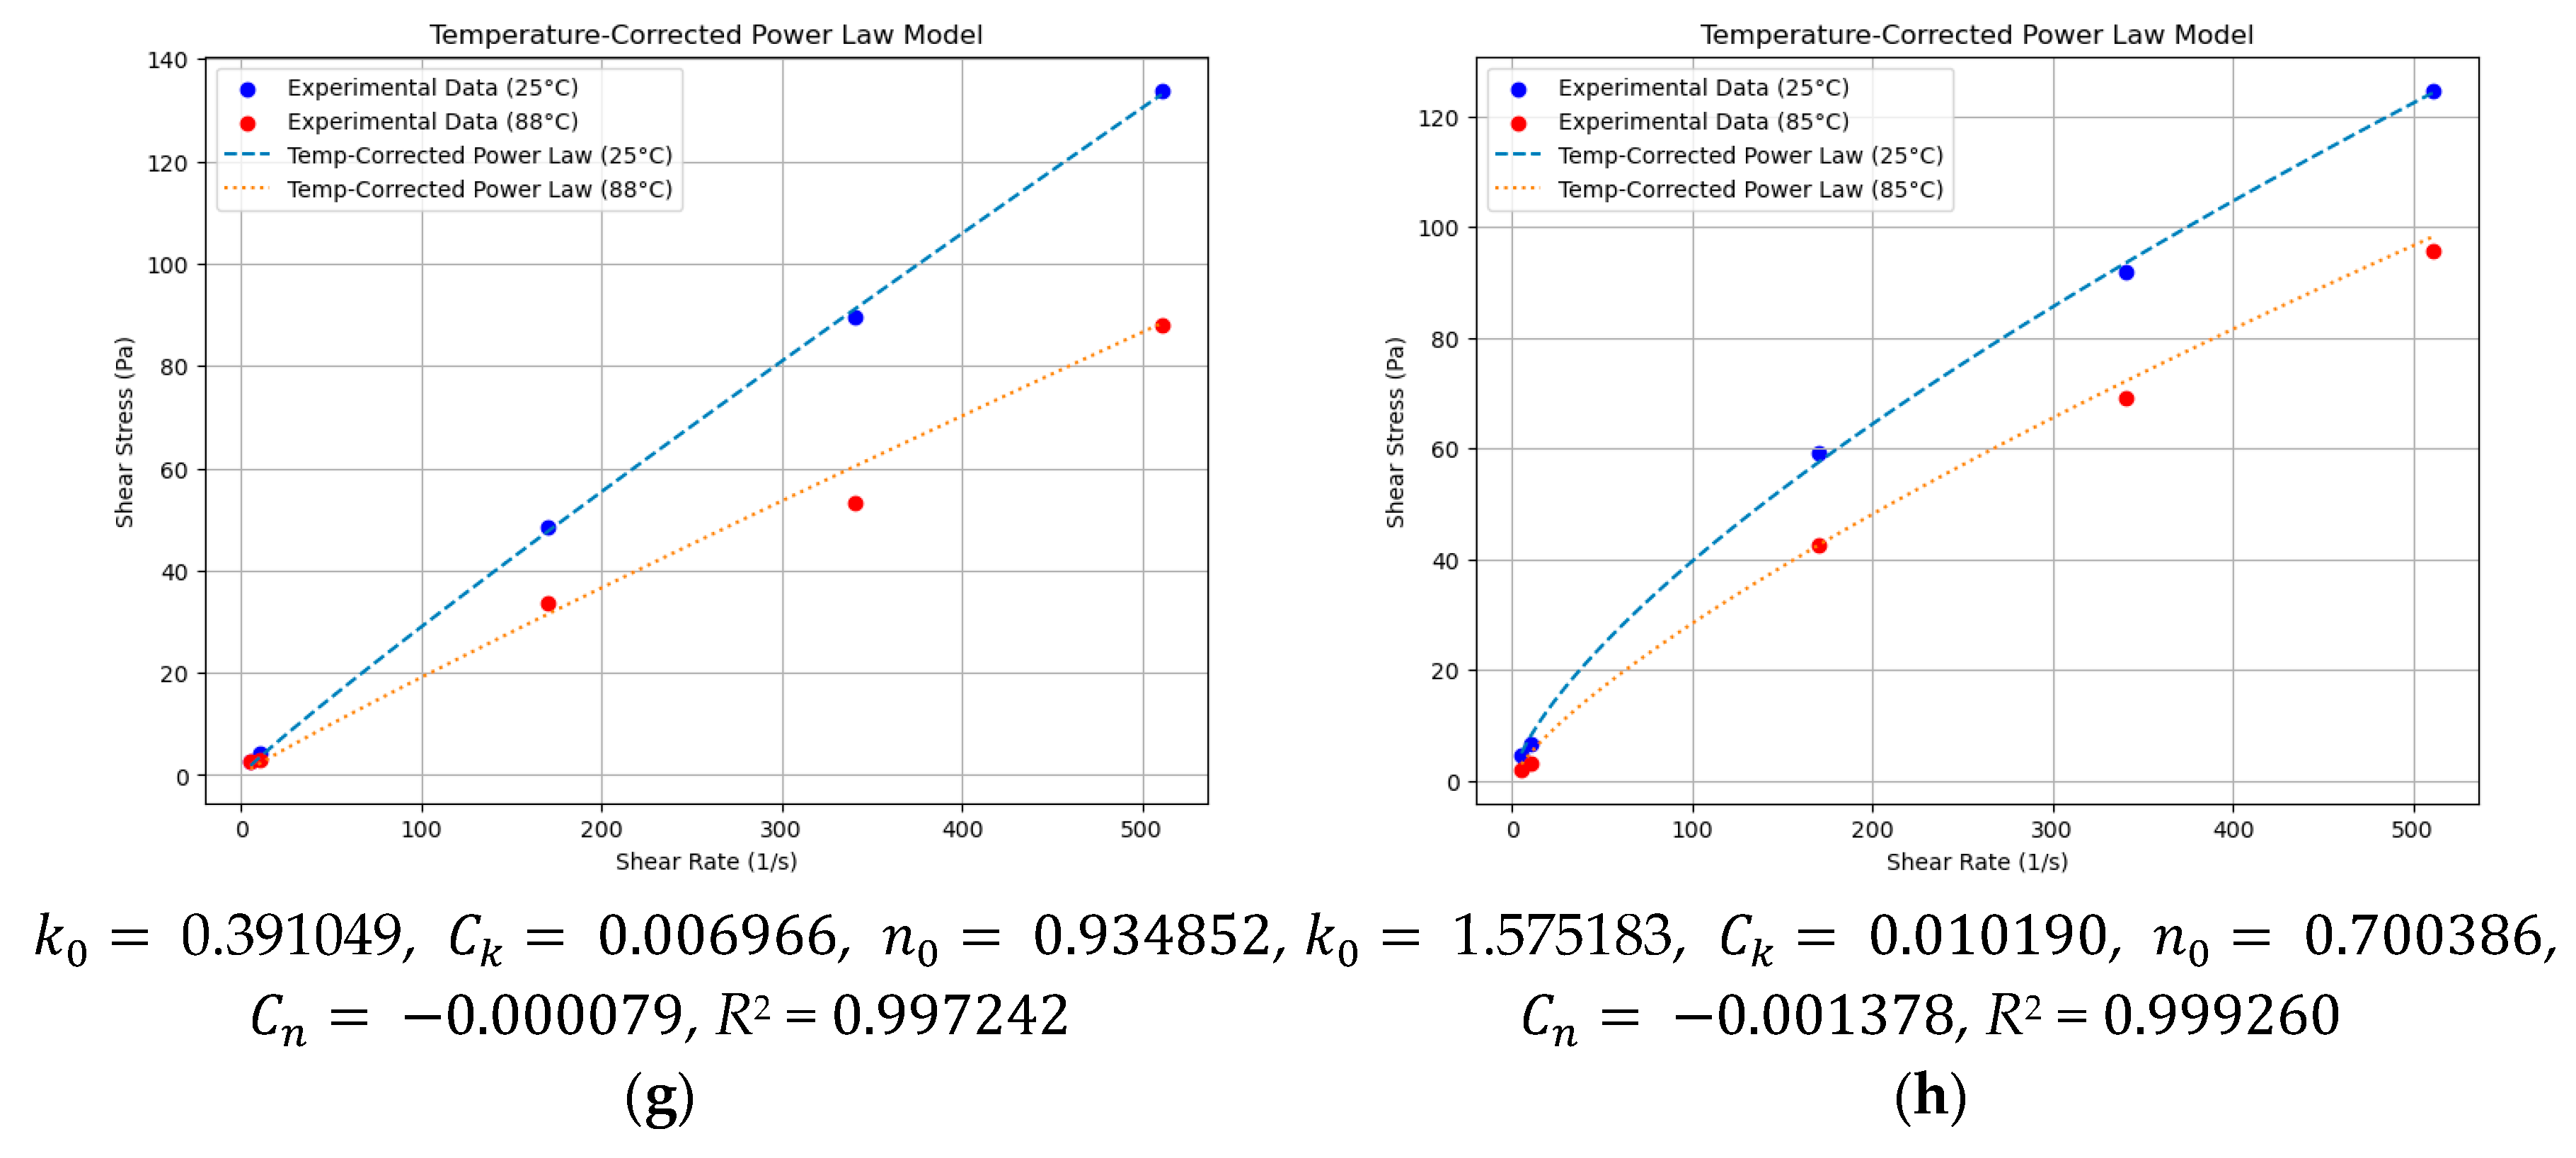
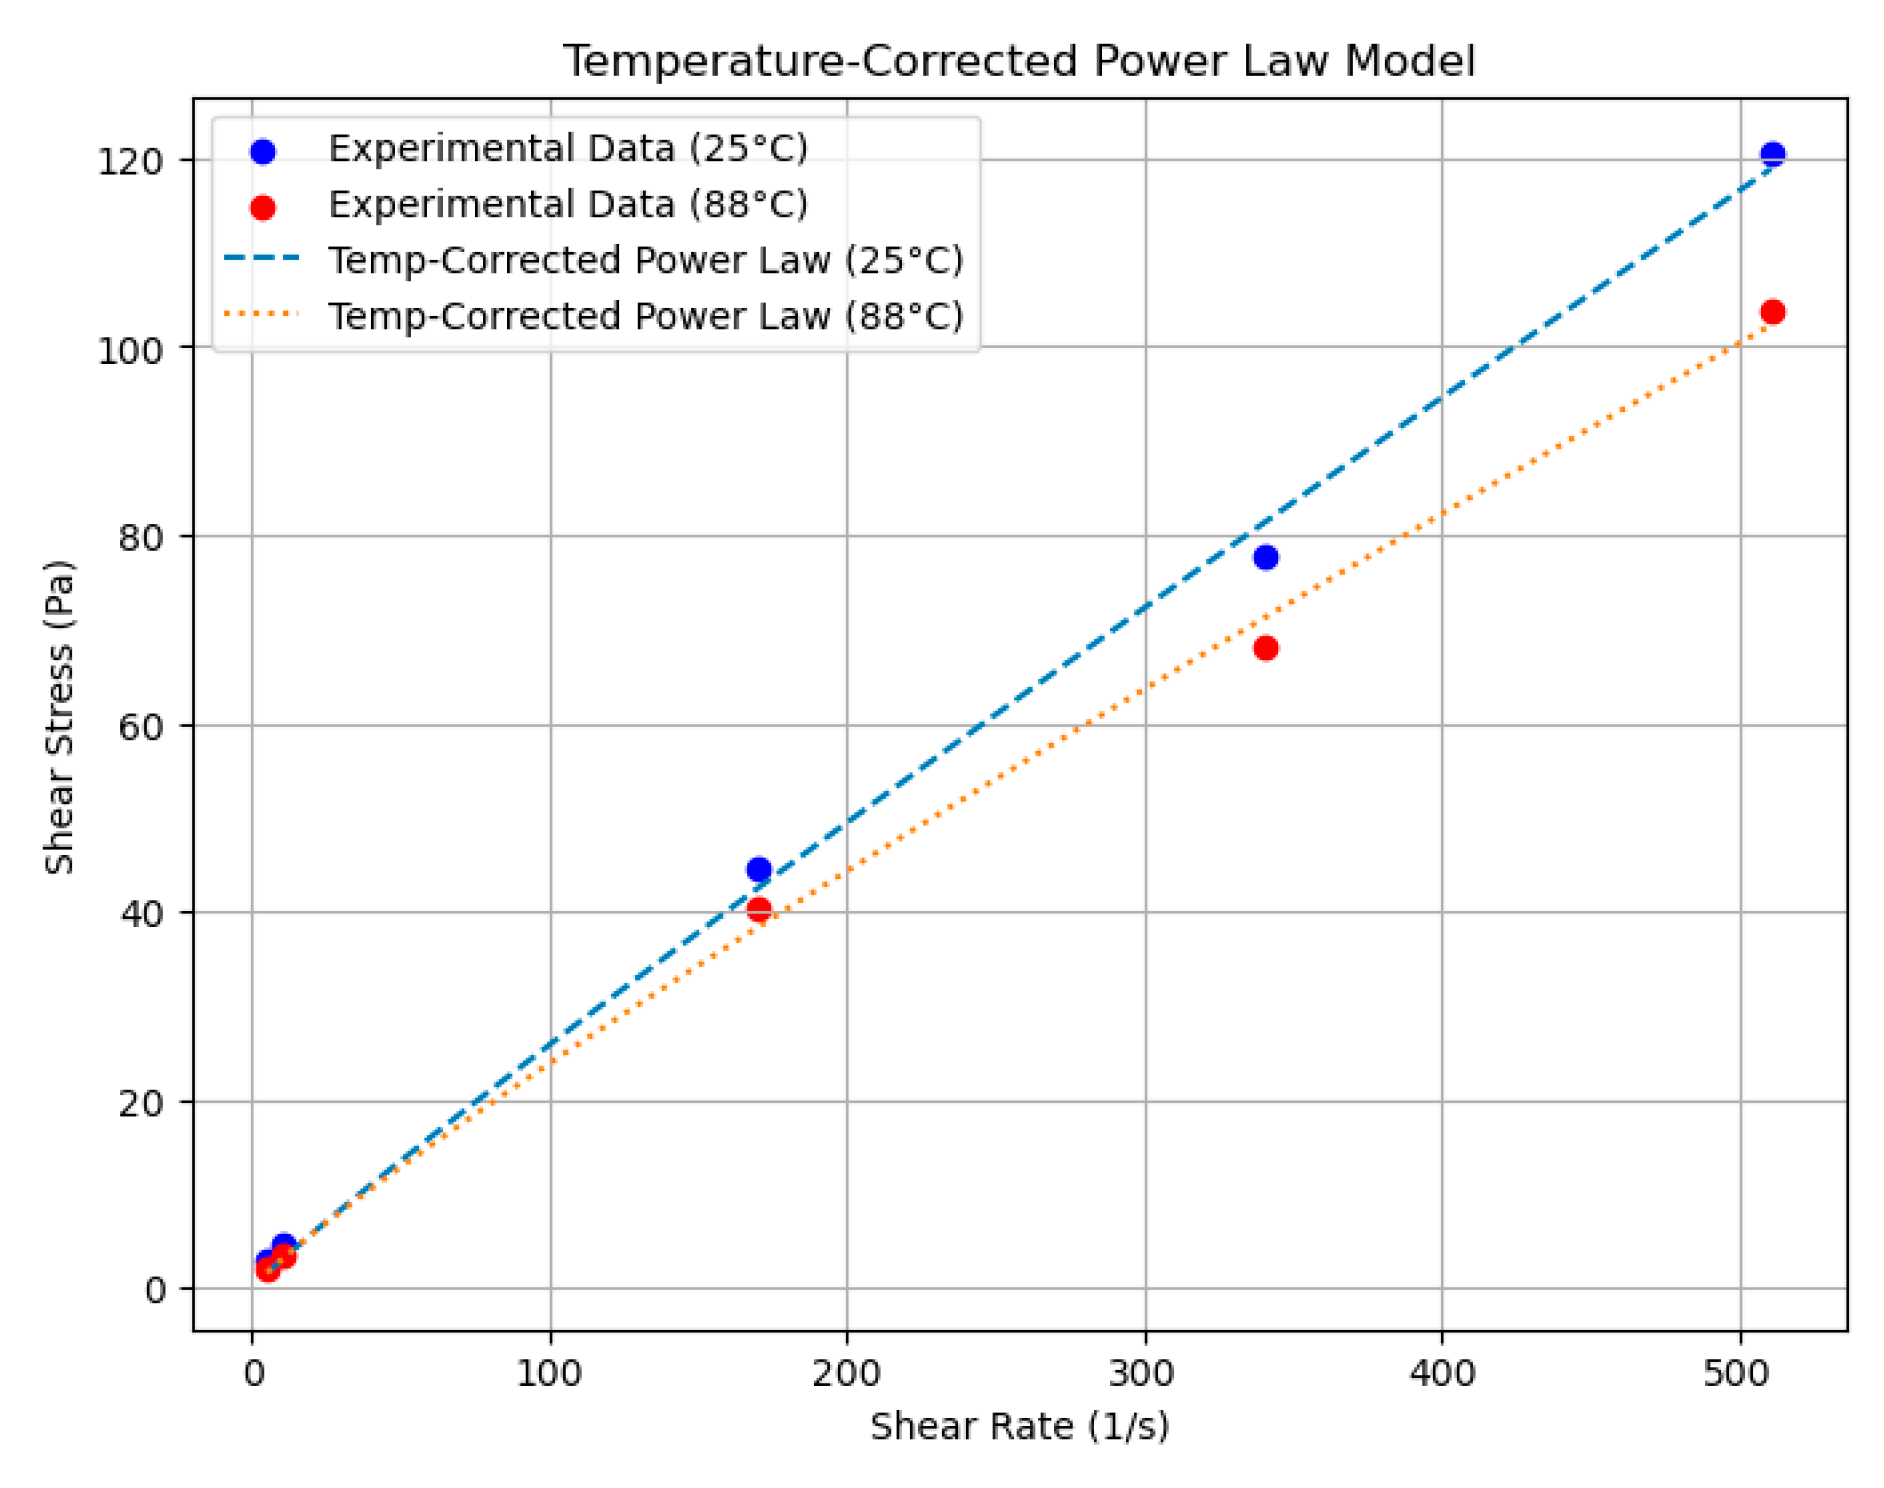
4.2. Domain Knowledge Embedding
4.3. Model Comparison
5. Field Test
6. Discussion
7. Conclusions
Author Contributions
Funding
Institutional Review Board Statement
Informed Consent Statement
Data Availability Statement
Conflicts of Interest
Appendix A
Appendix B

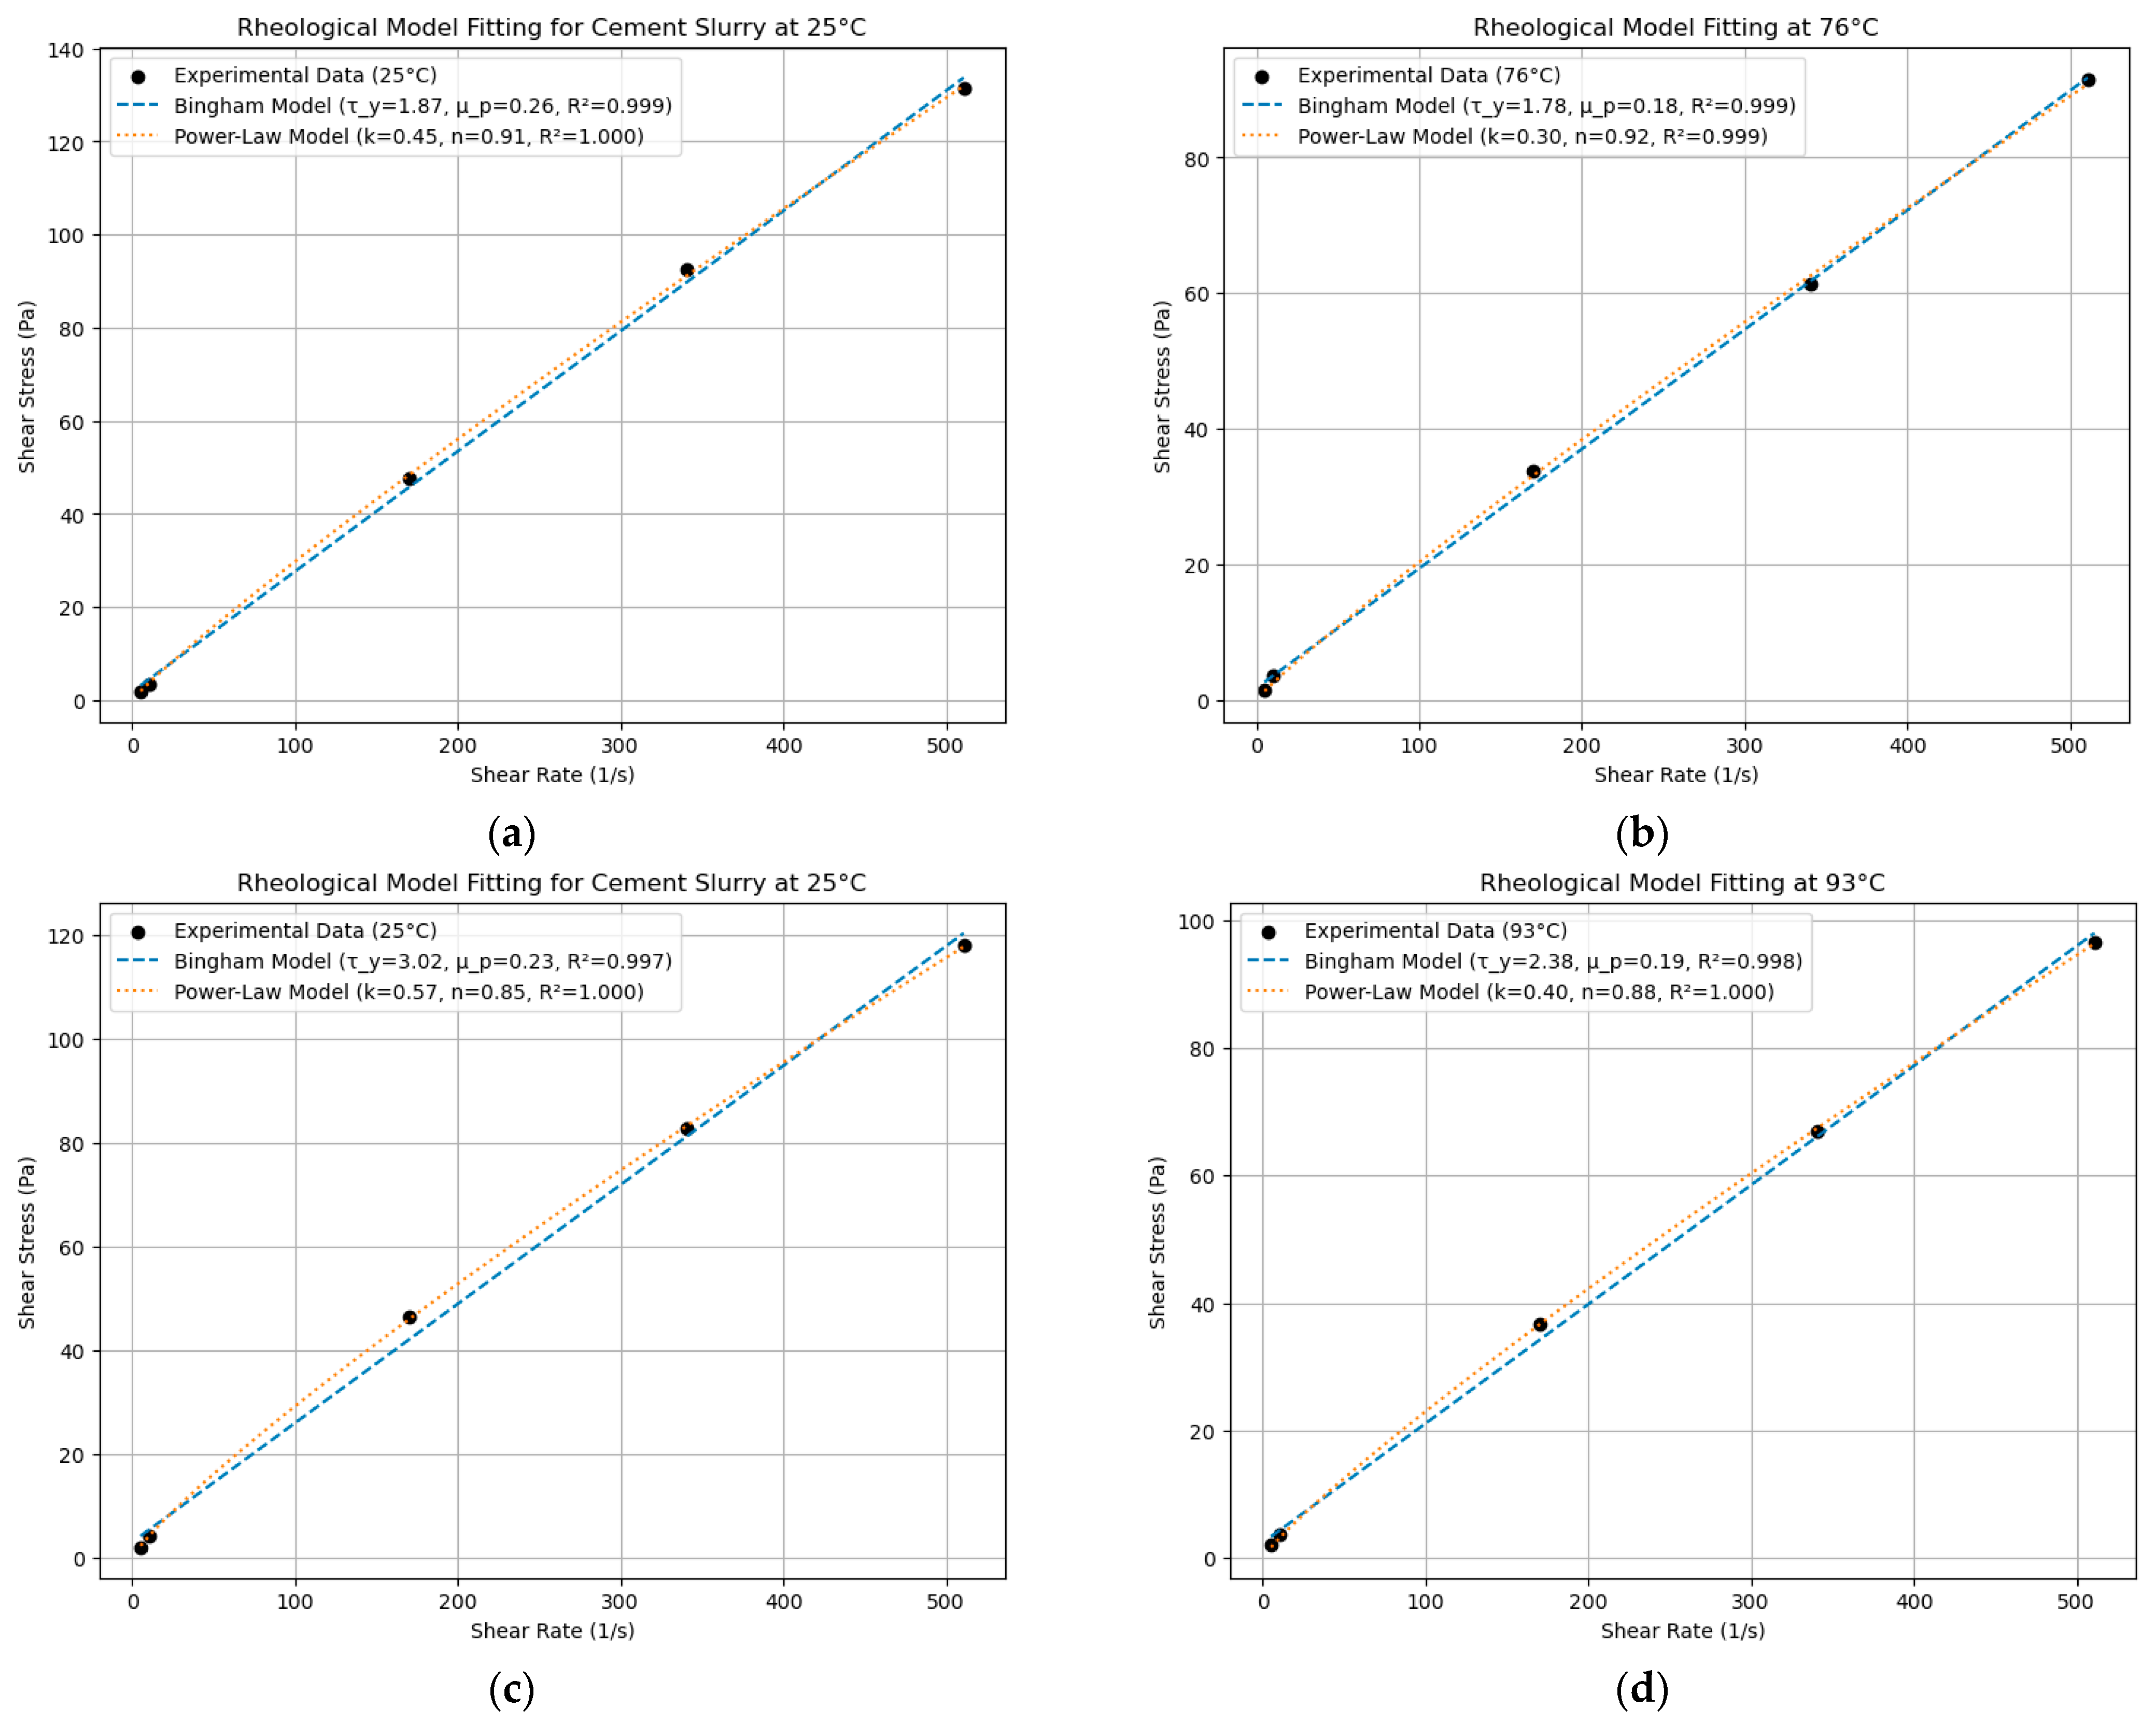
| Temperature | 3 | 6 | 100 | 200 | 300 |
|---|---|---|---|---|---|
| 25 °C | 6 | 9 | 87 | 152 | 236 |
| 88 °C | 4 | 7 | 79 | 133 | 203 |
References
- Tang, J.; Zhang, C.G.; Zhang, B.X.; Shi, F.F. Cement bond quality evaluation based on acoustic variable density logging. Pet. Explor. Dev. 2016, 43, 514–521. [Google Scholar] [CrossRef]
- Zhang, X.G.; Gao, X.Y.; Feng, M. Analysis of factors affecting cementing quality. Drill. Process. 2002, 25, 4. [Google Scholar] [CrossRef]
- Xue, M.; Chu, Z.H.; Li, Y.H.; Jiang, H.; Zhao, B.C.; Chen, X.D. Discussion on several issues regarding the interpretation and evaluation of cementing quality. Log. Technol. 2000, 24, 6. [Google Scholar] [CrossRef]
- Guo, X.Y.; Yang, Y.G.; Li, Z.Y.; Yang, X.Y. Discussion on the key factors to improve the cementing quality of complex wells. Drill. Fluids Complet. Fluids 2005, 22, 53–58. [Google Scholar] [CrossRef]
- Li, X.; Wang, J.; Sun, T. Construction of cementing quality evaluation method system and analysis of influencing factors. Sci. Technol. Bull. 2017, 33, 68–75. [Google Scholar] [CrossRef]
- Kinoshita, T.; Izuhara, W.; Valero, H.; Blyth, M. Feasibility and challenge of quantitative cement evaluation with LWD sonic. In Proceedings of the SPE Annual Technical Conference and Exhibition, New Orleans, LO, USA, 30 September 2013. [Google Scholar] [CrossRef]
- Sun, Z.C. Research on the Evaluation and Statistical Analysis Technology of Cementing Quality in the Adjustment Wells of Daqing. Master’s Thesis, Northeast Petroleum University, Daqing, China, 2009. [Google Scholar]
- Ai, C.; Bu, Z.D.; Zhao, W.C.; Li, Q. The orthogonal scale wavelet network method was used to predict cementing quality. Oil Drill. Technol. 2008, 6, 56–58. [Google Scholar] [CrossRef]
- Sun, F. Research on Cementing Quality Prediction Method. Master’s Thesis, Xi’an Shiyou University, Xi’an, China, 2012. [Google Scholar]
- Kong, C. Cementing Quality Prediction and Safety Evaluation Based on Gray Fuzzy Neural Network. Master’s Thesis, China University of Petroleum (East China), Qingdao, China, 2017. [Google Scholar]
- Guan, R.L. Prediction of cementing quality based on least squares support vector machine. Xinjiang Oil Gas 2018, 14, 5. [Google Scholar] [CrossRef]
- Du, D.N.; Zheng, S.J.; He, Y.Z.; Zhong, W.J.; Zhang, S.H. Cementing quality prediction method based on LM optimization neural network: A case study of block X in Shunbei oilfield. Pet. Geol. Eng. 2021, 35, 123–126. [Google Scholar] [CrossRef]
- Zhao, D.H.; Hu, L.B. Discuss machine learning methods to predict pre-operation cementing quality. Petrochem. Technol. 2022, 29, 208–210. [Google Scholar]
- He, Y.; Zheng, Y.Z.; Wu, B.Y. Analysis and study of the influencing factors of the whole process of deep and ultra-deep cementing. Tech. Superv. Pet. Ind. 2023, 39, 1–6. [Google Scholar] [CrossRef]
- Nyakilla, E.E.; Jun, G.; Kasimu, N.A.; Robert, E.F.; Innocent, N.; Mohamedy, T.; Shaame, M.; Ngata, M.R.; Mabeyo, P. Application of machine learning in the prediction of compressive, and shear bond strengths from the experimental data in oil well cement at 80 °C. Ensemble trees boosting approach. Constr. Build. Mater. 2022, 317, 125778. [Google Scholar] [CrossRef]
- Fang, C.F.; Wang, Z.; Song, X.Z.; Zhao, P.Z.; Yang, D.H.; Liu, M.C. A novel cementing quality evaluation method based on convolutional neural network. Appl. Sci. 2022, 12, 10997. [Google Scholar] [CrossRef]
- Zhang, T.J.; Wang, D.L.; Yang, L. RheologyNet: A physics-informed neural network solution to evaluate the thixotropic properties of cementitious materials. Cem. Concr. Res. 2023, 168, 107157. [Google Scholar] [CrossRef]
- Abdollahian, A.; Wang, H.; Liu, H.; Zheng, X.M. Transfer learning for acoustic cement bond evaluation: An image classification approach using acoustic variable Density log. Geoenergy Sci. Eng. 2024, 239, 212960. [Google Scholar] [CrossRef]
- Zhang, J.Y.; Song, W.Y.; Guo, S.L.; Bu, Y.H.; Liu, H.J.; Li, M.Z. Experimental study on the evaluation model of cementing quality for ultra-low density cement well cluster. Chem. Technol. Fuels Oils 2023, 59, 1129–1137. [Google Scholar]
- Kianoush, P.; Mesgari, F.; Jamshidi, E.; Gomar, M.; Kadkhodaie, A.; Varkouhi, S. Investigating the effect of hole size, bottom hole temperature, and composition on cement bonding quality of exploratory wells in Iran. Sci. Rep. 2024, 14, 29653. [Google Scholar] [CrossRef]
- Li, Y.J.; Zhang, W.D.; Wu, J.; Yang, Y.H.; Zhang, C.; Yang, H.Q. A comprehensive method for the optimization of cement slurry and to avoid air channeling in high temperature and high-pressure conditions. Fluid Dyn. Mater. Process. 2022, 19, 1237–1248. [Google Scholar] [CrossRef]
- Li, J.; Chen, W.J.; Liu, Z.D. Study on the influencing factors of the cementing quality evaluation and the improvement measures. In Proceedings of the International Field Exploration and Development Conference 2022, Xi’an, China, 16 November 2022. [Google Scholar] [CrossRef]
- Spearman, C. The proof and measurement of association between Two Things. Am. J. Psychol. 1904, 15, 72–101. [Google Scholar] [CrossRef]
- Cramér, H. Mathematical Methods of Statistics; Princeton University Press: Princeton, NJ, USA, 1946; p. 591. [Google Scholar]
- McCulloch, W.S.; Pitts, W. A logical calculus of the ideas immanent in nervous activity. Bull. Math. Biol. 1943, 5, 115–133. [Google Scholar] [CrossRef]
- Cheng, H.; Koc, L.; Harmsen, J.; Shaked, T.; Chandra, T.; Aradhye, H.; Anderson, G.; Corrado, G.; Chai, W.; Ispir, M.; et al. Wide & Deep learning for recommender systems. In Proceedings of the 1st Workshop on Deep Learning for Recommender Systems, Boston, MA, USA, 15 September 2016. [Google Scholar] [CrossRef]
- Tao, C.C.; Kutchko, B.; Rosenbaum, E.; Massoudi, M. A Review of Rheological Modeling of Cement Slurry in Oil Well Applications. Energies 2020, 13, 570. [Google Scholar] [CrossRef]
- Wang, L.; Liu, B.H.; Guo, Y.T.; Li, J.; Yan, H.Z.; Liu, H.J.; Heng, S. Experimental investigation of the cementation and tensile properties of cement to formation interface considering surface irregularity and drilling mud residue. J. Pet. Explor. Prod. Technol. 2023, 13, 705–721. [Google Scholar] [CrossRef]
- Tao, C.C.; Rosenbaum, E.; Kutchko, B.; Massoudi, M. The Importance of Vane Configuration on Yield Stress Measurements of Cement Slurry; Technical Report DOE-NETL-2020-2072; U.S. Department of Energy, National Energy Technology Laboratory: Pittsburgh, PA, USA, 2020. Available online: https://netl.doe.gov/sites/default/files/netl-file/ImportanceofVaneConfigurationonYieldStressMeasurementsofCementSlurry_04142020.pdf (accessed on 12 February 2024).
- Liu, J.; Zhu, J.L.; Ji, X.L.; Song, X.L.; Xue, Y.L. Study on the influence of cement slurry viscosity on acoustic emission response and deformation characteristics of slurry-coal cemented body. Constr. Build. Mater. 2024, 450, 138735. [Google Scholar] [CrossRef]
- Bingham, E.C. Fluidity and plasticity. In Fluidity and Plasticity; McGraw-Hill: New York, NY, USA, 1922. [Google Scholar]
- Newman, M. Power laws, Pareto distributions and Zipf’s law. Contemp. Phys. 2005, 46, 323–351. [Google Scholar] [CrossRef]
- Zhao, X.Y.; Luo, H.; Yang, M.; Lu, P.Q.; Zheng, Y.Z.; Li, H.T. Novel method for optimization cement slurry based on the wellbore integrity model in high-temperature and high-pressure conditions. ACS Omega 2023, 8, 45668–45677. [Google Scholar] [CrossRef]
- Grasinger, M.; Li, Z.C.; Vuotto, A.; Brigham, J.; Lannacchione, A.; Vandenbossche, J. Simulation of cement slurry flow to assess the potential for voids and channels in wellbore cementing processes. In Proceedings of the SPE Eastern Regional Meeting, Morgantown, WV, USA, 13 October 2015. [Google Scholar] [CrossRef]

| Category | Feature | Variable | Category | Feature | Variable |
|---|---|---|---|---|---|
| Drilling | Well depth | Cementing | Casing size | ||
| Borehole diameter | Centralizer position | ||||
| Drill bit size | Drilling fluid density | ||||
| Deviation angle | Preflush density | ||||
| Azimuth angle | Cement slurry density | ||||
| Geological | Formation fluid density | Cement slurry flow rate | |||
| Acoustic travel time | Preflush flow rate | ||||
| Wellbore temperature | Rheological Properties | ||||
| Gamma ray | Annular clearance | ||||
| Wellbore pressure | Water-cement ratio |
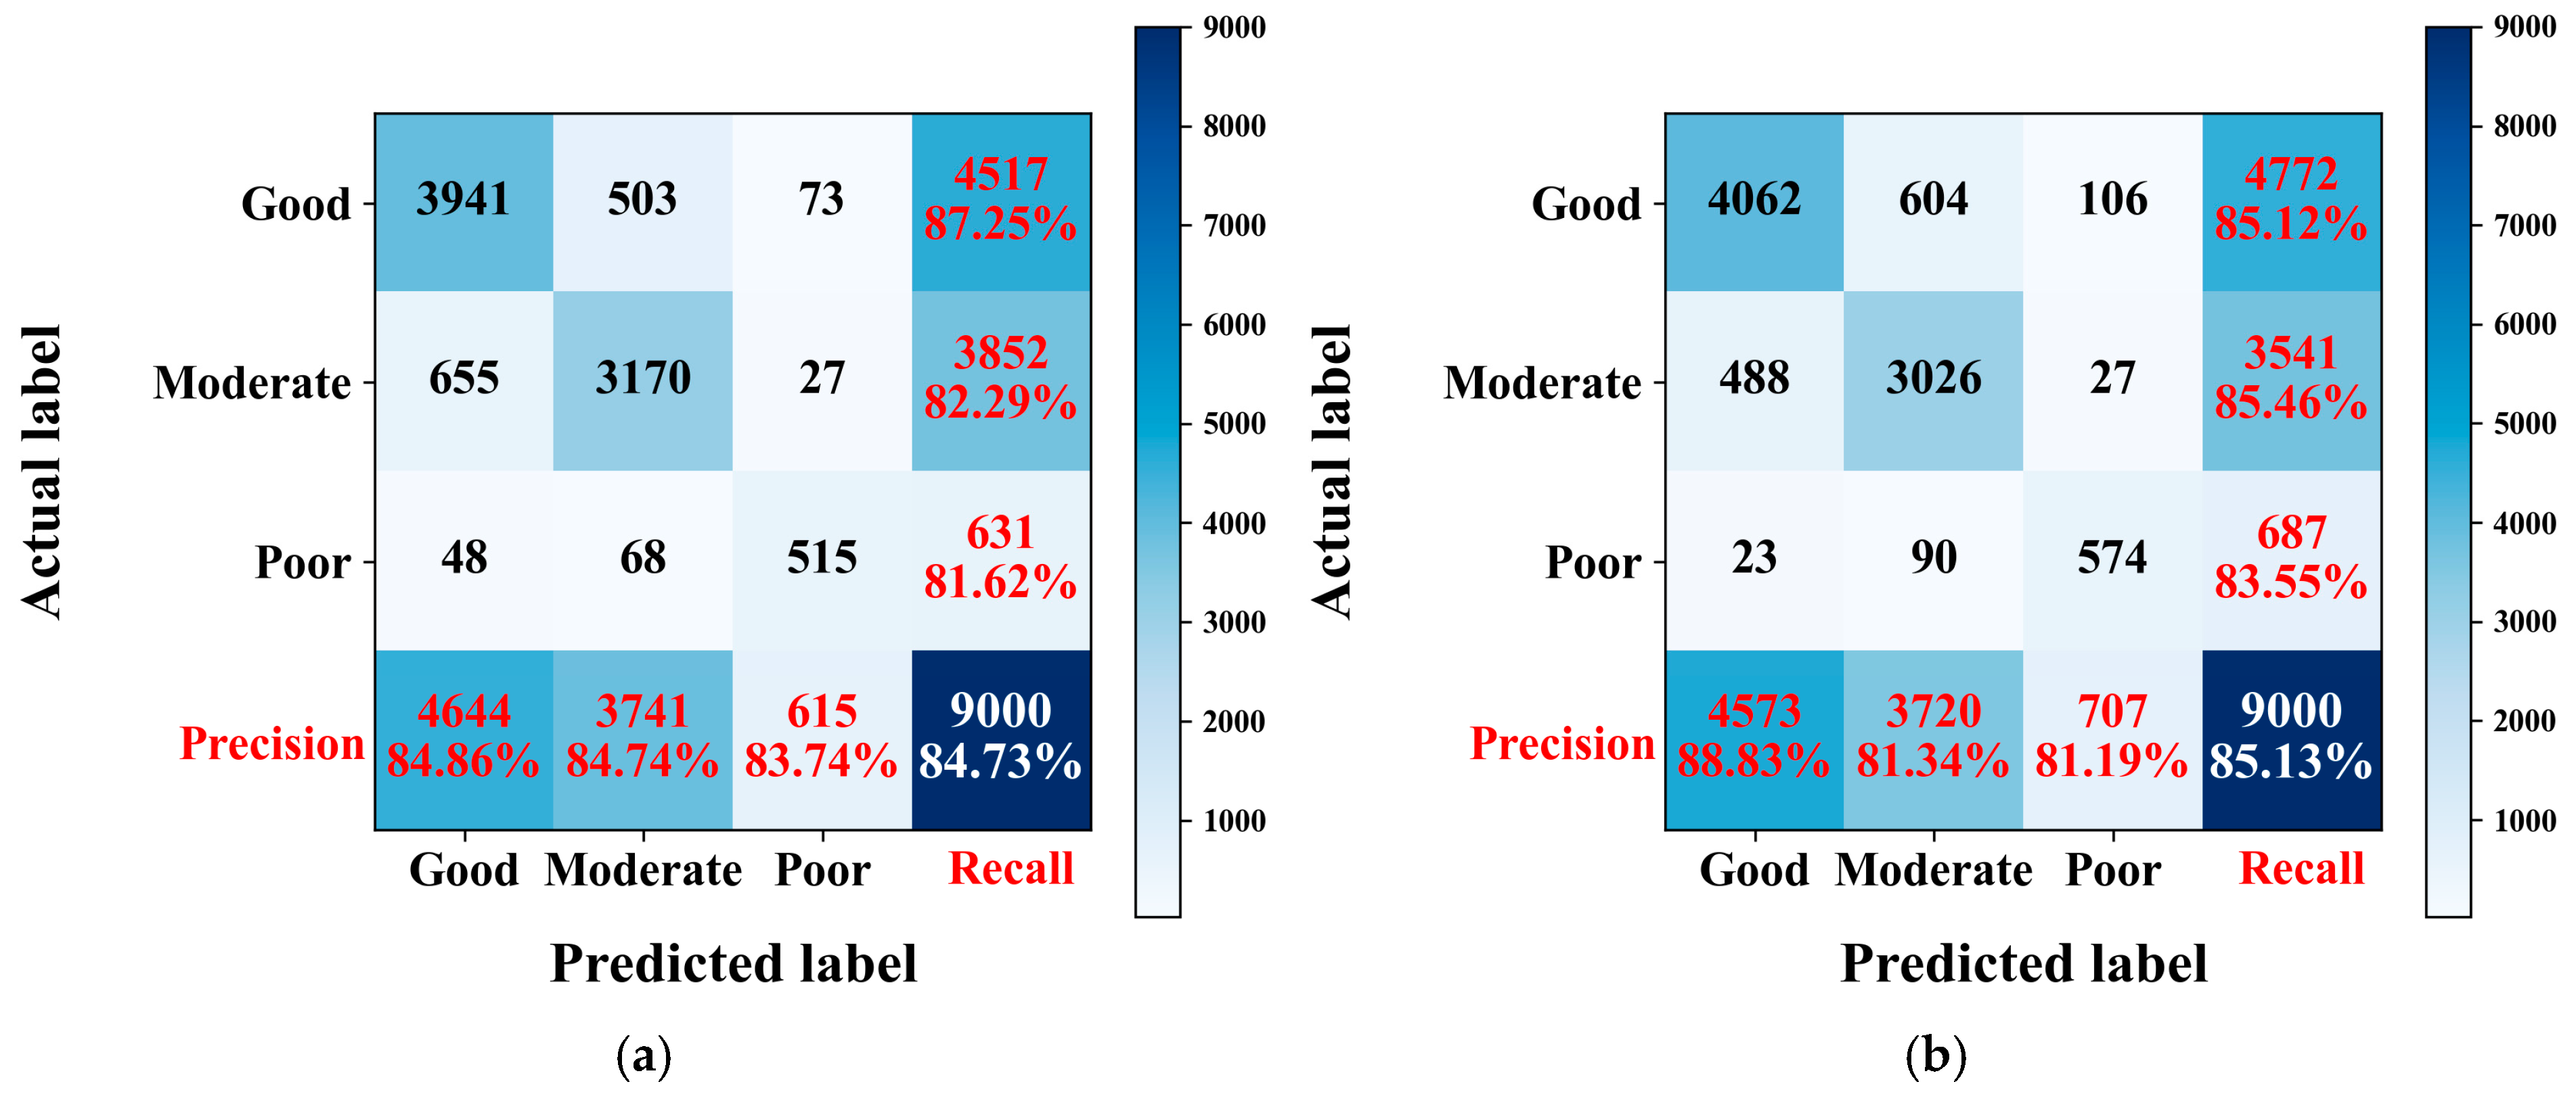
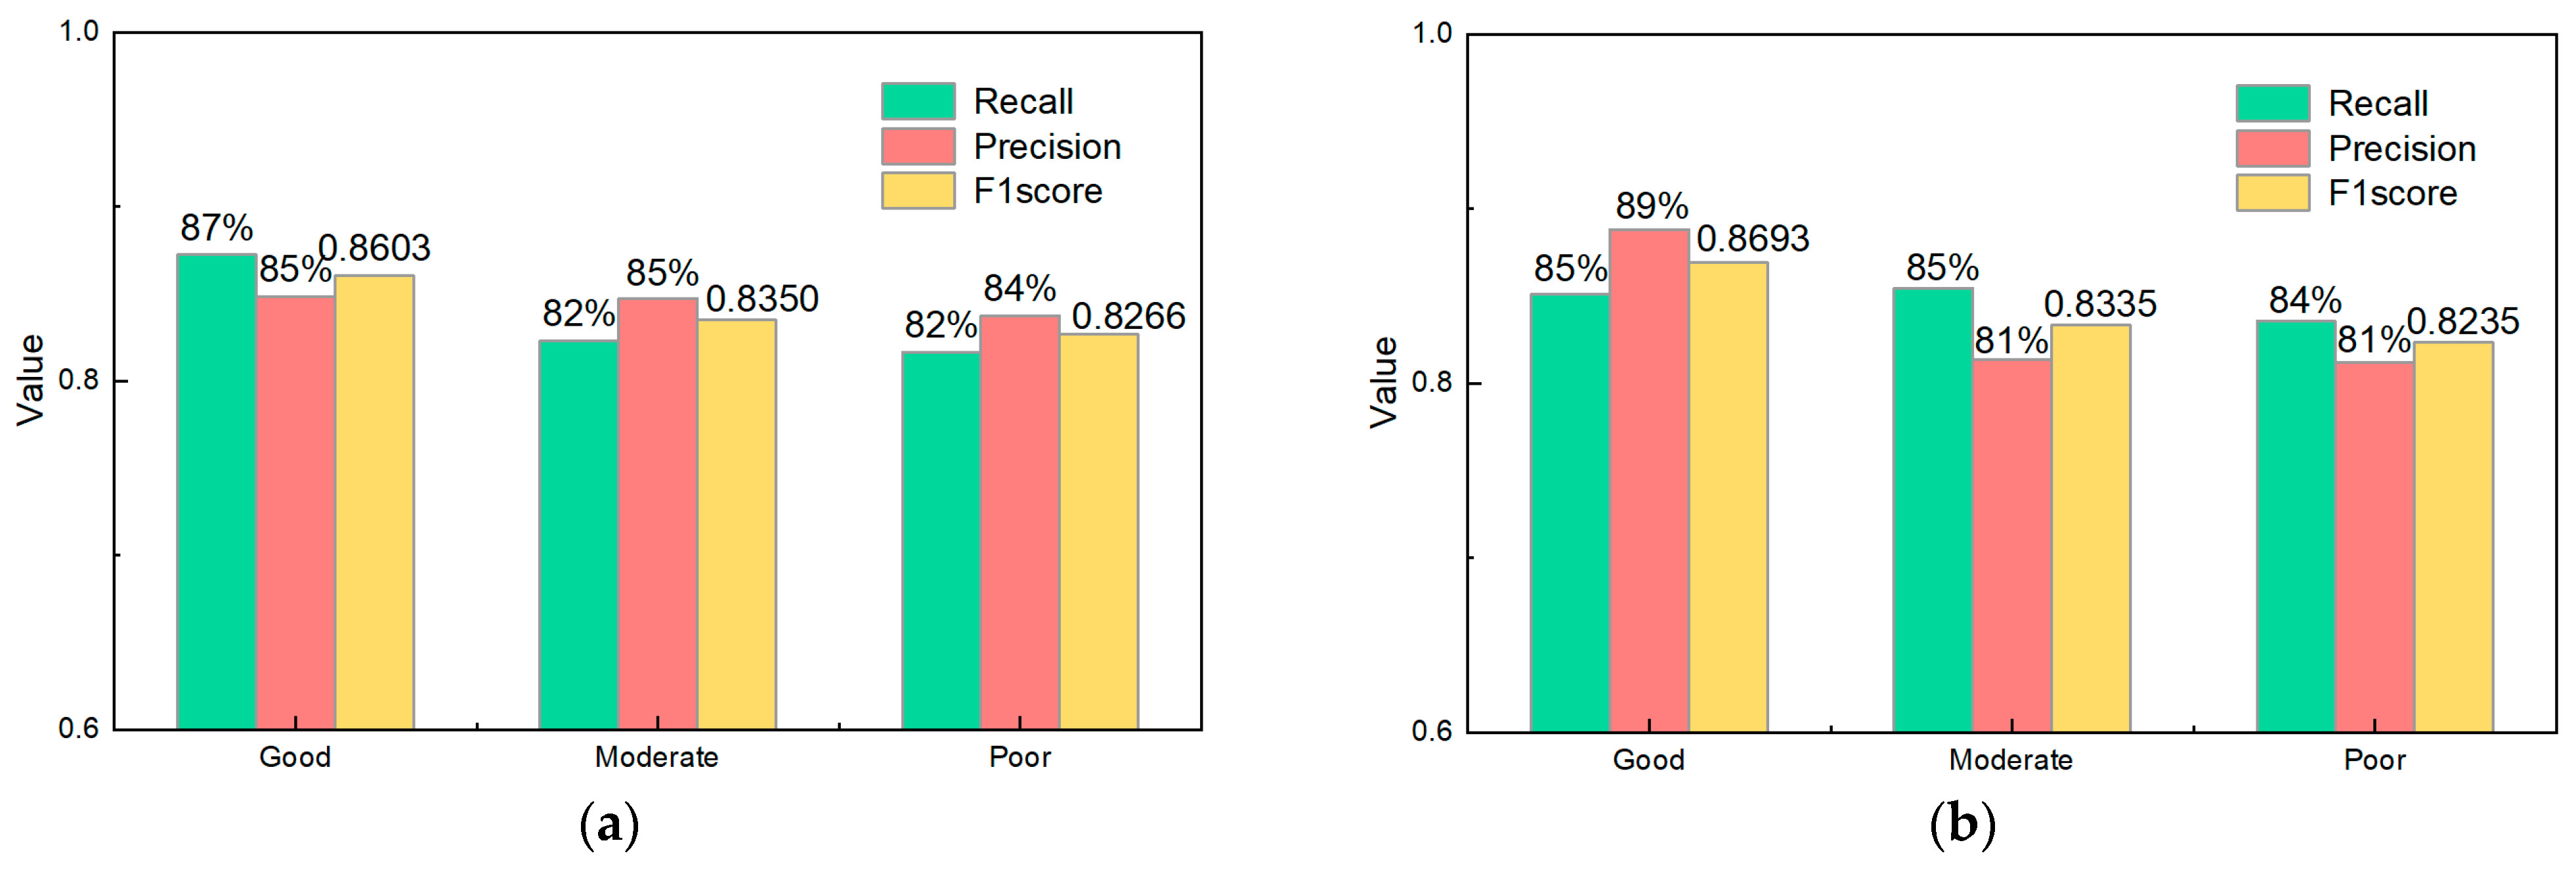
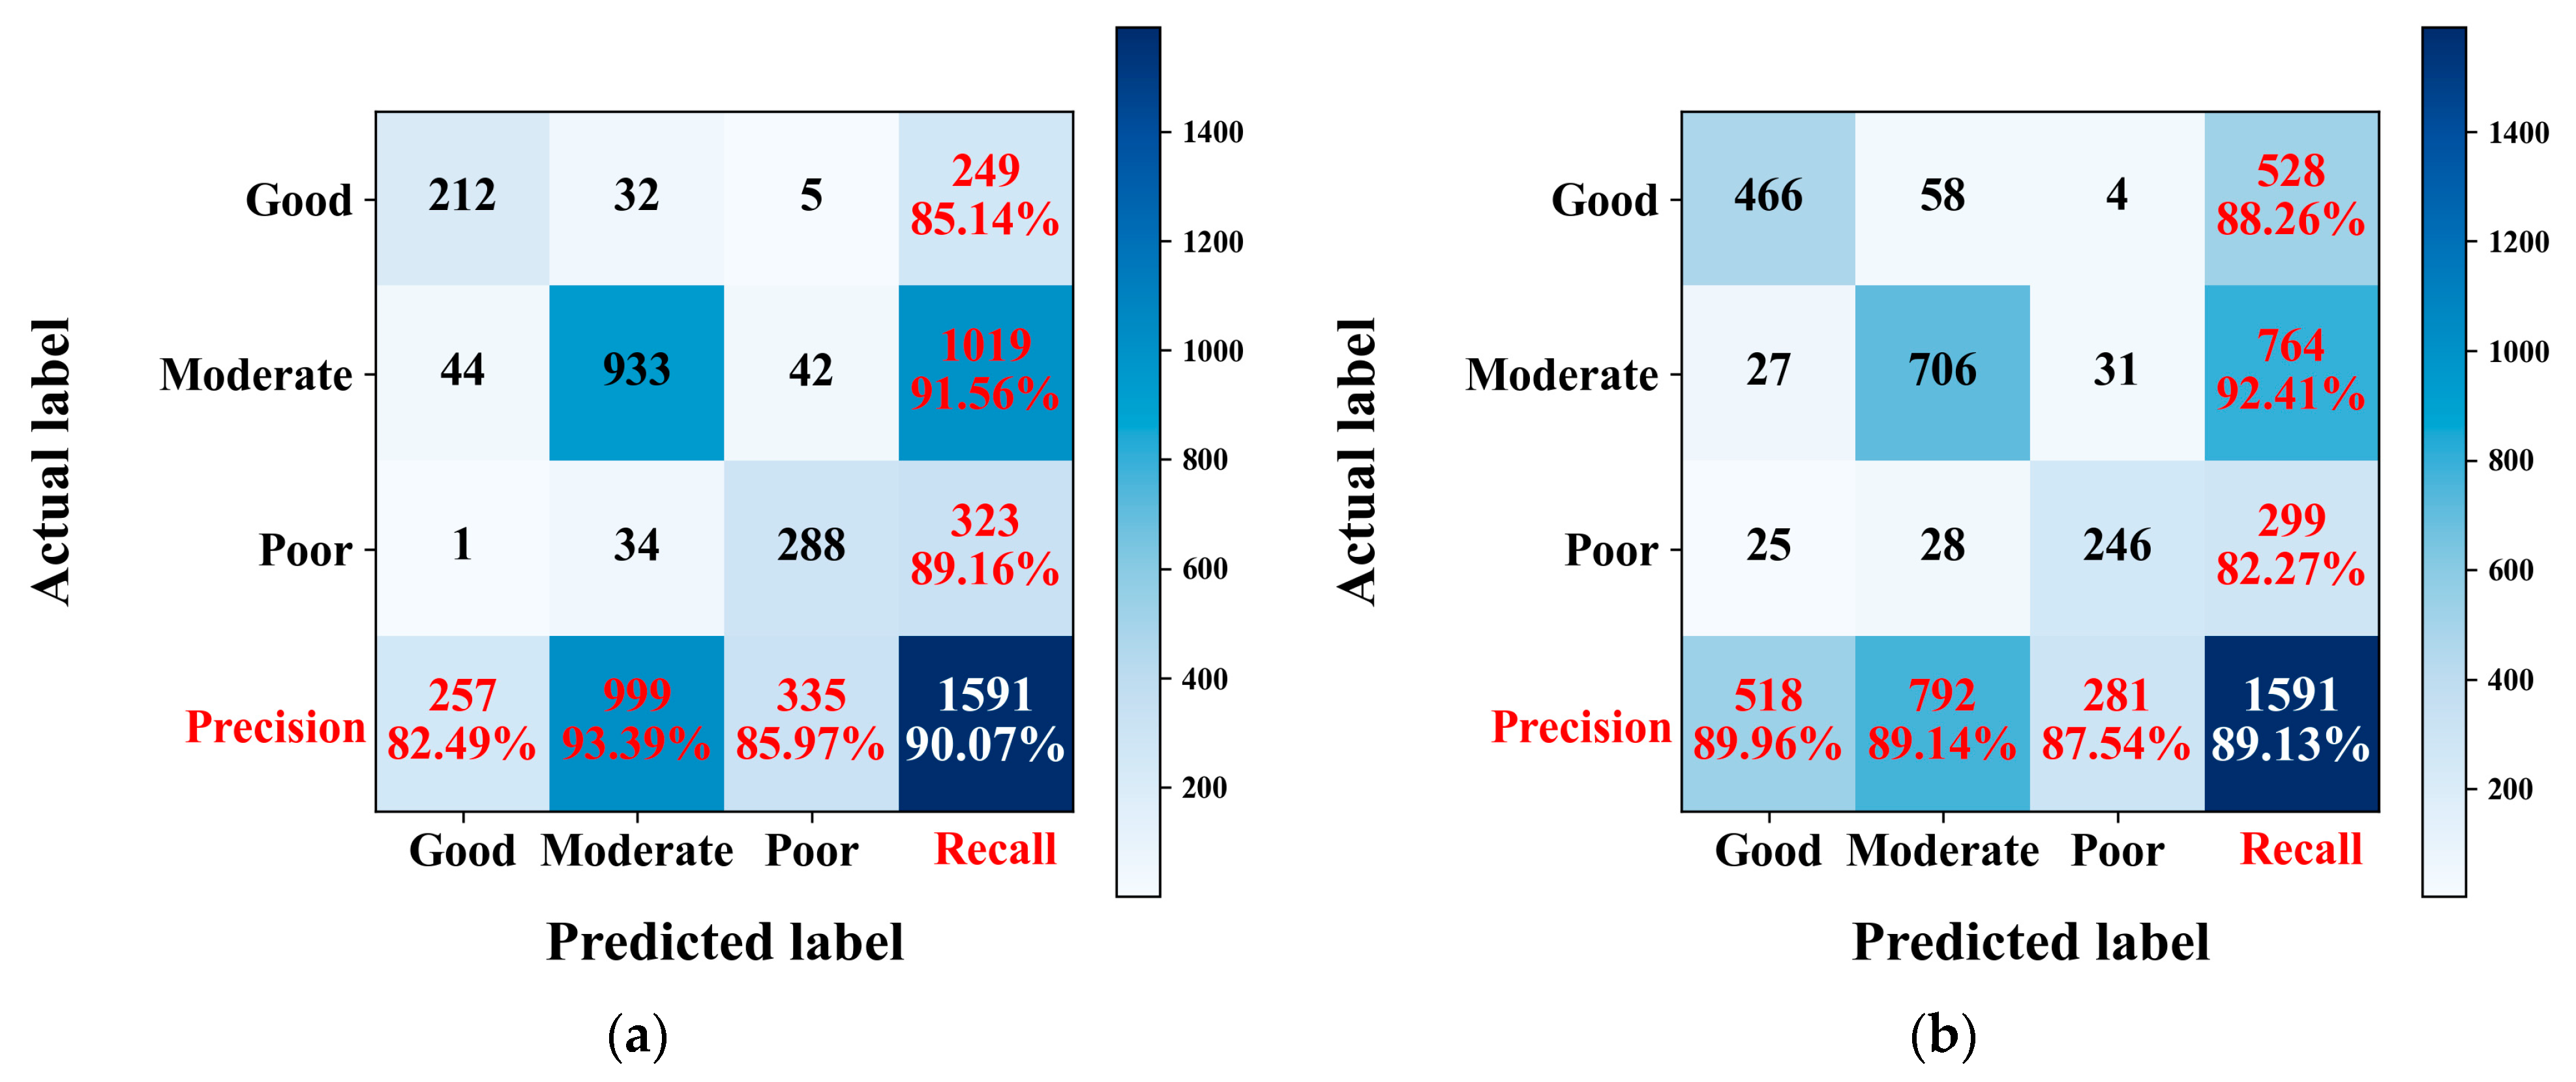
| Good | Moderate | Poor | |
|---|---|---|---|
| Recall | 87.24% | 82.29% | 81.62% |
| Precision | 84.86% | 84.73% | 83.74% |
| F1-score | 0.8603 | 0.8350 | 0.8266 |
| Good | Moderate | Poor | |
|---|---|---|---|
| Recall | 85.12% | 85.46% | 83.55% |
| Precision | 88.83% | 81.34% | 81.19% |
| F1-score | 0.8693 | 0.8335 | 0.8235 |
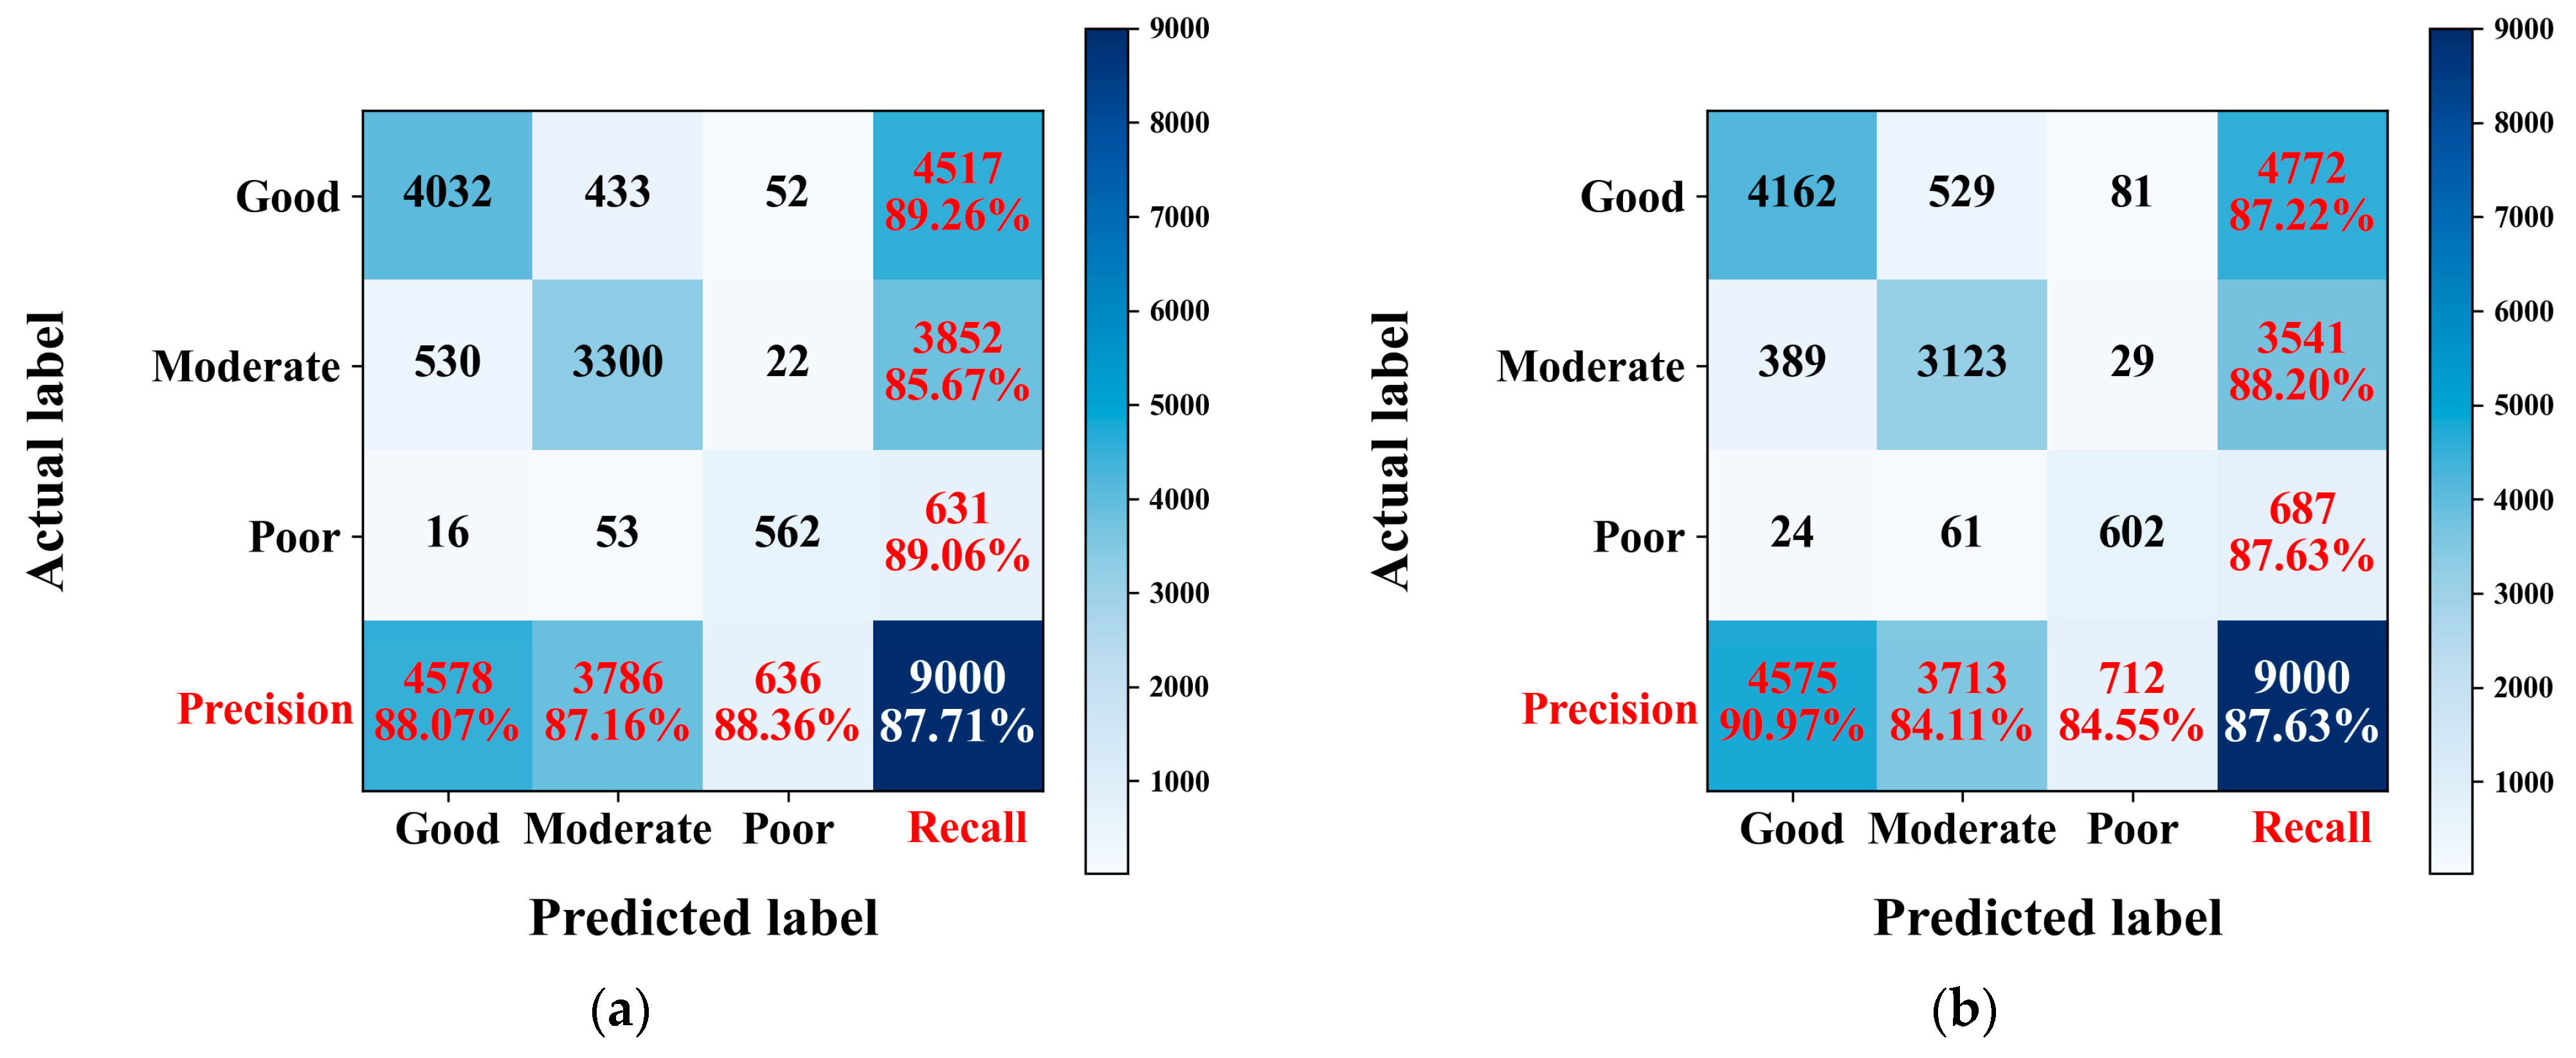
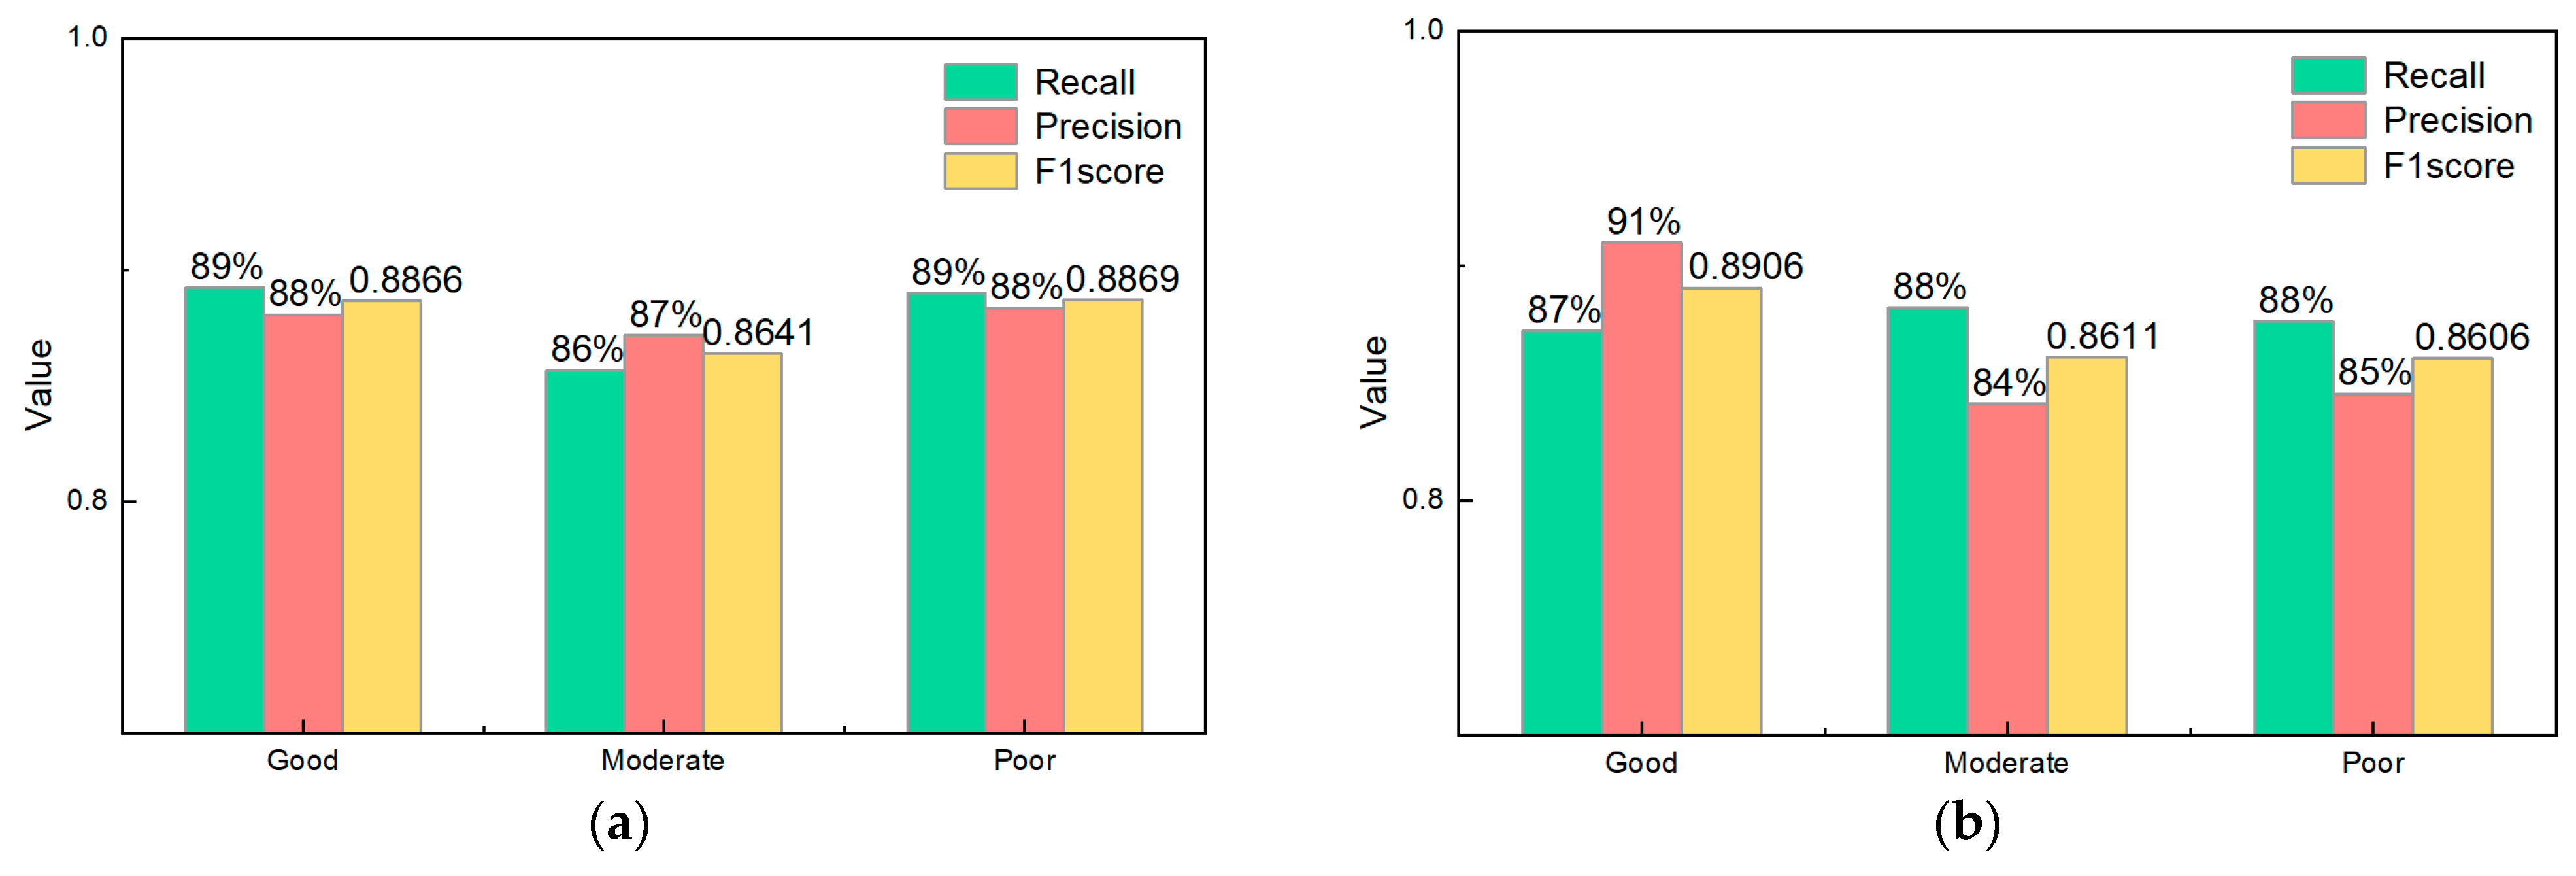
| Good | Moderate | Poor | |
|---|---|---|---|
| Recall | 89.26% | 85.67% | 89.01% |
| Precision | 88.07% | 87.16% | 88.36% |
| F1-score | 0.8866 | 0.8641 | 0.8869 |
| Good | Moderate | Poor | |
|---|---|---|---|
| Recall | 87.22% | 88.20% | 87.62% |
| Precision | 90.97% | 84.11% | 84.55% |
| F1-score | 0.8906 | 0.8611 | 0.8606 |
Disclaimer/Publisher’s Note: The statements, opinions and data contained in all publications are solely those of the individual author(s) and contributor(s) and not of MDPI and/or the editor(s). MDPI and/or the editor(s) disclaim responsibility for any injury to people or property resulting from any ideas, methods, instructions or products referred to in the content. |
© 2025 by the authors. Licensee MDPI, Basel, Switzerland. This article is an open access article distributed under the terms and conditions of the Creative Commons Attribution (CC BY) license (https://creativecommons.org/licenses/by/4.0/).
Share and Cite
Liu, R.; Yu, J.; Liu, L.; Wang, Z.; Zhou, S.; Zhu, Z. A Cement Bond Quality Prediction Method Based on a Wide and Deep Neural Network Incorporating Embedded Domain Knowledge. Appl. Sci. 2025, 15, 5493. https://doi.org/10.3390/app15105493
Liu R, Yu J, Liu L, Wang Z, Zhou S, Zhu Z. A Cement Bond Quality Prediction Method Based on a Wide and Deep Neural Network Incorporating Embedded Domain Knowledge. Applied Sciences. 2025; 15(10):5493. https://doi.org/10.3390/app15105493
Chicago/Turabian StyleLiu, Rengguang, Jiawei Yu, Luo Liu, Zheng Wang, Shiming Zhou, and Zhaopeng Zhu. 2025. "A Cement Bond Quality Prediction Method Based on a Wide and Deep Neural Network Incorporating Embedded Domain Knowledge" Applied Sciences 15, no. 10: 5493. https://doi.org/10.3390/app15105493
APA StyleLiu, R., Yu, J., Liu, L., Wang, Z., Zhou, S., & Zhu, Z. (2025). A Cement Bond Quality Prediction Method Based on a Wide and Deep Neural Network Incorporating Embedded Domain Knowledge. Applied Sciences, 15(10), 5493. https://doi.org/10.3390/app15105493