Designing an Interactive Visual Analytics System for Precipitation Data Analysis
Abstract
1. Introduction
- It creates a comprehensive hourly precipitation dataset by building a composite weather station list and integrating multiple data sources.
- It designs an innovative visual analytics system for hourly precipitation data analysis.
- It integrates multiple statistical analysis methods into visualizations to address limitations of analyzing precipitation data,
- It provides multiple user interaction techniques to help users conduct interactive visual analysis on single, as well as multiple, weather station data.
2. Previous Work
3. Comprehensive Hourly Precipitation Dataset
3.1. Data Collection
3.2. Managing HPD Data
4. IETD Analysis
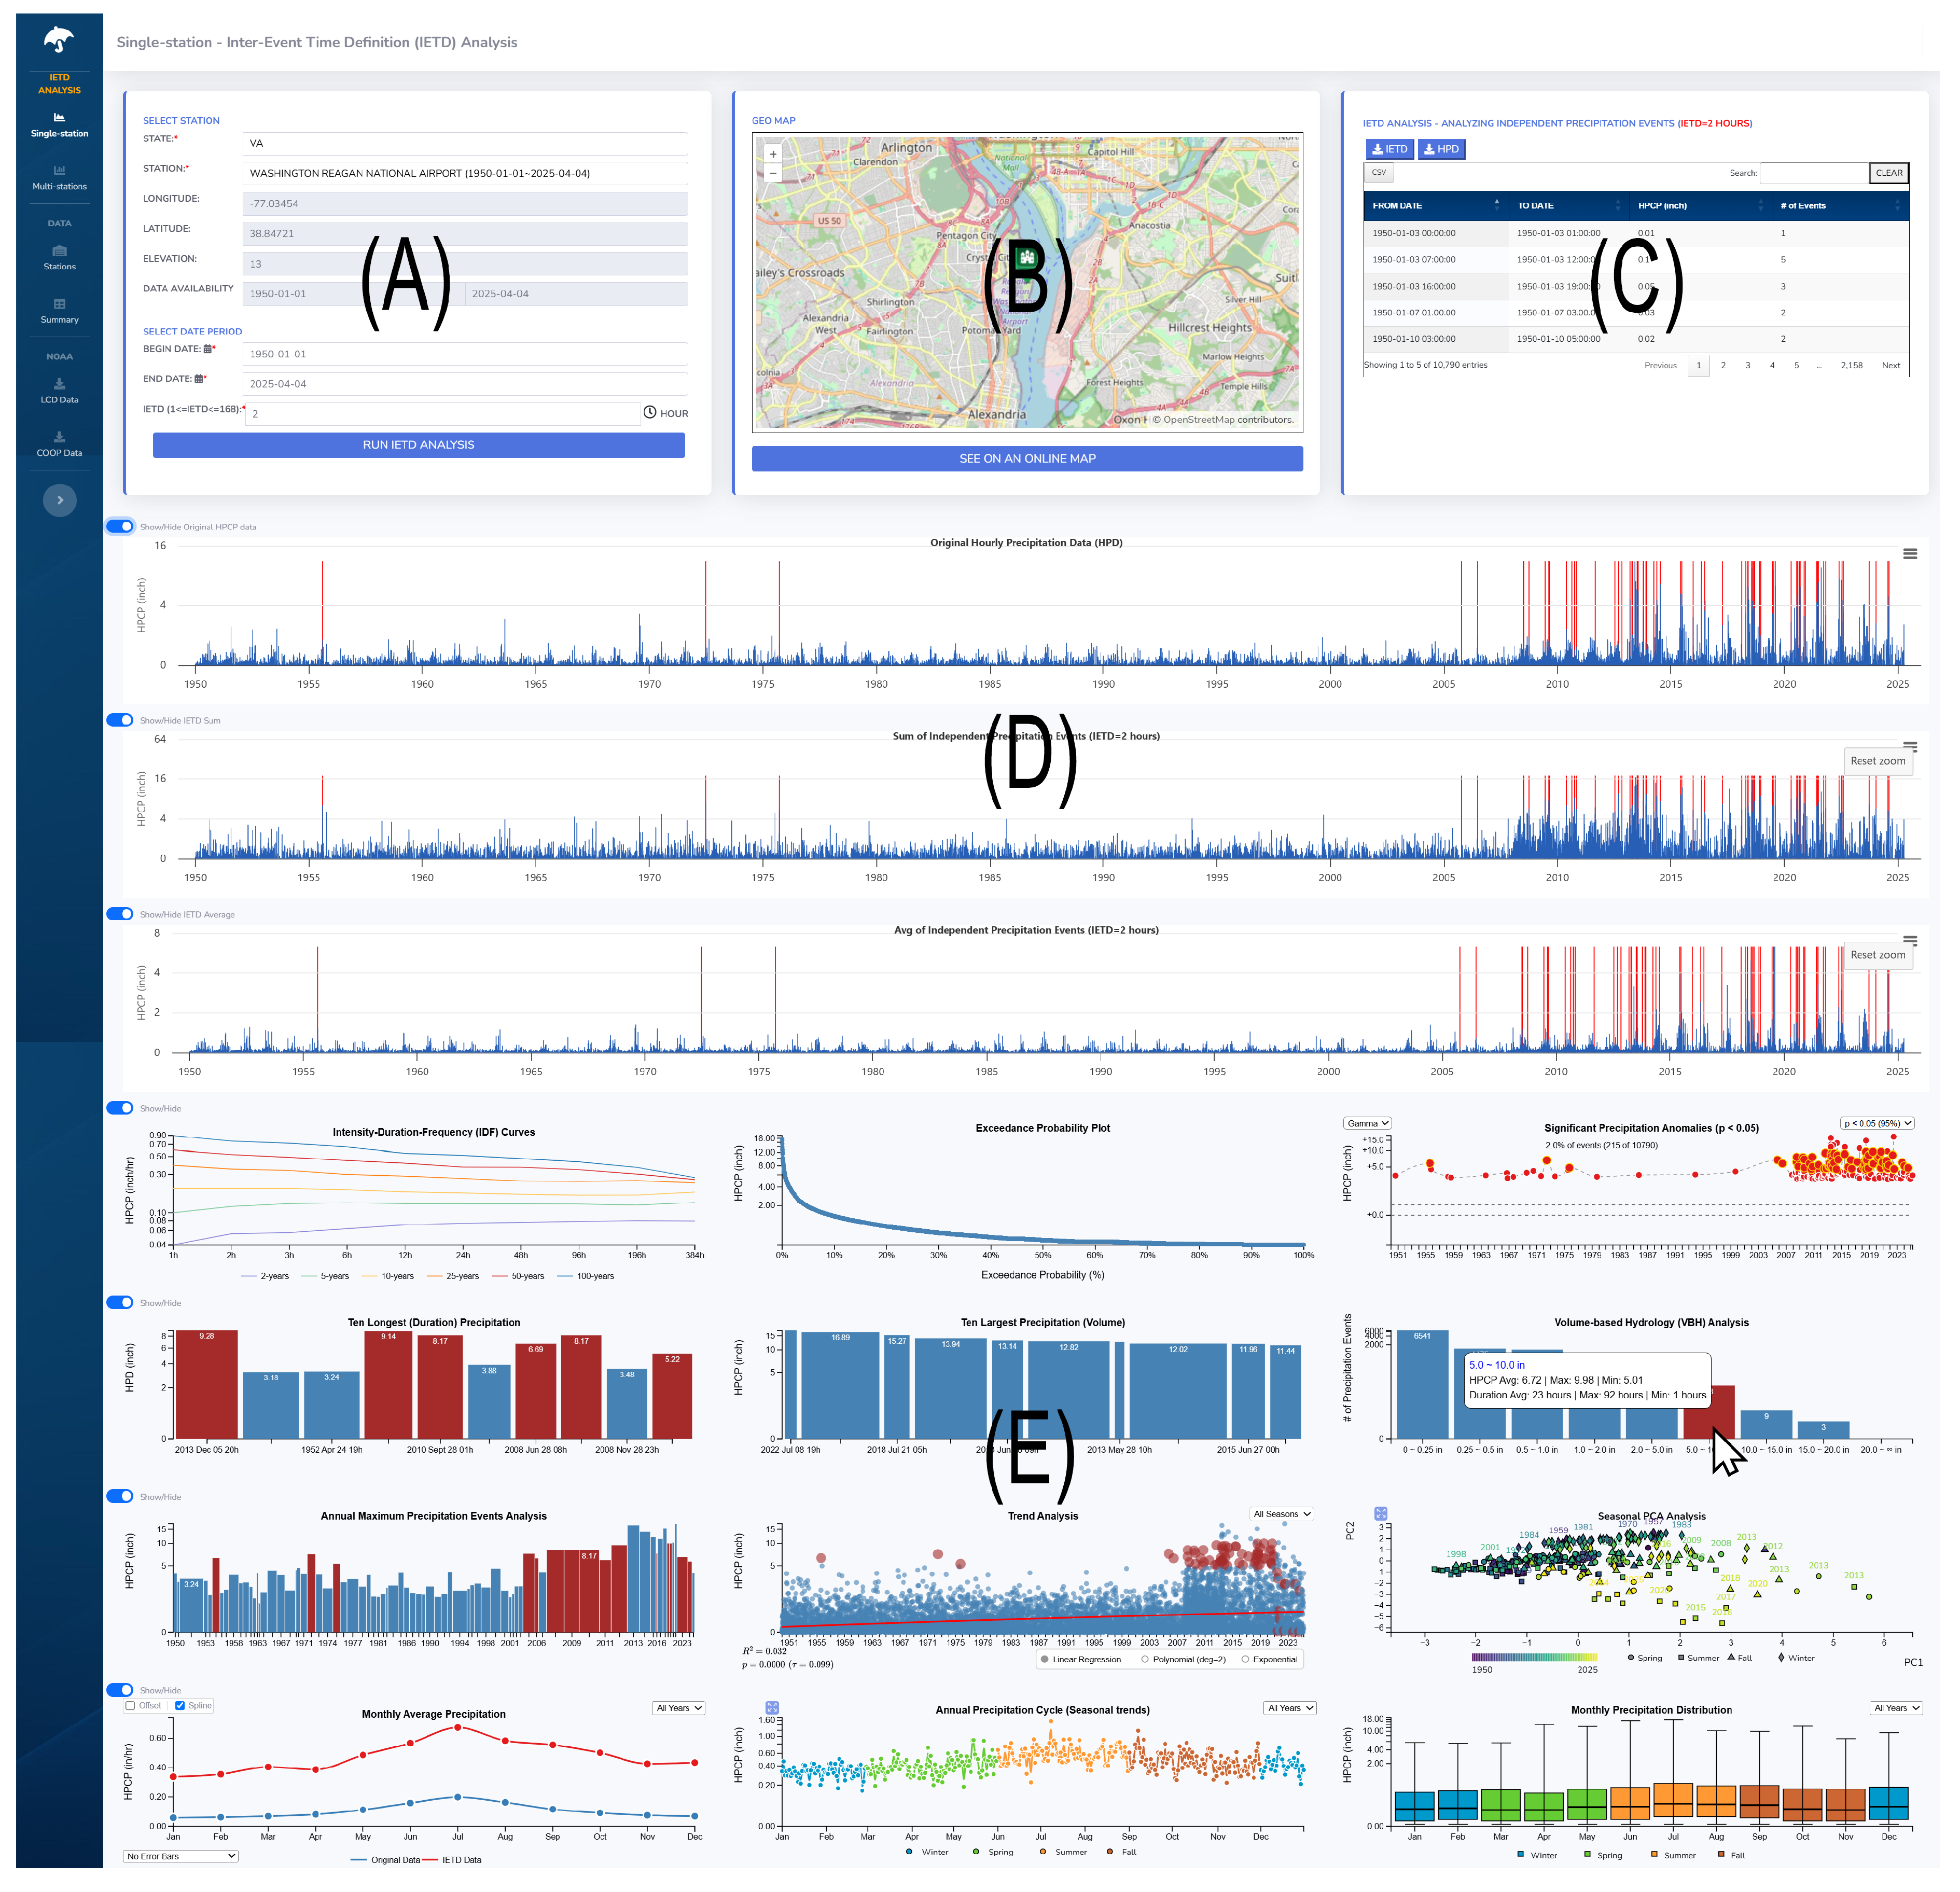
5. Interactive Precipitation Data Analysis System
5.1. Station-Specific Analysis Interface
5.1.1. Precipitation Frequency Analysis
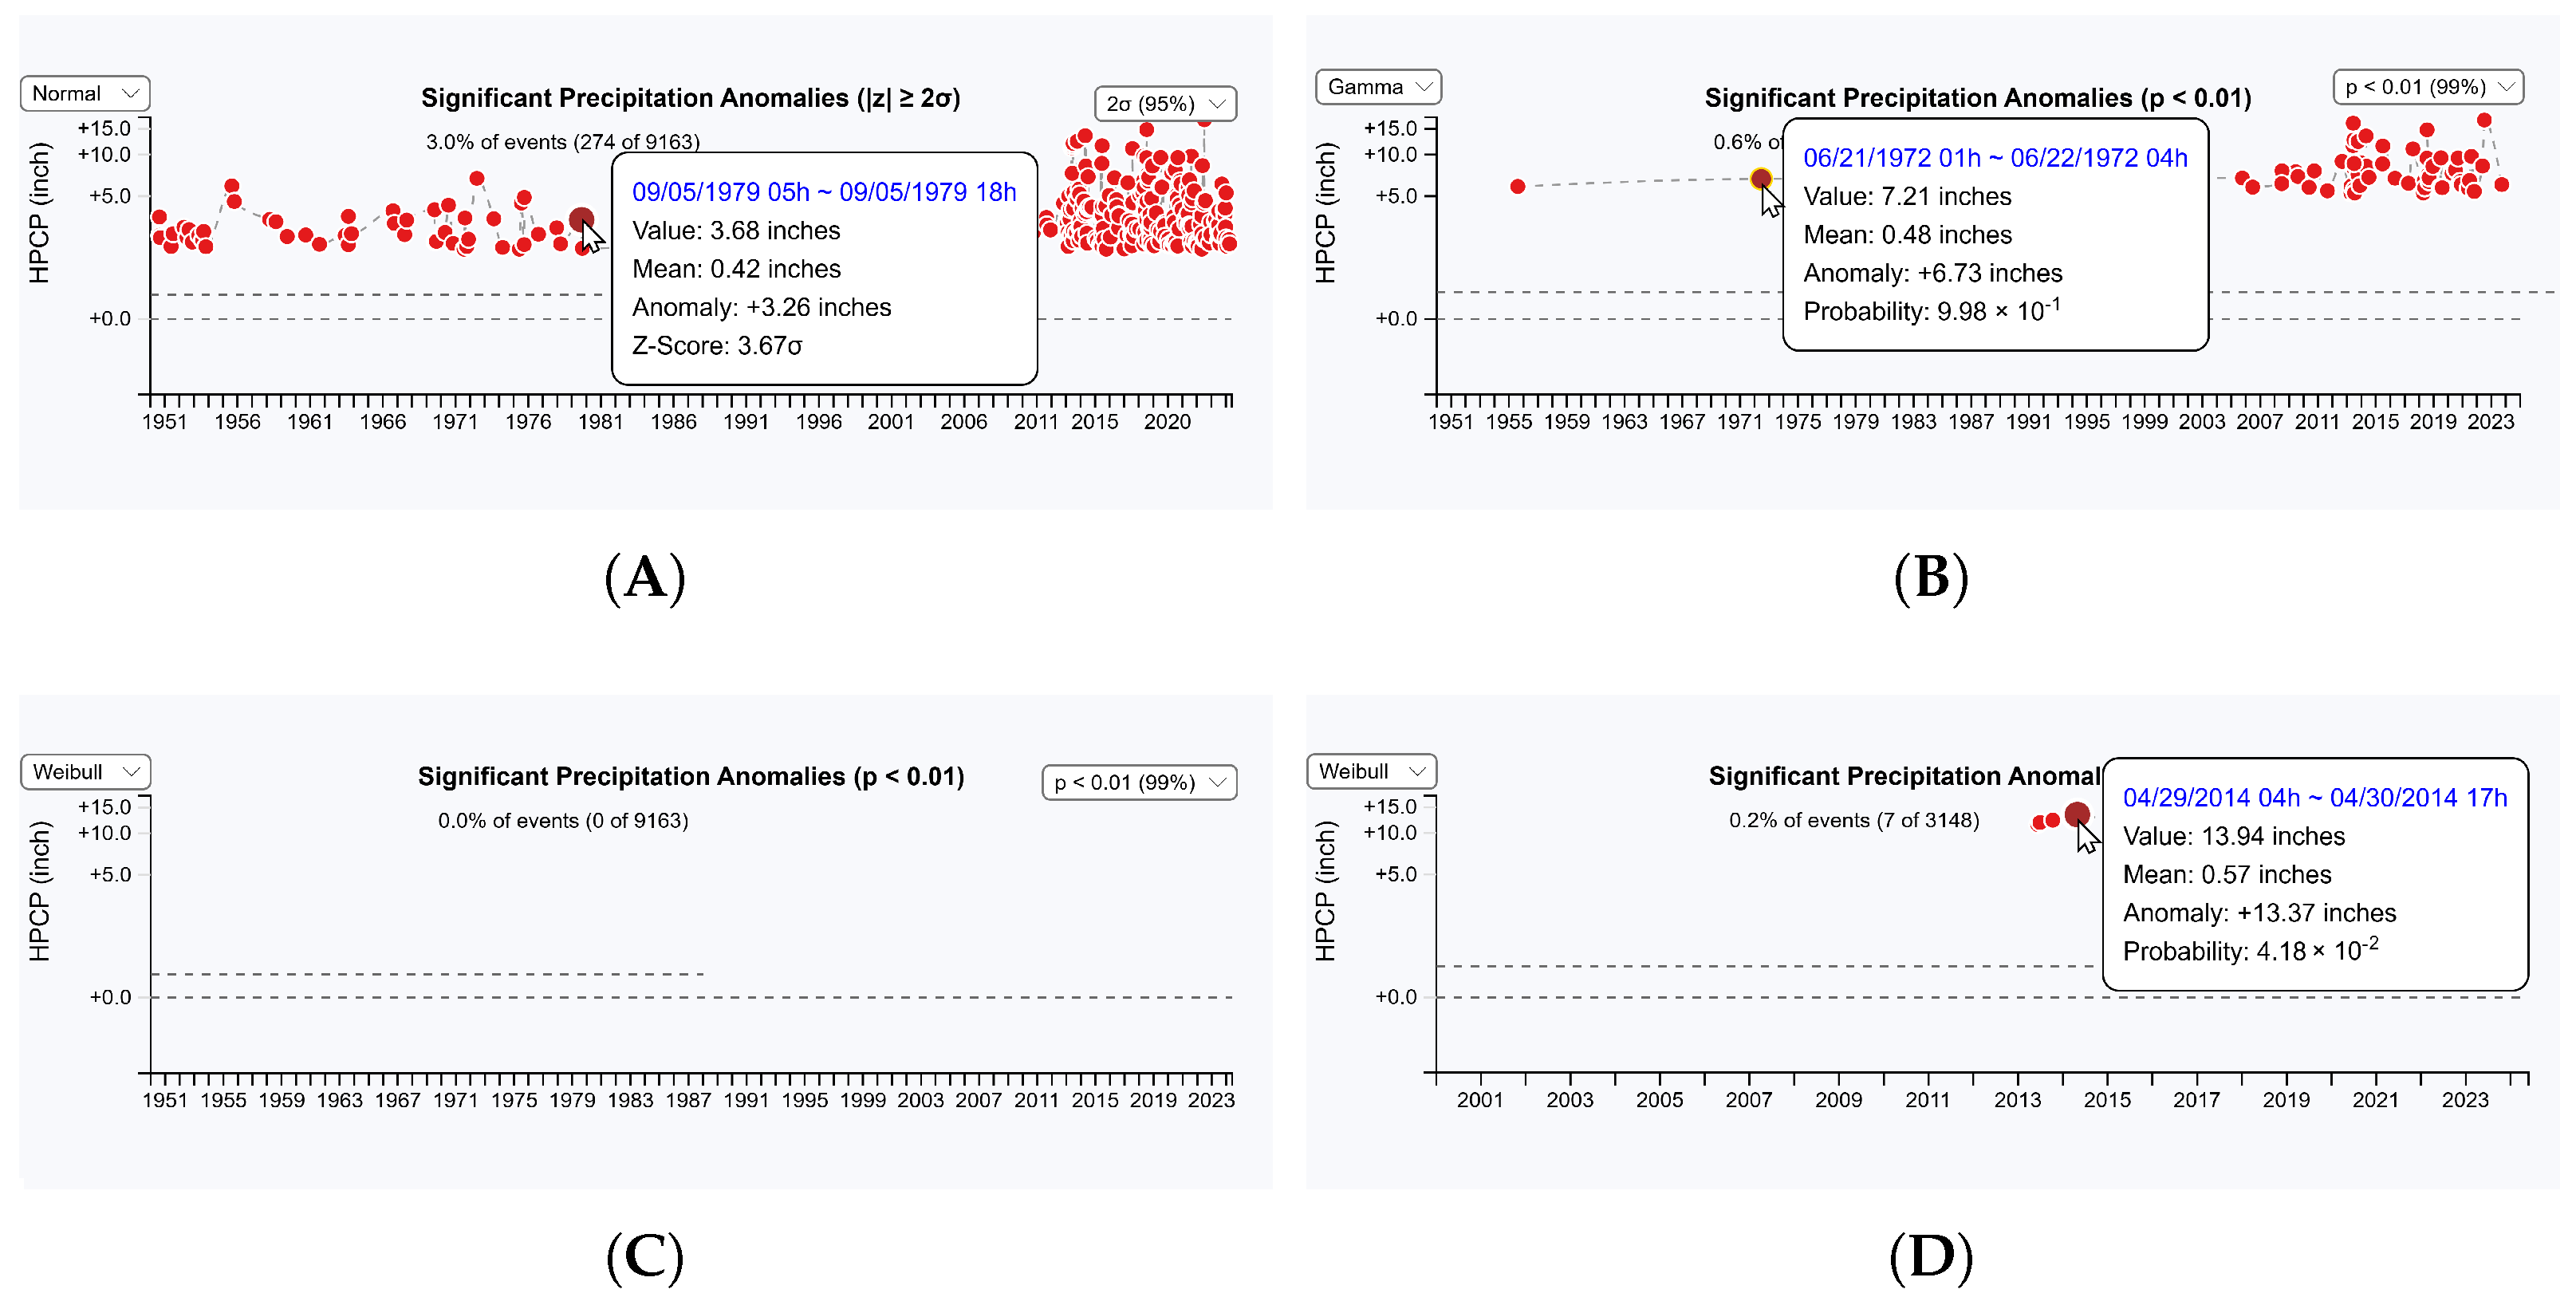
5.1.2. Precipitation Anomaly Detection
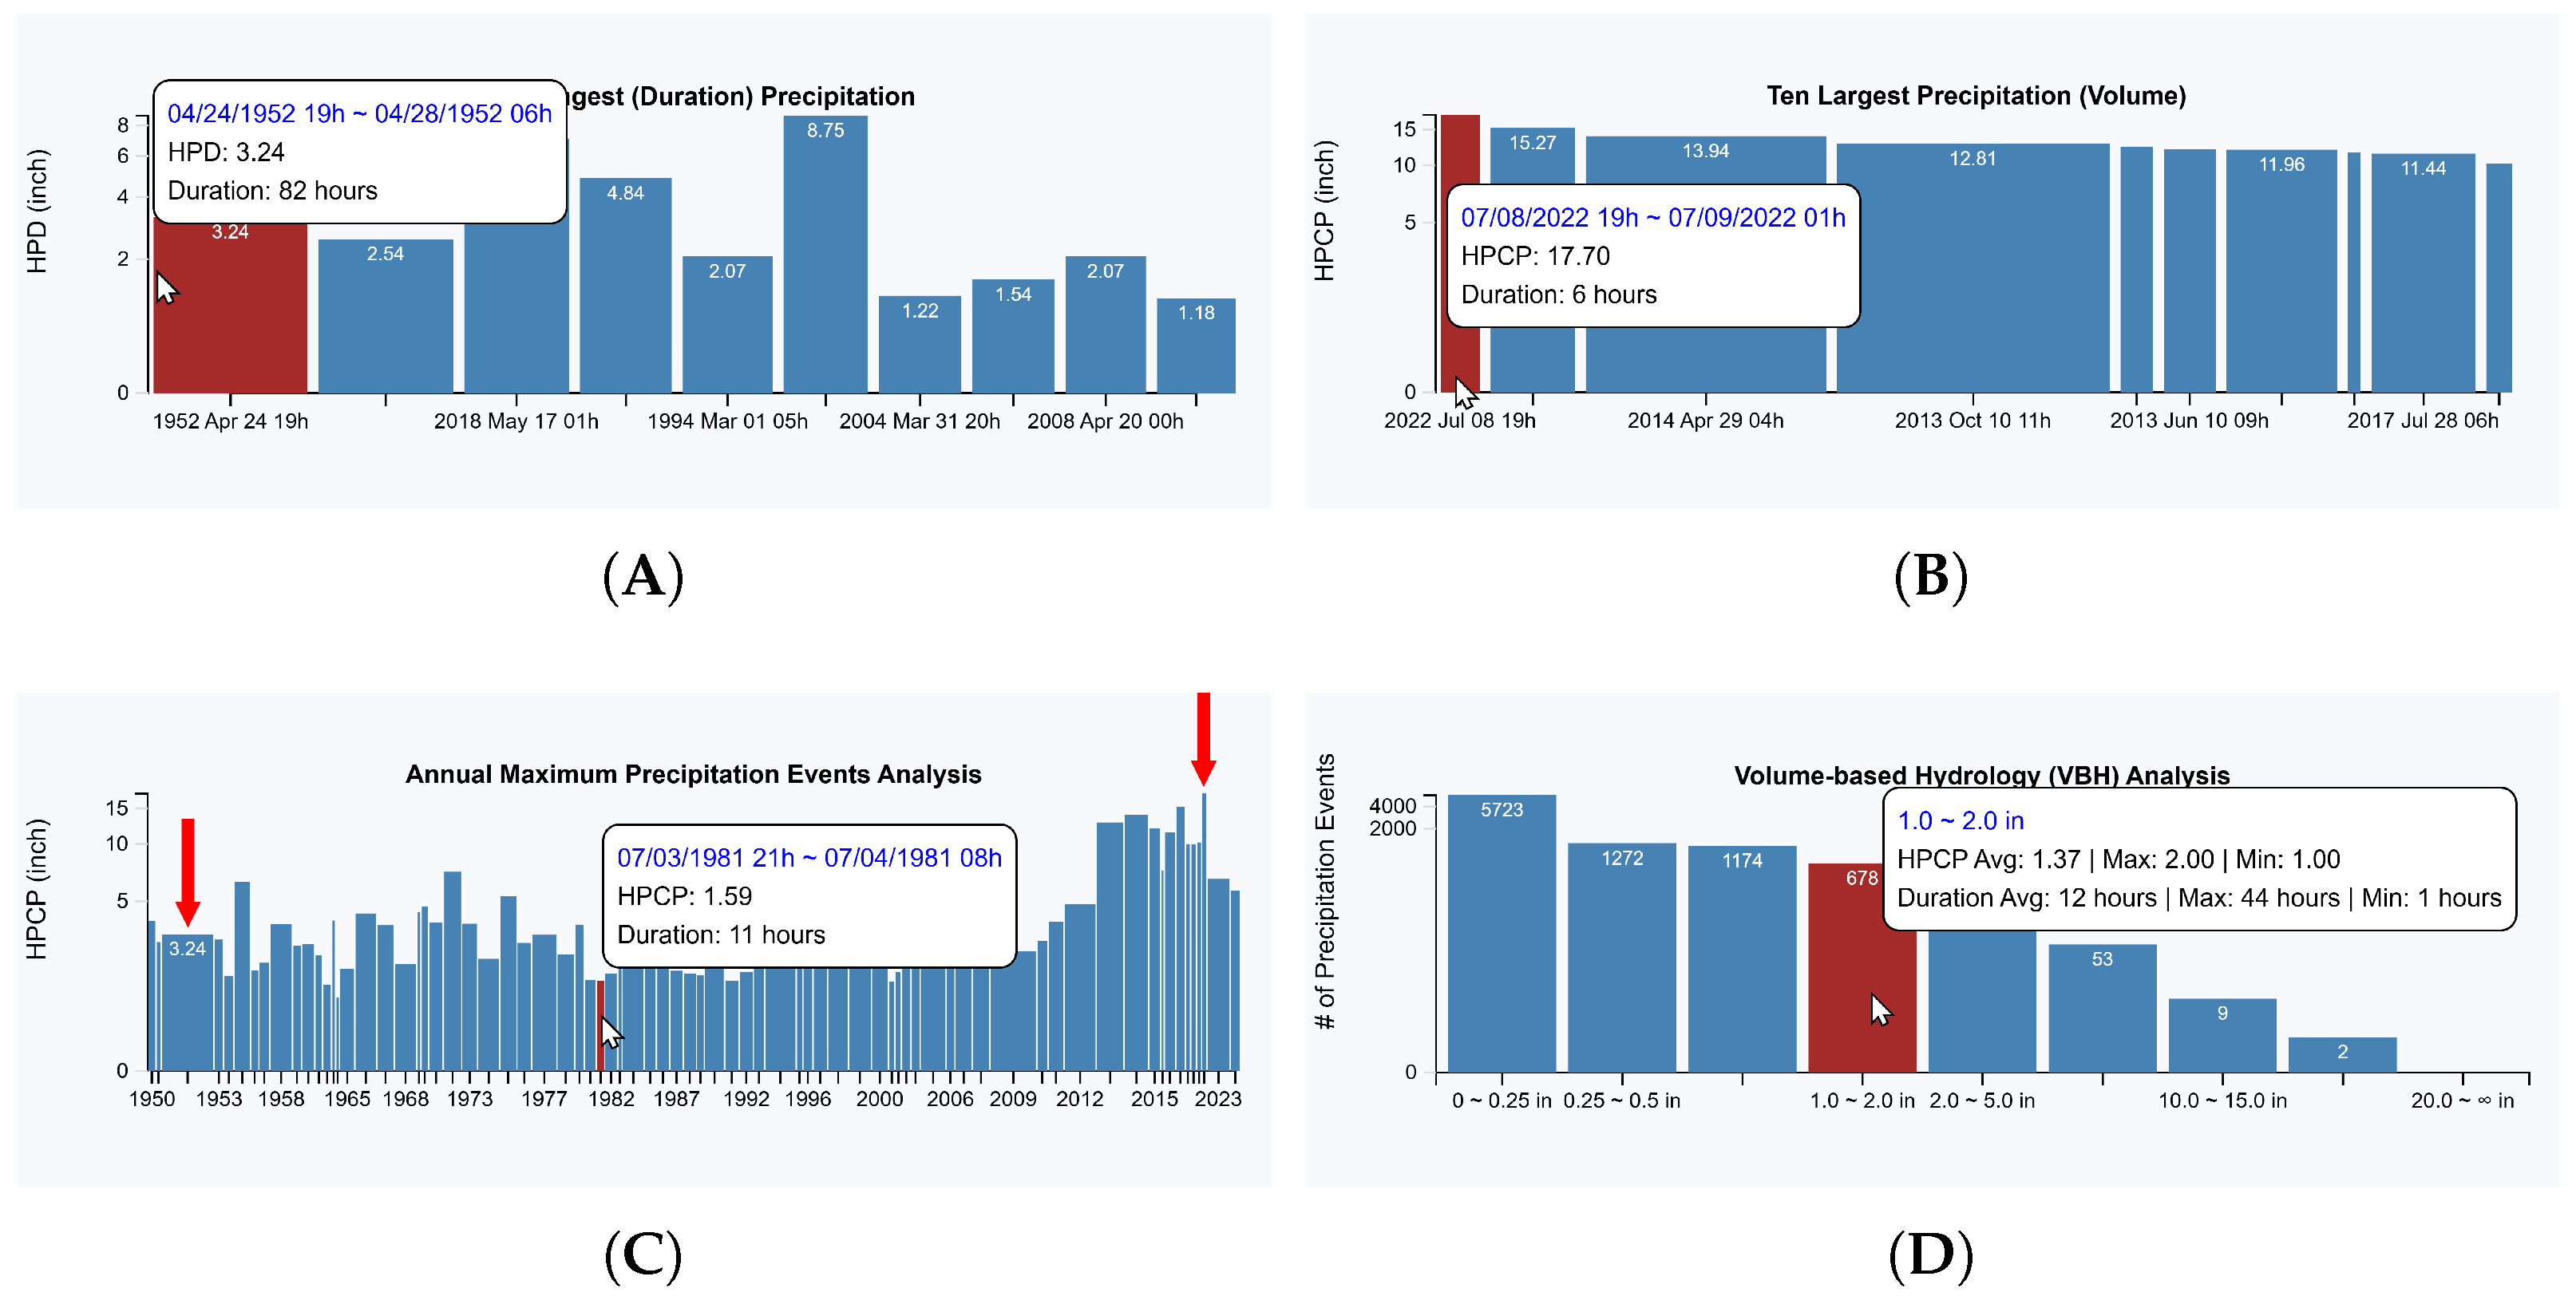
5.1.3. Analysis of Precipitation Duration and Intensity Patterns
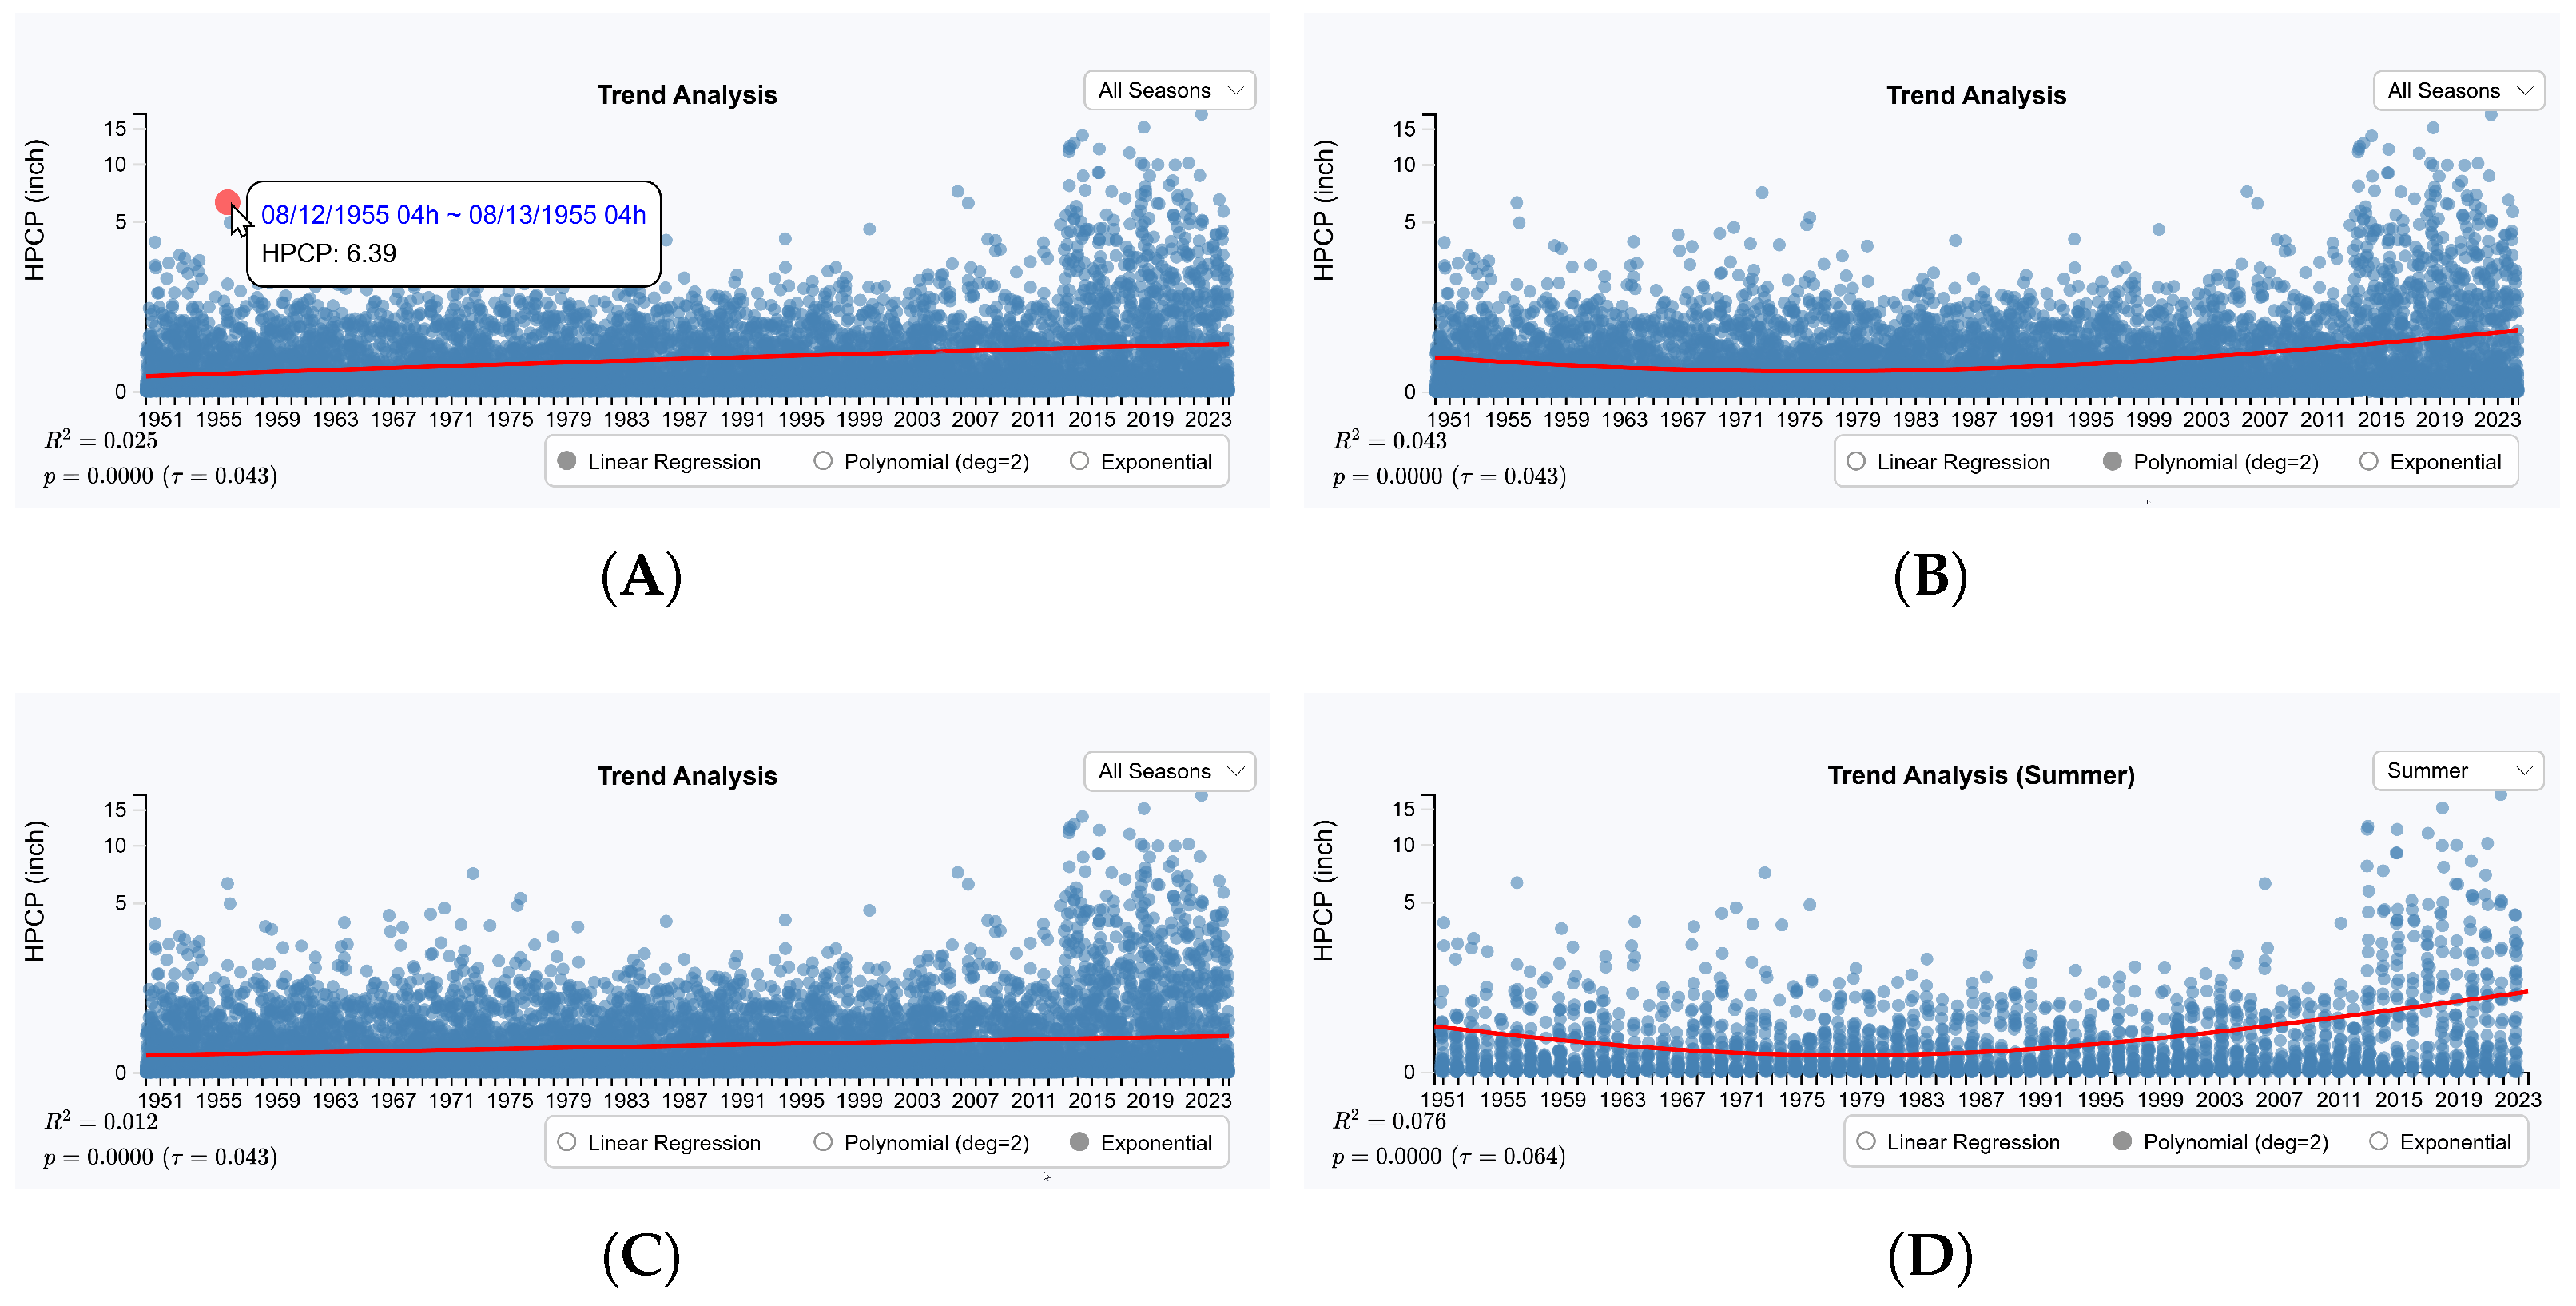
5.1.4. Precipitation Trend Analysis
5.1.5. Seasonal and Monthly Precipitation Analysis
5.2. Multi-Site Analysis Interface
5.2.1. Precipitation Trend Analysis
5.2.2. Annual PCA Analysis
5.2.3. Monthly Precipitation Analysis
6. Case Studies
6.1. Case Study: Analyzing Extreme Precipitation Variability
6.2. Case Study: Performing a Comparative Analysis on Multiple Regions
6.2.1. Trend Analysis
6.2.2. Extreme Event Analysis
6.2.3. Baseline Climatology Comparison
7. Conclusions and Future Work
Author Contributions
Funding
Institutional Review Board Statement
Informed Consent Statement
Data Availability Statement
Conflicts of Interest
Abbreviations
| ANN | Artificial Neural Networks |
| CI | Confidence Interval |
| CDF | Cumulative Distribution Function |
| COOP | Cooperative Observer Program |
| CSS | Cascading Style Sheets |
| CSV | Comma-Separated Values |
| CMVs | Coordinated Multiple Views |
| DCA | FAA ID of Washington Reagan National Airport |
| DOD | Department of Defense |
| DWT | Discrete Wavelet Transform |
| FAA | Federal Aviation Administration |
| HPD | Hourly Precipitation Data |
| HOMR | Historical Observing Metadata Repository |
| IAD | FAA ID of Washington Dulles International Airport |
| IAH | FAA ID of Houston Intercontinental Airport |
| ICAO | International Civil Aviation Organization |
| IDF | Intensity–Duration–Frequency |
| IETD | Inter-Event Time Difference |
| IL | Illinois, U.S. State |
| IQR | Interquartile Range |
| JSON | JavaScript Object Notation |
| LA | Los Angeles, California |
| LCD | Local Climatological Data |
| LSTM | Long Short-Term Memory |
| ML | Machine Learning |
| NCDC | National Climatic Data Center |
| NCEI | National Centers for Environmental Information |
| NOAA | National Oceanic and Atmospheric Administration |
| NWS | National Weather Service |
| RNN | Recurrent Neural Networks |
| SD | Standard Deviation |
| SE | Standard Error |
| SID | System Identification Number |
| SST | Stochastic Storm Transposition |
| SVD | Singular Value Decomposition |
| SVG | Scalable Vector Graphics |
| TX | Texas, U.S. State |
| VA | Virginia, U.S. State |
| WA | Washington, U.S. State |
| WMO | World Meteorological Organization |
Appendix A. Creating a Composite Weather Station Dataset
| NCDC | BEG_DT | END_DT | COOP | WBAN | ST | LAT_DMS | LON_DMS |
|---|---|---|---|---|---|---|---|
| 10000001 | 19490713 | 19501115 | 356032 | 24285 | OR | 44,35,00,N | 124,03,00,W |
| 10000001 | 19590701 | 19621001 | 24285 | OR | 44,35,00,N | 124,03,00,W | |
| 10000001 | 19621001 | 19630129 | 24285 | OR | 44,35,00,N | 124,03,00,W | |
| 10000001 | 19630129 | 19670125 | 356032 | 24285 | OR | 44,35,00,N | 124,03,00,W |
| 10000001 | 19670125 | 19800205 | 24285 | OR | 44,35,00,N | 124,03,00,W | |
| 10000001 | 19800205 | 19860516 | 356032 | 24285 | OR | 44,35,00,N | 124,03,00,W |
| 10000001 | 19860516 | 19880203 | 356032 | 24285 | OR | 44,35,00,N | 124,03,00,W |
| 10000001 | 19880203 | 19880501 | 24285 | OR | 44,35,00,N | 124,03,00,W | |
| 10000001 | 19880501 | 99991231 | 24285 | OR | 44,35,00,N | 124,03,00,W |
| COOP_ID | NCDC_ID | WBAN_ID | NAME | ST | LAT | LON |
|---|---|---|---|---|---|---|
| 503475 | 10000158|10500011 | 25322 | GUSTAVUS | AK | 58.4111 | −135.7089 |
| 506089 | 10000239 | 26489|46403 | MCKINLEY NATIONAL PARK AP | AK | 63.73333 | −148.91667 |
| 506093|505778 | 10000240|10100016 | 26429 | M | AK | 63.7175 | −148.9692 |
| 10116 | 10000485 | 53864 | ALABASTER SHELBY CO AP ASOS | AL | 33.17835 | −86.78178 |
| 15749 | 10000572 | 13896 | MUSCLE SHOALS AP | AL | 34.74388 | −87.59971 |
| NO | VAR_NAME | Explanation |
|---|---|---|
| 1 | IDX | Index |
| 2 | COOP_ID | NWS Cooperative network ID, assigned by NCEI. |
| 3 | GHCND_ID | Populated if the station is included in GHCN-Daily product by NCEI |
| 4 | NCDC_ID | A unique identifier used by NCEI. |
| 5 | NWSLI_ID | NWS location identifier |
| 6 | FAA_ID | Managed by USDT Federal Aviation Administration. |
| 7 | WBAN_ID | WBAN identifier (Weather-Bureau-Army-Navy), assigned by NCEI |
| 8 | WMO_ID | ID assigned by World Meteorological Organization |
| 9 | ICAO_ID | Managed by the International Civil Aviation Organization. |
| 10 | TRANSMITTAL_ID | The official ICAO identifier managed by the International Civil Aviation Organization. |
| 11 | TRANSMITTAL_ID_TYPE | ICAO or TRANSMITTAL |
| 12 | NAME | Station name |
| 13 | ALT_NAME | Alternate name or alias. |
| 14 | CITY | City listed on the LCD publication. |
| 15 | ST | USPS abbreviation for each state |
| 16 | COUNTY | Name of county |
| 17 | COUNTRY | FIPS country name |
| 18 | COUNTRY_CODE | FIPS country code |
| 19 | LOCATION | Station location |
| 20 | LOCATION_AREA | Location area |
| 21 | NWS_REGION | NWS region |
| 22 | ELEV | Station elevation in feet |
| 23 | ELEV_GROUND | Ground elevation. |
| 24 | ELEV_A | Wind anemometer height in feet. |
| 25 | ELEV_P | Pressure sensor elevation in feet. |
| 26 | LAT | Decimal latitude |
| 27 | LON | Decimal longitude |
| 28 | STNTYPE | Type of observing programs associated with the station. |
| 29 | UTC | Time zone |
| 30 | CALL | Federal Aviation Administration ID number |
| 31 | CALL_SIGN | Official FAA identifier for LCD stations |
| 32 | BEG_DT | Beginning date of record |
| 33 | ENG_DT | Ending date of record |
| 34 | CD | Climate division as determined by master divisional reference maps. assigned by NCEI. |
| 35 | LOC_PREC | Indicates precision of source lat and lon |
| 36 | LAT_DMS | Latitude degree, minute, etc format based on LOC_PREC precision |
| 37 | LON_DMS | Longitude degree, minute, etc format based on LOC_PREC precision |
| 38 | EL_GR_FT | Ground elevation in Feet. |
| 39 | EL_GR_M | Ground elevation in Meters. |
| 40 | EL_AP_FT | Airport: Field, Aerodrome, or Runway elevation - in Feet. |
| 41 | EL_AP_M | Airport: Field, Aerodrome, or Runway elevation - in Meters. |
| 42 | TYPE | Station type and/or platforms station participates |
| 43 | RELOCATION | Distance and direction of station relocation |
| 44 | GHCNMLT | Populated if the station is included in GHCN-Monthly Land Temperature product |
| 45 | IGRA | Populated if station is included in IGRA2 product |
| 46 | HPD | Populated if the station is included in Hourly Precipitation Data (HPD) product |
| 47 | GHCNH | Populated if the station is included in GHCN-Hourly product |
References
- Leopold, L.B. Hydrology for Urban Land Planning: A Guidebook on the Hydrologic Effects of Urban Land Use. U.S. Geol. Surv. Circ. 1968, 554. Available online: https://pubs.usgs.gov/publication/cir554 (accessed on 28 March 2025).
- Paul, M.J.; Meyer, J.L. Streams in the Urban Landscape. Annu. Rev. Ecol. Syst. 2001, 32, 333–365. [Google Scholar] [CrossRef]
- U.S. Environmental Protection Agency. Technical Guidance on Implementing the Stormwater Runoff Requirements for Federal Projects under Section 438 of the Energy Independence and Security Act. Technical Report EPA 841-B-09-001, U.S. Environmental Protection Agency, 2009. Available online: https://www.epa.gov/sites/default/files/2015-08/documents/epa_swm_guidance.pdf (accessed on 28 March 2025).
- Akan, A.O.; Houghtalen, R.J. Urban Hydrology, Hydraulics, and Stormwater Quality: Engineering Applications and Computer Modeling; John Wiley & Sons: Hoboken, NJ, USA, 2003. [Google Scholar]
- Bedient, P.B.; Huber, W.C.; Vieux, B.E. Hydrology and Floodplain Analysis, 6th ed.; Pearson: New York, NY, USA, 2018. [Google Scholar]
- Adams, B.J.; Papa, F. Urban Stormwater Management Planning with Analytical Probabilistic Models; John Wiley & Sons: New York, NY, USA, 2000. [Google Scholar]
- Guo, Y.; Adams, B.J. Hydrologic analysis of urban catchments with event-based probabilistic models: 1. Runoff volume. Water Resour. Res. 1998, 34, 3421–3431. [Google Scholar] [CrossRef]
- Chow, V.T.; Maidment, D.R.; Mays, L.W. Applied Hydrology; McGraw-Hill: New York, NY, USA, 1988. [Google Scholar]
- Easterling, D.R.; Kunkel, K.E.; Arnold, J.R.; Knutson, T.; LeGrande, A.N.; Leung, L.R.; Vose, R.S.; Waliser, D.E.; Wehner, M.F. Precipitation change in the United States. In Climate Science Special Report: Fourth National Climate Assessment, Volume I; Wuebbles, D., Fahey, D., Hibbard, K., Dokken, D., Stewart, B., Maycock, T., Eds.; U.S. Global Change Research Program: Washington, DC, USA, 2017; pp. 207–230. [Google Scholar] [CrossRef]
- Kunkel, K.E.; Karl, T.R.; Squires, M.F.; Yin, X.; Stegall, S.T.; Easterling, D.R. Precipitation Extremes: Trends and Relationships with Average Precipitation and Precipitable Water in the Contiguous United States. J. Appl. Meteorol. Climatol. 2020, 59, 125–142. [Google Scholar] [CrossRef]
- Menne, M.J.; Durre, I.; Vose, R.S.; Gleason, B.E.; Houston, T.G. An Overview of the Global Historical Climatology Network-Daily Database. J. Atmos. Ocean. Technol. 2012, 29, 897–910. [Google Scholar] [CrossRef]
- Roberts, J.C. State of the Art: Coordinated & Multiple Views in Exploratory Visualization. In Proceedings of the Fifth International Conference on Coordinated and Multiple Views in Exploratory Visualization (CMV 2007), Zurich, Switzerland, 2 July 2007; pp. 61–71. [Google Scholar] [CrossRef]
- Tominski, C.; Donges, J.F.; Nocke, T. Information Visualization in Climate Research. In Proceedings of the 2011 15th International Conference on Information Visualisation, London, UK, 13–15 July 2011; pp. 298–305. [Google Scholar] [CrossRef]
- Soe, M.M. Rainfall Prediction using Regression Model. In Proceedings of the 2023 IEEE Conference on Computer Applications (ICCA), Yangon, Myanmar, 27–28 February 2023; pp. 113–117. [Google Scholar] [CrossRef]
- Young, A.; Bhattacharya, B.; Daniëls, E.; Zevenbergen, C. Integrating WRF forecasts at different scales for pluvial flood forecasting using a rainfall threshold approach and a real-time flood model. J. Hydrol. 2025, 656, 132891. [Google Scholar] [CrossRef]
- Hiraga, Y.; Tahara, R.; Meza, J. A methodology to estimate Probable Maximum Precipitation (PMP) under climate change using a numerical weather model. J. Hydrol. 2025, 652, 132659. [Google Scholar] [CrossRef]
- Kumar, D.; Singh, A.; Samui, P.; Jha, R.K. Forecasting monthly precipitation using sequential modelling. Hydrol. Sci. J. 2019, 64, 690–700. [Google Scholar] [CrossRef]
- Manandhar, S.; Dev, S.; Lee, Y.H.; Meng, Y.S.; Winkler, S. A Data-Driven Approach for Accurate Rainfall Prediction. IEEE Trans. Geosci. Remote Sens. 2019, 57, 9323–9331. [Google Scholar] [CrossRef]
- Bartwal, K.; Pathak, N.; Alexander, J.; Aeri, M.; Dhondiyal, S.A.; Awasthi, S. Rainfall Prediction Using Machine Learning. In Proceedings of the 2024 2nd International Conference on Disruptive Technologies (ICDT), Greater Noida, India, 15–16 March 2024; pp. 582–588. [Google Scholar] [CrossRef]
- Partal, T.; Kahya, E. Trend analysis in Turkish precipitation data. Hydrol. Process. 2006, 20, 2011–2026. [Google Scholar] [CrossRef]
- Zerouali, B.; Elbeltagi, A.; Al-Ansari, N.; Abda, Z.; Chettih, M.; Santos, C.A.G.; Boukhari, S.; Araibia, A.S. Improving the visualization of rainfall trends using various innovative trend methodologies with time–frequency-based methods. Appl. Water Sci. 2022, 12, 207. [Google Scholar] [CrossRef]
- Panda, A.; Sahu, N. Trend analysis of seasonal rainfall and temperature pattern in Kalahandi, Bolangir and Koraput districts of Odisha, India. Atmos. Sci. Lett. 2019, 20, e932. [Google Scholar] [CrossRef]
- Mallakpour, I.; Villarini, G. The changing nature of flooding across the central United States. Nat. Clim. Change 2015, 5, 250–254. [Google Scholar] [CrossRef]
- Zhou, Z.; Smith, J.A.; Wright, D.B.; Baeck, M.L.; Yang, L.; Liu, S. Storm Catalog-Based Analysis of Rainfall Heterogeneity and Frequency in a Complex Terrain. Water Resour. Res. 2019, 55, 1871–1889. [Google Scholar] [CrossRef]
- Wright, D.B.; Yu, G.; England, J.F. Six decades of rainfall and flood frequency analysis using stochastic storm transposition: Review, progress, and prospects. J. Hydrol. 2020, 585, 124816. [Google Scholar] [CrossRef]
- Pawar, N.; Dhamge, N.R.; Kharkar, O.; Yeole, V.; Siddham, U.; Meshram, N. Frequency Analysis of Rainfall Data. Int. J. Res. Appl. Sci. Eng. Technol. 2023, 11, 2181–2186. [Google Scholar] [CrossRef]
- Hael, M.A.; Yongsheng, Y.; Saleh, B.I. Visualization of rainfall data using functional data analysis. SN Appl. Sci. 2020, 2, 461. [Google Scholar] [CrossRef]
- Hu, Q. On the Uniqueness of the Singular Value Decomposition in Meteorological Applications. J. Clim. 1997, 10, 1762–1766. [Google Scholar] [CrossRef]
- Joo, J.; Lee, J.; Kim, J.H.; Jun, H.; Jo, D. Inter-Event Time Definition Setting Procedure for Urban Drainage Systems. Water 2014, 6, 45–58. [Google Scholar] [CrossRef]
- Dey, A.; Hazra, A. A Semiparametric Generalized Exponential Regression Model with a Principled Distance-based Prior for Analyzing Trends in Rainfall. arXiv 2023, arXiv:2309.03165. [Google Scholar] [CrossRef]
- Zhang, J.; Xu, J.; Dai, X.; Ruan, H.; Liu, X.; Jing, W. Multi-Source Precipitation Data Merging for Heavy Rainfall Events Based on Cokriging and Machine Learning Methods. Remote Sens. 2022, 14, 1750. [Google Scholar] [CrossRef]
- Lawrimore, J.H.; Wuertz, D.; Wilson, A.; Stevens, S.; Menne, M.; Korzeniewski, B.; Palecki, M.A.; Leeper, R.D.; Trunk, T. Quality Control and Processing of Cooperative Observer Program Hourly Precipitation Data. J. Hydrometeorol. 2020, 21, 1811–1825. [Google Scholar] [CrossRef]
- DeGaetano, A.T.; Mooers, G.; Favata, T. Temporal Changes in the Areal Coverage of Daily Extreme Precipitation in the Northeastern United States Using High-Resolution Gridded Data. J. Appl. Meteorol. Climatol. 2020, 59, 551–565. [Google Scholar] [CrossRef]
- Maidment, D.R. Arc Hydro: GIS for Water Resources; ESRI Press: Redlands, CA, USA, 2002. [Google Scholar]
- Gerst, M.D.; Kenney, M.A.; Baer, A.E.; Speciale, A.; Wolfinger, J.F.; Gottschalck, J.; Handel, S.; Rosencrans, M.; Dewitt, D. Using Visualization Science to Improve Expert and Public Understanding of Probabilistic Temperature and Precipitation Outlooks. Weather. Clim. Soc. 2020, 12, 117–133. [Google Scholar] [CrossRef]
- Gimesi, L. Development of a visualization method suitable to present tendencies of changes in precipitation. J. Hydrol. 2009, 377, 185–190. [Google Scholar] [CrossRef]
- Tanaka, Y.; Angeliki, G.; Henry, E.; Raidou, R.; Gröller, E.; Itoh, T. Visualization of Relationships between Precipitation and River Water Levels. In Proceedings of the 2024 28th International Conference Information Visualisation (IV), Coimbra, Portugal, 22–26 July 2024; pp. 1–6. [Google Scholar] [CrossRef]
- National Oceanic and Atmospheric Administration. NOAA’s Cooperative Observer Program: The Nation’s Oldest and Largest Weather Network. Technical Report, National Weather Service, 2014. Available online: https://www.weather.gov/coop/ (accessed on 28 March 2025).
- Demaria, E.M.C.; Goodrich, D.C.; Kunkel, K.E. Evaluating the Reliability of the U.S. Cooperative Observer Program Precipitation Observations for Extreme Events Analysis Using the LTAR Network. J. Atmos. Ocean. Technol. 2019, 36, 317–332. [Google Scholar] [CrossRef]
- National Centers for Environmental Information. Local Climatological Data (LCD). Technical Report, NOAA, 2020. Available online: https://www.ncdc.noaa.gov/cdo-web/datatools/lcd (accessed on 28 March 2025).
- Balistrocchi, M.; Bacchi, B. Modelling the statistical dependence of rainfall event variables through copula functions. Hydrol. Earth Syst. Sci. 2011, 15, 1959–1977. [Google Scholar] [CrossRef]
- Palynchuk, B.A.; Guo, Y. Threshold analysis of rainstorm depth and duration statistics at Toronto, Canada. J. Hydrol. 2008, 348, 335–345. [Google Scholar] [CrossRef]
- Restrepo-Posada, P.J.; Eagleson, P.S. Identification of independent rainstorms. J. Hydrol. 1982, 55, 303–319. [Google Scholar] [CrossRef]
- Bostock, M.; Ogievetsky, V.; Heer, J. D3 Data-Driven Documents. IEEE Trans. Vis. Comput. Graph. 2011, 17, 2301–2309. [Google Scholar] [CrossRef]
- Zhao, W.; Abhishek; Kinouchi, T. Uncertainty quantification in intensity-duration-frequency curves under climate change: Implications for flood-prone tropical cities. Atmos. Res. 2022, 270, 106070. [Google Scholar] [CrossRef]
- Olivera, M.; Heard, C. Increases in the extreme rainfall events: Using the Weibull distribution. Environmetrics 2018, 30, e2532. [Google Scholar] [CrossRef]
- Maidment, D.R. Handbook of Hydrology; McGraw-Hill: New York, NY, USA, 1993. [Google Scholar]
- Martinez-Villalobos, C.; Neelin, J.D. Why Do Precipitation Intensities Tend to Follow Gamma Distributions? J. Atmos. Sci. 2019, 76, 3611–3631. [Google Scholar] [CrossRef]
- Martinez-Villalobos, C.; Neelin, J.D. Shifts in Precipitation Accumulation Extremes During the Warm Season Over the United States. Geophys. Res. Lett. 2018, 45, 8586–8595. [Google Scholar] [CrossRef]
- USGCRP. Impacts, Risks, and Adaptation in the United States: Fourth National Climate Assessment, Volume II; Reidmiller, D.R., Avery, C.W., Easterling, D.R., Kunkel, K.E., Lewis, K.L.M., Maycock, T.K., Stewart, B.C., Eds.; U.S. Global Change Research Program: Washington, DC, USA, 2018; p. 1515. [CrossRef]
- Marra, F.; Amponsah, W.; Papalexiou, S.M. Non-asymptotic Weibull tails explain the statistics of extreme daily precipitation. Adv. Water Resour. 2023, 173, 104388. [Google Scholar] [CrossRef]
- Pieper, P.; Düsterhus, A.; Baehr, J. A universal Standardized Precipitation Index candidate distribution function for observations and simulations. Hydrol. Earth Syst. Sci. 2020, 24, 4541–4565. [Google Scholar] [CrossRef]
- Burden, R.L.; Faires, J.D. Numerical Analysis, 9th ed.; Cengage Learning: Boston, MA, USA, 2011. [Google Scholar]
- Qiu, J.; Shen, Z.; Leng, G.; Wei, G. Synergistic effect of drought and rainfall events of different patterns on watershed systems. Sci. Rep. 2021, 11, 18957. [Google Scholar] [CrossRef] [PubMed]
- Day, S.J. Managing Water Locally: An Inquiry Into Community-Based Water Resources Management in Fragile States. Ph.D. Thesis, Cranfield University, Cranfield, UK, 2016. Available online: https://core.ac.uk/download/42144249.pdf (accessed on 28 March 2025).
- Weisberg, S. Applied Linear Regression; Wiley Series in Probability and Statistics; Wiley: Hoboken, NJ, USA, 2005. [Google Scholar]
- Hu, Z.; Liu, S.; Zhong, G.; Lin, H.; Zhou, Z. Modified Mann-Kendall trend test for hydrological time series under the scaling hypothesis and its application. Hydrol. Sci. J. 2020, 65, 2419–2438. [Google Scholar] [CrossRef]
- Guilbert, J.; Betts, A.K.; Rizzo, D.M.; Beckage, B.; Bomblies, A. Characterization of increased persistence and intensity of precipitation in the northeastern United States. Geophys. Res. Lett. 2015, 42, 1888–1893. [Google Scholar] [CrossRef]
- Hatsuzuka, D.; Sato, T.; Higuchi, Y. Sharp rises in large-scale, long-duration precipitation extremes with higher temperatures over Japan. Npj Clim. Atmos. Sci. 2021, 4, 29. [Google Scholar] [CrossRef]
- Şan, M.; Nacar, S.; Kankal, M.; Bayram, A. Daily precipitation performances of regression-based statistical downscaling models in a basin with mountain and semi-arid climates. Stoch. Environ. Res. Risk Assess. 2023, 37, 1431–1455. [Google Scholar] [CrossRef]
- Villarini, G. On the seasonality of flooding across the continental United States. Adv. Water Resour. 2016, 87, 80–91. [Google Scholar] [CrossRef]
- Shi, W.; Hu, Y. A study on the forecast model of winter precipitation type in Liaocheng based on physical parameters. Meteorol. Appl. 2023, 30, e2126. [Google Scholar] [CrossRef]
- Clark, A.J. Generation of Ensemble Mean Precipitation Forecasts from Convection-Allowing Ensembles. Weather Forecast. 2017, 32, 1569–1583. [Google Scholar] [CrossRef]
- Xie, B.; Guo, H.; Meng, F.; Sa, C.; Luo, M. Historical Evolution and Future Trends of Precipitation Based on Integrated Datasets and Model Simulations of Arid Central Asia. Remote Sens. 2023, 15, 5460. [Google Scholar] [CrossRef]
- Xie, P.; Arkin, P.A. Global Precipitation: A 17-Year Monthly Analysis Based on Gauge Observations, Satellite Estimates, and Numerical Model Outputs. Bull. Am. Meteorol. Soc. 1997, 78, 2539–2558. [Google Scholar] [CrossRef]
- Swain, D.L.; Langenbrunner, B.; Neelin, J.D.; Hall, A. Increasing precipitation volatility in twenty-first-century California. Nat. Clim. Chang. 2018, 8, 427–433. [Google Scholar] [CrossRef]
- Zhang, W.; Villarini, G.; Vecchi, G.A.; Smith, J.A. Urbanization exacerbated the rainfall and flooding caused by hurricane Harvey in Houston. Nature 2018, 563, 384–388. [Google Scholar] [CrossRef]
- Nielsen-Gammon, J.W.; Zhang, F.; Odins, A.M.; Myoung, B. Extreme rainfall in Texas: Patterns and predictability. Phys. Geogr. 2012, 33, 133–156. [Google Scholar] [CrossRef]
- Mahoney, K.; Ralph, F.M.; Wolter, K.; Doesken, N.; Dettinger, M.; Gottas, D.; Coleman, T.; White, A. Climatology of extreme daily precipitation in Colorado and its diverse spatial and seasonal variability. J. Hydrometeorol. 2018, 19, 69–91. [Google Scholar] [CrossRef]
- Friedrich, K.; Kalina, E.A.; Aikins, J.; Steiner, M.; Gochis, D.; Kucera, P.A.; Ikeda, K.; Sun, J. Raindrop Size Distribution and Rain Characteristics during the 2013 Great Colorado Flood. J. Hydrometeorol. 2016, 17, 53–72. [Google Scholar] [CrossRef]
- Christian, J.; Christian, K.; Basara, J.B. Drought and pluvial dipole events within the Great Plains of the United States. J. Appl. Meteorol. Climatol. 2015, 54, 1886–1898. [Google Scholar] [CrossRef]
- Brooks, H.E.; Doswell, C.A.; Kay, M.P. Climatological Estimates of Local Daily Tornado Probability for the United States. Weather Forecast. 2003, 18, 626–640. [Google Scholar] [CrossRef]
- Kunkel, K.E.; Karl, T.R.; Brooks, H.; Kossin, J.; Lawrimore, J.H.; Arndt, D.; Bosart, L.; Changnon, D.; Cutter, S.L.; Doesken, N.; et al. Monitoring and understanding trends in extreme storms: State of knowledge. Bull. Am. Meteorol. Soc. 2013, 94, 499–514. [Google Scholar] [CrossRef]
- Huang, X.; Wang, C. Estimates of exposure to the 100-year floods in the conterminous United States using national building footprints. Int. J. Disaster Risk Reduct. 2020, 50, 101731. [Google Scholar] [CrossRef]
- Watson, K.M.; Harwell, G.R.; Wallace, D.S.; Welborn, T.L.; Stengel, V.G.; McDowell, J.S. Characterization of Peak Streamflows and Flood Inundation at Selected Areas in Texas Following the 2016 Spring Floods; Technical Report Scientific Investigations Report 2018-5062; U.S. Geological Survey: Reston, VA, USA, 2018. [CrossRef]
- Herbert, P.J. Atlantic Hurricane Season of 1979. Monthly Weather Review, National Hurricane Center, 1980. Available online: http://www.aoml.noaa.gov/general/lib/lib1/nhclib/mwreviews/1979.pdf (accessed on 28 March 2025).
- Liscum, F.; Weigel, J.F.; Johnson, S.L. Hydrologic Data for Urban Studies in the Houston, Texas Metropolitan Area, 1979. Open-File Report 81-264, U.S. Geological Survey, Austin, Texas, 1980. Available online: https://pubs.usgs.gov/of/1981/0264/report.pdf (accessed on 28 March 2025).
- Blake, E.S.; Zelinsky, D.A. National Hurricane Center Tropical Cyclone Report: Hurricane Harvey. Tropical Cyclone Report AL092017, National Hurricane Center, NOAA, 2018. Available online: https://www.nhc.noaa.gov/data/tcr/AL092017_Harvey.pdf (accessed on 28 March 2025).
- Nielsen, E.R.; Schumacher, R.S. Dynamical Mechanisms Supporting Extreme Rainfall Accumulations in the Houston “Tax Day” 2016 Flood. Mon. Weather Rev. 2020, 148, 83–109. [Google Scholar] [CrossRef]
- Lower Brazos Regional Flood Planning Group. 2023 Lower Brazos Amended Regional Flood Plan; Technical Report, Texas Water Development Board, 2023; Halff Associates, Inc.: Fort Worth, TX, USA, 2023. [Google Scholar]
- Kunkel, K.E.; Champion, S.M. An Assessment of Rainfall from Hurricanes Harvey and Florence Relative to Other Extremely Wet Storms in the United States. Geophys. Res. Lett. 2019, 46, 13500–13506. [Google Scholar] [CrossRef]
- Emanuel, K. Assessing the present and future probability of Hurricane Harvey’s rainfall. Proc. Natl. Acad. Sci. USA 2017, 114, 12681–12684. [Google Scholar] [CrossRef] [PubMed]
- Dettinger, M. Climate change, atmospheric rivers, and floods in California–a multimodel analysis of storm frequency and magnitude changes. JAWRA J. Am. Water Resour. Assoc. 2011, 47, 514–523. [Google Scholar] [CrossRef]
- Overland, J.E.; Walter, B.A. Marine Weather of the Inland Waters of Western Washington. Noaa Technical Memorandum erl pmel-44, NOAA Pacific Marine Environmental Laboratory, 1983. Available online: https://www.pmel.noaa.gov/pubs/PDF/over595/over595.pdf (accessed on 28 March 2025).
- Feng, Z.; Leung, L.R.; Hagos, S.; Houze, R.A.; Burleyson, C.D.; Balaguru, K. More frequent intense and long-lived storms dominate the springtime trend in central US rainfall. Nat. Commun. 2016, 7, 13429. [Google Scholar] [CrossRef]
- Hayhoe, K.; VanDorn, J.; Croley, T.; Schlegal, N.; Wuebbles, D. Regional climate change projections for Chicago and the US Great Lakes. J. Great Lakes Res. 2010, 36, 7–21. [Google Scholar] [CrossRef]
- Smith, E.N.; Gebauer, J.G.; Klein, P.M.; Fedorovich, E.; Gibbs, J.A. The Great Plains Low-Level Jet during PECAN: Observed and Simulated Characteristics. Mon. Weather Rev. 2019, 147, 1845–1869. [Google Scholar] [CrossRef]
- Angel, J.; Markus, M. Frequency Distributions of Heavy Precipitation in Illinois: Updated Bulletin 70; Number CR-2019-05 in ISWS Contract Report, Illinois State Water Survey, 2019. Available online: https://experts.illinois.edu/en/publications/frequency-distributions-of-heavy-precipitation-in-illinois-update (accessed on 28 March 2025).
- Andresen, J.; Hilberg, S.; Kunkel, K. Historical Climate and Climate Trends in the Midwestern USA. In U.S. National Climate Assessment Midwest Technical Input Report; Great Lakes Integrated Sciences and Assessments Center: Ann Arbor, MI, USA, 2012; pp. 1–18. Available online: https://glisa.umich.edu/media/files/NCA/MTIT_Historical.pdf (accessed on 28 March 2025).
- Dong, L.; Leung, L.R. Roles of External Forcing and Internal Variability in Precipitation Changes of a Sub-Region of the U.S. Mid-Atlantic During 1979–2019. J. Geophys. Res. Atmos. 2022, 127, e2022JD037493. [Google Scholar] [CrossRef]
- California Department of Water Resources. The 1976–1977 California Drought–A Review. Technical Report 165, California Department of Water Resources, Sacramento, California, 1978. Available online: https://cawaterlibrary.net/wp-content/uploads/2017/05/Drought-1976-77.pdf (accessed on 28 March 2025).
- U.S. General Accounting Office. CED-77-137 California Drought of 1976 and 1977–Extent, Damage, and Governmental Response. Report to the Congress CED-77-137, U.S. General Accounting Office, Washington, D.C, 1977. Available online: https://www.gao.gov/assets/ced-77-137.pdf (accessed on 28 March 2025).
- Campos, E.; Wang, J. Numerical simulation and analysis of the April 2013 Chicago floods. J. Hydrol. 2015, 531, 454–474. [Google Scholar] [CrossRef]
- Rogers, M. July 2013: 13th Warmest on Record (tie), Slightly Wetter Than Average in D.C. The Washington Post, 1 August 2013. Available online: https://www.washingtonpost.com/news/capital-weather-gang/wp/2013/08/01/july-2013-13th-warmest-on-record-tie-slightly-wetter-than-average-in-d-c/ (accessed on 28 March 2025).
- Lin, Y.; Pan, L.; Ostrenga, D.; Tan, Z.; Wei, J.; Hearty, T.; Vollmer, B.; Savtchenko, A.K. July 2018 Mid-Atlantic Atmospheric River and Extreme Precipitation Event Captured by MERRA-2. J. Hydrometeorol. 2018, 19, 1881–1897. [Google Scholar] [CrossRef]
- Gunther, E.B.; Cross, R.L. Eastern North Pacific Tropical Cyclones of 1977. Mon. Weather Rev. 1977, 105, 1583–1589. [Google Scholar] [CrossRef]
- Doswell III, C.A.; Brooks, H.E.; Maddox, R.A. Flash Flood Forecasting: An Ingredients-Based Methodology. Weather Forecast. 1996, 11, 560–581. [Google Scholar] [CrossRef]
- Marinescu, P.J.; van den Heever, S.C.; Heikenfeld, M.; Barrett, A.I.; Barthlott, C.; Hoose, C.; Fan, J.; Fridlind, A.M.; Matsui, T.; Miltenberger, A.K.; et al. Impacts of cloud microphysics parameterizations on simulated aerosol–cloud interactions for deep convective clouds over Houston. Atmos. Chem. Phys. 2021, 21, 4979–4999. [Google Scholar] [CrossRef]
- National Centers for Environmental Information (NCEI). Historical Observing Metadata Repository, Year of Data Release. Available online: https://www.ncei.noaa.gov/access/homr/ (accessed on 28 March 2025).






Disclaimer/Publisher’s Note: The statements, opinions and data contained in all publications are solely those of the individual author(s) and contributor(s) and not of MDPI and/or the editor(s). MDPI and/or the editor(s) disclaim responsibility for any injury to people or property resulting from any ideas, methods, instructions or products referred to in the content. |
© 2025 by the authors. Licensee MDPI, Basel, Switzerland. This article is an open access article distributed under the terms and conditions of the Creative Commons Attribution (CC BY) license (https://creativecommons.org/licenses/by/4.0/).
Share and Cite
Jeong, D.H.; Behera, P.; Jeong, B.K.; Luna Sangama, C.D.; Higgs, B.; Ji, S.-Y. Designing an Interactive Visual Analytics System for Precipitation Data Analysis. Appl. Sci. 2025, 15, 5467. https://doi.org/10.3390/app15105467
Jeong DH, Behera P, Jeong BK, Luna Sangama CD, Higgs B, Ji S-Y. Designing an Interactive Visual Analytics System for Precipitation Data Analysis. Applied Sciences. 2025; 15(10):5467. https://doi.org/10.3390/app15105467
Chicago/Turabian StyleJeong, Dong Hyun, Pradeep Behera, Bong Keun Jeong, Carlos David Luna Sangama, Bryan Higgs, and Soo-Yeon Ji. 2025. "Designing an Interactive Visual Analytics System for Precipitation Data Analysis" Applied Sciences 15, no. 10: 5467. https://doi.org/10.3390/app15105467
APA StyleJeong, D. H., Behera, P., Jeong, B. K., Luna Sangama, C. D., Higgs, B., & Ji, S.-Y. (2025). Designing an Interactive Visual Analytics System for Precipitation Data Analysis. Applied Sciences, 15(10), 5467. https://doi.org/10.3390/app15105467


