Development of a Stability Index for Evaluating Drivers’ Psychological Stability During Truck Platooning


Abstract
1. Introduction
2. Review of Related Works and Technological Trends
2.1. Review of Related Technologies
2.2. Trends in Truck Platooning Technology
2.3. Review of Literature
2.3.1. Driver Behavior Analysis Using a Driving Simulator
2.3.2. Studies on Platooning Using a Driving Simulator
2.4. Contributions and Distinctions of This Study
3. Development of a Quantitative Evaluation Index—‘Stability Index’ for Assessing Drivers’ Psychological Stability
4. Experimental Environment for Truck Platooning
4.1. Selection of Truck-Platooning Experimental Methodology
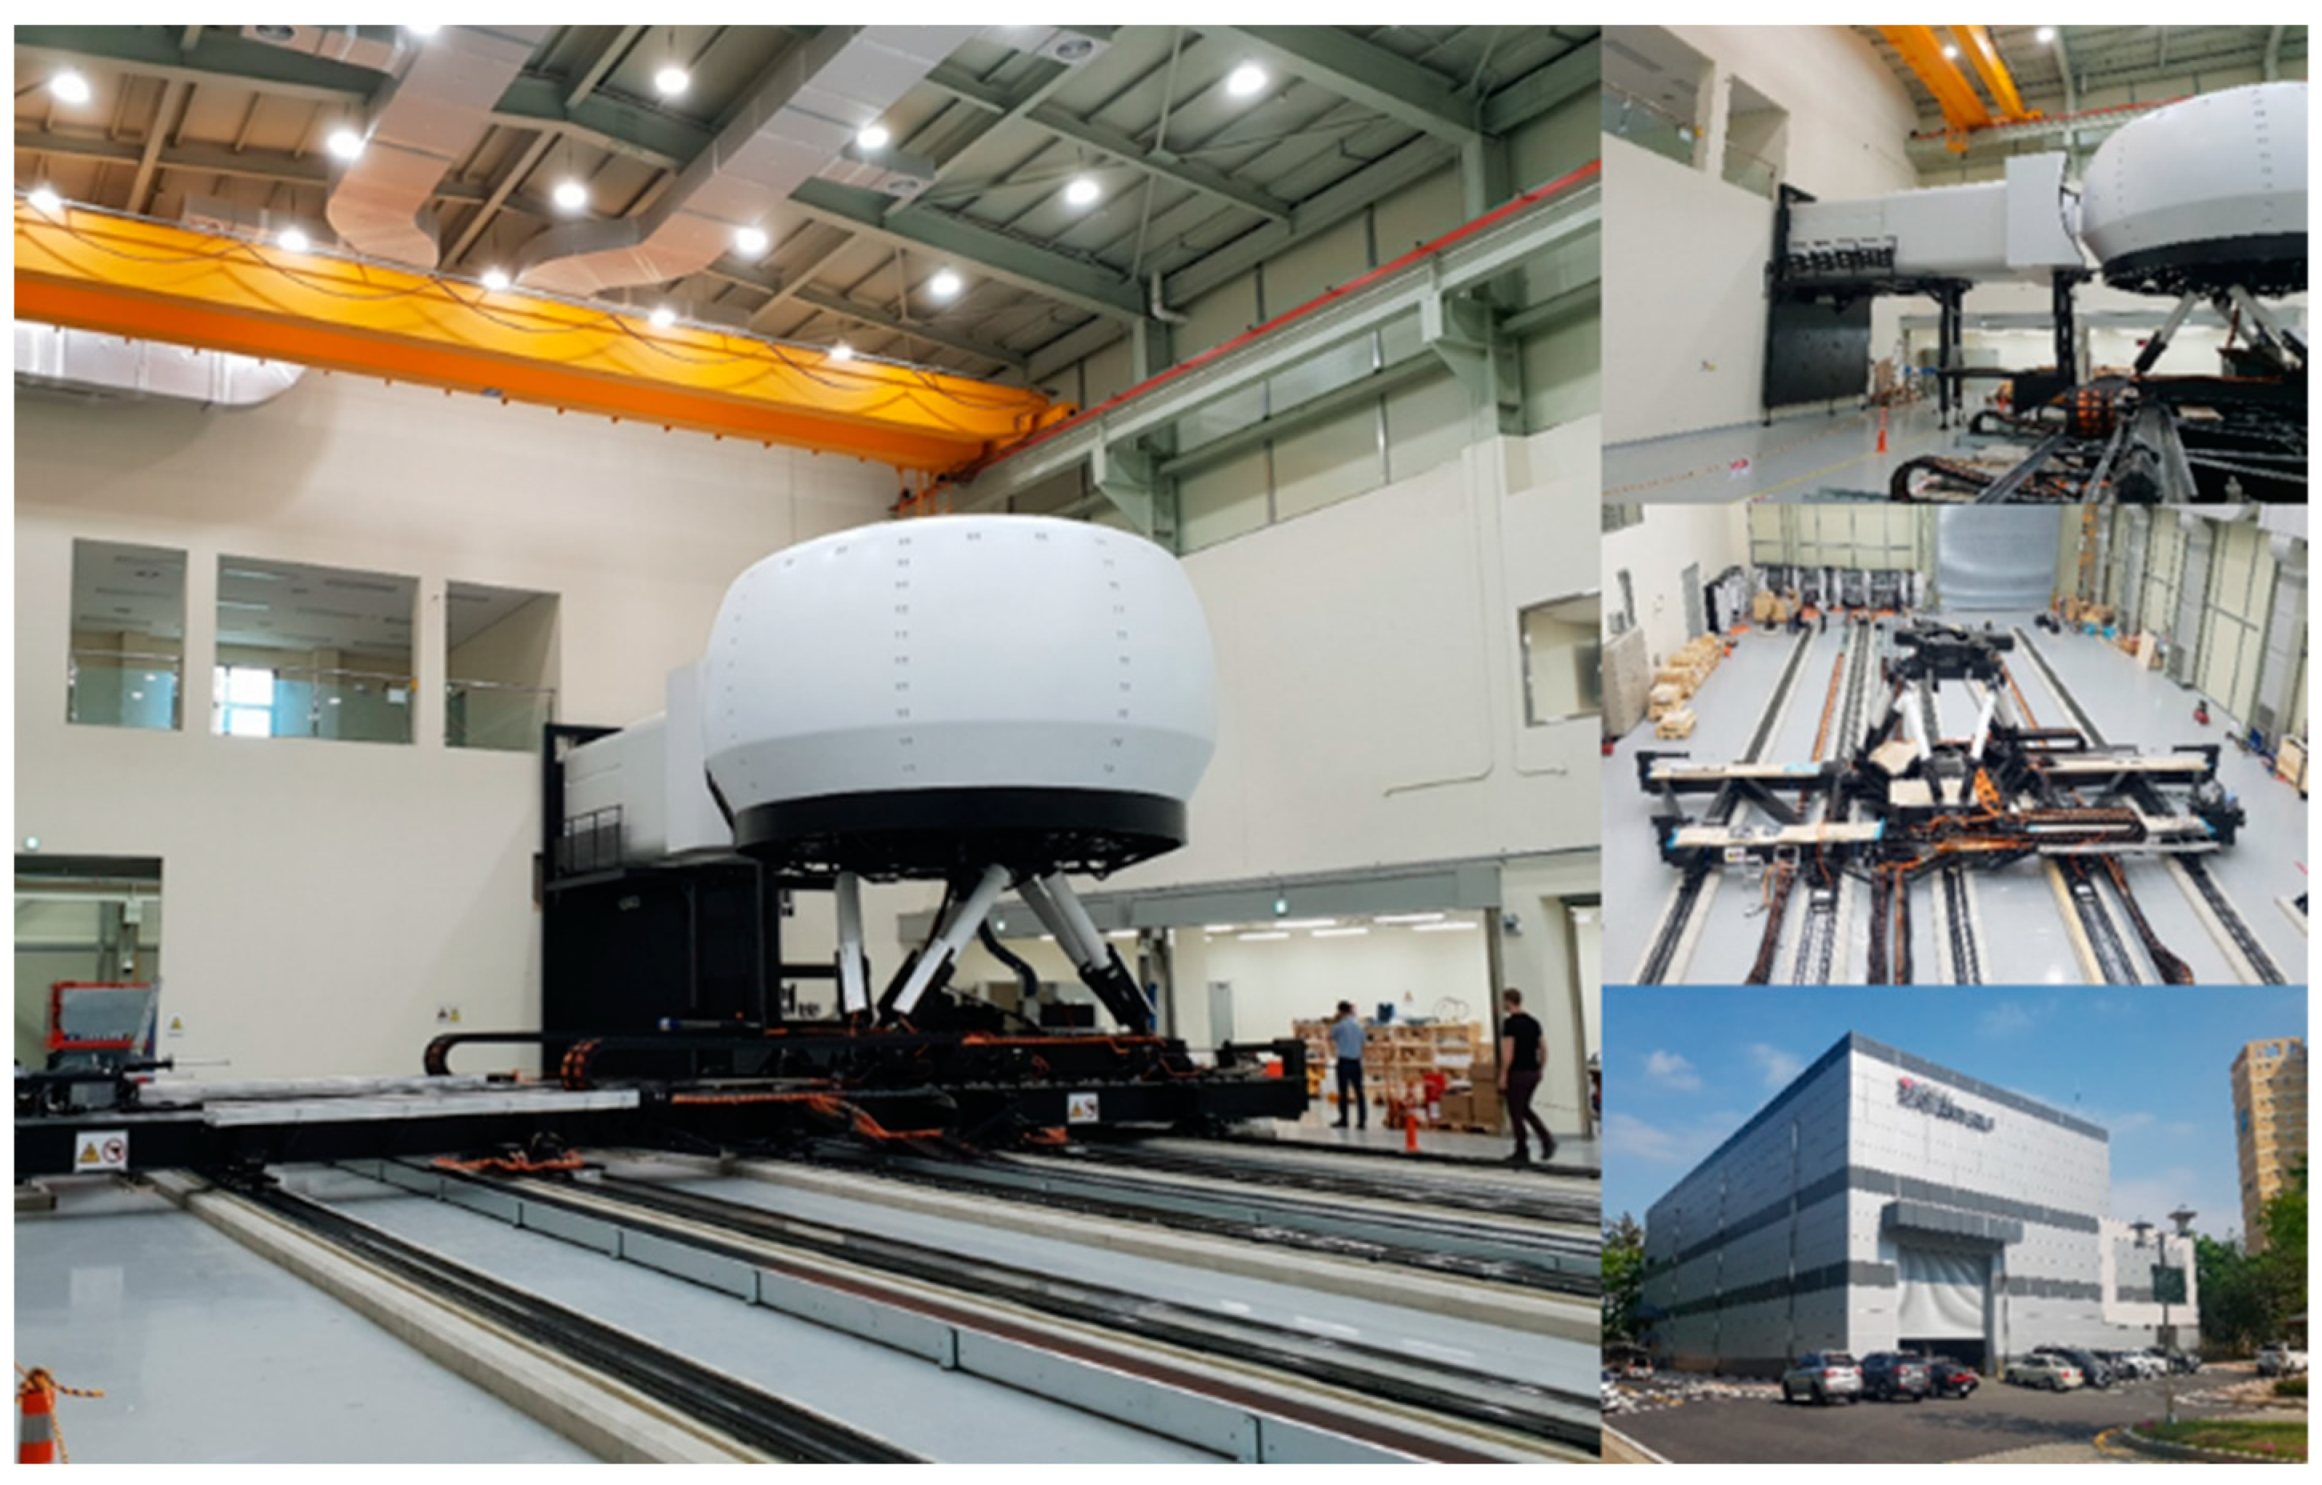
4.2. Selection of Driving Simulator and Construction of Experimental Environment
4.3. Collection of Physiological Signals
5. Driver Psychological Stability Evaluation Experiment Using Driving Simulator
5.1. Experimental Procedure and Scenario Design
5.2. Participant Recruitment
5.3. Evaluation of Drivers’ Psychological Stability by Scenario
5.4. Evaluation of Drivers’ Psychological Stability According to Presence of See-Through Functionality
5.5. Post-Experiment Survey for Validation of Stability Index
6. Conclusions and Future Work
6.1. Conclusions
6.2. Limitations and Future Works
Author Contributions
Funding
Institutional Review Board Statement
Informed Consent Statement
Data Availability Statement
Conflicts of Interest
References
- Tsugawa, S.; Jeschke, S.; Shladover, S.E. A review of truck platooning projects for energy savings. IEEE Trans. Intell. Veh. 2016, 1, 68–77. [Google Scholar] [CrossRef]
- Willemsen, D.M.C.; Schmeitz, A.J.C.; Mascalchi, E. EU ENSEMBLE project: Specification of an interoperable solution for a support function for platooning. IEEE Trans. Intell. Transp. Syst. 2023, 24, 5705–5718. [Google Scholar] [CrossRef]
- Shladover, S.E. Introduction to truck platooning. In Proceedings of the ITS World Congress, Montreal, QC, Canada, 29 October–2 November 2017. [Google Scholar]
- Törnell, J.; Sebben, S.; Söderblom, D. Influence of inter-vehicle distance on the aerodynamics of a two-truck platoon. Int. J. Automot. Technol. 2021, 22, 747–760. [Google Scholar] [CrossRef]
- Cheng, H.; Wang, Y.; Chong, D.; Xia, C.; Sun, L.; Liu, J.; Gao, K.; Yang, R.; Jin, T. Truck platooning reshapes greenhouse gas emissions of the integrated vehicle-road infrastructure system. Nat. Commun. 2023, 14, 4495. [Google Scholar] [CrossRef] [PubMed]
- Bergenhem, C.; Shladover, S.; Coelingh, E.; Englund, C.; Tsugawa, S. Overview of platooning systems. In Proceedings of the 19th ITS World Congress, Vienna, Austria, 22–26 October 2012. [Google Scholar]
- Axelsson, J. Safety in vehicle platooning: A systematic literature review. IEEE Trans. Intell. Transp. Syst. 2016, 18, 1033–1045. [Google Scholar] [CrossRef]
- Vissers, J.; Banspach, J.; Liga, V.; Tang, T.; Nordin, H.; Julien, S.; Martinez, S.; Villette, C. V1 Platooning Use-Cases, Scenario Definition and Platooning Levels, D2.2 of H2020 Project ENSEMBLE. 2018. Available online: https://platooningensemble.eu/storage/uploads/documents/2021/03/24/ENSEMBLE-D2.2_V1-Platooning-use-cases,-scenario-definition-and-platooning-levels_FINAL.pdf (accessed on 15 April 2025).
- Jeong, S.; Baek, Y.; Son, S.H. Distributed urban platooning towards high flexibility, adaptability, and stability. Sensors 2021, 21, 2684. [Google Scholar] [CrossRef] [PubMed]
- European Road Transport Research Advisory Council. Automated Driving Road Map. ERTRAC Task Force “Connectivity and Automated Driving”, Version 5. 2015. Available online: https://www.ertrac.org/wp-content/uploads/2022/07/ERTRAC_Automated-Driving-2015.pdf (accessed on 15 April 2025).
- Tsugawa, S. An overview on an automated truck platoon within the energy ITS project. IFAC Proc. Vol. 2013, 46, 41–46. [Google Scholar] [CrossRef]
- Manawadu, U.; Ishikawa, M.; Kamezaki, M.; Sugano, S. Analysis of individual driving experience in autonomous and human-driven vehicles using a driving simulator. In Proceedings of the IEEE International Conference on Advanced Intelligent Mechatronics (AIM), Busan, South Korea, 7–11 July 2015; IEEE Publications: New York, NY, USA, 2015; pp. 299–304. [Google Scholar] [CrossRef]
- Su, C.; Deng, W.; Sun, H.; Wu, J.; Sun, B.; Yang, S. Forward collision avoidance systems considering driver’s driving behavior recognized by Gaussian Mixture Model. In Proceedings of the IEEE Intelligent Vehicles Symposium, Los Angeles, CA, USA, 11–14 June 2017; IEEE Publications: New York, NY, USA, 2017; pp. 535–540. [Google Scholar] [CrossRef]
- Huang, L.; Zhao, X.; Li, Y.; Rong, J. Driving simulator-based study to quantify typical diagrammatic guide sign efficiency along urban expressway interchanges. J. Transp. Saf. Sec. 2020, 12, 839–862. [Google Scholar] [CrossRef]
- Guo, X.; Jiang, Y.; Kim, I. Interacting with autonomous platoons: Human driver’s adaptive behaviors in planned lane changes. In Systems and Information Engineering Design Symposium (SIEDS); IEEE Publications: Charlottesville, VA, USA, 2020; pp. 1–5. [Google Scholar] [CrossRef]
- Tang, T.Q.; Gui, Y.; Zhang, J. ATAC-Based Car-Following Model for Level 3 Autonomous Driving Considering Driver’s Acceptance. IEEE Trans. Intell. Transport. Syst. 2022, 23, 10309–10321. [Google Scholar] [CrossRef]
- Wang, C.; Xu, C.; Peng, C.; Tong, H.; Ren, W.; Jiao, Y. Predicting the duration of reduced driver performance during the automated driving takeover process. J. Intell. Transp. Syst. 2024, 29, 218–233. [Google Scholar] [CrossRef]
- Zheng, R.; Nakano, K.; Kato, S.; Ogitsu, T.; Yamabe, S.; Aoki, K.; Suda, Y. Human–machine interface system for simulation-based automatic platooning of trucks. In Proceedings of the 16th International IEEE Conference on Intelligent Transportation Systems (ITSC 2013), The Hague, Netherlands, 6–9 October 2013; IEEE Publications: New York, NY, USA, 2013; pp. 535–539. [Google Scholar] [CrossRef]
- Zheng, R.; Yamabe, S.; Nakano, K.; Suda, Y. Biosignal analysis to assess mental stress in automatic driving of trucks: Palmar perspiration and masseter electromyography. Sensors 2015, 15, 5136–5150. [Google Scholar] [CrossRef] [PubMed]
- Heikoop, D.D.; de Winter, J.C.F.; van Arem, B.; Stanton, N.A. Effects of platooning on signal-detection performance, workload, and stress: A driving simulator study [App]. Appl. Ergon. 2017, 60, 116–127. [Google Scholar] [CrossRef] [PubMed]
- Gerrits, B.; Mes, M.; Schuur, P. Simulation of real-time and opportunistic truck platooning at the port of Rotterdam. In Proceedings of the Winter Simulation Conference (WSC), National Harbor, MD, USA, 8–11 December 2019; IEEE Publications: New York, NY, USA, 2019; pp. 133–144. [Google Scholar] [CrossRef]
- Shin, E.; Kim, M.G.; Lee, C.; Kang, H.B. Driver’s status recognition using multiple wearable sensors. KIPS Trans. Comput. Comm. Syst. 2017, 6, 271–280. [Google Scholar] [CrossRef]
- Kim, J.; Shin, M. Utilizing HRV-derived respiration measures for driver drowsiness detection. Electronics 2019, 8, 669. [Google Scholar] [CrossRef]
- Shi, H.; Yang, L.; Zhao, L.; Su, Z.; Mao, X.; Zhang, L.; Liu, C. Differences of heart rate variability between happiness and sadness emotion states: A pilot study. J. Med. Biol. Eng. 2017, 37, 527–539. [Google Scholar] [CrossRef]
- Rein, G.; Atkinson, M.; McCraty, R. The physiological and psychological effects of compassion and anger. J. Adv. Med. 1995, 8, 87–105. [Google Scholar]
- Rosner, B.; Glynn, R.J.; Lee, M.L.T. The Wilcoxon signed rank test for paired comparisons of clustered data. Biometrics 2006, 62, 185–192. [Google Scholar] [CrossRef] [PubMed]


| No. | Stage | Details |
|---|---|---|
| 1 | General Driving | The following vehicle accelerates to reduce the distance to the leading vehicle, thereby initiating the platooning process. |
| 2 | Platoon Formation | When the distance between following and leading vehicles decreases to approximately 50 m, enabling V2V communication, the following vehicle requests to join the platoon. Upon approval from the leading vehicle, longitudinal control (pedal release) and lateral control (steering release) are automated sequentially. |
| 3 | Platoon Maintenance | The platoon maintains a constant speed and intervehicle distance for 120 s, as specified in the experimental scenario. |
| 4 | Platoon Dissolution | After the scenario is terminated, the following vehicle sequentially switches to manual lateral (steering operation) and longitudinal (pedal operation) control upon its own request and the leading vehicle’s approval. |
| 5 | General Driving | The following vehicle increases its distance from the leading vehicle, dissolves the platoon, and returns to general driving. |
| Stage | Category | Details | Duration |
|---|---|---|---|
| 1 | Start Driving | Begin driving on the third lane Driving time for adaptation to the driving simulator Accelerate to and maintain a speed of 90 km/h Approach the truck platoon traveling at 80 km/h ahead | 1 min |
| 2 | Preparation for Platoon Formation | Platoon formation procedure is initiated when the distance between the following vehicle in the platoon and the experimental vehicle reaches 25 m | 1 min |
| 3 | (Scenario 1) Automatic Gap Adjustment Scenario | Driving system automatically adjusts the time gap Five time gaps: 0.2, 0.4, 0.6, 0.8, 1.0 s Order of displayed time gaps is randomized to minimize bias | 12 min |
| 4 | (Scenario 2) Manual Gap Adjustment Scenario | Experiment starts with a time gap of 0.6 s Conduct experiments both with and without see-through functionality Participants manually adjust the time gap within 0.2–1.0 s in ±0.1 s increments to select an acceptable time gap | 4 min |
| 5 | End of Driving | End of the experiment | 1–3 min |
| Category | Number of Participants (%) |
|---|---|
| Age | |
| 20 s | 1 (5%) |
| 30 s | 1 (5%) |
| 40 s | 6 (30%) |
| 50 s | 8 (40%) |
| 60 s | 4 (20%) |
| Occupation in transportation industry | |
| Yes | 11 (55%) |
| No | 9 (45%) |
| Driving experience | |
| <10 yr | 2 (10%) |
| 11–20 yr | 3 (15%) |
| 21–30 yr | 9 (45%) |
| ≥31 yr | 6 (30%) |
| Annual average driving distance | |
| <10,000 km | 1 (5%) |
| 10,000–20,000 km | 8 (40%) |
| ≥20,000 km | 11 (55%) |
| Weekly highway usage frequency | |
| 1 time | 3 (15%) |
| 2 times | 5 (20%) |
| 3 times | 4 (20%) |
| 4 times | 1 (5%) |
| 5 times | 2 (10%) |
| 6 times | 0 (-) |
| 7 times | 5 (35%) |
| Average daily driving time | |
| <1 h | 3 (15%) |
| 1–3 h | 14 (70%) |
| ≥3 h | 3 (15%) |
| Category | Intervehicle Time Gap | ||||
|---|---|---|---|---|---|
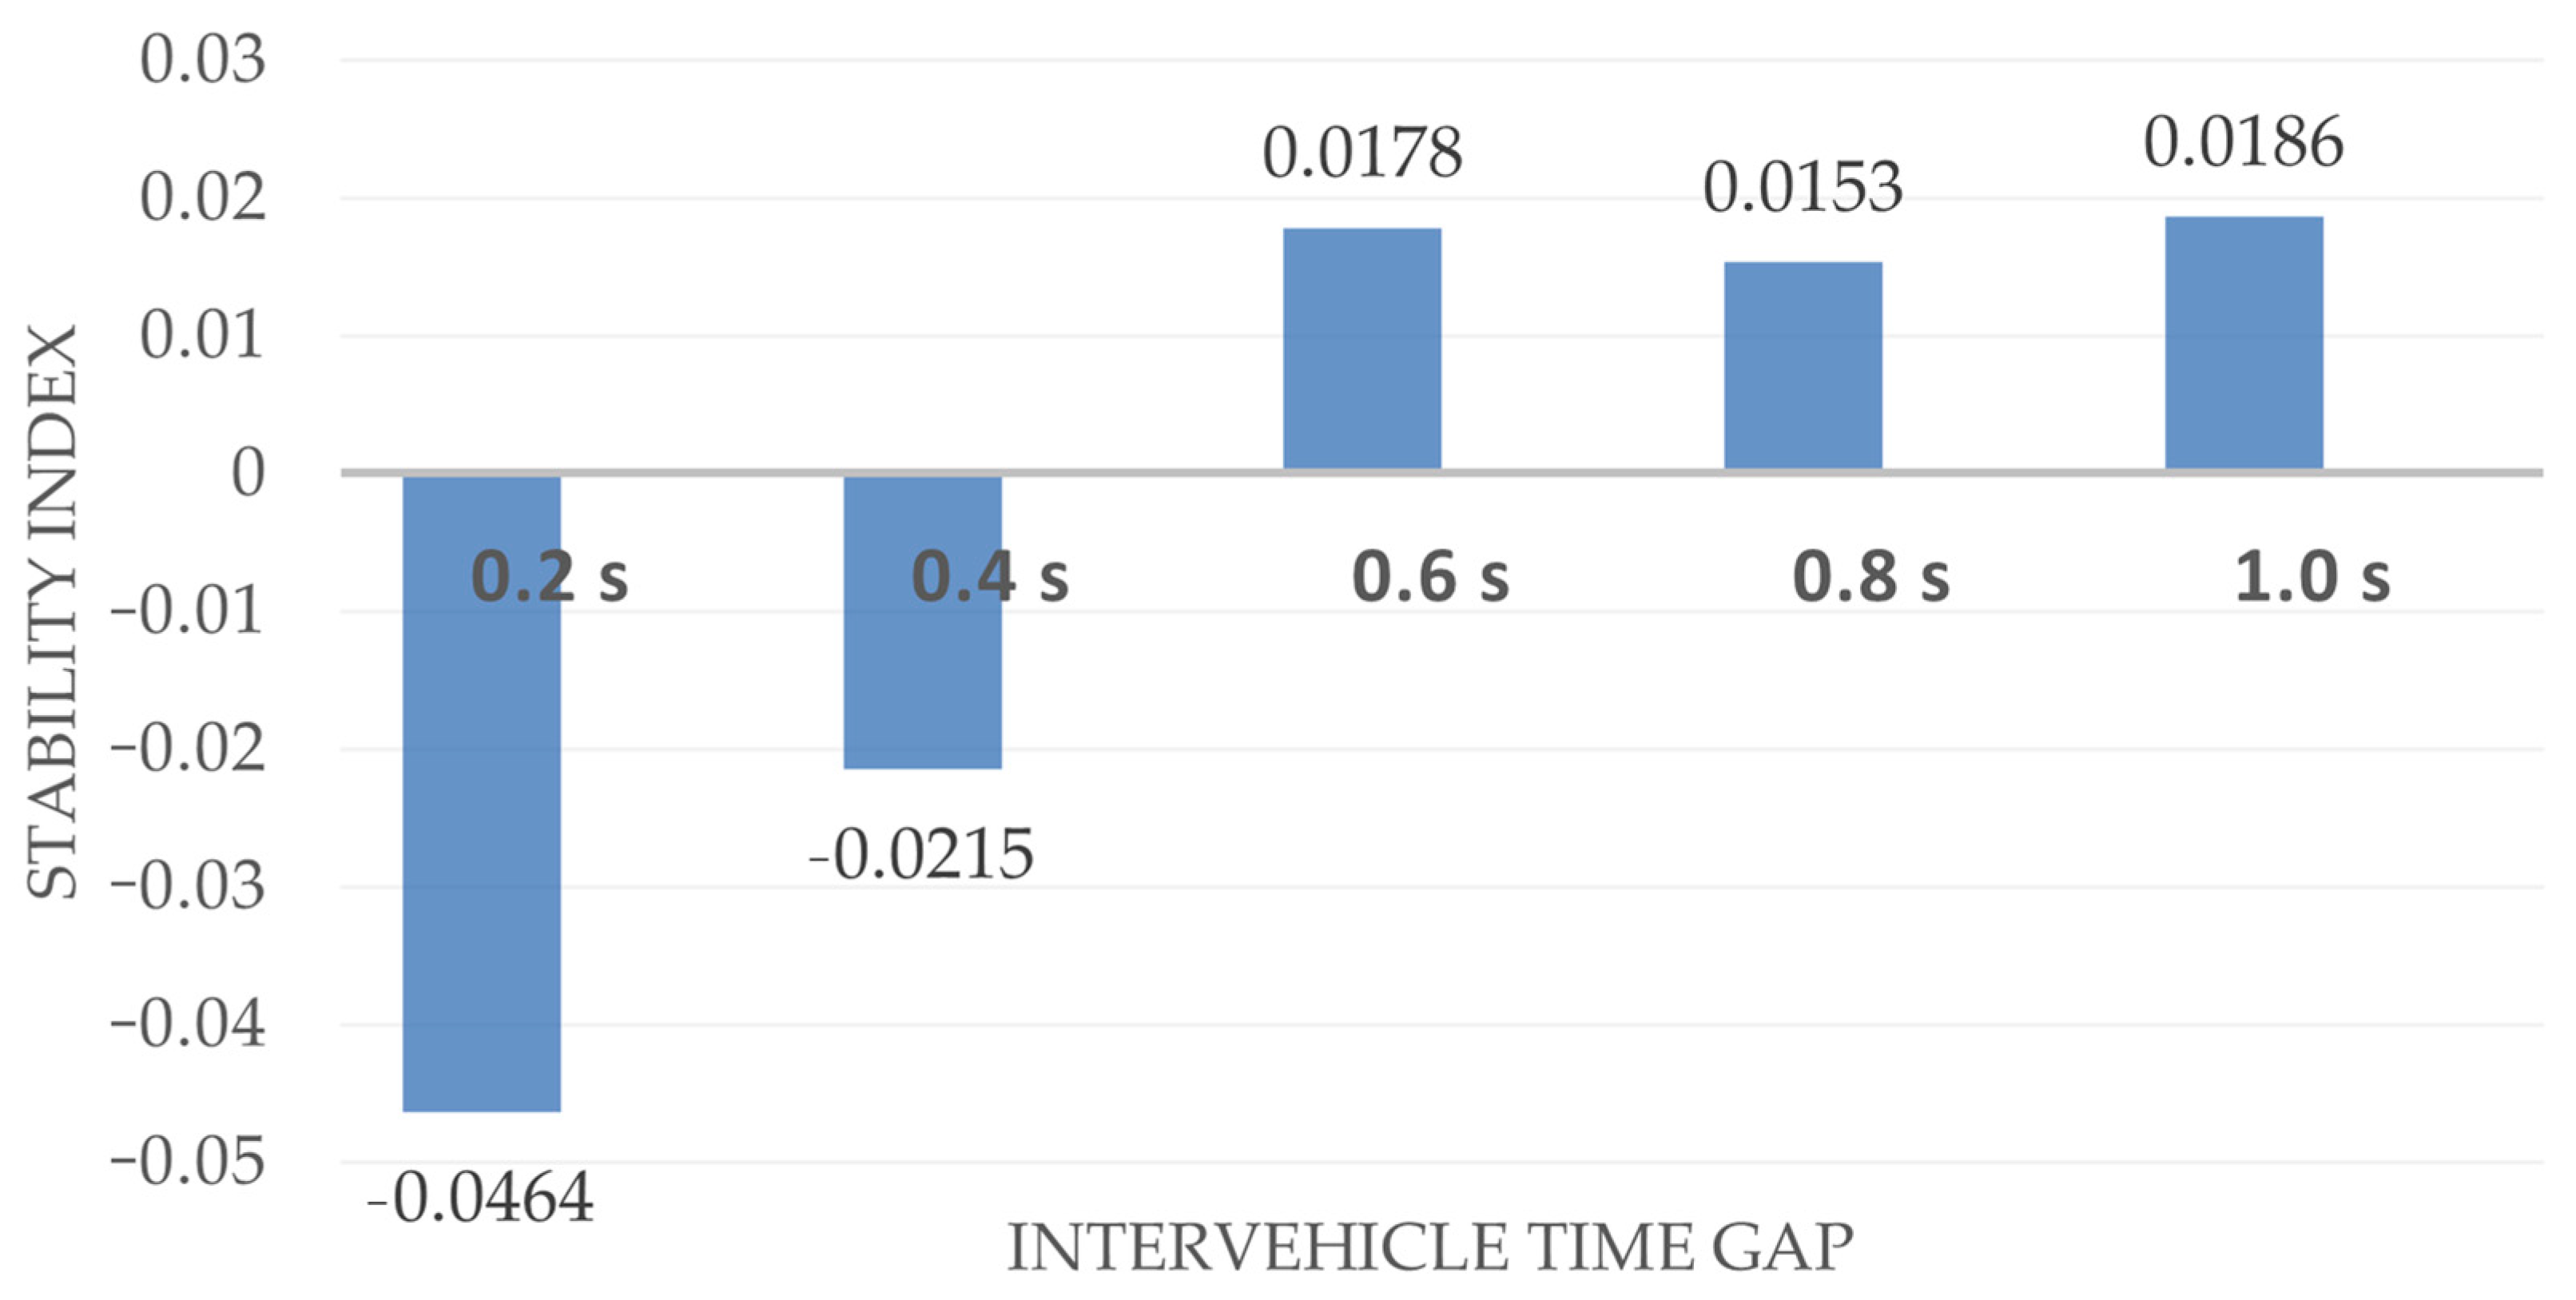
| 0.2 s (5 m) | 0.4 s (10 m) | 0.6 s (15 m) | 0.8 s (20 m) | 1.0 s (25 m) | |
| Stability Index | –0.0464 | –0.0215 | 0.0178 | 0.0153 | 0.0186 |
| Change compared to 0.6 s | –0.0642 | –0.0393 | - | −0.0024 | +0.0008 |
| Category | Intervehicle Time Gap | ||||
|---|---|---|---|---|---|
| 0.2 s (5 m) | 0.4 s (10 m) | 0.6 s (15 m) | 0.8 s (20 m) | 1.0 s (25 m) | |
| Number of drivers selecting time gap Without see-through | 3 (15%) | 0 (-) | 1 (5%) | 3 (15%) | 13 (65%) |
| Average time gap = 0.915 s (22.9 m) | |||||
| Number of drivers selecting time gap With see-through | 3 (15%) | 4 (20%) | 1 (5%) | 1 (5%) | 11 (55%) |
| Average time gap = 0.865 s (21.6 m) | |||||
| Category | Mean | Standard Deviation | Negative Ranks | Positive Ranks | Ties | Z | p-Value | ||||
|---|---|---|---|---|---|---|---|---|---|---|---|
| N | Mean Rank | Sum of Ranks | N | Mean Rank | Sum of Ranks | N | |||||
| Without See-Through | 0.915 | 0.146 | 6 | 3.50 | 21.00 | 0 | 0.00 | 0.00 | 14 | −2.27 | 0.023 |
| With See-Through | 0.865 | 0.166 | |||||||||
| Category | Intervehicle Time Gap | ||||
|---|---|---|---|---|---|
| 0.2 s (5 m) | 0.4 s (10 m) | 0.6 s (15 m) | 0.8 s (20 m) | 1.0 s (25 m) | |
| Driver Stability Points | 7.10 | 6.57 | 4.50 | 4.57 | 4.30 |
| Change Compared to 0.6 s | +2.60 | +2.07 | - | +0.07 | −0.20 |
| Standard Deviation | 1.1805 | ||||
Disclaimer/Publisher’s Note: The statements, opinions and data contained in all publications are solely those of the individual author(s) and contributor(s) and not of MDPI and/or the editor(s). MDPI and/or the editor(s) disclaim responsibility for any injury to people or property resulting from any ideas, methods, instructions or products referred to in the content. |
© 2025 by the authors. Licensee MDPI, Basel, Switzerland. This article is an open access article distributed under the terms and conditions of the Creative Commons Attribution (CC BY) license (https://creativecommons.org/licenses/by/4.0/).
Share and Cite
Cho, H.; Kim, Y.; Oh, S.; Yun, I. Development of a Stability Index for Evaluating Drivers’ Psychological Stability During Truck Platooning. Appl. Sci. 2025, 15, 5429. https://doi.org/10.3390/app15105429
Cho H, Kim Y, Oh S, Yun I. Development of a Stability Index for Evaluating Drivers’ Psychological Stability During Truck Platooning. Applied Sciences. 2025; 15(10):5429. https://doi.org/10.3390/app15105429
Chicago/Turabian StyleCho, Hyonbae, Yejin Kim, SeokJin Oh, and Ilsoo Yun. 2025. "Development of a Stability Index for Evaluating Drivers’ Psychological Stability During Truck Platooning" Applied Sciences 15, no. 10: 5429. https://doi.org/10.3390/app15105429
APA StyleCho, H., Kim, Y., Oh, S., & Yun, I. (2025). Development of a Stability Index for Evaluating Drivers’ Psychological Stability During Truck Platooning. Applied Sciences, 15(10), 5429. https://doi.org/10.3390/app15105429