Article

An Integrated Cellular Automata Model Improves the Accuracy of Secondary Fragmentation Prediction

1
Laboratory of Block Caving, Universidad de Concepción, Concepción 4070409, Chile
2
Laboratory of Block Caving, University of Chile, Santiago 8330111, Chile
*
Author to whom correspondence should be addressed.
Appl. Sci. 2025, 15(10), 5425; https://doi.org/10.3390/app15105425
Submission received: 4 April 2025 / Revised: 6 May 2025 / Accepted: 8 May 2025 / Published: 13 May 2025

Abstract

:
Fine material in caving mining can impact dilution, inrushes, and downstream processing. This work describes the application of a new model to improve the accuracy of the prediction of fine material in block caving mining by coupling a stress model and a fragmentation model, integrating the shear strain effect. This combination seeks to offer a better representation of the secondary fragmentation process than previous models have attained. This approach was implemented through a flow simulator using cellular automata to model the gravitational behavior of broken material during extraction. Physical experiments were then replicated in the flow simulator to couple both models and estimate rock fragmentation under stress. Adding the shear strain effect to the new model showed demonstrable improvements in fine fragmentation estimations, optimizing the results under different confinement conditions. The errors obtained did not exceed 6.8% for 0.8 MPa of confinement, 6.5% for 3 MPa, and 3.8% for 5 MPa, also maintaining a low margin of error for medium and coarser fragments, such as d50 and d80. This improvement in predicting the appearance of fine material supports more accurate planning and the implementation of more focused measures to be taken at drawpoints.

1. Introduction

Block caving is an efficient mass mining method, characterized by high productivity and low operating costs [1], ideal for extracting large low-grade mineral deposits. Originally used in secondary rocks, its application in competent rocks has brought new challenges to improving productivity [2]. Despite the advantages of block caving, one of its main challenges is the variability in the flow and fragmentation of fractured material, particularly the presence of fine material, which affects the efficiency of the caving process.
Three levels of fragmentation occur during the caving process: in situ, primary and secondary fragmentation [3,4]. Secondary fragmentation, the object of study for this work, occurs while the material moves through the extraction column and is affected by variables such as stresses, extraction and rock properties [4]. Secondary fragmentation is also influenced by discontinuities and veins within the rock mass, as well as by interactions between blocks of different strengths [5]. This fragmentation process includes mechanisms such as the opening of discontinuities, faults due to compression or shear and abrasion of the edges and corners of the blocks. Additionally, Pierce et al. [6] observed that the shear and compression stresses, the shape and distribution of fragment sizes, the resistance and the initial porosity play a crucial role in this process.
The results of secondary fragmentation can impact caving operations in various ways. First, reducing the size of fragments over time can narrow movement zones, which can affect the design of the extraction level [6]; likewise, the accumulation of fine material in the voids between coarser fragments can generate the formation of cushions. In addition, fine material moves faster than coarse fragments [6,7], which can produce fine inrushes [8] and mud rushes in the presence of humidity [9], thus creating operational risks. This fine material is also a source of airborne dust and, in later stages, can negatively influence the efficiency of ore processing [10]. Modeling secondary fragmentation is, therefore, key to mitigating or foreseeing the operational problems that can be triggered by the generation of fine material.
Some empirical models have been developed to estimate secondary fragmentation [3,7,10,11,12]. Numerical methods have also been suggested for a more comprehensive representation. For example, Block Cave Fragmentation (BCF) software [13] is a tool that evaluates primary and secondary fragmentation in block caving operations; however, the dynamics of stress are not considered in the estimation of secondary fragmentation [8]. Pierce [10] developed the REBOP flow model (today known as Massflow [14]), in which he introduced an empirical approach based on the work of Hardin and Bridgwater [15,16] to model secondary fragmentation using compression and shear mechanisms [10,17], but again stresses and the dynamics of gravity flow were not considered in the model. Another approach is FracMan [18,19], which employs a discrete fracture network (DFN) model of secondary fragmentation based on the generation and fragmentation of veinlets. However, although empirical models allow estimates of secondary fragmentation, in general, they do not directly represent the phenomena involved in gravity flow and fragmentation. There are even tools such as PFC that allow a DEM to interact with a DFN for more complex simulations at controlled scales that could be used to include joint effects [20]. On the other hand, numerical methods allow more mechanisms or phenomena to be included; nevertheless, they fail to adequately estimate the generation of fines, especially during gravity flow.
To more fully integrate the dynamics involved in fragmentation, Castro et al. [21] proposed a fragmentation model within a gravity flow simulator based on cellular automata to model rock fragmentation during large-scale flow. Their fragmentation model uses rock strength, vertical stresses and travel distance as input parameters to estimate the secondary fragmentation that the rock undergoes. This current work describes the application of a new numerical model based on cellular automata that combines a stress model [22] and a fragmentation model [21] and integrates the shear strain effect to more accurately estimate the dynamics of secondary fragmentation in block caving operations.

2. Materials and Methods

The stresses and strength of rocks are among the main variables that determine rock fragmentation. Therefore, it is essential to be able to correctly represent stresses for more accurate fragmentation results. However, at the scale of the broken material in caving, few stress models are available. Then, to better represent the dynamics of gravity flow, this approach modified the previous fragmentation model using cellular automata [21], to combine a stress model [22] in a flow simulator based on cellular automata with the addition of a shear effect. Simulations were completed to emulate the flow of broken material and obtain a more dynamic vision of secondary fragmentation. The new integrated model was then applied at mine scale to estimate the generation of fine material under different operational criteria. The objective was a more accurate model representing secondary fragmentation in a confined flow environment, with an emphasis on the generation of fine material.

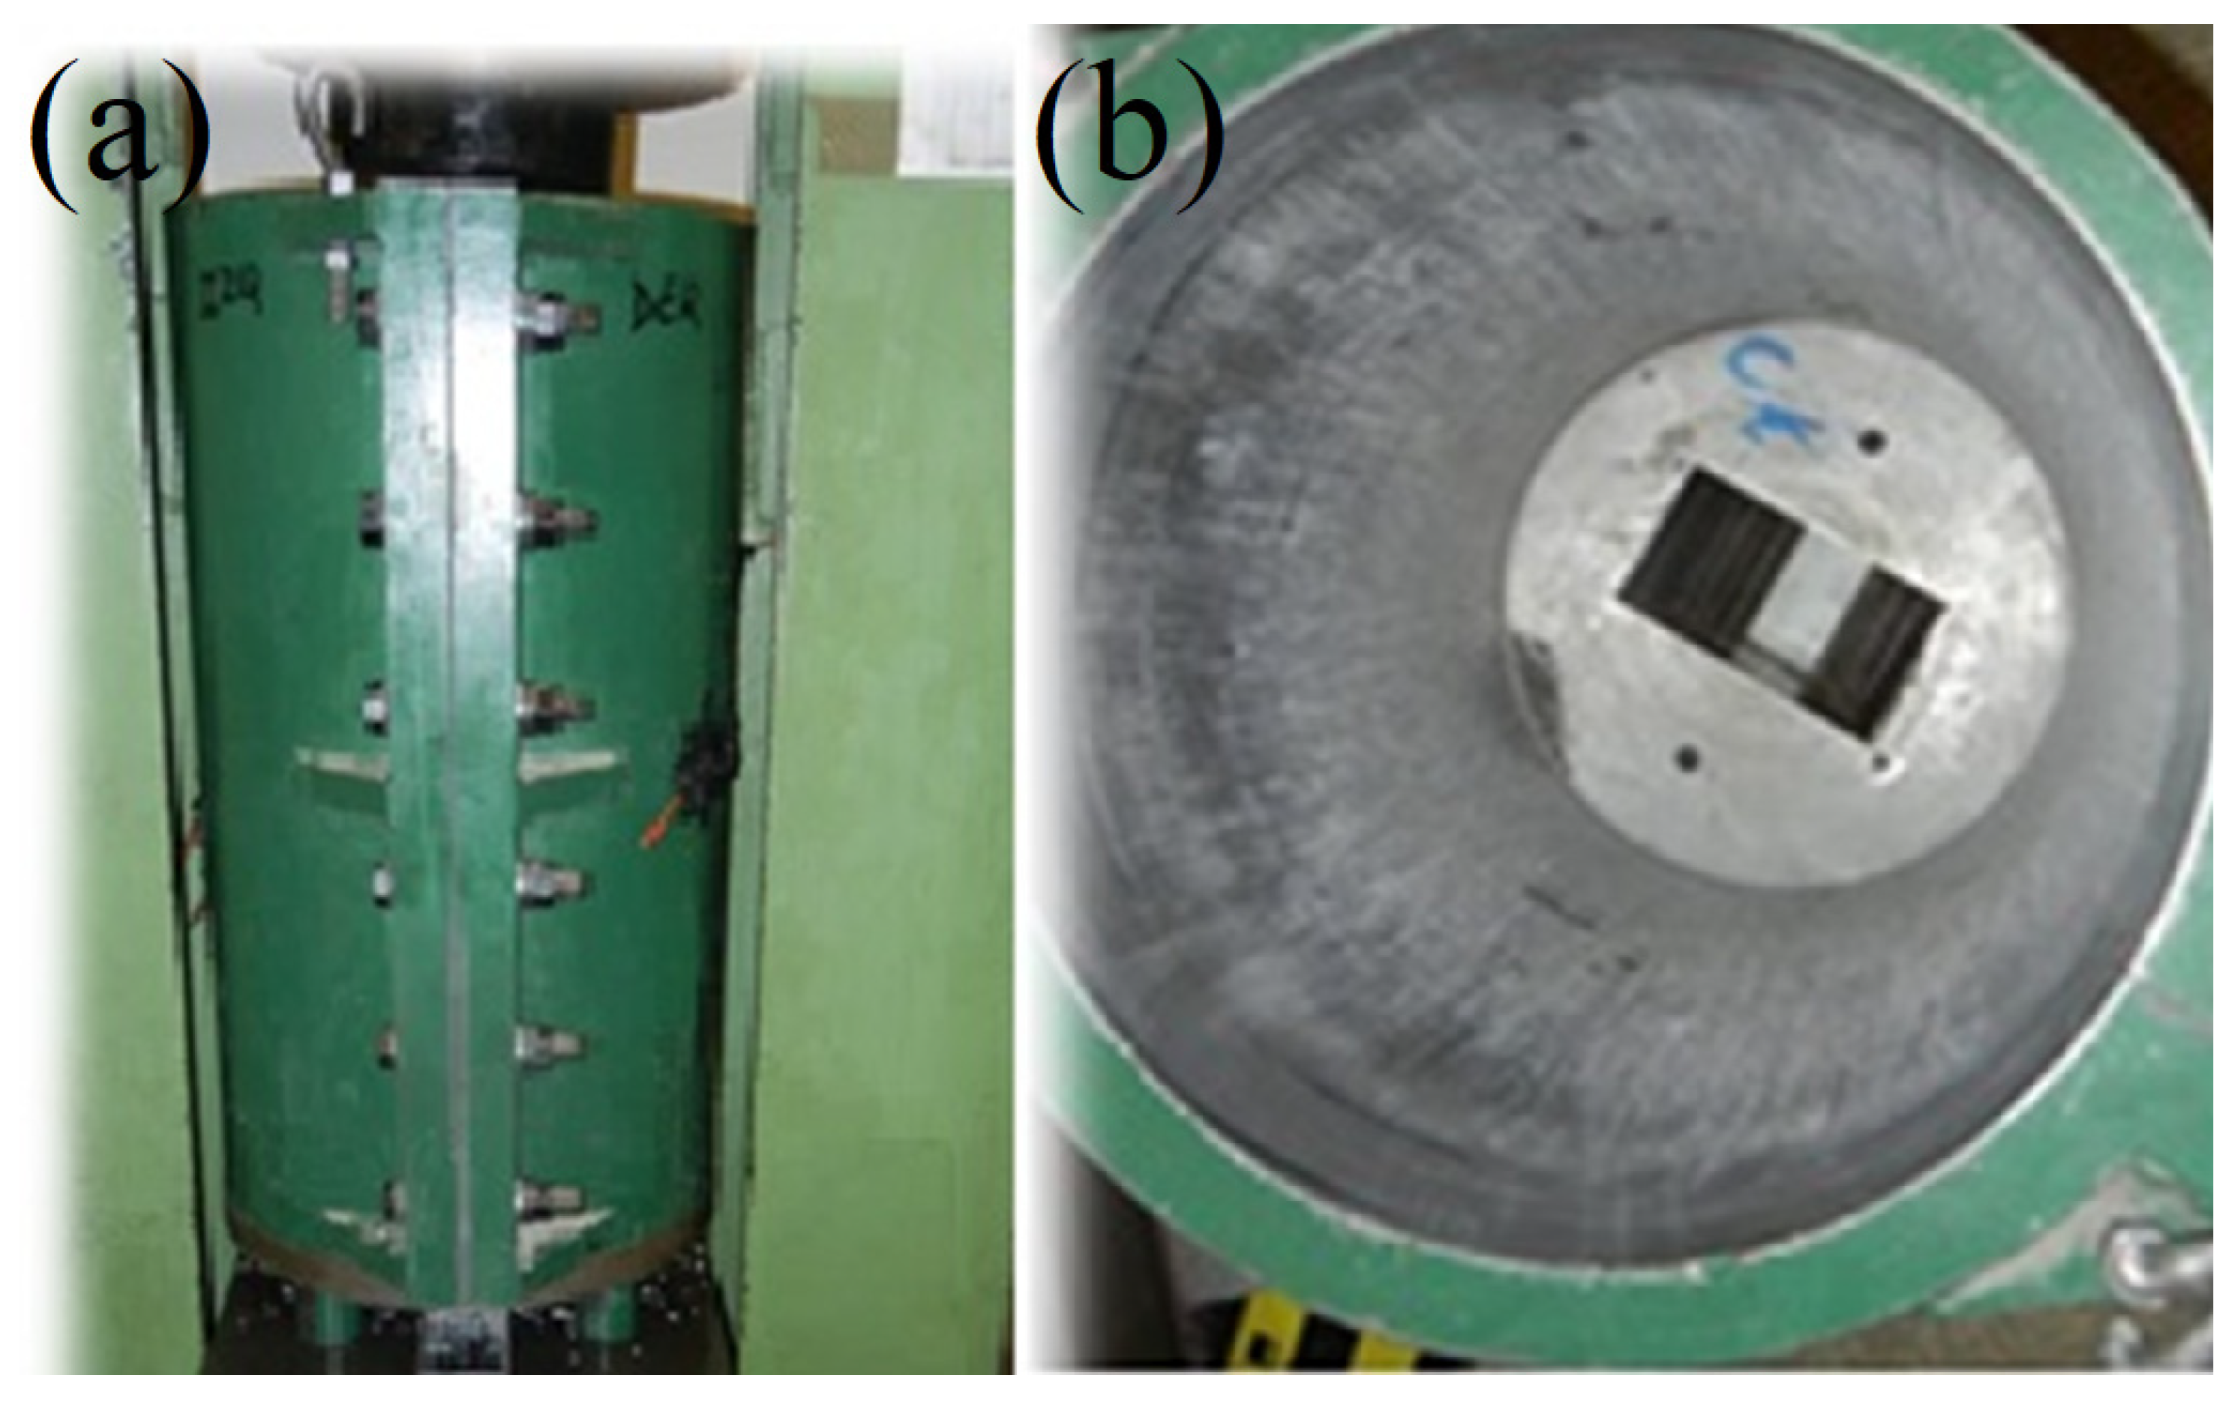
2.1. Physical Experiment
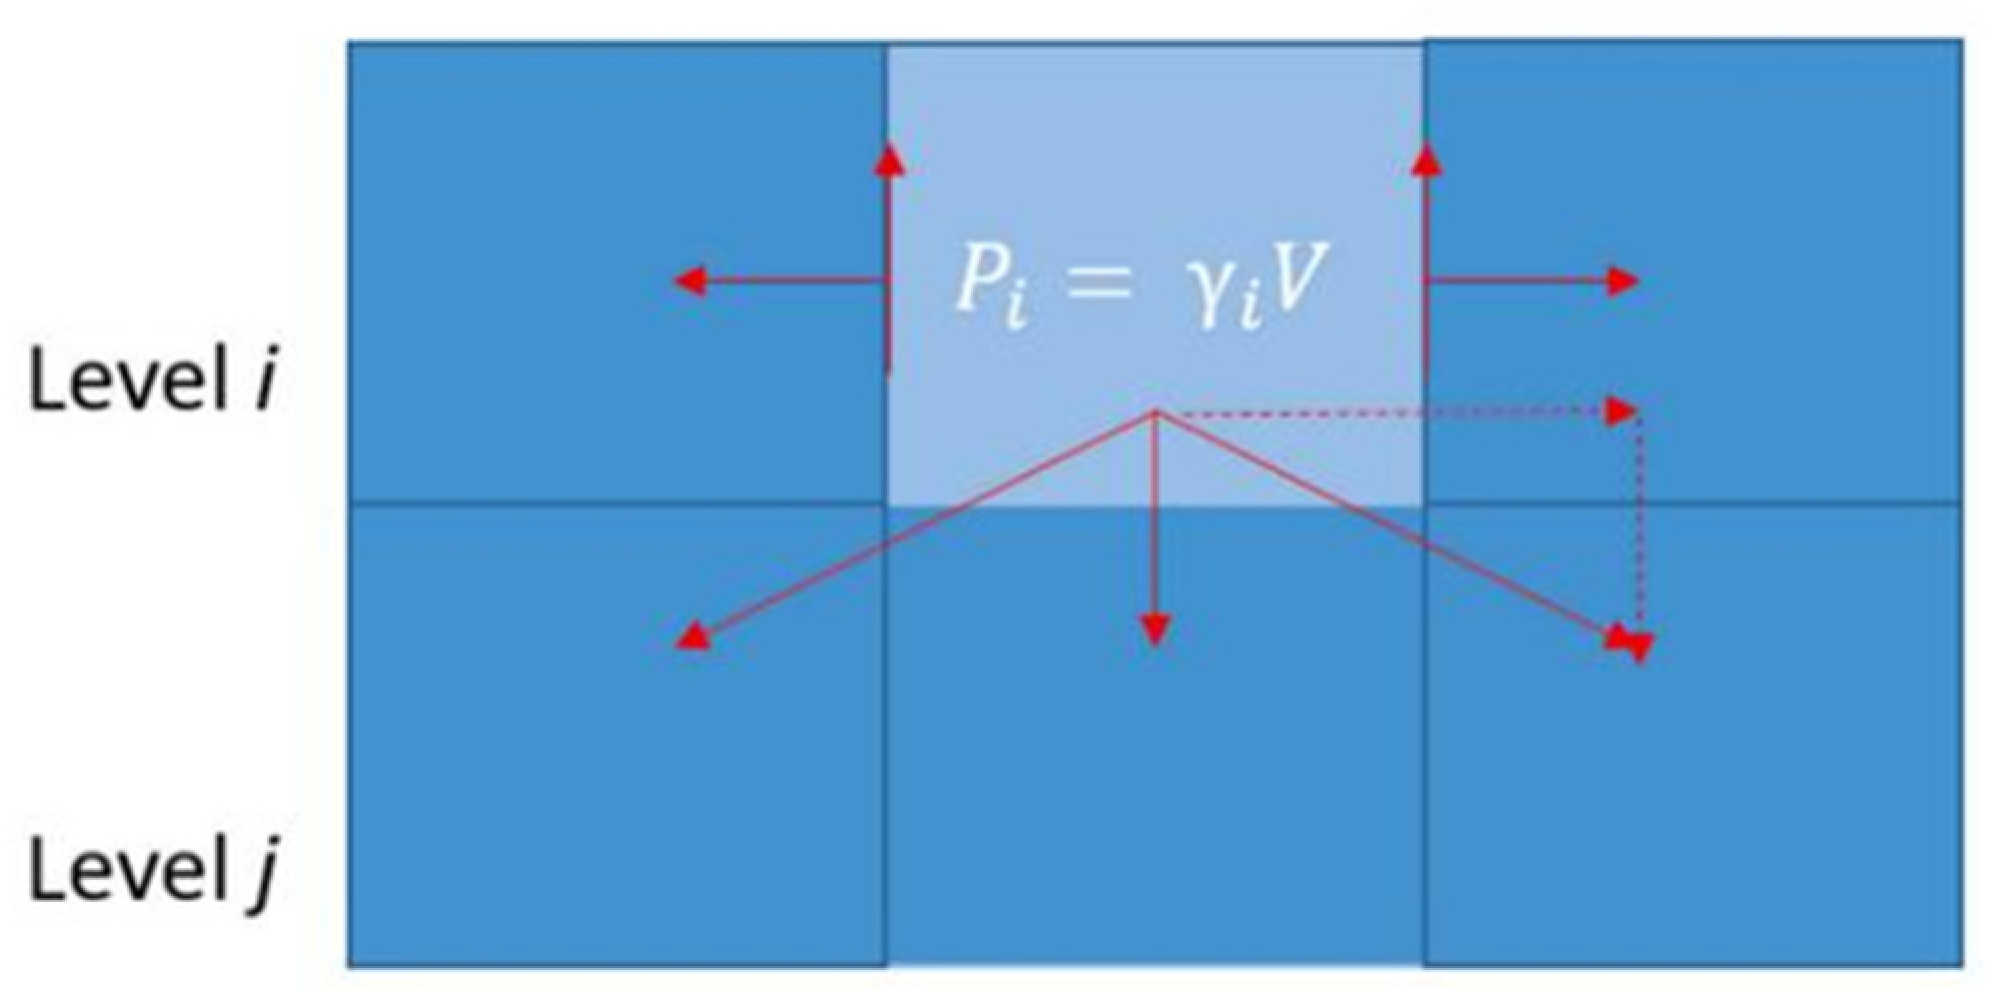
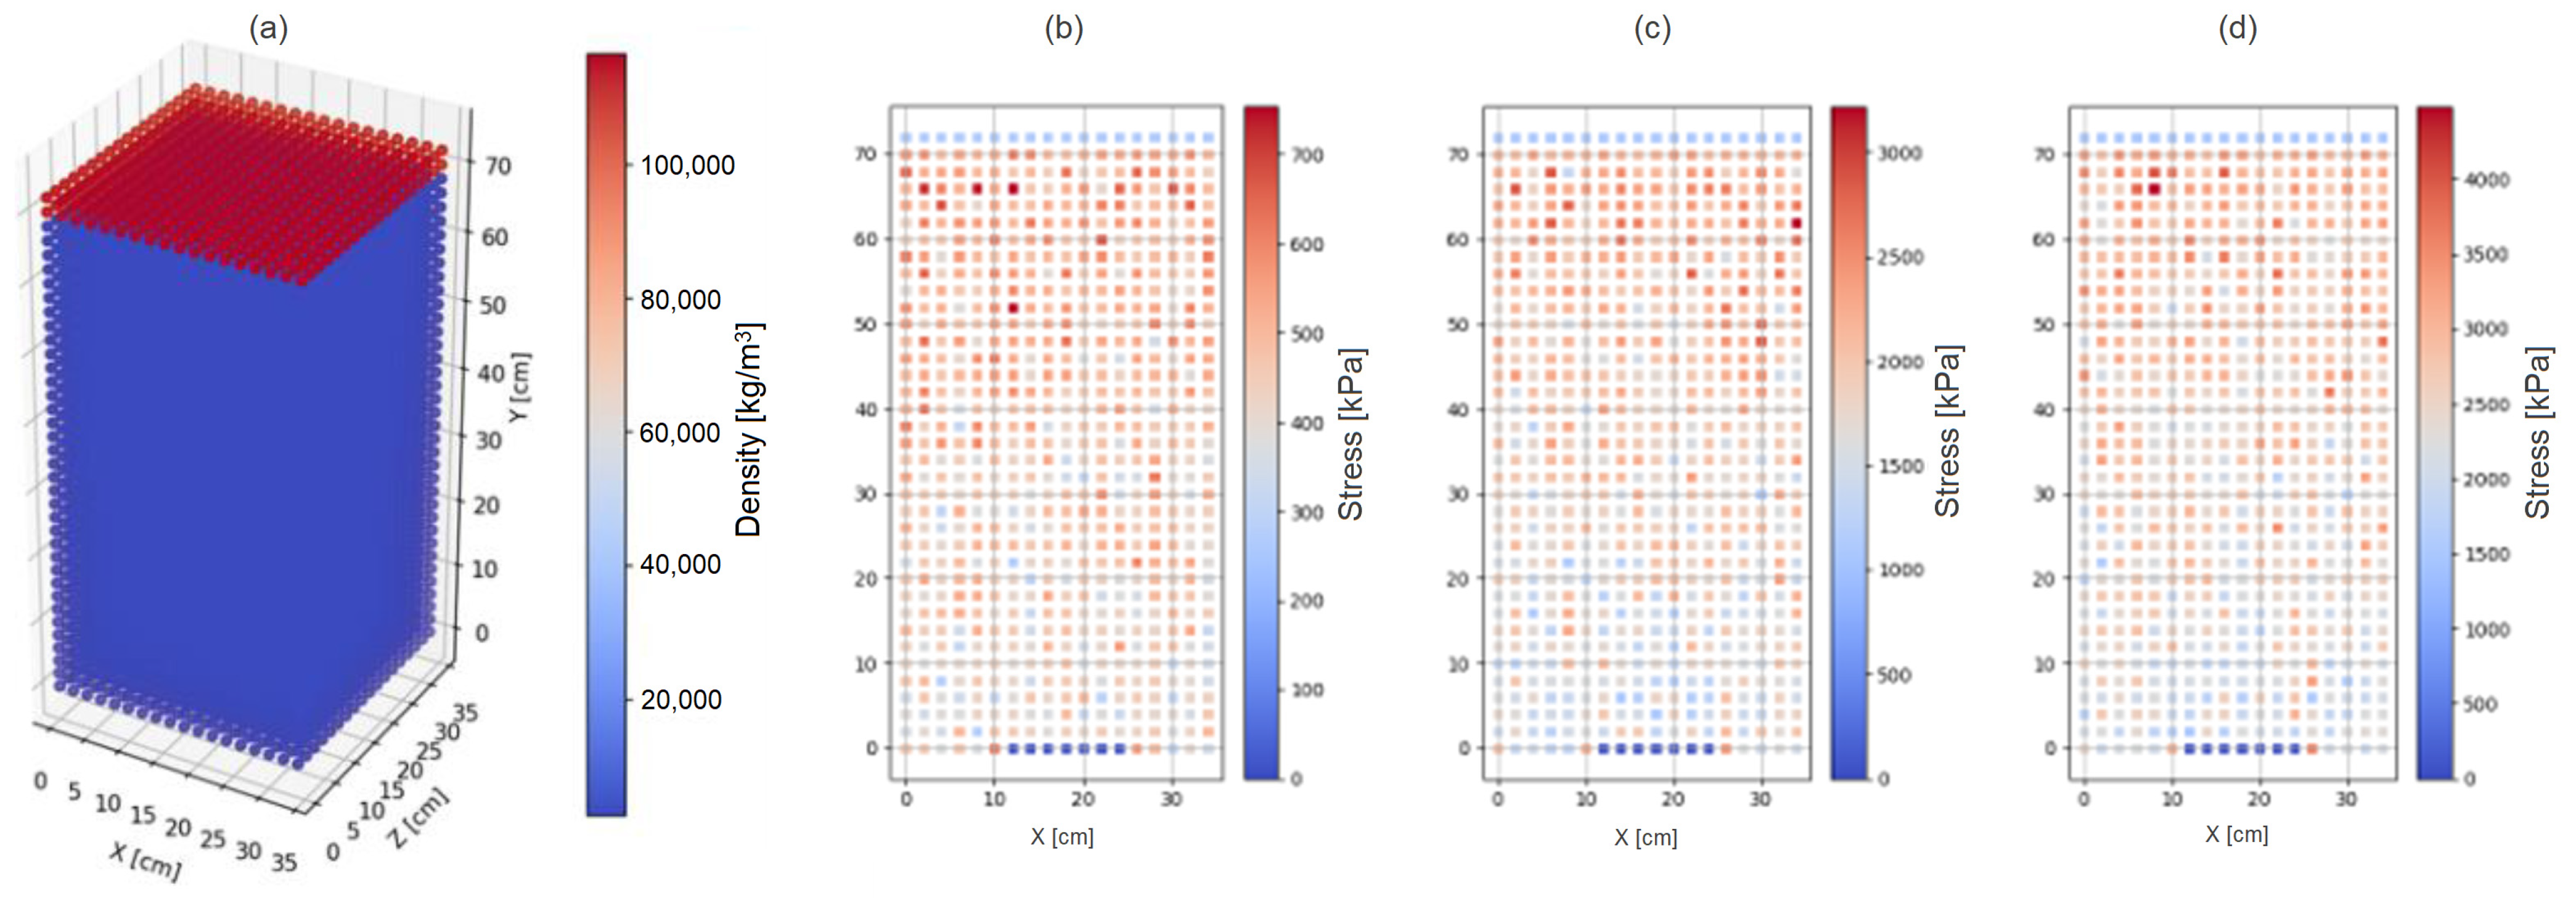
The experiments carried out by [11,12] were used as a reference. These experiments were developed in a laboratory-scale experimental system that simulates a confined flow under different stresses of 0.8, 3 and 5 MPa, considering an initial and final granulometry for different fragment sizes as detailed in Table 1.
The experimental design, previously presented by [12], details the use of a steel cylinder with an internal diameter of 340 mm and a height of 700 mm, capable of holding between 60 and 70 kg of material (Figure 1a). This cylinder is designed to apply a maximum pressure of 14 MPa, and at its base is a trough with two extraction points on a scale of 1:75. The drawbell is in the center of the model to minimize the interaction of the flow zones with the cylinder walls. The fragmented material flows through a rectangular opening of 53 mm by 96 mm, simulating the conditions of a confined flow (Figure 1b).
These experiments were selected to study secondary fragmentation in a controlled environment, incorporating the effect of confinement during material extraction. In addition, input and output data were available, which were then used for comparison with the simulated numerical results. Each experiment was performed in duplicate, and the reported fragmentation values are the mean value for each experiment pair.
The gravity flow in block caving mainly involves the forces of gravity, friction and cohesion. Electrostatic forces are a source of cohesion. These forces exist in all material, independent of its chemical nature [23]. Electrostatic forces are stronger than gravity for particle diameters below 100 μm [24]. In the case of the material tested, however, gravity forces are stronger than electrostatic forces for 100% of the total mass. The kinematic similitude must include geometrical similitude, friction angle, bulk density and time. In the physical model, the geometry is at a scale of 1:75 in the drawbell dimension and in the particle size distribution of the material using the parallel gradation method [25]. The load is directly applied through the press machine. For the sake of simplicity, the scaling effect of material strength is omitted in this study; future work on this point may benefit this study.

2.2. Stress Model

In underground mining, the stresses in the rock mass are usually modeled as a continuum, but with block caving, continuous models do not adequately represent the loads and distributions associated with the broken material column [26,27]. To address this limitation, the work done by [22] proposed a vertical stress model of granular material that can simulate static and dynamic flow conditions. This model was developed within a gravity flow simulator based on cellular automata to replicate both the scale of the problem and the flow conditions. To achieve this, the weight transition was applied through the cells of a cellular automata to simulate gravity flow in caving mines. To simulate stresses, the weight of a (granular) cell was randomly distributed among the lower cells, as shown in Figure 2.
In Figure 2, a cell at level i distributed its weight, Pi, over a lower cell at level j. Weight is a function of the specific gravity, γi, and cell volume, V. In addition, shear forces (friction) and horizontal forces can be considered. However, in this work only vertical force transmission was modeled. The vertical forces in the model are the weight components (gravity) and the shear components (friction). Here, weight transmission is simplified by introducing a buoyancy parameter, E, which is defined between 0 and 1 and represents the fraction of the weight of a cell that is distributed to the lower cells. The weight of the cell distributed to the lower cells is represented by Equation (1):
γ i γ i   1 E = γ i   E
Then, the weight of a cell at level j is its weight plus the weight fractions of the top nine cells (Equation (2)):
P j = γ j V + E i = 1 9 P i B i
Considering Pj as the weight of cell j and βi as the weight fraction of cell i transmitted to cell j, βi is defined by the multinomial probability distribution in Equation (3):
β x j = n ! j = 1 k x j ! j = 1 k p j x j
The proposed stress model is designed for granular material in a static state. However, as observed in previous research [26,28] vertical stress tends to increase in areas of stagnation and decrease in areas of movement when gravity flow is initiated due to ore extraction. It is for this reason that a relaxation parameter R, between 0 and 1, is introduced to model the weight distribution between zones of movement and stagnation. The parameter R decreases the probability of weight distribution over the movement zone when one or more cells are in the stagnant zone, applying Equation (4).
B k = B i R i = 1 9 B i R
In Equation (4), R = R (i.e., 0 < R < 1, R must be calibrated) if the cell i is a movement cell, or R = 1 if not (stagnant cell). The weight distributed to the lower cells is defined by the distribution function Bi, so the relaxation parameter multiplies Bi × R. The distribution function Bi is then updated to a new distribution function Bk, as shown in Equation (4), maintaining the distribution without losing the transferred mass. In the 2D example shown in Figure 3, the weight of the top-center cell is transferred to the non-void cells below. Since one cell is in the movement zone (bottom-right cell), it will receive less weight.

2.3. Fragmentation Model

In block caving mining, the size of the rock fragments is affected by the fragmentation that occurs during gravity flow in the ore column while material is being extracted from the drawpoints [4]. In addition, smaller particles or fragments can migrate between coarser fragments during this process [29,30,31,32]. The dynamics of these two phenomena, rock fragmentation and particle percolation, present challenges for large-scale simulation in the context of block caving. To meet this challenge, in a study carried out by [20], a gravity flow simulator using the dynamics of cellular automata with a void diffusion rule was used to create a fragmentation model [29] (Figure 4). The fragmentation model uses rock strength, vertical stresses, and distance traveled as input variables to estimate rock fragmentation on a caving scale and was calibrated using experimental and mining operations data.
The fragmentation model applied a reduction to the mean size (d50) associated with each cell to replicate the fragmentation that the material undergoes when it flows due to gravity. By applying a fragmentation model that modifies the d50 (Equation (5)), the fragmentation mechanisms are integrated. In this case, the size reduction ratio, R50, is defined as follows [21]:
R 50 = d 50 , i d 50 , f d .
In the equation above, R50 is the reduction in size suffered by the average size of the fragments (d50, cm) of a cell that travels a distance “d” (m). d50,i and d50,f are the average initial and final sizes, respectively (in cm), measured when a distance d is traveled. Then, knowing the reduction ratio R50 for a cell, it is possible to determine the fragmentation that a block will undergo, quantified through the decrease in its d50 when traveling a distance d from its original position. Additionally, the d50 is used in the flow simulator to incorporate migration during extraction [33]; for this reason, the d50 was selected in the fragmentation model.
There is an experimental correlation (Figure 5) between the proposed R50 and the UCS/σv relation. Thus, Equation 6 was proposed based on the observed results. Data from previous comminution experiments performed under confined conditions and during extraction were used to analyze the behavior of R50, presented in Figure 5.
From an adjustment to these data, the fragmentation equation was defined as follows:
R 50 = α σ v U C S β .
In Equation (6), R50 is the reduction ratio of the mean size (cm/m), σv is the mean vertical stress (MPa), UCS is the uniaxial compressive strength (MPa), and α and β are fitting parameters. In a case evaluated, the estimation errors were 9% and 7% [21]; those percentages were considered low error rates due to the wide variability of the phenomena involved. It should be noted that the R50 can be replicated for any characteristic size i, such as Ri, if the respective fitting parameters (α, β) for each size i are known. Then, Equation 6 can be rewritten as Equation (7):
R i = α σ v U C S β .
Equations (6) and (7) show that stress is one of the variables used by the fragmentation model to estimate size reduction. For this reason, it is essential that stress be correctly calculated and integrated as detailed below.

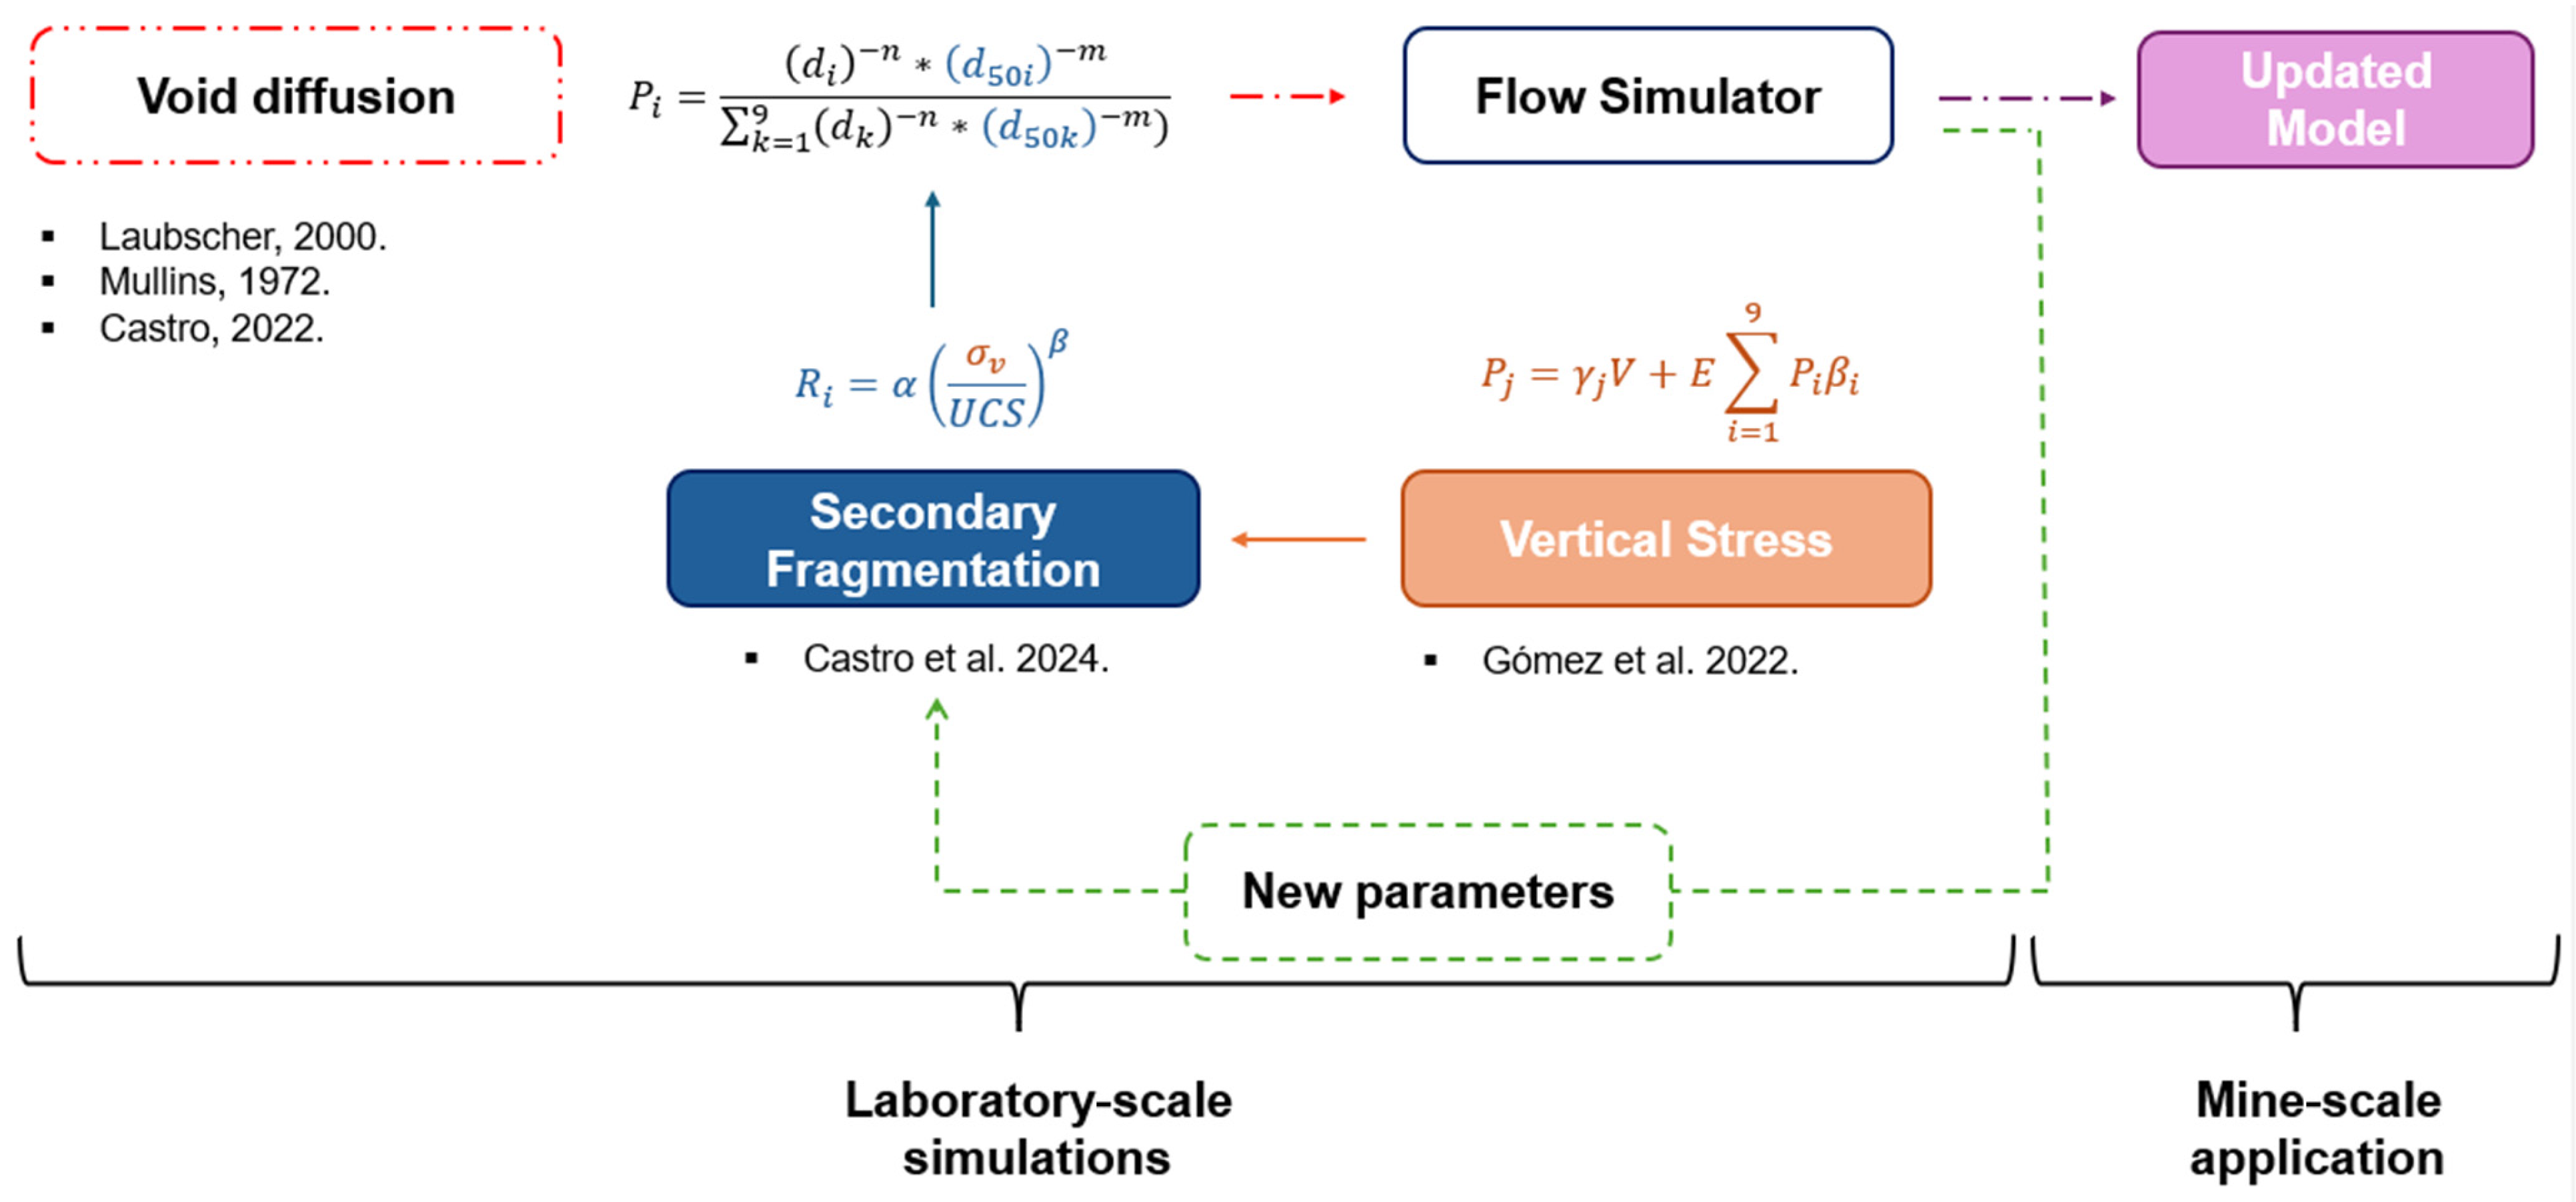
2.4. Combining Models

Using the fragmentation and stress models previously described [21,22] within a flow simulator, it is feasible to integrate key variables and mechanisms for a more accurate estimation of secondary fragmentation in block caving mining. A summary of the methodology used to accomplish this is presented in Figure 6.
The flow simulator used considers a probability function (Pi in Figure 6) to determine the probability of a higher cell descending. This function is what allows the modeling of the flow of broken material in a cellular robot. The variables of this function are the distance between cells (di) and the average size (d50). When a void is introduced in the robot (due to mineral extraction), the void rises, exchanging positions with a higher cell using this function. The closer the cell is (smaller d) and the smaller the granulometry (smaller d50), the greater the probability of exchange for that cell. More details on this operation can be found in [33]. As can be seen, the average size influences the probability of material flow according to this formula. This is where a fragmentation model is integrated that impacts the flow by decreasing the d50 as the simulation progresses, using Equation (6). Originally, this equation considered an average stress calculated by the lithostatic load; however, as the material is broken, this value may be overestimated, which is why in this work the stress model for broken material developed in [22] is used.
An integrated fragmentation + stress model was developed using a series of steps. First, the stress model [22] and the fragmentation [21] were merged by relating the two through vertical stress (σv). Then, the coupling between the two models was introduced into a flow simulator based on the void diffusion rule, to replicate the physical experiments carried out by [11]. After analyzing the results obtained in this step, the next step, indicated by green dotted lines, was carried out in which shear deformation and friction were incorporated. Subsequently, a new simulation was carried out with the new model under the same conditions as the first simulation, comparing both results based on the Ri values obtained for the different particle sizes (d10, d20, d50, and d80) to assess the improvement in the model’s accuracy. Finally, the new model integrating the shear strain effect was applied at mine scale to evaluate the generation of fine material.

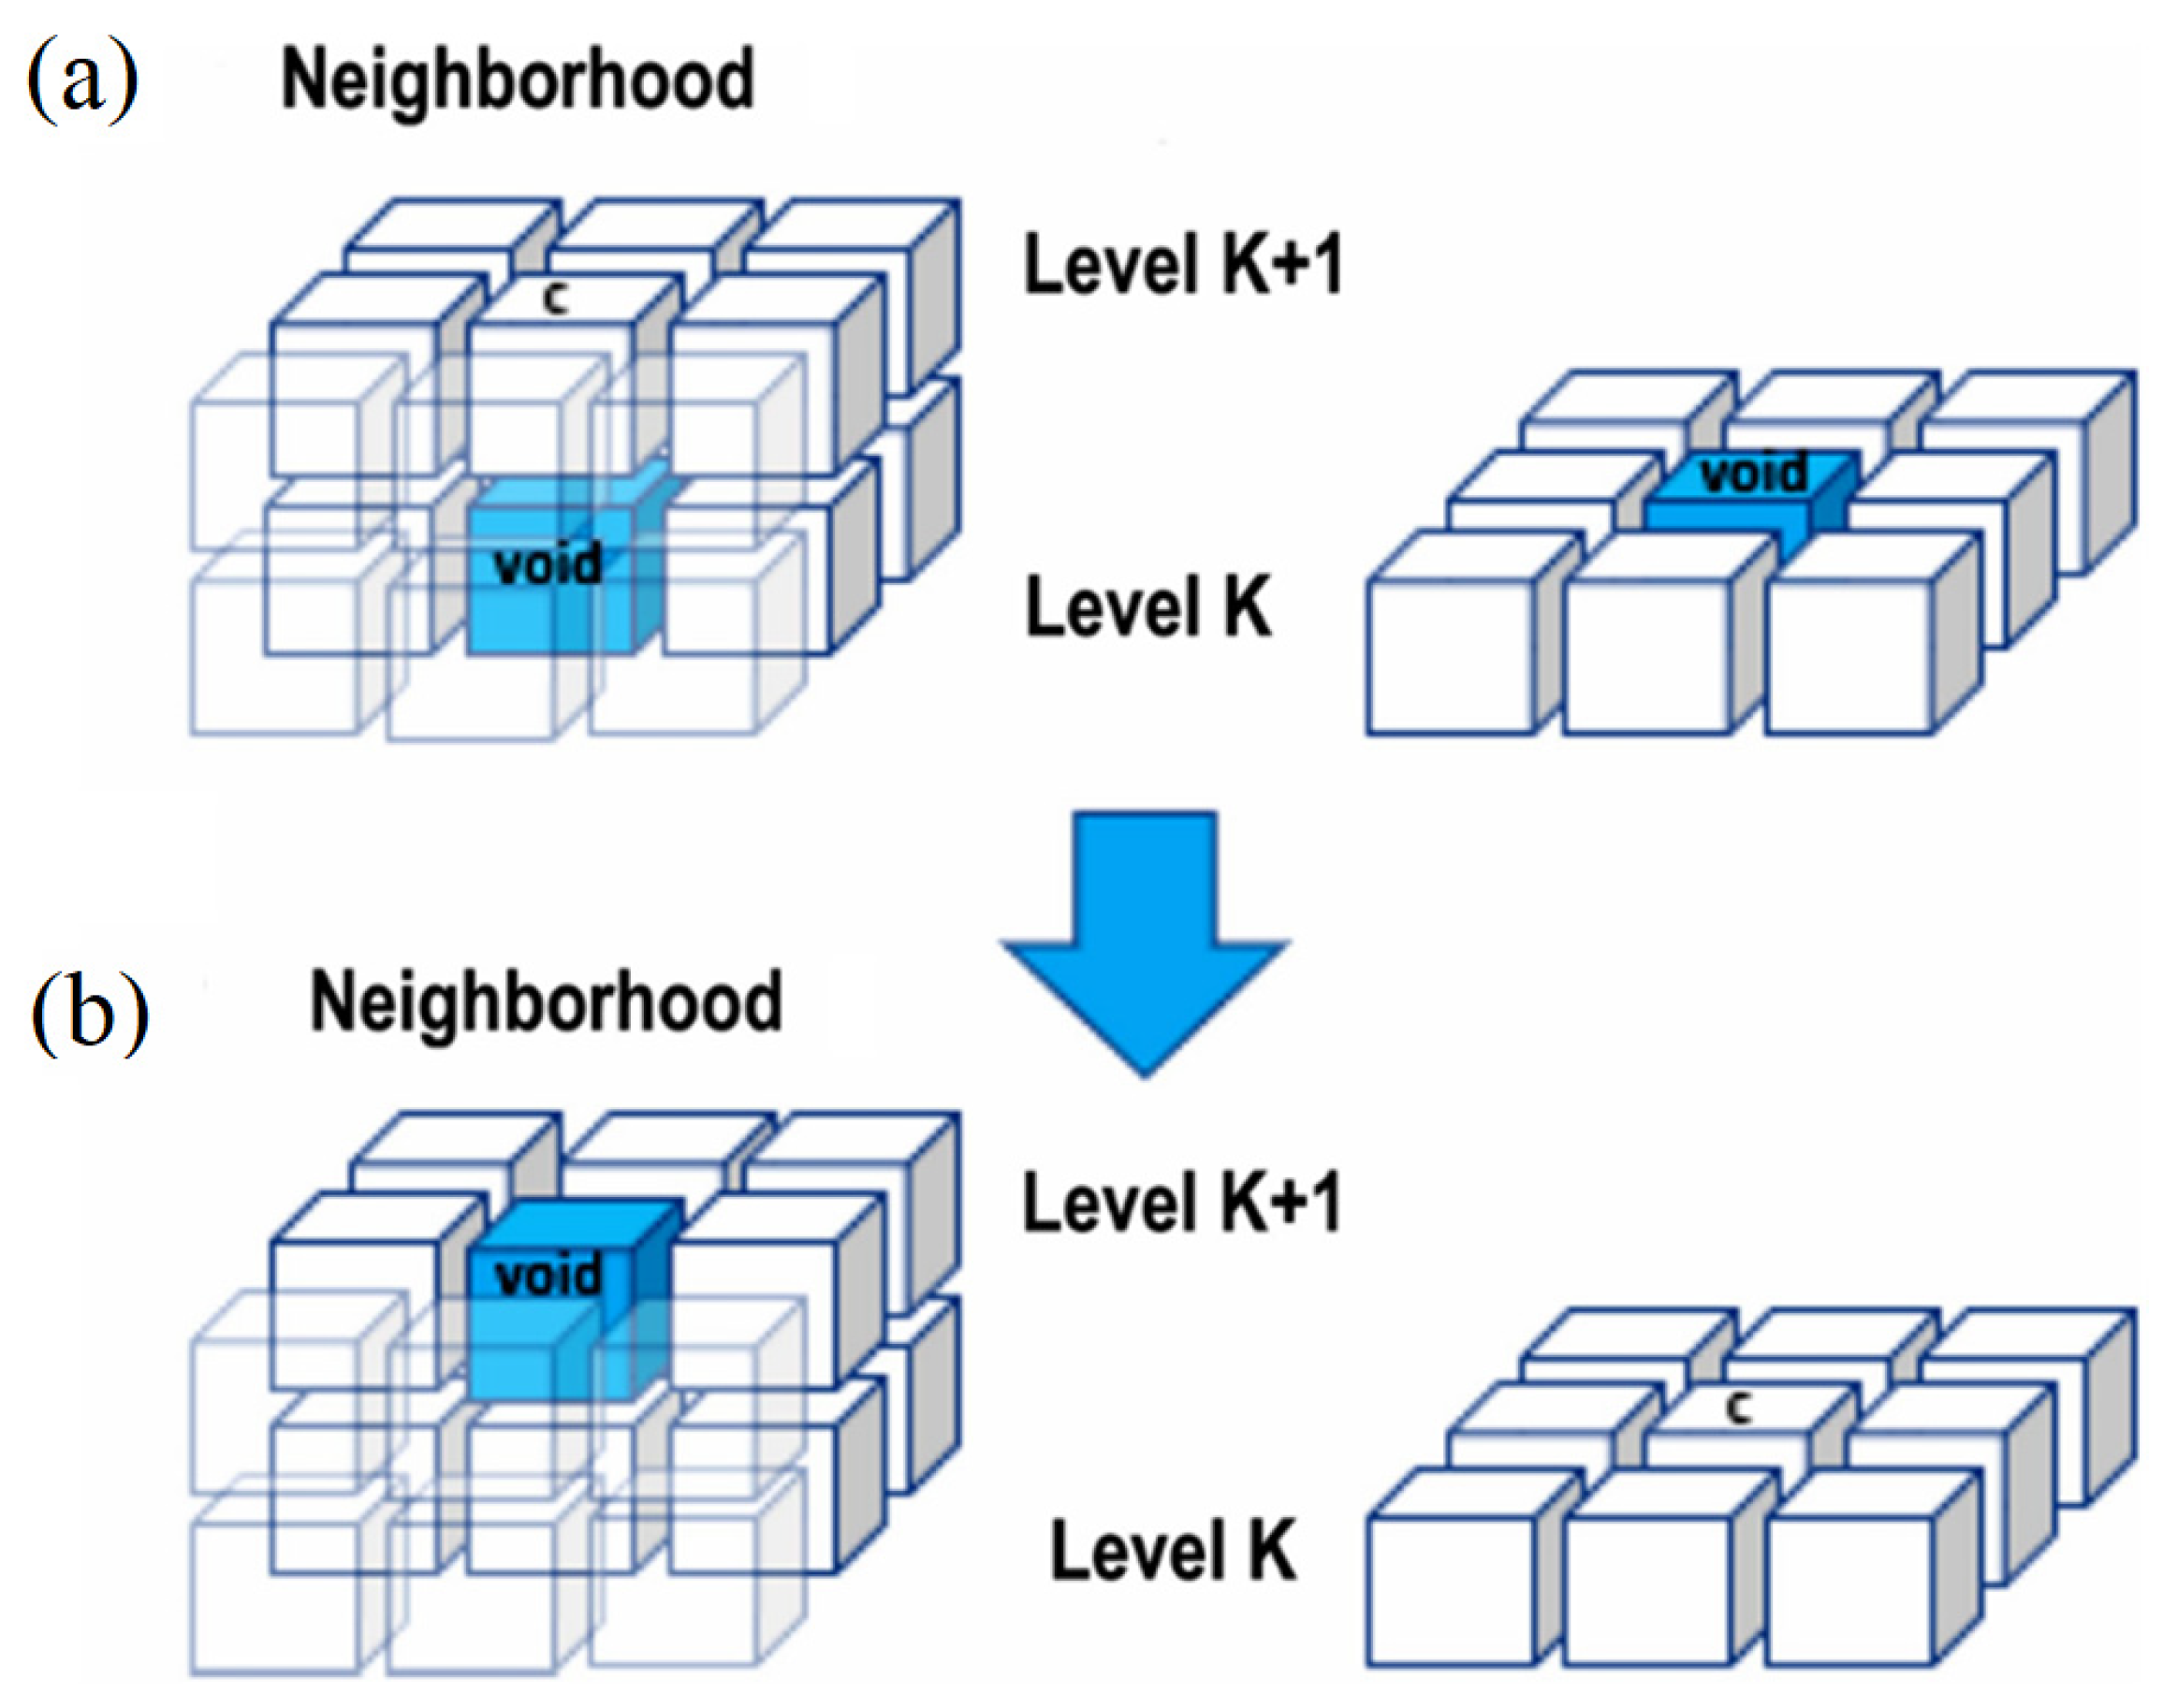
2.5. Numerical Model

To conduct the simulations with the original model, 3 block models were built based on the confined flow experiment [11], resulting in rectangular models with measurements of 34 cm × 34 cm × 70 cm. In these models, on the “y” axis of the graph, 68 cm correspond to granodiorite material (UCS 142.6 MPa), and the remaining 2 cm represent the confinement present in the experiment (Figure 7a). To incorporate different confinement pressures similar to the physical experiments and to have a bounded block model, an overload was simulated at the top of the block model by increasing the density of the upper blocks (red blocks in Figure 7a). Thus, depending on the confinement load to be achieved, a higher density was used, as indicated in Table 2. It should be noted that the density mentioned above has no relation to the density of the material tested (2620 kg/m3), represented in blue in Figure 7a.
Once the block model was built, the simulation was carried out in the flow simulator, using the input parameters shown in Table 3. Five simulations were carried out in each experiment, taking into account the vertical stresses used in previous experimental studies [11], which correspond to 0.8 MPa, 3 MPa and 5 MPa, to obtain characteristic size results.
An extraction of 40 cycles was performed, which is equivalent to approximately 9 kg. The N and Mv parameters are numerical model adjustment parameters that define the shape of the movement zone.

3. Results

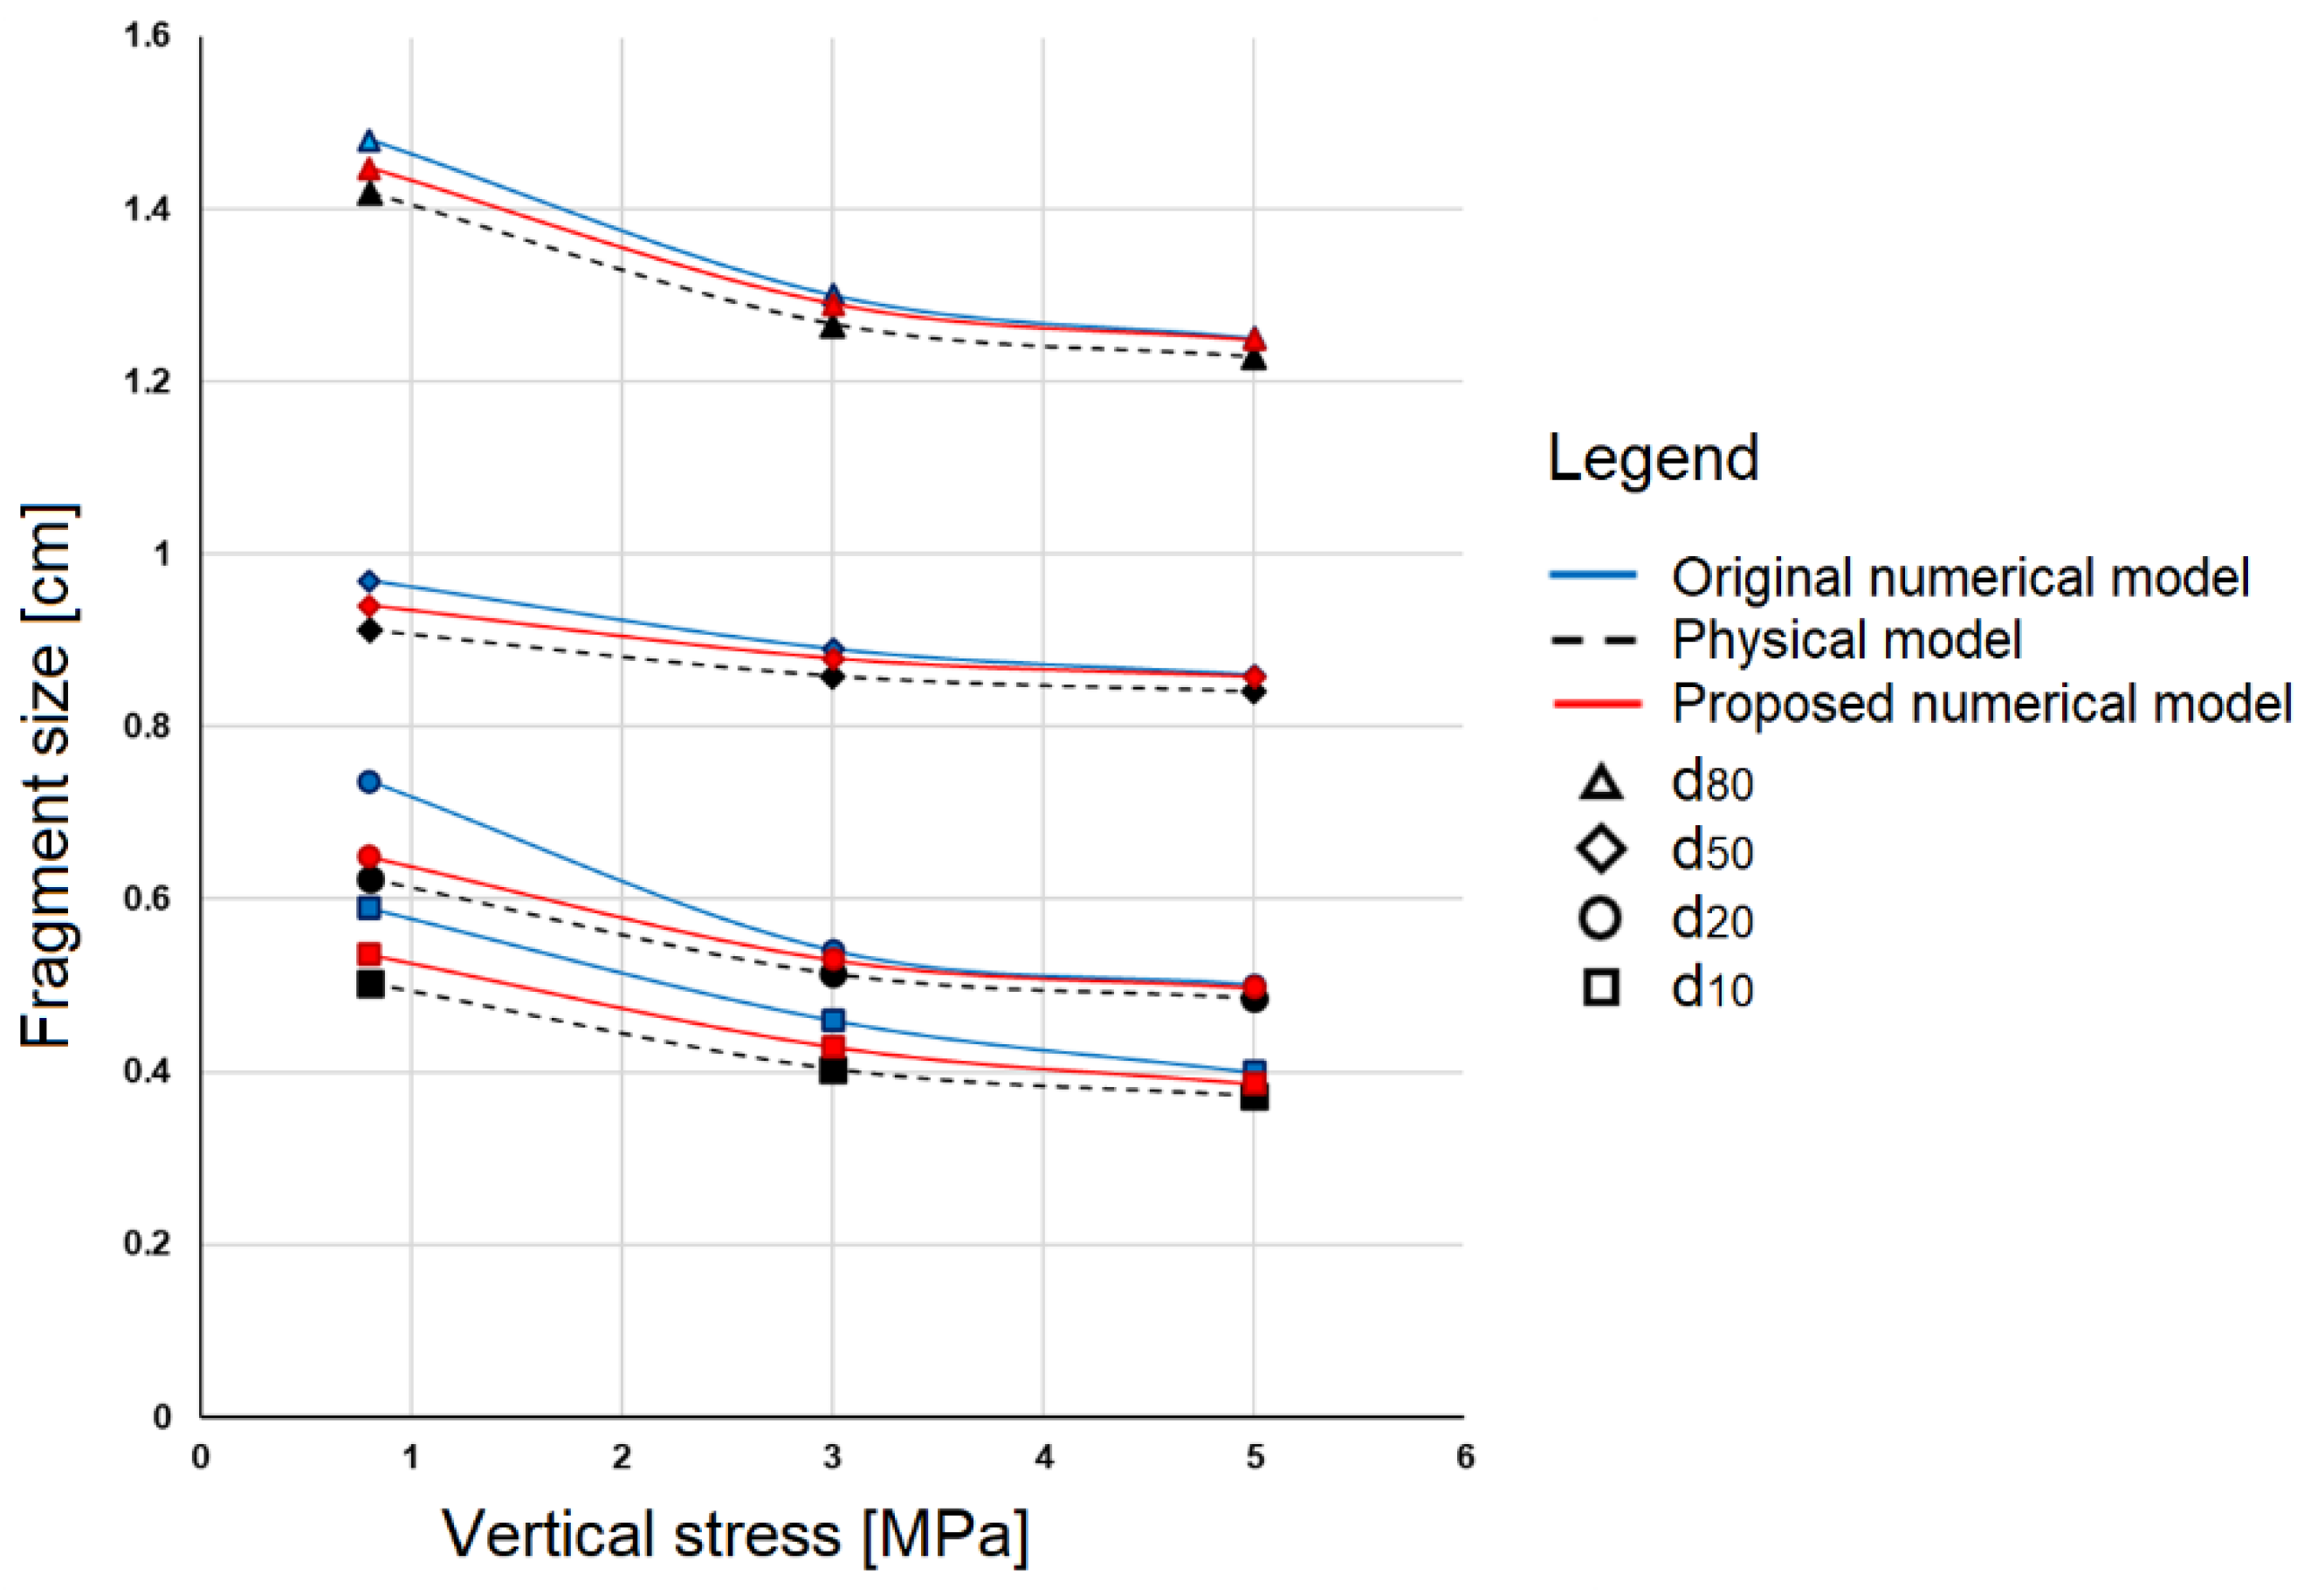
3.1. Original Model Results

The flow simulations of vertical stresses 0.8 MPa, 3 MPa and 5 MPa were evaluated to obtain the final sizes for each of the pass-through percentages to be assessed (d10, d20, d50 and d80) for comparison with the previously obtained experimental results. From this comparison, the fragmentation prediction capacity associated with the original model was determined. The characteristic sizes obtained by the numerical model correspond to the average value of the five simulations carried out for each vertical stress.
As shown in Figure 8 (square marker), at 0.8 MPa, the final simulated d10 was 0.59 cm, while the experimental value was 0.50 cm. At 3 MPa, the values were 0.46 cm and 0.43 cm, respectively, and at 5 MPa, the results were 0.40 cm and 0.39 cm. The associated errors decrease with increasing pressure, from 17.5% at 0.8 MPa to 7.5% at 5 MPa. This suggests that although the simulation tends to slightly overestimate fragment sizes, the model’s accuracy improves at higher stresses.
As for the d20 particle size, as shown in Figure 8 (circular marker), at 0.8 MPa, the error was 18.1%. However, as the stresses increased, this error was markedly reduced, with only 2.9% of error at 5 MPa. These data demonstrate that errors are greater at low stresses and decrease as the confinement stress increases.
Figure 8 (diamond marker) presents the results for d50, where the values obtained in the simulation were slightly higher than those obtained experimentally at the three evaluated stresses (0.8, 3 and 5 MPa). The percentage errors between the simulation and experiments are relatively low for d50 (6.2% at 0.8 MPa, 3.6% at 3 MPa and 2.3% at 5 MPa). This suggests that the simulation reproduces the behavior of the material under different levels of confinement quite well, with a better accuracy at higher stresses, where the discrepancy between the simulated and experimental results is minimal.
Finally, the values of the d80 fragment size, as illustrated in Figure 8 (triangular marker), show a decrease in both simulation and physical experiments as the confinement pressure increases. The percentage error for d80 is lower compared to the other sizes, with values of 4.4% at 0.8 MPa, 2.7% at 3 MPa and 1.8% at 5 MPa. These results indicate that the simulation model is quite accurate in predicting the d80 size, especially at higher stresses, where the discrepancy between the simulated and experimental values is minimal.
Overall, in this first iteration, better results were obtained in predicting medium to coarser sizes. Similarly, better accuracy was achieved at greater confinements. This suggests that the fragmentation model is better able to predict the compression mechanism but does not adequately replicate any shear mechanism that may be present, as it misses more in smaller sizes and low loads.

3.2. Fragmentation Model with Shear Effect

Given the results observed in Section 3.1 and to minimize differences, especially in the estimation of the smallest material size (d10 and d20), Ri results were evaluated in both numerical simulations and physical experiments. In this way, the error was quantified, which made it possible to identify the discrepancies and propose adjustments to incorporate the effect of the shear. Table 4 shows the errors as “ε”, which corresponds to the difference between the experimental and simulated Ri, as obtained from the previous estimates for each characteristic size. As shown in the table, errors decrease with greater confinement pressures.
Fragmentation related to shear has been identified in caving mining [6,35,36], and based on what was observed in Section 3.1, this error was hypothesized to occur because the shear strain effect was not considered in the fragmentation model. In this way, the reduction ratio (Equation (8)) can be expressed as follows:
R i = α 1 σ v U C S α 2 + ε ,
where
ε = γ δ σ v α 3 .
In Equation (9), γ is shear strain, a dimensionless parameter related to the interaction height and the width of the shear band. The vertical stress is represented by σv, while α3 is a calibration constant related to abrasion effects. The parameter δ is linked to the friction of the system, a calibrated and dimensionless value. The reduction ratio results are presented in Table 5 for different fragment sizes. Thus, considering the results in Figure 9, the values of the δ and α3 parameters are determined through the minimization of the mean square error.
After integrating this new factor (Equation (9)) incorporating shear fragmentation into the fragmentation model, a series of simulations were executed, following the same procedure used previously to ensure the consistency and comparability of the results obtained. The impact of the shear strain effect on the behavior of the model was analyzed for each of the pass-through percentages and the three confinement pressures considered in this study. The results derived from these simulations are presented in Figure 9. The characteristic sizes obtained by the numerical models (original and proposed) correspond to the average value of the five simulations carried out for each vertical stress.
The new model shows a good fit for the prediction of fine fragmentation at low confinement stresses, achieving an error of 6.8% in the simulation with the new integrated model compared to the experimental results for the d10 fragment size. As the stress increased, errors decreased to 6.5% for 3 MPa and 3.8% for 5 MPa, evidencing an improvement in model accuracy (Figure 9, square marker).
As for particle size d20, Figure 9 (circular marker) illustrates that for a 0.8 MPa stress, the adjusted model predicts a d20 value of 0.649 cm, very close to the experimental value of 0.624 cm. At higher stresses, the accuracy was maintained, with predictions of 0.530 cm for 3 MPa compared to 0.514 cm experimentally, and 0.498 cm for 5 MPa compared to 0.485 cm obtained in physical experiments.
The errors corresponding to the particle size d50 also reflect the accuracy of the fitted model. Under a stress of 0.8 MPa, the model predicted a value of d50 with an error of only 3.1%. At 3 MPa, the error was reduced to 2.3%, and at 5 MPa, it decreased even more to 2.0%, highlighting the progressive improvement in the model under conditions of greater stresses (Figure 9, diamond marker). For particle size d80 presented in Figure 9 (triangular marker), at 0.8 MPa, the model predicts a d80 of 1.447 cm, with an error of 2.0% compared to the experimental value of 1.42 cm. At 3 MPa, the error is only 1.9%, with a prediction of 1.29 cm versus the experimental 1.27 cm. Finally, at 5 MPa, the model predicts a d80 of 1.248 cm, with an error of only 1.6% compared to the experimental value of 1.23 cm.

4. Mine-Scale Application
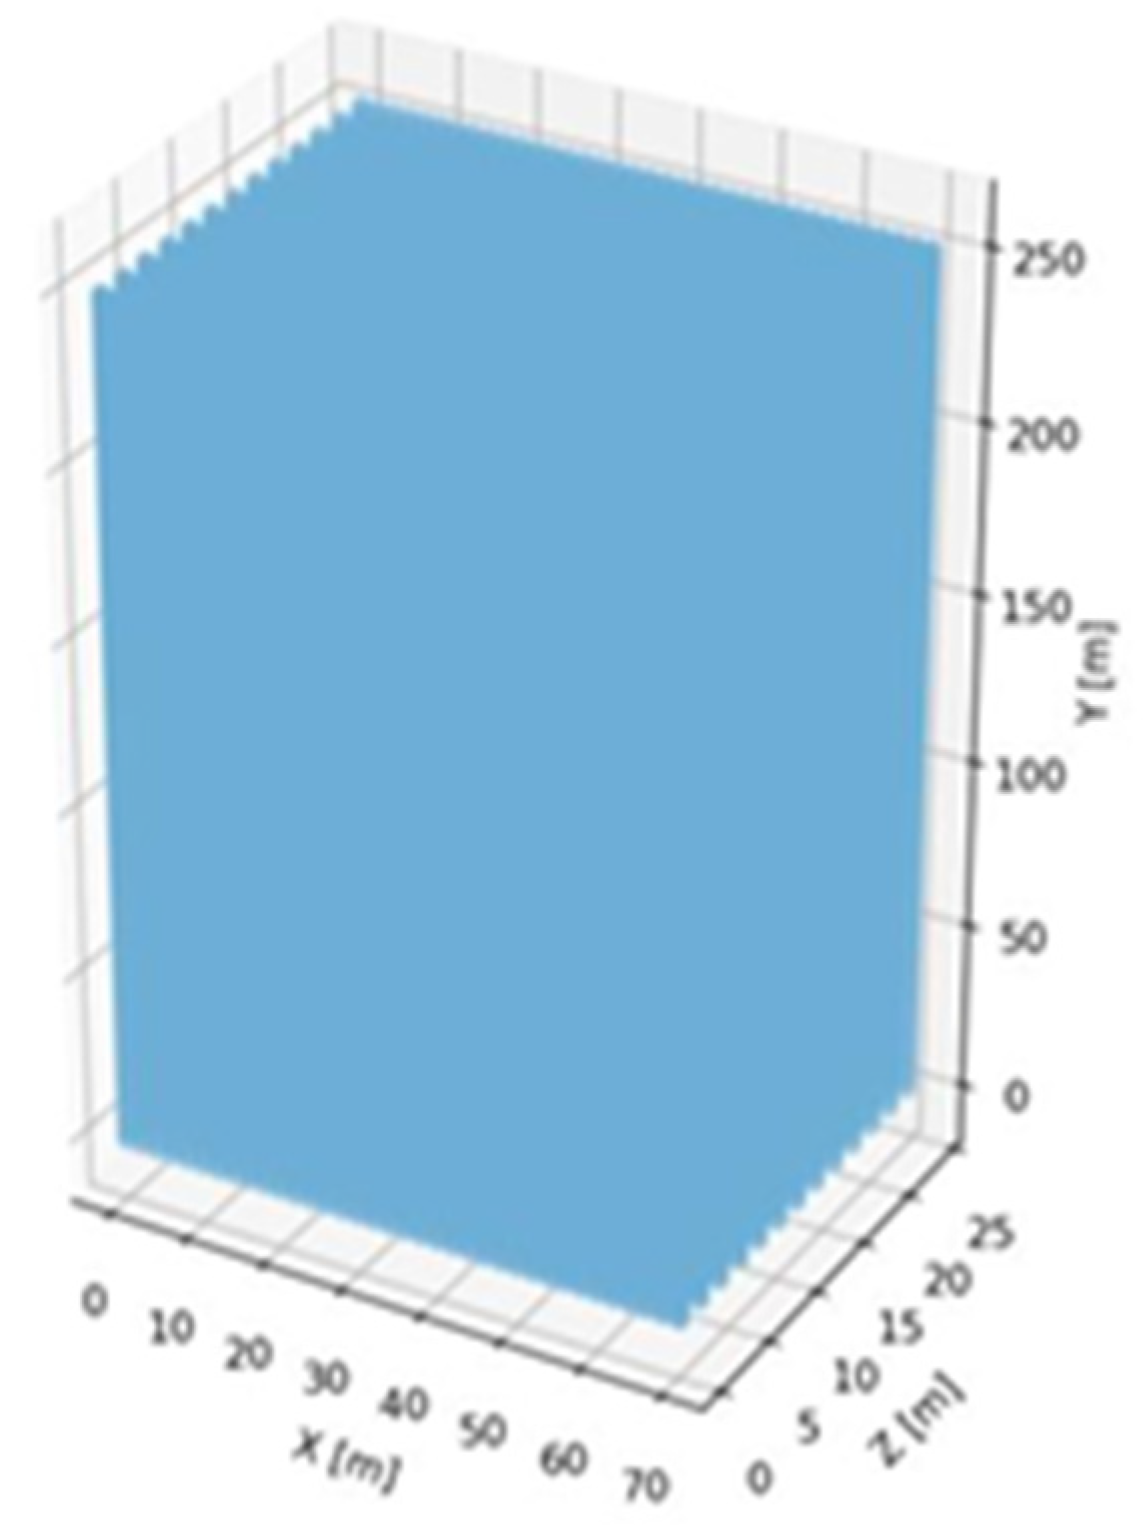
Because each mining operation defines “fine material” according to its particular conditions (type of rock, presence of water) and the problem being addressed (mud rushes, fine bursts, cohesive hangings, etc.) different classification criteria were applied to evaluate the generation of fine material during secondary fragmentation. The fragment size that constitutes fine material according to three distinct mining operations’ definitions was used in the scaled mine-model application described below. For example, in Esmeralda (El Teniente), fragments smaller than 5 cm are considered fine material; in Diablo Regimiento (El Teniente), those less than 7 cm; and in Palabora Lift 1, fragments smaller than 1 cm.

4.1. Input Data

To evaluate the behavior of the mine-scale model, simulations were carried out with real mine data and using a synthetic block model. The input parameters used are described in Table 6, and the block model with measurements are 70 m × 250 m × 25 m is shown in Figure 10.

4.2. Mine Scale Results

Figure 11 presents the results obtained from the large-scale flow simulation, including the new fragmentation model. This figure reports the d10 and d20 obtained during mineral extraction. Different “fine sizes” are also reported according to the criteria of three different block caving operations.
In the case of the Esmeralda criterion, 100% of the material corresponding to d10 was classified as fine, and 40.65% of d20 also fell into this category. This high amount of fine material could generate the previously mentioned operational problems, which highlights the need for an adequate predictive model for this type of fragment.
At the Diablo Regimiento criterion, 100% of the material of d10 and 80.43% of d20 would be classified as fine, indicating an even greater tonnage of fine material, increasing the likelihood of operational problems such as fine bursts or the formation of cohesive arcs at extraction points. Finally, in Palabora Lift 1, 80.43% of the d10 material would be classified as fine, but the size corresponding to d20 would not be included in this classification, as it exceeds 1 cm.
Because the accumulation of fine material can lead to operational problems, such as fine inrushes, mud rushes (in presence of humidity) and cohesive hangups, it is crucial to maintain rigorous control over the size of the fragments during the extraction process. These issues pose a risk not only to safety but also to the stability of the operation, highlighting the importance of a model that assesses the behavior of fine material as a function of extraction to prevent operational complications.
Future research should include an analysis of the effect of scaling the strength of the material tested to a laboratory scale, as well as the effect of fragmentation when extracting from multiple drawpoints or drawbells. Since friction is a key parameter, analyzing materials with different amounts of friction [37] or the heterogeneities of the rock mass [38] can also enrich the proposed model. Finally, if a robust database of extraction and rock characterization is available, the model could be validated on a larger scale. However, the results presented in Section 4 are within the range observed in caving mines [39,40,41,42,43].

5. Conclusions

The new model combining the fragmentation model with a stress model developed in a flow simulator showed satisfactory results when replicating experiments under high confinement pressure conditions at laboratory scale, reaching a margin of error close to 10%. However, when confinement pressures were lower, the discrepancy between simulated and experimental secondary fragmentation results increased considerably, which was hypothesized to be due to the absence of shear deformation. This discrepancy was observed particularly in the fine fragmentation simulation, since in the case of coarser fragments, such as d50 or d80, the margin of error was smaller. The main conclusions are summarized below:
  • With the inclusion of the shear strain effect, the results obtained with the new integrated model, which better represented the dynamics of the gravity flow and fragmentation of caved material, showed a notable improvement in fine granulometry, while for coarser sizes under conditions of high stresses, a slight improvement was also observed;
  • Shear deformation influences smaller fragments due to secondary fragmentation more significantly, validating its integration into the proposed model and improving the model’s prediction accuracy.
Given that fines are commonly identified in block caving mines, applying a model such as the one described here should be considered to support planning measures in the presence of fine material that will likely appear at drawpoints.

Author Contributions

Conceptualization, R.G. and R.C.; methodology, C.S.M.; software, C.S.M.; calibration, C.S.M.; formal analysis, R.G. and C.S.M.; investigation, R.G., C.S.M. and R.C.; resources, R.C.; data curation, C.S.M.; writing—original draft preparation, R.G.; writing—review and editing, R.C.; visualization, R.G. and C.S.M.; supervision, R.G. and R.C. project administration, R.C.; funding acquisition, R.C. All authors have read and agreed to the published version of the manuscript.

Funding

This research was funded by Agencia Nacional de Investigación y Desarrollo, grant numbers 1230749 and AFB230001.

Institutional Review Board Statement

Not applicable.

Informed Consent Statement

Not applicable.

Data Availability Statement

Data will be made available on request.

Acknowledgments

The authors also thank Diane Greenstein for her support in the editing.

Conflicts of Interest

The authors declare no conflicts of interest.

References

  1. Chitombo, G. Importance of Geology in Cave Mining. SEG Discov. 2019, 119, 1–21. [Google Scholar] [CrossRef]
  2. Chacon, J.; Gopfert, H.; Ovalle, A. Thirty years evolution of block caving in Chile. In Proceedings of the MassMin 2004, Santiago, Chile, 22–25 August 2004; pp. 387–392. [Google Scholar]
  3. Laubscher, D.H. Cave mining-the state of the art. J. S. Afr. Inst. Min. Metall. 1994, 94, 279–293. [Google Scholar]
  4. Brown, E.T. Block Caving Geomechanics, 2nd ed.; Julius Kruttschnitt Mineral Research Centre: Indooroopilly, QLD, Australia, 2007. [Google Scholar]
  5. Dorador, L.; Eberhardt, E.; Elmo, D. Influence of rock mass veining and non-persistent joints on secondary fragmentation during block caving. In Fourth International Symposium on Block and Sublevel Caving, 2018; Potvin, Y., Jakubec, J., Eds.; ACG: Vancouver, BC, USA, 2018; pp. 271–282. [Google Scholar] [CrossRef]
  6. Pierce, M.; Weatherley, D.; Kojovic, T. A hybrid methodology for secondary fragmentation prediction in cave mines. In Second International Symposium on Block and Sublevel Caving; Potvin, Y., Ed.; ACG: Perth, WA, Australia, 2010; pp. 567–581. [Google Scholar] [CrossRef]
  7. Laubscher, D. Block Cave Manual; Julius Kruttschnitt Mineral Research Centre: Brisbane, QLD, Australia, 2000. [Google Scholar]
  8. Pretorius, D.; Ngidi, S. Cave management ensuring optimal life of mine at Palabora. In Proceedings of the 5th Conference and Exhibition on Mass Mining, Lulea, Sweden, 9–11 June 2008; pp. 63–71. [Google Scholar]
  9. Laubscher, D.H. Mud flow/Mud push and water inflow potential. In Block Cave Manual, International Caving Study (1997–2000); JKMRC and Itasca Consulting Group, Inc.: Brisbane, QLD, Australia, 2000; pp. 1–9. [Google Scholar]
  10. Pierce, M.E. A Model for Gravity Flow of Fragmented Rock in Block Caving Mines. Ph.D. Thesis, University of Queensland, Brisbane, QLD, Australia, 2009. [Google Scholar]
  11. Gómez, R.; Castro, R.L.; Casali, A.; Palma, S.; Hekmat, A. A Comminution Model for Secondary Fragmentation Assessment for Block Caving. Rock Mech. Rock Eng. 2017, 50, 3073–3084. [Google Scholar] [CrossRef]
  12. Gómez, R.; Castro, R.; Betancourt, F.; Moncada, M. Comparison of normalized and non-normalized block caving comminution models. J. S. Afr. Inst. Min. Metall. 2021, 121, 581–588. [Google Scholar] [CrossRef]
  13. Esterhuizen, G.S. BCF: A Program to Predict Block Cave Fragmentation (Version 3.05); [Computer Software]; Pittsburgh, PA, USA, 2005. [Google Scholar]
  14. Itasca. Massflow Tutorial. Itasca International Inc., 2024. Available online: https://docs.itascacg.com/itasca920/massflow/enginemassflow/doc/manual/massflow_manual/massflowhome.html (accessed on 21 March 2025).
  15. Hardin, B. Crushing of Soil Particles. J. Geotech. Eng. 1985, 111, 1177–1192. [Google Scholar] [CrossRef]
  16. Bridgwater, J.; Utsumi, R.; Zhang, Z.; Tuladhar, T. Particle attrition due to shearing-the effects of stress, strain and particle shape. Chem. Eng. Sci. 2003, 58, 4649–4665. [Google Scholar] [CrossRef]
  17. Pierce, M.; Fuenzalida, M. Application of a methodology for secondary fragmentation prediction in cave mines. In Proceedings of the 3rd International Symposium on Block and Sublevel Caving, Santiago, Chile, 5–6 June 2014; pp. 318–327. [Google Scholar]
  18. Golder. FracMan; FracMan Technology Group: Redmond, WA, USA, 2012. [Google Scholar]
  19. Rogers, S.; Elmo, D.; Webb, G.; Catalan, A. A discrete fracture network based approach to defining in situ, primary and secondary fragmentation distributions for the Cadia East panel cave. In Second International Symposium on Block and Sublevel Caving; Potvin, Y., Ed.; ACG: Perth, WA, Australia, 2010; pp. 425–440. [Google Scholar]
  20. Wang, P.; Ren, F.; Cai, M. Influence of joint geometry and roughness on the multiscale shear behaviour of fractured rock mass using particle flow code. Arab. J. Geosci. 2020, 13, 165. [Google Scholar] [CrossRef]
  21. Castro, R.; Gómez, R.; Castillo, J.J.; Jerez, O. Fragmentation model integrated in a gravity flow simulator for block caving planning. Granul. Matter 2024, 26, 20–22. [Google Scholar] [CrossRef]
  22. Gómez, R.; Castro, R. Stress modelling using cellular automata for block caving applications. Int. J. Rock Mech. Min. Sci. 2022, 154, 105124. [Google Scholar] [CrossRef]
  23. Israelachvili, J.N. Intermolecular and Surface Forces, 3rd ed.; Academic Press: Cambridge, MA, USA, 2011. [Google Scholar]
  24. Andreotti, B.; Forterre, Y.; Pouliquen, O. Granular Media; Between Fluid and Solid, 55; Cambridge University Press: Cambridge, UK, 2013; Available online: https://books.google.cl/books?hl=es&lr=&id=2ekG3NYgpqsC&oi=fnd&pg=PR7&dq=granular+media+2013&ots=NZBBw_JSC1&sig=nRJYtYBABGO1pvK09hT75PhEou8&redir_esc=y#v=onepage&q=granular%20media%202013&f=false (accessed on 7 May 2025).
  25. Dorador, L.; Villalobos, F.A. Analysis of the geomechanical characterization of coarse granular materials using the parallel gradation method. Obras Proy. 2020, 27, 50–63. [Google Scholar] [CrossRef]
  26. Castro, R.; Gómez, R.; Pierce, M.; Canales, J. Experimental quantification of vertical stresses during gravity flow in block caving. Int. J. Rock Mech. Min. Sci. 2020, 127, 104237. [Google Scholar] [CrossRef]
  27. Pierce, M.E. Forecasting vulnerability of deep extraction level excavations to draw-induced cave loads. J. Rock Mech. Geotech. Eng. 2019, 11, 527–534. [Google Scholar] [CrossRef]
  28. Orellana, L.F. Evaluación de variables de Diseño del Sistema de Minería Continua a Partir de Experimentación en Laboratorio. Master’s Thesis, Universidad de Chile, Santiago, Chile, 2012. [Google Scholar]
  29. Laubscher, D. Dilution. In Block Cave Manual, International Caving Study (1997–2000); JKMRC and Itasca Consulting Group, Inc.: Brisbane, QLD, Australia, 2000. [Google Scholar]
  30. Hashim, M.; Hazizan, M.; Sharrock, G.; Saydam, S. A Review of Particle Percolation in Mining. In SHIRMS 2008; Potvin, Y., Carter, J., Dyskin, A., Jeffrey, R., Eds.; Australian Centre for Geomechanics: Perth, WA, Australia, 2008; pp. 273–284. [Google Scholar] [CrossRef]
  31. Castro, R.; Arancibia, L.; Gómez, R. Quantifying fines migration in block caving through 3D experiments. Int. J. Rock Mech. Min. Sci. 2022, 151, 8–10. [Google Scholar] [CrossRef]
  32. Aravena, M.; Palma, S.; Vivanco-Avaria, F.; Nelis, G. Quantification of fines migration in block caving mining through laboratory experiments. Results Eng. 2025, 25, 103576. [Google Scholar] [CrossRef]
  33. Castro, R.; Gómez, R.; Arancibia, L. Fine material migration modelled by cellular automata. Granul. Matter 2022, 24, 1–11. [Google Scholar] [CrossRef]
  34. Mullins, W.W. Stochastic theory of particle flow under gravity. J. Appl. Phys. 1972, 43, 665–678. [Google Scholar] [CrossRef]
  35. Dorador, L.; Heberhardt, E.; Elmo, D.; Norman, B.; Aguayo, A. Influence of secondary fragmentation and column height on block size distribution and fines migration reaching drawpoints. In Proceedings of the 3rd International Symposium on Block and Sublevel Caving, Santiago, Chile, 5–6 June 2014; pp. 128–137. [Google Scholar]
  36. Valderrama, M.M. Generacion de Material fino Inducido por Esfuerzo de Corte y su Aplicacion a la Fragmentacion Secundaria en Block Caving. Bachelor’s Thesis, Universidad de Concepción, Concepcion, Chile, 2024. [Google Scholar]
  37. Lapčević, V.; Torbica, S. Numerical investigation of caved rock mass friction and fragmentation change influence on gravity flow formation in sublevel caving. Minerals 2017, 7, 56. [Google Scholar] [CrossRef]
  38. Cardu, M.; Godio, A.; Oggeri, C.; Seccatore, J. The influence of rock mass fracturing on splitting and contour blasts. Geomech. Geoengin. 2022, 17, 822–833. [Google Scholar] [CrossRef]
  39. Brzovic, A.; Villaescusa, E. Rock mass characterization and assessment of block-forming geological discontinuities during caving of primary copper ore at the El Teniente mine, Chile. Int. J. Rock Mech. Min. Sci. 2007, 44, 565–583. [Google Scholar] [CrossRef]
  40. Pereira, J.; Divasto, C.; Barindelli, G. Evaluación Comparativa Metodologías Mapeo Presencial Granulométrico v/s Procesamiento Digital de Imágenes: Casos de Estudio Mina Subterránea. In SIMIN 2023; Universidad de Santiago de Chile: Santiago, Chile, 2023. [Google Scholar]
  41. Moss, A.; Russel, F.; Jones, C. Caving and Fragmentation at Palabora: Prediction to Production. In Proceeding of the Massmin 2004, Santiago, Chile, 22–25 August 2004; pp. 585–590. [Google Scholar]
  42. Kurniawan, C.; Setyoko, T.B. Impact of rock type variability on production rates and scheduling at the DOZ-ESZ block cave mine. In Proceedings of the 5th Conference and Exhibition on Mass Mining, Lulea, Sweden, 9–11 June 2008; pp. 291–302. [Google Scholar]
  43. Nadolski, S.; Munkhchuluun, M.; Klein, B.; Elmo, D.; Hart, C. Cave fragmentation in a cave-to-mill context at the New Afton Mine part I: Fragmentation and hang-up frequency prediction. Min. Technol. 2018, 127, 75–83. [Google Scholar] [CrossRef]
Figure 1. (a) Cylindrical model in a pressing machine to apply different vertical stresses. (b) Extraction point within the physical model [12].
Applsci 15 05425 g001
Figure 2. Profile view (2D) of weight transmission in a cell network [22]. Red arrows illustrate distribution of normal and shear forces.
Applsci 15 05425 g002
Figure 3. (a) Profile view of mass transmission in a six-cell arrangement with stagnant and motion zones, modified from [22]. (b) Stagnant zone and flow zone in a physical experiment [26].
Applsci 15 05425 g003
Figure 4. Void diffusion rule applied to the flow simulator [21]. (a) State prior to the ascent of a void. (b) State after exchanging cell “c” with the void.
Applsci 15 05425 g004
Figure 5. Fragmentation results from physical experiments under confined flow [12].
Applsci 15 05425 g005
Figure 6. Methodology used in this work to integrate previous modeling of stress (vertical stress) and fragmentation (secondary fragmentation) [7,21,22,33,34].
Applsci 15 05425 g006
Figure 7. (a) Block model for replicating confined flow experiments at 0.8 MPa. Initial state of stresses in kPa in the 2D cut in the middle of the model: (b) 0.8 MPa; (c) 3 MPa; (d) 5 MPa.
Applsci 15 05425 g007
Figure 8. Original numerical model vs physical model results [12].
Applsci 15 05425 g008
Figure 9. Results of the proposed numerical model for the pass-through percentages studied.
Applsci 15 05425 g009
Figure 10. Synthetic block model for mine-case simulations.
Applsci 15 05425 g010
Figure 11. Evaluation of fine material according to mine criteria.
Applsci 15 05425 g011
Table 1. Initial and final sizes of material in experiment.
Initial SizeFinal Size
Stress
[MPa]
d10
[mm]
d20
[mm]
d50
[mm]
d80
[mm]
d10
[mm]
d20
[mm]
d50
[mm]
d80
[mm]
0.86.657.4710.815.65.026.249.1214.18
34.035.148.5912.66
53.724.868.4112.28
Table 2. Densities associated with confinement pressures, including the rock density of the material used in the physical model and the high densities used to replicate a high vertical load in the numerical model.
Vertical Stress [MPa]Upper Block Density [kg/m3]Material Density [kg/m3]
0.8116,675.852620
3437,027.03
5728,378.61
Table 3. Input data for numerical simulations of gravity flow.
ParameterValue
Maximum extraction40
N6
Mv3
d10 initial0.66
d20 initial0.75
d50 initial1.08
d80 initial1.56
Number of simulations per vertical stress5
Table 4. Errors obtained between experimental and numerically simulated reduction ratios, Ri.
σv [MPa]ε
R10R20R50R80
0.80.5400.9160.3450.437
30.2180.1110.1400.067
50.0960.0540.0790.066
Table 5. Calibrated values for α3 and δ. Parameters obtained after minimizing the mean square error between the experimental and numerical values.
Reduction Ratiosα3 δ
R100.791.03
R201.582.10
R500.740.53
R801.251.15
Table 6. Input material properties used for mine-scale gravity flow simulation.
ParameterValueUnit
Density2600kg/m3
d100.049m
d200.107m
d500.340m
d800.809m
UCS70.0MPa
Disclaimer/Publisher’s Note: The statements, opinions and data contained in all publications are solely those of the individual author(s) and contributor(s) and not of MDPI and/or the editor(s). MDPI and/or the editor(s) disclaim responsibility for any injury to people or property resulting from any ideas, methods, instructions or products referred to in the content.

