Article

Study of a Triaxial Testing System for Unsaturated Subgrade Fillers Using a High-Suction Tensiometer and Photogrammetry

School of Civil Engineering, Harbin Institute of Technology, Harbin 150090, China
*
Author to whom correspondence should be addressed.
Appl. Sci. 2025, 15(10), 5380; https://doi.org/10.3390/app15105380
Submission received: 25 March 2025 / Revised: 7 May 2025 / Accepted: 8 May 2025 / Published: 12 May 2025
(This article belongs to the Section Civil Engineering)

Abstract

:
This study examines a triaxial testing system for unsaturated subgrade fillers, utilizing a high-suction tensiometer and photogrammetry to more accurately simulate and analyze their mechanical behavior. Digital image correlation (DIC) technology is combined with non-contact photogrammetry, employing a multi-ray tracing method to reconstruct the 3D model of the sample and monitor its volume changes. Real-time matric suction is measured using a high-suction tensiometer, avoiding traditional suction control methods and enabling a more accurate reproduction of deformation and suction changes in unsaturated soil samples under natural conditions. This study further analyzes key parameters, such as specific volume change, suction change, and shear failure state, under varying moisture content and stress conditions, with parameter calibration for mechanical behavior performed using the BBM model. This system significantly reduces traditional experimental time, offering a new tool for studying the mechanical behavior of unsaturated subgrade fillers, with substantial theoretical value and practical application potential.

1. Introduction

During the construction of unsaturated subgrades, the mechanical properties of the unsaturated subgrade fill have become key factors influencing its stability and safety. The triaxial test, widely used to characterize unsaturated soils, has been extensively applied. However, since the pores contain both water and air, the volume change of the soil sample no longer corresponds solely to the exchange of water, rendering conventional triaxial test equipment for saturated soils unsuitable for testing unsaturated soils. Recently, with the growing demand for measuring the volume change of unsaturated soils, various innovative methods and equipment have been developed. Houston and Zhang (2023) [1] proposed a novel method based on the stress path approach, which independently quantifies the effects of net total stress and suction on the volume change of unsaturated soils, providing a more refined framework for precise analysis. Roux and Jacobsz (2021) [2] used a high-capacity tensiometer (HCT) to directly measure the soil water retention curve (SWRC) and combined it with photometric methods to measure volume changes. Their findings indicated that this procedure is more precise for high-suction soils, as it is able to define hydraulic and volumetric behavior. Orazayeva et al. (2024) [3] created 3D scanning technology to measure residual soils’ volume change, eliminating the limitations of the historical drying method and offering better volume change data. Li et al. (2021) [4] performed compression experiments on soil samples while controlling suction and porosity to understand the behavior of unsaturated soils’ volume change. Their findings highlighted that their procedure was able to sufficiently control saturation variation for soil samples and sufficiently define hydraulic and mechanical responses. Alhaj et al. (2020) [5] used tensiometers, filter paper methods, and dew point moisture meters to measure the water retention curves of several unsaturated soil samples, investigate the volume change of soils under different moisture conditions, and showed that these results were sufficient and capable of jointly mapping the water retention curve of unsaturated soils, particularly tropical clay. Saha and Sekharan (2021) [6] employed the balloon method to measure the volume shrinkage curve (VSC) using tensiometers and dew point moisture meters. They noted the significance of the VSC in deriving the water retention curve (WRC) in low plasticity soils and argued that ignoring volume changes will result in measurement errors. Mishra et al. (2021) [7] suggested a straightforward method to measure volume change to derive effective soil water retention curves (SWRC) and soil shrinkage curves (SSC) for soft soils, using a simple balloon method to examine earth structure while also utilizing high-capacity polymer tensiometers.
In recent years, there has been a shift in the demand for research directed at investigating the mechanical behavior of unsaturated soils, which has led to the construction of new suction-controlled triaxial testing devices that provide improved measurement of unsaturated soil behavior. For example, some suction-controlled triaxial testing devices consist of a double chamber, with the inner chamber designed to monitor the soil sample’s volume change [8]. In some device designs, the inner chamber features an air inlet disk located at the bottom of the test chamber, supplemented with modern axial conversion technology to allow for proper matric suction control. More established designs of triaxial testing devices also contain an inner chamber filled with mercury, where a soil sample’s volume change is measured based on the change in the mercury meniscus [9]. The condensed communication pathway between the inner and outer chambers assists in mitigating any potential influence that confining pressure changes may have on measured data reliability. Suction-controlled triaxial testing devices have been depicted as some of the most useful means for testing unsaturated soil properties, especially regarding shear strength and deformation [10]. Despite the advancements made in suction-controlled triaxial devices, they are still impeded by technical conditions. For instance, the double chamber volume measurement method, while effective for volumetric measurements, has several limitations, such as complicated system calibration, changes in temperature, and the tendency for materials in the inner chamber to absorb water while the devices are operating [2]. If the method is only moderately calibrated, the volume change measurement of the inner chamber remains at an accuracy of 0.25%, yet unknown sources of errors remain latent, while their potential to affect the study is unknown. Suction-controlled triaxial tests usually operate under a consolidation–drainage mode of test measurement, which can take a long time to complete and can cost a great deal to run because of the need to decompress unsaturated soil samples due to their low permeability, which limits their application in typical engineering conditions [9]. When an intended complete characterization of the stress–strain behavior of an unsaturated soil sample is desired, an unsaturated triaxial test may take several years to run, resulting in significant limitations for practical engineering applications.
With the declining price of digital cameras, the application of image-based approaches to assess soil sample volume changes during triaxial tests is increasing [11]. It has become apparent recently that image-based strategies have advanced significantly in assessing soil sample volume changes (e.g., [12,13,14]). For example, Fayek et al. (2024) [12] proposed a method using photogrammetry to assess soil sample volume changes, which allows for the absolute measurement of soil volume in a triaxial test. More traditionally, this method relies on high-resolution imaging capabilities to measure soil sample volume changes with high accuracy for soil samples undergoing different strain stages. Zheng et al. (2020) [13] also used a similar image processing approach in conjunction with optical imaging and digital systems to measure soil samples in a non-contact manner. This allows for an efficient method of measuring soil samples that minimizes precision errors associated with manual measurement methods. The calibration of the system is important to consider in these image-based approaches. Fayek et al. (2024) [12] distinguished their work by proposing a new optical imaging system that provides accurate measurements of soil sample volume changes, unaffected by environmental effects. Furthermore, Li et al. (2021) [14] proposed an innovative three-dimensional image reconstruction approach for measuring soil sample volume deformation due to axial strain imposed during triaxial testing. They tested this process with or without complex equipment that supported three-dimensional viewing. Wang et al. (2020) [15] applied 3D digital image correlation (3D-DIC) technology, which produced significantly higher accuracy measures and made it easier to assess uneven deformations, providing new insights into soil mechanics. In contrast to these new methods, more traditional methods with a backbone that uses a water impermeable system, as proposed by Macari et al. (1997) [16] and Gachet et al. (2007) [17], appear to function reasonably; however, they require high-quality calibration and consideration of refraction and temperature effects, which contribute to the precision error. The proposed image processing technology was effective at ameliorating, in part, refraction and environmental effects while improving procedure efficiency and process accuracy and partially lowering or removing precision variables associated with traditional measures used in the laboratory. Wu et al. (2024) [18] employed the digital volume correlation method using particle tracking to improve earlier aspects of the precision variables associated with traditional methods. This offers superior precision measures of volume change when shear occurs on the soil sample [18]. Lastly, Sharanya et al. (2021) [19] demonstrated methods for considering soil sample volume change and the benefits and efficiencies of digital image methodologies. That is, three researchers concluded that these methodologies provide both efficacy and cost benefits when applied to laboratory methodologies.
Numerous researchers have measured the matric suction of unsaturated soil samples with high-capacity tensiometers (HCTs) over the past 20 years. Tensiometers, especially traditional ones, are commonly used for measuring soil suction in soil science; however, they are typically constrained to values less than 100 kPa because of the cavitation effect of water [19]. Recently, researchers developed new HCTs with higher performance for processing matric suction greater than 100 kPa. For example, Mendes et al. (2022) [20] recently used a new ceramic material with a higher air entry value (AEV) in the design of HCTs that facilitated the measurement of matric suction in excess of 3 MPa, which is an important feature for testing unsaturated soil samples. The introduction of high-capacity tensiometers has led to direct, reliable suction measurements. Liu et al. (2022) [21] evaluated osmotic pressure tensiometers (OT) to determine soil water characteristic curves (SWCC), finding that OT responded faster in the suction range of 10–1500 kPa and provided higher accuracy than traditional methods. Rahardjo et al. (2021) [22] introduced a new osmotic pressure tensiometer using cross-linked polymer solutions, which both expanded the range of suction measurement and enhanced reliability for long-term monitoring. In the application of a high-suction tensiometer, Hamdany et al. (2022) [23] proposed a new method for soil suction measurement based on NTU osmotic pressure tensiometers, which can accurately measure stable soil suction over time and is suitable for field monitoring. Guo et al. (2023) [24] developed a vacuum saturation technique (VCSM) to enhance the saturation process of high-suction tensiometers, thereby increasing their usability in laboratory and field settings. Tang et al. (2024) [25] proposed a real-time suction measurement technique based on fiber optic polymer sensors for application in unsaturated soil mechanics tests using high-suction tensiometers, which can measure suction values from 96 kPa to 911,456 kPa and exhibited good stability in shear and volume deformation tests. Najdi et al. (2023) [26] proposed improved HCT technology along with volume measurement techniques to provide higher fidelity in obtaining soil water characteristic curves. Although high-suction tensiometers establish superior accuracy for measurement properties, there are still challenges that remain. Liu et al. (2024) [27] noted that HCTs experience pressure decay after relatively prolonged periods of use, highlighting the need for calibration to improve stability. Moreover, Kang et al. (2023) [28] evaluated thermal physical parameter testing methods of HCTs and added optimized calibration functions to improve measurement accuracy in complicated environments.
Thu et al. (2006) [29] conducted constant water content triaxial tests on both saturated and unsaturated soil samples. Measures of suction and volume change were taken using a high-suction tensiometer and a double-chamber method, respectively. Despite its shortcomings in measuring volume changes, the double-chamber method was noted by Rasool and Aziz (2020) [30] as a good approach for determining the mechanical behavior of unsaturated soils in constant water content triaxial tests. This was particularly true when suction was low because the shear strength of the soil sample varied with water content, which complicated the influence of suction in controlled tests. Chen et al. (2020) [31] developed a new method that incorporated high-suction tensiometers with triaxial shear tests to measure the mechanical behavior of soil samples under different moisture contents. In their work, they note the merits of constant water content triaxial tests, which are a useful method for evaluating unsaturated soils. However, while constant water content triaxial tests can measure the stress–strain behavior of unsaturated soils, they found that Yoshikawa and Noda (2020) [32] suggested the analysis is more complicated than that of suction-controlled triaxial tests due to the improper analysis of suction. Fang et al. (2020) [33] utilized a modified state surface approach (MSSA) to address the issues they encountered with suction-controlled tests on unsaturated soils by explaining the elasto-plastic behavior of unsaturated soils under constant water content triaxial tests. They concluded that the MSSA was a good method for resolving complex issues, such as the relationship between shear strength and volume change encountered in constant water content triaxial tests.
In this research, a 3D settlement and consolidation testing system for unsaturated subgrade fill is presented, which incorporates high tensiometers and digital image correlation (DIC) non-contact photogrammetry. The system uses DIC and non-contact photogrammetry to accurately reconstruct the 3D model of the unsaturated soil specimens throughout triaxial testing, as well as to monitor volume changes in real time as a result of the test. The system incorporates a high tensiometer to measure matric suction during triaxial testing, rather than controlling suction, which allows for a more realistic representation of the 3D deformation process of the unsaturated subgrade specimen and suction changes during testing. The system also allows for axial force and confining pressure to be applied under unconfined conditions, which is closer to how soil behaves in its natural state. This system of testing can greatly enhance the accuracy of experiments compared to traditional methods, with much shorter testing times. Furthermore, variations in specific volume, suction response, and main parameters during shear failure for different moisture contents and total confining pressures are investigated. In order to relate the mechanical behavior of the specimens, the BBM model is used to calibrate them. This study presents crucial experimental data regarding the mechanical behavior of unsaturated subgrade fill under varying water content and loading conditions and provides important information pertaining to the mechanical properties of subgrade fill. Group A subgrade filler, which is widely used in practical engineering, was selected for the experiments due to its specific particle size distribution and physical properties. Therefore, the conclusions are mainly applicable to similar soil types and engineering conditions. Although the applicability is limited by variations in physical and mechanical properties among different soils, their fundamental mechanical behaviors are generally consistent. This suggests that the proposed testing method and the observed mechanical patterns can still be applied to similar soil conditions. Given the regional and project-based differences in the types and properties of subgrade fillers, future triaxial tests should be performed on a wider range of unsaturated sandy and silty soils to validate the applicability and generality of the conclusions. This would also support a systematic evaluation of the adaptability and measurement accuracy of the testing system under varied soil conditions. As a result, it would provide a stronger experimental foundation for understanding the mechanical behavior of unsaturated subgrade fillers and offer broader technical guidance for engineering applications.

2. Unsaturated Subgrade Filler Triaxial Testing System

The unsaturated subgrade fill triaxial testing system developed in this study is shown in Figure 1a. The pressure chamber’s outer wall is made of acrylic, with dimensions of 300 mm in height, 180 mm in outer diameter, 9.6 mm in thickness, and a refractive index of 1.491. A total of 200 measurement targets are installed on the acrylic outer wall, including six circular regions (30 targets each) and two vertical stripe regions (10 targets each). Additionally, high-contrast measurement targets, designed for automatic software identification, are installed on both the acrylic outer wall and the rubber membrane surrounding the specimen. Figure 1b illustrates the schematic structure of the testing system. Digital image correlation (DIC) technology is used in this system to reconstruct the 3D model of the unsaturated soil specimen from images captured during the triaxial test and to compute soil volume changes via non-contact photogrammetry. Moreover, a high-suction tensiometer monitors matric suction changes during the triaxial test rather than directly controlling the suction. This method applies axial force and confining pressure to the specimen to simulate natural drainage conditions, closely replicating the deformation and drainage processes of subgrade fill under natural conditions. Figure 1c shows the positioning of the 3D camera during the measurement process. To ensure effective data capture and prevent potential issues with image quality, the following camera parameters were carefully set and adjusted throughout the experiment: (a) Horizontal angle: The horizontal angle between the camera and the sample’s central axis is initially set between 15° and 30° to allow coverage of the side surface of the sample and avoid occlusion dead zones. The angle is then adjusted based on changes in the sample throughout the different deformation stages of the test, ensuring effective capture of morphological changes, the deformation process, and local deformation characteristics. (b) Distance between the camera and the sample: The distance between the camera and the surface of the sample is continually adjusted based on the required resolution and image coverage. During the tests, the distance from the camera to the surface of the sample was kept within a range of 30 cm to 50 cm to obtain clear images and avoid blurriness or distortion. The distance from the camera to the sample surface in the early stage of the experiment is approximately 40 cm. For cases in which the highest resolution is needed to capture local deformation features, the distance can be reduced to 30 cm; for cases in which a wider field of view is required to capture large deformation stages, the distance can be increased to 50 cm. Overall, this ensures adequate resolution and overlapping areas in all the different experimental stages. (c) Camera movement step size: To ensure coverage of the various areas of the sample, the camera is moved in the horizontal circumferential direction by 15° for each shot. After completing each set of images, the camera rotates a total of 15° relative to the center of the sample to take the next set of shots and continues this process until the complete 360° scan is completed or all deformation areas to be observed have been covered. (d) Camera height adjustment: The center of the camera lens is generally aligned with the central axis of the sample, corresponding to its midpoint. When significant shear bands or large deformations are observed, the height is adjusted in increments of ± 20 mm to ensure that the pre-identified deformation areas are within the optimal imaging range, thereby improving the accuracy and effectiveness of the images. (e) Number of views and overlap rate: The minimum number of photos taken for each testing step was 24 to cover the target minimum of a 360° view. For close-up images, the overlap rate was strictly maintained at ≥70%, with an overlap rate of 80% or more for specific areas of interest. This approach was designed to ensure that the subsequent imaging reconstruction process is seamless, smooth, and yields higher accuracy.
The image overlap rate affects the comparison accuracy of the algorithm, as well as many of the tasks involved in stabilizing the 3D reconstruction for subsequent reconstruction processes. When the overlap is below 60%, feature point matching becomes very difficult. To support the robustness of the 3D reconstruction process, a number of effective countermeasures were put in place to ensure that the mean image overlap rate remained above 60%: (a) Setting overlap rates: To ensure that images were aligned correctly and generated quality 3D models during the stitching process, a photo-to-photo overlap rate of 60% from adjacent photos was required in this study. This overlap rate was based on the standard recommendation of DIC technology, while fully considering the requirements for feature point matching at a later stage and for 3D reconstruction. A rationally chosen overlap rate optimizes the image without sacrificing critical components, allowing for the adequate capture of feature points in the image and effective matching from different angles to improve stitching. (b) Angle and camera configuration: During multiple view acquisition, the angle between two adjacent cameras was maintained at 10°~20° apart from their respective shooting directions, ensuring at least a 60% overlap rate for each image. This angle selection maintained the continuity of each image, accurately including features from one image to the next without duplicating data from overlaps. This limited overlap of the samples creates fewer redundant overlapping areas while allowing for coverage of almost any flat surface that still has distinguishable feature points. Consideration was also given to the angle and position for shooting the sample. The final shooting process ensured that the arrangements and sequences of view-to-view camera shots produced clear images and angles that covered the surface area in question while preventing blind spots and coverage gaps in overlapping areas. Each camera’s position and order pertaining to the images took into consideration the morphology of the subject material and experimental obligations. Based on the geometry of the subject material and utilizing precision objectives, a wider range from which to shoot was constructed as a circular approach with the cameras surrounding the material. While retaining as much usable image area as possible, the angles of each shooting situation and properly designated shooting sequences were managed so that any gaps due to omitted descriptions or lack of overlap did not result in white spaces or “lost” recorded aspects due to errors in the image acquisition order. (c) Redundant shooting strategy: A redundant shooting strategy was used as part of the experimental design to minimize the risk of insufficient overlap. That is, when the overlap area of adjacent images is too low, falling below the 60% threshold set for the experiment, additional shooting directions are taken, or the area is re-shot, to provide adequate support for all feature point locations in the reconstruction. Throughout the course of the experiment, repeated verification of the image stitching process and the integrity of the 3D reconstruction was performed to ensure that all overlap rates met the acceptable threshold and that there were no failures in the reconstruction due to low overlap areas. (d) Re-shooting local areas: Rebel local areas with low overlap that affect the overall quality of the reconstruction are re-shot to fill in missing viewpoint information and ensure that no gaps or distortions are present in the 3D reconstruction. The re-shooting of local areas is performed with strict capture ordering and camera settings to maintain data consistency across the other areas. This procedure enhances the reconstruction process for the quality of all low overlap situations in local areas to ensure data integrity and help to avoid instability or overall failure in the reconstruction process due to insufficient overlap in just one area. (e) Experimentation verification and quality control: Repeated shooting verifications were completed to ensure high-quality shots and the effectiveness of the overlap rate. After each experiment, image processing software was used to carry out a quantitative impact analysis to determine the extent of image overlap and ensure that all overlapped areas exceed 60%. Repeated verification and corrections were made to the actual image stitching process to further ensure that the high-definition match did not experience error catch-up behavior caused by low overlap rates.

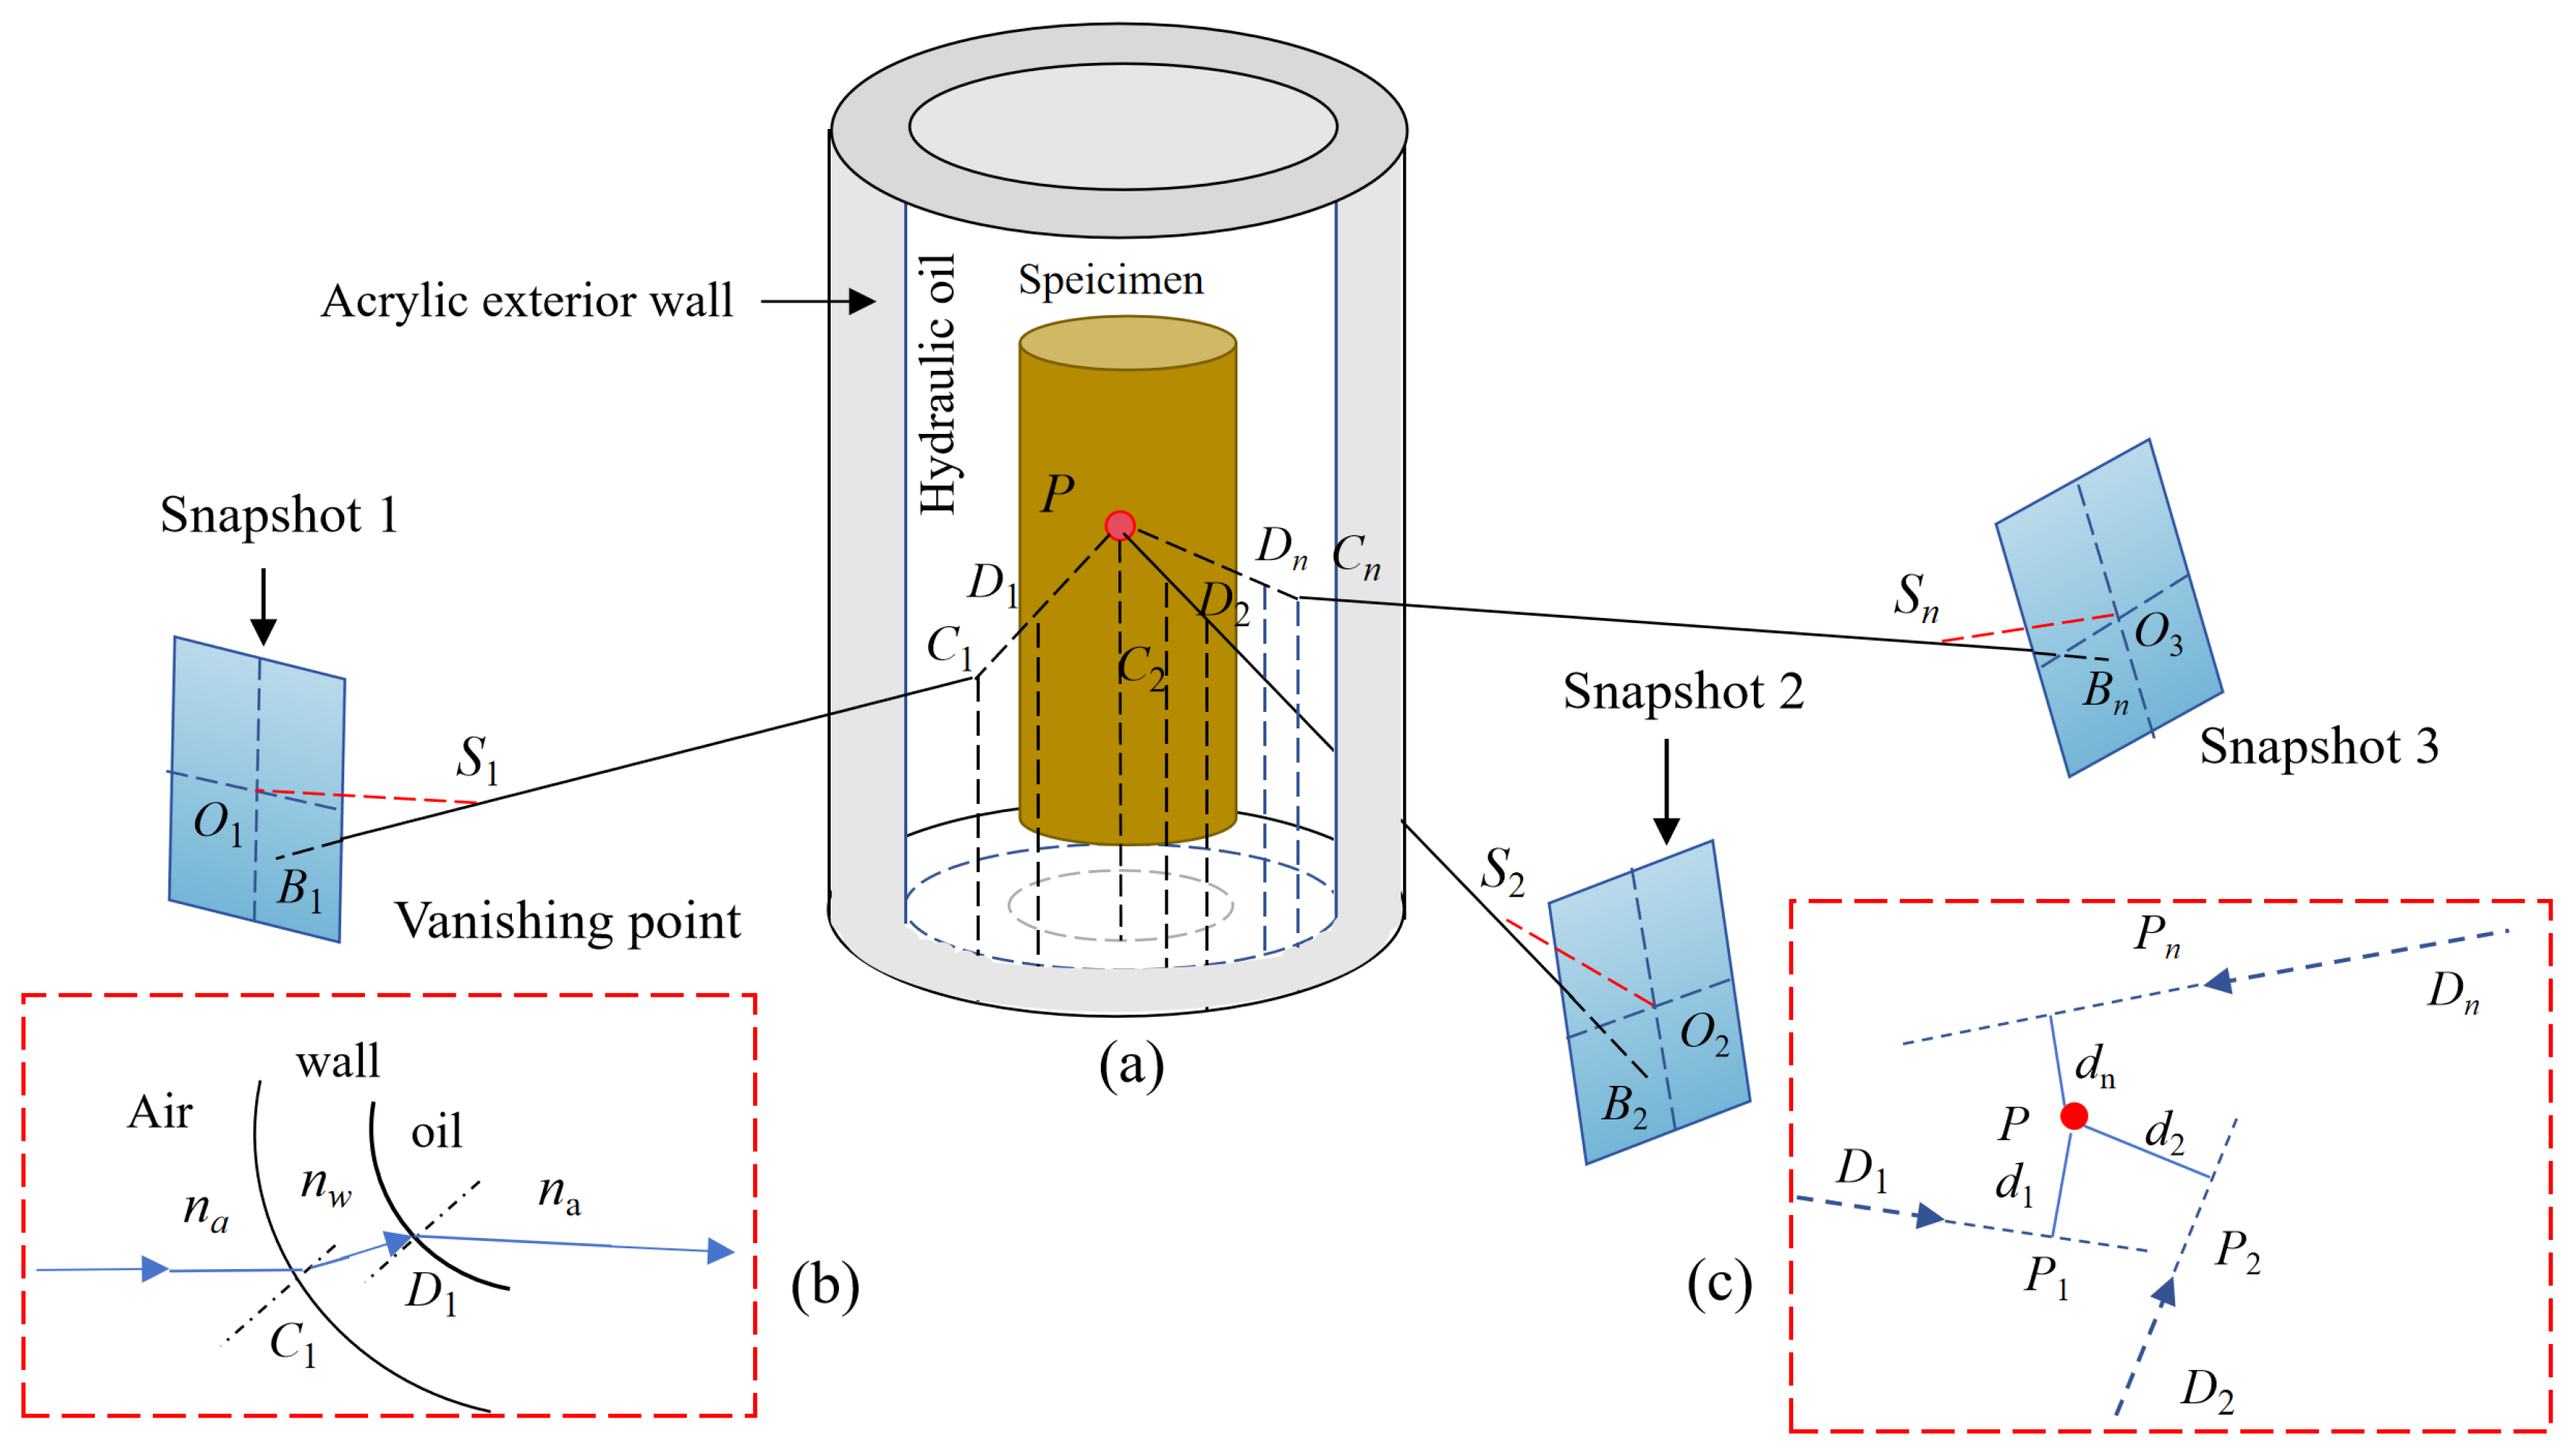
2.1. Three-Dimensional Volume Measurement of Samples Using Photogrammetry

Deformation data of the samples during the experiment are acquired using photogrammetry technology in this system. Overlapping images are captured with a digital camera, as shown in Figure 2a, and measurement markers are positioned on the loading frame and the surface of the triaxial chamber. The camera’s position and orientation are inferred based on photogrammetry principles, as demonstrated by the perspective center S1 in Figure 2. The 3D coordinates of the measurement targets on the triaxial chamber wall are calculated from known camera parameters, allowing for the precise determination of the shape and orientation of the chamber’s outer surface. By capturing images of the sample from various angles and applying image processing techniques, multiple 2D images are reconstructed into a 3D model, which precisely calculates the volume changes of unsaturated samples. This enables further analysis of shear strength characterization and constitutive model behavior during the 3D settlement consolidation process. This research proposes and refines a multiple ray-tracing technique to reconstruct the 3D model, as demonstrated in Figure 2. In Figure 2, S1, S2, and Sn represent the positions of the camera’s perspective centers, and subscripts 1, 2, and n represent the images captured at these locations. B1, B2, and Bn represent the positions of point P in each image, and O1S1, O2S2, and OnSn represent the camera’s shooting directions, with their magnitudes equal to the lens’s focal length. For example, by using the direction obtained from the photogrammetry analysis shown in Figure 2c for image 1, the 3D coordinates of the points in the image can be calculated, thus determining the 3D coordinates of ray B1S1. The shape and position of the triaxial chamber have been determined from the previous analysis, enabling the calculation of the intersection point C1 of ray B1S1 with the chamber’s outer surface, as shown in Figure 2a. By considering the known refractive indices of air (na) and the chamber wall (nc), along with the shape and position of the chamber’s outer surface, the direction of the incident ray B1S1, and the location of intersection C1, Snell’s Law is applied to calculate the direction of the refracted ray C1D1, as depicted in Figure 2b. A similar ray-tracing process can be applied to points B2 and Bn in images 2 and n, analyzing the same object point P. If there are no errors, all traced rays D1P, D2P, and DnP will converge at point P in three-dimensional space, as illustrated in Figure 2a. However, errors are inevitable in actual measurements, so the rays may not converge in three-dimensional space, as illustrated in Figure 2c. To address this issue, the least-squares optimization method proposed by Zhang et al. (2015) [34] may be referenced. By minimizing the sum of squared distances from a point to all traced rays, the source point of the rays is determined, allowing for the calculation of point P’s 3D coordinates, which are then used to calculate the 3D coordinates of multiple points on the sample’s surface, constructing a complete 3D model to determine the total volume change of the sample. This method is subsequently employed to obtain the 3D coordinates of many points on the surface of the sample, forming an overall 3D model that yields the ability to calculate the total change in volume of the sample.

2.2. Matric Suction Tensiometer

The tensiometer used in this study can measure a maximum suction of 1500 kPa and consists of three main components: porous ceramic, sensing element, and pressure sensor. Figure 3a illustrates the structural diagram of the tensiometer, in which the porous ceramic is connected to an internal reservoir, enabling the exchange of soil water with the external soil to measure matric suction. Figure 3b presents a schematic of the pressure sensor, detailing its internal structure and electrical connections. The tensiometer operates based on changes in soil water suction, sensing the dynamics of soil moisture to provide high-precision data on soil humidity, consolidation properties, and engineering responses. Figure 3c displays a photograph of the tensiometer. In this study, the tensiometer was saturated in a triaxial test chamber through multiple cycles of pressurization at 600 kPa to ensure complete saturation. Subsequently, the tensiometer was calibrated within the positive pressure range to ensure measurement accuracy and reliability.

3. Reliability Evaluation of the 3D Settlement and Consolidation Testing System for Unsaturated Subgrade Fill

3.1. Sample Preparation

The soil used in this study was sourced from a high embankment along a heavy-haul railway. Its characteristics include a coefficient of uniformity, C u = d 60 / d 10 , of 10.894 and a coefficient of gradation, C c = d 30 2 / d 60 d 10 , of 1.02, placing it within the classification of Group A fillers according to the guidelines outlined in the TB10001-2016 (2016) [35]. The detailed particle grading distribution is presented in Table 1. The embankment filler was subjected to sieving in accordance with the TB10102-2010 (2010) [36], and the particle grading curve for the unmodified embankment filler is illustrated in Figure 4. This filler exhibited a maximum dry density of 2.06 g/cm3 and an optimum moisture content (OMC) of 8.5%, as determined through standard light compaction testing. A compaction level of 95% was used to prepare the samples. Figure 5 shows the compaction test curve for the embankment soil.
Based on the fundamental properties of the embankment filler, the sample preparation process was carried out as follows. First, the soil is dried, and distilled water is added at a mass ratio of 16% relative to the moisture content. During the weighing process, an additional 2% of distilled water is added to compensate for moisture loss during mixing. The distilled water is divided into three portions, each of which is sprayed evenly onto the soil sample using a spray method, including mixing for 3 min per portion. This process is repeated until the soil sample is thoroughly mixed. After mixing, the sample is shaped, wrapped in plastic film, and placed in a moisture box for 24 h for curing before further use. The light compaction method is then applied to divide the soil sample into three layers, which are compacted into a soil column with a diameter of 100 mm and a height of 200 mm. After compaction, the sample is exposed to the atmosphere for approximately 15 min each time, with the exposure time precisely controlled to gradually adjust the moisture content and accurately control its evaporated moisture. Finally, the treated soil sample is sealed in a plastic bag and stored in a humid room for 30 days to ensure that the suction of each layer in the sample reaches equilibrium. The sample parameters under different initial conditions are presented in Table 2, where the suction values measured for three sample groups under varying net confining pressures are listed, with net confining pressures of 5 kPa, 200 kPa, and 600 kPa.

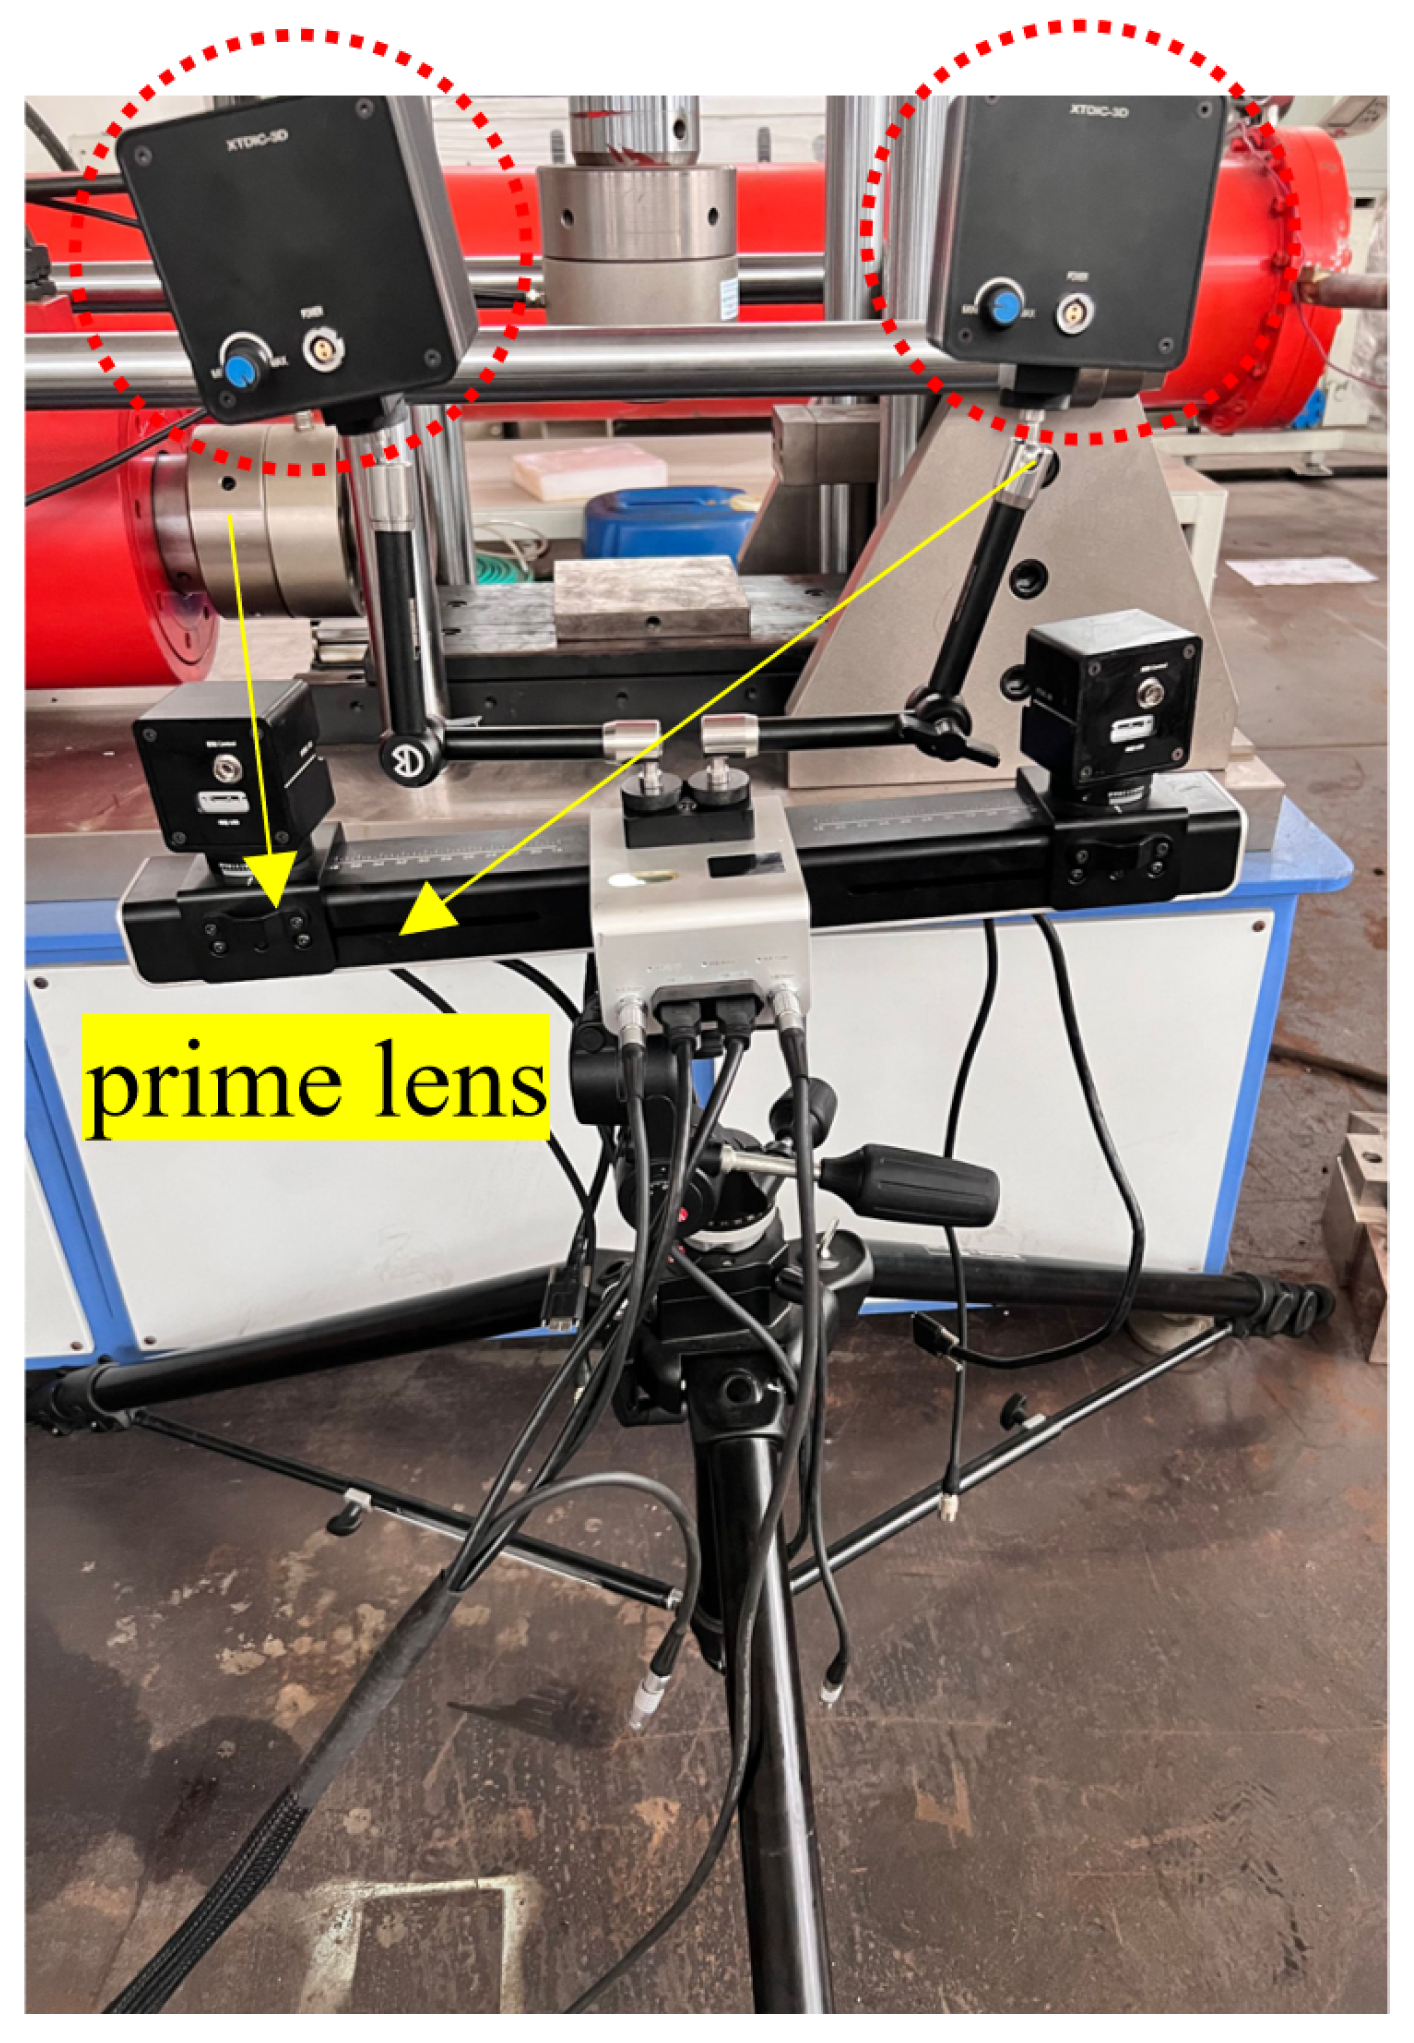
3.2. Photogrammetry System and Camera Calibration

A digital image correlation (DIC) system was employed in this study, as shown in Figure 6. Equipped with two 35 mm fixed-focus lenses (Canon EF 35 mm f/2 IS USM), the system features lenses with a large aperture and short focal length, making them particularly suitable for observing small deformations in confined spaces, especially in experiments requiring a larger field of view. The camera’s image sensor has a resolution of 12.3 megapixels (4000 × 3000 pixels), providing sufficient detail to ensure high precision during 3D reconstruction. Although camera lenses may exhibit barrel or pincushion distortion, photogrammetry assumes the camera lens to be an ideal pinhole lens, necessitating distortion correction. To achieve this, the digital image correlation system employed multi-lens calibration technology, capturing 15 images of a standard calibration board to obtain accurate internal and external camera parameters. The internal parameters include focal length, principal point location, and distortion parameters, while the external parameters include the camera’s translation vector and rotation matrix. These parameters were calculated accurately using the Levenberg–Marquardt optimization algorithm, ensuring high accuracy and reliability of the measurement data. The camera’s calibration results are listed in Table 3.

3.3. Experimental Design

Three sets of experiments with constant moisture content were designed and conducted to validate the self-developed 3D settlement and consolidation testing system, as shown in Table 2. Each experiment was performed under consolidated undrained and consolidated drained conditions. Under consolidated undrained conditions, data and characteristics of the pore-water phase were tested, while under consolidated drained conditions, the same factors were evaluated. The first set of experiments was conducted under a constant confining pressure of 5 kPa, with shear applied until the soil sample failed. The second set of experiments involved isotropically loading the soil sample to 200 kPa, followed by shear at this pressure until failure or until the axial displacement reached 20 mm, whichever occurred first. In the third set of experiments, the soil sample was isotropically loaded to 600 kPa, followed by shear until the axial displacement reached 20 mm. During the isotropic loading phase of the second and third sets of experiments, the confining pressure was increased by 50 kPa at each step. The soil was sheared at a rate of 1 mm/min during triaxial shear. During the isotropic loading phase, the loading process was paused and held constant after each 50 kPa increase in confining pressure or every 2–3 mm of axial displacement. Volume changes in the sample caused fluctuations in pore water pressure (uw), which were measured using the high-tensiometer described in Section 2.2. Tensiometer measurements typically stabilize in 20 min, which is consistent with findings from Andrianatrehina et al. (2020) [37], Rahardjo et al. (2021) [22], and Le and Jacobsz (2021) [2]. The suction value measured at this stage is termed the representative suction for the effective loading condition. Image analysis was subsequently performed using photogrammetry, as described in Section 2.1, with photographs taken from different directions to ensure optimal quality and accuracy. To enhance measurement accuracy, the following strategies were employed: (1) at least five photos from different directions were taken for each region or point of interest; (2) sufficient overlap between adjacent photos was ensured; and (3) photos were captured from various angles. Approximately 24 photos were taken for each loading step, with the required time being 2 to 3 min. Each triaxial test typically took 6 h to complete. After the test, the soil samples were extracted, and their total weight and moisture content were measured for subsequent analysis. In the USA, the ASTM D2435 (2011) [38] standard indicates that a conventional triaxial test usually requires a longer period of time, especially when performing consolidation tests on a saturated sample, as there is generally a 24 h observation time, and some clay will take up to 48 h to consolidate to ensure complete consolidation. The Chinese Standard for Geotechnical Testing Method (GB/T 50123-2019 [39]) also allows for longer periods to observe sample volume and suction changes during conventional triaxial testing, mainly using 24 h as a reference for the entire test cycle. In the Standard for Soil Test Method (GB/T 50123-1999 [40]), it is stated that during triaxial testing, the settlement should be measured, and the relevant results presented within 24 h in order to account for the stability of the soil sample. However, the triaxial testing system in this thesis uses a combination of high-suction tensiometer technology and digital image correlation technology to perform the tests in a very short experimental time while obtaining accurate results. A direct comparison with traditional methods showed that this system can complete all the required data collection for conventional triaxial tests, including volume and suction changes, in as little as 6 h while maximizing experimental efficiency.

3.4. Analysis of Experimental Results

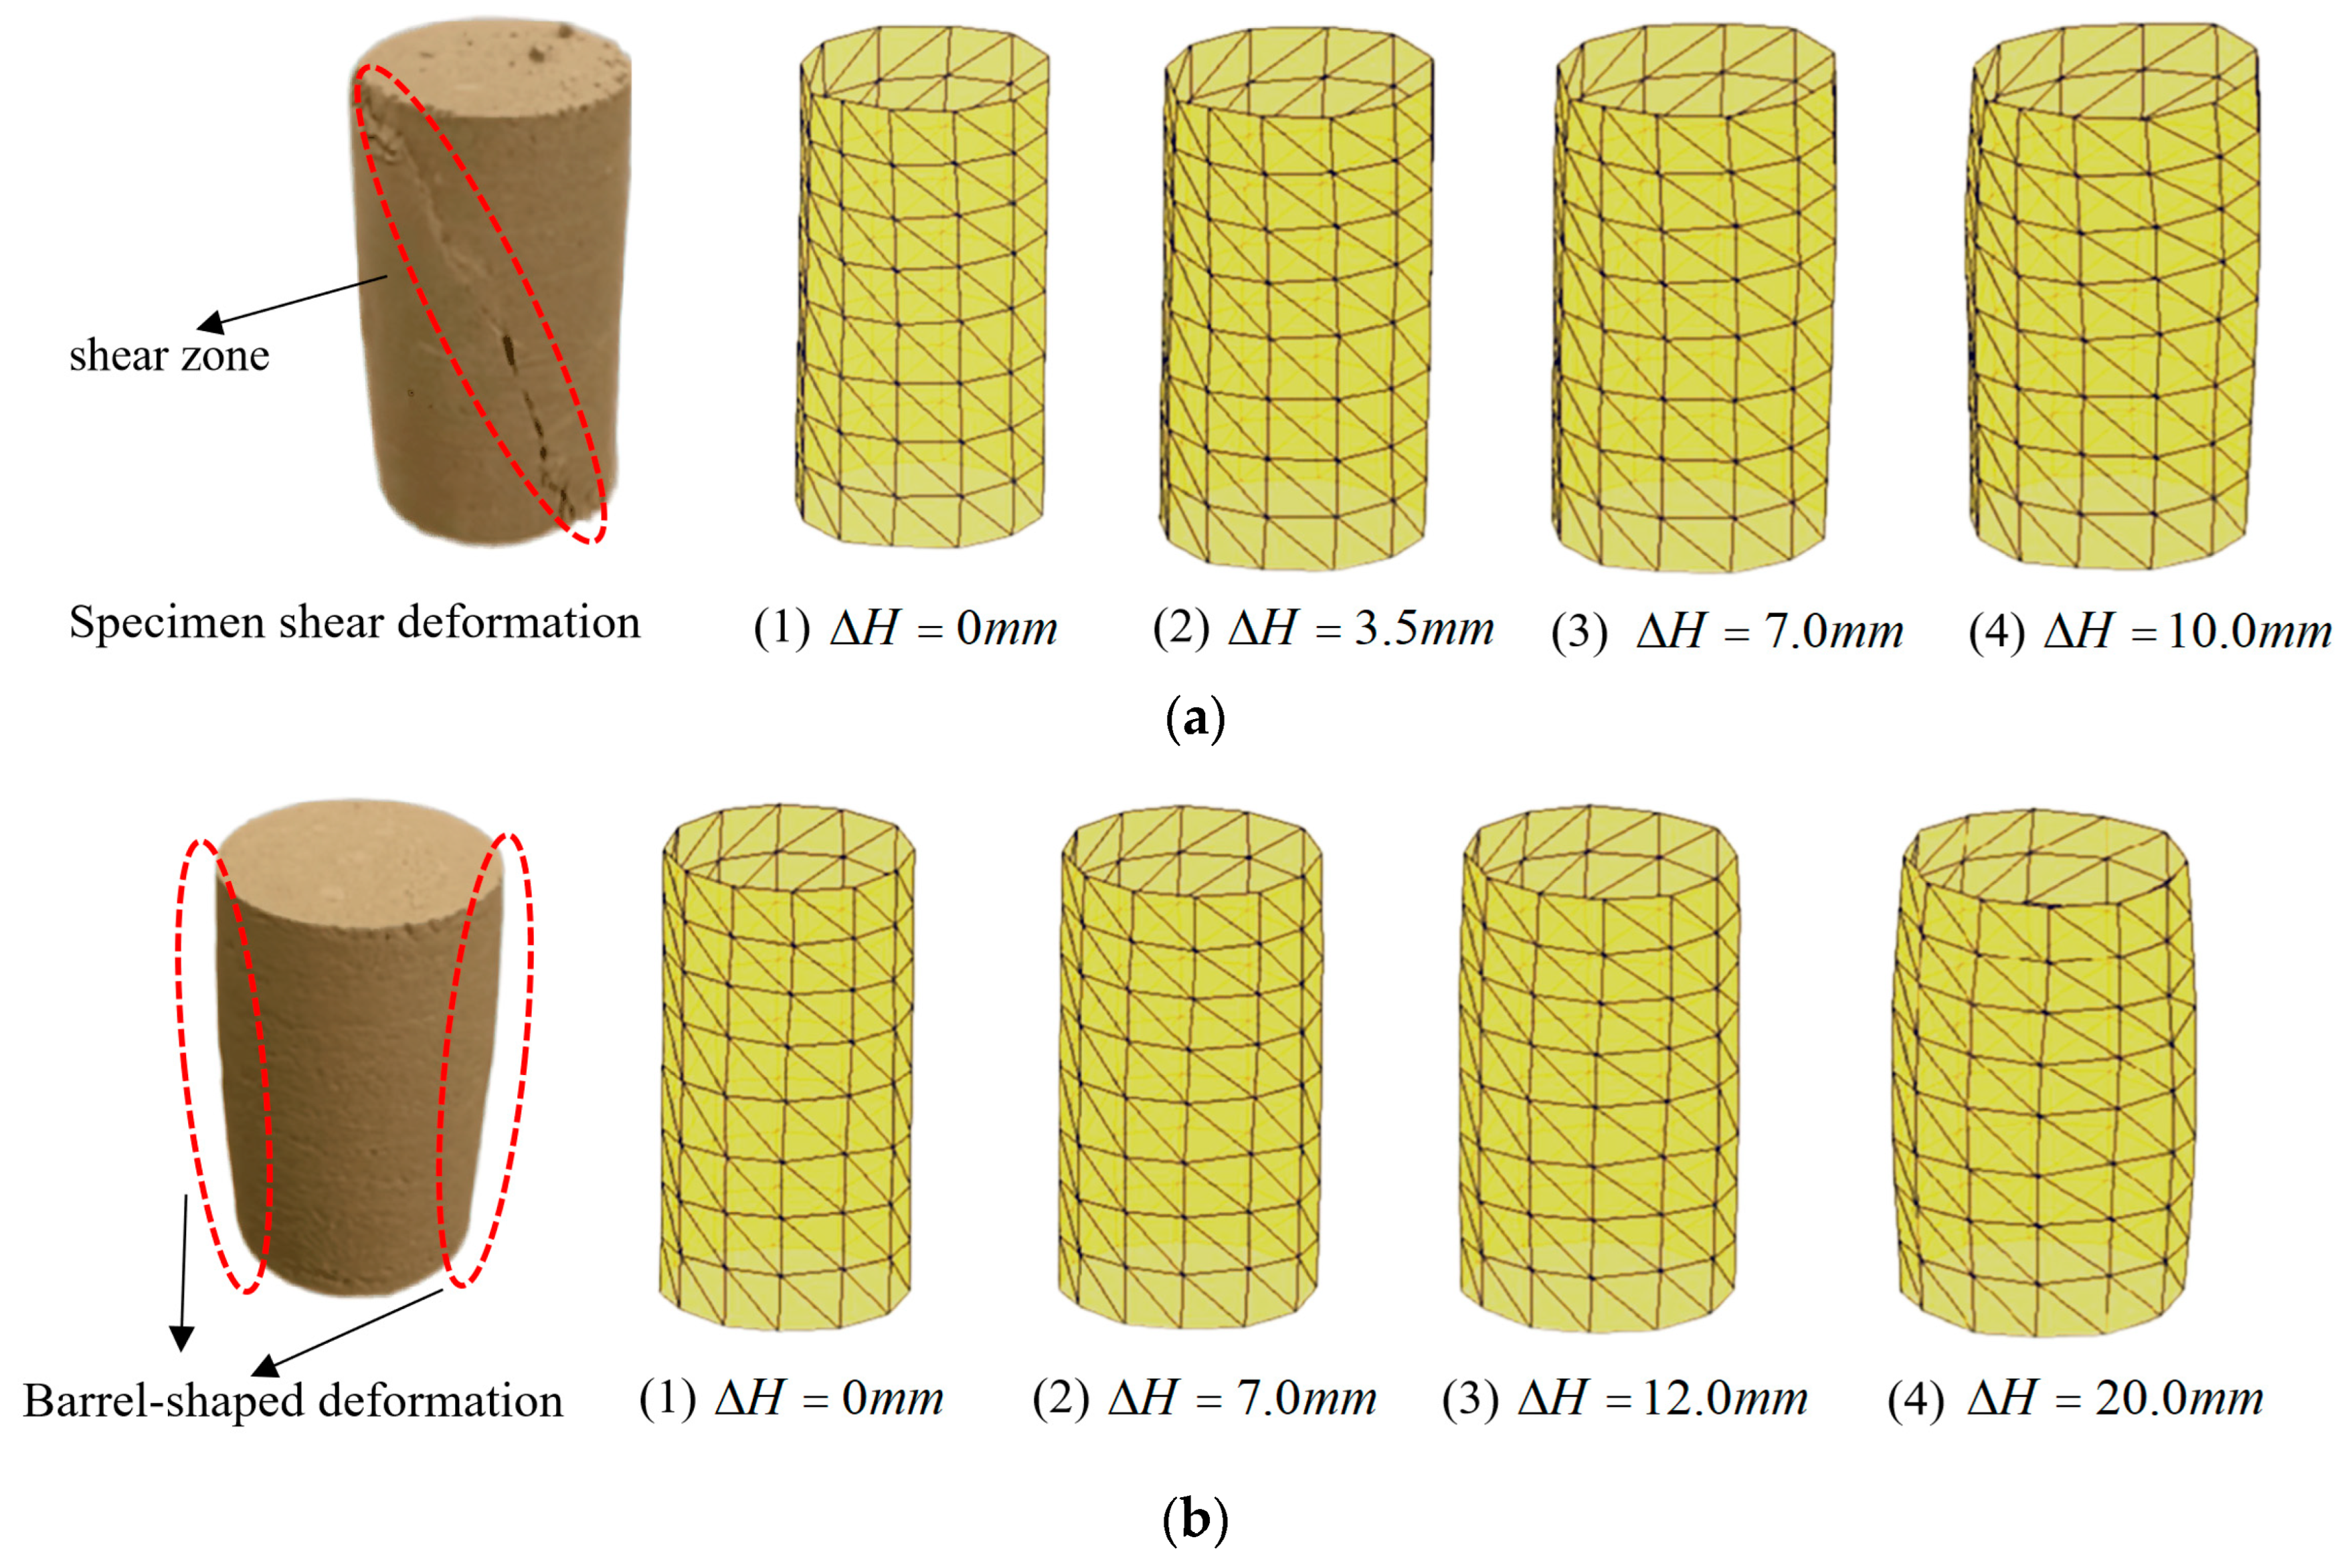
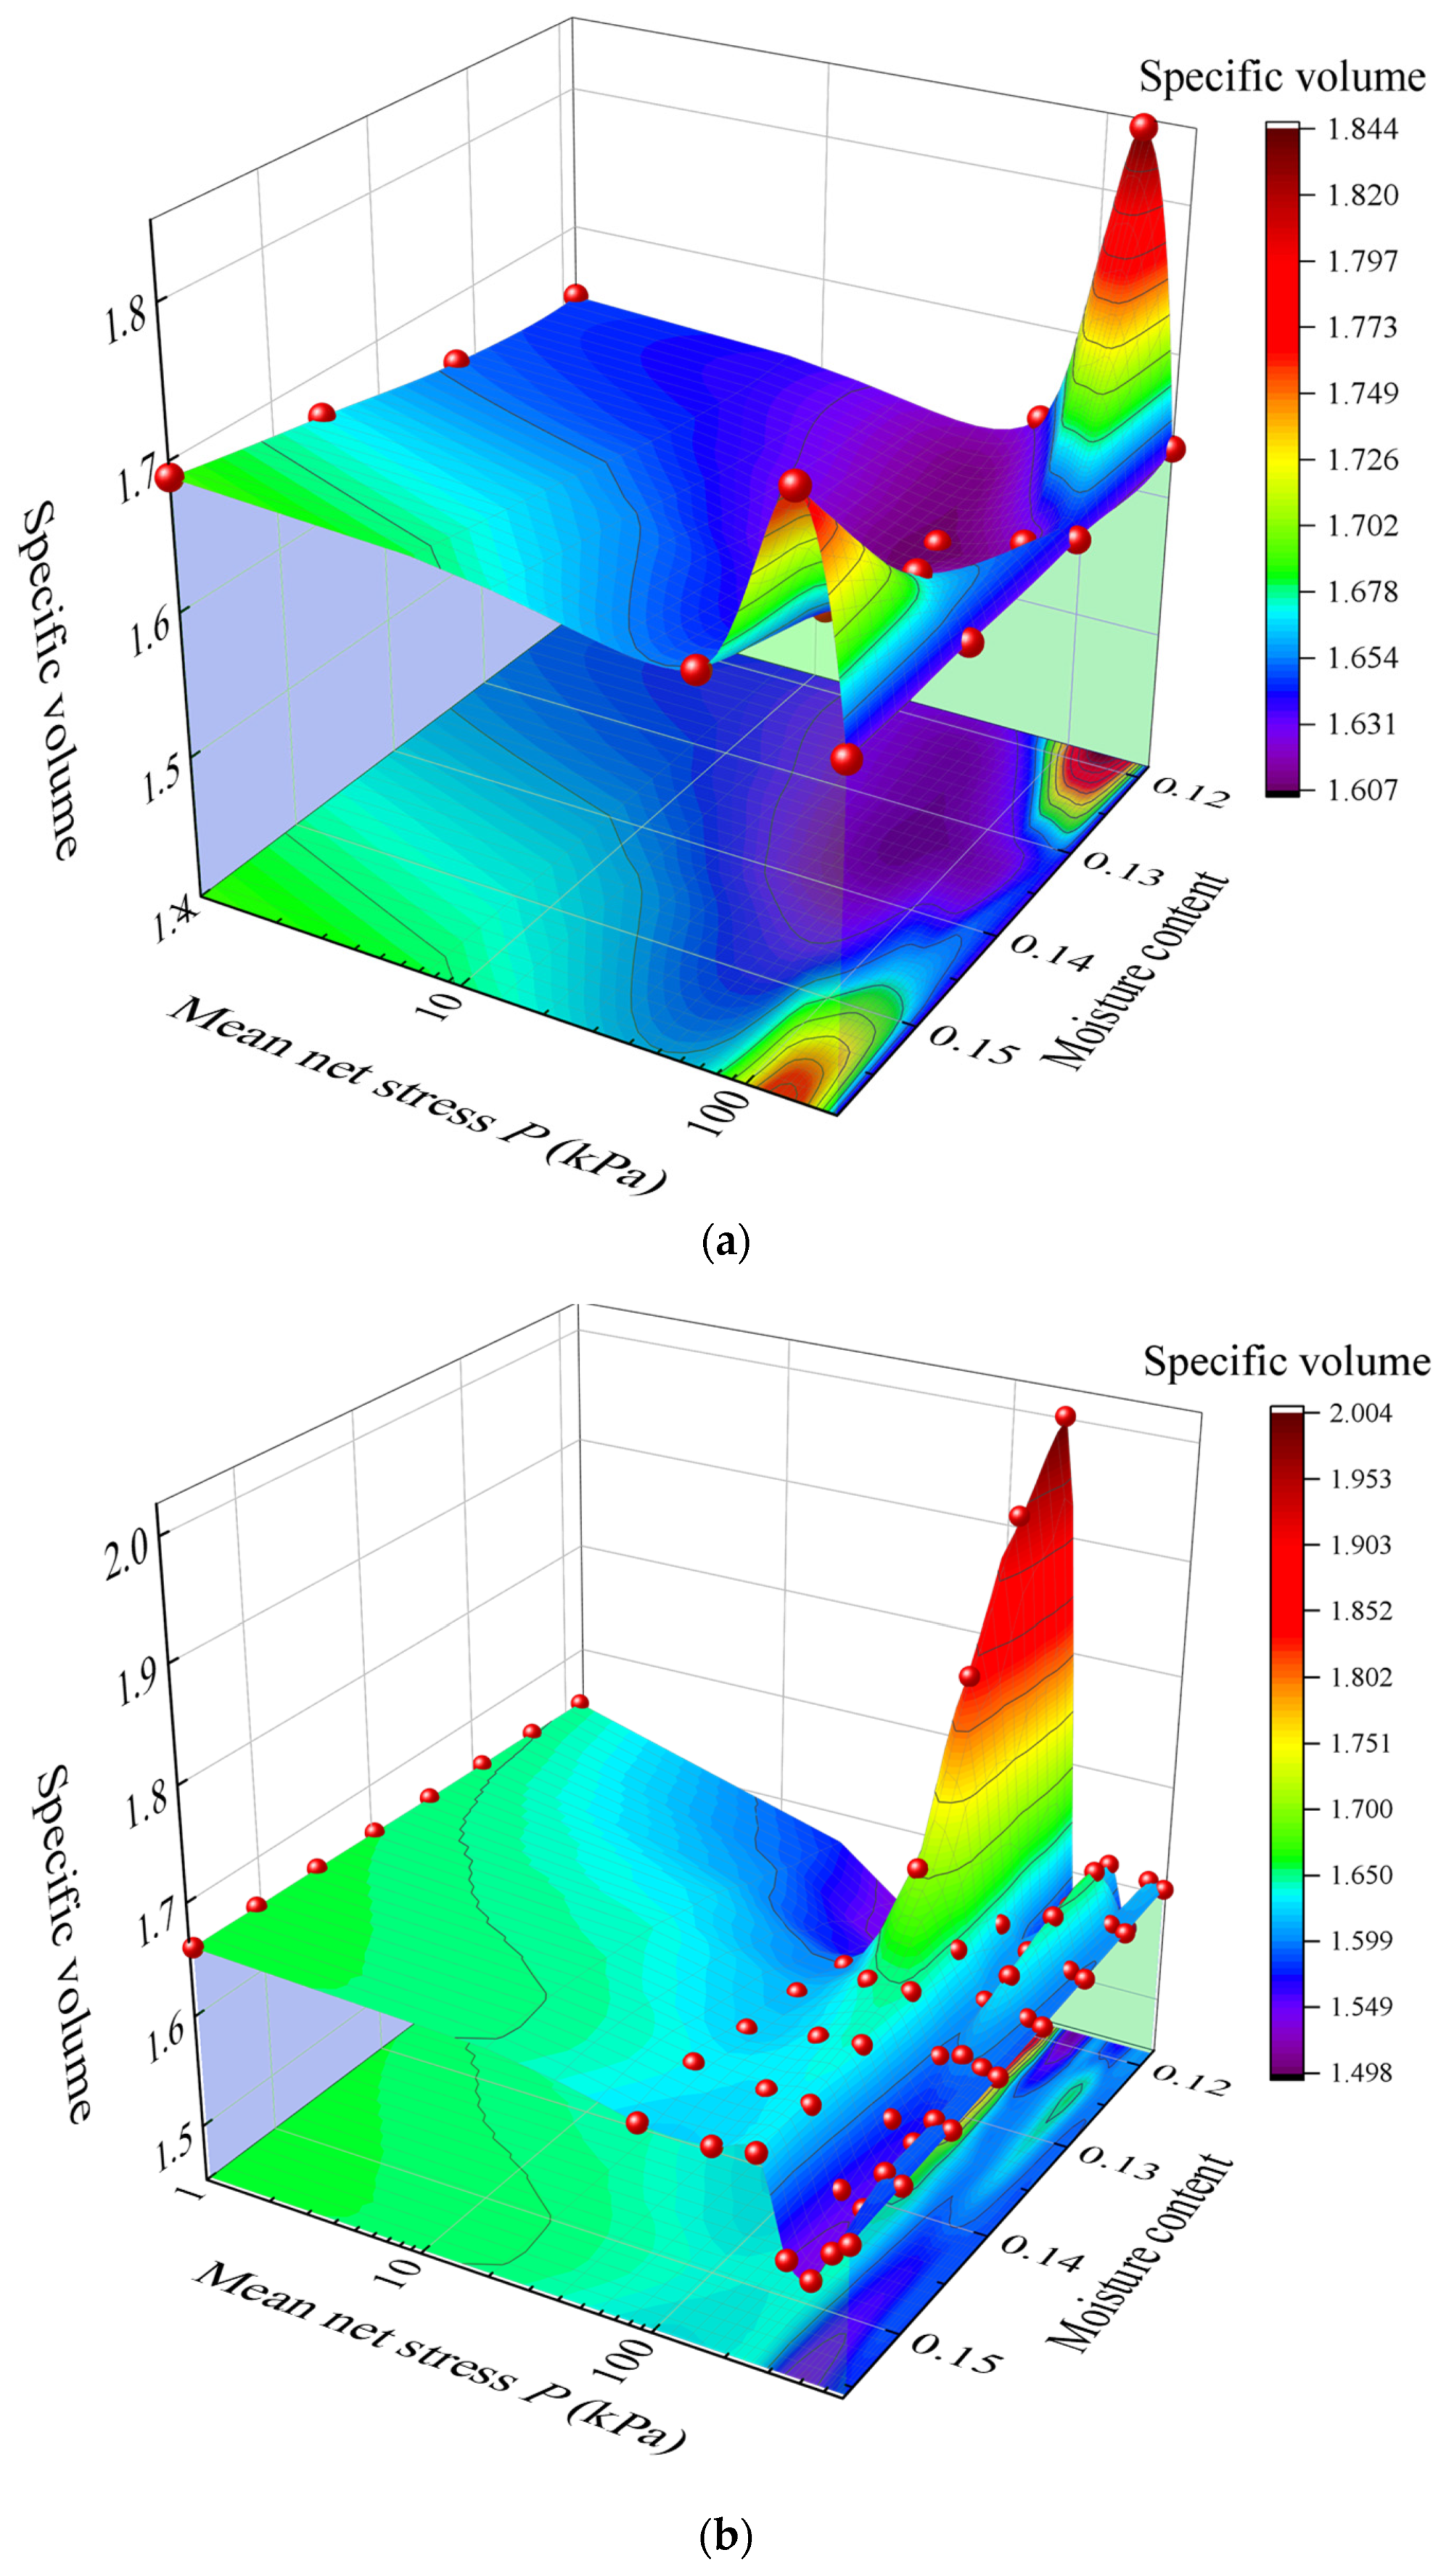
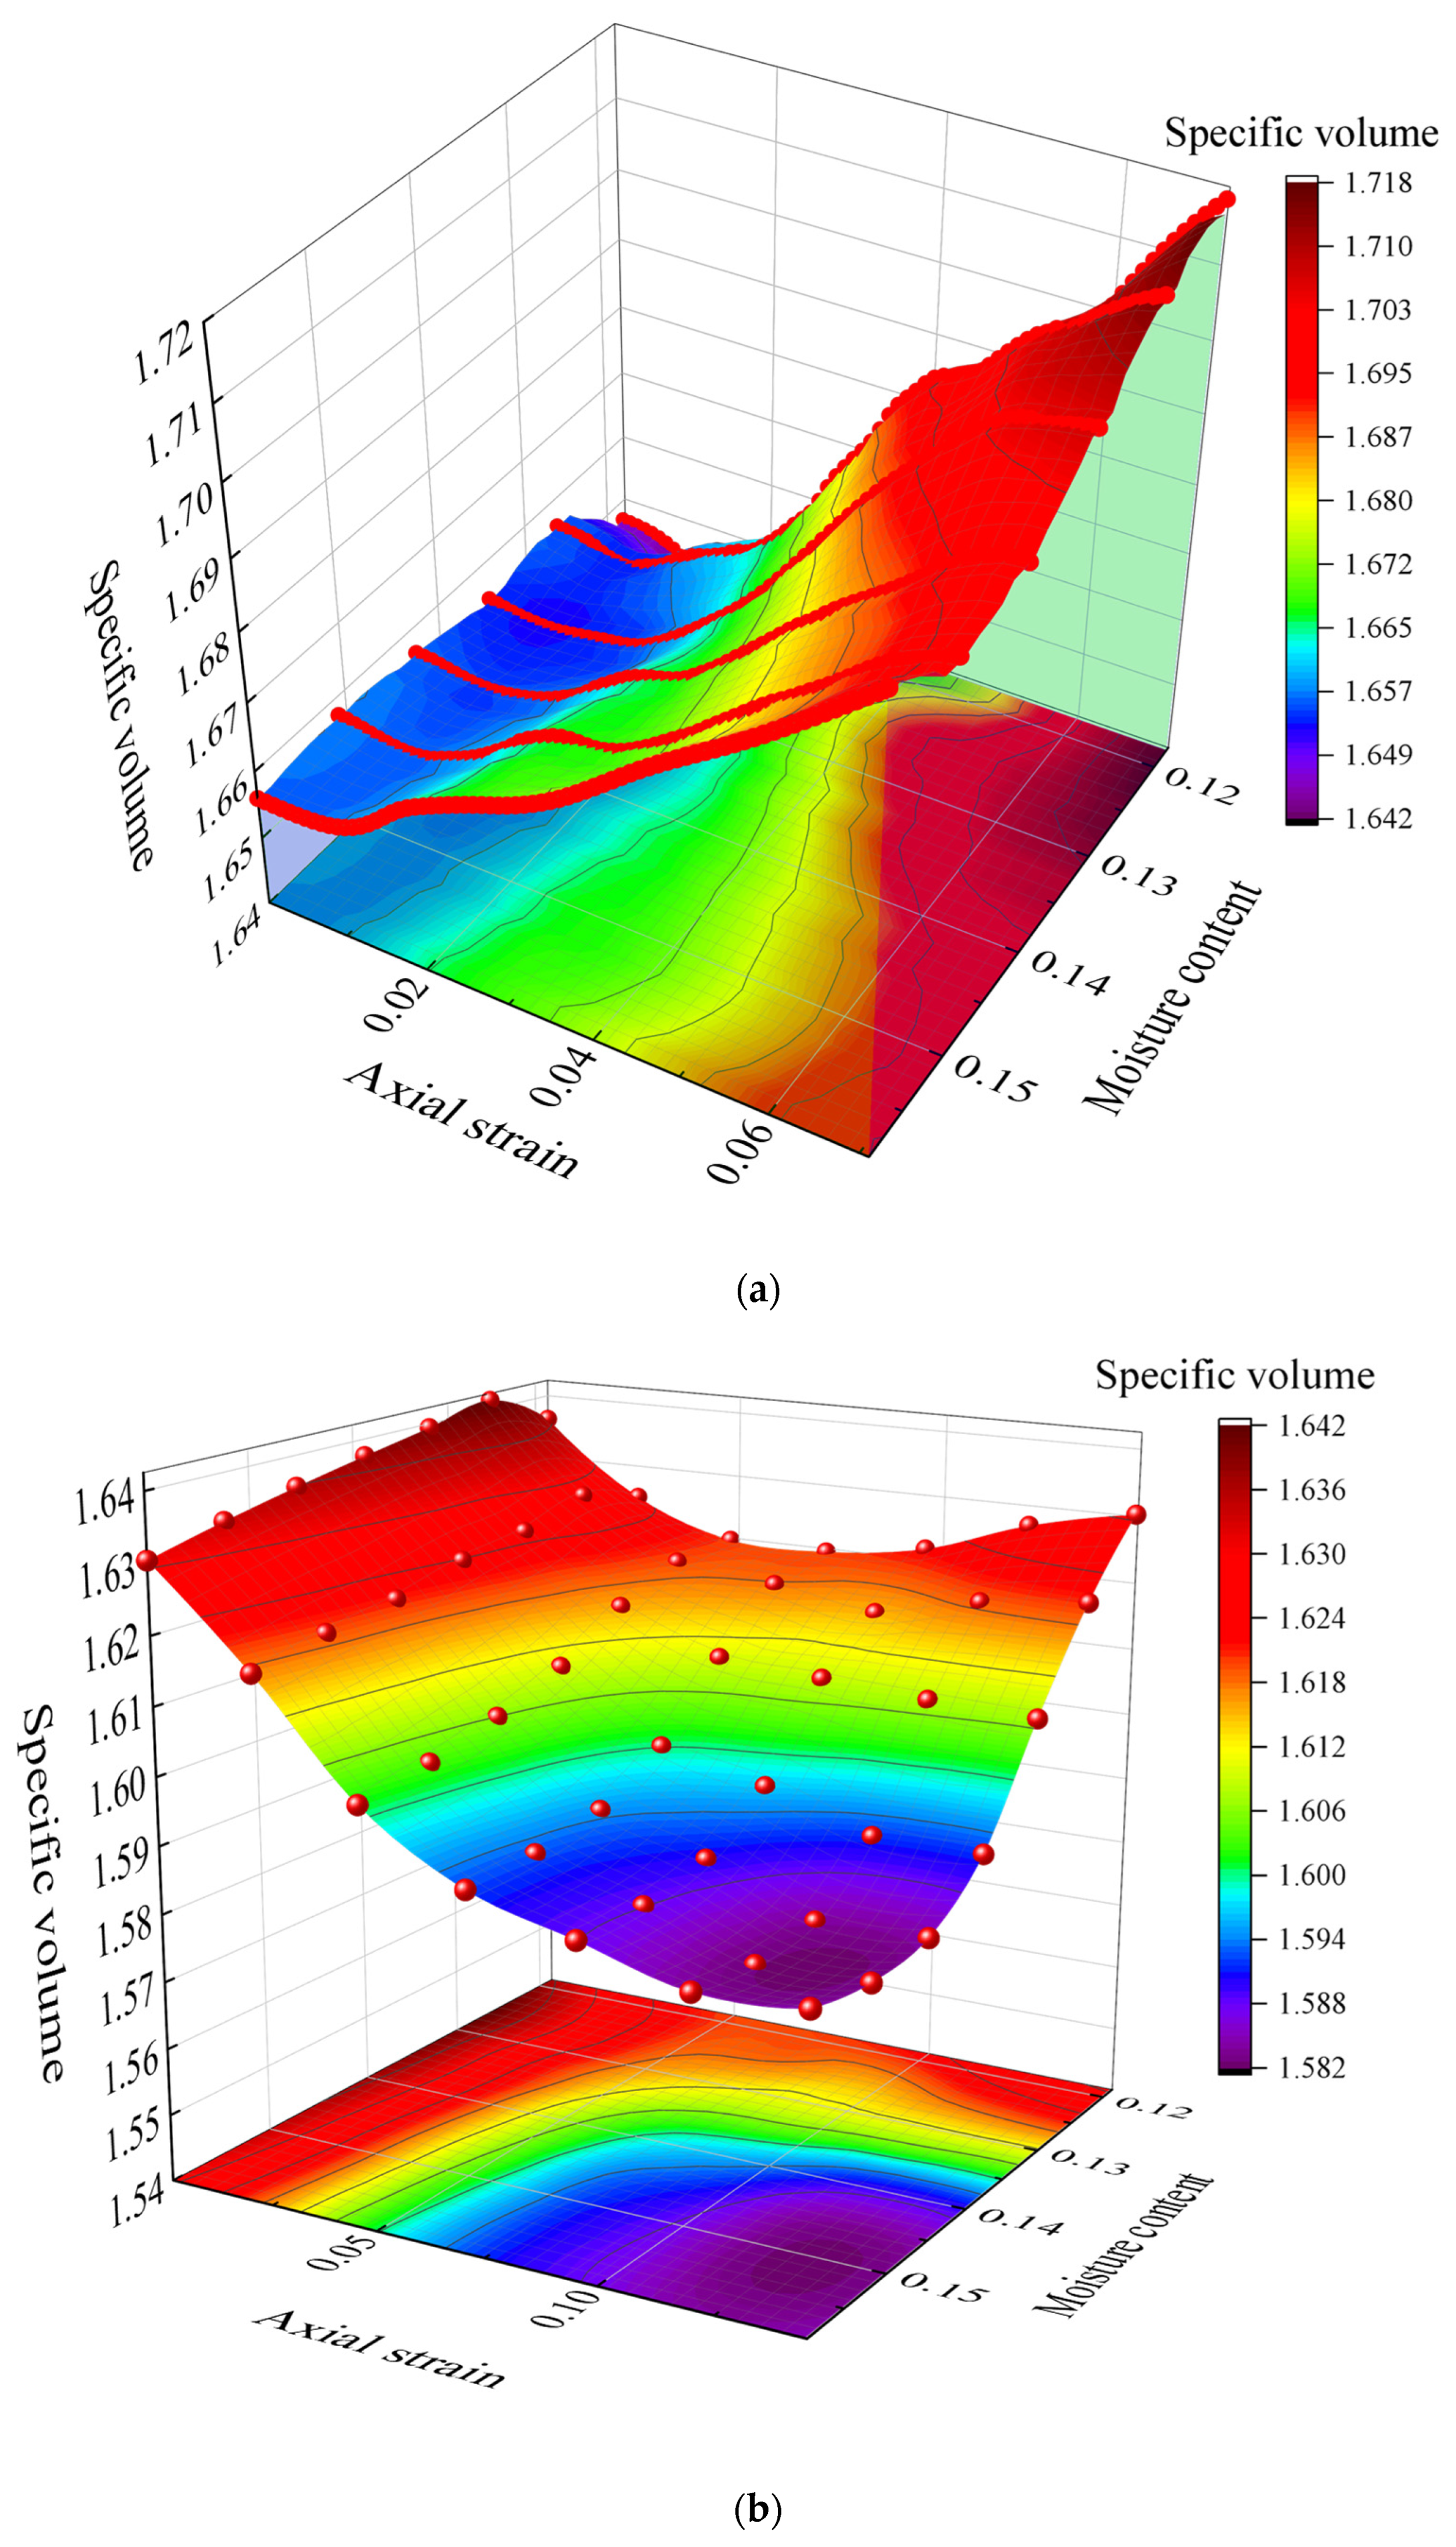
3.4.1. Sample Volume Change

The three-dimensional coordinates of 120 measurement targets on the sample surface were obtained by capturing images at various loading levels. A triangular mesh was then constructed by connecting adjacent points, reflecting the shape changes of the sample under different loading conditions. The deformation during the shear process was analyzed using sample 1 from Group 1 (moisture content: 15.89%) and sample 1 from Group 2 (moisture content: 15.90%), as shown in Figure 7. Figure 7a,b illustrate the deformation of the two samples under net confining pressures of 5 kPa and 200 kPa and at different axial displacements. As seen in Figure 7a, under a net confining pressure of 5 kPa, the sample largely maintained its cylindrical shape as the axial displacement reached 3.5 mm. As displacement increased, a distinct shear band formed, and the sample eventually failed under the applied deviatoric load. In contrast, Figure 7b shows that when samples with similar moisture contents were sheared under a 200 kPa net confining pressure, barrel-shaped deformation occurred without any observable failure surface as the axial displacement increased. At this stage, the diameter at the center of the sample was largest and tapered toward the ends. This deformation was caused by the friction between the soil and the loading platen, which restricted deformation at the ends. Additionally, the higher confining pressure effectively suppressed shear band formation. The experimental results are consistent with previous studies [11,41,42].
The volumes of the soil samples were measured under various loading conditions using the triangular mesh method. The total weight, moisture content, and soil density were measured, and the specific volume of each sample was subsequently calculated. Figure 8 illustrates the changes in the specific volume of samples from sets 2 and 3 under various isotropic pressures and moisture contents. The results indicate that as the moisture content of the samples increases, their initial specific volume also increases. At low moisture content, there is less water within the sample, resulting in greater friction between soil particles and a smaller specific volume. As moisture content increases, the lubricating effect of water reduces friction between particles, causing the sample to expand and the specific volume to increase. As shown in Figure 8a, when the total confining pressure is below 200 kPa, particularly below 50 kPa, the specific volume curve is flat, indicating that the sample’s deformation is limited and remains stable. As moisture content increases, the specific volume rises slightly, with smaller changes observed, especially at medium to low moisture contents. However, when the total confining pressure approaches 100 kPa, the steepness of the specific volume curve increases, indicating significant plastic deformation of the sample. Under high moisture content conditions, the lubricating effect of water reduces friction between soil particles, leading to a more pronounced increase in the specific volume. As shown in Figure 8b, compared to 200 kPa, the confining pressure of 600 kPa has a more pronounced impact on the specific volume. As confining pressure increases, especially under high moisture content, the specific volume of the sample increases significantly. At higher confining pressures, the sample undergoes more plastic deformation, with moisture reducing interaction between soil particles, making the sample more susceptible to large-scale deformation. Under 600 kPa confining pressure, the specific volume curve becomes steeper, and the plastic deformation of the sample is more pronounced. Under identical loading history conditions, samples with higher moisture content show a larger reduction in specific volume, especially under 600 kPa confining pressure, at which the lubricating effect of water causes significant deformation during loading. Compared to 200 kPa, the change in specific volume under 600 kPa is more pronounced, especially under higher moisture conditions, where the volume compression effect is more evident. In Figure 8b, the change in specific volume during unloading under 600 kPa confining pressure is similar to that during loading, with more noticeable changes observed under high moisture content conditions, indicating that moisture continuously affects the deformation recovery ability of the sample. As the moisture content increases, the elasticity of the sample decreases, indicating that moisture has a long-term impact on plastic deformation. The yield stress of each sample is determined using the Casagrande method for further analysis.
The specific volume changes of the samples from sets 1 and 2 during the shear process under 5 kPa and 200 kPa net confining pressures are shown in Figure 9a,b. Figure 9a shows that the samples exhibit similar trends under the lower confining pressure of 5 kPa. At approximately 1% axial strain, shear compression occurs in the sample. As the axial strain increases, the influence of moisture becomes evident, causing the sample to undergo shear expansion. This suggests that under low confining pressure, the strain of the samples is more flexible, and the influence of moisture on deformation is significant, leading to alternating expansion and compression during shear. Under the 5 kPa confining pressure, the sample predominantly experiences shear compression at low strains, with shear expansion occurring at higher strains. Figure 9b illustrates that under the higher net confining pressure of 200 kPa, the trend of specific volume change becomes more complex. When the initial moisture content exceeds 13.41%, the sample first undergoes shear compression as axial strain or deviatoric stress increases. Compared to the 5 kPa confining pressure, shear compression is more pronounced and persistent under higher pressures, especially when moisture content is elevated, where the effect of moisture leads to distinct shear compression characteristics at high strains. However, when the initial moisture content is below 13.41%, the sample exhibits different behavior, first undergoing shear compression and then experiencing shear expansion at higher strains. This indicates that at low moisture content, the deformation mode is more complex, with insufficient moisture causing shear compression at low strains, followed by a gradual transition to shear expansion as strain increases. In summary, moisture content significantly affects the specific volume change in unsaturated soil. Under 5 kPa confining pressure, the specific volume change is relatively gradual, and samples with higher moisture content are more prone to shear expansion. Under the higher 200 kPa confining pressure, samples with moisture content exceeding 13.41% exhibit more pronounced shear compression, while those with moisture content below 13.41% first undergo compression followed by expansion. Under higher confining pressure, the effect of moisture content on deformation becomes more complex, possibly due to the distribution of moisture within the sample and changes in pore pressure.
Figure 10 shows the fitted surface of deviatoric stress, axial strain, and moisture content for samples from sets 1 and 2, which were tested under 5 kPa and 200 kPa net confining pressures. In Figure 10a, under the lower confining pressure of 5 kPa, deviatoric stress increases significantly with axial strain, peaking at around 3% axial strain before decreasing, which indicates sample softening. As the moisture content increases, the peak deviatoric stress decreases slightly, and the sample shows varying degrees of softening during subsequent strain, potentially due to deformation and shear expansion under high moisture conditions and low confining pressures. As shown in Figure 10b, under the higher 200 kPa net confining pressure, deviatoric stress follows a different trend with increasing axial strain. For samples with initial moisture content below 13.42%, deviatoric stress initially increases and then slightly decreases, exhibiting shear compression and softening. Under high confining pressure, samples with lower moisture content show more pronounced shear compression. For samples with moisture content above 13.42%, deviatoric stress continuously increases with axial strain, demonstrating strong shear resistance with no noticeable softening, indicating that higher moisture content enhances shear strength and prevents softening. In general, under both 5 kPa and 200 kPa net confining pressures, shear strength increases as moisture content decreases. Low moisture content increases the sample’s suction, enhancing shear strength through the effect of confining pressure. Particularly under the higher 200 kPa confining pressure, samples with lower moisture content exhibit higher shear strength, while those with higher moisture content show lower shear strength, mainly due to stronger plastic deformation.

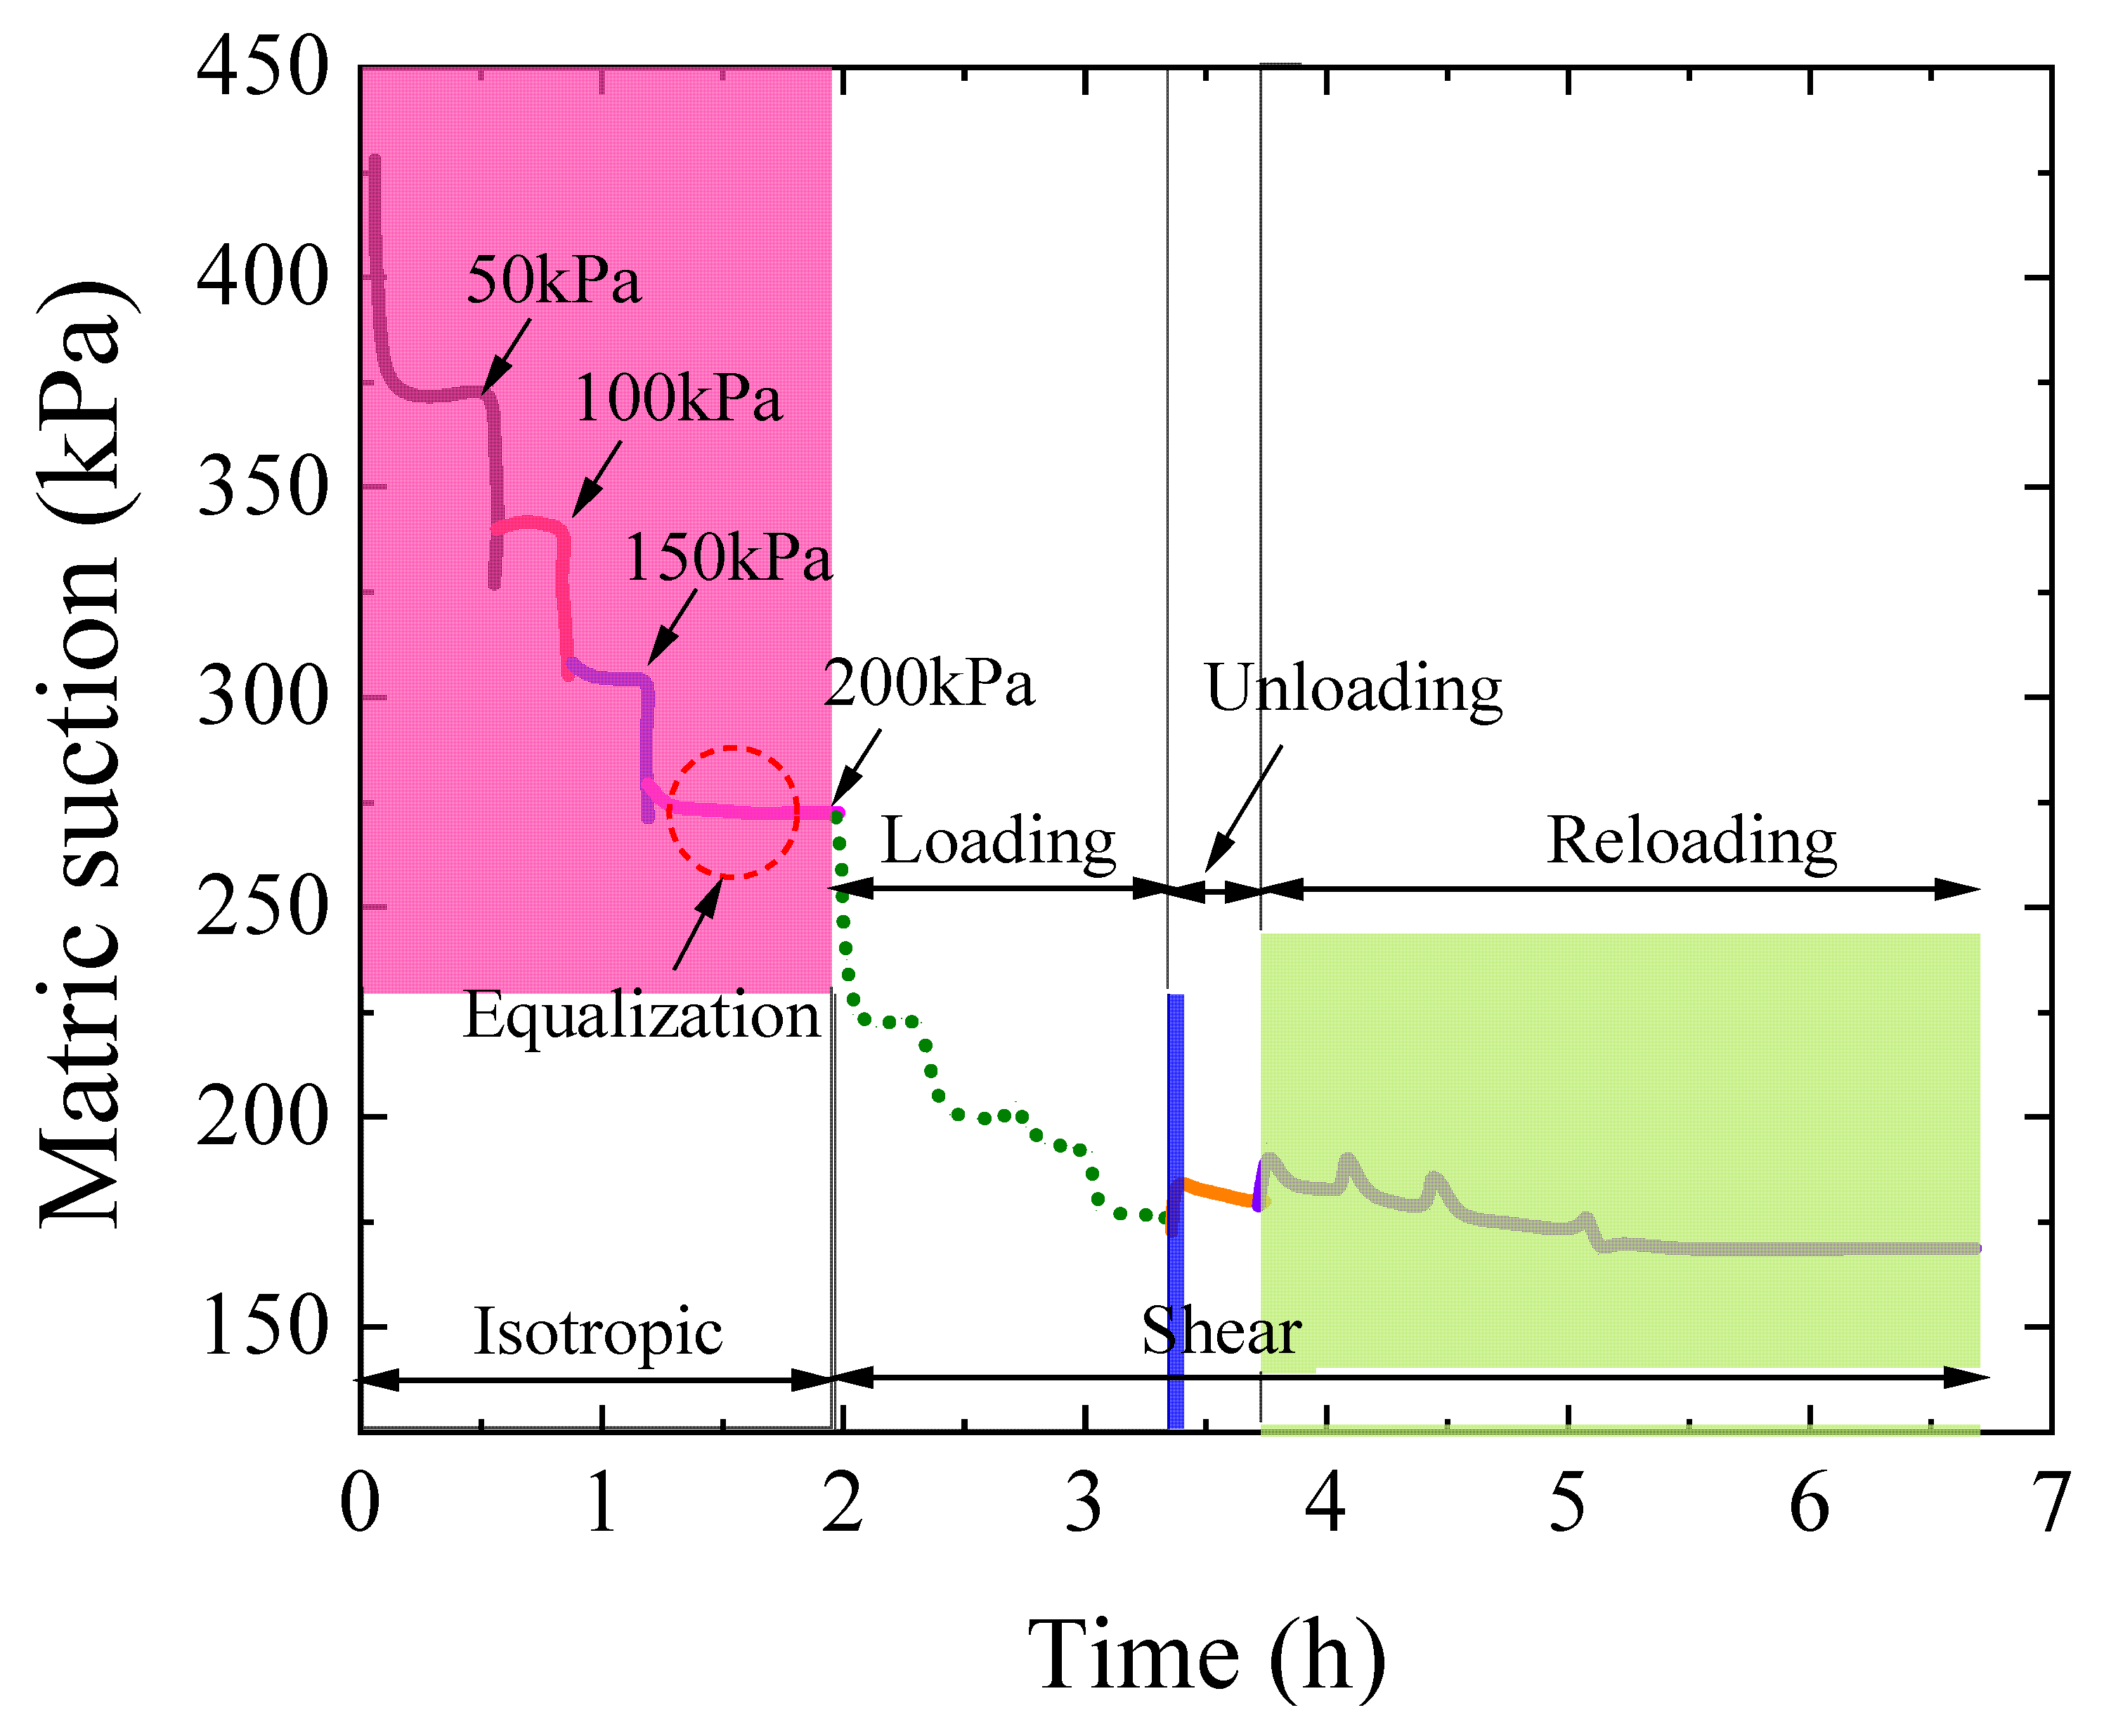
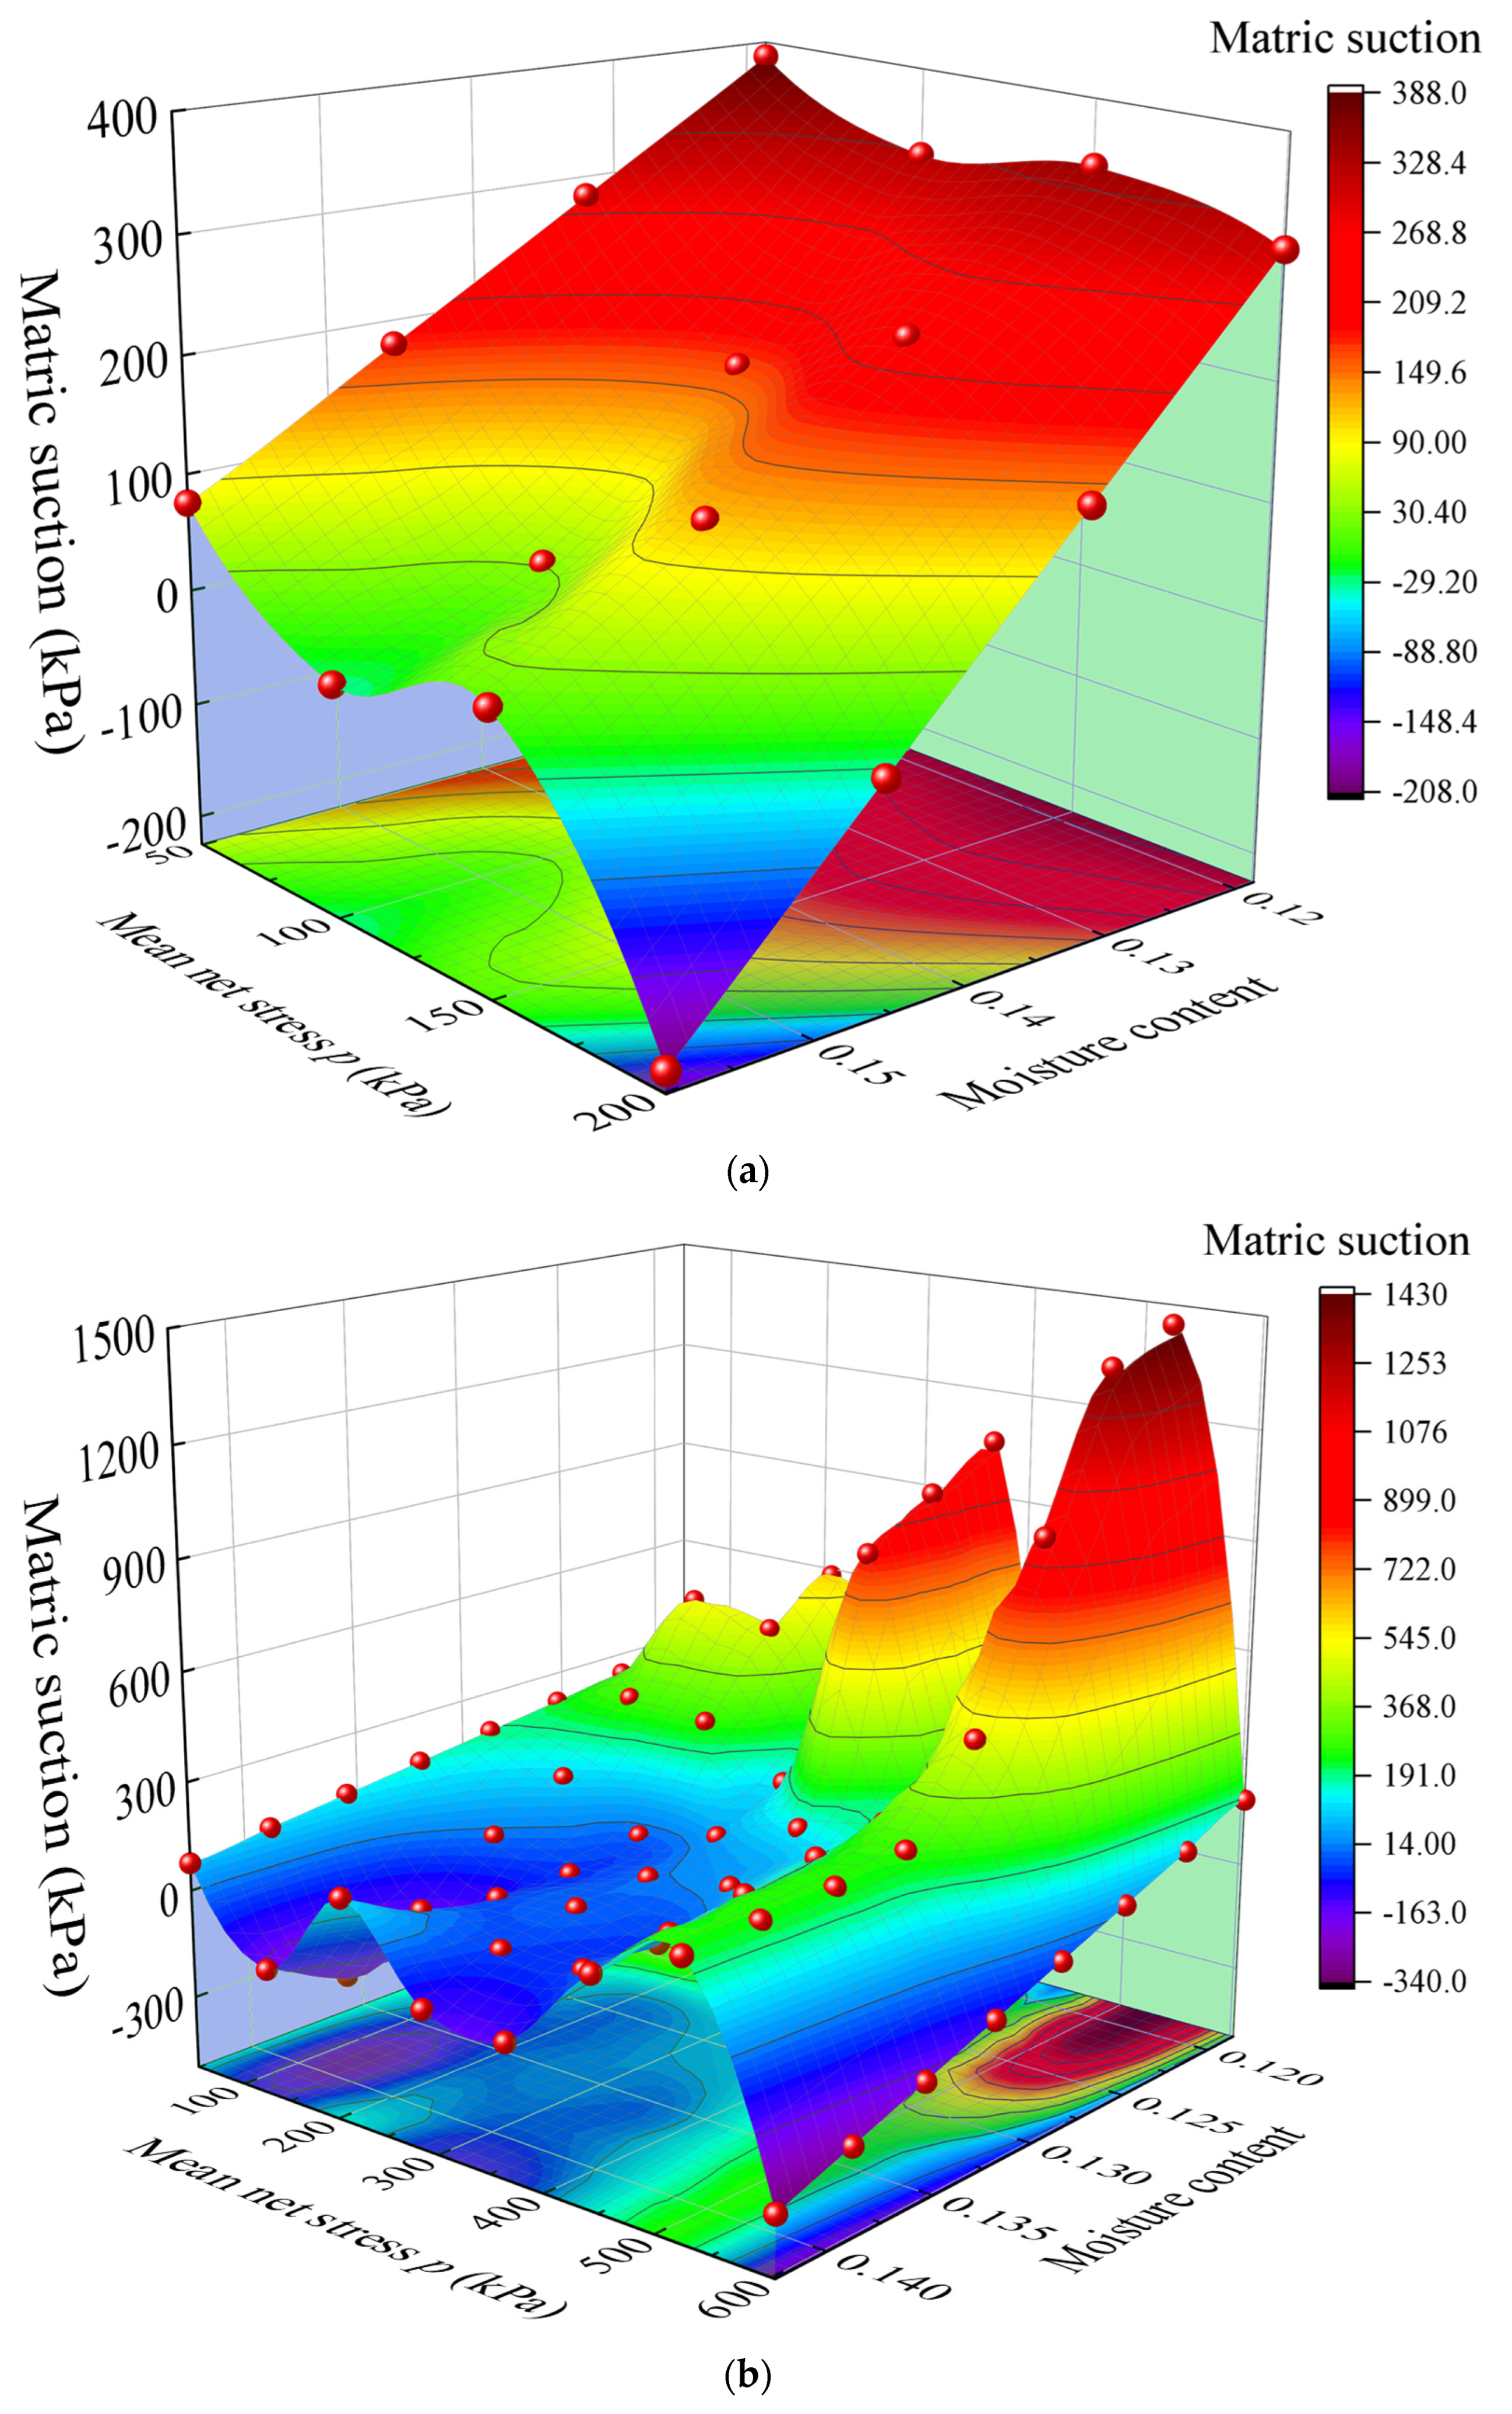
3.4.2. Analysis of Suction Variation

Figure 11 illustrates the suction response of the fourth sample from the second group during both the isotropic and shear loading processes. As the confining pressure increases, the suction decreases immediately, indicating that the pore water in the sample is influenced by the confining pressure, resulting in reduced suction during isotropic loading. Over time, suction gradually recovers and approaches equilibrium, which is consistent with trends observed in previous studies [33,43,44,45,46,47,48]. This suggests that suction variation in the sample under isotropic loading follows a regular pattern, where suction decreases and gradually recovers to equilibrium, reflecting adjustments in soil structure and water distribution. When a 200 kPa confining pressure is applied during triaxial shear, suction variation differs from that during isotropic loading. Initially, the applied deviatoric stress causes an immediate decrease in suction. Subsequently, under constant loading, suction continues to decrease slightly before eventually reaching equilibrium. Unlike isotropic loading, suction variation during triaxial shear is more complex, with a larger decrease in suction, likely due to soil deformation and pore water movement under deviatoric stress. As shear loading continues, the suction of the sample gradually stabilizes, indicating that the shear process has a more significant impact on soil moisture. During unloading, suction variation exhibits a clear rebound phenomenon. During initial unloading, suction increases rapidly, then gradually decreases, ultimately reaching a new equilibrium state. This process indicates that during unloading, the redistribution of water inside the sample temporarily increases suction. After unloading adjustment, suction gradually returns to equilibrium. Similar to the loading and shear processes, suction recovery after unloading also requires a certain amount of time, typically between 5 and 20 min, depending on the initial suction.
Suction in the equilibrium state is considered the representative value for each loading level. Figure 12a,b show the variation in suction of the samples from Set 2 and Set 3 during isotropic loading. Figure 12 shows that the suction of the samples decreases significantly as the isotropic load increases. This indicates that with increasing confining pressure during compression, the pore water pressure also increases, resulting in a decrease in suction. The magnitude of the suction decrease is closely related to the moisture content and initial suction of the samples. Samples with lower moisture content generally exhibit higher initial suction and experience a more significant decrease in suction during loading. As shown in Figure 12a, the fifth sample from Set 2 (w = 11.83%) and the sixth sample from Set 3 (w = 11.83%) have higher initial suction and display larger variations in suction under the same load. This suggests that samples with lower moisture content exhibit stronger capillary suction, which results in a more significant suction decrease during loading. In contrast, as the moisture content increases, the suction decrease becomes less pronounced, especially when the moisture content reaches 15.57%, at which point the suction variation stabilizes with almost no significant change. As shown in Figure 12b, irreversible suction changes occur during unloading under an average net stress of 300 kPa. With increasing moisture content, this irreversible suction change gradually decreases. Particularly at higher moisture contents, this change becomes almost imperceptible and is closely related to the stress history and moisture changes of the sample. Irreversible suction changes suggest that the microstructure of the sample undergoes irreversible changes during loading and unloading. Although the moisture contents of the two samples are nearly identical, slight differences in suction were observed under the same isotropic load. For example, under a 50 kPa load, the suction of samples with moisture contents of 11.84% and 11.83% was 418.2 kPa and 430.5 kPa, respectively. This difference could be attributed to the stress history of the samples, suggesting that even with nearly identical moisture contents, prior loading conditions and structural differences can influence suction measurements.
Figure 13a,b show the variation in suction of the samples from Set 1 and Set 2 under 5 kPa and 200 kPa net confining pressures during the triaxial shear test. Figure 13 shows that moisture content is a key factor influencing suction response. For samples with moisture content greater than 13.41%, as shown in Figure 13a, suction variation is minimal under different net confining pressures. This suggests that samples with higher moisture content exhibit more stable suction changes under triaxial shear stress and are less affected by net confining pressure. For samples with moisture content less than 13.41%, as shown in Figure 13b, suction gradually decreases throughout the test, especially in the early shear stage, where it drops rapidly before slightly rebounding. This suggests that samples with low moisture content are more sensitive to suction variation under deviatoric stress. The data in the figure also show that applied net confining pressure significantly affects soil suction variation. Specifically, for samples with low moisture content, higher applied net confining pressure leads to a more significant decrease in suction. This indicates that higher confining pressure compresses the pore water in the sample more easily, resulting in decreased suction. Therefore, as net confining pressure increases, the suction variation in the sample becomes more pronounced. Additionally, Figure 13b shows that failure occurs in Set 1 samples when the strain reaches 8%, limiting the axial strain to 8%. During shear testing, axial strain plays a critical role in soil stability. Higher axial strain indicates that the sample structure is more prone to damage, which is closely linked to suction variation. Particularly under high moisture content, the degree of structural damage is lower, further demonstrating the effect of moisture content on sample stability.

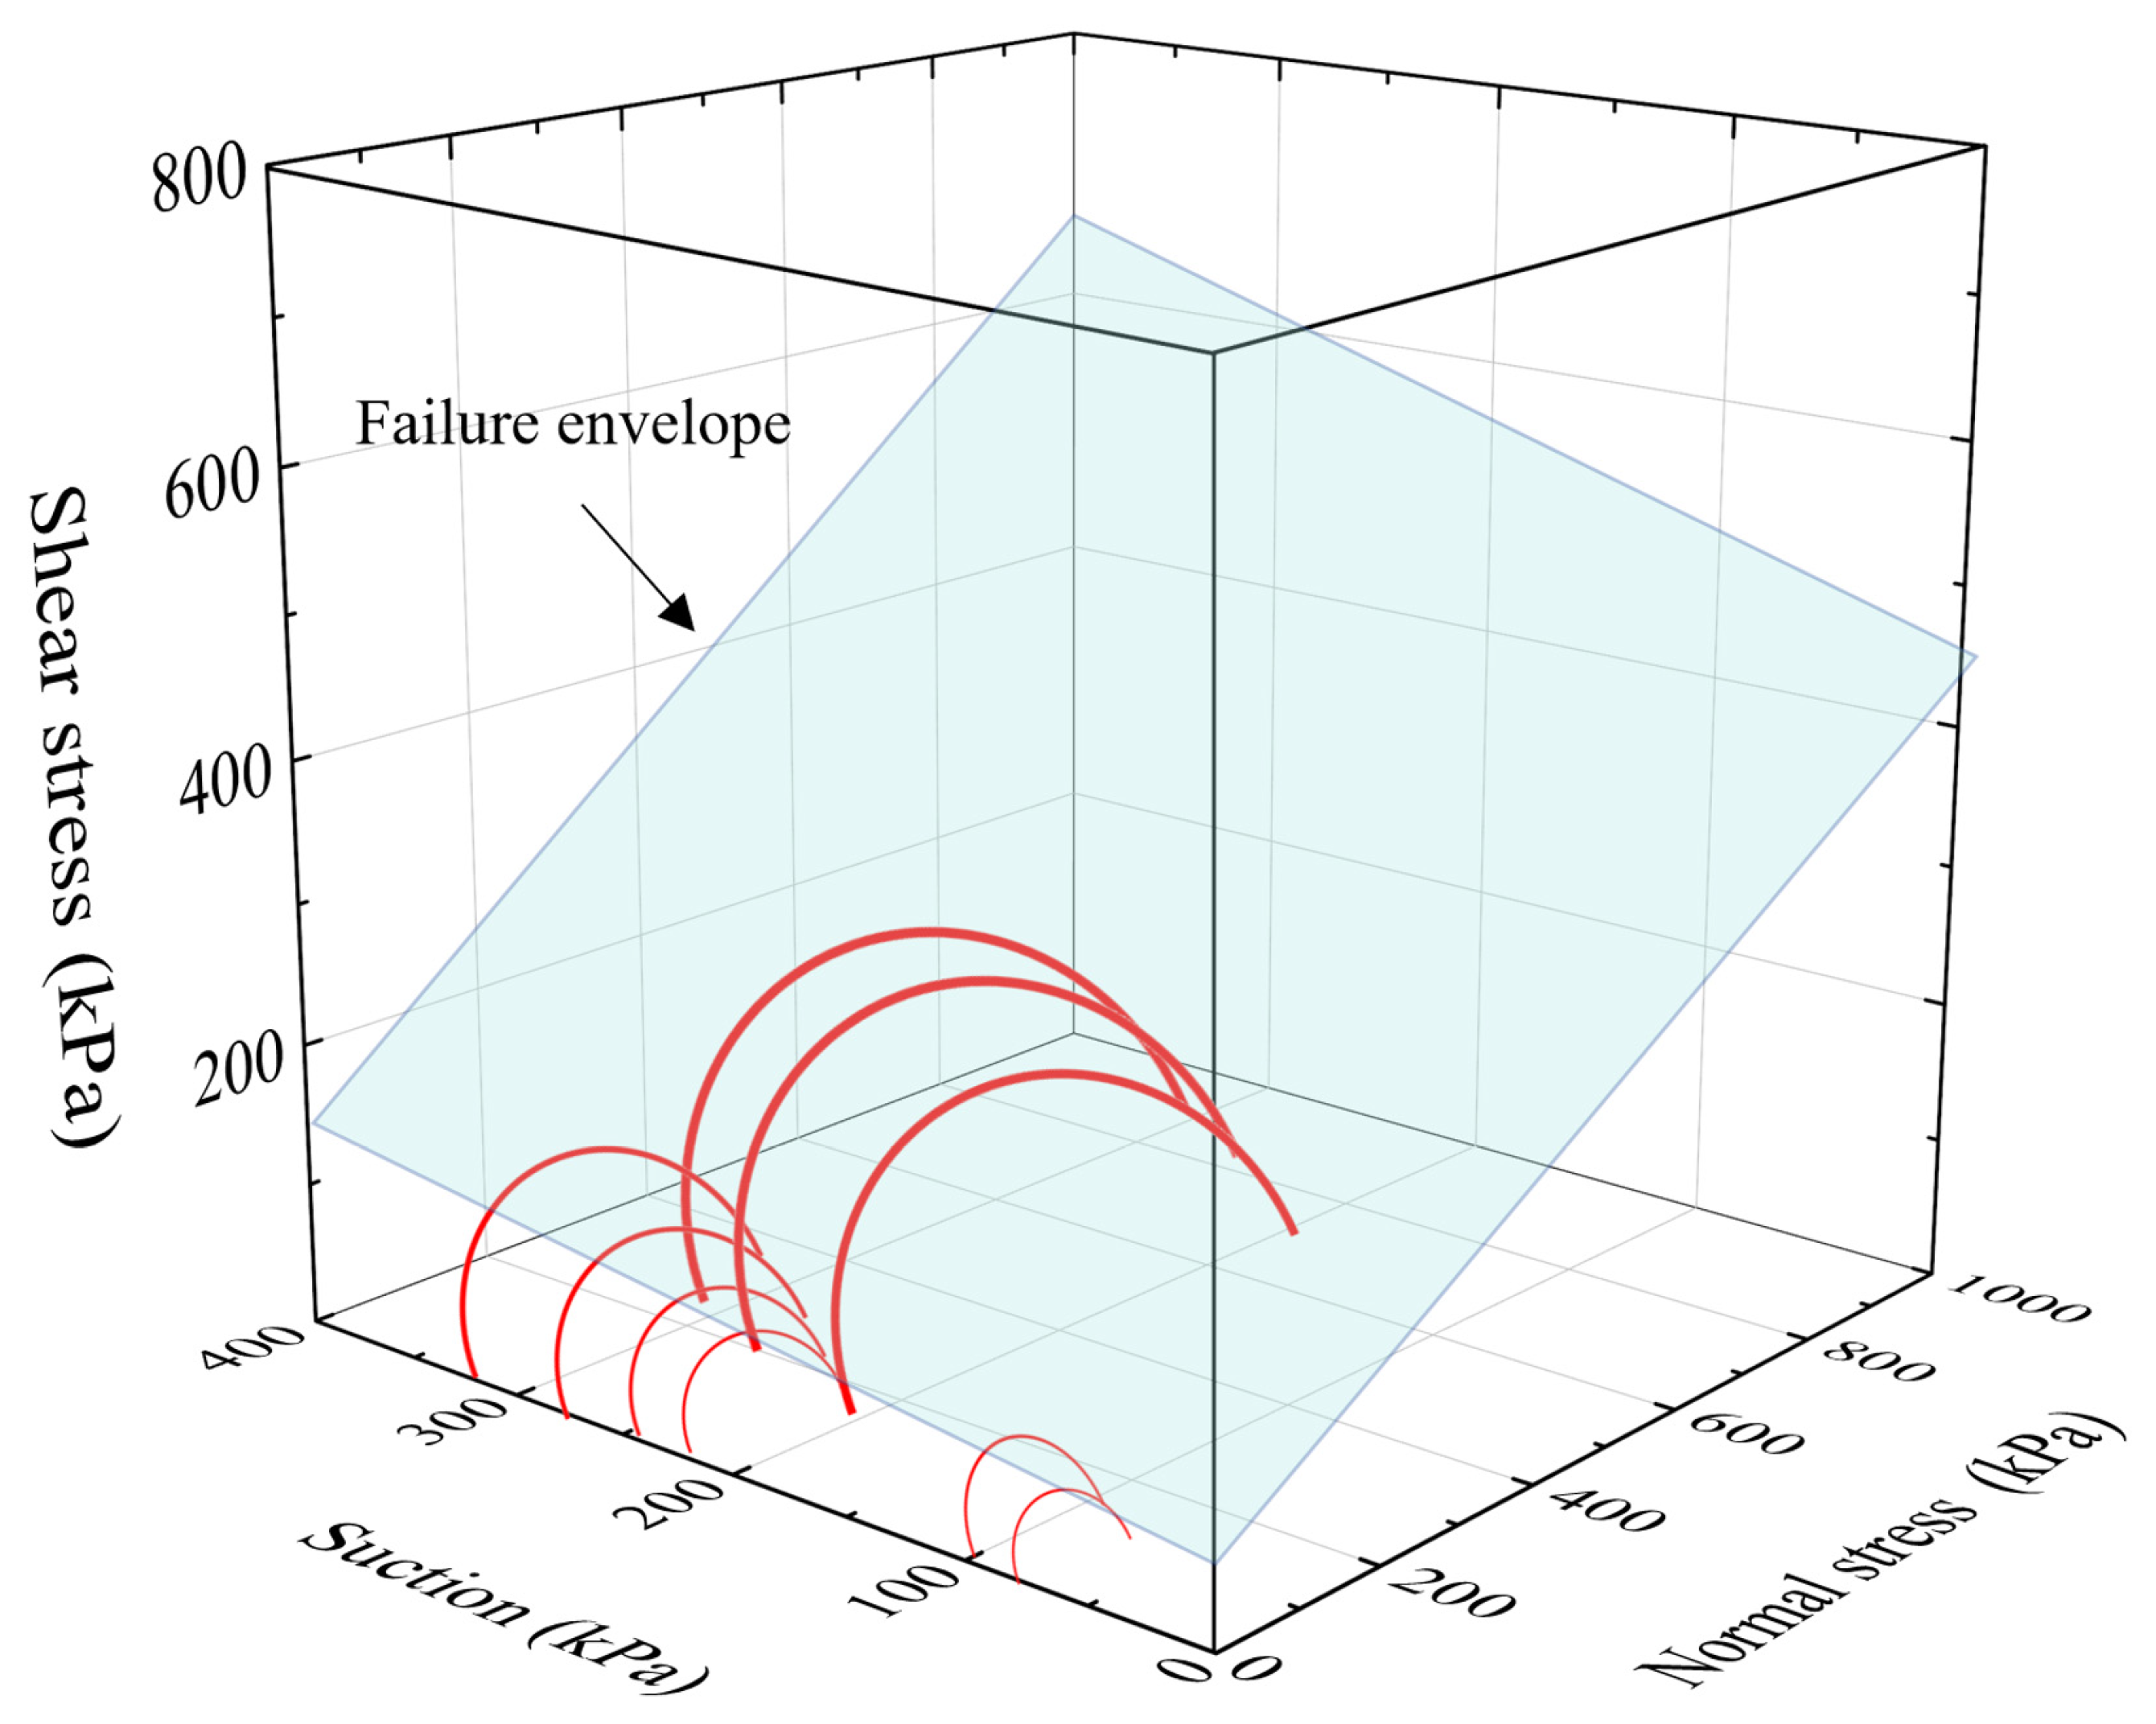
3.4.3. Analysis of Shear Strength

Recent studies have consistently suggested that the distance from the center of the Mohr circle to the failure point is commonly considered the radius of the Mohr circle, Rd [44,49,50,51].
R d = σ 1 d σ 3 d 2
However, due to the nonlinear mechanical behavior of unsaturated soils, discrepancies between experimental results and theoretical values, d0, exist.
d 0 = R d σ 1 d σ 3 d 2
Consequently, this study reformulates the determination of shear strength parameters as a least squares optimization issue, with the aim of minimizing the error between theoretical and experimental data through parameter optimization. The specific objective is to minimize the function G(X).
G X = i = 1 n d 0 2 = R d σ 1 d σ 3 d 2 2 = i = 1 n c 0 + σ 1 d + σ 3 d 2 u a tan φ 0 + s d tan φ b tan φ 0 2 + tan φ b 2 + 1 σ 1 d + σ 3 d 2
Here, C0 is cohesive strength under saturated conditions, σ 1 d is the maximum principal stress under shear failure conditions, σ 3 d is the minimum principal stress under shear failure conditions, ua is the pore air pressure, φ 0 is the frictional angle under saturated conditions, and φ b is the angle that indicates how shear strength changes in response to variations in matric suction.
Substituting the data from Table 4 into Equation (3) yields the best fit, with C0, φ 0 , and φ b values of 18.74 kPa, 30.2°, and 14.09°, respectively. The coefficient of determination, R², of the regression equation is 0.98, with a standard deviation of 2.88 kPa, indicating a strong correlation between the independent variables (C0, φ 0 , and φ b ) and the dependent variables (sd, σ 1 d u a , and σ 3 d u a ). Figure 14 illustrates the Mohr–Coulomb circles and the failure envelope at the shear failure point. The predicted results closely align with the experimental stress range, demonstrating an ideal fit.

3.4.4. Analysis of Constitutive Behavior

The Barcelona basic model (BBM) is one of the earliest and most widely used constitutive models for unsaturated soils. It accurately describes the mechanical behavior of soils at different moisture contents and the impact of moisture changes on the stress–strain relationship. In recent years, many scholars have calibrated the parameters of this model using triaxial test data from samples with varying moisture contents [52,53,54,55]. The BBM model parameters were calibrated using the third (of three) sampling set of triaxial test data (the specific coefficients are presented in Table 5), and then we directly compared the experimental values to the theoretical model predictions in the three-dimensional space of mean net stress, suction, and specific volume, as illustrated in Figure 15a. The yield curve of the sample was plotted, as shown in Figure 15b. Figure 15a shows high consistency between the experimental and predicted values. The trend of specific volume variation remains consistent across different mean net stress levels, with a small gap between the experimental and predicted values. For instance, at a mean net stress of 200 kPa, the experimental specific volume is 1.63, while the predicted value is 1.62, resulting in a small difference of only 0.61%, indicating that the model can accurately predict the specific volume. However, in some regions, such as at a stress of 400 kPa, the difference between the predicted and experimental values is about 12.57%, while at lower stress levels, such as 100 kPa, the difference is 11.83%. This trend indicates that as stress increases, the prediction error of the model also increases, particularly in regions of higher suction. This suggests that the BBM model demonstrates good predictive accuracy in the medium–low stress range, but its predictive ability may be limited under high stress or high suction conditions. In regions of higher suction, the variation in specific volume is more pronounced, especially in the low stress range, where the experimental values show more significant changes. In contrast, the predicted values of the theoretical model show smoother changes in this region, suggesting that the model may not fully capture the subtle variations of the sample under low stress and high suction conditions. In conclusion, the theoretical model proposed in this study effectively simulates the mechanical behavior of unsaturated soils, particularly in the medium–low stress range. However, as stress and suction increase, the predictive accuracy of the model decreases. Future research should consider incorporating additional soil properties or more complex nonlinear behaviors to enhance predictive capabilities under high-stress conditions.
Figure 15b shows the yield behavior curves for six different stress paths, where each curve corresponds to a specific path, and the solid circles on each path represent the yield points. As the mean net stress increases, the yield curve shifts upward, indicating that the yield suction of the sample increases with the increasing mean net stress, a trend observed across all stress paths. However, differences exist in the slopes and shapes of the yield curves across different paths. For instance, the yield curves for stress paths 1 and 2 are steeper, indicating that the sample is more sensitive to net stress along these paths, especially at 200 kPa, where the yield suction for stress path 1 approaches 400 kPa, and the yield suction for stress path 2 is slightly lower. In contrast, the yield curves for stress paths 5 and 6 are relatively flat, suggesting that the yield suction of the sample varies less along these paths. Notably, most of the yield curves in the figure exhibit a relatively flat slope in the initial stage, and as net stress increases, the curves gradually become steeper, indicating that in high-stress regions, the sample’s yield behavior becomes more sensitive to net stress. For instance, the yield points for stress paths 5 and 6 are nearing saturation around 300 kPa, and in high-stress regions, the increase in yield points gradually slows. This indicates that the yield behavior of unsaturated soils is influenced not only by stress paths but also by stress history, which plays a major role in the yield behavior of the soil. The yield point positions also exhibit clear differences in distribution, as the yield point positions for stress paths 1 and 2 are mostly in the high suction region, while stress path 6 has yield point locations in the lower suction region. In addition, the distribution of yield point positions clearly differs due to the varying effects of the different stress paths on yield behavior, which may be attributed to stress history and loading path. BBM model parameter calibration typically relies on suction-controlled tests, with each sample’s calibration process requiring 1–2 months, making it both cumbersome and costly. In comparison, the 3D settlement and consolidation system developed in this study significantly reduces the calibration time to 6 h, greatly enhancing experimental efficiency. This system not only reduces the experimental cycle but also shows clear advantages in terms of ease of operation, accuracy control, and data acquisition, offering a more efficient and economical solution for rapid BBM model calibration.

4. Conclusions

Based on the experimental data and analysis of the triaxial testing system developed in this study, the following key findings and conclusions are drawn:
(1)
The triaxial testing system developed in this study integrates high-suction tensiometer technology with digital image correlation (DIC), enabling the precise 3D reconstruction of sample models through non-contact photogrammetry. It effectively monitors the volume and suction changes of unsaturated subgrade fill samples. Compared with typical methods, which require several days to 24 h for the complete experiment, this system has reduced the experimental time by reducing the total test time to 6 h. This time reduction was achieved without compromising measurement accuracy, as demonstrated by side-by-side direct documentation using the same observation and validation methods as traditional studies. The time reduction represents a notable improvement in the testing process’s efficiency.
(2)
As the moisture content increases, the specific volume of the sample gradually increases. When the confining pressure is below 200 kPa, particularly at 50 kPa, the changes in specific volume are smaller, with limited deformation, and the changes remain relatively minor at medium and low moisture content. As the confining pressure approaches 100 kPa, the specific volume curve steepens, and the sample undergoes significant plastic deformation. Under a confining pressure of 600 kPa, the effect of moisture becomes more pronounced, and the specific volume increases substantially, especially under high moisture content conditions, with more noticeable deformation. At low moisture content, the sample exhibits shear compression, whereas under high moisture conditions, the lubricating effect of water reduces particle friction, leading to shear expansion.
(3)
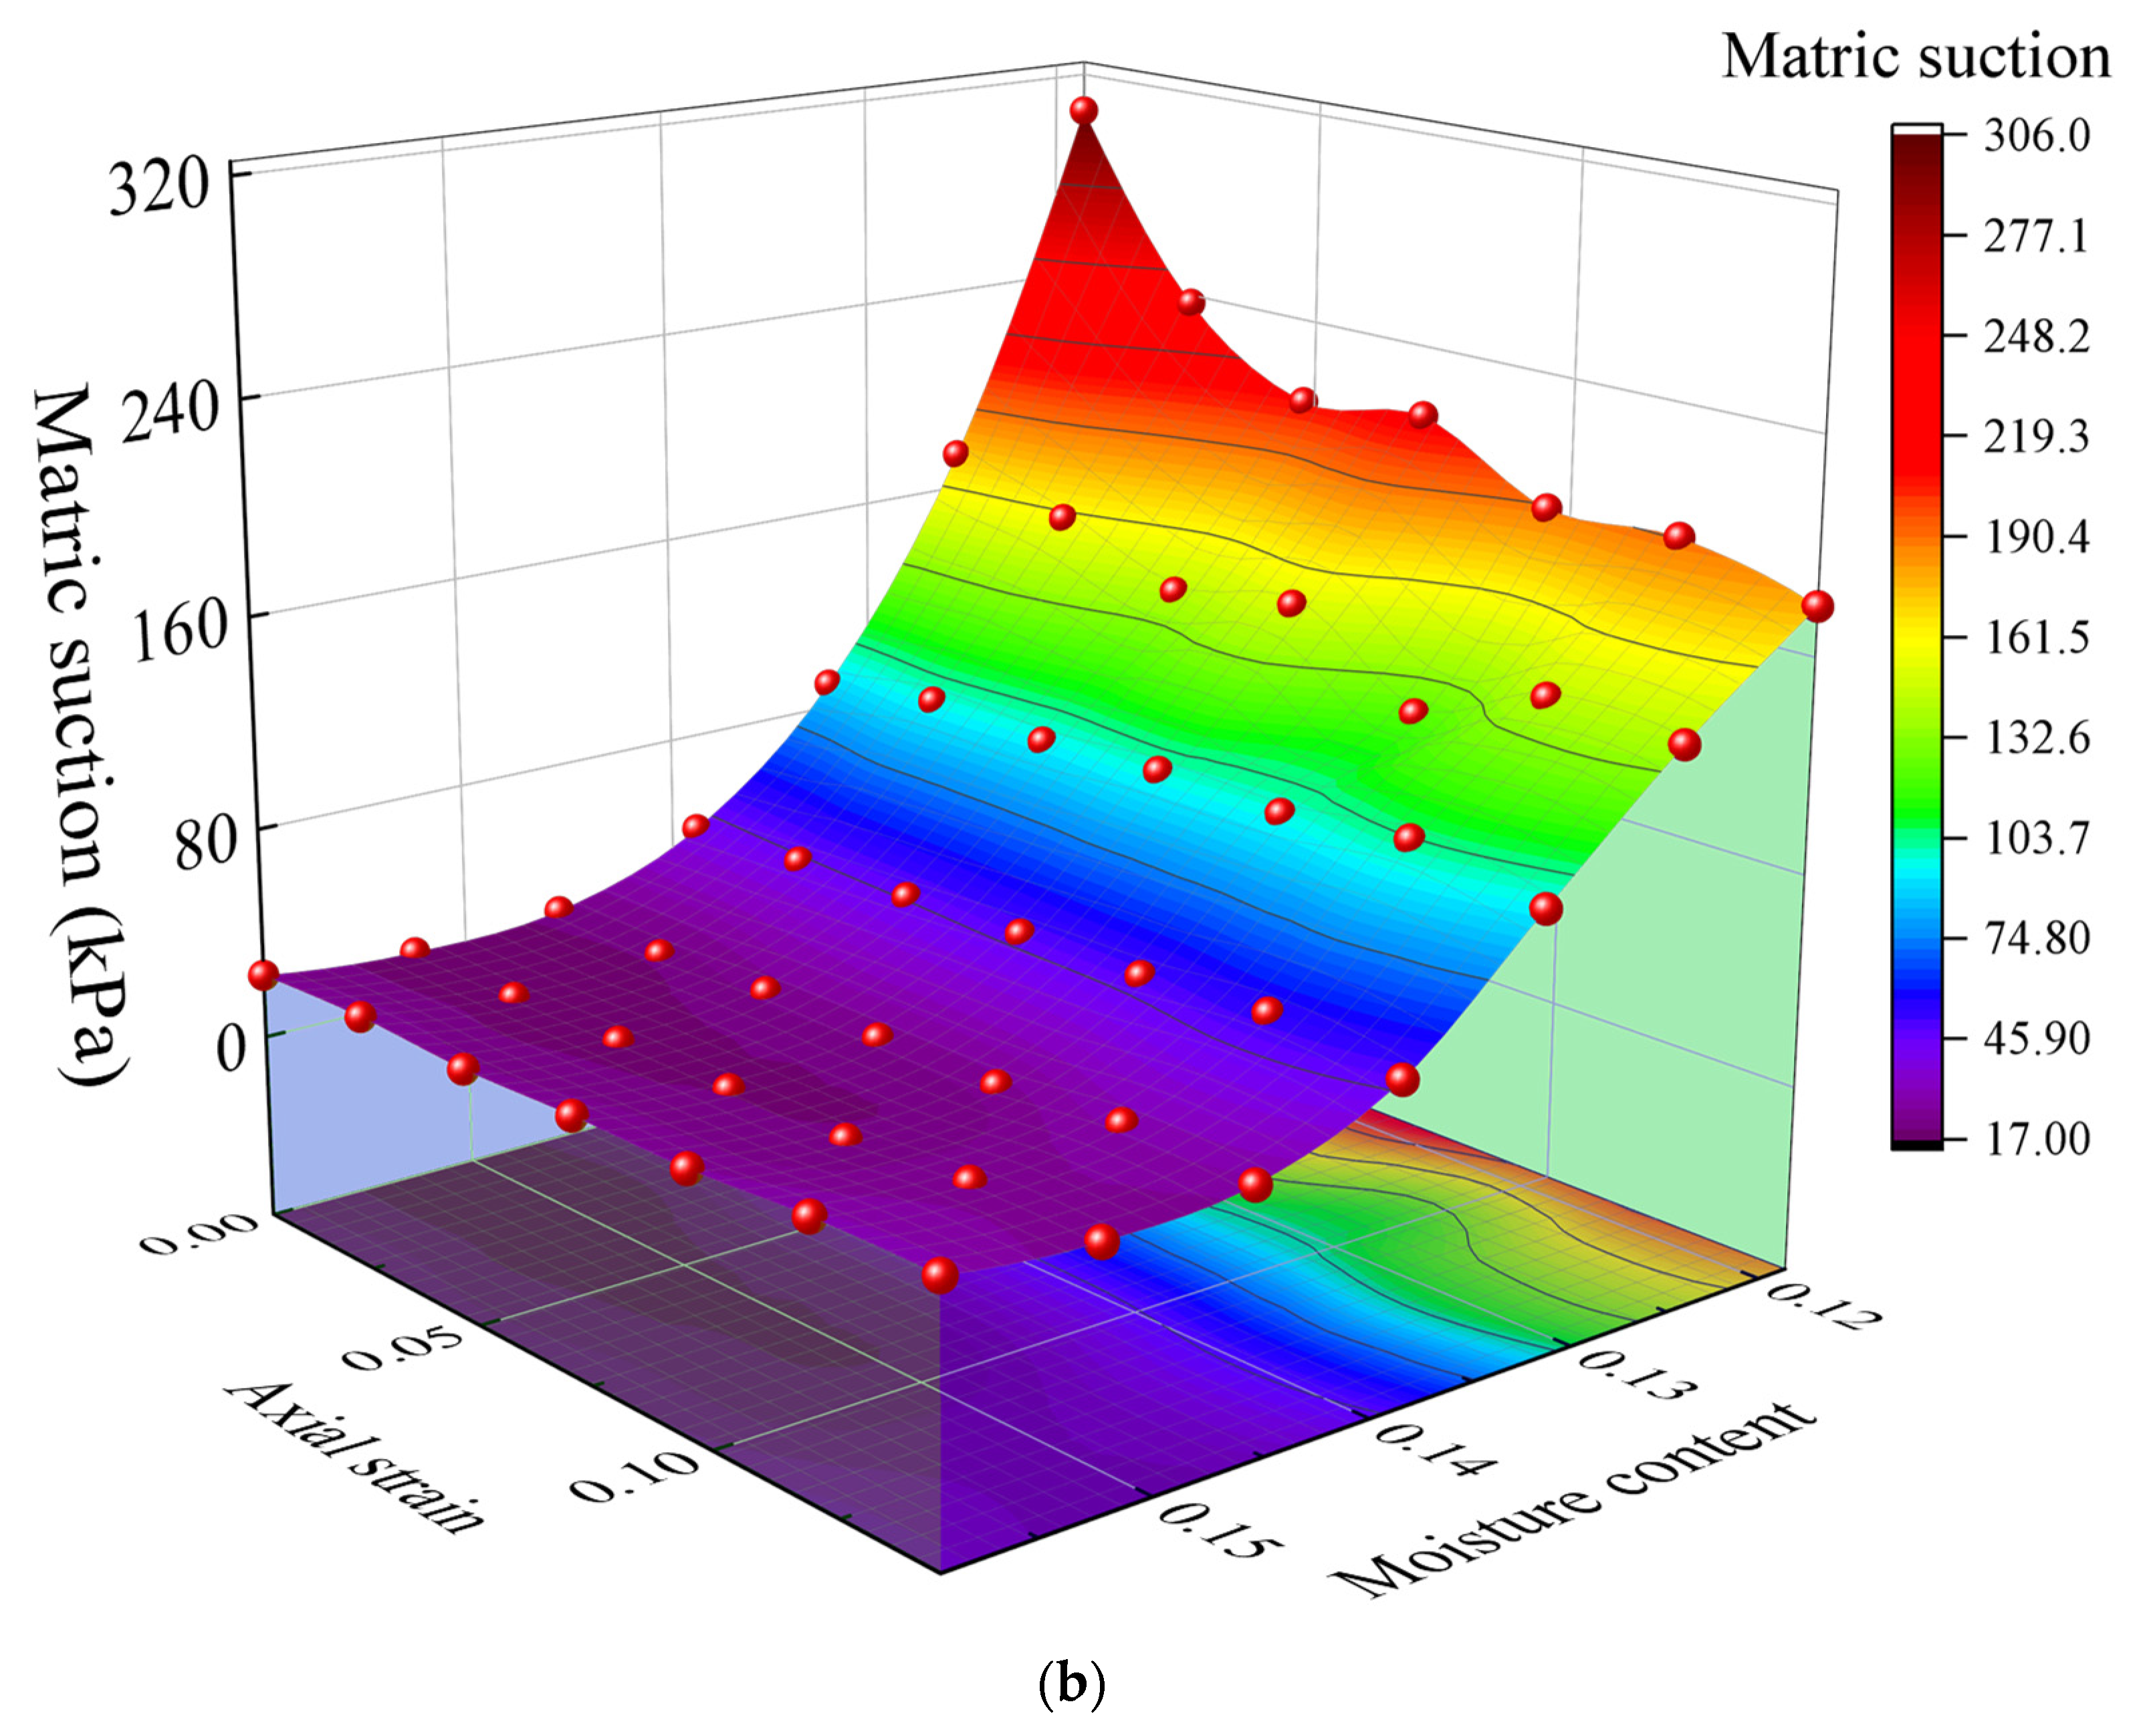
During isotropic loading, an increase in confining pressure causes a rapid decrease in suction. When a confining pressure of 200 kPa is applied, the suction decreases to about 420 kPa and then slowly recovers to equilibrium, indicating an adjustment in soil structure and moisture distribution. During triaxial shear loading, the decrease in suction is more pronounced. After applying deviatoric stress, the suction rapidly decreases to 380 kPa and ultimately stabilizes at equilibrium. Compared to isotropic loading, suction changes during shear loading are more complex, particularly under high moisture conditions.
(4)
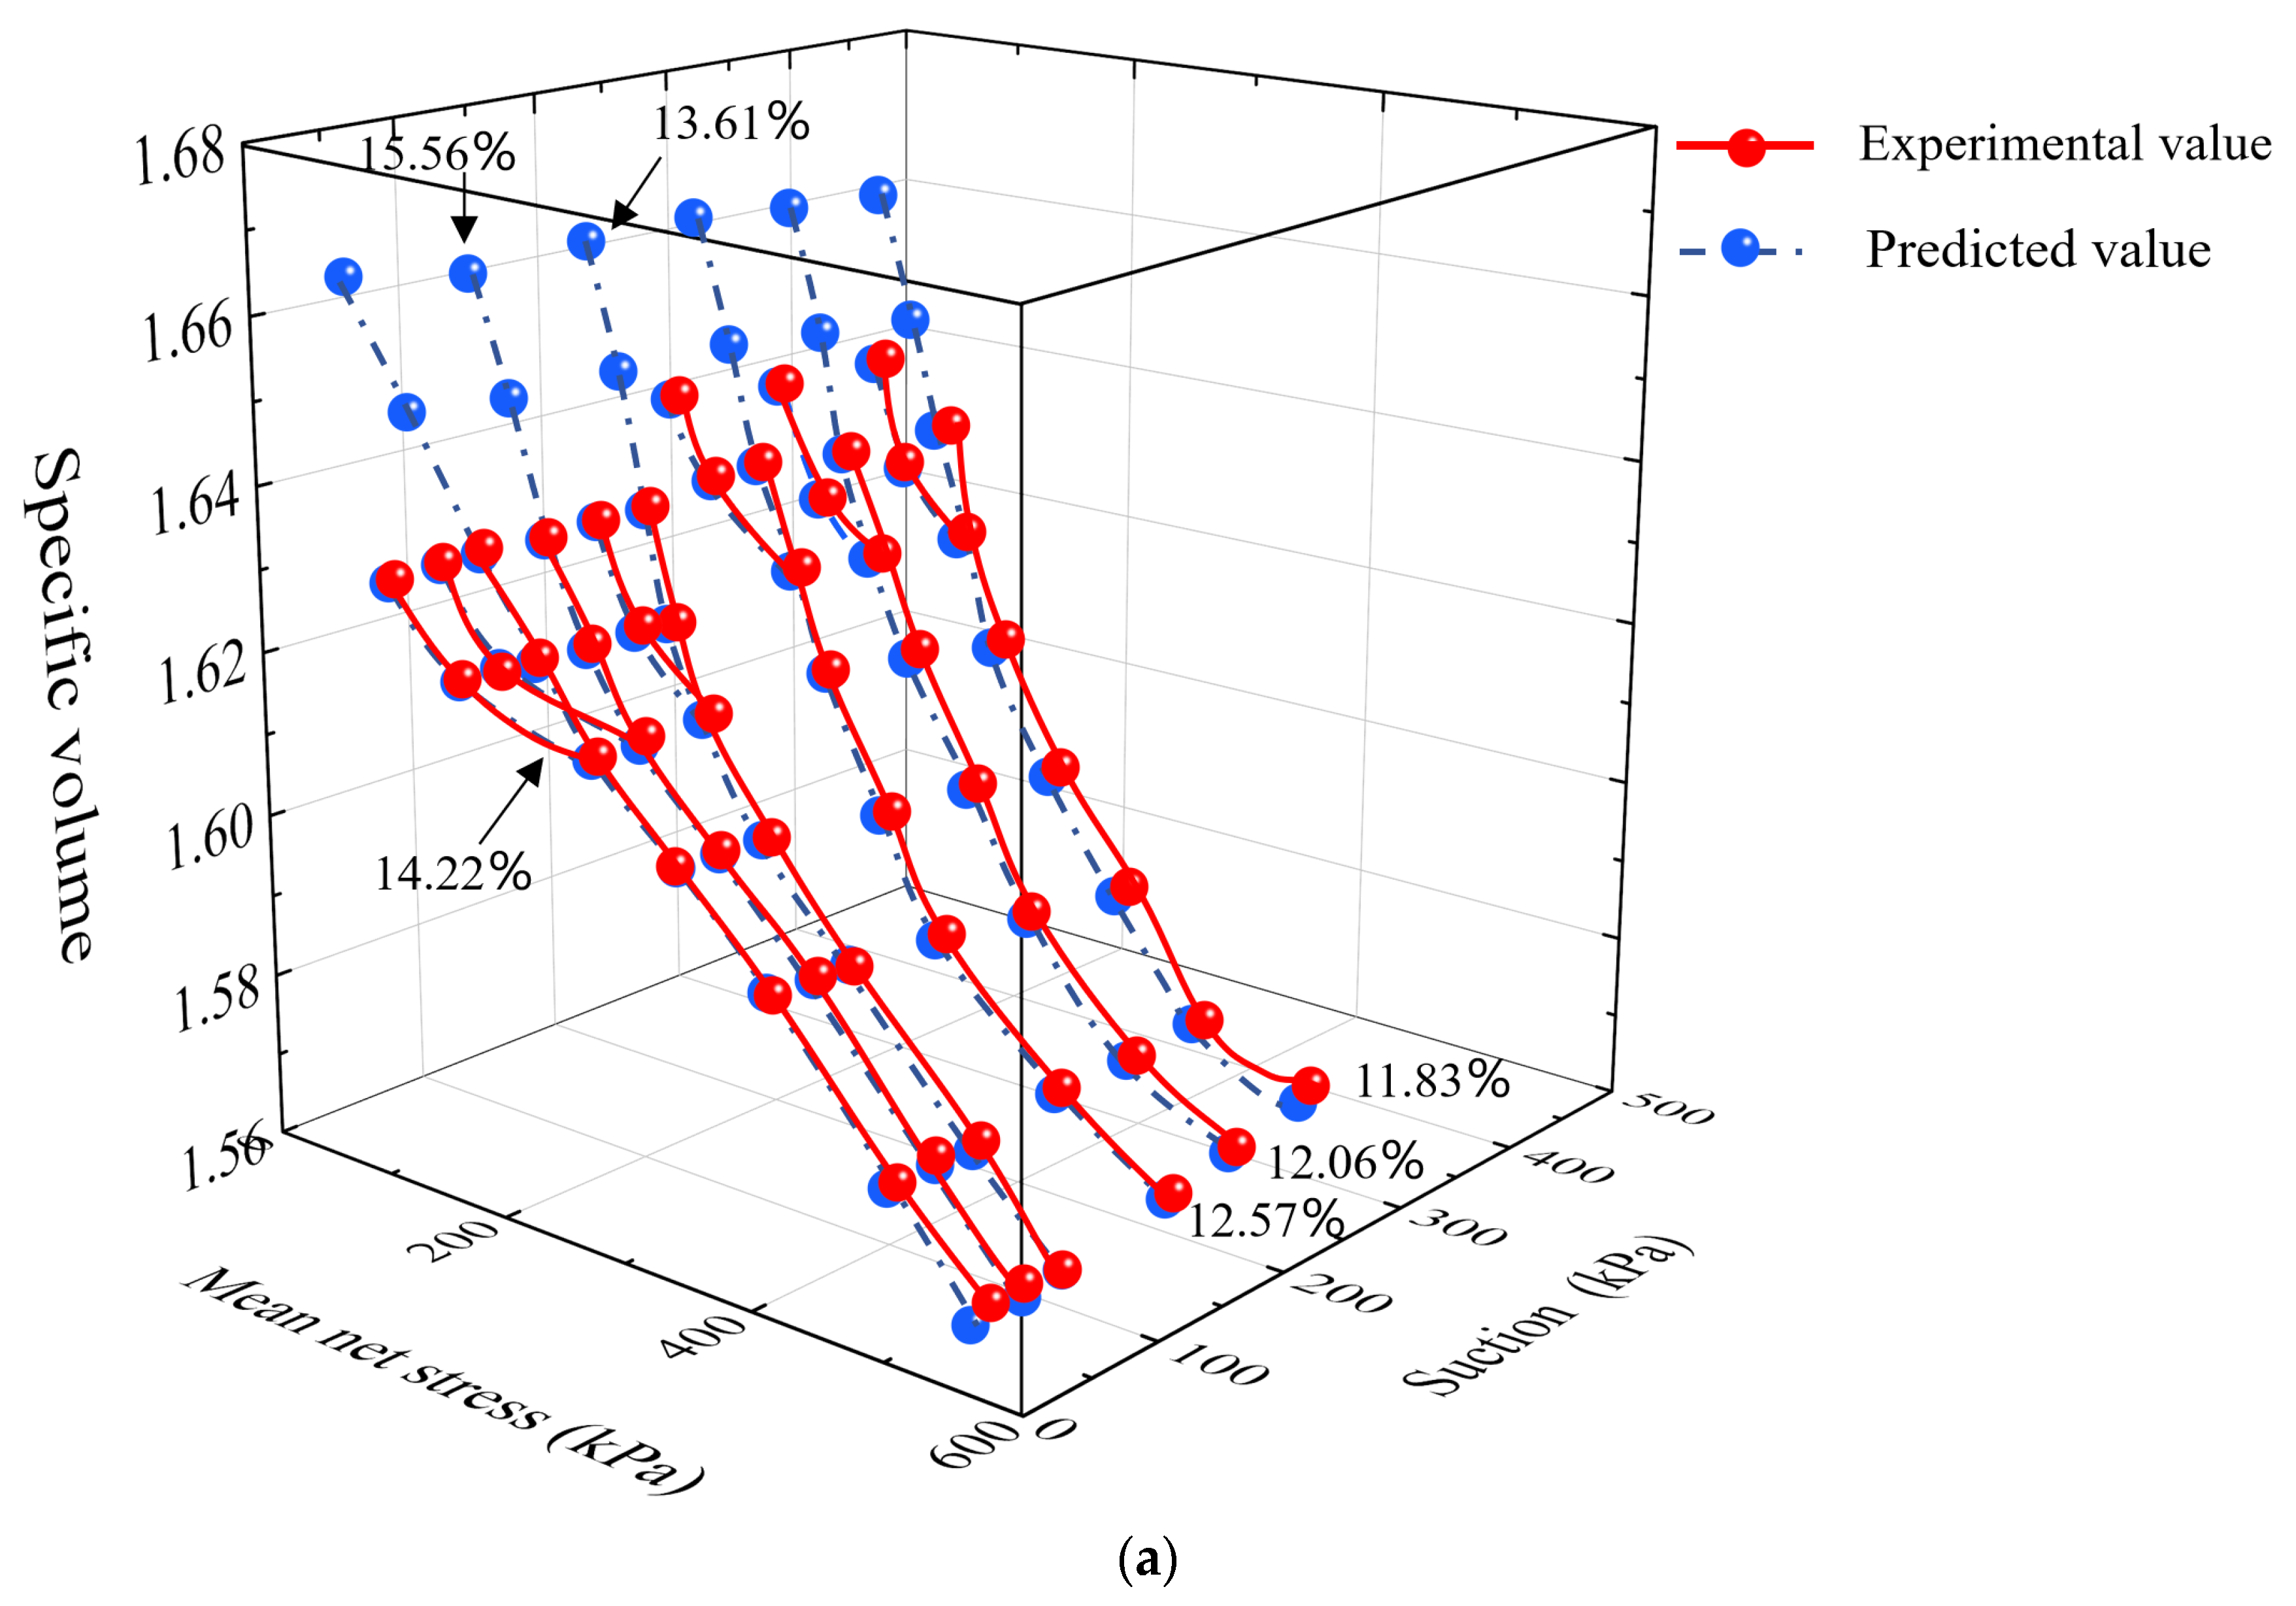
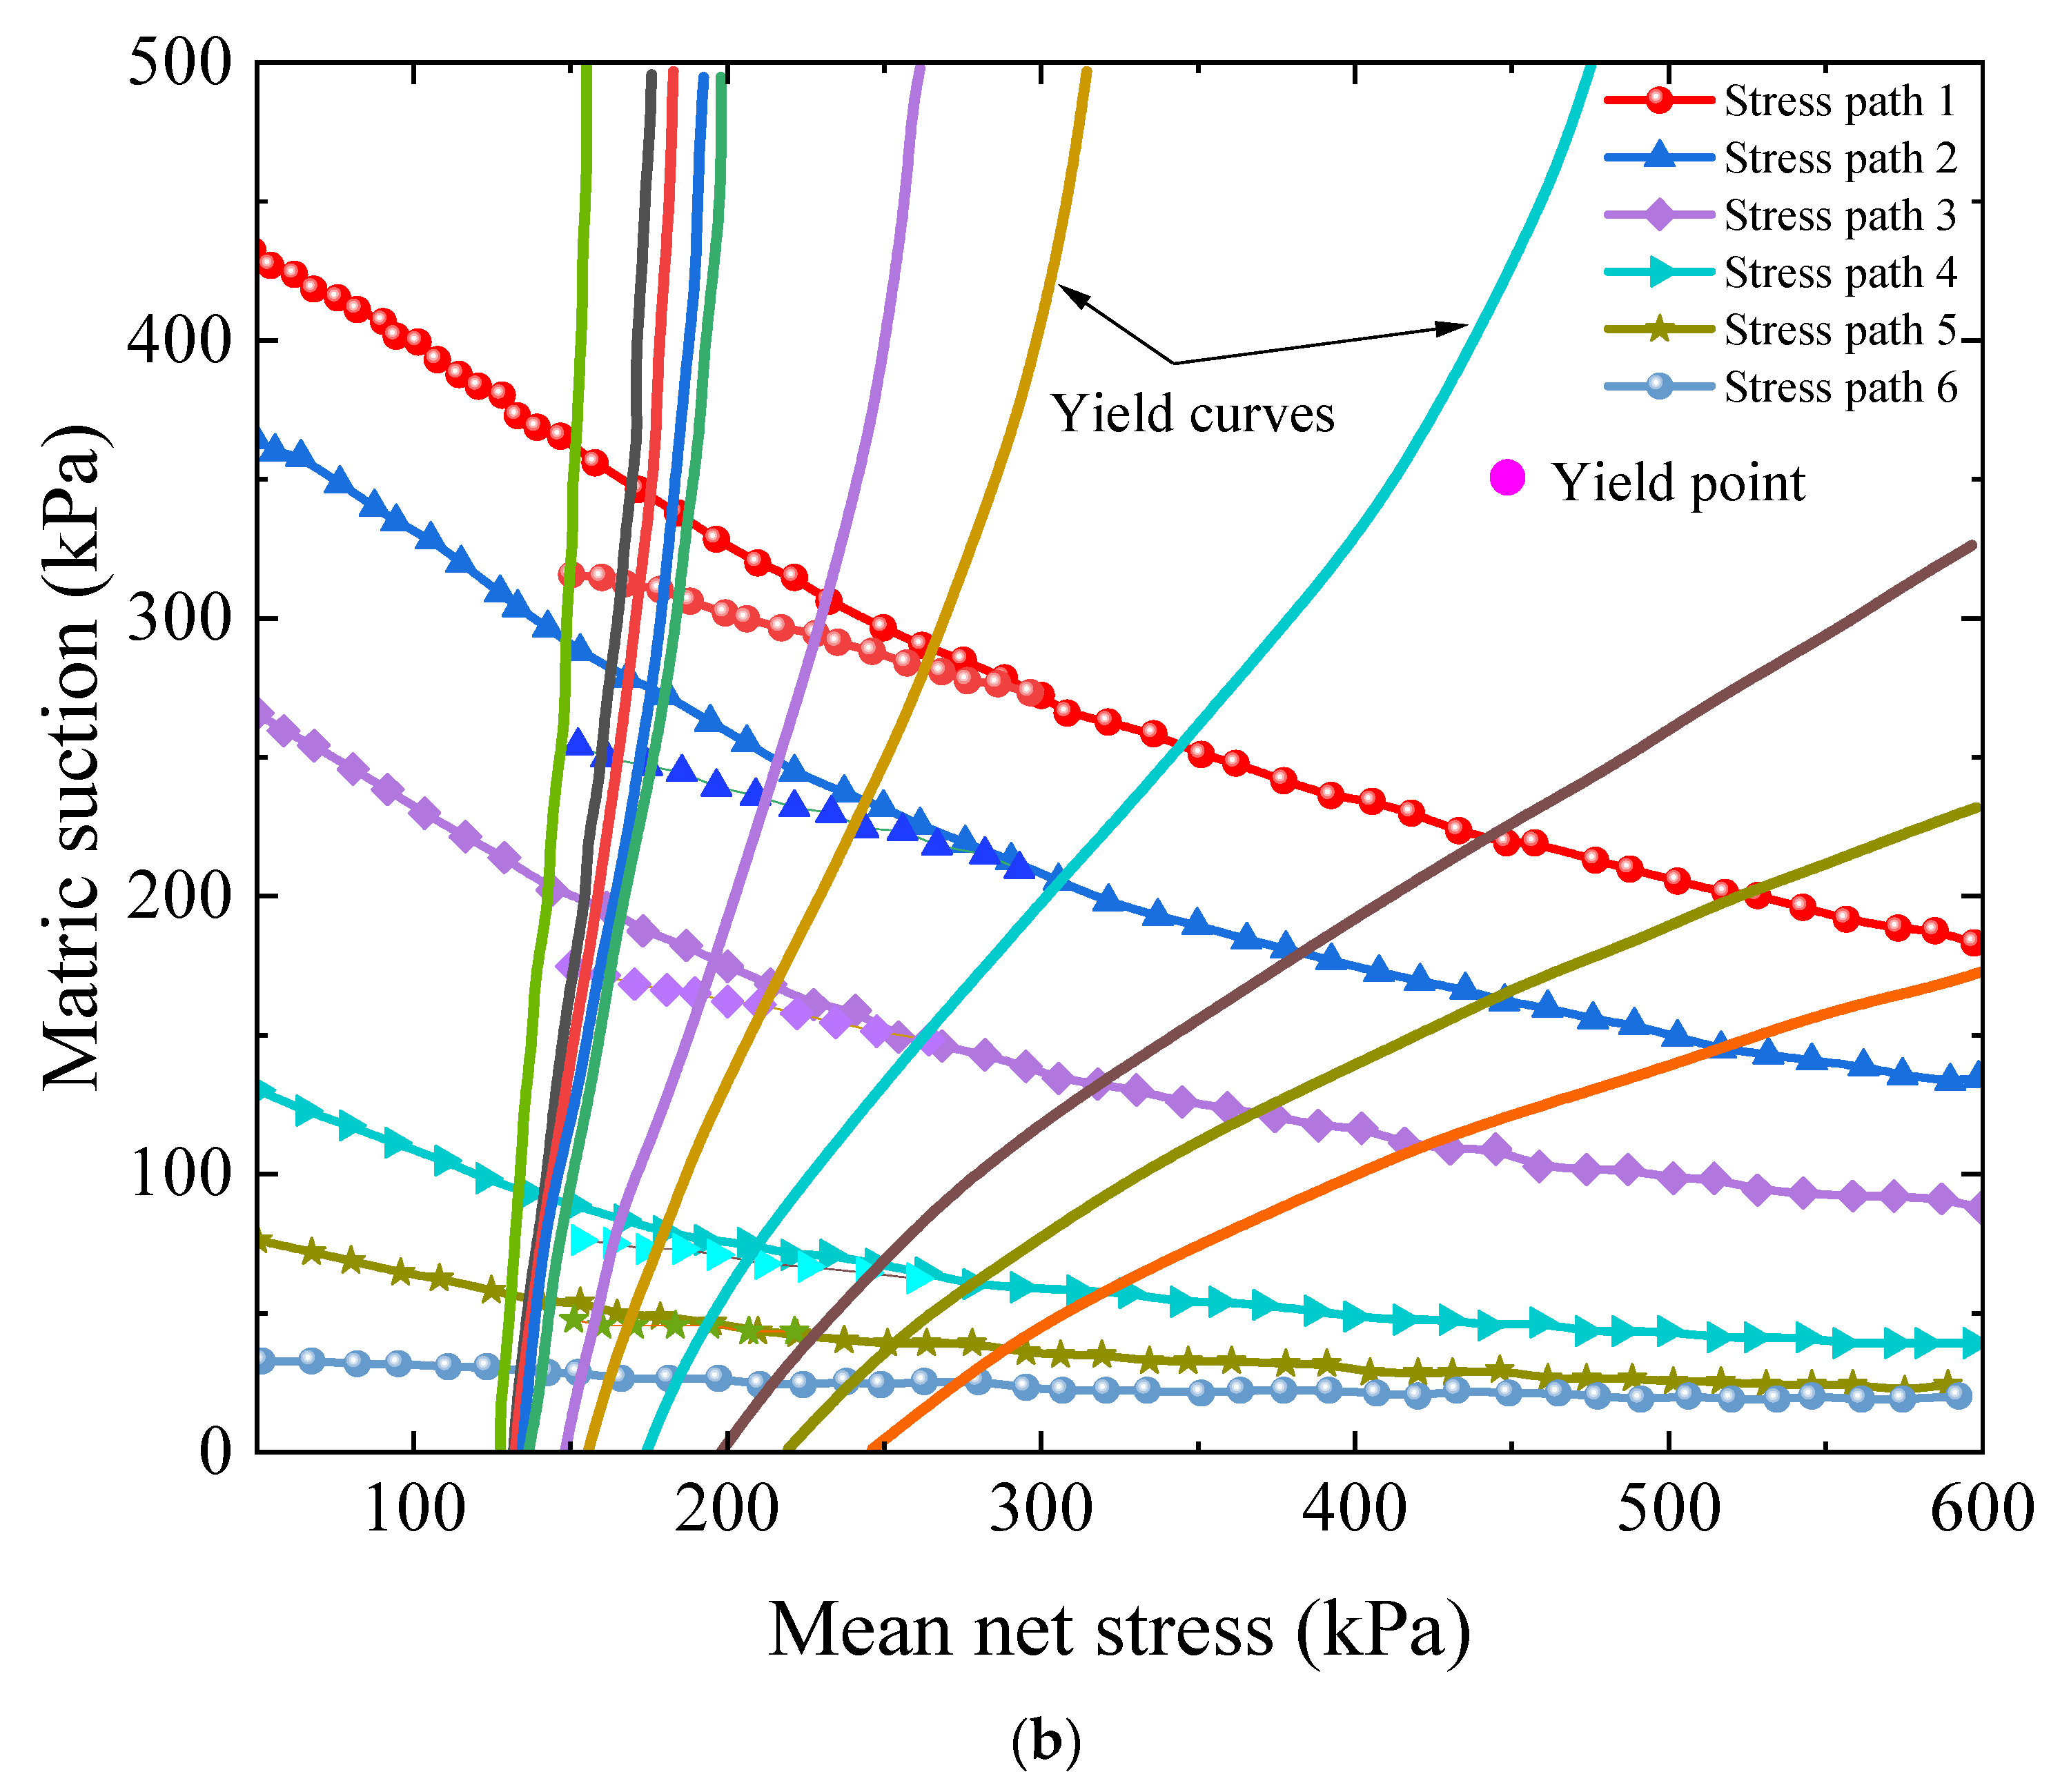
In this study, the BBM model parameters were calibrated using triaxial test data. The results demonstrate that the model performs well in the medium to low stress range, especially when the mean net stress is 200 kPa, with only a 0.61% difference in specific volume between experimental and predicted values. However, in the high stress or high suction region, the prediction error increases, particularly when the stress is 400 kPa, with a difference of approximately 12.57%. As the mean net stress increases, the yield suction also increases, and there are significant differences in the slope and shape of the yield curves under different stress paths. The yield points in the high suction region are more concentrated, further highlighting the significant role of the stress path in yield behavior.

Author Contributions

Conceptualization, methodology, and software, Y.H.; writing—original draft preparation, Y.H.; funding acquisition and writing—review and editing, X.L. All authors have read and agreed to the published version of the manuscript.

Funding

This work was supported by the National Key Research and Development Program Project (Grant No. 2018YFC1505305), the National Natural Science Foundation of China (Grant No. 51578195, 51608533), the Heilongjiang Province Applied Technology Research and Development Program (Grant No. GA19A501), and the 69th Batch of General Projects of China Postdoctoral Science Foundation (Grant No. 2021M690840).

Institutional Review Board Statement

Not applicable.

Informed Consent Statement

Not applicable.

Data Availability Statement

The original contributions presented in this study are included in the article. Further inquiries can be directed to the corresponding author.

Acknowledgments

We would like to express our respect and gratitude to the anonymous reviewers and editors for their valuable comments and suggestions.

Conflicts of Interest

The authors declare no conflicts of interest.

References

  1. Houston, S.; Zhang, X. A unified two independent stress variable approach to moisture-change-induced unsaturated soil volume change. E3S Web Conf. 2023, 382, 01001. [Google Scholar] [CrossRef]
  2. Le Roux, P.F.; Jacobsz, S.W. Performance of the tensiometer method for the determination of soil-water retention curves in various soils. Geotech. Test. J. 2021, 44, 1079–1096. [Google Scholar] [CrossRef]
  3. Orazayeva, S.; Satyanaga, A.; Kim, Y.; Rahardjo, H.; Qian, Z.; Moon, S.-W.; Kim, J. Advanced scanning technology for volume change measurement of residual soil. Appl. Sci. 2024, 14, 10938. [Google Scholar] [CrossRef]
  4. Li, W.; Yang, Q.; Xue, Z.; Liu, W.; Hua, Y. Experimental study and constitutive modeling of volume change behavior in unsaturated soils. Bull. Eng. Geol. Environ. 2021, 80, 679–689. [Google Scholar] [CrossRef]
  5. Alhaj, K.; Biscontin, G.; Elshafie, M.; Osman, A. Water retention and characteristic curves representing tropical clay soils from Africa. Geotech. Test. J. 2020, 195, 01019. [Google Scholar] [CrossRef]
  6. Saha, A.; Sekharan, S. Importance of volumetric shrinkage curve (VSC) for determination of soil–water retention curve (SWRC) for low plastic natural soils. J. Hydrol. 2021, 596, 126113. [Google Scholar] [CrossRef]
  7. Mishra, P.N.; Scheuermann, A.; Bhuyan, M.H. A unified approach for establishing soil water retention and volume change behavior of soft soils. Geotech. Test. J. 2021, 44, 1197–1216. [Google Scholar] [CrossRef]
  8. Zheng, F.; Shao, S.; Wang, Y.; Shao, S. A new suction-controlled true triaxial apparatus for unsaturated soil testing. Geotech. Test. J. 2021, 44, 833–850. [Google Scholar] [CrossRef]
  9. Haeri, S.M.; Borujerdi, S.S.; Garakani, A.A. A fully automated unsaturated triaxial device for testing of soils under complicated hydromechanical stress paths. E3S Web Conf. 2024, 544, 01014. [Google Scholar] [CrossRef]
  10. de Campos, T.M.; de CViana, A.C.; Silva, T.A.; Abrantes, L.G. Evaluation of the At-Rest Coefficient of Earth Pressure in Unsaturated Residual Soil with a New Suction-Controlled Device. Geotech. Test. J. 2021, 44, 373–391. [Google Scholar] [CrossRef]
  11. Xia, Y.; Mu, C.; Li, W.; Ye, K.; Wu, H. Study of dynamic evolution of the shear band in triaxial soil samples using photogrammetry technology. Sustainability 2022, 14, 14660. [Google Scholar] [CrossRef]
  12. Fayek, S.; Zhang, X.; Xia, P. Photogrammetry-Based Method for Measuring Volume Changes of Soil Specimens During Critical Phases of Triaxial Testing. Transp. Res. Rec. 2024, 2678, 1887–1901. [Google Scholar] [CrossRef]
  13. Zheng, G.; Shao, L.; Guo, X.; Zhang, J. Investigation of the mechanical behaviour of an unsaturated soil mixture using a digital image measurement system. Eur. J. Environ. Civ. Eng. 2020, 24, 1051–1067. [Google Scholar] [CrossRef]
  14. Li, L.; Li, P.; Cai, Y.; Lu, Y. Visualization of non-uniform soil deformation during triaxial testing. Acta Geotech. 2021, 16, 3439–3454. [Google Scholar] [CrossRef]
  15. Wang, P.; Guo, X.; Sang, Y.; Shao, L.; Yin, Z.; Wang, Y. Measurement of local and volumetric deformation in geotechnical triaxial testing using 3D-digital image correlation and a subpixel edge detection algorithm. Acta Geotech. 2020, 15, 2891–2904. [Google Scholar] [CrossRef]
  16. Macari, E.J.; Parken, J.; Costes, N.C. Measurement of volume changes in triaxial tests using digital imaging techniques. Geotech. Test. J. 1997, 20, 103–109. [Google Scholar] [CrossRef]
  17. Gachet, P.; Geiser, F.; Laloui, L.; Vulliet, L. Automated digital image processing for volume change measurement in triaxial cells. Geotech. Test. J. 2007, 30, 98–103. [Google Scholar] [CrossRef]
  18. Wu, M.; Wang, J.; Pan, B.; Yin, Z.-Y. Particle tracking-aided digital volume correlation for clay–sand soil mixtures. Géotechnique, 2024; ahead of print. [Google Scholar]
  19. Sharanya, A.G.; Mudavath, H.; Thyagaraj, T. Review of methods for predicting soil volume change induced by shrinkage. Innov. Infrastruct. Solut. 2021, 6, 116. [Google Scholar] [CrossRef]
  20. Mendes, J.; Najdi, A.; Encalada, D.; Prat, P.C.; Ledesma, A. Towards the development of new high-capacity tensiometers capable of measuring soil matric suction beyond 3 MPa. Can. Geotech. J. 2022, 59, 1539–1552. [Google Scholar] [CrossRef]
  21. Liu, H.; Rahardjo, H.; Satyanaga, A.; Du, H. Use of osmotic tensiometers in the determination of soil-water characteristic curves. Eng. Geol. 2023, 312, 106938. [Google Scholar] [CrossRef]
  22. Rahardjo, H.; Shen, Y.; Tsen-Tieng, D.L.; Ramos-Rivera, J.; Nong, X.-F.; Hamdany, A.H. New osmotic tensiometer development. Geotech. Test. J. 2021, 44, 722–740. [Google Scholar] [CrossRef]
  23. Hamdany, A.H.; Shen, Y.; Satyanaga, A.; Rahardjo, H.; Lee, T.-T.D.; Nong, X. Field instrumentation for real-time measurement of soil-water characteristic curve. Int. Soil Water Conserv. Res. 2022, 10, 586–596. [Google Scholar] [CrossRef]
  24. Guo, Y.; Lin, H.C.; Peng, J.B. Response characteristics of an insertion tensiometer investigated via the vacuum saturation method. Catena 2023, 224, 106966. [Google Scholar] [CrossRef]
  25. Tang, G.; Ma, X.; Zhang, H.; Liu, Z.; He, Y. Real-time determination of soil suction in unsaturated clay based on POF sensor. Measurement 2025, 245, 116569. [Google Scholar] [CrossRef]
  26. Najdi, A.; Encalada, D.; Mendes, J.; Prat, P.C.; Ledesma, A. Evaluating innovative direct and indirect soil suction and volumetric measurement techniques for the determination of soil water retention curves following drying and wetting paths. Eng. Geol. 2023, 322, 107179. [Google Scholar] [CrossRef]
  27. Liu, H.; Hamdany, A.H.; Rahardjo, H. Laboratory investigation of osmotic tensiometers filled with cross-linked polyacrylamide. Transp. Geotech. 2024, 44, 101173. [Google Scholar] [CrossRef]
  28. Kang, J.; Yu, Z.; Zhang, Y.; Zhang, T.; Yao, P.; Ye, X. Development of the thermophysical parameter tester for measuring the soil matrix suction and optimization of the calibration function. Comput. Electron. Agric. 2023, 211, 108018. [Google Scholar] [CrossRef]
  29. Thu, T.M.; Rahardjo, H.; Leong, E.C. Shear strength and pore-water pressure characteristics during constant water content triaxial tests. J. Geotech. Geoenviron. Eng. 2006, 132, 411–419. [Google Scholar] [CrossRef]
  30. Rasool, A.M.; Aziz, M. Advanced triaxial tests on partially saturated soils under unconfined conditions. Int. J. Civ. Eng. 2020, 18, 1139–1156. [Google Scholar] [CrossRef]
  31. Chen, B.; Gao, Y.; Sun, D.; Li, J. Simple testing method for measuring the triaxial stress-strain relations of unsaturated soils at high suctions. Geotech. Test. J. 2021, 44, 535–546. [Google Scholar] [CrossRef]
  32. Yoshikawa, T.; Noda, T. Triaxial test on water absorption compression of unsaturated soil and its soil-water-air-coupled elastoplastic finite deformation analysis. Soils Found. 2020, 60, 1151–1170. [Google Scholar] [CrossRef]
  33. Fang, J.; Feng, Y.; Li, Z. Compression and shear strength characteristics of unsaturated intact loess in true triaxial tests. Geotech. Test. J. 2020, 43, 1436–1462. [Google Scholar] [CrossRef]
  34. Zhang, X.; Li, L.; Chen, G.; Lytton, R. A photogrammetry-based method to measure total and local volume changes of unsaturated soils during triaxial testing. Acta Geotech. 2015, 10, 55–82. [Google Scholar] [CrossRef]
  35. TB10001-2016; Code for Design of Earthworks and Track Bed for Railway. China Railway Publishing: Beijing, China, 2016.
  36. TB10102-2010; The Code for Soil Test of Railway Engineering. China Railway Publishing: Beijing, China, 2010.
  37. Andrianatrehina, S.R.; Li, Z.-S.; Taibi, S.; Fleureau, J.-M.; Boutonnier, L. An improved unsaturated triaxial device to characterize the pore-water pressure and local volume change behavior of a compacted marl. Geotech. Test. J. 2020, 43, 339–350. [Google Scholar] [CrossRef]
  38. ASTM D2435; Standard Test Methods for One-Dimensional Consolidation Properties of Soils. ASTM International: West Conshohocken, PA, USA, 2011.
  39. GB/T 50123-2019; Standard for Geotechnical Testing Method. Ministry of Housing and Urban-Rural Development of the People’s Republic of China; China Standards Press: Beijing, China, 2019.
  40. GB/T 50123-1999; Standard for Soil Test Method. Ministry of Housing and Urban-Rural Development of the People’s Republic of China; China Standards Press: Beijing, China, 1999.
  41. Li, Y.Z.; Liu, E.L.; He, M. Mechanical properties of artificially structured soil and Binary-medium-based constitutive model under undrained conditions. PLoS ONE 2024, 19, e0296441. [Google Scholar] [CrossRef]
  42. Ning, Y.; Huang, Q.F.; Shi, C.; Meng, Q.X. Numerical simulation study on compression characteristics of gravelly soil mixture based on soft servo method. Geofluids 2021, 2021, 9946628. [Google Scholar] [CrossRef]
  43. Luo, T.; Chen, D.; Yao, Y.P.; Zhou, A.N. An advanced UH model for unsaturated soils. Acta Geotech. 2020, 15, 145–164. [Google Scholar] [CrossRef]
  44. Bardanis, M.; Grifiza, S.; Kokoviadis, D.; Feuillas, M. The combination of splitting tensile strength and unconfined compression tests on unsaturated soils to measure the evolution of unsaturated shear strength. E3S Web Conf. 2023, 382, 04001. [Google Scholar] [CrossRef]
  45. Rivera-Hernandez, X.A.; Vahedifard, F.; Ellithy, G.S. Effect of suction and confining pressure on shear strength and dilatancy of highly compacted silty sand: Single-stage versus multistage triaxial testing. Geotech. Test. J. 2021, 44, 407–421. [Google Scholar] [CrossRef]
  46. Mu, Q.Y.; Dai, B.L.; Zhou, C. A constitutive model for structured soils under saturated and unsaturated conditions. Int. J. Numer. Anal. Methods Geomech. 2023, 47, 2562–2586. [Google Scholar] [CrossRef]
  47. Pande, P.; Giri, J.; Ali, M.S.; Mohammad, F.; Raut, J.; Raut, S.; Sathish, T.; Giri, P. Comparative analysis of saturated–unsaturated shear strength under undrained loading: Experimental validation and ANN prediction of clayey soils. AIP Adv. 2024, 14, 075118. [Google Scholar] [CrossRef]
  48. Rasool, A.M.; Kuwano, J. Effect of constant loading on unsaturated soil under water infiltration conditions. Geomech. Eng. 2020, 20, 221–232. [Google Scholar]
  49. Altamirano Muñiz, E.F. Modeling soils’ failure envelope with virtual displacements (LSVD). arXiv 2023, arXiv:2406.18594. [Google Scholar]
  50. Tian, D.; Zheng, H. The generalized Mohr-Coulomb failure criterion. Appl. Sci. 2023, 13, 5405. [Google Scholar] [CrossRef]
  51. Handspiker, W.; Liu, Z.; Ghafghazi, M. On stress ratio equations in three-dimensional stress space for modelling soil behaviour. Geotech. Res. 2024, 11, 243–255. [Google Scholar] [CrossRef]
  52. Rawat, A.; Lang, L.; Baille, W.; Dieudonne, A.C.; Collin, F. Coupled hydro-mechanical analysis of expansive soils: Parametric identification and calibration. J. Rock Mech. Geotech. Eng. 2020, 12, 620–629. [Google Scholar] [CrossRef]
  53. Zhang, X.; Riad, B.; Alonso, E.E. Calibration of BBM parameters using the modified state surface approach. J. Geotech. Eng. 2023, 382, 15001. [Google Scholar] [CrossRef]
  54. Ji, Z.; Yi, H.; Li, G.; Liu, B.; Wu, Z. Numerical Implementation of the Barcelona Basic Model Based on Return-Mapping Integration. Appl. Sci. 2022, 12, 11933. [Google Scholar] [CrossRef]
  55. Prajapati, V.; Das, A. Numerical implementation of BBM in FE package for solving unsaturated soil boundary value problems. E3S Web Conf. EDP Sci. 2023, 382, 15003. [Google Scholar] [CrossRef]
Figure 1. Overview of the testing system and setup. Notes: (a) self-developed unsaturated subgrade fill triaxial testing system, (b) schematic structure of the testing system, (c) positioning of the 3D camera during the measurement process.
Applsci 15 05380 g001
Figure 2. Three-dimensional coordinates of point P in the unsaturated soil specimen reconstructed using the photogrammetry method. Notes: (a) image capture and measurement setup, (b) ray tracing and refraction calculation, (c) 3D coordinate reconstruction and optimization.
Applsci 15 05380 g002
Figure 3. Schematic and actual diagram of matric suction tensiometer components. Notes: (a) structural schematic, (b) sensor section schematic, (c) actual product diagram.
Applsci 15 05380 g003
Figure 4. Grain size distribution curve for the embankment soil.
Applsci 15 05380 g004
Figure 5. Compaction test curve for the embankment soil.
Applsci 15 05380 g005
Figure 6. Schematic of the digital image correlation (DIC) system.
Applsci 15 05380 g006
Figure 7. Deformation of the specimen under different axial displacement conditions. Notes: (a) σ 3 = 5   kPa , (b) σ 3 = 200   kPa .
Applsci 15 05380 g007
Figure 8. Comparison of the specific volume of samples under different isotropic pressure and water content conditions. Notes: (a) A load of 200 kPa (Set 2), (b) a load of 600 kPa (Set 3).
Applsci 15 05380 g008
Figure 9. Comparison of the variation in the specific volume of the sample during the triaxial shearing process. Notes: (a) σ 3 = 5   kPa (Set 1), (b) σ 3 = 200   kPa (Set 2).
Applsci 15 05380 g009
Figure 10. Deviator stress–axial strain relationship during the triaxial shearing process. Notes: (a) σ 3 = 5   kPa (Set 1), (b) σ 3 = 200   kPa (Set 2).
Applsci 15 05380 g010aApplsci 15 05380 g010b
Figure 11. Responses of the tensiometer in a constant water content test for a sample in Set 2.
Applsci 15 05380 g011
Figure 12. Comparison of suction variations under isotropic loading for samples with different moisture contents. Notes: (a) A load of 200 kPa (Set 2), (b) a load of 600 kPa (Set 3).
Applsci 15 05380 g012
Figure 13. Matric suction–axial strain relationship during the shearing process for specimens with different moisture contents. Notes: (a) σ 3 = 5   kPa (Set 1), (b) σ 3 = 200   kPa (Set 2).
Applsci 15 05380 g013aApplsci 15 05380 g013b
Figure 14. Mohr–Coulomb circles and failure envelope at the shear failure point of the specimen.
Applsci 15 05380 g014
Figure 15. Comparison of constitutive models for specimens with different moisture contents under isotropic loading conditions: (a) differences between experimental data and theoretical predictions, (b) yield curves.
Applsci 15 05380 g015aApplsci 15 05380 g015b
Table 1. Grading distribution of filler particles.
Particle Size/mm>1010–52–51–20.5–10.25–0.50.074–0.25≤0.074
Percent content/%1.1310.12911.23427.715.61313.14418.1882.862
Table 2. Soil samples’ initial coefficients in the testing procedure.
SampleSerial NumberPreliminary Condition
w (%)es (kPa)
Set 115.890.65528.0
14.560.65557.2
13.480.652170.0
13.050.654241.4
12.160.652387.3
11.760.647501.7
Set 215.900.65673.1
13.410.654145.6
12.920.652253
11.980.650364.8
11.840.647417.2
Set 315.560.65834.0
14.220.65576.7
13.610.653130.3
12.570.650265.8
12.040.649364.6
11.830.648430.3
Table 3. Camera coefficient calibration results.
CoefficientPrior to IdealizationPost-IdealizationUnit
Fx 23.897524.3567(mm)
Fy 15.886216.1234(mm)
M49364936(mm)
Px 12.128912.4433(mm)
Py 9.13899.2448(mm)
P1−3.89760(×10−6)
P21.61560(×10−6)
K15.9980(×10−5)
K2−4.8760(×10−9)
N32183218(mm)
f54.398554.3885(mm)
Table 4. Soil sample coefficients at the failure point under shear loading conditions.
SampleSerial Numbersd (kPa) σ 1 d u a (kPa) σ 3 d u a (kPa)
Set 135.795.65
63.9127.35
127.9197.85
164.9249.45
256.8290.75
322.9336.35
Set 2--200
--200
121.7748.9200
171.9786.9200
196.9830.9200
Set 3--200
--200
--200
--200
--200
--200
Table 5. Model coefficients.
CoefficientOptimal Fit
pc (MPa)0.121
κ 0.0077
β (MPa−1)7.999
r0.377
Q(0)0.667
λ(0)0.054
κ s 0.0116
Note: κ represents the gradient of the unloading–reloading curve corresponding to the average net stress; κ s indicates the gradient of the unloading–reloading curve related to soil suction; Q(0) refers to the specific volume when p equals pc and s is zero; λ(0) also denotes the gradient of the virgin compression curve related to the average net stress when s equals zero; r is a parameter that regulates the steepness of the virgin compression curve; β is a parameter that influences the slope of the virgin compression curve when s is not equal to zero; and pc is the reference stress.
Disclaimer/Publisher’s Note: The statements, opinions and data contained in all publications are solely those of the individual author(s) and contributor(s) and not of MDPI and/or the editor(s). MDPI and/or the editor(s) disclaim responsibility for any injury to people or property resulting from any ideas, methods, instructions or products referred to in the content.

