1. Introduction
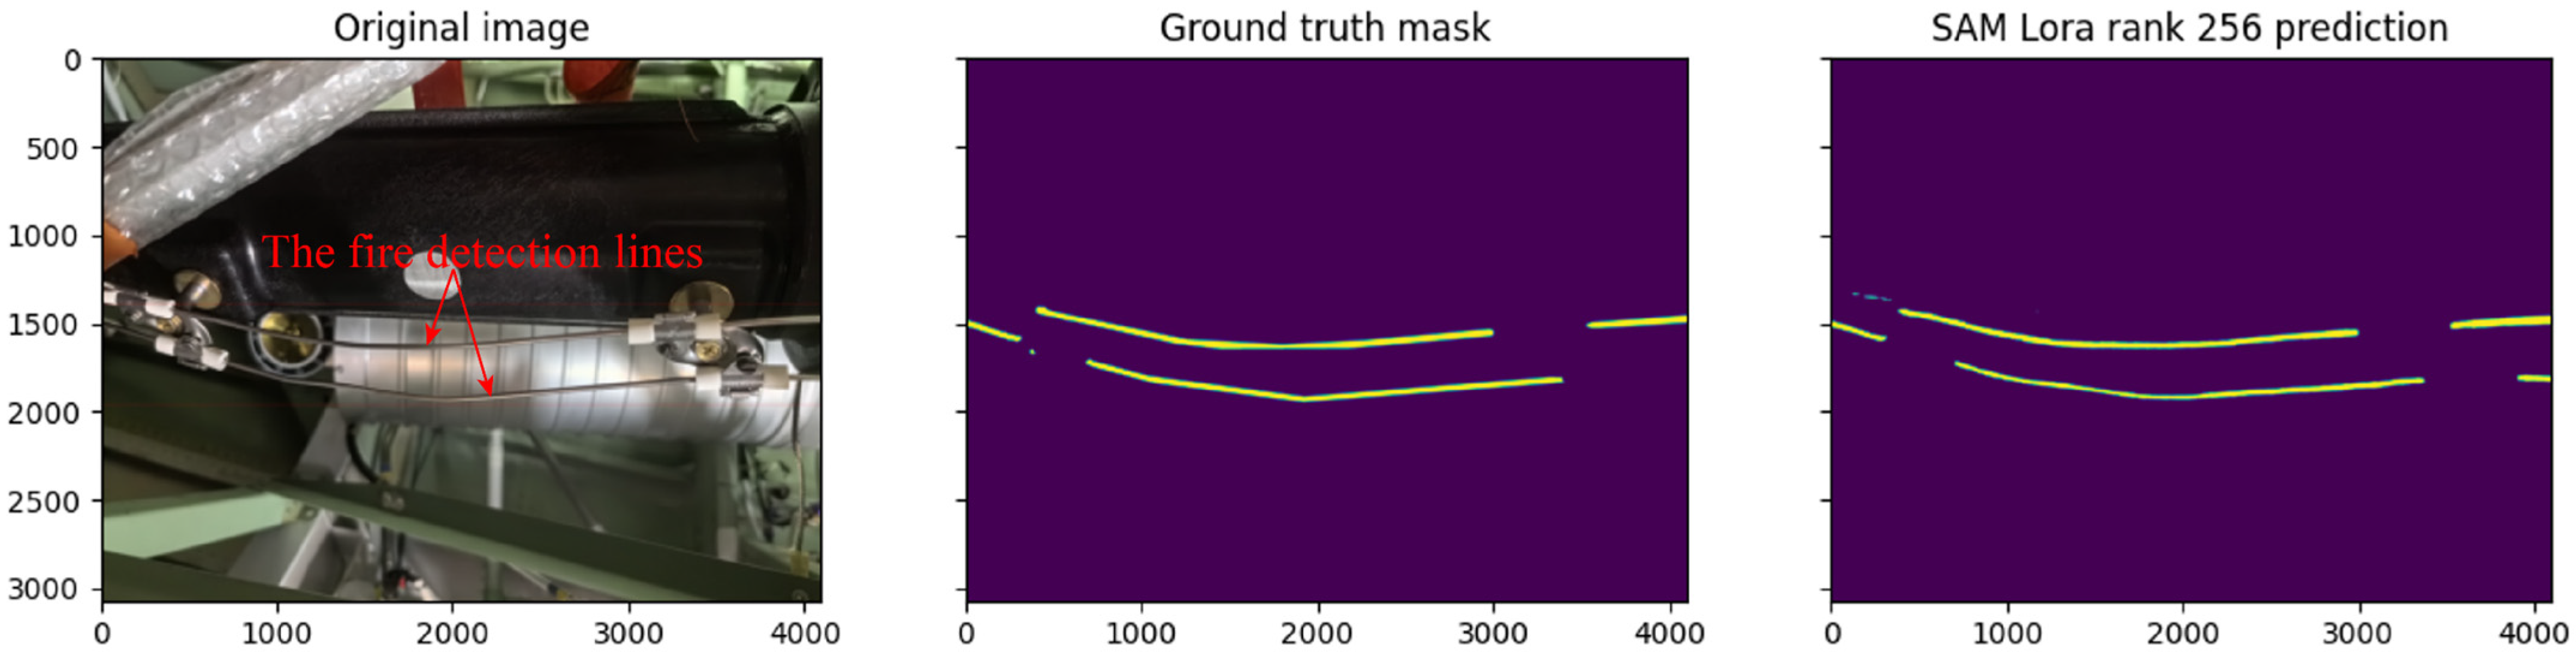
Fire detection lines are critical components of an aircraft’s fire protection system, and they are responsible for monitoring whether key compartments such as the engine bay, APU bay, EE bay, and cargo hold experience fire or overheating. According to aircraft manufacturing process specifications, the distance between any two fire detection lines must exceed a defined threshold. Therefore, verifying the spacing between fire detection lines is a crucial step in ensuring conformity with type design during aircraft assembly.
Due to the wide distribution of fire detection lines across various complex compartments and their large quantity, manual inspection for spacing compliance is time-consuming and prone to errors or omissions. The task of computing the distance between fire detection lines can be divided into two subtasks: (1) segmentation of the fire detection lines and (2) calculation of the minimum spacing between them. As the temperature of fire detection lines is typically the same as the surrounding environment, infrared imaging cannot be used to identify them. Therefore, visual algorithms are required to detect their contours.
To the best of our knowledge, there is currently no dedicated research focused on visual detection algorithms specifically for fire detection lines. Related work has mainly addressed similar elongated objects using either traditional edge detection methods or deep learning-based segmentation models. However, conventional edge detection algorithms generally lack adaptability to complex and cluttered scenarios such as those inside aircraft compartments, making them unsuitable for this task. Deep learning-based segmentation models have shown strong performance in various fields, including automatic parking [
1], point cloud processing [
2], remote sensing image processing [
3,
4], autonomous driving [
5], security imaging [
6], aerial imaging [
7], and medical imaging [
8]. Nevertheless, applications in the aerospace field remain rare, largely due to the high accuracy requirements, lack of high-quality public datasets, prevalence of fine elongated structures, difficulty in extracting texture-similar features, and the need for domain-specific knowledge [
9,
10].
However, high-quality image segmentation of aircraft components can compute the geometric relationships between parts by using segmented masks. These relationships can be compared with the engineering requirements of the aircraft to determine manufacturing compliance. This provides significant support for assessing the conformity of assembly relationships for a large number of components, such as cables, pipes, and fasteners in aircraft. It also helps to reduce the workload of operators and minimize the impact of human errors.
In recent years, the segmentation detection model based on deep learning has made great progress. A full convolutional network (FCN) [
11] has broken through the limit of input image size, which can process images of any size and generate segmentation results by replacing the full connection layer with a convolution layer. It greatly enhances the flexibility and application scope of the model. U-Net [
12] combines the encoder and decoder structure and retains important detailed features through cross-level jump connections. The encoder down-samples the input image to capture the features, and the decoder up-samples the feature map to predict the segmentation results, which realizes fine local reconstruction. Zhou et al. [
13] further developed and expanded the U-Net architecture on this basis by introducing the nested jump connection strategy, enabling the model to more effectively capture multi-scale context information, promote the deep fusion of features at different levels, and improve the accuracy and robustness of segmentation. The Deep lab [
14] series models introduce the concept of void convolution and a fully connected conditional random field, which not only expands the receptive field and enhances the model’s ability to understand a wide range of contexts but also optimizes the segmentation boundary through post-processing steps, making the model perform well in complex scenes and fine-grained segmentation tasks. However, due to the limited convolution characteristics, these methods have some difficulties in identifying small and slender objects [
15]. At the same time, the small-scale self-built dataset is fine-tuned to transfer the pre-trained model to other objects.
In recent years, Transformer [
16] has been gradually introduced to machine vision by NLP tasks. ViT [
17], for the first time, applied the self-attention mechanism to the image classification task based on the Transformer, demonstrating the ability of global feature capture. TransUNet [
18] creatively integrates CNN and ViT and uses the local details (CNN is good at) and global context information (ViT is good at) in the image segmentation task to realize the effective integration of regional and global features of the input image. Swin UNETR [
19] focuses on using ViT as the main feature extractor, using the Swin Transformer structure to improve the segmentation efficiency and ability by gradually narrowing the range of attention.
Due to the highly parallelized self-attention mechanism, hierarchical representation learning method, and robustness, which is easy to scale and transfer, the Transformer has gradually become a core component of large foundational models. In the field of machine vision, the Segment Anything Model (SAM) based on a Transformer has become a powerful tool for image segmentation tasks, offering impressive zero sample performance and the ability to transfer to new image distributions and functions [
20]. It has been applied in various practical scenarios, including agriculture, manufacturing, remote sensing, and health care [
21]. Although SAM has been trained on 11 million images with 1 billion masks, the application of the SAM training dataset still faces challenges in the aircraft field due to the lack of aircraft parts image samples and the different characteristics of aircraft parts and ordinary objects.
Therefore, it is necessary to build a custom dataset, develop fine-tuning methods and loss functions, analyze the impact of involved parameters on model accuracy, and conduct fine-tuning of SAM to apply SAM in the field of aircraft component image segmentation. Currently, there are three technical approaches: (1) A large-scale domain-specific dataset is created, and comprehensive fine-tuning of all parameters in the SAM model is performed [
22]; (2) A CNN network is added to SAM [
23,
24]. Then, most of the SAM parameters are frozen, and a small number of parameters are fine-tuned; (3) LoRA [
25] or adapters [
26,
27] are added to SAM, which refers to the fine-tuning methods of large language models. The branch parameters are adjusted, trained, and combined with the SAM model parameters. This architecture is relatively simpler [
28].
Considering the characteristics of target segmentation detection in the aviation field, the third technical route is selected. For the distance detection between aircraft fire detection lines, the main contributions are as follows:
The dataset of fire detection line segmentation is self-built. Fire detection lines are widely involved in the aircraft manufacturing compliance inspection process and have slender features, which are typically representative and difficult to divide.
The SAM fine-tuning model, ASAM, based on LoRA, is proposed, which is 13.82 times higher than the Dice of the classical segmentation model K-Net under the same training parameters. Only a small part of the model parameters needs to be updated to reduce the training cost in the actual use process.
The fusion loss function is proposed to conduct adaptive training to the target task, which improves the ability of the training model to match the target task. Since the minimum distance between the fire detection lines should be controlled to be greater than the value required by the process specification, we can take the target task of calculating the minimum distance between the fire detection lines through image segmentation as an example. The research method has a certain generality for the application in the aviation field.
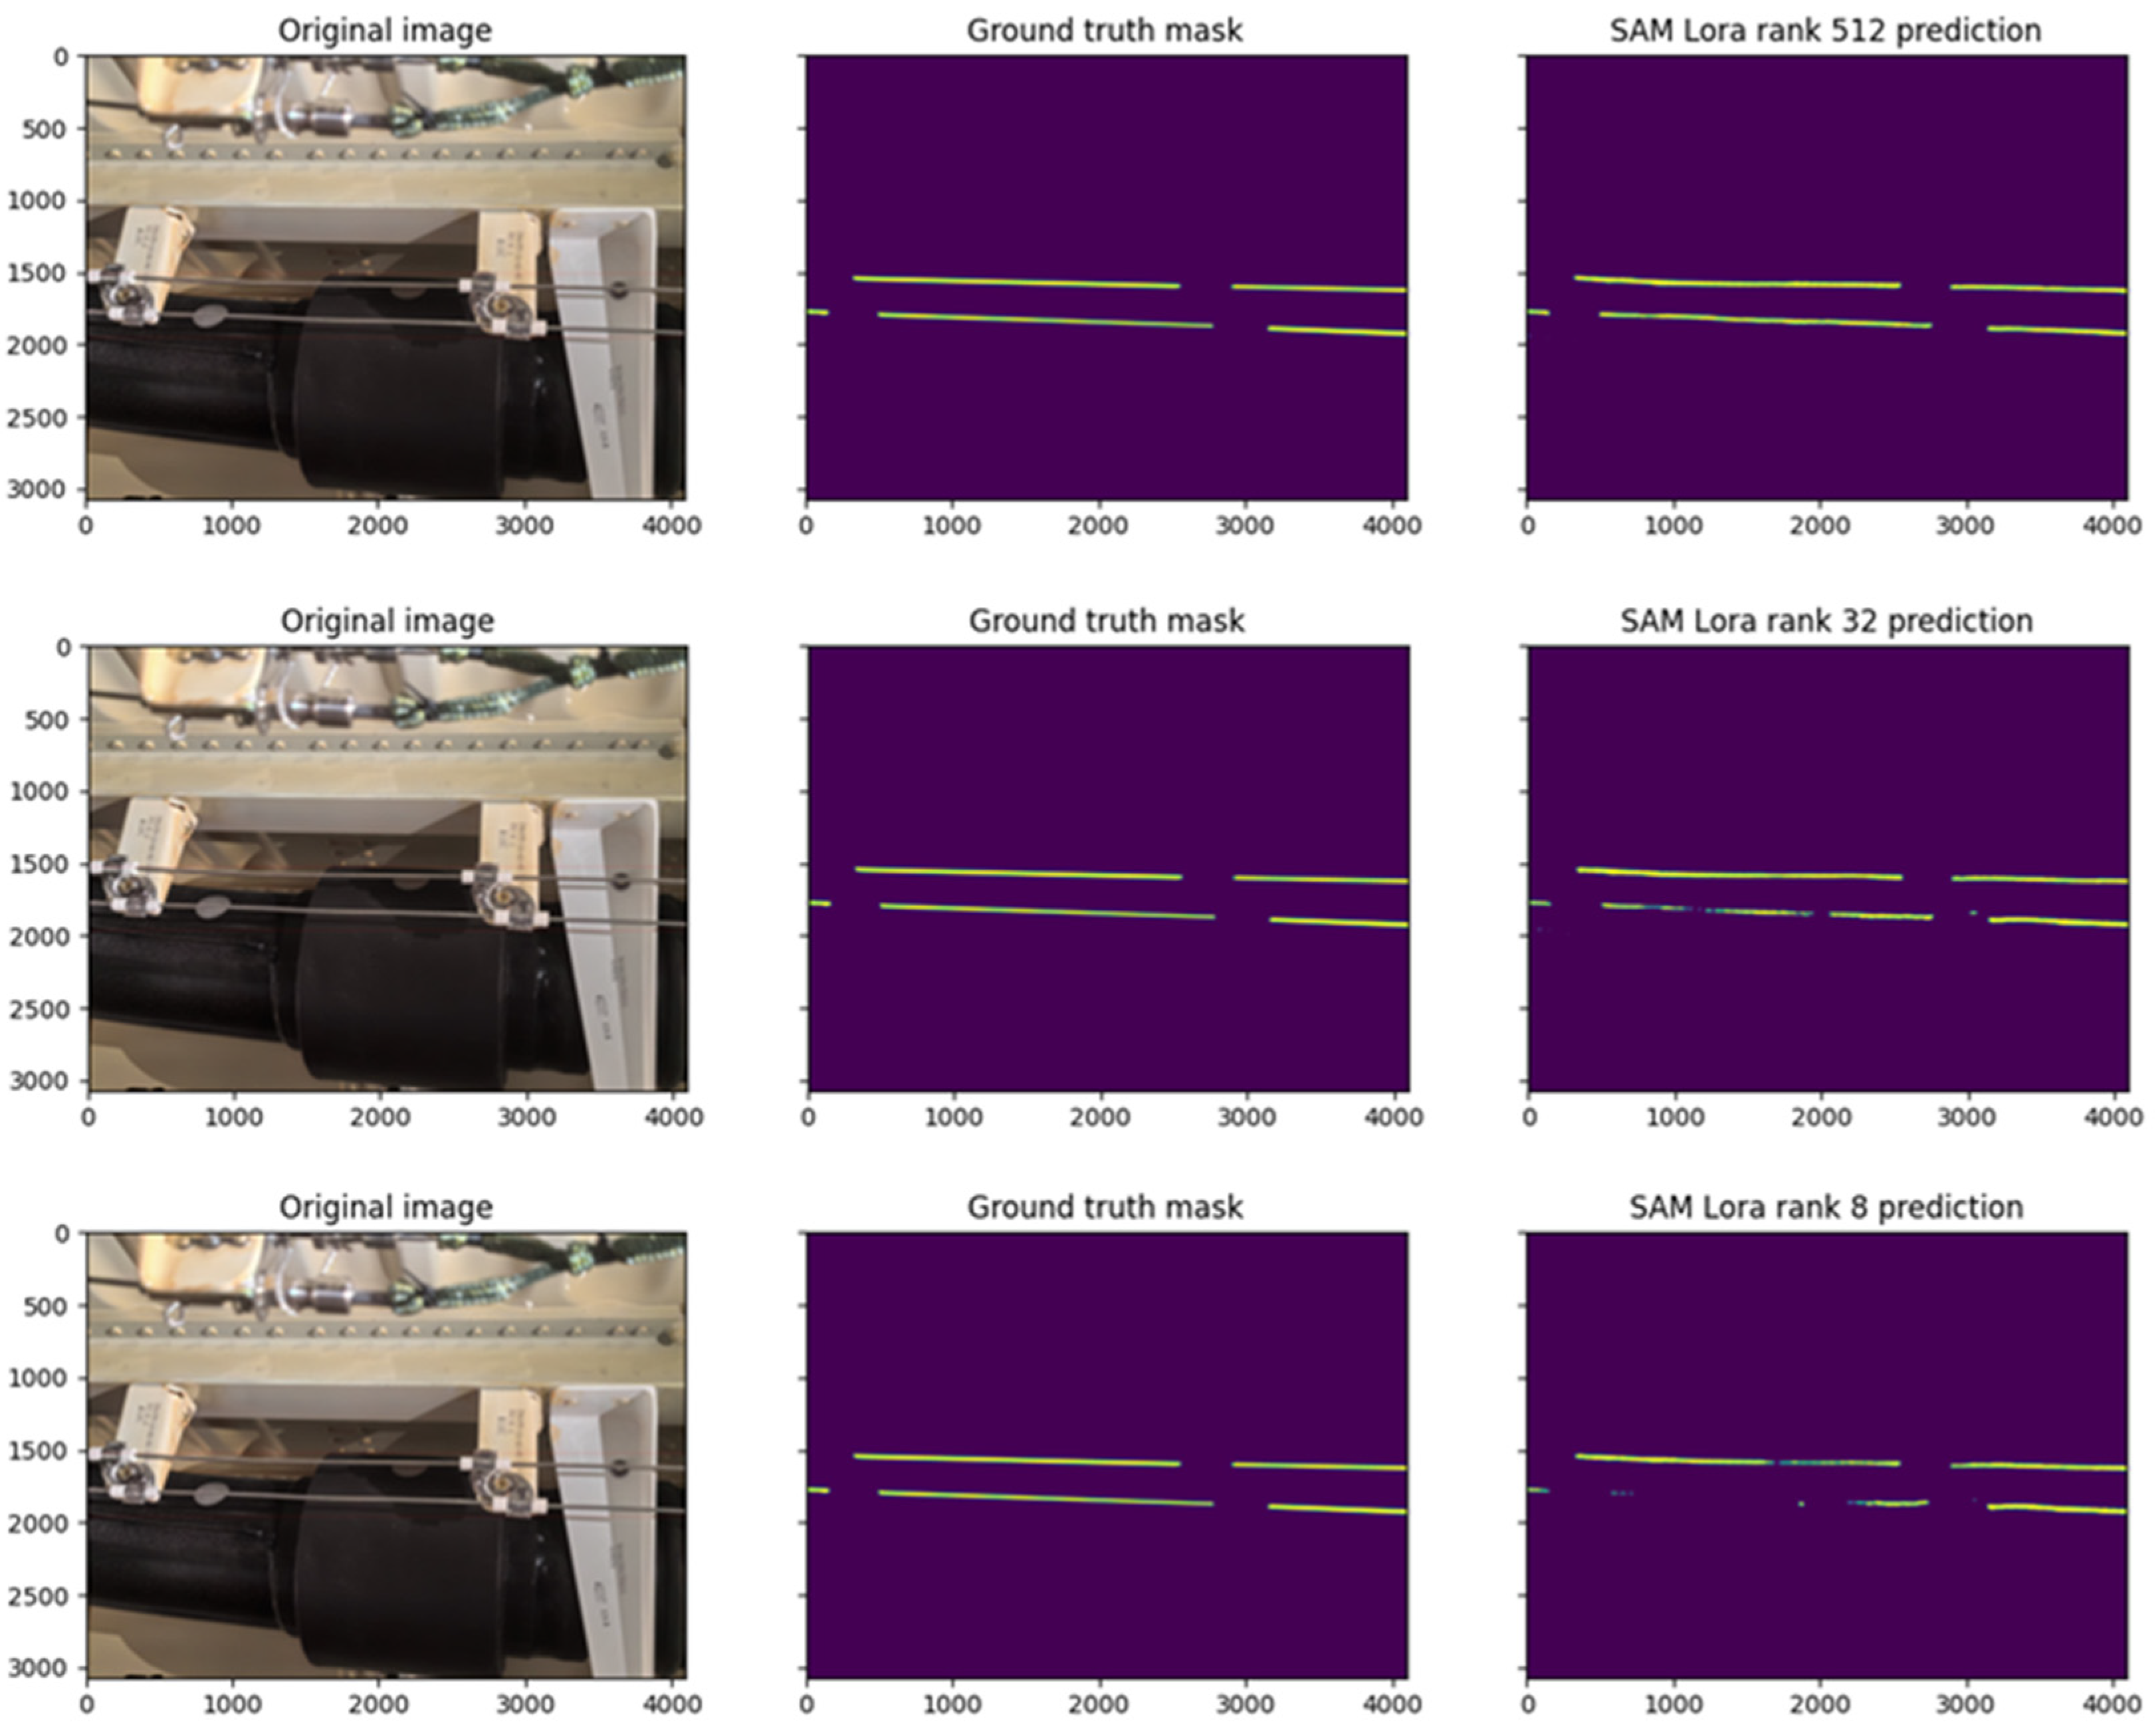
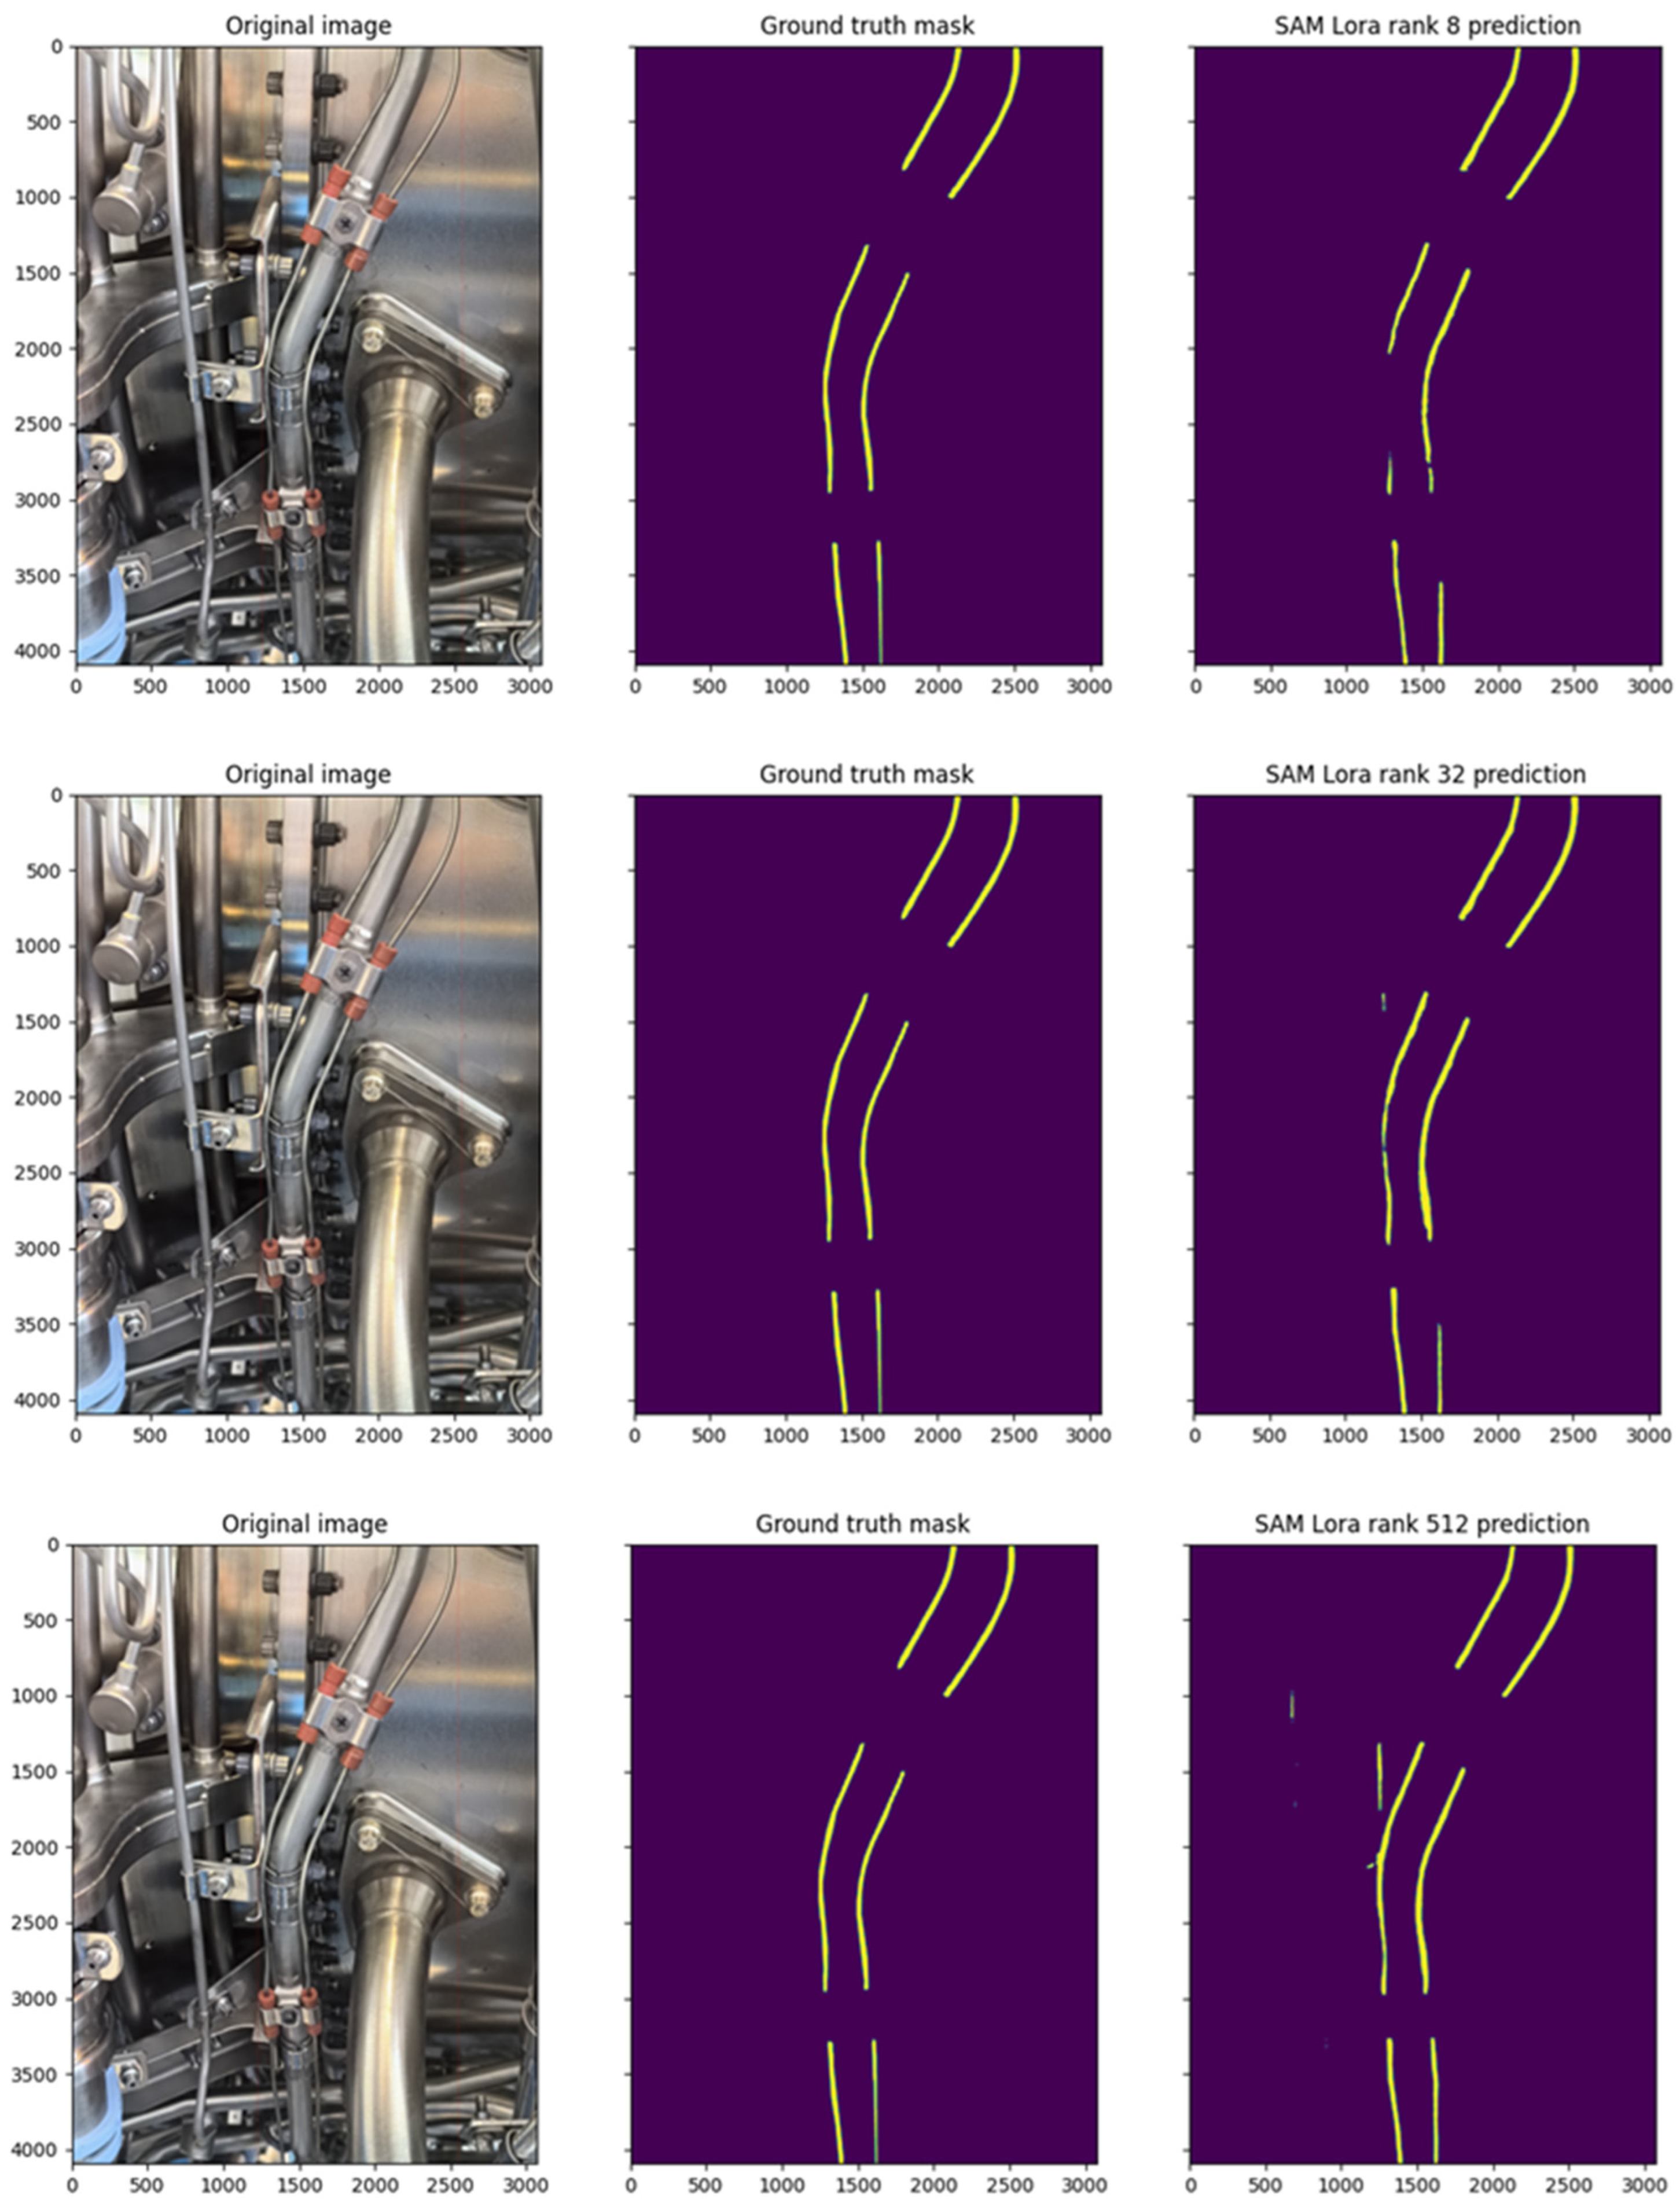
The influence of different LoRA ranks and SAM weights on the model is studied through experiments, which provides a new reference for the wide application of SAM in the field of image segmentation and detection of aircraft parts.
2. Materials and Methods
2.1. SAM
The core technology of the Segment Anything Model (SAM) draws on Transformer, whose self-attention mechanism allows models to capture long-distance dependencies, which is particularly important for understanding complex visual scenes and fine-grained segmentation tasks. At the beginning of SAM design, SAM is able to learn rich visual patterns through large-scale and diversified datasets and conduct zero-sample migration on unseen data distributions and tasks, which makes SAM the basic model for other visual tasks.
The SAM core consists of three parts: image encoder, prompt encoder, and mask decoder. The image encoder uses a Vision Transformer (ViT) to transform the input image into a high-dimensional feature vector or image encoding. The prompt encoder processes different types of input prompts, enabling it to guide the model in producing a segmentation mask. The mask decoder efficiently generates the segmentation mask of the target object based on the input image encoding and prompt encoding.
However, for private datasets like aircraft part images, SAM requires either global or local fine-tuning to learn its unique textures and features. Although there is no case in the field of aircraft parts, MedSAM uses 1,570,263 image mask pairs to fine-tune SAM globally in the field of medical imaging. The model performs 150 training [
22] tasks on 20 A100 (80 G) GPUs. Such training costs are not affordable for aircraft manufacturing and maintenance enterprises. Therefore, this paper studies the SAM local fine-tuning method with more industrial utility.
2.2. LoRA
Low-Rank Adaptation (LoRA) can efficiently customize pre-trained large models. It is originally applied to the diffusion model or language model. It has trained a few parameters, retains complete fine-tuning performance, accelerates the training speed, and greatly reduces the size of the weights. Recently, it has become one of the preferred methods for customized AI models. LoRA allows the indirect training of some dense layers in the neural network by optimizing the low-rank decomposition matrix of dense layers varying during debugging, which keeps the pre-trained weight frozen [
25].
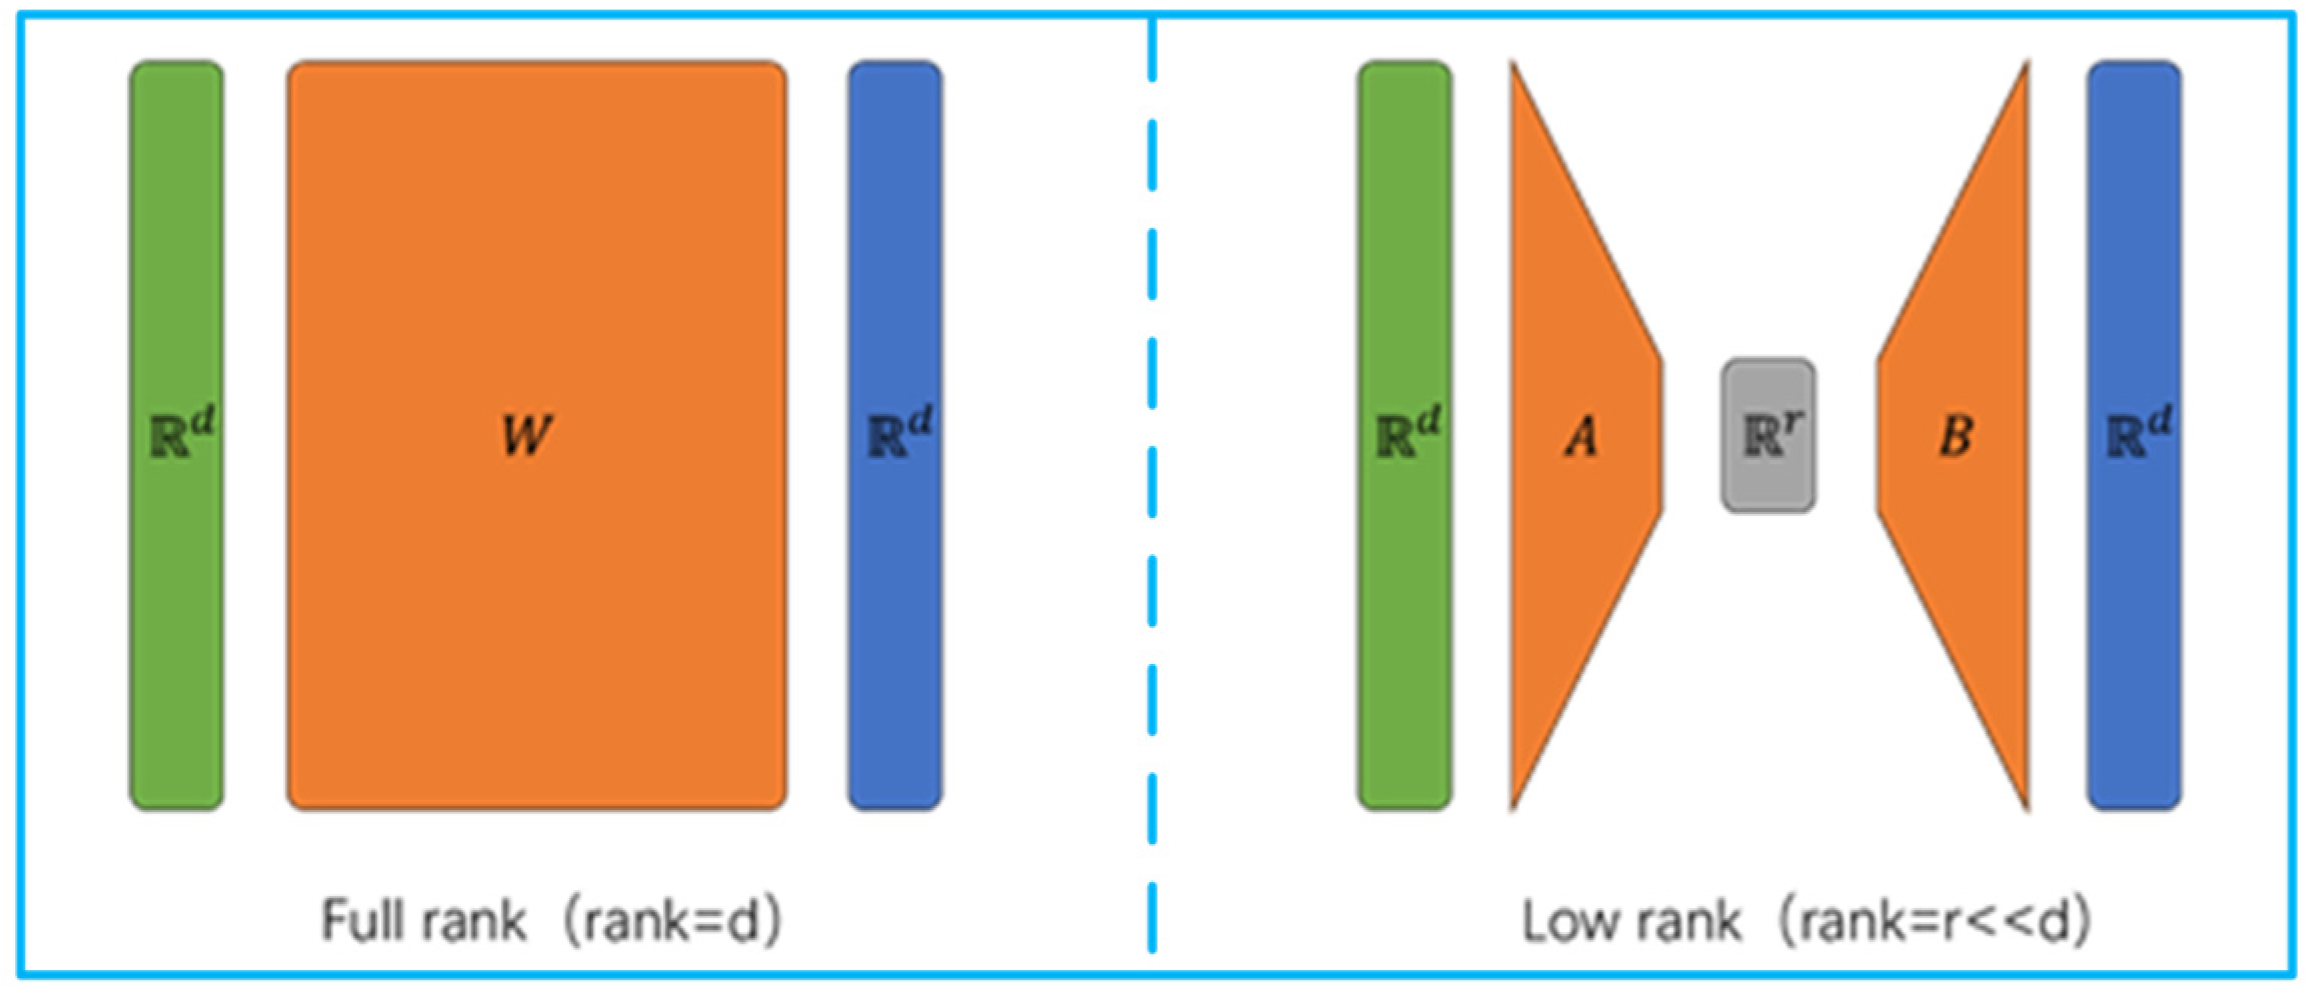
As shown in
Figure 1, a matrix
d ×
d can represent any linear transformation in a vector space of dimension
d. First, the transformation is converted from
Rd to
Rr(where
r ≪
d), and then it is converted back to
Rd. Through this process, the number of parameters is reduced from
d ×
d to 2 ×
d ×
r. Theoretically, LoRA can be applied to all models by using matrix multiplication. The effect of LoRA on the fine-tuning of the model can be improved by adjusting
r and other methods. Based on the above principles, LoRA can be extended to the field of machine vision. By injecting a trainable low-rank decomposition matrix into each layer of the Transformer architecture, the weight of the pre-trained model is unchanged, and the number of parameters that need to be trained during fine-tuning is significantly reduced. The trainable matrix is merged with frozen weights during deployment, so it does not introduce additional inference delays like other add-on modules.
In view of the above characteristics, we can also train multiple LoRA models in parallel in subsequent studies, such as fire detection lines, pipelines, and rivets. Each LoRA performs its task and shares the same underlying model weights. Multiple LoRAs are loaded in RAM simultaneously. Different inputs are fed through different LoRA models to build agents adapted to multiple aircraft parts image segmentation tasks.
2.3. Model Structure
This paper proposes the ASAM model. Based on SAM, it applies mature image encoders, prompt encoders, and a LoRA fine-tuning scheme for the mask decoder and innovatively proposes a fusion loss function. For the image encoder, all parameters of the SAM are frozen, and the image features of the custom dataset are compressed and projected to the same dimension as the SAM output by introducing the frozen SAM parameters. The original SAM points, boxes, masks, and text prompts were discarded, and the encoder was prompted to use the automatic segmentation mode uniformly. All parameters in the SAM mask decoder are frozen by using the same mode. Fine-tuning is performed by using LoRA. For the segmentation head of SAM, since the target task only requires distinguishing between the background and the fire detection line, the segmentation head is simplified by removing the ambiguity setting that allows SAM to output multiple segmentation masks.
2.4. Image Encoder
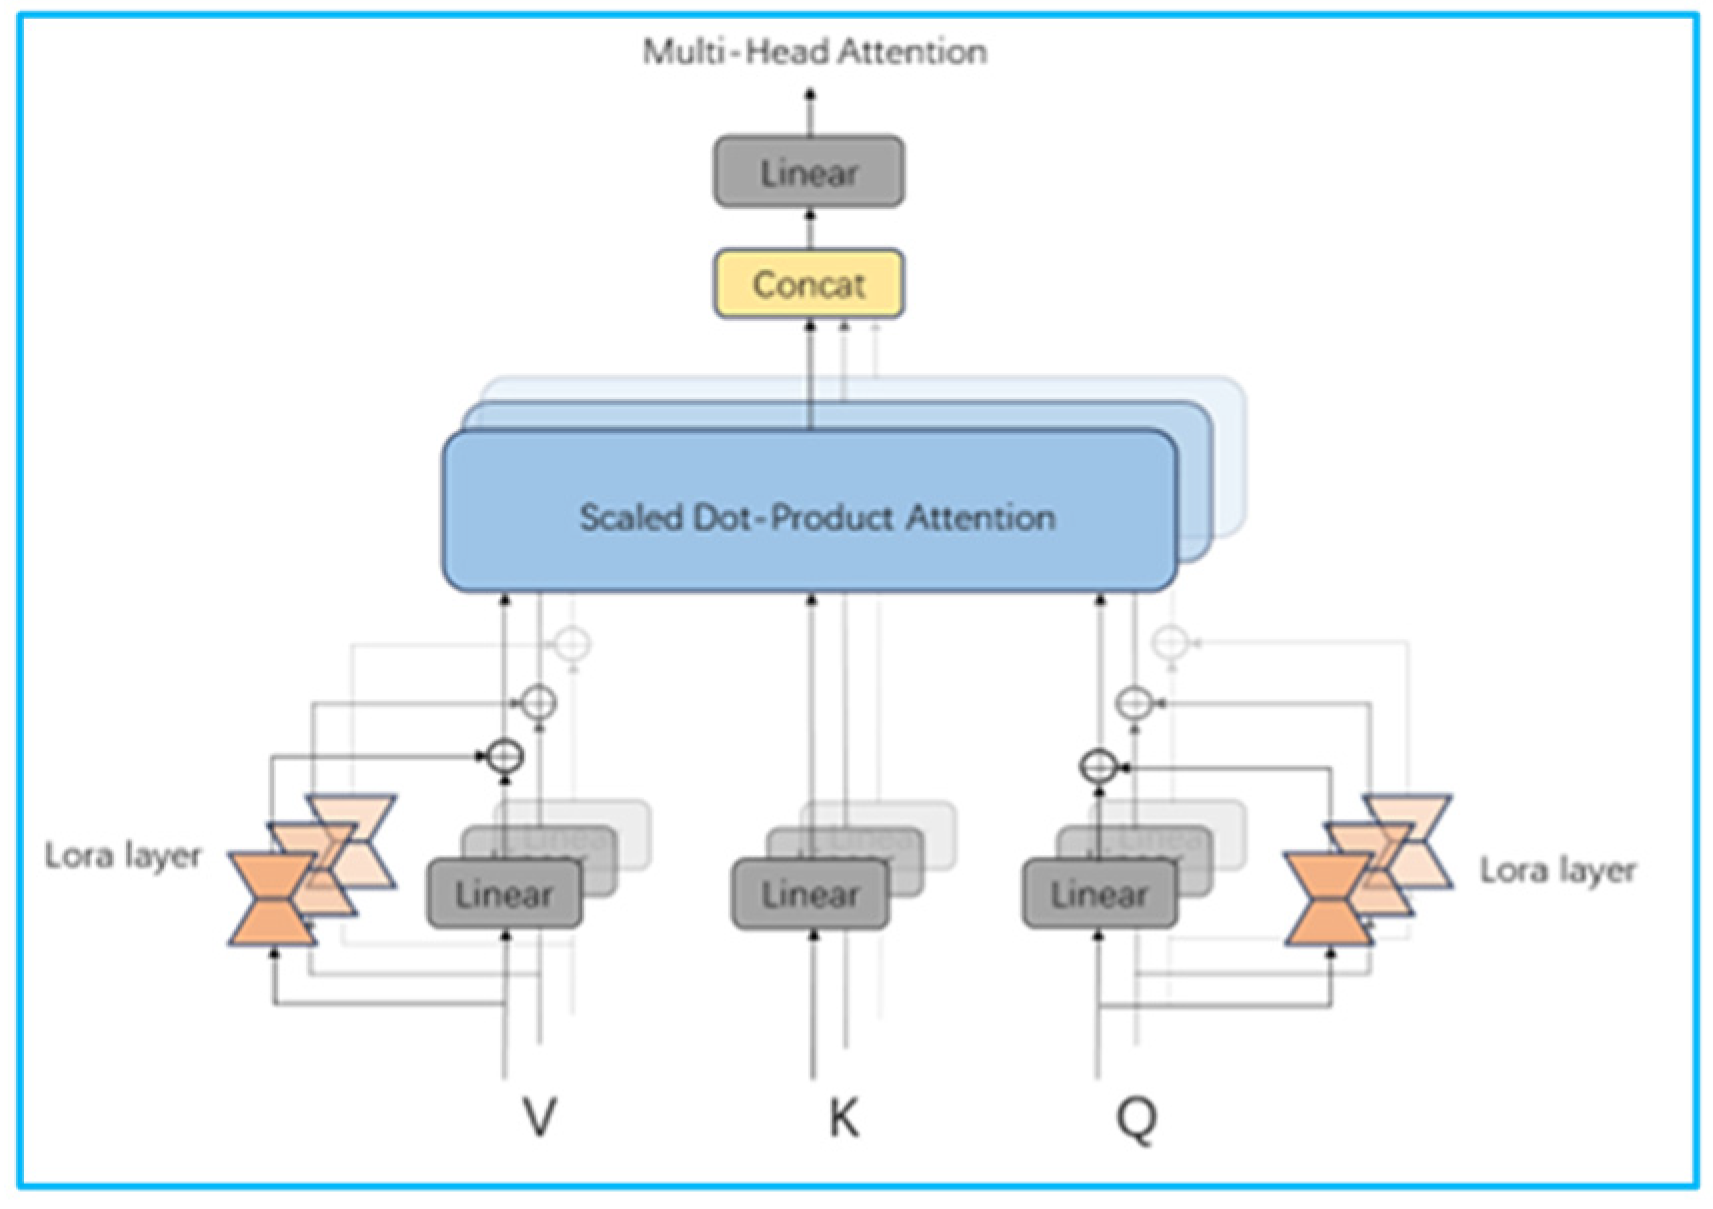
Referring to the method in the LoRA paper [
20], LoRA can adjust Wq, Wv, Wk, or Wo. According to the experimental results in the paper, the benefits obtained by adjusting Wq and Wv are comparable to those obtained by adjusting Wq, Wk, Wv, and Wo. They are greater than the benefits obtained by adjusting Wq. Therefore, to simplify the model, this paper chooses to change the Wq, Wv scheme. The structure of the Multi-Head Attention model after adding LoRA is detailed in
Figure 2. In the figure, an attention function can be described as mapping a query and a set of key-value pairs to an output, where the query, keys, values, and production are all vectors. The output is computed as a weighted sum of the values, where a compatibility function of the query with the corresponding key computes the weight assigned to each value. In practice, we compute the attention function on a set of queries simultaneously, packed together into a matrix Q. The keys and values are also packed together into matrices K and V.
In
Figure 2, value (V), key (K), and query (Q) are projected to a low dimension h times. Then, the attention function of h times is performed. Finally, the output is combined and then projected back to obtain the final output. During the process, the LoRA bypass is added to V and Q.
where
,
,
,
.
= 8 is chosen, because = 512, = = = 64.
For the given F, due to the addition of LoRA layers, V and Q in the above formula are combined with low-rank matrix parameters based on the original SAM parameters. Wq, Wk, and Wv are from the frozen projection layers of SAM, Aq, Bq, Av, and Bv, which are trainable LoRA parameters. The calculation method for the above formula is the same as in the paper [
16].
where
,
,
,
.
2.5. Tip Encoder and Mask Decoder
For the prompt encoder, the auto-segmentation mode is always used, and other prompt modes are removed during the fine-tuning process. For the mask decoder, since the mask decoder of SAM includes a Transformer decoder block and a dynamic mask prediction head, the same LoRA fine-tuning method used for the image encoder is applied to the Transformer decoder block. In contrast, the dynamic mask prediction head is significantly simplified. Since only the mask for the fire detection line needs to be segmented, the category is fixed, and the ambiguity prediction feature of SAM is removed. Analysis shows that this simplification helps improve performance.
2.6. Loss Function
The constructed loss function consists of two parts. For the segmentation task, the traditional Dice loss function is used. On this basis, to optimize the fine-tuned model’s adaptability to the target task (i.e., fire detection line distance detection), a target task loss function is added. The sum of the weights of the two loss functions is used as the total loss function.
2.6.1. Dice Loss Function
The Dice loss function is a loss function based on the Dice coefficient (Sørensen–Dice coefficient), which is widely used in computer vision tasks such as image segmentation and object detection, especially performing well in dealing with datasets with category imbalance characteristics. The purpose of introducing the Dice loss function is to measure the degree of overlap between the prediction mask and the true mask, enabling the model to learn more accurate information.
The Dice coefficient is a measure of the similarity of two sets, which is defined as the size of the intersection of two sets divided by the size of the union. In the second classification problem, it can be expressed as follows:
where TP is the true positive, FP is the false positive, and FN is the false negative.
The Dice loss function minimizes the loss by maximizing the value of the Dice coefficient. Therefore, the Dice loss function is defined as one minus the Dice coefficient:
To avoid division by zero and improve numerical stability, a smoothing term
is added to both the numerator and the denominator:
2.6.2. Loss Function of the Target Task
Since the target task is to calculate the minimum distance between the fire detection lines through the segmentation masks, the ratio of the width of the segmentation masks to the actual width of the fire detection lines is used as a reference during the calculation process. In order to prevent the situation where the mask prediction is good but the mask width and relative distance prediction are poor, the minimum distance between the fire detection lines is recorded during the process of collecting the custom dataset. During training, the minimum distance between the fire detection lines is calculated by using the predefined masks, and the difference between this calculated distance and the recorded true minimum distance is used as part of the total loss function to optimize the model’s performance on the target task. Because the mask prediction in the early training stage is relatively rough, it is meaningless to introduce the target task loss function. Therefore, when the training is 50%, the target task loss function is introduced. The total loss function is
In this study, hyper-parameters λ1 and λ2 are set to 0.5. Although this method is demonstrated with the task of measuring the minimum distance between fire detection lines, it is of universal applicability. Additionally, Distance Loss can be adjusted or replaced to suit different target tasks. The calculation method for Distance Loss used in this paper is as follows.
Curve width measurement is widely used in the field of traditional machine vision. Because this curve is usually an object with uneven width of road cracks, product scratches, or human tissue, it is generally necessary to identify the contour of the curve and then calculate it based on the contour. The width of the fire detection line is consistent. The algorithm can be appropriately simplified. Because the distance between the fire detection line is introduced into the training iteration process, the simplified algorithm also helps to reduce the computational overhead.
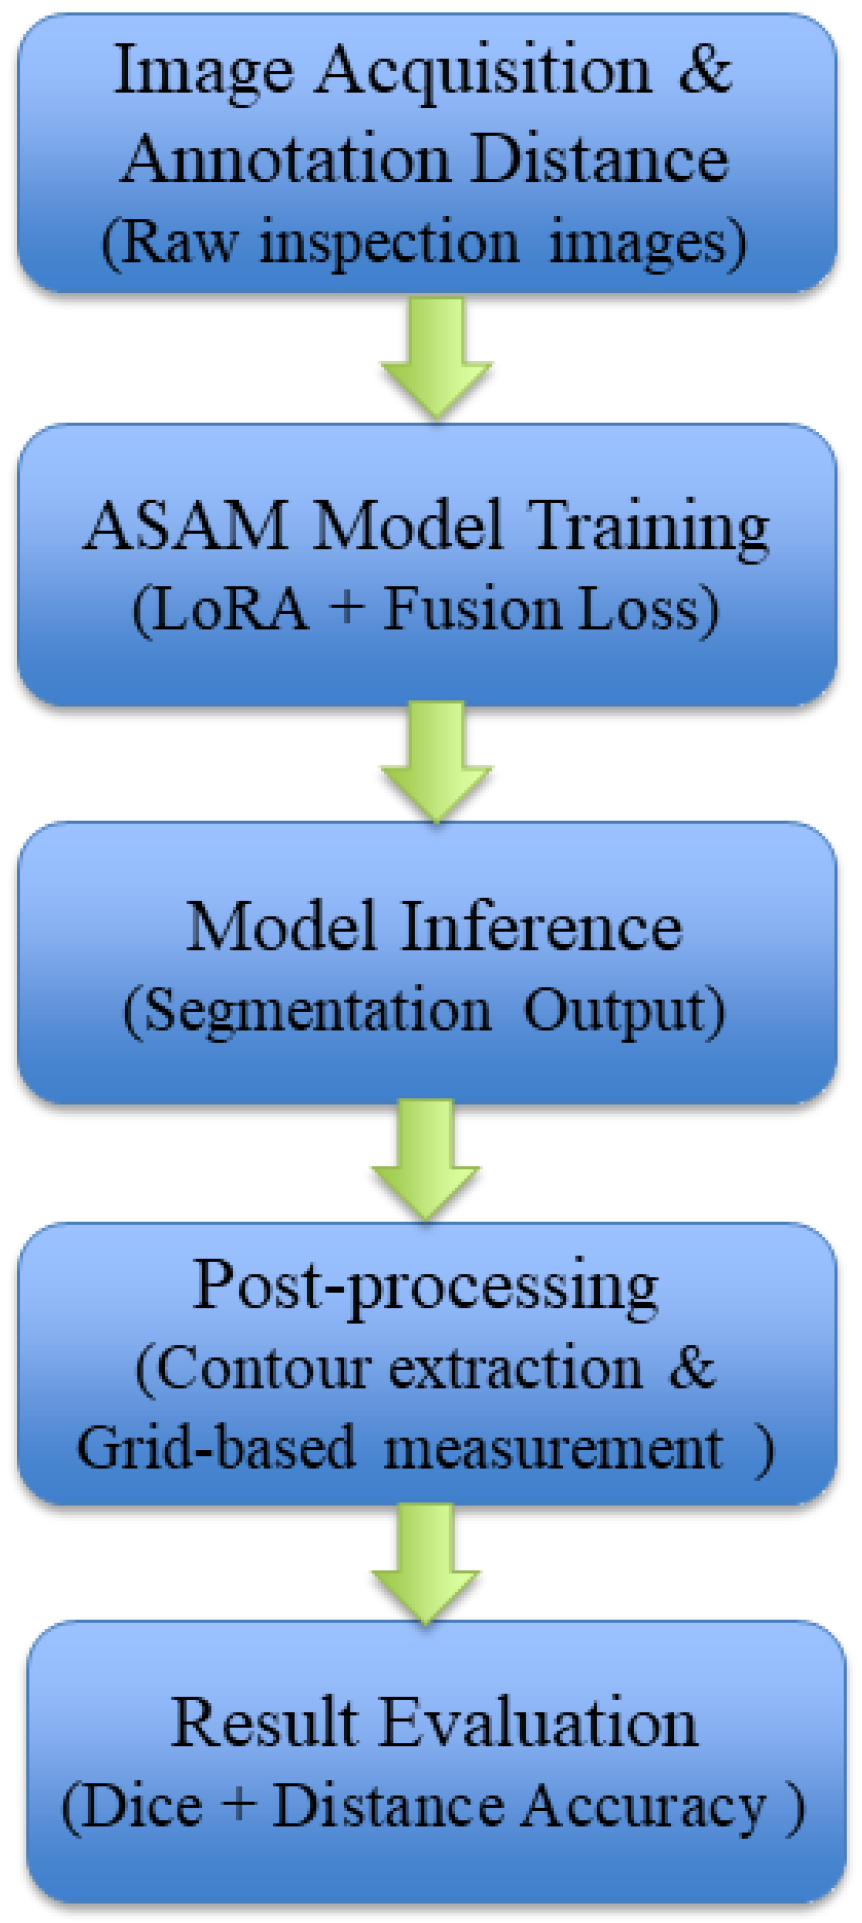
The overall workflow of the proposed method is illustrated in
Figure 3, including image acquisition, annotation and supervision preparation, LoRA-based SAM fine-tuning with fusion loss, segmentation inference, post-processing for distance calculation, and final evaluation.
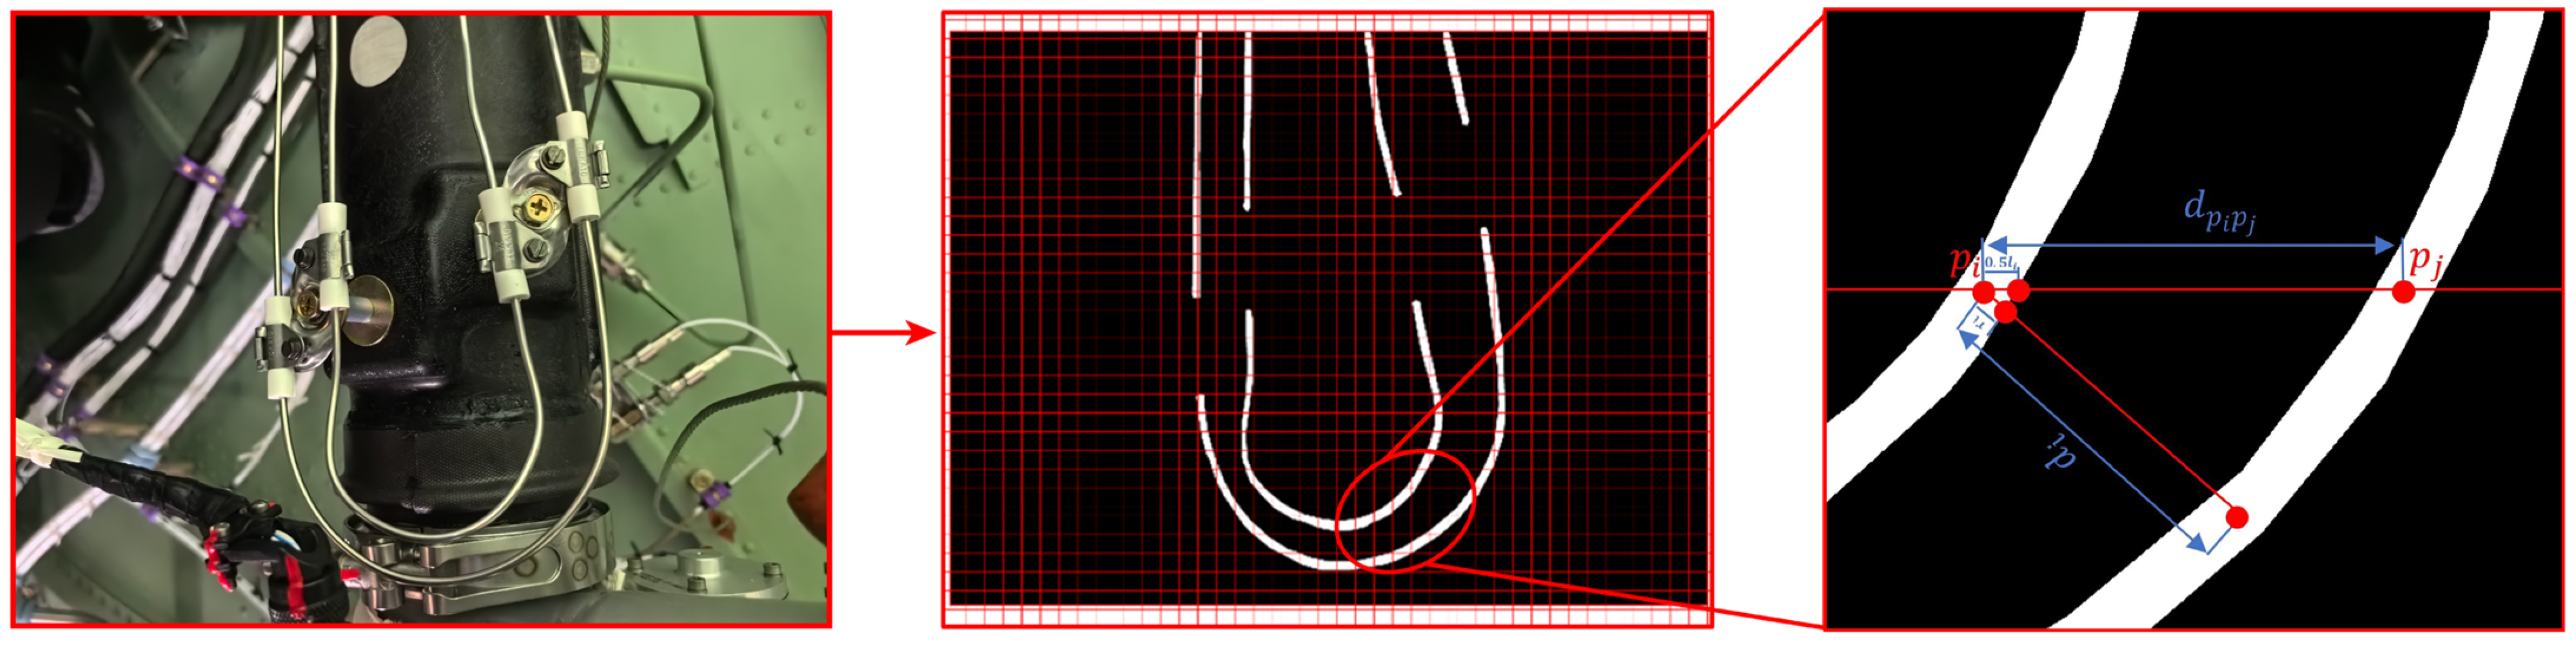
As shown in
Figure 4, after denoising the mask image, uniform grid lines
are drawn. The pixel lengths
of the line segments where the grid lines intersect with the mask, the midpoint coordinates
, and the pixel distances
from
to the nearest black pixel are calculated.The pixel width of the fire detection line is
. If
and
are on the same initially drawn grid line but in different connected components of the mask, then the pixel distance between the fire detection lines at
is
, where
is the distance from
to
. When
is sufficiently large, the minimum pixel distance between the fire detection lines is
. Since some segments
and
are discarded because they are in the same connected component, the result is
. Since the true width
of the fire detection lines is known, the minimum true distance between the fire detection lines is
, defined as follows:
where
Drecord is the minimum distance between the fire detection lines recorded for each image in the collected dataset.
3. Results
3.1. Dataset Introduction
To investigate the fine-tuning capability of the model on small-scale datasets, we constructed a relatively small custom dataset. The training set consists of 400 images, including 100 images each from the engine bay, APU bay, EE bay, and cargo hold, with 25% of the images used for validation during training. The test set contains 100 images, with 25 images from each of the same four compartments, which collectively represent the typical environments where aircraft fire detection lines are located. All images were captured under natural lighting conditions, from a human inspector’s perspective, perpendicular to the plane formed by the two fire detection lines. Interactive annotations were performed using EISeg, and standard data augmentation techniques were applied.
Unlike conventional datasets, our dataset is task-specific. During the image acquisition process, we applied standard inspection procedures to measure the minimum distance between the fire detection lines within the camera’s field of view. These measurements were recorded alongside each image. In the subsequent training process, the recorded minimum distance was used as part of the input to the fusion loss function. During testing, in addition to computing the Dice coefficient for segmentation accuracy, the model’s accuracy in estimating the minimum distance between the fire detection lines was also evaluated. This design enhances the model’s applicability to the target task.
3.2. Experimental Results
Training of ASAM is conducted on an RTX 4090 and uses OpenMMLab’s MMSegmentation. It is compared with classic semantic segmentation algorithms, including UNet, SegFormer, PSPNet, K-Net, Fast-SCNN, and DeepLabV3. To ensure fairness, the same loss function is used, and the epoch is set to 50. Among them, UNet, SegFormer, PSPNet, Fast-SCNN, and DeepLabV3+ fail to segment the fire detection line mask on the custom dataset. We qualitatively analyze the reason, as the custom dataset images have relatively elongated features, and the dataset is small, which prevents these models from learning effective features. Among these models, only K-Net was able to generate valid segmentation masks on this task, making it the only operational baseline model in our experiments. We compare the Dice coefficients and the accuracy of the minimum distance between the fire detection lines for ASAM and K-Net, both when trained with only and when trained with the fusion loss function. ASAM uses the sam_vit_b weights and r = 512. K-Net uses the swin_large weights.
The accuracy of the minimum distance between the fire detection lines for the target task, denoted as A, is defined by Equation (10). The experimental results are detailed in
Table 1.
As shown in
Table 1, the use of a fused loss function that includes the target task loss function has a minimal impact on the model’s segmentation performance. Still, it significantly improves the accuracy of the minimum distance measurement between the fire detection lines. This provides insights for applying machine vision models to various domain tasks, emphasizing not only the model’s segmentation performance but also considering the application effects on the final target task during the training stage.
5. Conclusions
Based on SAM, a LoRA fine-tuning model, ASAM, is constructed for image segmentation of aircraft parts. An innovative fusion loss function has been proposed to enhance the model’s applicability to the target task. Taking the fire detection line as an example, a custom dataset is formed through collection and annotation. Experiments are conducted to compare the performance of the proposed model with K-Net quantitatively. The robustness of the model is also qualitatively analyzed. Meanwhile, the effects of different SAM weights and ranks on model performance are discussed from both quantitative and qualitative aspects to support subsequent deployment inference.
Given that fire detection lines are elongated and challenging to segment, the proposed ASAM model demonstrates a certain level of generalization in the field of aircraft component image segmentation. In future work, different LoRA fine-tuning models can be developed for various inspection tasks, enabling input routing within a single batch to construct a unified agent capable of handling multiple segmentation tasks for different aircraft parts. Furthermore, considering the multi-dimensional nature of aircraft inspection tasks, it is also promising to design task-specific fusion loss functions and model architectures to enhance adaptability across diverse application scenarios.
Despite its effectiveness, the proposed method still has several limitations. (1) To accurately calculate the distance between fire detection lines, the input image must be captured from a viewpoint perpendicular to the plane formed by the two lines during inference. (2) The current model does not yet support scenarios involving multiple pairs of fire detection lines in a single image. (3) The segmentation performance may be affected by occlusion from pipelines, shadows, and image overlap, especially in complex environments. Future work will focus on addressing these issues by exploring spatial distance estimation based on multi-view monocular images, as well as developing more advanced image enhancement and denoising techniques. These efforts are expected to improve the model’s robustness and applicability further.


