Article

Thermal–Electrical Optimization of Lithium-Ion Battery Conductor Structures Under Extreme High Amperage Current

1
China Lithium Battery Technology (Luoyang) Co., Ltd., Luoyang 471003, China
2
School of Vehicle and Transportation Engineering, Henan University of Science and Technology, Luoyang 471003, China
3
School of Mechatronics Engineering, Henan University of Science and Technology, Luoyang 471003, China
4
Institute of Materials, Henan Academy of Sciences, Zhengzhou 450002, China
*
Author to whom correspondence should be addressed.
Appl. Sci. 2025, 15(10), 5338; https://doi.org/10.3390/app15105338 (registering DOI)
Submission received: 16 March 2025 / Revised: 23 April 2025 / Accepted: 2 May 2025 / Published: 10 May 2025
(This article belongs to the Section Applied Thermal Engineering)

Abstract

:
This study addresses the critical challenges of conductor structure fusing, thermal management failure, and thermal runaway risks in lithium-ion batteries under extreme high-amperage discharge conditions. By integrating theoretical analysis, multiphysics coupling simulations, and experimental validation, the research systematically investigates the overcurrent capability of lithium battery conductor structures. A novel current–thermal structure coupled finite element model was developed to analyze the dynamic relationship between key parameters, specifically overcurrent cross-sectional area and contact area, and their influence on temperature gradient distribution. Experimental results confirm the model’s accuracy, revealing that under extreme high-amperage conditions, increasing the conductor cross-sectional area by 50% only marginally extends the battery’s current-carrying duration from 0.75 s to 0.8 s. This limited enhancement is attributed to rapid heat generation, which restricts the effectiveness of increasing the cross-sectional area alone. Instead, optimizing the conductor structure by modifying the heat conduction path, which involves a similar increase in the cross-sectional area and an additional 60% increase in contact area through the addition of a welding reinforcement structure, achieves thermal equilibrium. The optimized design achieves a current-carrying duration of 1.73 s, which is 230% of the duration of the traditional configuration. This work establishes a scalable framework for enhancing the thermal–electrical performance of lithium-ion batteries, providing a theoretical foundation for structural optimization and offering significant methodological support for advancing research in high-power battery design, with potential applications in electric vehicles, renewable energy systems, and industrial robotics.

1. Introduction

Lithium-ion batteries (LIBs) have become the cornerstone of modern energy systems due to their superior energy density, extended cycle life, minimal self-discharge rate, and absence of memory effect [1], powering a wide range of applications, from portable electronics and renewable energy storage, to electric vehicles, ships, and aircraft. These applications are increasingly pushing the boundaries of battery performance, with a particular emphasis on fast-charging capability and high-rate discharging performance. For example, electric vehicles require rapid charging to improve user experience [2], energy storage stations must deliver millisecond-level power for grid frequency regulation [3], and electric marine propulsion systems demand high-current pulse discharges on the kiloampere scale [4]. These demanding scenarios place great stress on the battery’s current-carrying components [5,6,7,8], making the optimization of overcurrent capability a critical technical challenge. Inadequate overcurrent tolerance can result in severe thermal and structural failures [9,10,11] such as localized overheating, internal fusion, and ultimately, thermal runaway.
Enhancing the overcurrent capability of LIBs can be approached from the perspectives of material design and internal structure design [12,13]. On the materials side, numerous efforts have been made to develop active materials with improved electrical and thermal properties. Carbon-coated LiFePO4 particles [14,15], ceramic separators [16], optimized electrolytes [17,18], and fast ion-conductive anode materials [19,20,21] have significantly improved rate performance and thermal resilience. Furthermore, phase-change materials have shown promise in enhancing thermal conductivity to maintain the thermal stability of LIBs [22,23]. However, while these material-level innovations have gained widespread attention, relatively few studies have addressed the internal conductor structure (also termed current collector [24]), which is a critical current pathway inside the battery. Despite frequent reports of failure in internal conductor structures during high-current applications, the in-depth research on this issue remains limited. Especially under extreme load conditions, such as those encountered in electric propulsion or fast-charging stations, the internal conductor structure often becomes the weakest link [25], resulting in localized failure. This lack of understanding hinders the development of structurally robust LIBs capable of withstanding the increasing current loads.
High-current operation introduces additional complexity and risk, particularly in thermal management. Elevated current densities accelerate Joule heating, intensify thermal gradients, and increase the likelihood of triggering thermal runaway events. Significant in-plane and through-thickness temperature gradients are observed during a 10 C discharge (200 A) [26], while multiphysics simulations have demonstrated how heat generation and voltage drop become tightly coupled under 5 C to 10 C conditions [27,28,29,30]. In parallel, electrical constraints such as limited internal space and high energy density severely restrict the design flexibility of current-carrying structures, often forcing them to operate near their thermal and electrical failure thresholds. Although recent studies have improved high-rate operation to the hundred-ampere level [31,32,33,34], the kiloampere-level discharge regimes urgently required by next-generation technologies remain largely unexplored. The current lack of understanding in this extreme regime prevents the development of safe, high-power LIBs for future applications.
This study addresses a critical knowledge gap in lithium-ion battery design by systematically investigating the impact of internal conductor structural configurations on overcurrent resilience under ultra-high current conditions (>10 kA). A multiphysics finite element model, coupling electrical and thermal domains, is developed to simulate the time-dependent evolution of temperature and current density during high-current operation. This model is experimentally validated using a custom-designed high-current impulse testing platform, enabling the identification of key failure thresholds and thermoelectric bottlenecks. The findings highlight the importance of conductor geometry and interfacial optimization in mitigating localized heating and enhancing overcurrent capability. This work establishes a physics-informed design framework for optimizing internal conductor structures, offering a new pathway to improve the thermal safety, electrical performance, and structural reliability of LIBs in high-power applications such as grid-scale energy storage and electric transportation.

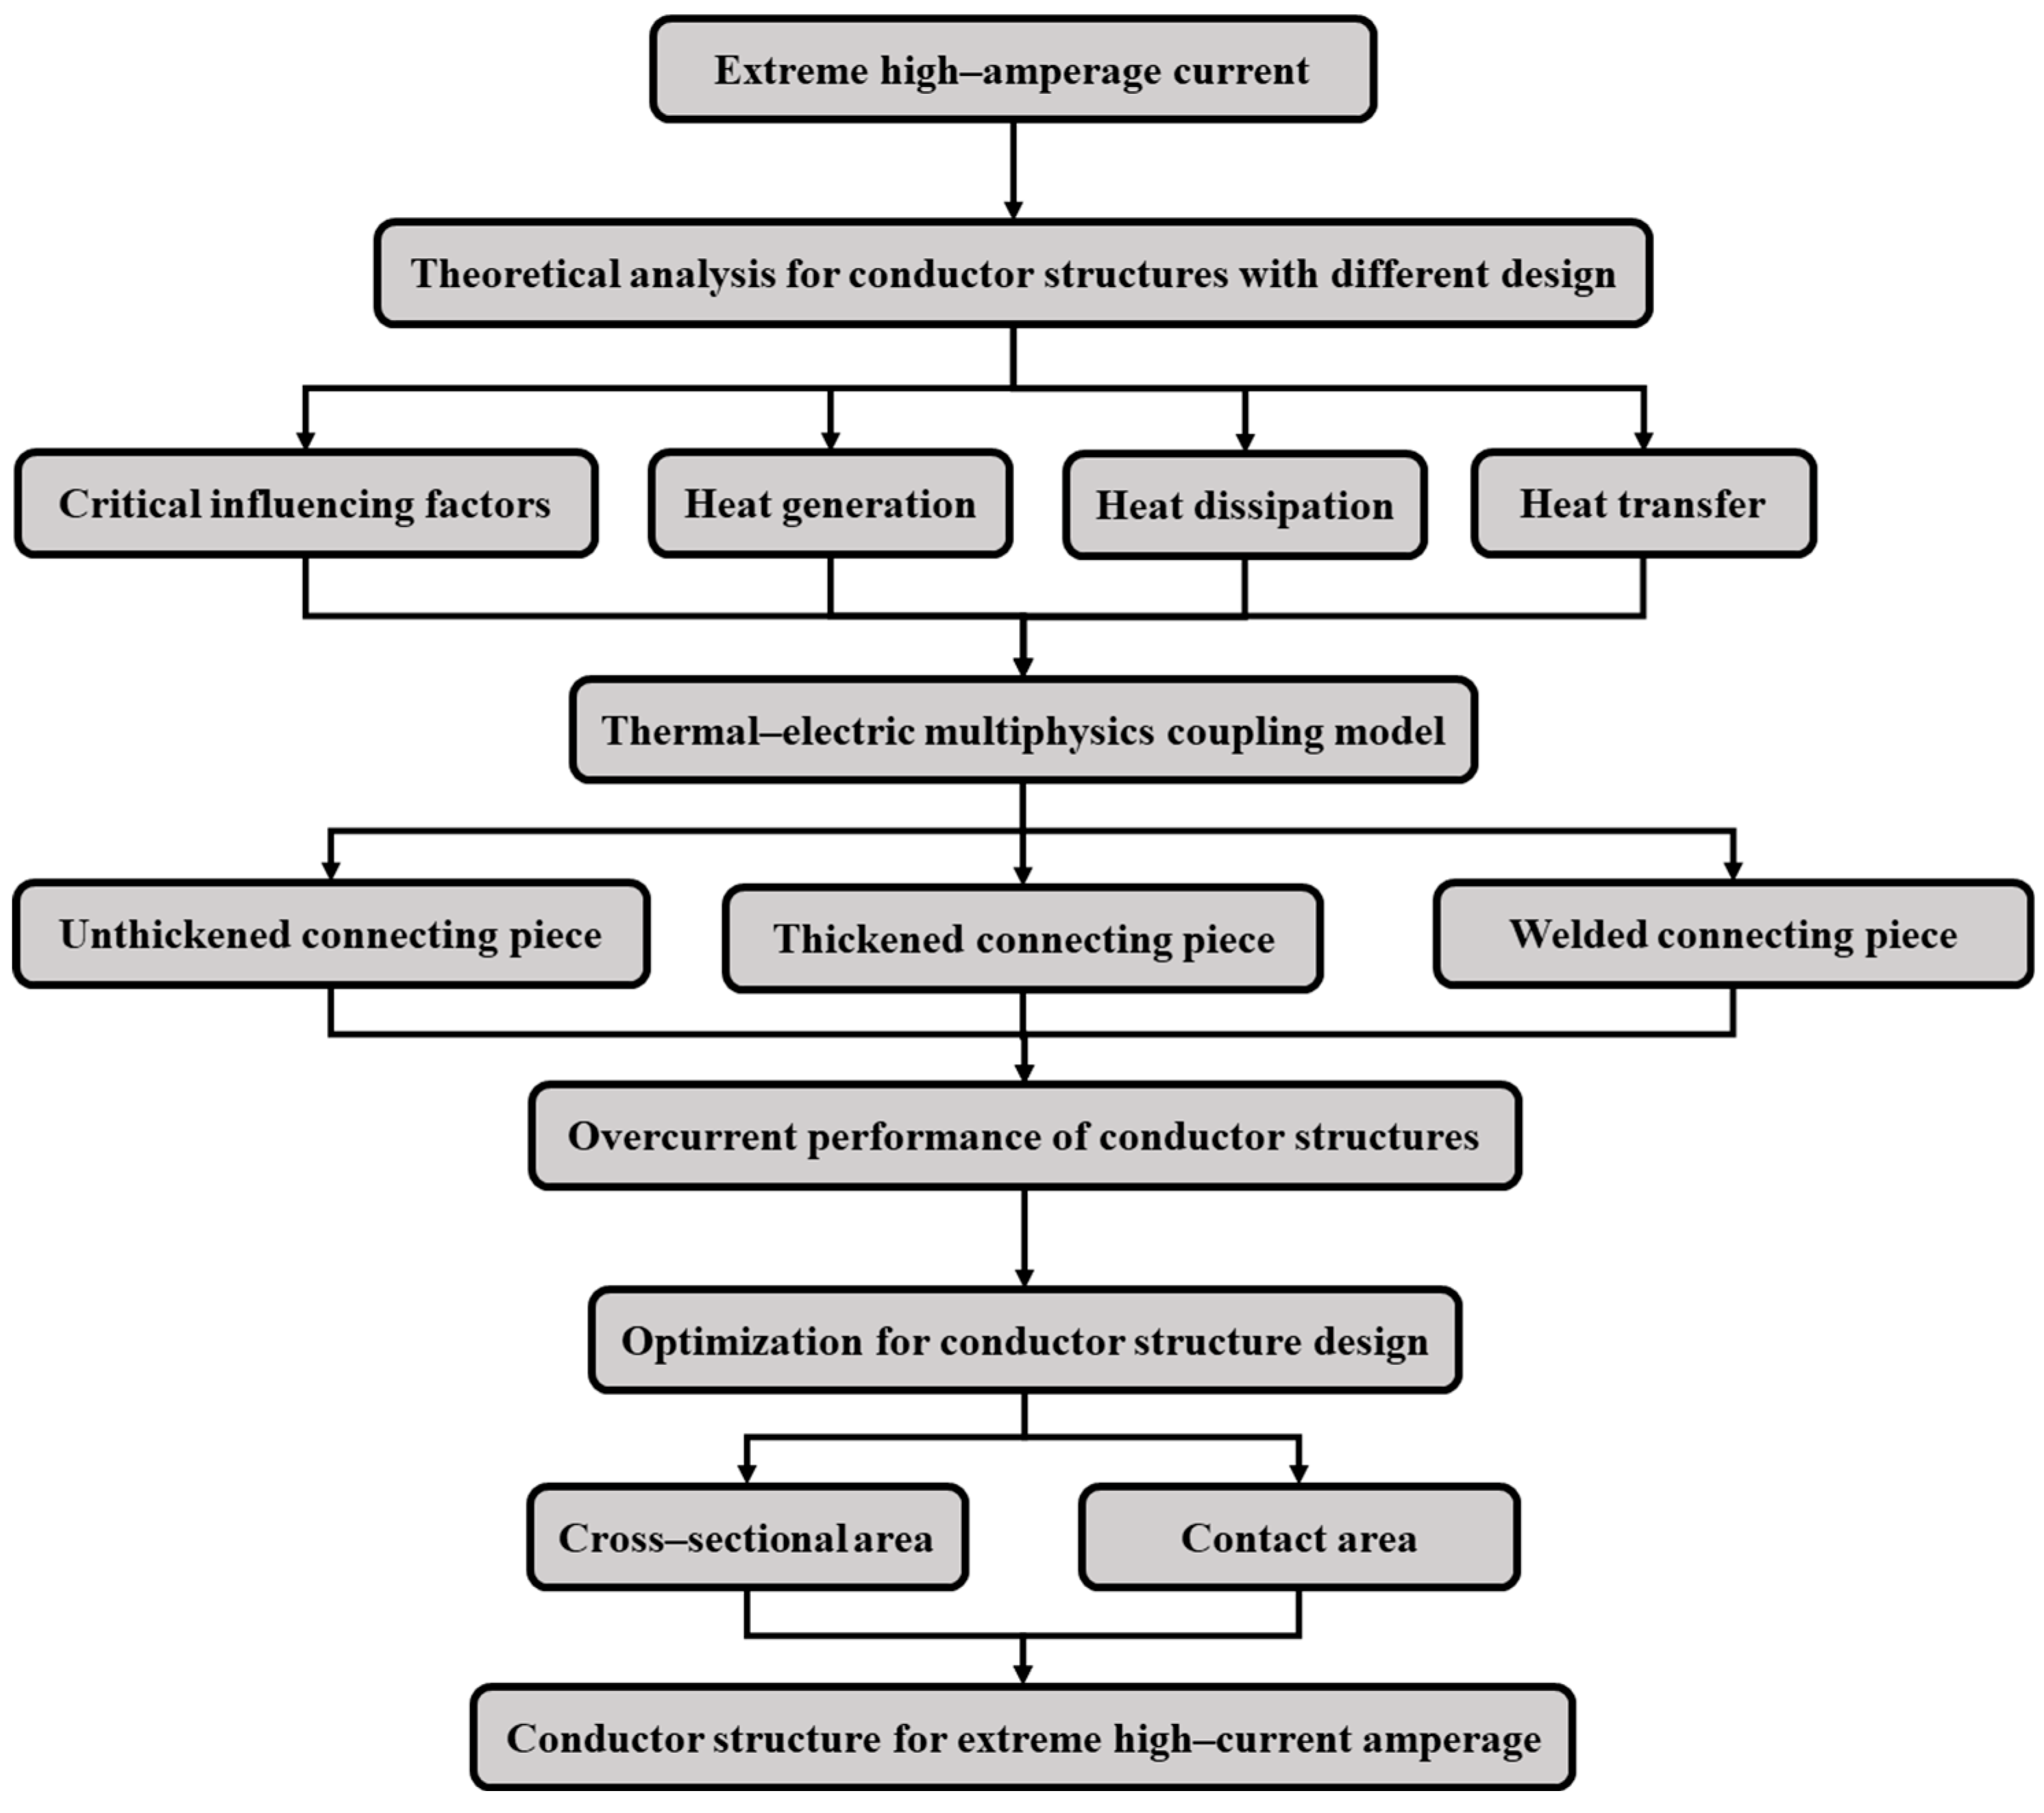
2. Structural Optimization Method with Multiphysical Field Coupling

2.1. Theoretical Basis of Optimization Method

Lithium-ion batteries consist of conductor structures and protective casings, with the conductor structures serving as critical functional units within the battery system. These structures primarily include poles, connecting pieces, and tabs, which facilitate electrical connections between the internal and external circuits of the battery through the cells [35,36]. Among these components, the poles typically feature significant design redundancy, whereas the connecting pieces and tabs are subject to spatial constraints, limiting their design flexibility. This limitation directly impacts the safety margins of battery packs under extreme operating conditions [37]. Therefore, a comprehensive understanding of the heat generation and dissipation mechanisms in conductor structures is essential for optimizing their current-carrying capacity.
(1) Joule heating effect in conductor structures
The primary heat source in conductor structures originates from the Joule heating effect, which occurs when an electric current flows through the material [38]. The dynamic response of this process is governed by the following thermodynamic equation [39]:
Q = C p m T
where C p is the specific heat capacity of the material, m is the mass of the material, and T is the temperature rise on the conductor structures.
(2) Heat generation in conductor structures
According to Joule’s law, when an electric current passes through a conductor, electrical energy is converted into heat [40]. Under a constant current of I , the heat generated within the conductor structures, denoted as Q + , is linearly proportional to the square of the current; the conductor resistance, R ; and the duration of conduction t :
Q + = I 2 R t
When considering a time-dependent current I ( t ) and temperature-dependent resistance R ( T ) under actual operating conditions, the differential expression of Joule heating can be extended to
Q + = I t 2 · ρ τ T · L S d t
where ρ τ ( T ) is the resistivity of the material, L is the length of the conductor structures, and S is its cross-sectional area. By combining Equations (1) and (3), the rate of temperature change in the conductor structures can be expressed as
d T d t = I t 2 R T C p T m = I t 2 ρ τ T · L S C p T ρ L S = ρ τ T C p T ρ · I t 2 S 2
where ρ is the material density.
From Equation (4), it is evident that for a given material, the steady-state temperature rise due to Joule heating is influenced by the current intensity, cross-sectional area of the structural components, and conduction duration. Under fixed current and conduction duration, increasing the cross-sectional area effectively reduces temperature rise.
(3) Heat dissipation in conductor structures
The total heat dissipation Q of the conductor structures comprises internal conduction through the connecting components and convective heat exchange with the environment. The dynamic heat transfer model is expressed as [41]
Q = h S * T t T w t d t = h A c + A w T t T w t d t
where h is the comprehensive convection-conduction heat transfer coefficient and S * represents the effective heat dissipation area, including the mechanical contact area A c (crimp interface) and the welding metallurgical bonding area A w . The transient temperature of the conductor structures is denoted as T ( t ), while T w ( t ) represents the ambient temperature, which includes the temperature of the conduction path (connecting components) and surrounding air.
When the conduction heat transfer coefficient h is constant, a larger mechanical contact area A c and the welding metallurgical bonding area A w enhance heat dissipation efficiency. If the welding area is fixed, increasing the contact area can effectively lower the temperature change rate.
(4) Thermodynamics during current flow
The rate of heat accumulation in the conductor structures follows the principle of energy conservation:
d Q d t = d Q + d t d Q d t = I t 2 R T h A c + A w T t T w t
By combining Equations (1) and (6), the rate of temperature change on the conductor structures can be expressed as
d T d t = ρ τ ( T ) C p ( T ) ρ · I t 2 S 2 h A c + A w T t T w t C p ( T ) m
In summary, Equations (5) and (8) indicate that under constant current I and fixed welding area A w , the current-carrying cross-sectional area S of the structure and the contact area A c between the structures are the key factors influencing the temperature evolution of conductor structures.
(5) Evaluation methodology
As illustrated in Figure 1, the proposed evaluation methodology aims to enhance the current-carrying capacity of lithium-ion batteries and achieve an optimized design for highly efficient conductor structures. This is accomplished through a systematic approach that integrates theoretical derivation, multiphysics coupling finite element analysis (FEA) [42,43,44,45], and experimental validation, all while adhering to high-amperage constraints.
First, theoretical models for heat generation, dissipation, and transfer within conductor structures are established. These models derive the functional relationships between the cross-sectional area of structural components, the contact area, and the resulting temperature variations.
Next, multiphysics coupling simulations are conducted by increasing the thickness of structural components and incorporating reinforced welded structures to enhance structural parameters. This allows for a comprehensive analysis of key factors influencing temperature distribution and thermal behavior within the conductor structures.
Finally, experimental validation is performed to verify the impact of these critical parameters on temperature variation. The experimental results help determine the optimal configuration and material modifications needed to maximize current-carrying efficiency. Through this integrated methodology, the most effective design pathways for optimizing conductor structures are identified.

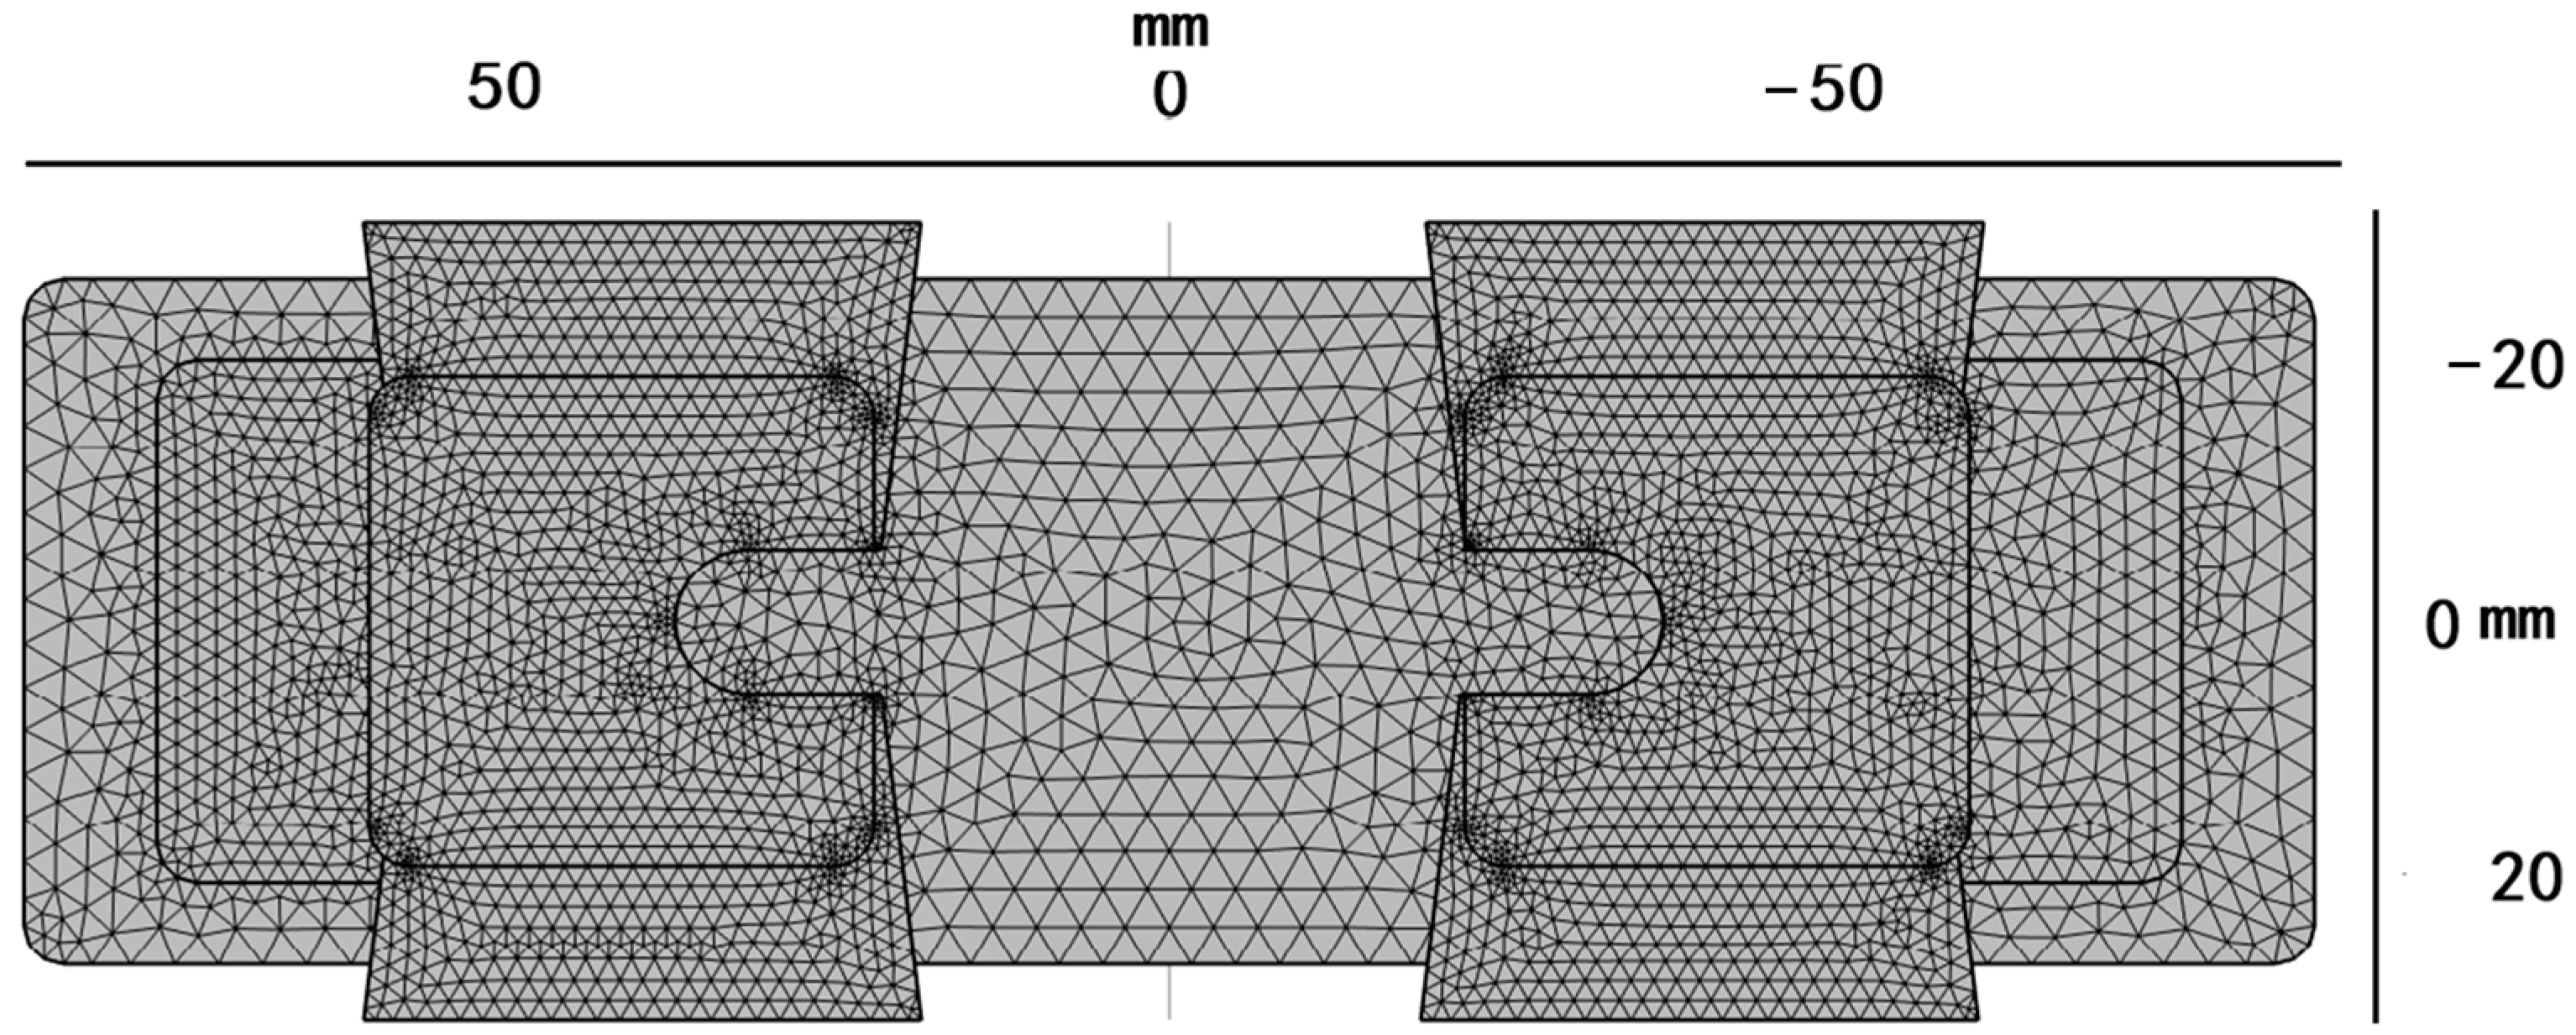
2.2. Finite Element Analysis Method

As illustrated in Figure 2, three experimental configurations are designed:
(a)
Control Group (C0 Group): Unthickened connecting piece and tab, serving as the baseline.
(b)
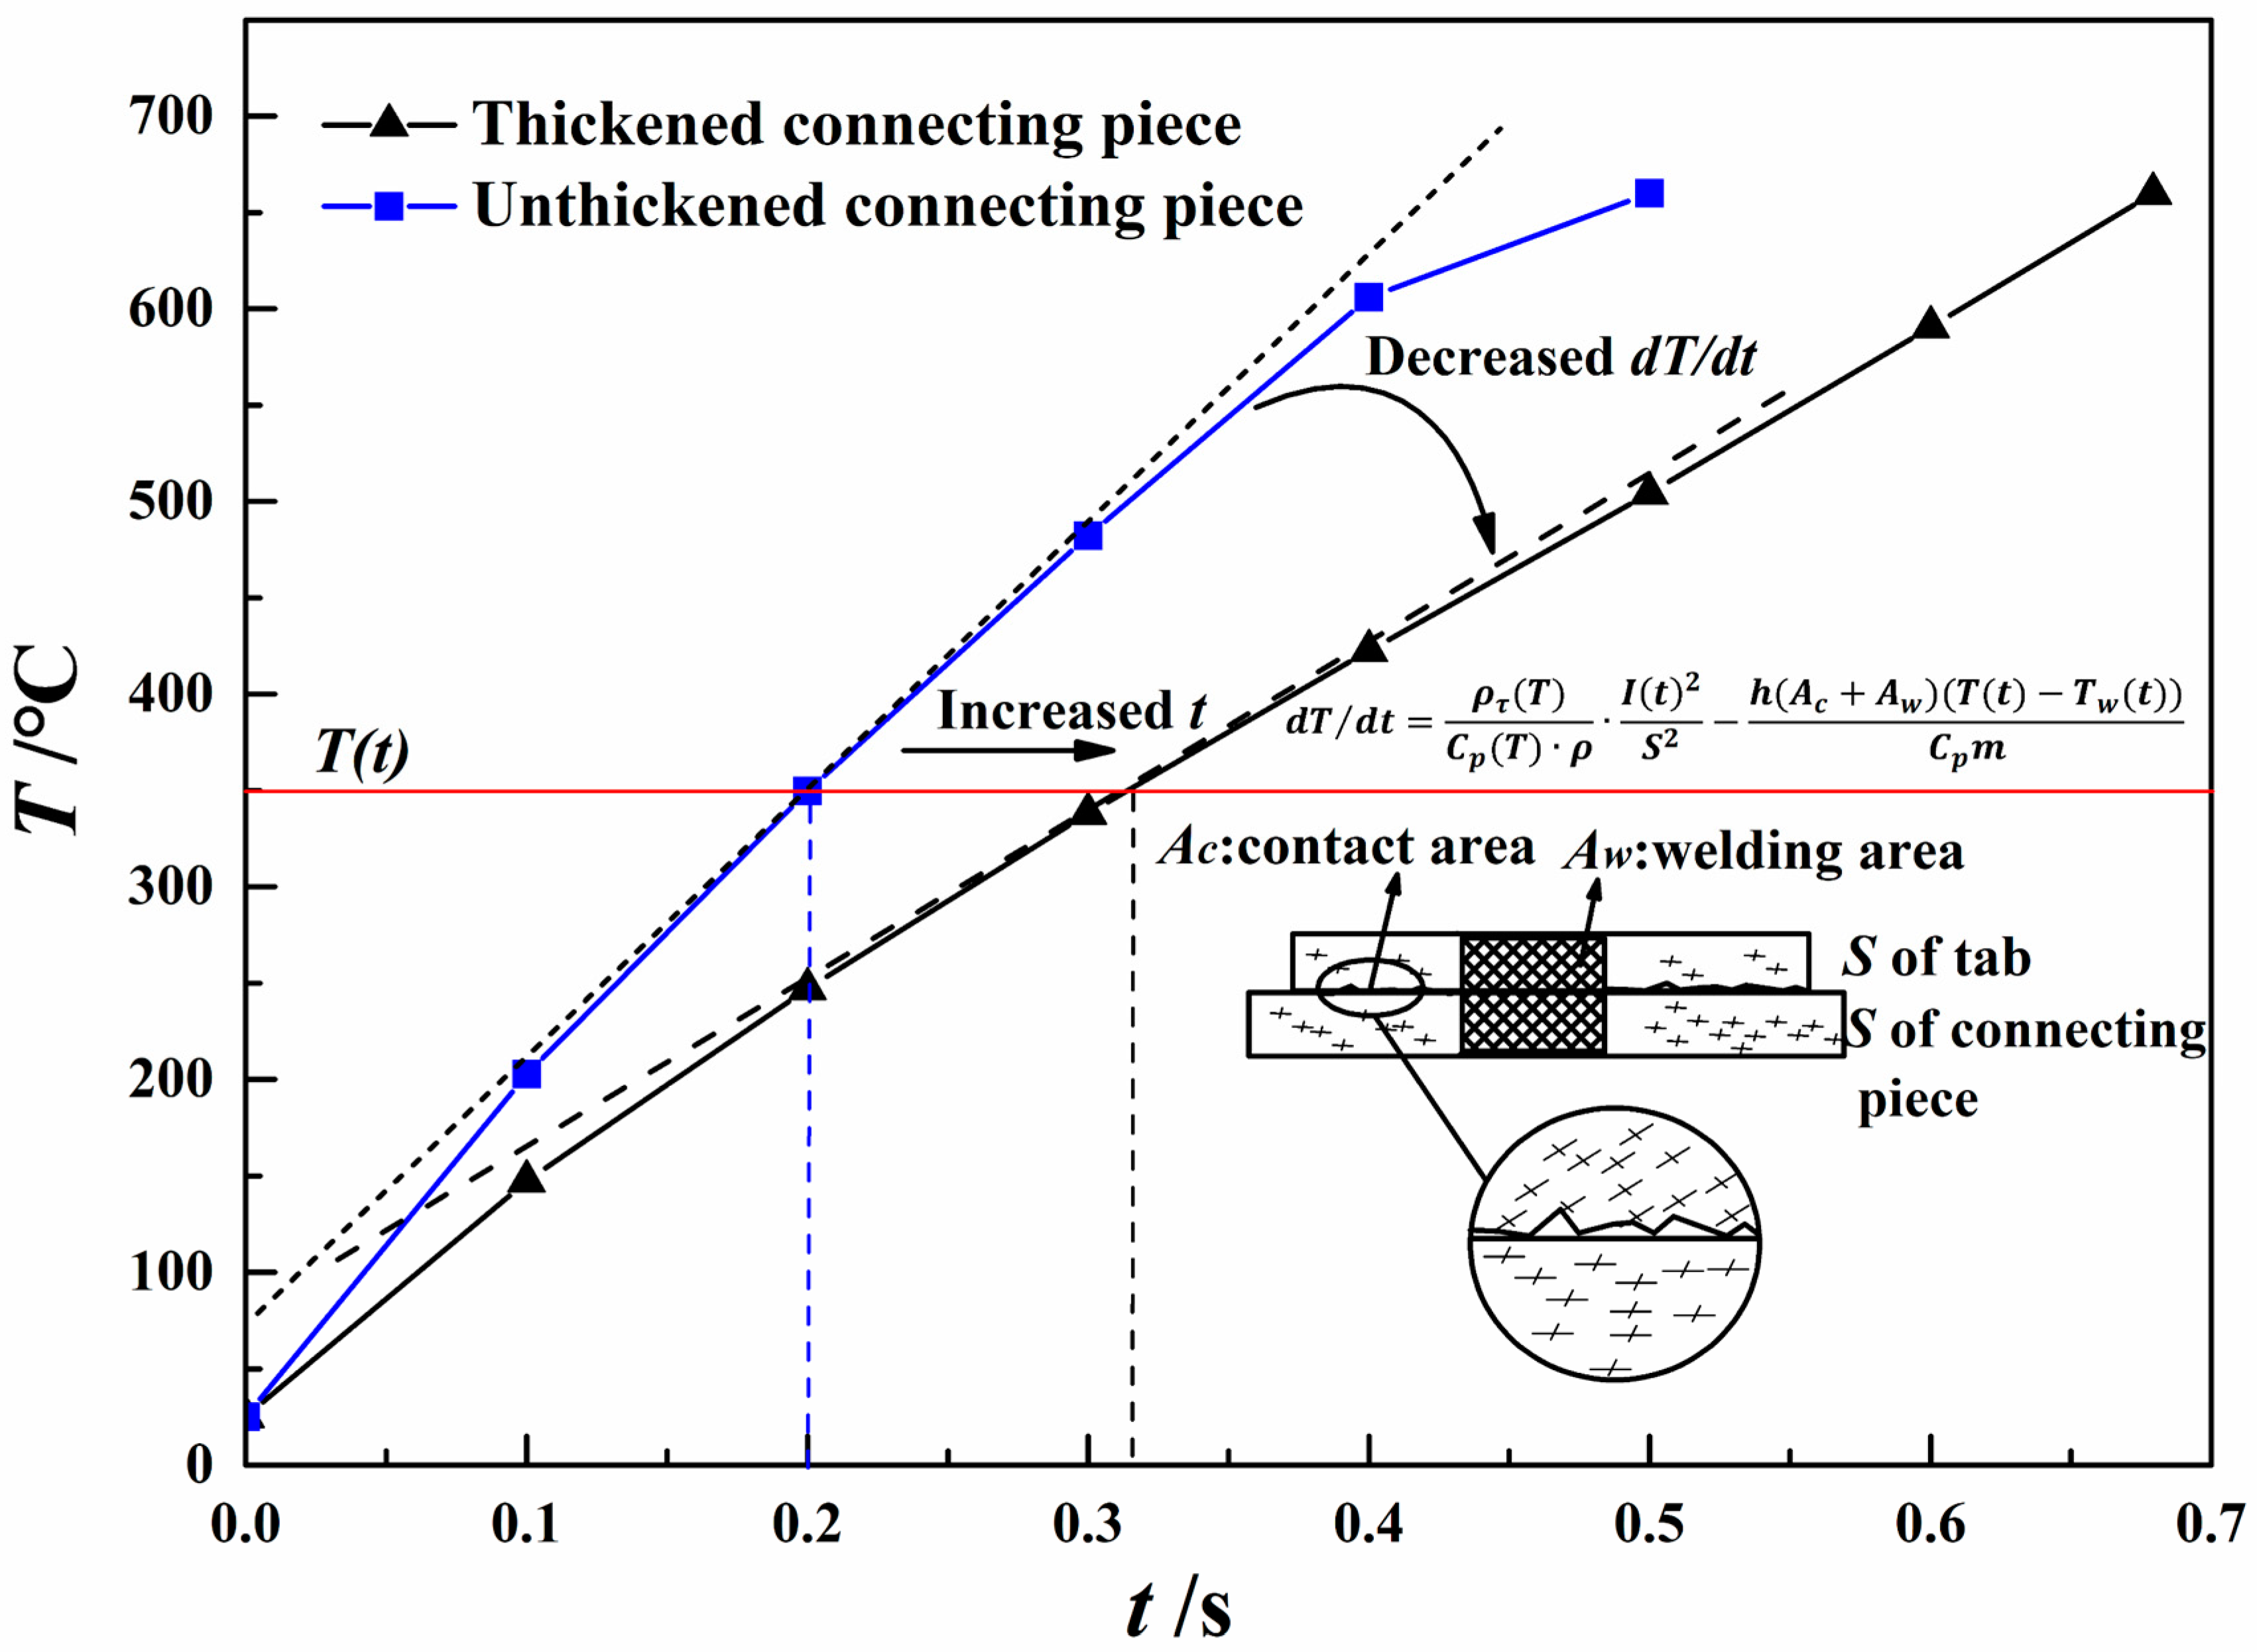
Test Group 1 (T1 Group): Thickened connecting piece and tab, used to assess the impact of cross-sectional area on temperature variation.
(c)
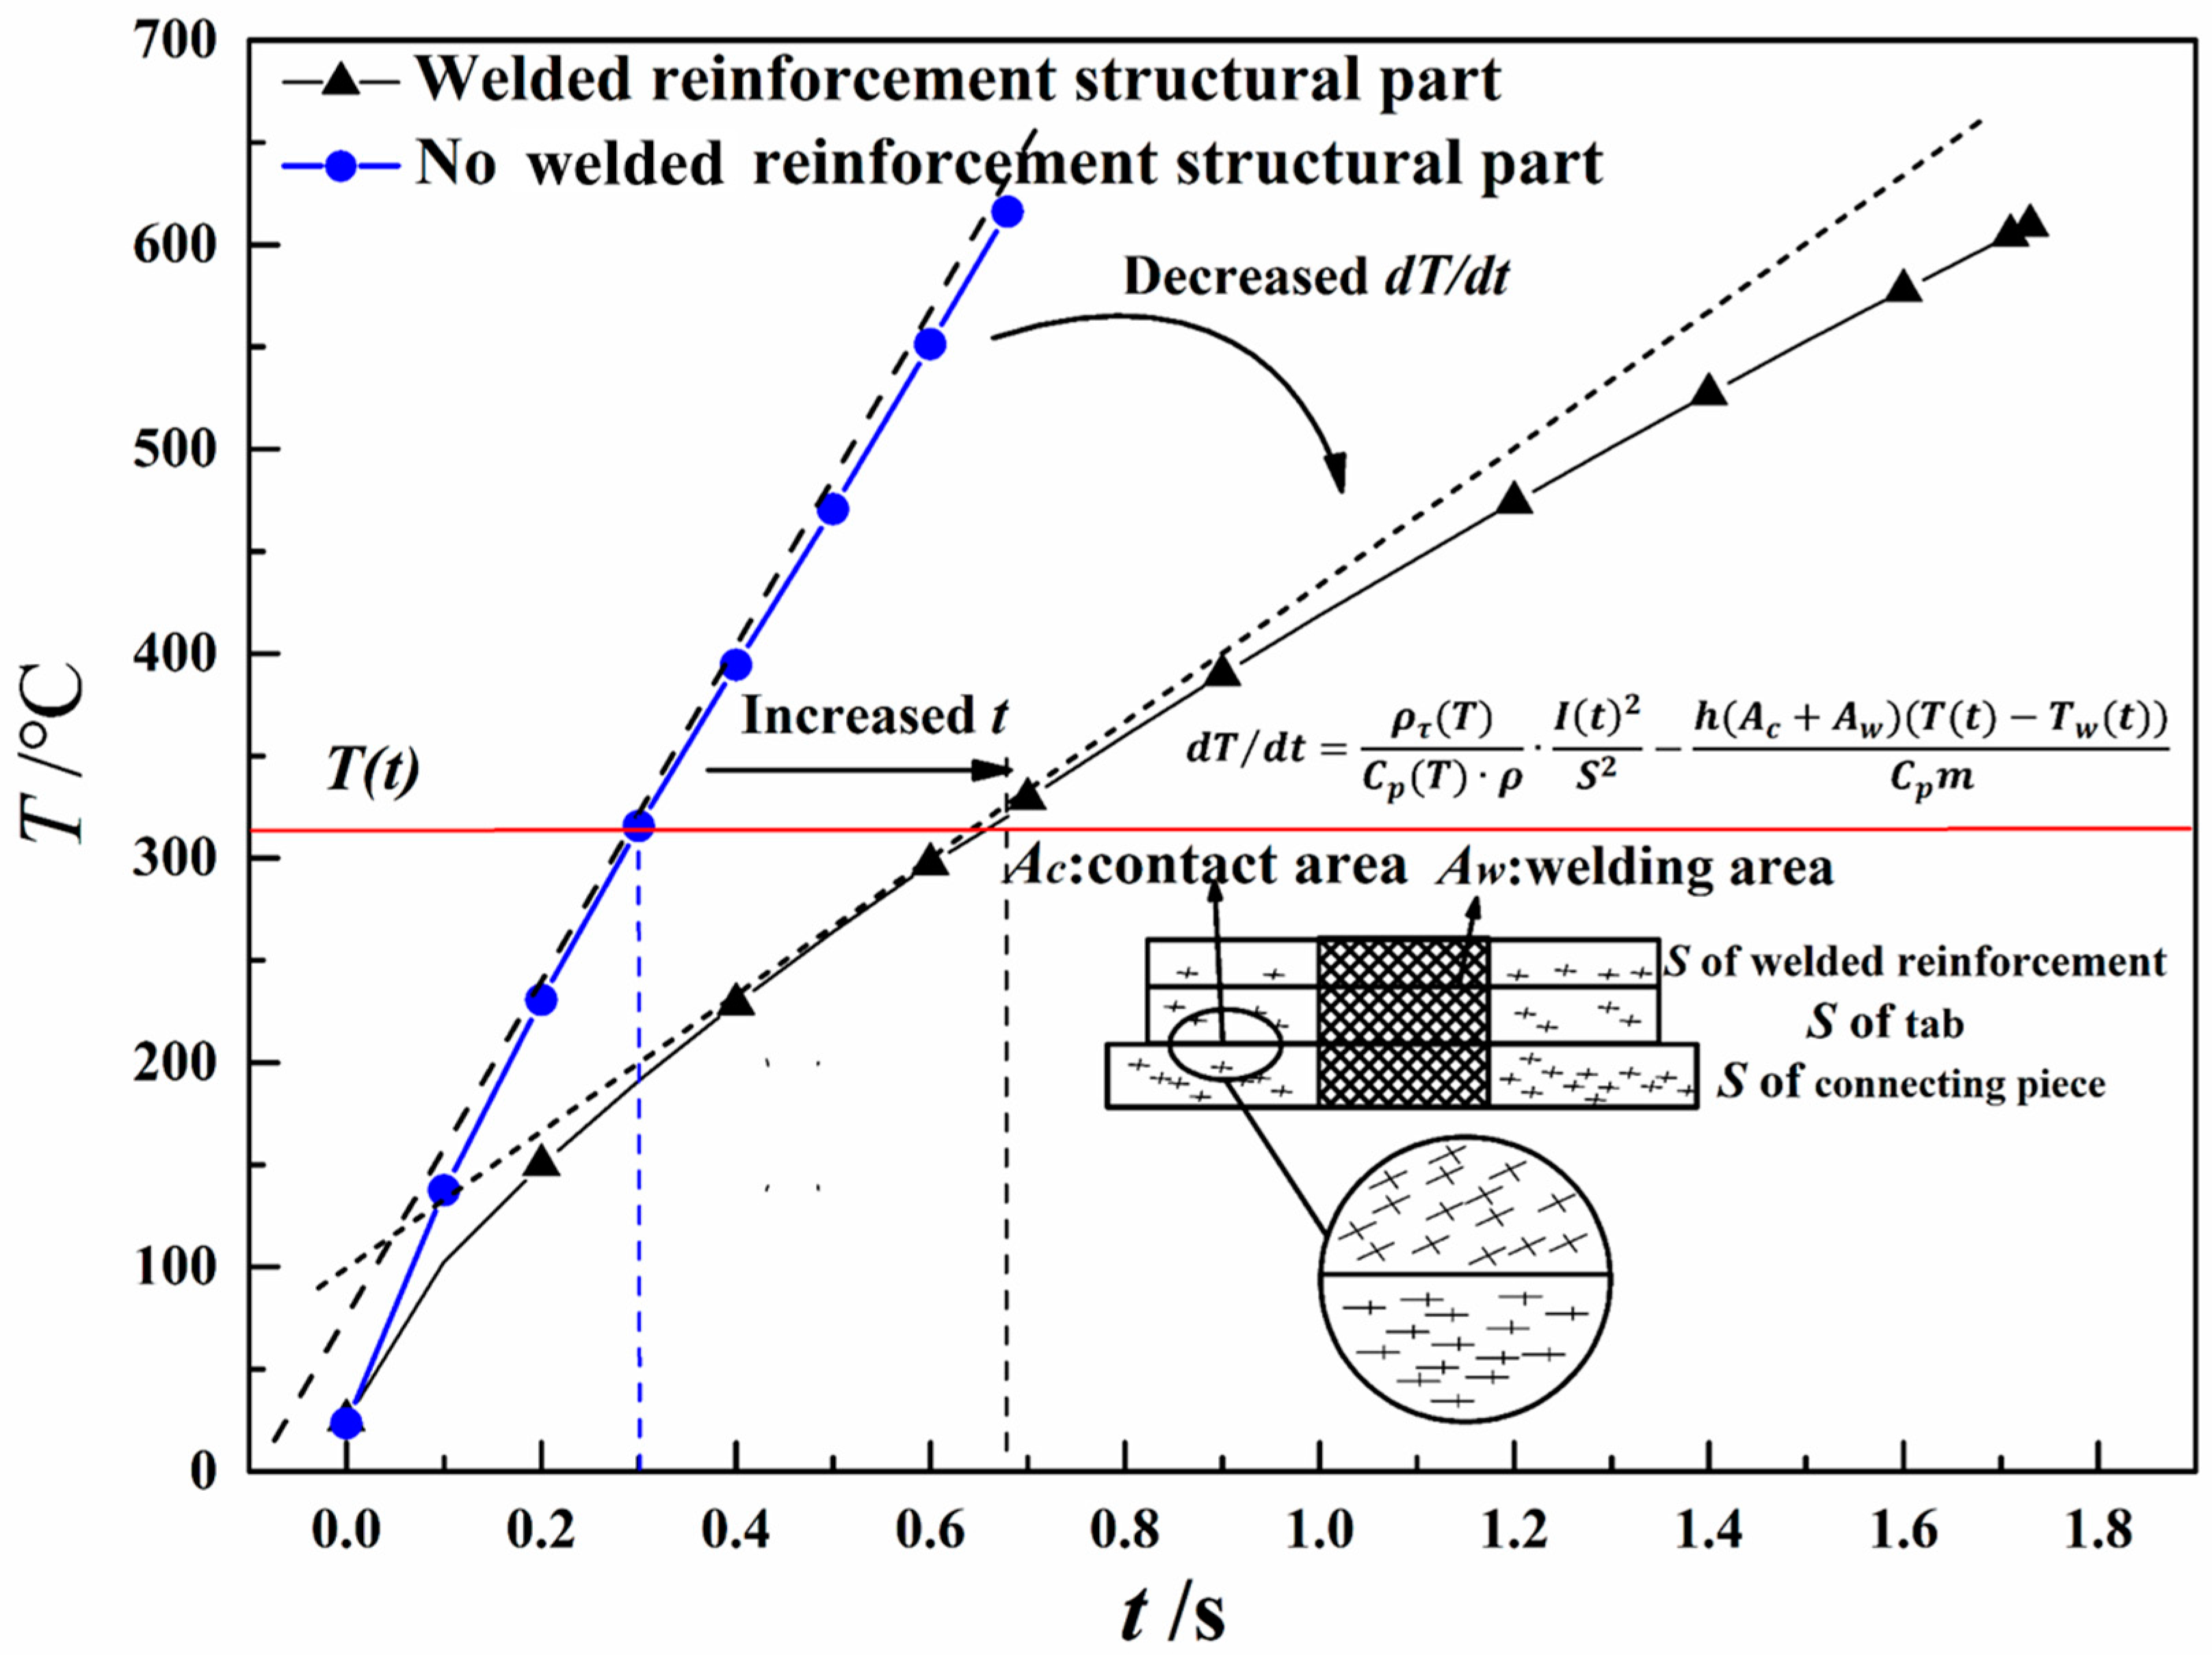
Test Group 2 (T2 Group): Thickened connecting piece and tab, along with welded reinforcement structural part, designed to evaluate the effect of contact area enhancement on temperature changes.
The comparison between T1 and the C0 isolates the influence of cross-sectional area on temperature rise, while the comparison between T2 and T1 reveals the impact of increased contact area on thermal performance.
Using the T1 model as an example, this model employs a free tetrahedral grid for three-dimensional discretization, optimizing the grid division scheme through a grid analysis. The final composite grid system consists of 101,920 three-dimensional domain elements, covering areas such as the positive and negative connecting pieces, tabs, and welded reinforcement structural parts; 46,035 two-dimensional boundary elements for surface heat flow exchange; and 6,730 one-dimensional boundary elements to simulate the welding contact lines.
Table 1 shows the thermophysical parameters of the conductor structures model. In defining the heat source, the model considers two primary factors: the Joule heat generated by the metal conductor and the heat from contact resistance. For major current-carrying components like the connecting pieces and tab, the Joule heating is calculated based on the theoretical model in Equation (2). For micro-areas such as the welding zone of the piece connector and the contact surface of the welded reinforcement structural part, an equivalent contact resistance model is employed to quantify the interface heating power. The conservation equation and heat transfer law are implemented within COMSOL Multiphysics 6.2 software, with the grid division shown in Figure 3.
The initial temperature of the structure is set to 25 °C, which is equal to the ambient temperature. Heat exchange with the surrounding environment is assumed to occur via natural convection, with a convection heat transfer coefficient of 15 w/(m2·K). A transient solver is employed to calculate the temperature change in the structure over time under high current conditions. COMSOL software is used to simulate and solve the thermal behavior of conductor structures. The simulation calculates the surface temperature distribution of the structure, considering the Joule heating and heat dissipation mechanisms. The time step for the calculation is set to 0.01 s to ensure accurate temporal resolution. The temperature distribution of Control Group, Test Group 1, and Test Group 2 is simulated under continuous 10 kA discharge conditions.

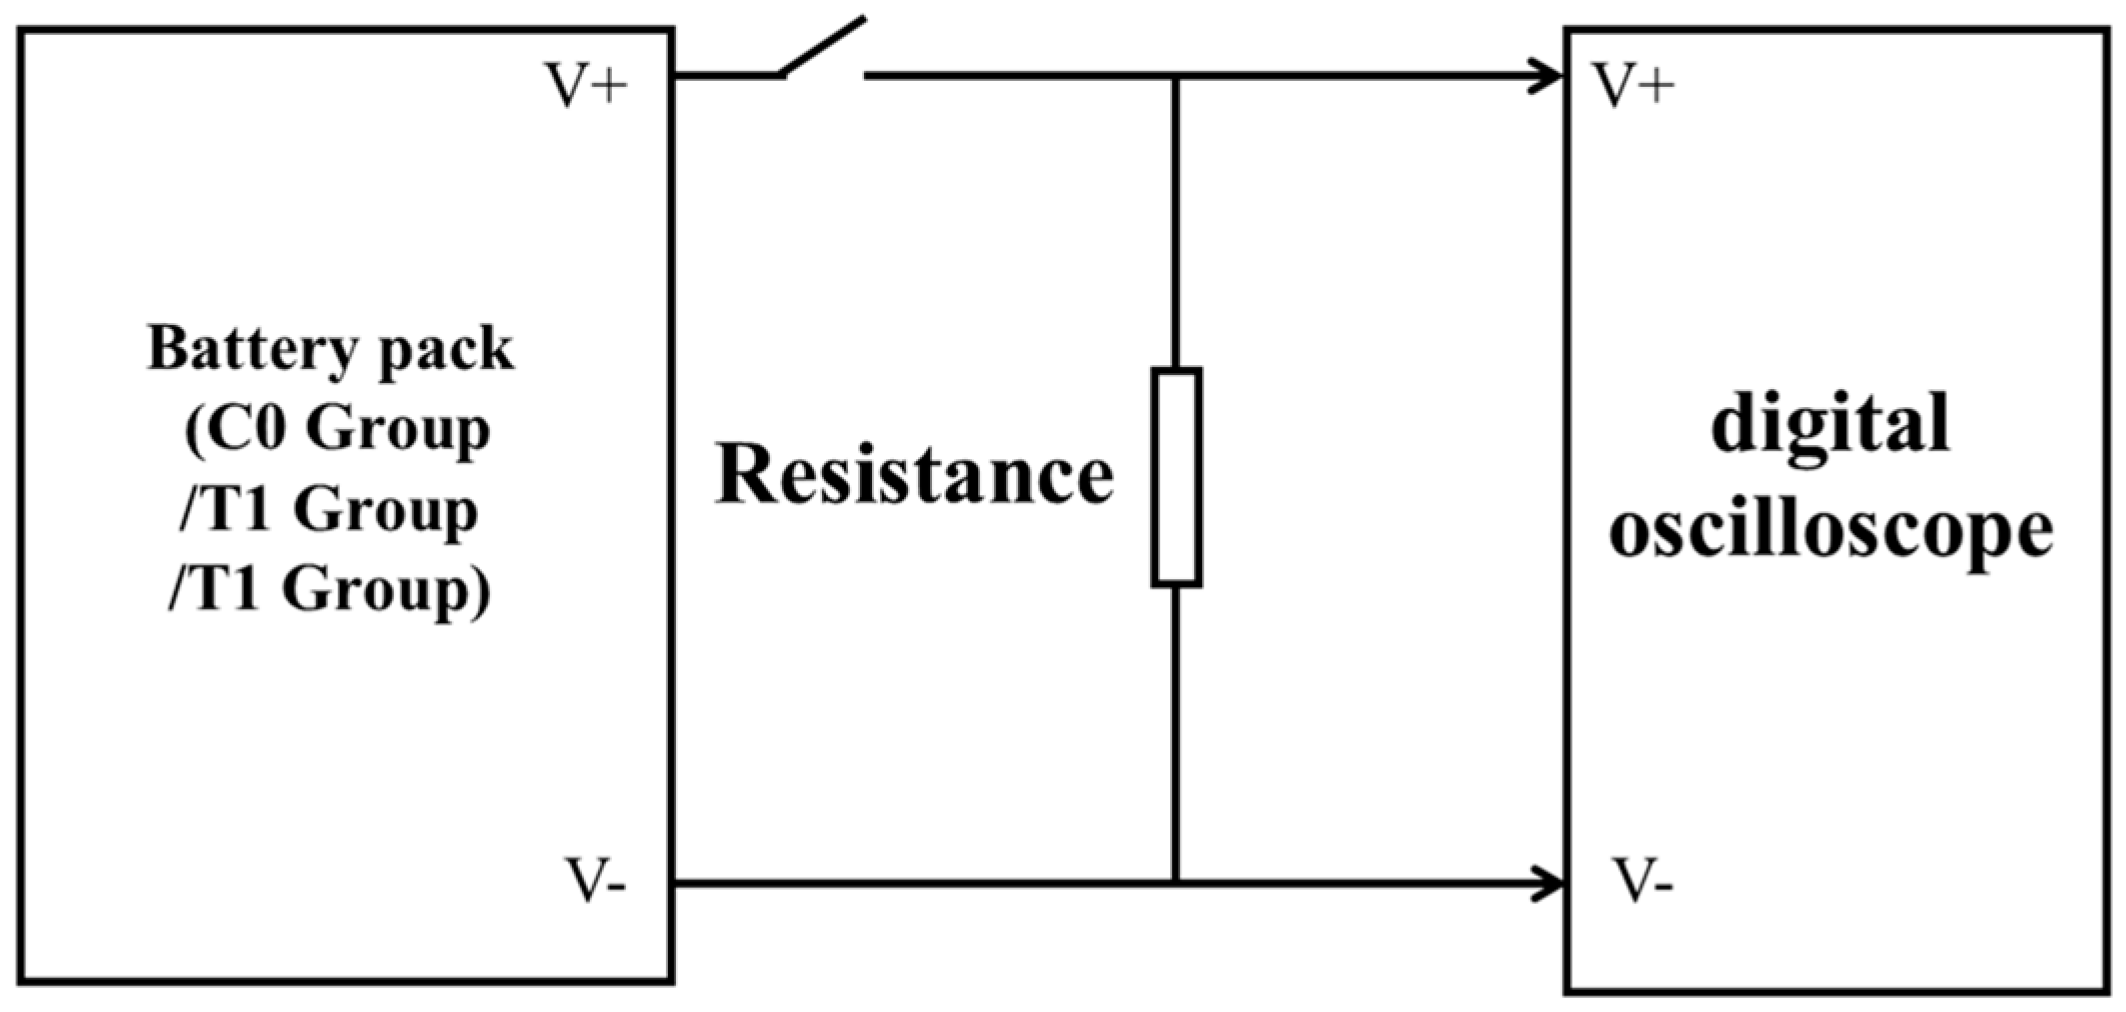
2.3. Experimental Validation Methods

The conductor structure is composed of a connecting piece and a tab; the connecting piece is welded together with the tab through ultrasonic welding. The sizes of the unthickened connecting piece, the thickened connecting piece, and the welding aid reinforcement are shown in Table 2. As shown in Table 3, the theoretical cross-sectional area of the T1 group is increased by 50% compared with the C0 group, due to the limited internal space of the battery and the extrusion of the ultrasonic welding process, even if the effective cross-sectional area of the welding aid fixing part T2 is approximately equivalent to the cross-sectional area of the T1 group. The contact area after welding is shown in Table 2.
The schematic diagram of the battery discharging test for different conductor structures is shown in Figure 4, aiming to verify the current-carrying capacity of the battery’s conductor structures under large-amperage operation conditions. The study also aims to validate the improvement in the current-carrying cross-sectional area, contact area, and the temperature change rate, as well as the heat exchange efficiency, through comparison and optimization. A test platform was built based on a series battery pack, which included multi-cell lithium batteries (with a total voltage of 10 V), adjustable milliohm-level power resistance (0.3 to 0.5 mΩ, ±0.5%), and a high-precision data acquisition oscilloscope (Tektronix MSO5104, sampling rate 1 kHz). The tests were conducted in a constant-temperature environment (25 ± 1 °C), where real-time measurements of voltage (resolution 0.1 mV) and current (accuracy ±0.5%) were recorded. Test method: The battery pack is connected in series with adjustable milliohm-level power resistance to achieve the generation of a thousand-ohm current, the current and voltage at both ends of the battery pack are detected by an oscilloscope, and the current and voltage changes with time are recorded. The tests were loaded with continuous high-amperage currents (10 kA) to trigger the failure criterion (voltage 0 V or current 0 A). The Control group (C0 group), Test Group 1 (T1 group), and Test Group 2 (T2 group) formed three groups in total, and the range of the test results was confirmed to achieve test accuracy/repeatability.
The lithium-ion power battery pack consists of three batteries connected in series, each with a nominal voltage of 3.2 V. The charge cut-off voltage is 3.65 V, and the discharge cut-off voltage is 2.5 V. The series resistance of the battery pack is adjustable (0.3 to 0.5 mΩ, ± 0.5%). The experimental procedure is as follows:
  • Allow the battery to rest for a period of time (1 h);
  • Charge the battery at a constant current of 0.5 C until it is fully charged, then allow it to cool naturally to room temperature;
  • Perform a discharge test on the series resistance of the battery pack at room temperature, maintaining the same current until the detection voltage becomes abnormal, and the open circuit condition is met.

3. Simulation Results and Optimizing Parameter Determination

The results of thermal field simulation for the C0 are shown in Figure 5. According to the discharge temperature–time variation curve in Figure 5a, the temperature at the junction of the positive connecting piece and the tab piece stacking contact area exhibits an exponential increase, reaching the melting point of aluminum (660 °C) within 0.54 s. From the temperature distribution cloud diagram of the conductor structures in Figure 5b, it is evident that under the simulated condition of continuous 10 kA discharge for 0.54 s, the temperature distribution within the conductor structures is highly uneven. The key temperature observations indicate that the maximum instantaneous temperatures of the positive connecting piece and the positive tab both reach 660 °C, while the negative connecting piece and the negative tab reach 462.53 °C. Notably, the first place to heat up is the stacked weld between the connector and the lug. The temperature at the cathode was 349.77 °C and 605.94 °C at 0.2 s and 0.4 s, respectively. The highest temperature (660 °C) is concentrated at the junction of the positive connecting piece and the tab stack contact area. Due to the geometrical discontinuity at the junction, a region of temperature concentration is formed, leading to local overheating. This localized thermal stress results in a weak point, susceptible to thermal runaway, significantly impacting the overall safety and stability of the battery system under extreme high-current conditions.
The simulation results in Figure 6 show that the temperature at the junction of the contact/non-contact area of the positive connecting piece, tab, and welded reinforcement structural part increases exponentially, reaching the melting point of aluminum (660 °C) in 0.68 s. As observed in the temperature distribution contour diagram (as shown in Figure 6b), under a continuous 10 kA discharge for 0.68 s, the temperature distribution across the conductor structures remains uneven. The first place to heat up is the stacked weld between the connector and the lug. The temperature at the cathode was 247.01 °C and 442.7 °C at 0.2 s and 0.4 s, respectively. The instantaneous temperature of the positive connecting piece and positive tab both reach 660 °C, while the negative connecting piece and negative tab reach 666.58 °C and 666.72 °C, respectively. The maximum temperature (660 °C) is concentrated at the junction of the contact/non-contact area of the positive connecting piece, tab, and welded reinforcement structural part.
The simulation results in Figure 7a show that the temperature at the junction of the contact/non-contact area of the positive connecting piece, tab, and welded reinforcement structural part increases exponentially, reaching the melting point of aluminum (660 °C) in 1.73 s. As observed in the temperature distribution contour diagram (as shown in Figure 7b), under a continuous 10 kA discharge for 1.73 s, the temperature distribution across the conductor structures remains uneven. The first place to heat up is the stacked weld between the connector and the lugs. The temperatures at the cathode were 274.71 °C and 406.41 °C at 0.4 s and 0.8 s, respectively. The instantaneous temperature of the positive connecting piece is 611.53 °C, the negative connecting piece is 596.22 °C, the positive tab is 618.9 °C, and the negative tab is 598.92 °C. The maximum temperature (660 °C) is concentrated at the junction of the contact/non-contact area of the positive connecting piece, tab, and welded reinforcement structural part.
The simulation results under a 10 kA continuous current show that the continuous over-current time of T2 group was 1.73 s, while the T1 group lasted 0.68 s and the C0 group lasted 0.44 s. This indicates that increasing the contact area between conductor structures has a more significant effect on temperature reduction than merely increasing the cross-sectional area. The most easily fused positions in all three groups were at the junction of the contact/non-contact area of the positive connecting piece and positive tab stack. Using 660 °C as the fusing threshold, the T2 groups exhibited a slower temperature rise rate and a more uniform spatial heat accumulation gradient, confirming that expanding the contact area effectively improves thermal resistance. Under high-amperage conditions, the control group showed significant high-temperature aggregation, whereas the T2 group, which included a thickened connecting piece and a welded reinforcement structural part, demonstrated better temperature suppression characteristics. This difference in thermal behavior confirms that expanding both the cross-sectional area and contact area enhances interface heat transfer efficiency, optimizing the three-dimensional heat transfer path within the guide components and significantly improving the current-carrying capacity and thermal stability of the structure.

4. Experimental Verification Results

The variation curves of voltage and current with discharge time for the C0 group, shown in Figure 8, illustrate the dynamic characteristics of the battery at different stages. In the initial stage (before t1), the battery voltage remains stable at 10 V, while the current is zero, an open-circuit state where the battery is unaffected by external loads and remains in electrochemical equilibrium with no chemical energy release. At t1, the battery voltage sharply drops from 10 V to 2 V, and the current rapidly increases from 0 A to 10 kA, marking the beginning of the discharge process. This abrupt change suggests a sudden shift in the battery’s internal impedance, leading to a drastic voltage drop and a rapid current surge. The sudden change in voltage and current reflects the battery’s fast response under high-amperage discharge conditions and highlights its dynamic behavior. The internal impedance shift at t1 may result from a sudden decrease in circuit contact resistance or rapid activation of electrochemical reactions inside the battery [45]. Between t1 and t2 (a duration of 0.75 s), the battery voltage continues to decline while the current gradually decreases from 10 kA to 6 kA, indicating a sustained current-carrying state. This sustained current flow leads to significant heating within the conductive structures [46,47,48,49], causing a sharp temperature rise. Eventually, at t2, the temperature reaches the melting point, leading to the fusion of the conductive structure and a complete current drop to 0 A.
As shown in Figure 9, displaying the voltage–current–time curve of the discharge test of the battery T1 group, the battery is in an open-circuit state in the initial stage (before t1); the battery voltage is stable at 10 V and the current is 0 A. At t1, the battery voltage drops from 10 V to 2 V, and the current rises sharply from 0 A to 10 kA, and during the continuous discharge phase from t1 to t2 (t2t1 = 0.8 s), the battery voltage drops continuously and the current drops from 10 kA to 6 kA. At t2, the voltage is 0 V and the current is 0 A.
As shown in Figure 9, the variation curves of voltage and current with discharge time for T1 group reveals its electrical response under high-amperage discharge. In the initial stage (before t1), the battery remains in an open-circuit state, with a stable voltage of 10 V and zero current. At t1, a sharp voltage drop from 10 V to 2 V is observed, accompanied by a rapid current surge from 0 A to 10 kA, marking the onset of the discharge process. During the continuous discharge stage from t1 to t2 (lasting 0.8 s), the battery voltage continues to decline, while the current gradually decreases from 10 kA to 6 kA. At t2, the voltage drops to 0 V and the current also falls to 0 A, indicating the end of the discharge cycle.
As shown in Figure 10, the variation curves of voltage and current with discharge time for T2 group illustrate the battery’s response under high-amperage discharge. In the initial stage (before t1), the battery remains in an open-circuit state, with a stable voltage of 10 V and zero current. At t1, the battery voltage drops sharply from 10 V to 2 V, while the current surges from 0 A to 10 kA, marking the start of the discharge process. During the continuous discharge phase from t1 to t2 (lasting 1.73 s), the battery voltage steadily declines, and the current gradually decreases from 10 kA to 6 kA. At t2, both the voltage and current reach 0 V and 0 A, respectively, indicating the completion of the discharge cycle.
Through experimental comparison, it was observed that at time t1, the circuit suddenly closes, causing the voltage to drop sharply to 2 V, while the current surges from 0 A to 10 kA. This phenomenon occurred consistently across all three test groups. The abrupt voltage drop and current spike indicate a sudden and significant change in the battery’s internal impedance, revealing a common characteristic of internal impedance variation under high-current conditions [50,51,52]. This rapid response highlights the dynamic behavior of the battery during high-amperage discharge and confirms the swift activation of the electrochemical reaction when the circuit is closed.
During the continuous discharge stage (form t1 to t2), notable differences emerged among the three test groups. Specifically, the time interval t2t1 was 0.75 s in the C0 group (as shown in Figure 8), 0.8 s in T1 group (as shown in Figure 9), and extended to 1.73 s in T2 group (as shown in Figure 10). The optimized design (T2 group) demonstrated a substantial increase in current-carrying duration, achieving 230% of the control group’s duration (C0). In contrast, the conventional design (T1 group) showed only a negligible improvement, with a duration of 107% of that of the control group.
While the simulation has inherent limitations, leading to slight discrepancies between experimental and simulated results, the measured fusing time of the conductor structures closely aligns with the electrothermal coupling simulation outcomes. This consistency not only validates the accuracy of the simulation analysis and experimental verification but also provides deeper insight into the dynamic characteristics of battery performance under high-amperage discharge conditions.

5. Discussion

5.1. Dynamic Effect of Heat Generation and Heat Dissipation of Conductor Structures Under Extreme High-Amperage Condition

As shown in Table 4, the current-carrying durations of different conductor configurations were compared using both simulation and experimental data. To ensure a conservative and reliable interpretation, the minimum experimental values in each group were selected to account for measurement variability. This comparison highlights the performance differences among the configurations and provides insight into the reliability of the simulation model.
The T2 configuration exhibited the longest current-carrying duration in both simulation and experimental results, which confirms the effectiveness of the proposed structural optimization. Although the experimental values for the C0 and T1 groups were higher than their simulated counterparts, this is likely attributed to the simplifications and idealized conditions within the model. Nevertheless, the consistent trend across all configurations indicates that the simulation model has practical predictive value and offers meaningful guidance for optimizing conductor structures under extreme high-current conditions.
As shown in Figure 11, which compares the simulated temperature rise curves over time for unthickened and thickened connecting pieces, increasing the cross-sectional area of the conductor structures effectively reduces the temperature change rate and extends the current-carrying duration under high-amperage conditions, given a fixed welding area. The cross-sectional area directly influences the resistance of the connecting piece, thereby reducing Joule heating and affecting the overall temperature variation. However, the observed increase in current-carrying time remains limited. This is due to the nature of kiloampere-level currents, which behave differently from conventional high currents. Under such extreme conditions, Joule heating is significantly amplified, leading to rapid temperature surges. Therefore, to achieve a substantial improvement in current-carrying time, heat dissipation must also be optimized. In other words, increasing the contact area between conductor structures is essential for enhancing heat dissipation efficiency and mitigating thermal buildup.
The comparison of simulated temperature rise curves over time between unconfigured and configured welded reinforcement structures is shown in Figure 12. Building upon the demonstration in Figure 11, the welded reinforcement structural part effectively expands both the contact area and cross-sectional area between the conductor structures. The increased contact area at the same instantaneous temperature enhances heat dissipation efficiency, significantly delaying the temperature rise and reducing the rate of temperature change [53]. Consequently, the current-carrying time is notably extended.
According to the experimental verification data, as shown in Figure 9 and Figure 10, the change in the contact area between the conductor structures directly affects the change in the cross-sectional area of the current-carrying and the heat dissipation area, which improves the heat dissipation area between the conductor structures and strengthens the effectiveness of electron transport. The effectiveness and engineering applicability of the multiphysics coupling are verified.
According to the analysis of Figure 11 and Figure 12, as shown in Figure 13, the dynamic effect of heat generation and heat dissipation of the conductor structures under high ampere current is different from that of a small current, and in the case of low-amperage (ILA), combined with Equation (8), it can be seen that the temperature change rate of the conductor structures is d T d t > 0, in the 0–t0 stage, that is, the heat generation efficiency is higher than the heat dissipation efficiency, and the heat generation Q + is greater than the heat dissipation Q , and the temperature rises. In the t0t1 stage, the temperature change rate decreases, that is, the heat dissipation efficiency increases with the instantaneous temperature increase, and the difference between heat generation Q + and heat dissipation Q decreases, resulting in a slow temperature increase. In the t1t2 stage, the temperature change rate tends to be 0, the heat dissipation Q is close to the heat generation Q + , and the thermal equilibrium appears on the conductor structures, and a stable temperature field is established. Therefore, in the case of low currents, it is common to increase the current-carrying cross-sectional area to significantly increase the current-carrying capacity. In the case of extreme high-amperage current (IEHA), the temperature change rate increases sharply in the 0–t0 stage, that is, the heat generation efficiency is much higher than the heat dissipation efficiency, and the heat generation 1 is much greater than the heat dissipation 1, and the temperature rises sharply. In the t0t1 stage, the temperature change rate decreases slowly, and even though the heat dissipation efficiency increases with the instantaneous temperature increase, the difference between heat generation Q + and heat dissipation Q is too large, resulting in no obvious temperature change. In this case, it is necessary to increase the cross-sectional area of the current-carrying to reduce the heat generation efficiency, and at the same time, it is necessary to reduce the heat difference by increasing the contact area and reducing the heat dissipation efficiency, so as to promote the thermal balance.
Based on the experimental verification data shown in Figure 9 and Figure 10, the contact area between the conductor structures directly influences both the cross-sectional area of current flow and the heat dissipation area. This enhancement improves heat dissipation efficiency and strengthens electron transport, verifying the effectiveness and engineering applicability of multiphysics coupling. According to the analysis of Figure 11 and Figure 12, and as further illustrated in Figure 13, the dynamic behavior of heat generation and dissipation in conductor structures under extreme high-amperage conditions differs significantly from that under low current conditions. In the case of low-amperage currents (ILA), based on Equation (7), the temperature change rate d T d t > 0 in the stage of 0 to t0, meaning that heat generation exceeds heat dissipation ( Q + > Q ), leading to a temperature rise. During the t0 to t1 stage, the temperature change rate decreases as the heat dissipation efficiency increases with rising instantaneous temperature, reducing the gap between Q + and Q , which results in a slower temperature rise. In the stage of t1 to t2, the temperature change rate approaches zero, and heat dissipation Q nearly equals heat generation Q + , achieving thermal equilibrium and forming a stable temperature field. Under these conditions, increasing the cross-sectional area of conductor structures effectively enhances current-carrying capacity.
However, under extreme high-amperage conditions (IEHA), the temperature change rate increases sharply in the 0 to t0 stage due to significantly higher heat generation than dissipation ( Q + Q ), causing a rapid temperature rise. In the t0 to t1 stage, although the heat dissipation efficiency increases with temperature, the gap between Q + and Q remains large, resulting in continued heat accumulation. In such cases, increasing the cross-sectional area helps reduce heat generation, while expanding the contact area improves heat dissipation efficiency, ultimately promoting thermal equilibrium.

5.2. Applications and Limitations

In this study, three conductor configurations were evaluated: the C0 group as the baseline, the T1 group representing a conventional design, and the T2 group as the optimized structure. Compared with T1, the T2 configuration significantly improves thermal management by increasing both the cross-sectional area and contact area, thereby enhancing the heat dissipation pathway. However, these benefits are accompanied by increased structural complexity and reduced flexibility in internal space utilization. From a manufacturing perspective, the T1 design benefits from mature processes and lower cost, while T2 introduces higher fabrication requirements and associated cost burdens. In terms of reliability, although conventional structures have proven their long-term durability under standard conditions, they tend to fail prematurely under ultra-high current loads. The optimized T2 structure mitigates these risks through reinforcement informed by multiphysics analysis, although its complexity may introduce new reliability considerations.
This work establishes a theoretical framework for evaluating key structural parameters that influence the overcurrent tolerance of lithium-ion batteries. The optimized structure demonstrates potential to reduce both conductor resistance and interfacial resistance, which may lower Joule heating, improve energy efficiency, enhance fast-charging performance, and extend cycle life. To support this, a current–thermal structure coupled finite element model was developed to quantify the effects of cross-sectional area and contact area on thermal response under high-current conditions. This approach transcends traditional design practices by incorporating dynamic thermal effects into structural optimization and forms a scalable framework for performance improvement under similar multiphysics environments.
The findings are broadly applicable beyond pulse-discharge scenarios. The proposed design is also relevant for systems operating under low-current but thermally sensitive conditions, such as precision electronics or temperature-regulated energy systems. In addition, the model enables predictive evaluation of current-carrying performance and hotspot formation, offering practical guidance for structural optimization in advanced battery systems. In real-world applications, the optimized conductor structure has promising relevance across multiple industries. For electric vehicles, it supports dynamic testing involving frequent acceleration and braking, where pulse current surges are common. In high-power energy storage systems, it facilitates short-duration high-current output for meeting transient power demands. In aerospace applications, it offers robust performance under instantaneous high-load conditions such as rocket ignition or emergency power delivery. In all these contexts, enhanced overcurrent capacity directly improves peak power delivery and system resilience in critical scenarios.
However, several limitations remain. This study assumes a constant welding area and uniform welding quality, which diverges from real-world conditions where process variability, porosity, and residual stress introduce randomness into joint behavior [54,55]. These factors can significantly affect thermal resistance and failure probability. Future research should develop dynamic welding zone models that incorporate real-time monitoring and adaptive parameter control. Multiphysics-based optimization frameworks may be expanded to include residual stress, interface morphology, and microstructural evolution. A comparative cost–performance analysis between the traditional and optimized designs is also necessary to assess industrial scalability. In addition, this work was conducted under a single material system to isolate structural effects. Material nonlinearities at high temperatures, such as temperature-dependent thermal conductivity and resistivity, were not included. Addressing this limitation will require future studies involving multiple conductor materials and associated experimental validation across a broader thermal range. Finally, post-failure validation was not performed in this study. Future work will include thermal imaging and microstructural inspections, such as scanning electron microscopy (SEM) and cross-sectional analysis, to confirm the location and severity of predicted thermal damage. These investigations will enhance the accuracy of the simulation model and establish a stronger correlation between predicted stress concentrations and actual failure mechanisms.

6. Conclusions

In this paper, the thermal dynamic equilibrium of heat generation and heat dissipation in conductor structures, along with the evolution of their temperature field under extreme high-amperage current conditions, is analyzed. The key factors influencing the performance of conductor structures, namely the current-carrying cross-sectional area and contact area, are compared. Additionally, the dynamic effects of heat generation and heat dissipation are thoroughly examined through both extreme high-amperage current discharge experiments and multiphysics coupling simulations of the conductor structures. This dual verification provides a theoretical foundation and evaluation method for assessing the key factors affecting a battery’s ability to withstand extreme high-amperage current, offering significant engineering practical value. Based on above analysis and discussion, the following conclusions can be drawn:
  • Through a comprehensive evaluation method involving theoretical derivation, multiphysics coupling finite element analysis, and experimental verification, it has been confirmed that both the cross-sectional area and the contact area of the conductor structures are closely linked to the battery’s ability to withstand extreme high-amperage current condition.
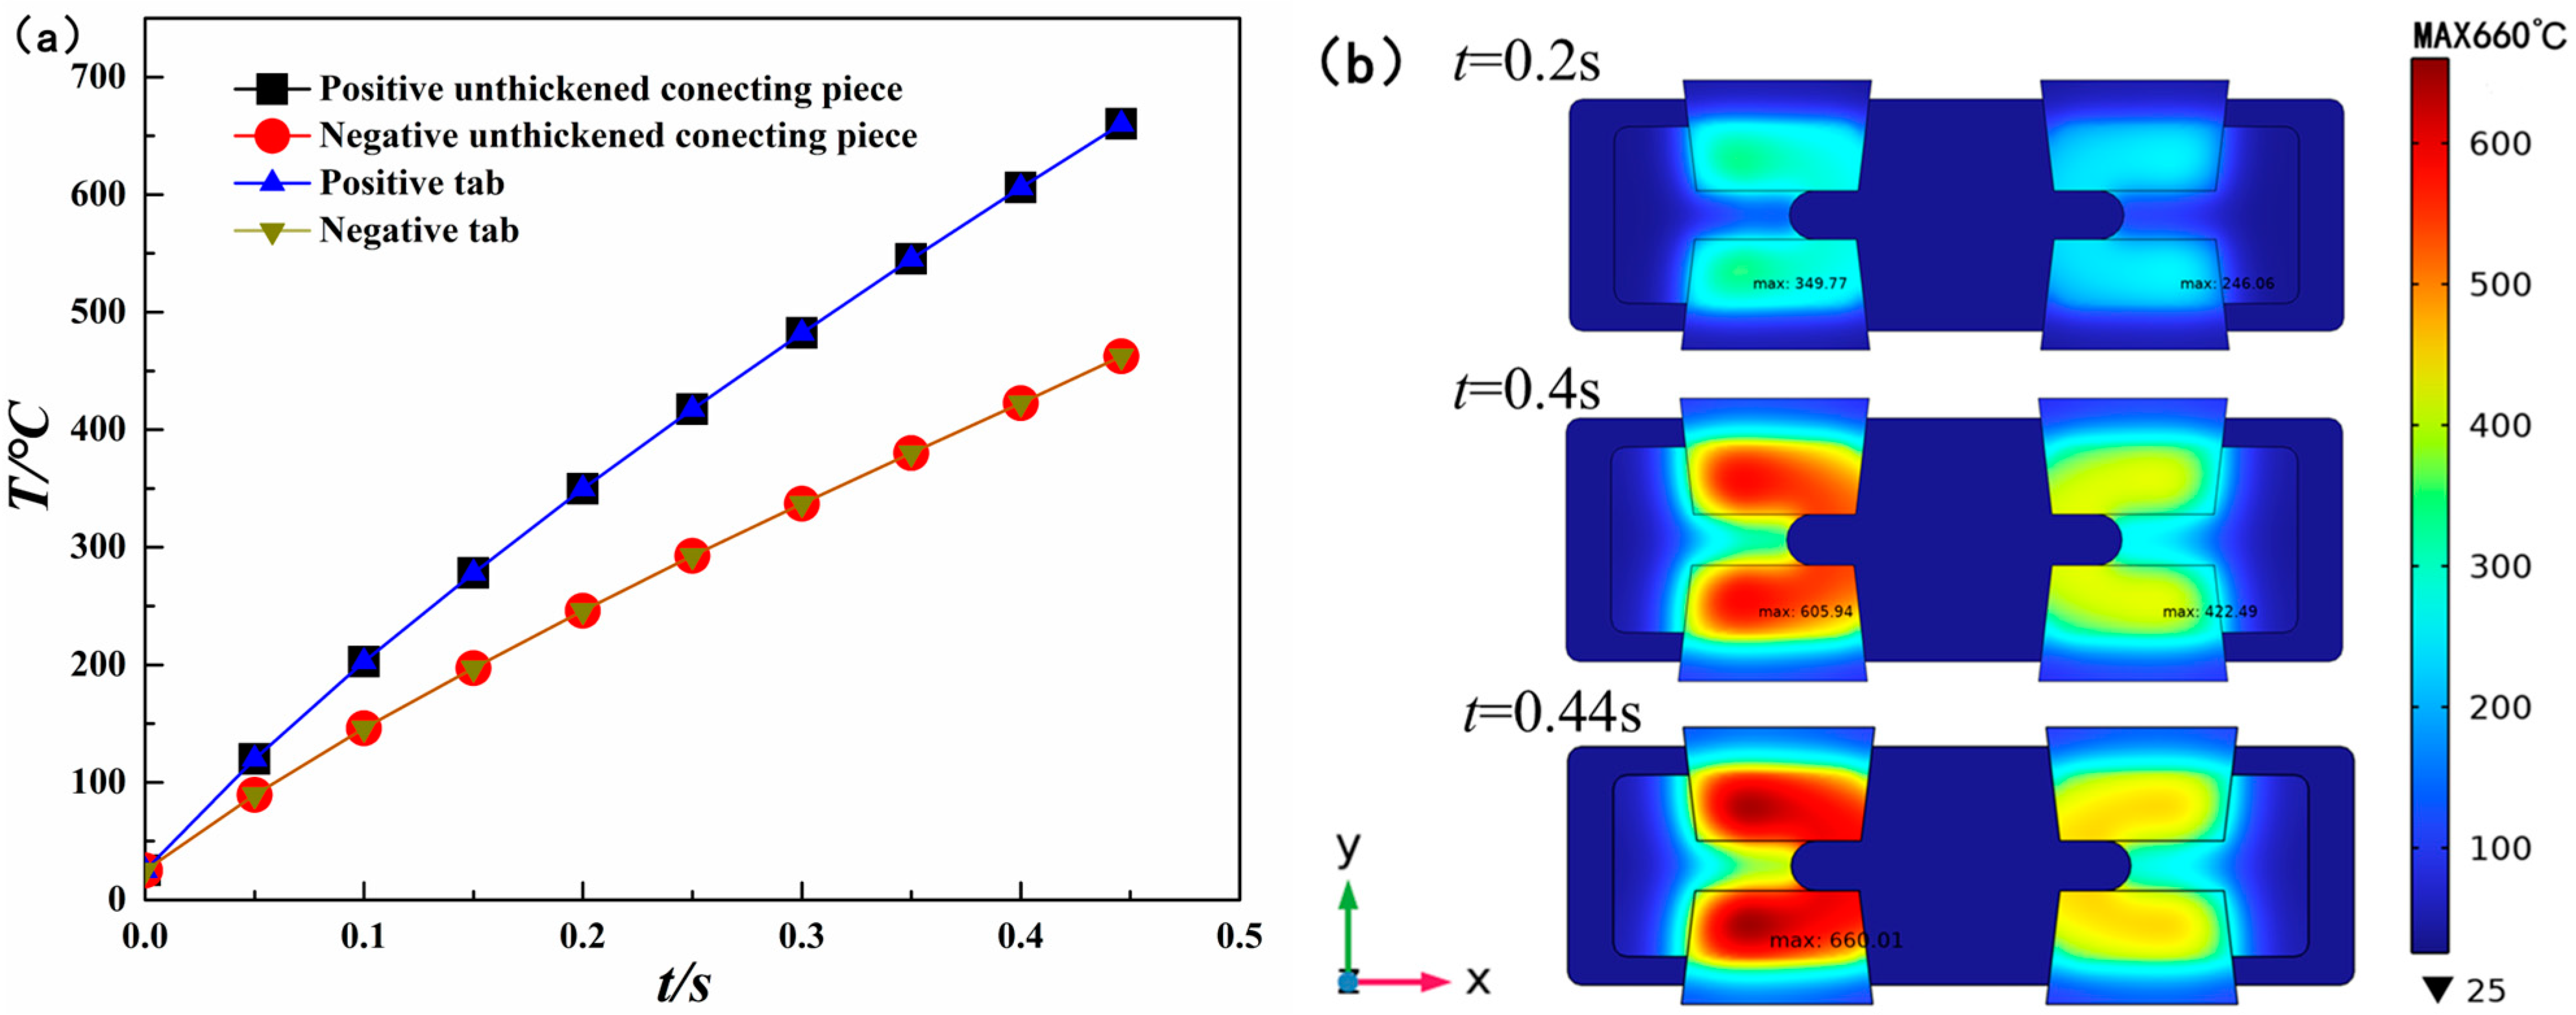
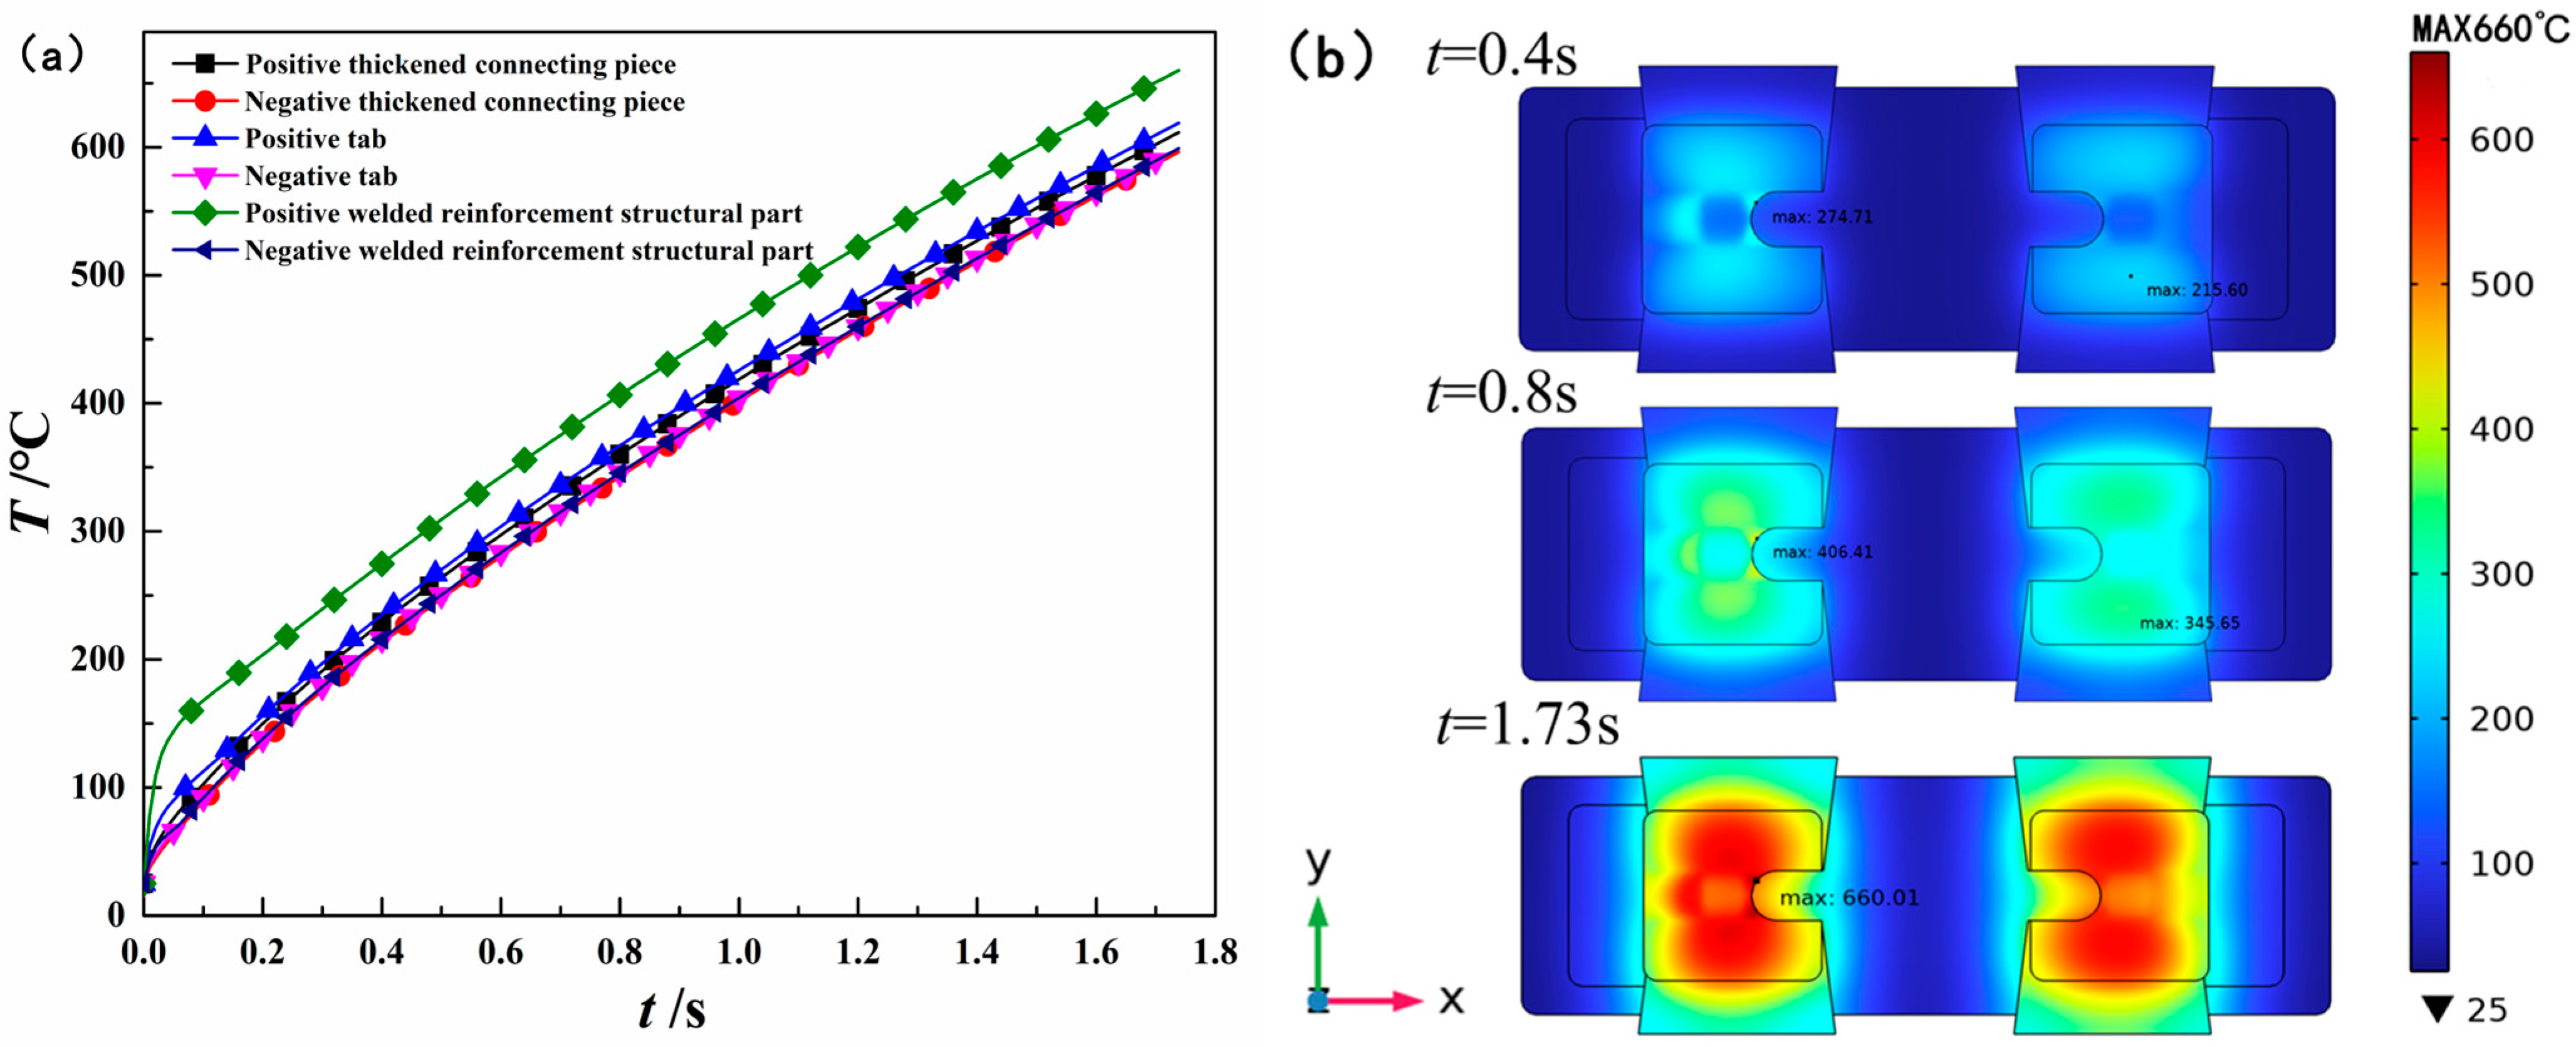
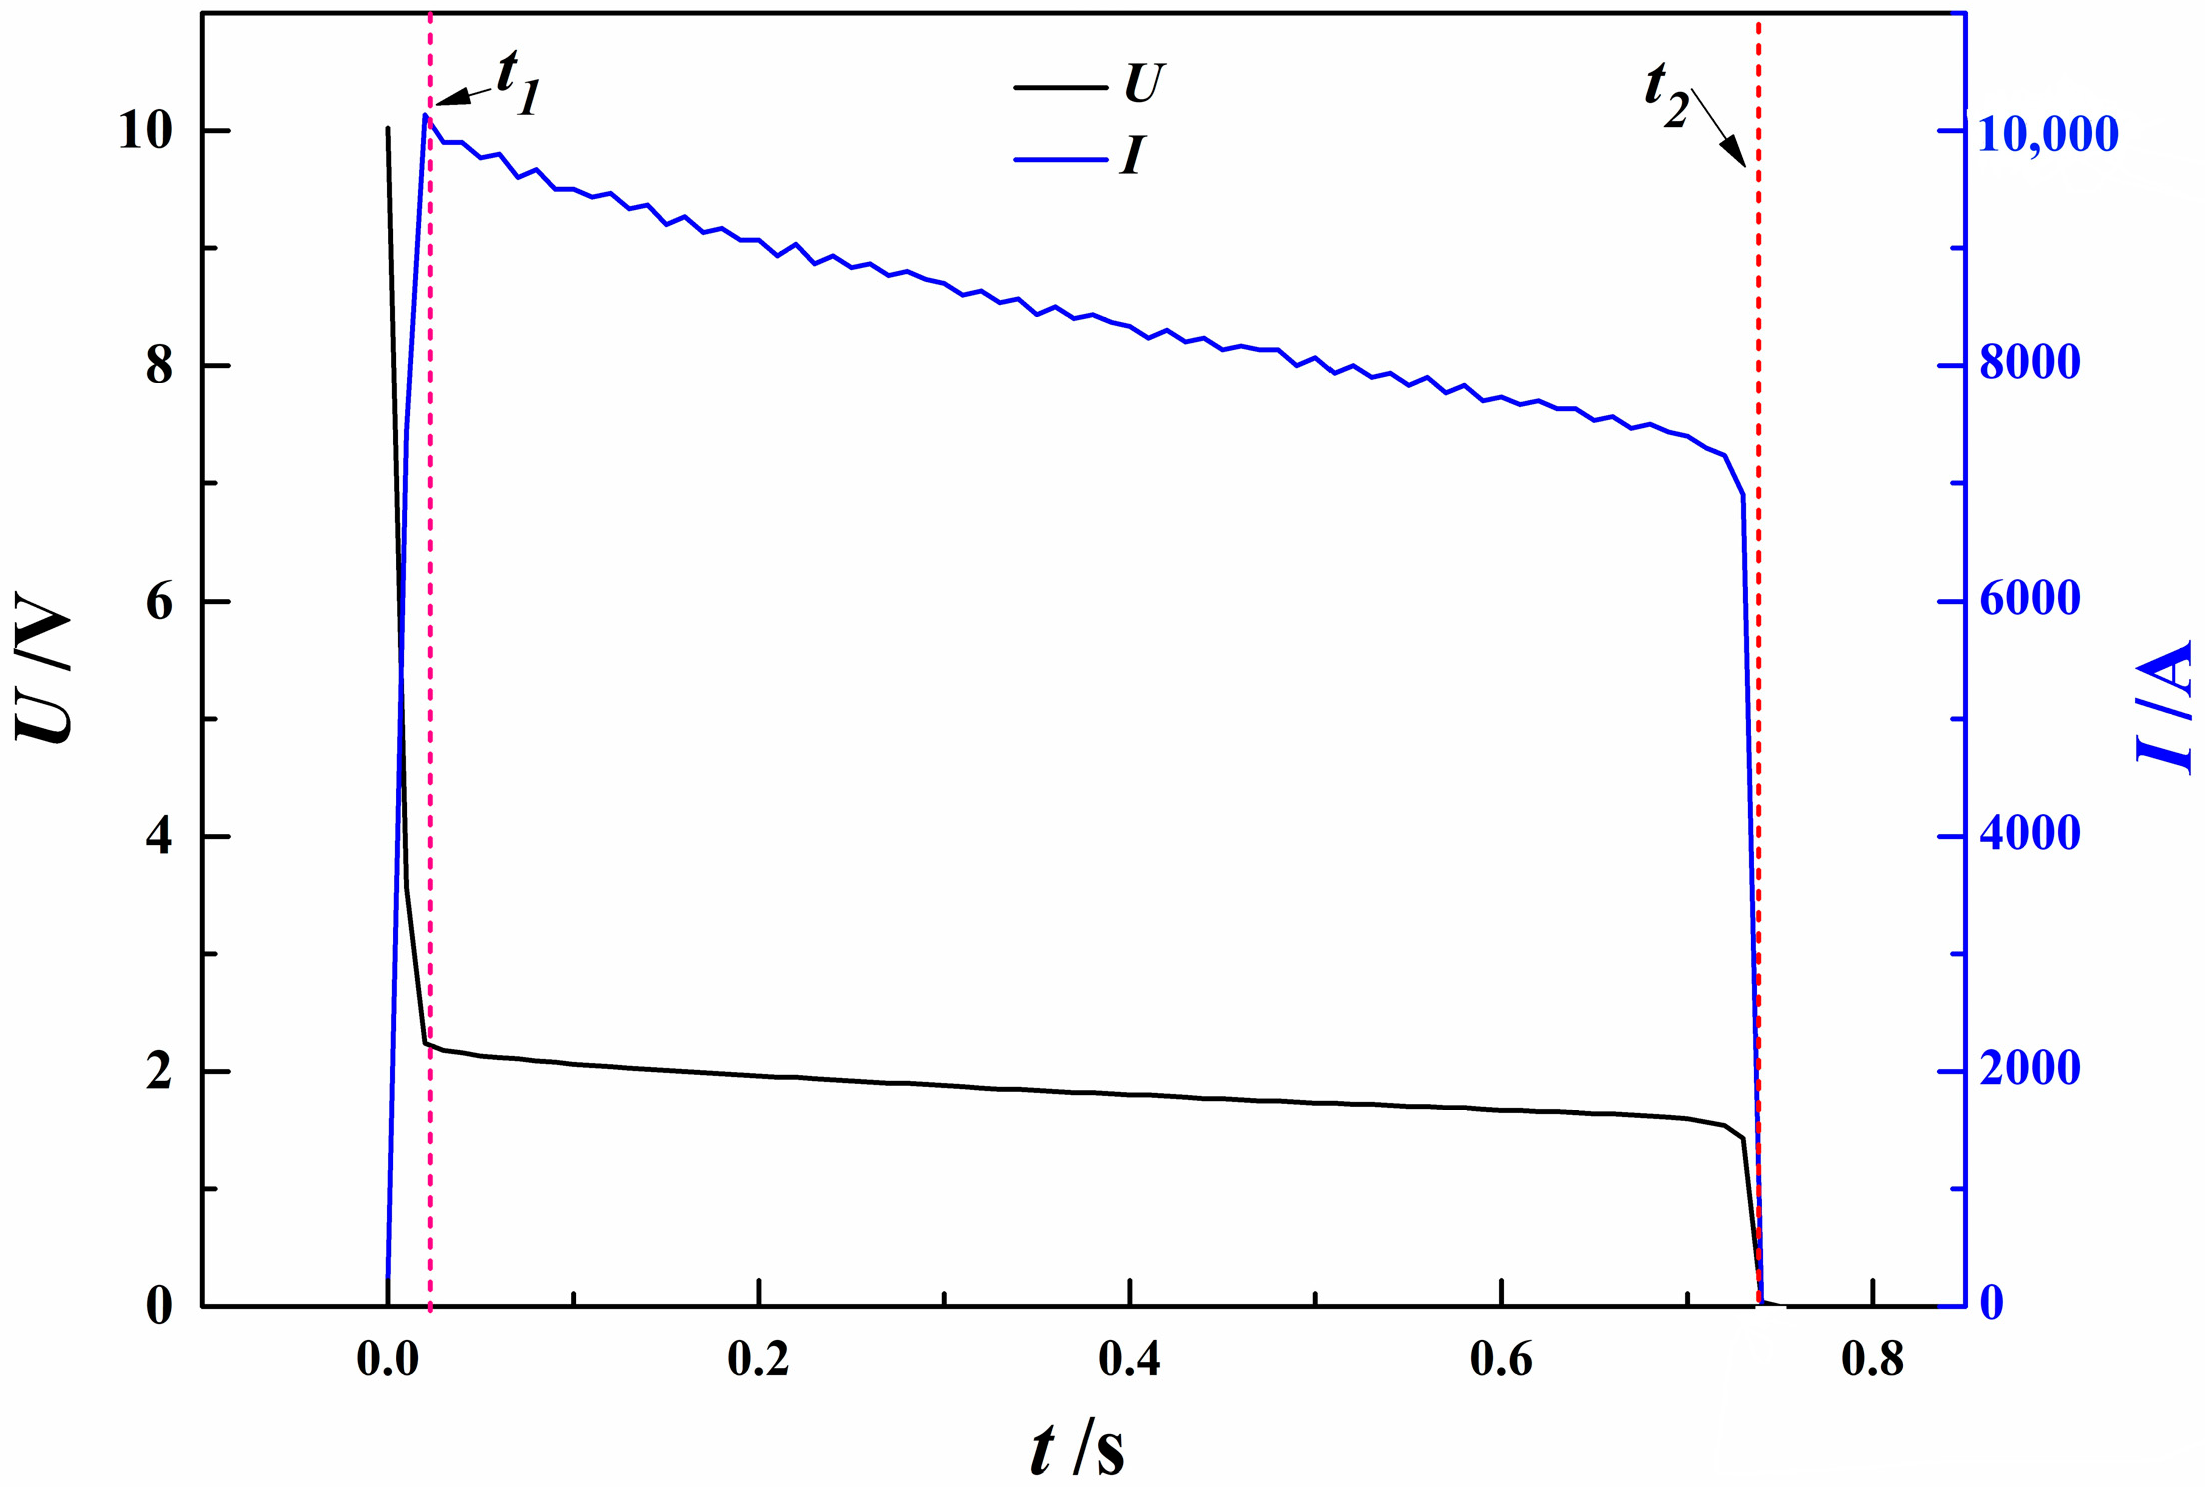
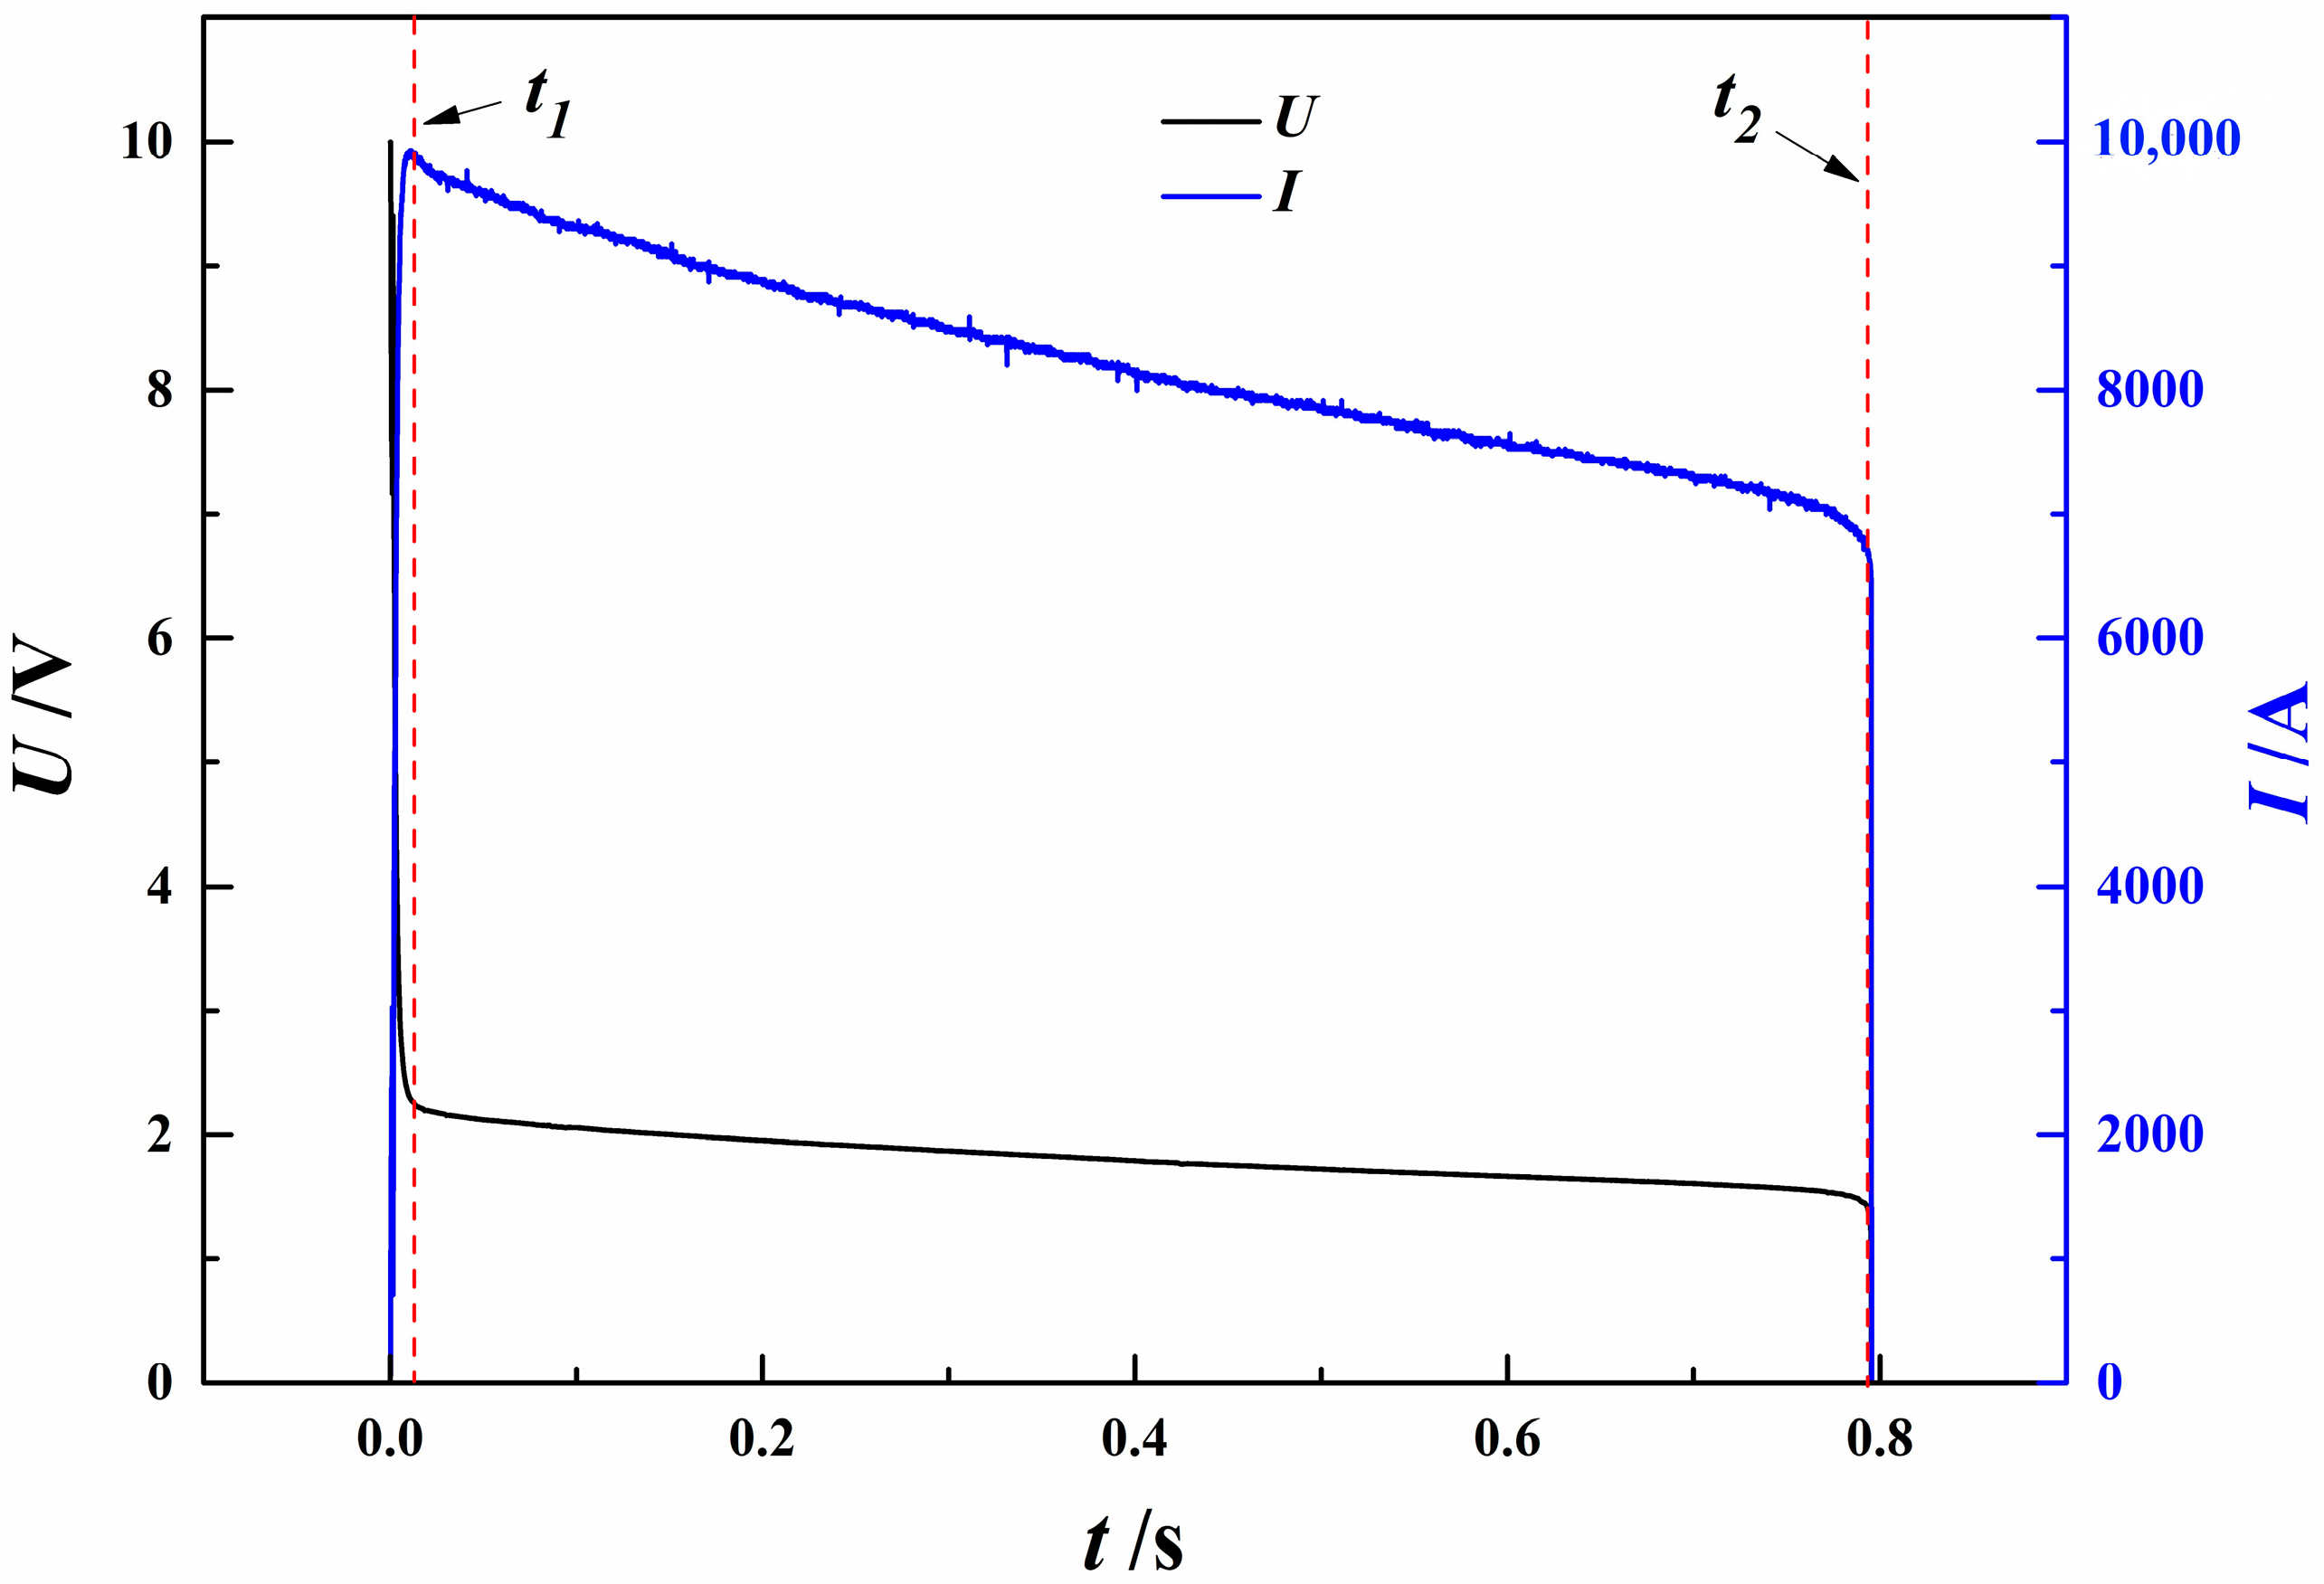
  • Under extreme high-current conditions and fixed welding areas, the positive conductor structure reaches the fusing temperature threshold of 660 °C within 0.45 s, indicating rapid heat accumulation. By increasing the conductor’s cross-sectional area by 50%, the current-carrying duration improves modestly from 0.75 s to 0.8 s, demonstrating that enlarging the cross-sectional area alone is not sufficient for substantial thermal performance enhancement.
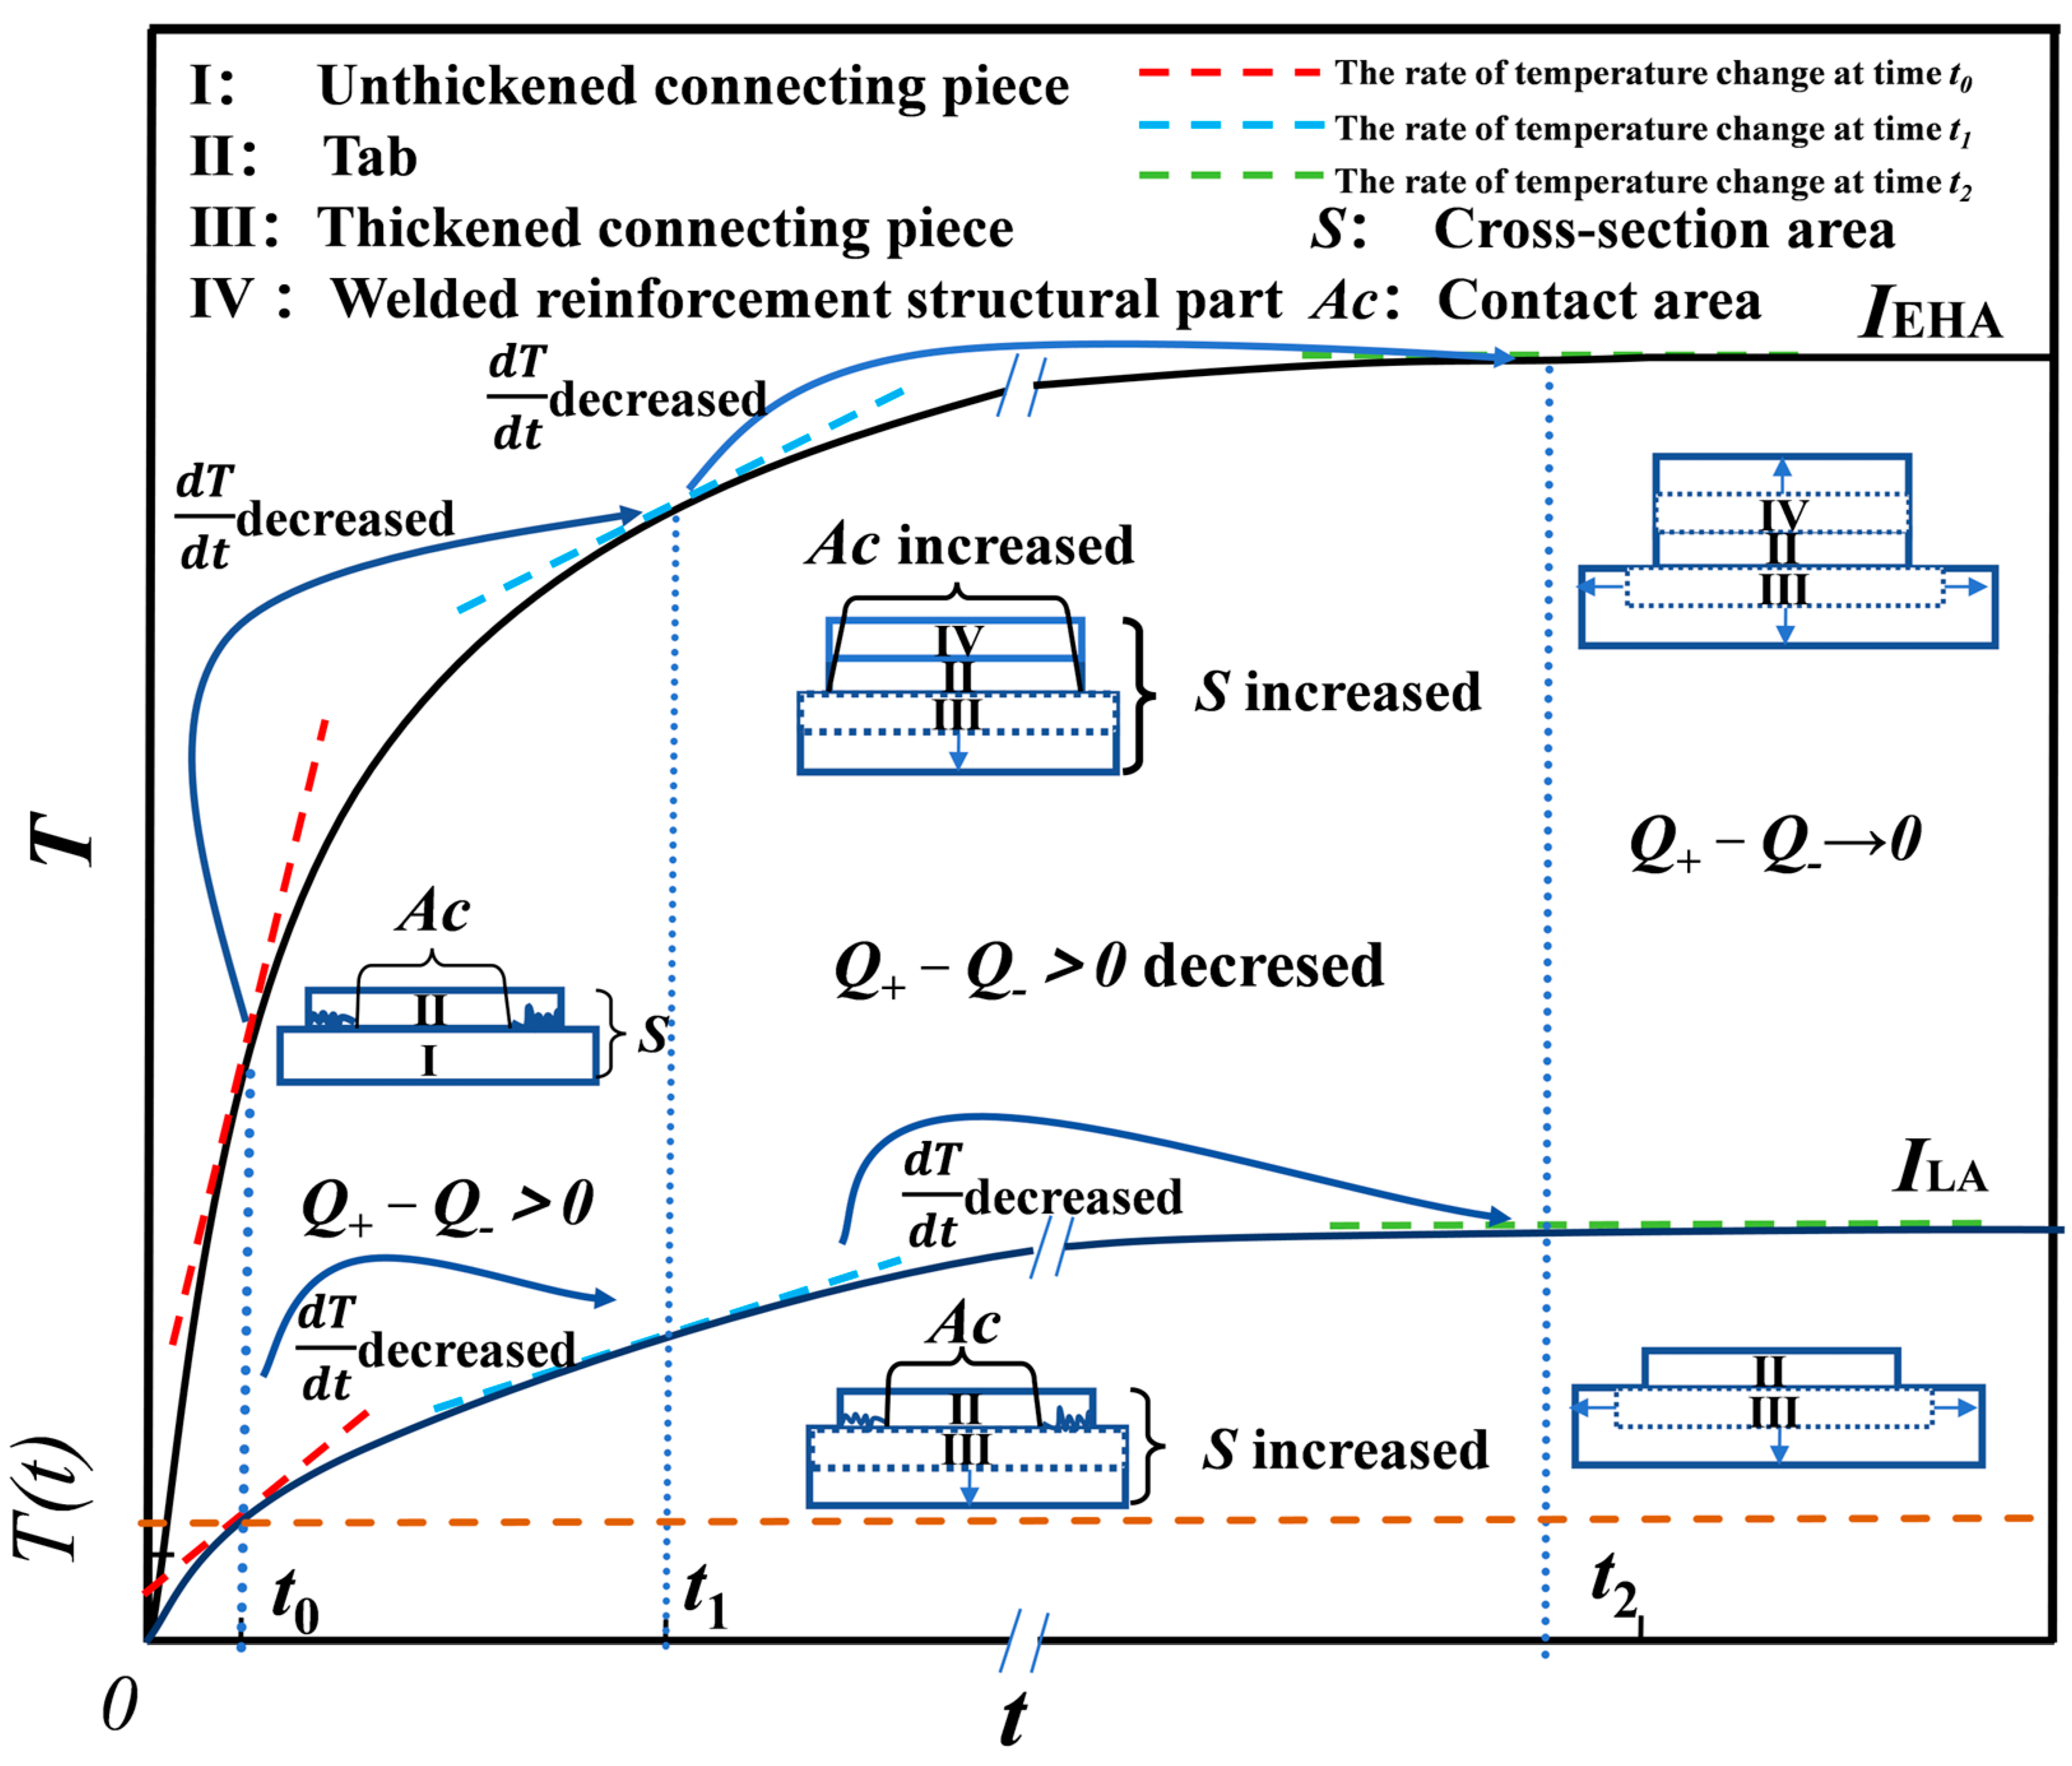
  • The dynamic effects of heat generation and heat dissipation in conductor structures differ markedly from those observed under low-current conditions. For low currents, increasing the cross-sectional area promotes thermal balance. However, for extreme high-amperage currents, it is necessary to simultaneously adjust both the cross-sectional area (to reduce heat generation) and the contact area (to enhance heat dissipation efficiency) to balance the difference between heat generation and heat dissipation.
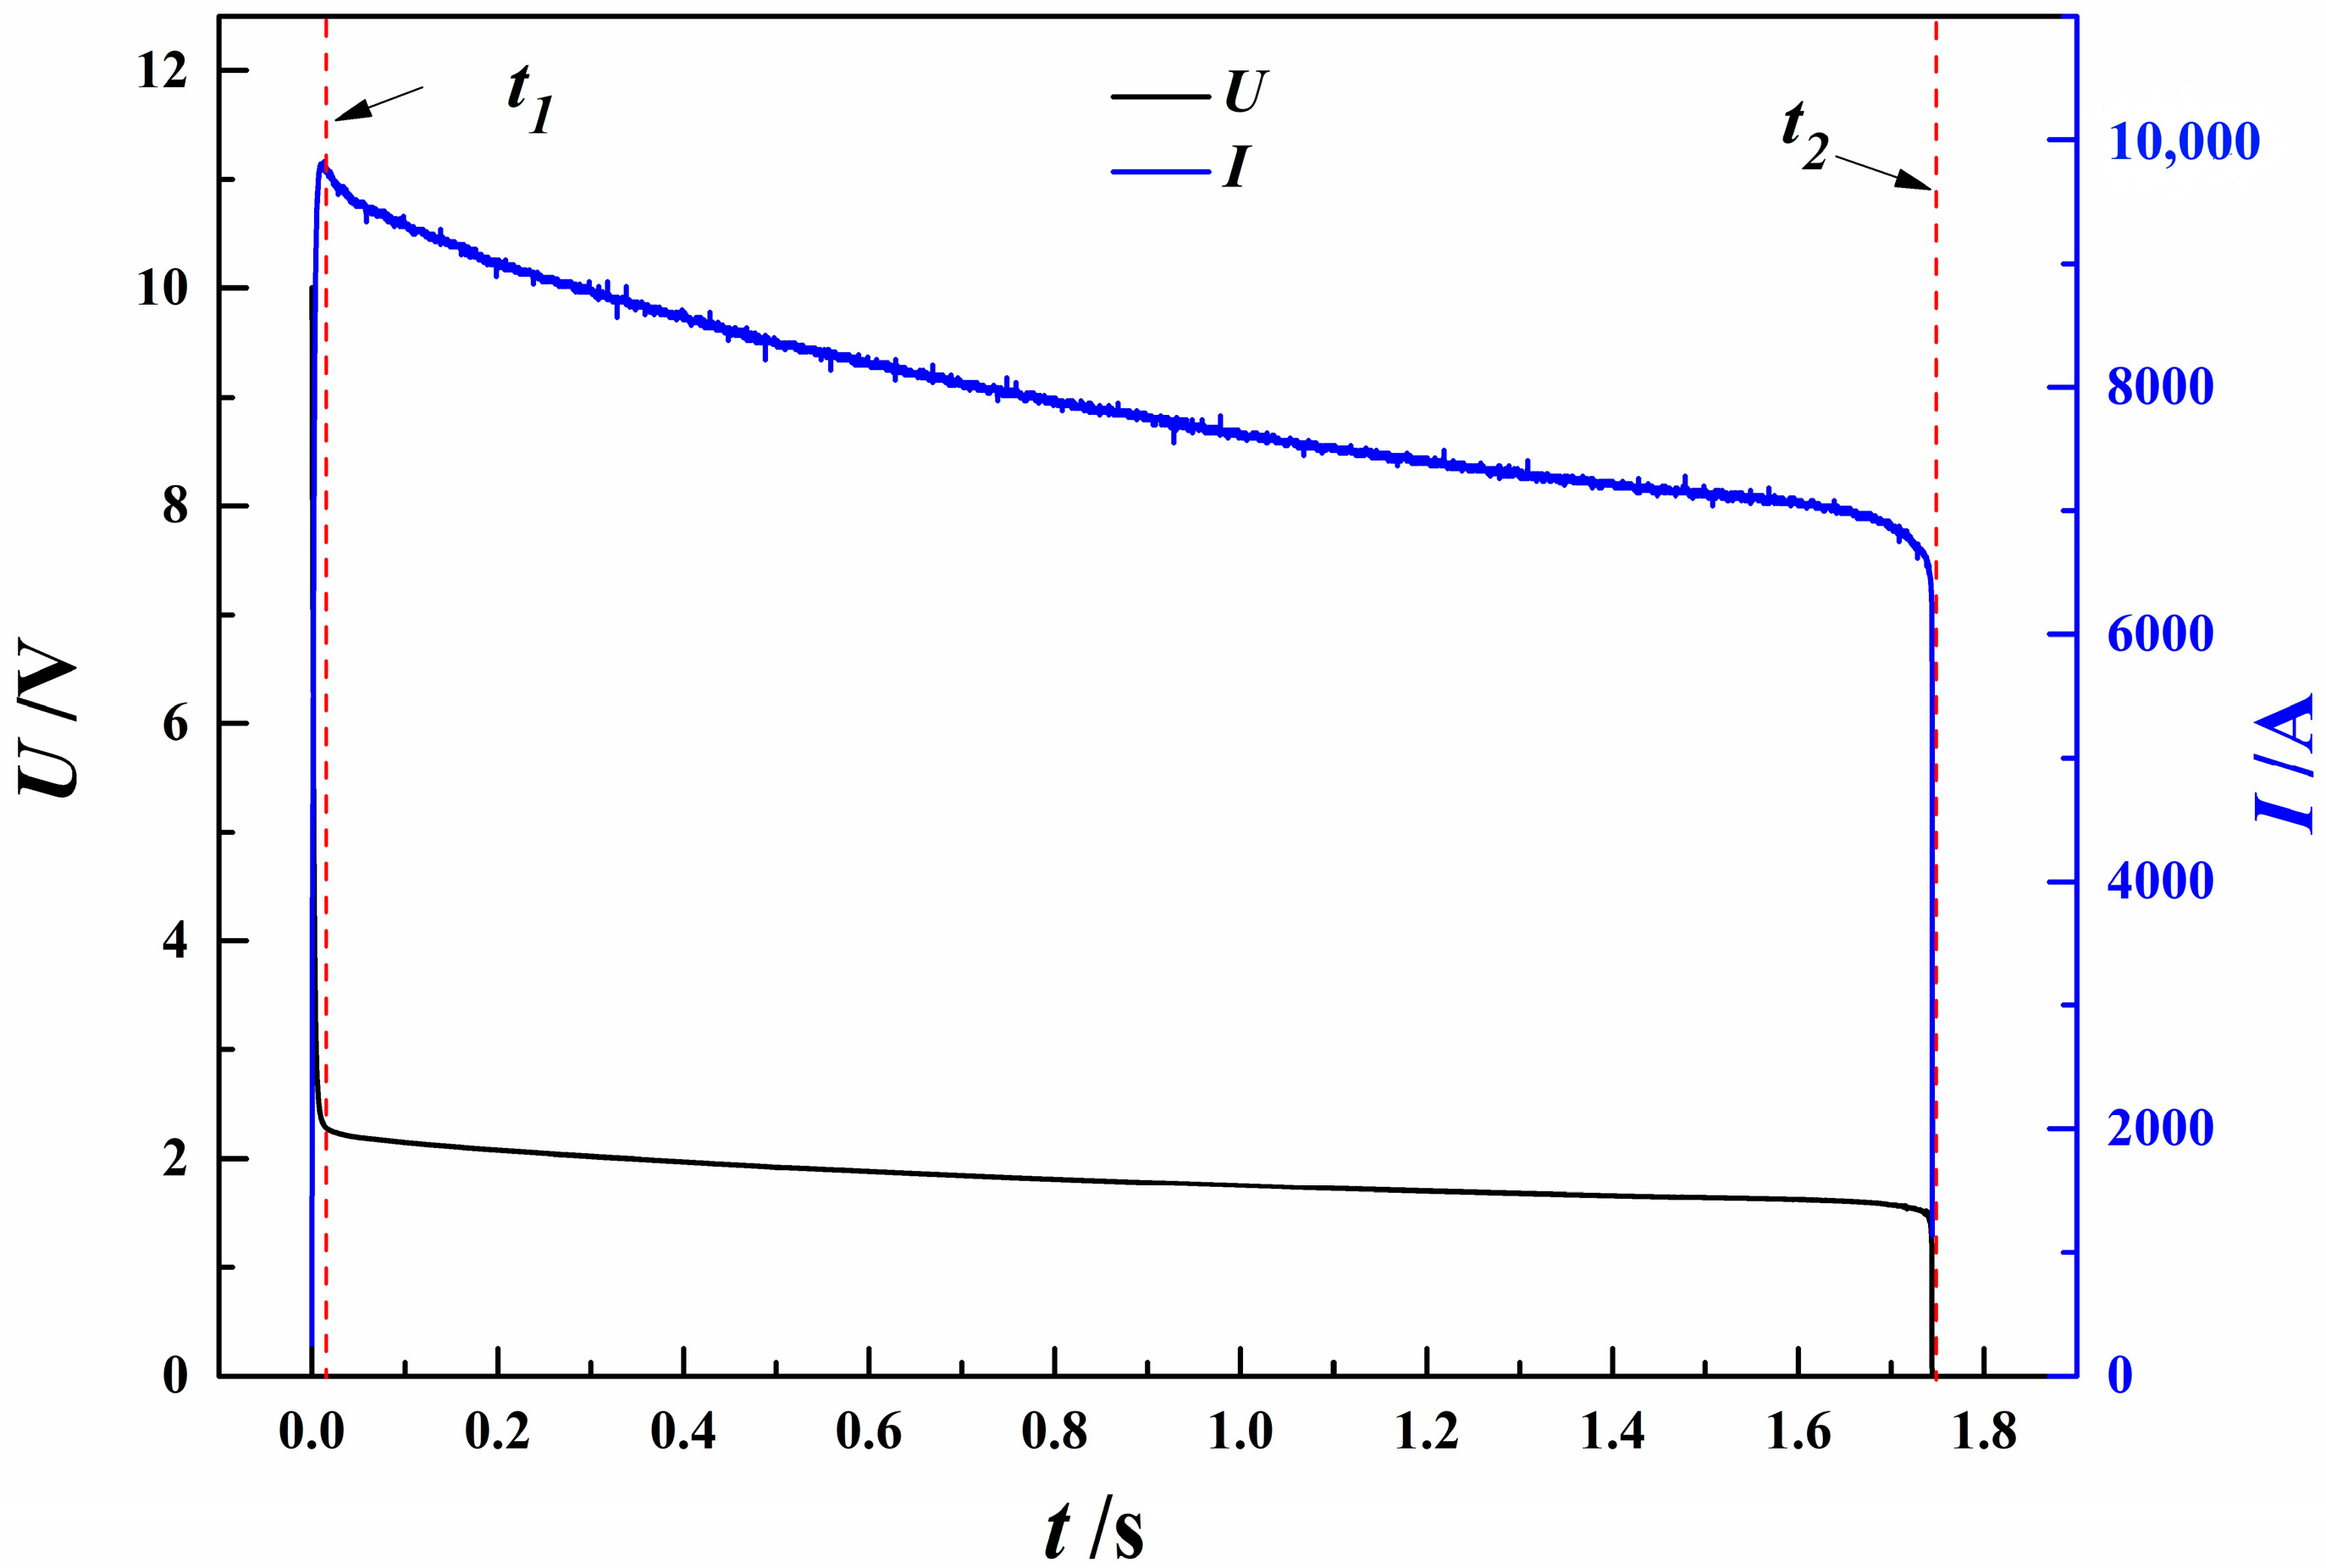
  • By introducing a welded reinforcement structure, the thermal conduction path transitions from a “welding-dominant” to a “welding–contact synergy” model. This optimization involves a similar increase in cross-sectional area compared to the traditional design and an additional 100% increase in contact area, ultimately extending the current-carrying duration to 1.73 s (230% of traditional design’s current-carrying duration). This synergy between structure and thermal balance significantly enhances the current-handling capacity of the conductor.

Author Contributions

Conceptualization, J.G. and H.L.; methodology, J.G.; software, Y.W.; validation, Y.W. and H.L.; formal analysis, J.G. and Y.W.; investigation, J.G. and Y.W.; resources, Y.L.; data curation, Y.L.; writing—original draft preparation, J.G.; writing—review and editing, H.L. and X.Y.; visualization, Y.L.; supervision, H.L.; project administration, Y.W. and H.L.; funding acquisition, Y.W. and H.L. All authors have read and agreed to the published version of the manuscript.

Funding

This research was funded by the Henan Provincial Science and Technology Research Project, 252102520048, and the Doctor Scientific Research Start-up Fund of Henan University of Science and Technology, 13480087, 13480130.

Institutional Review Board Statement

Not applicable.

Informed Consent Statement

Not applicable.

Data Availability Statement

Data available on request from the authors.

Acknowledgments

One of the authors, Yahui Liu, would like to express sincere gratitude for the financial support provided by the Central Plains Talent Program—Central Plains Young Postdoctoral Innovative Talent Project in Henan Province. This support has been crucial in facilitating the research presented in this work. The authors also extend their appreciation to all collaborators and institutions involved in this study.

Conflicts of Interest

Author Jingdi Guo was employed by the company China Lithium Battery Technology (Luoyang) Co., Ltd. The remaining authors declare that the research was conducted in the absence of any commercial or financial relationships that could be construed as a potential conflict of interest.

References

  1. Wenjun, L.; Hangyu, X.; Qi, Y.; Jiuming, L.; Zhenyu, Z.; Shengbin, W.; Jiayue, P.; Bin, Z.; Xianglei, C.; Zhen, Z. Development of Strategies for High-Energy-Density Lithium Batteries. Energy Storage Sci. Technol. 2020, 9, 448–478. [Google Scholar]
  2. Domínguez-Navarro, J.A.; Dufo-López, R.; Yusta-Loyo, J.M.; Artal-Sevil, J.S.; Bernal-Agustín, J.L. Design of an Electric Vehicle Fast-Charging Station with Integration of Renewable Energy and Storage Systems. Int. J. Electr. Power Energy Syst. 2019, 105, 46–58. [Google Scholar] [CrossRef]
  3. Akram, U.; Nadarajah, M.; Shah, R.; Milano, F. A Review on Rapid Responsive Energy Storage Technologies for Frequency Regulation in Modern Power Systems. Renew. Sustain. Energy Rev. 2020, 120, 109626. [Google Scholar] [CrossRef]
  4. Wang, W.; Rui, C.; Wei, W.; Wugui, W. Design and Verification of a Current-Pulsed Power Supply for Special Loads. Chin. J. Ship Res. 2019, 14, 30–36. [Google Scholar]
  5. Ouyang, D.; Chen, M.; Huang, Q.; Weng, J.; Wang, Z.; Wang, J. A Review on the Thermal Hazards of the Lithium-Ion Battery and the Corresponding Countermeasures. Appl. Sci. 2019, 9, 2483. [Google Scholar] [CrossRef]
  6. Feng, X.; Zheng, S.; Ren, D.; He, X.; Wang, L.; Cui, H.; Liu, X.; Jin, C.; Zhang, F.; Xu, C.; et al. Investigating the Thermal Runaway Mechanisms of Lithium-Ion Batteries Based on Thermal Analysis Database. Appl. Energy 2019, 246, 53–64. [Google Scholar] [CrossRef]
  7. Tao, J.; Wang, S.; Cao, W.; Fernandez, C.; Blaabjerg, F. A Comprehensive Review of Multiple Physical and Data-Driven Model Fusion Methods for Accurate Lithium-Ion Battery Inner State Factor Estimation. Batteries 2024, 10, 442. [Google Scholar] [CrossRef]
  8. Chen, Z.; Liu, W.; Xia, T.; Pan, E. Consistency Evaluation for Lithium-Ion Battery Energy Storage Systems Based on Approximate Low-Rank Representation and Hypersphere Concentration. IEEE Trans. Ind. Electron. 2024, 72, 4811–4821. [Google Scholar] [CrossRef]
  9. Ba, L.M.; Tang, K.; Kang, L.B.; Pan, G.H.; He, G.L. Thermal Effects and Structure Optimization of High Power Li-Ion Batteries. Chin. J. Power Sources 2018, 42, 3–7. [Google Scholar]
  10. Kong, L.; Li, Y.; Feng, W. Strategies to Solve Lithium Battery Thermal Runaway: From Mechanism to Modification. Electrochem. Energy Rev. 2021, 4, 633–679. [Google Scholar] [CrossRef]
  11. Finegan, D.P.; Darcy, E.; Keyser, M.; Tjaden, B.; Heenan, T.M.M.; Jervis, R.; Bailey, J.J.; Vo, N.T.; Magdysyuk, O.V.; Drakopoulos, M.; et al. Identifying the Cause of Rupture of Li-Ion Batteries during Thermal Runaway. Adv. Sci. 2018, 5, 1700369. [Google Scholar] [CrossRef]
  12. Tang, Y.; Zhang, Y.; Li, W.; Ma, B.; Chen, X. Rational Material Design for Ultrafast Rechargeable Lithium-Ion Batteries. Chem. Soc. Rev. 2015, 44, 5926–5940. [Google Scholar] [CrossRef]
  13. Xue, N.; Du, W.; Martins, J.R.R.A.; Shyy, W. Lithium-Ion Batteries: Thermomechanics, Performance, and Design Optimization. In Handbook of Clean Energy Systems; Wiley Online Library: Minneapolis, MN, USA, 2015; pp. 1–16. [Google Scholar] [CrossRef]
  14. Zaghib, K.; Dontigny, M.; Guerfi, A.; Charest, P.; Rodrigues, I.; Mauger, A.; Julien, C.M. Safe and Fast-Charging Li-Ion Battery with Long Shelf Life for Power Applications. J. Power Sources 2011, 196, 3949–3954. [Google Scholar] [CrossRef]
  15. Wang, J.; Sun, X. Understanding and Recent Development of Carbon Coating on LiFePO 4 Cathode Materials for Lithium-Ion Batteries. Energy Environ. Sci. 2012, 5, 5163–5185. [Google Scholar] [CrossRef]
  16. Cheng, G.; Gao, L.; Gu, H.; Wang, K. Developing and Fast Charge Performance of High Power Li-Ion Battery. Batter. Bimon. 2019, 049, 94–97. [Google Scholar]
  17. He, T.; Liu, W.; Mai, M.; Qi, J.; Lei, Y. Design of Fast Charging Electrolyte for Lithium Iron Phosphate. SINO-Glob. Energy 2024, 29, 29–35. [Google Scholar]
  18. Lei, S.; Zeng, Z.; Cheng, S.; Xie, J. Fast-charging of Lithium-ion Batteries: A Review of Electrolyte Design Aspects. Batter. Energy 2023, 2, 20230018. [Google Scholar] [CrossRef]
  19. Ai, X.; Song, K.; Guo, M.; Liu, X.; Zhang, Y.; Hu, B. Effect of Amorphous Carbon Coated Graphite Anode on Fast Charge Performance of Lithium Battery. Carbon N. Y. 2023, 4, 1–6. [Google Scholar]
  20. Balogun, M.-S.; Zhu, Y.; Qiu, W.; Luo, Y.; Huang, Y.; Liang, C.; Lu, X.; Tong, Y. Chemically Lithiated TiO 2 Heterostructured Nanosheet Anode with Excellent Rate Capability and Long Cycle Life for High-Performance Lithium-Ion Batteries. ACS Appl. Mater. Interfaces 2015, 7, 25991–26003. [Google Scholar] [CrossRef]
  21. Wang, D.; Liu, H.; Li, M.; Wang, X.; Bai, S.; Shi, Y.; Tian, J.; Shan, Z.; Meng, Y.S.; Liu, P.; et al. Nanosheet-Assembled Hierarchical Li4Ti5O12 Microspheres for High-Volumetric-Density and High-Rate Li-Ion Battery Anode. Energy Storage Mater. 2019, 21, 361–371. [Google Scholar] [CrossRef]
  22. Afaynou, I.; Faraji, H.; Choukairy, K.; Khallaki, K.; Akrour, D. Effectiveness of a PCM-Based Heat Sink with Partially Filled Metal Foam for Thermal Management of Electronics. Int. J. Heat Mass Transf. 2024, 235, 126196. [Google Scholar] [CrossRef]
  23. Kaliaperumal, M.; Dharanendrakumar, M.S.; Prasanna, S.; Abhishek, K.V.; Chidambaram, R.K.; Adams, S.; Zaghib, K.; Reddy, M.V. Cause and Mitigation of Lithium-Ion Battery Failure—A Review. Materials 2021, 14, 5676. [Google Scholar] [CrossRef] [PubMed]
  24. Zhu, P.; Gastol, D.; Marshall, J.; Sommerville, R.; Goodship, V.; Kendrick, E. A Review of Current Collectors for Lithium-Ion Batteries. J. Power Sources 2021, 485, 229321. [Google Scholar] [CrossRef]
  25. Zhang, M.; Liu, L.; Stefanopoulou, A.; Siegel, J.; Lu, L.; He, X.; Ouyang, M. Fusing Phenomenon of Lithium-Ion Battery Internal Short Circuit. J. Electrochem. Soc. 2017, 164, A2738–A2745. [Google Scholar] [CrossRef]
  26. Grandjean, T.; Barai, A.; Hosseinzadeh, E.; Guo, Y.; McGordon, A.; Marco, J. Large Format Lithium Ion Pouch Cell Full Thermal Characterisation for Improved Electric Vehicle Thermal Management. J. Power Sources 2017, 359, 215–225. [Google Scholar] [CrossRef]
  27. Lai, Y.; Du, S.; Ai, L.; Ai, L.; Cheng, Y.; Tang, Y.; Jia, M. Insight into Heat Generation of Lithium Ion Batteries Based on the Electrochemical-Thermal Model at High Discharge Rates. Int. J. Hydrogen Energy 2015, 40, 13039–13049. [Google Scholar] [CrossRef]
  28. Jiang, F.; Peng, P.; Sun, Y. Thermal Analyses of LiFePO4/Graphite Battery Discharge Processes. J. Power Sources 2013, 243, 181–194. [Google Scholar] [CrossRef]
  29. Drake, S.J.; Martin, M.; Wetz, D.A.; Ostanek, J.K.; Miller, S.P.; Heinzel, J.M.; Jain, A. Heat Generation Rate Measurement in a Li-Ion Cell at Large C-Rates through Temperature and Heat Flux Measurements. J. Power Sources 2015, 285, 266–273. [Google Scholar] [CrossRef]
  30. Basu, S.; Patil, R.S.; Ramachandran, S.; Hariharan, K.S.; Kolake, S.M.; Song, T.; Oh, D.; Yeo, T.; Doo, S. Non-Isothermal Electrochemical Model for Lithium-Ion Cells with Composite Cathodes. J. Power Sources 2015, 283, 132–150. [Google Scholar] [CrossRef]
  31. Jin, Y.; Zhao, W.; Li, Z.; Liu, B.; Liu, L. Modeling and Simulation of Lithium-Ion Battery Considering the Effect of Charge-Discharge State. J. Phys. Conf. Ser. 2021, 1907, 012003. [Google Scholar] [CrossRef]
  32. Panchal, S.; Rashid, M.; Long, F.; Mathew, M.; Fraser, R.; Fowler, M. Degradation Testing and Modeling of 200 Ah LiFePO4 Battery; SAE Technical Paper 2018-01-0441; SAE: Detroit Michigan, MI, USA, 3 April 2018. [Google Scholar] [CrossRef]
  33. Burke, A.; Miller, M. Life Cycle Testing of Lithium Batteries for Fast Charging and Second-Use Applications. In Proceedings of the 2013 World Electric Vehicle Symposium and Exhibition (EVS27), Barcelona, Spain, 17–20 November 2013; pp. 1–10. [Google Scholar]
  34. Ferguson, S.; Brenner, C.; Cox, J.; Foote, B.; Hensley, K.; Ruth, N. Saft’s Xcelion 6T® 28V Lithium Ion Batteries for Military Vehicles. In Proceedings of the 2017 Ndia Ground Vehicle Systems Engineering and Technology Symposium, Power & Mobility (P&M) Technical Session, Novi, MI, USA, 8–10 August 2017. [Google Scholar]
  35. Bingkun, G. Lithium-Ion Batteries; Central South University Press: Changsha, China, 2005; ISBN 7-81061-5632-7. [Google Scholar]
  36. Scrosati, B. Lithium Batteries: Science and Technology. Electrochim. Acta 2004, 49, 2215–2216. [Google Scholar] [CrossRef]
  37. Bo, L. Research on the Safety Performance of Lithium-Ion Batteries; Central South University Press: Changsha, China, 2014; ISBN 9787548712435. [Google Scholar]
  38. Maher, K.; Boumaiza, A.; Amin, R. Understanding the Heat Generation Mechanisms and the Interplay between Joule Heat and Entropy Effects as a Function of State of Charge in Lithium-Ion Batteries. J. Power Sources 2024, 623, 235504. [Google Scholar] [CrossRef]
  39. Lei, S.; Yanzhe, X.; Zhuoran, Z. Research of Heating Power of Lithium-Ion Battery Based on Discharging Curve. Mar. Electr. Electron. Technol. 2022, 42, 61–64. [Google Scholar] [CrossRef]
  40. Mama, M.; Solai, E.; Capurso, T.; Danlos, A.; Khelladi, S. Comprehensive Review of Multi-Scale Lithium-Ion Batteries Modeling: From Electro-Chemical Dynamics up to Heat Transfer in Battery Thermal Management System. Energy Convers. Manag. 2025, 325, 119223. [Google Scholar] [CrossRef]
  41. Tang, M.; Wu, C.; Peng, W.; Han, R.; Zhang, S.; Wang, D. Numerical Simulation Study on the Impact of Convective Heat Transfer on Lithium Battery Air Cooling Thermal Model. Appl. Therm. Eng. 2024, 257, 124220. [Google Scholar] [CrossRef]
  42. Sun, H.; Tian, W.; Yue, J.; Su, F. Lithium-Ion Battery Heterogeneous Electrochemical-Thermal-Mechanical Multiphysics Coupling Model and Characterization of Microscopic Properties. J. Power Sources 2025, 629, 235970. [Google Scholar] [CrossRef]
  43. Alkhedher, M.; Al Tahhan, A.B.; Yousaf, J.; Ghazal, M.; Shahbazian-Yassar, R.; Ramadan, M. Electrochemical and Thermal Modeling of Lithium-Ion Batteries: A Review of Coupled Approaches for Improved Thermal Performance and Safety Lithium-Ion Batteries. J. Energy Storage 2024, 86, 111172. [Google Scholar] [CrossRef]
  44. Wang, Y.; Ni, R.; Jiang, X.; Yin, M.; Zhang, D.; Xie, Z. An Electrochemical-Mechanical Coupled Multi-Scale Modeling Method and Full-Field Stress Distribution of Lithium-Ion Battery. Appl. Energy 2023, 347, 121444. [Google Scholar] [CrossRef]
  45. Liu, Y.; Tang, S.; Li, L.; Liu, F.; Jiang, L.; Jia, M.; Ai, Y.; Yao, C.; Gu, H. Simulation and Parameter Identification Based on Electrochemical- Thermal Coupling Model of Power Lithium Ion-Battery. J. Alloys Compd. 2020, 844, 156003. [Google Scholar] [CrossRef]
  46. Qiu, C.; He, G.; Shi, W.; Zou, M.; Liu, C. The Polarization Characteristics of Lithium-Ion Batteries under Cyclic Charge and Discharge. J. Solid State Electrochem. 2019, 23, 1887–1902. [Google Scholar] [CrossRef]
  47. Zhao, D.; Chen, W. Analysis of Polarization and Thermal Characteristics in Lithium-Ion Battery with Various Electrode Thicknesses. J. Energy Storage 2023, 71, 108159. [Google Scholar] [CrossRef]
  48. Yang, F.; Qiao, Y.; Gao, B.; Duan, P.; Zhu, Y. Investigation on Li-Ion Battery Charging Polarization Characteristics and Influence Factors. Ionics 2016, 22, 1603–1610. [Google Scholar] [CrossRef]
  49. Xie, W.; Guo, P.; Gao, X. Elucidating the Rate Limitation of Lithium-Ion Batteries under Different Charging Conditions through Polarization Analysis. J. Energy Storage 2024, 82, 110554. [Google Scholar] [CrossRef]
  50. Zhang, B.; Chen, M.; Yang, D. Investigation of the Polarization Effect in Lithium Iron Phosphate Battery for Electric Vehicles. In Proceedings of the 2014 IEEE Conference and Expo Transportation Electrification Asia-Pacific (ITEC Asia-Pacific), Beijing, China, 31 August–3 September 2014; pp. 1–5. [Google Scholar] [CrossRef]
  51. Wimarshana, B.; Bin-Mat-Arishad, I.; Fly, A. A Multi-Step Parameter Identification of a Physico-Chemical Lithium-Ion Battery Model with Electrochemical Impedance Data. J. Power Sources 2023, 580, 233400. [Google Scholar] [CrossRef]
  52. Li, Z.; Gao, M.; Zhao, X.; Cai, X.; Zhang, Y. Heat Generation Effect and Failure Mechanism of Pouch-Type Lithium-Ion Battery under over-Discharge for Electric Vehicle. J. Energy Storage 2024, 76, 109759. [Google Scholar] [CrossRef]
  53. Taheri, P.; Hsieh, S.; Bahrami, M. Investigating Electrical Contact Resistance Losses in Lithium-Ion Battery Assemblies for Hybrid and Electric Vehicles. J. Power Sources 2011, 196, 6525–6533. [Google Scholar] [CrossRef]
  54. Mo, J.; Zhang, G.; Zhang, J.; Mo, C.; Wang, B.; Guo, S.; Jiang, R.; Liu, J.; Peng, K. Effect of Cold Welding on the Inconsistencies and Thermal Safety of Battery Modules Based on a Constructed Discharge Model. Appl. Energy 2025, 377, 124570. [Google Scholar] [CrossRef]
  55. Brand, M.J.; Schmidt, P.A.; Zaeh, M.F.; Jossen, A. Welding Techniques for Battery Cells and Resulting Electrical Contact Resistances. J. Energy Storage 2015, 1, 7–14. [Google Scholar] [CrossRef]
Figure 1. Flow chart of evaluation methodology.
Applsci 15 05338 g001
Figure 2. Schematic diagram of conductor structure: (a) C0; (b) T1; (c) T2.
Applsci 15 05338 g002
Figure 3. Grid sectional drawing of conductor structures.
Applsci 15 05338 g003
Figure 4. Schematic diagram of battery discharging test for different conductor structures.
Applsci 15 05338 g004
Figure 5. Results of thermal field simulation for C0 group: (a) variation curve of temperature in different structure parts with discharging time; (b) temperature field of conductor structures.
Applsci 15 05338 g005
Figure 6. Results of thermal field simulation for T1 group: (a) variation curve of temperature in different structure parts with discharging time; (b) temperature field of conductor structures.
Applsci 15 05338 g006
Figure 7. Results of thermal field simulation for T2 group: (a) variation curve of temperature in different structure parts with discharging time; (b) temperature field of conductor structures.
Applsci 15 05338 g007
Figure 8. Variation curves of voltage and current with discharge time for C0 group.
Applsci 15 05338 g008
Figure 9. Variation curves of voltage and current with discharge time for T1 group.
Applsci 15 05338 g009
Figure 10. Variation curves of voltage and current with discharge time for T2 group.
Applsci 15 05338 g010
Figure 11. Comparison of temperature rise curves over time between unthickened and thickened connecting piece.
Applsci 15 05338 g011
Figure 12. Comparison of temperature rise curves over time between unconfigured and configured welded reinforcement structural part.
Applsci 15 05338 g012
Figure 13. Design guideline for current-carrying structure considering dynamic effect of heat generation and heat dissipation.
Applsci 15 05338 g013
Table 1. Thermophysical parameters of conductor structure model.
Structural PartsDensity
(kg/m3)
Specific Heat Capacity
(J/kg°C)
Thermal Conductivity
(w/m2·K)
Positive connecting piece2.7 × 1038.8 × 102237
Negative connecting piece8.9 × 1033.9 × 102394
Positive tab2.7 × 1038.8 × 102237
Negative tab8.9 × 1033.9 × 102394
Positive welded reinforcement structural part2.7 × 1038.8 × 102237
Negative welded reinforcement structural part8.9 × 1033.9 × 102394
Table 2. Design size of the conductor structure.
Structural PartsDimensions (L × W × D/mm)
Unthickened connecting piece54 × 40 × 1
Thickened connecting piece54 × 40 × 1.5
Welded reinforcement structural part38 × 37.5 × 0.2 (thickness before welding)
Table 3. Design parameter of different configuration groups.
Configuration GroupsCross-Sectional Area of Overflow (mm2)Solder Area (mm2)Contact Area of Overflow
(mm2)
C054100348
T181100348
T2 88.5100580
Table 4. Current-carrying time for different conductor configurations.
Configuration GroupTest Current-Carrying Time (s)Simulated Current-Carrying Time (s)
Control Group (C0)0.750.44
0.98
0.79
Test Group 1 (T1)0.800.68
1.2
0.95
Test Group 2 (T2)1.731.73
1.89
1.74
Disclaimer/Publisher’s Note: The statements, opinions and data contained in all publications are solely those of the individual author(s) and contributor(s) and not of MDPI and/or the editor(s). MDPI and/or the editor(s) disclaim responsibility for any injury to people or property resulting from any ideas, methods, instructions or products referred to in the content.

