

Study on Optimization of Filling Schemes and Surface Stability in Multi-Mining Right Intersection Areas

 ,
,
Abstract
1. Introduction
2. Overview
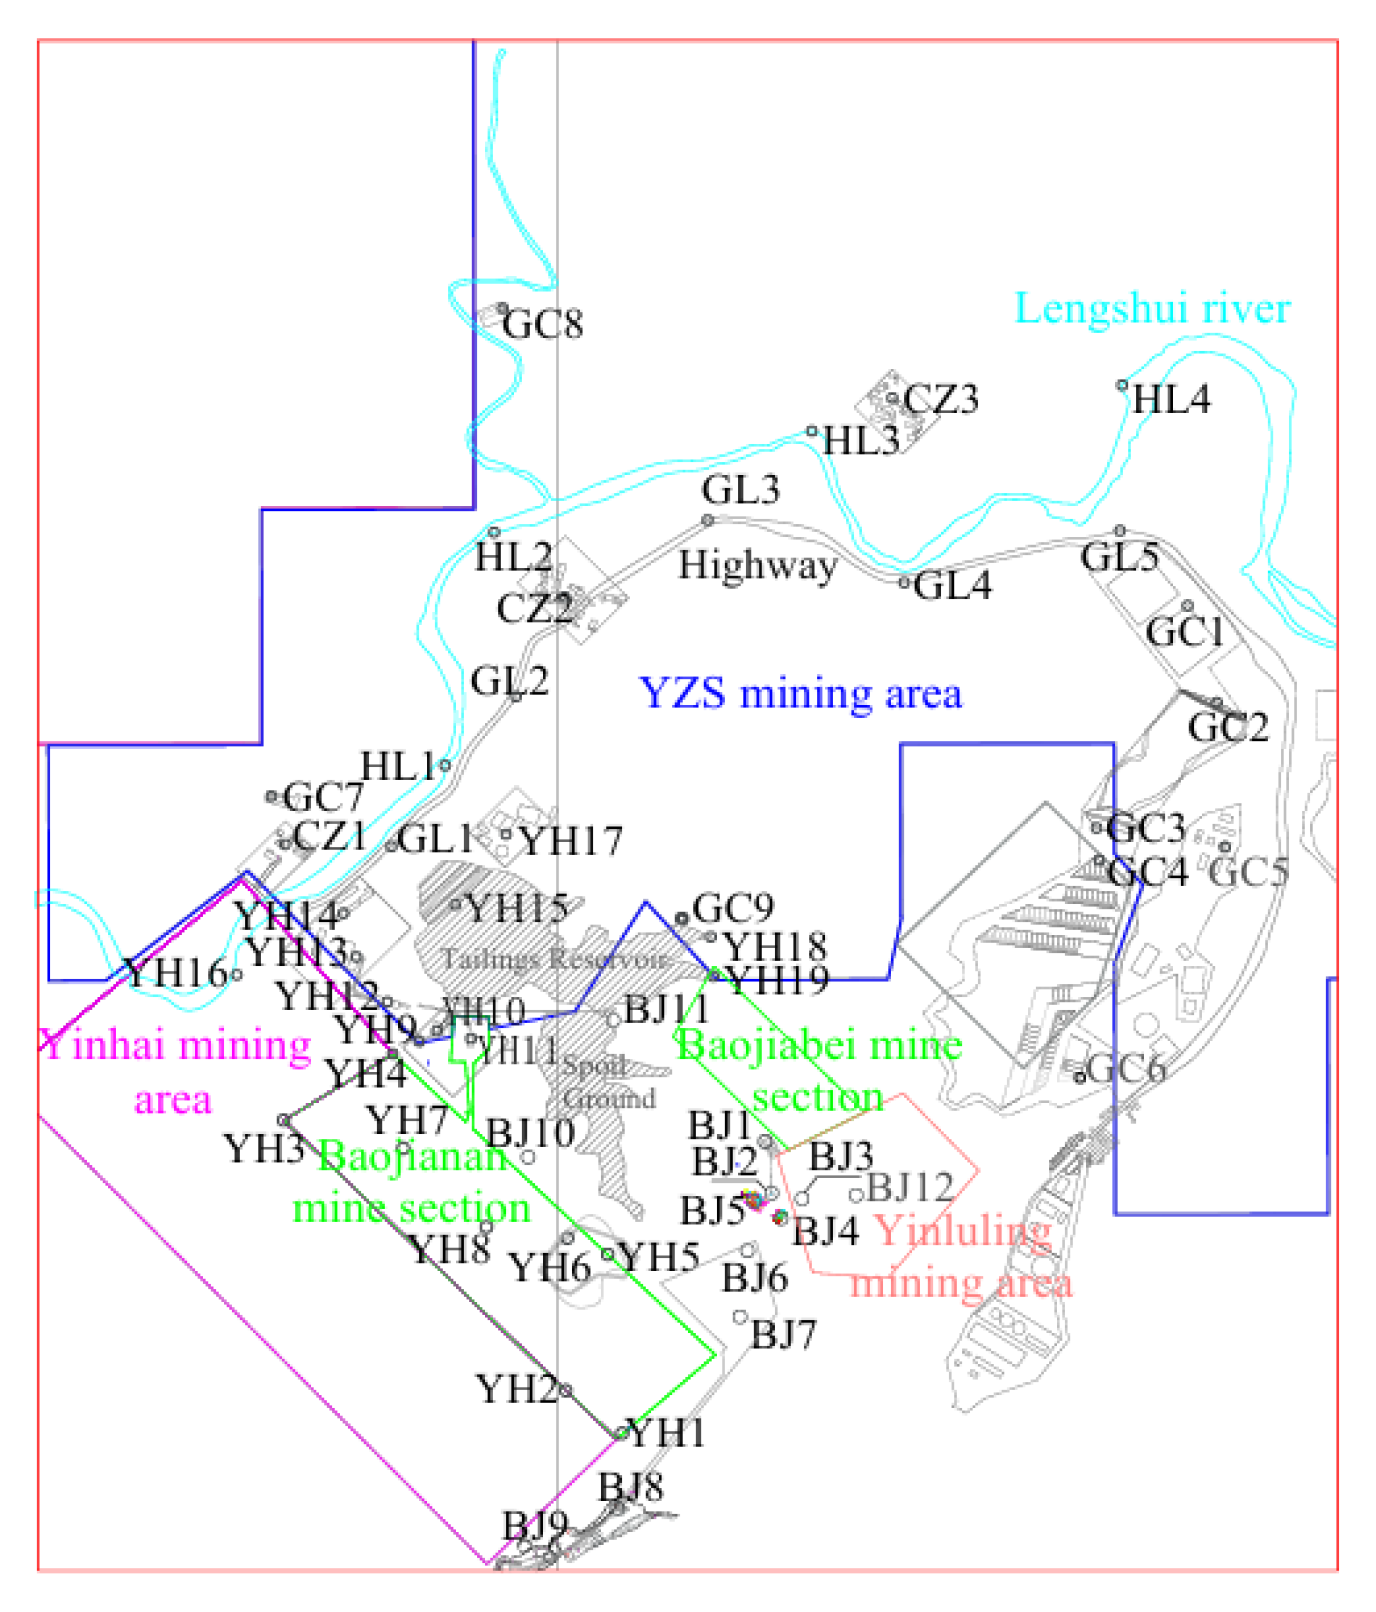
2.1. General Situation of Mining Area
2.2. Layout of Monitoring Points
2.3. Stability Criterion
3. Model Establishment and Parameter Determination
3.1. Model Establishment
3.2. Parameter Selection
4. Analysis of Numerical Simulation Results
4.1. Calculation Formulas for Surface Subsidence and Horizontal Displacement Deformation
4.2. Results and Analysis
- (1)
- Surface subsidence
- (2)
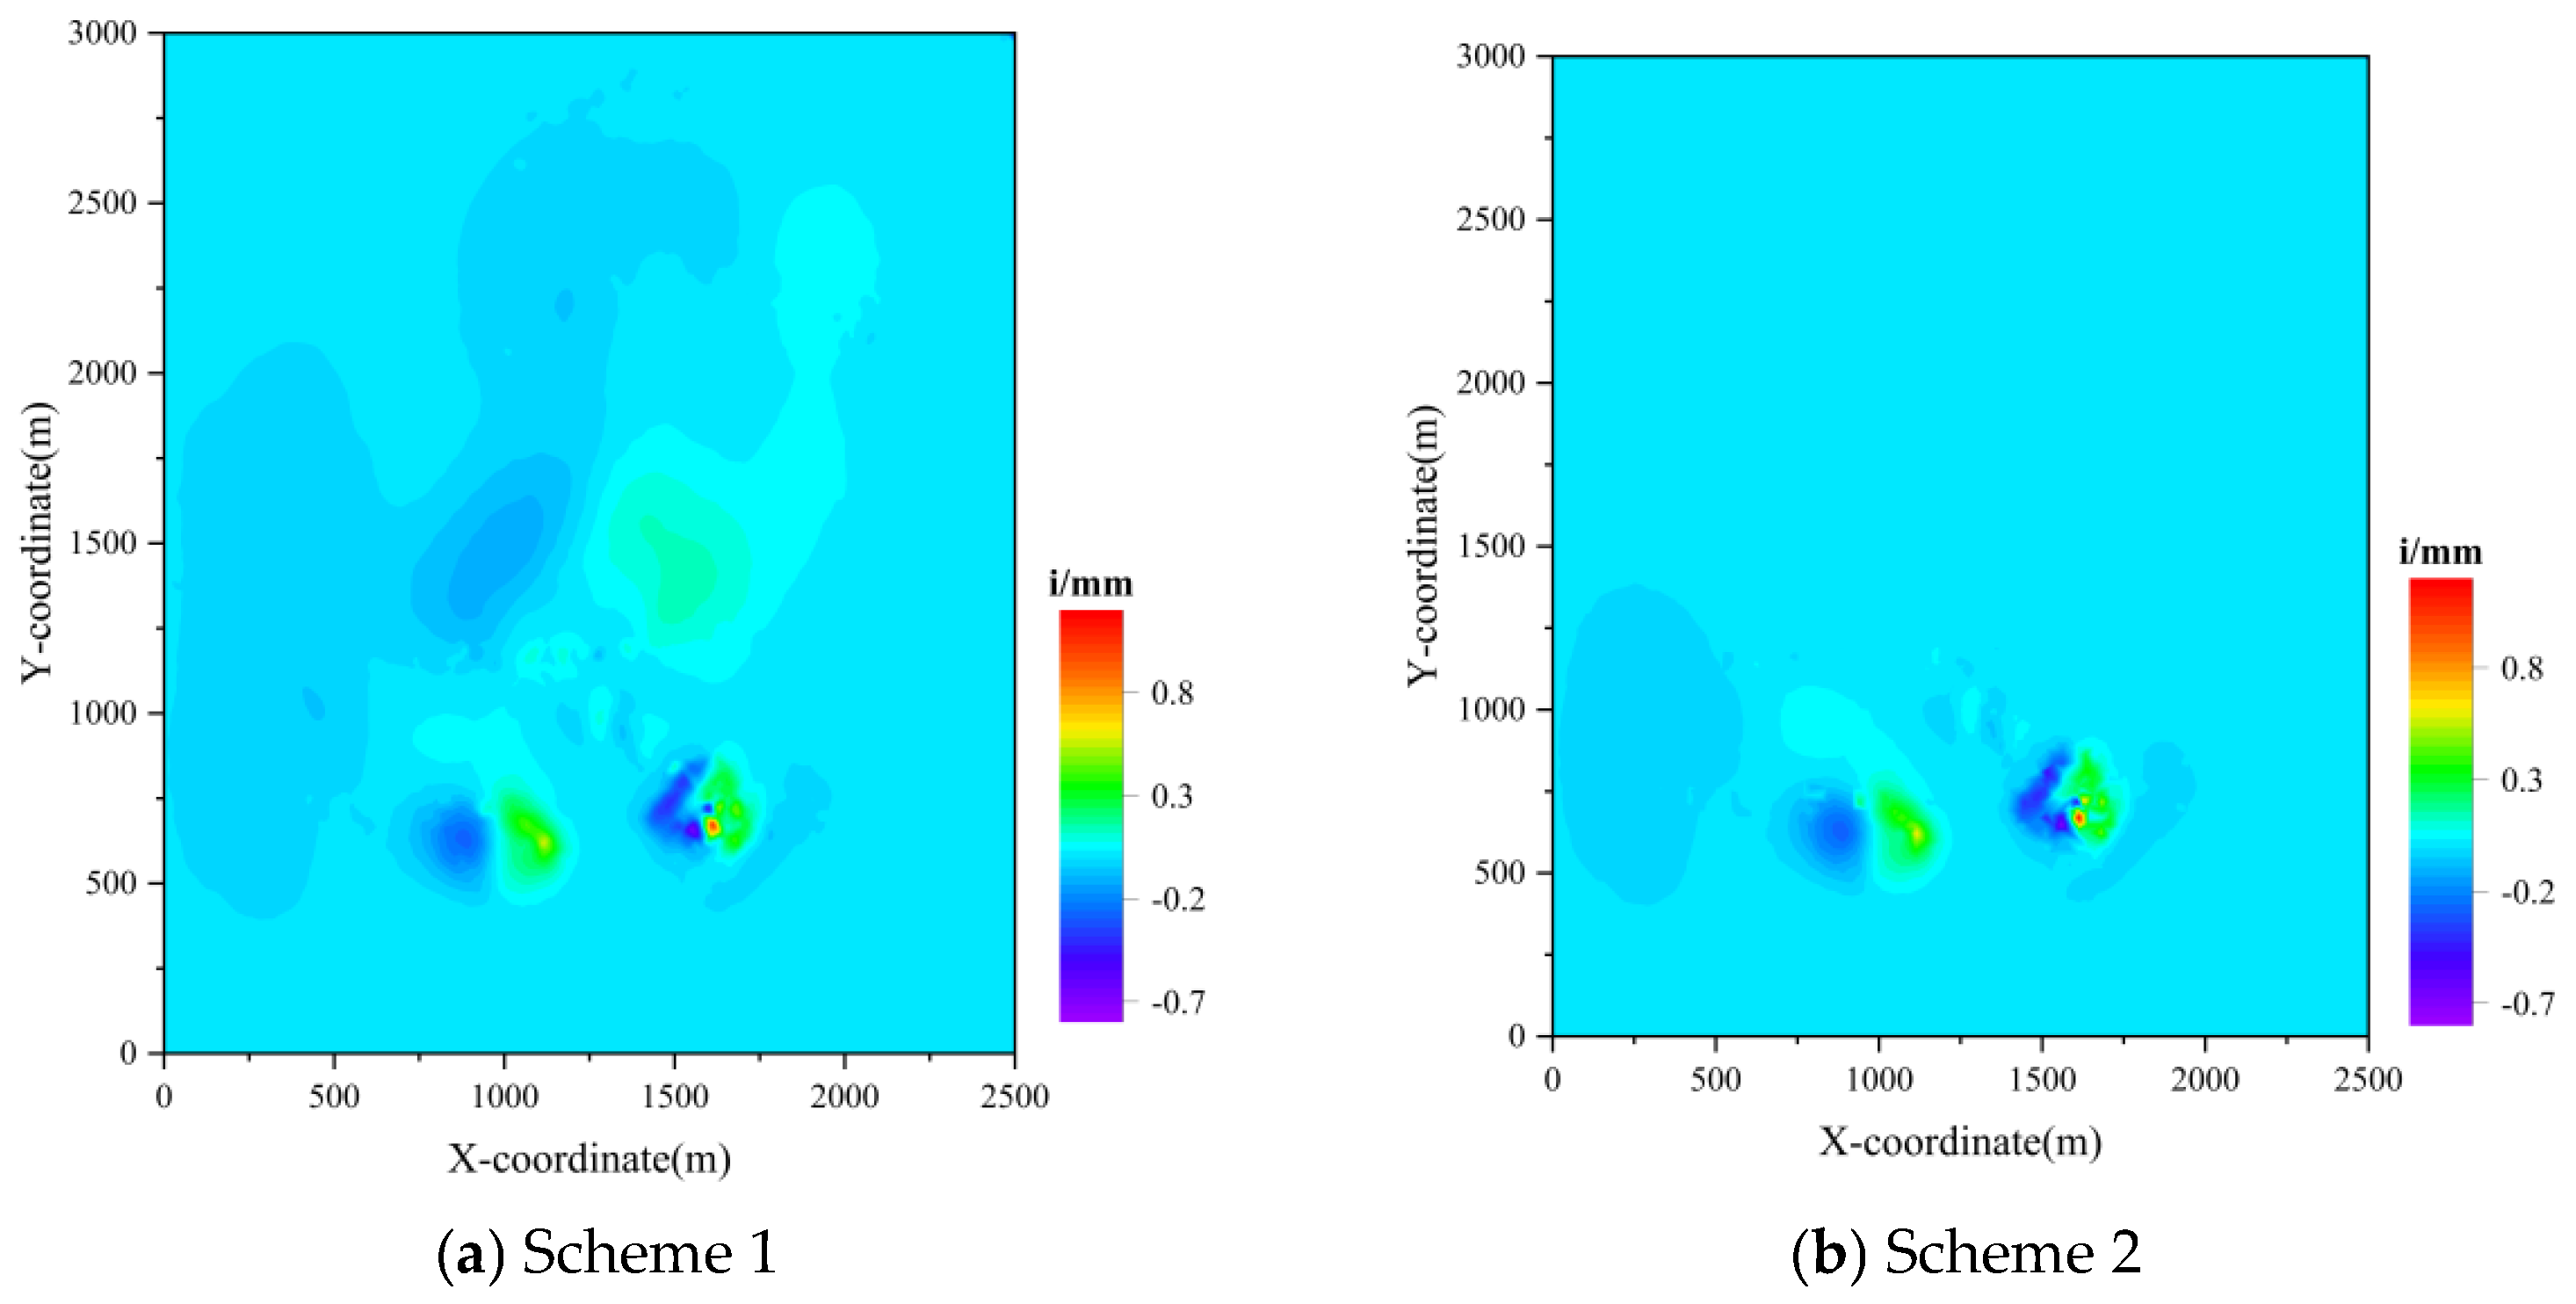
- Surface tilt rate
- (3)
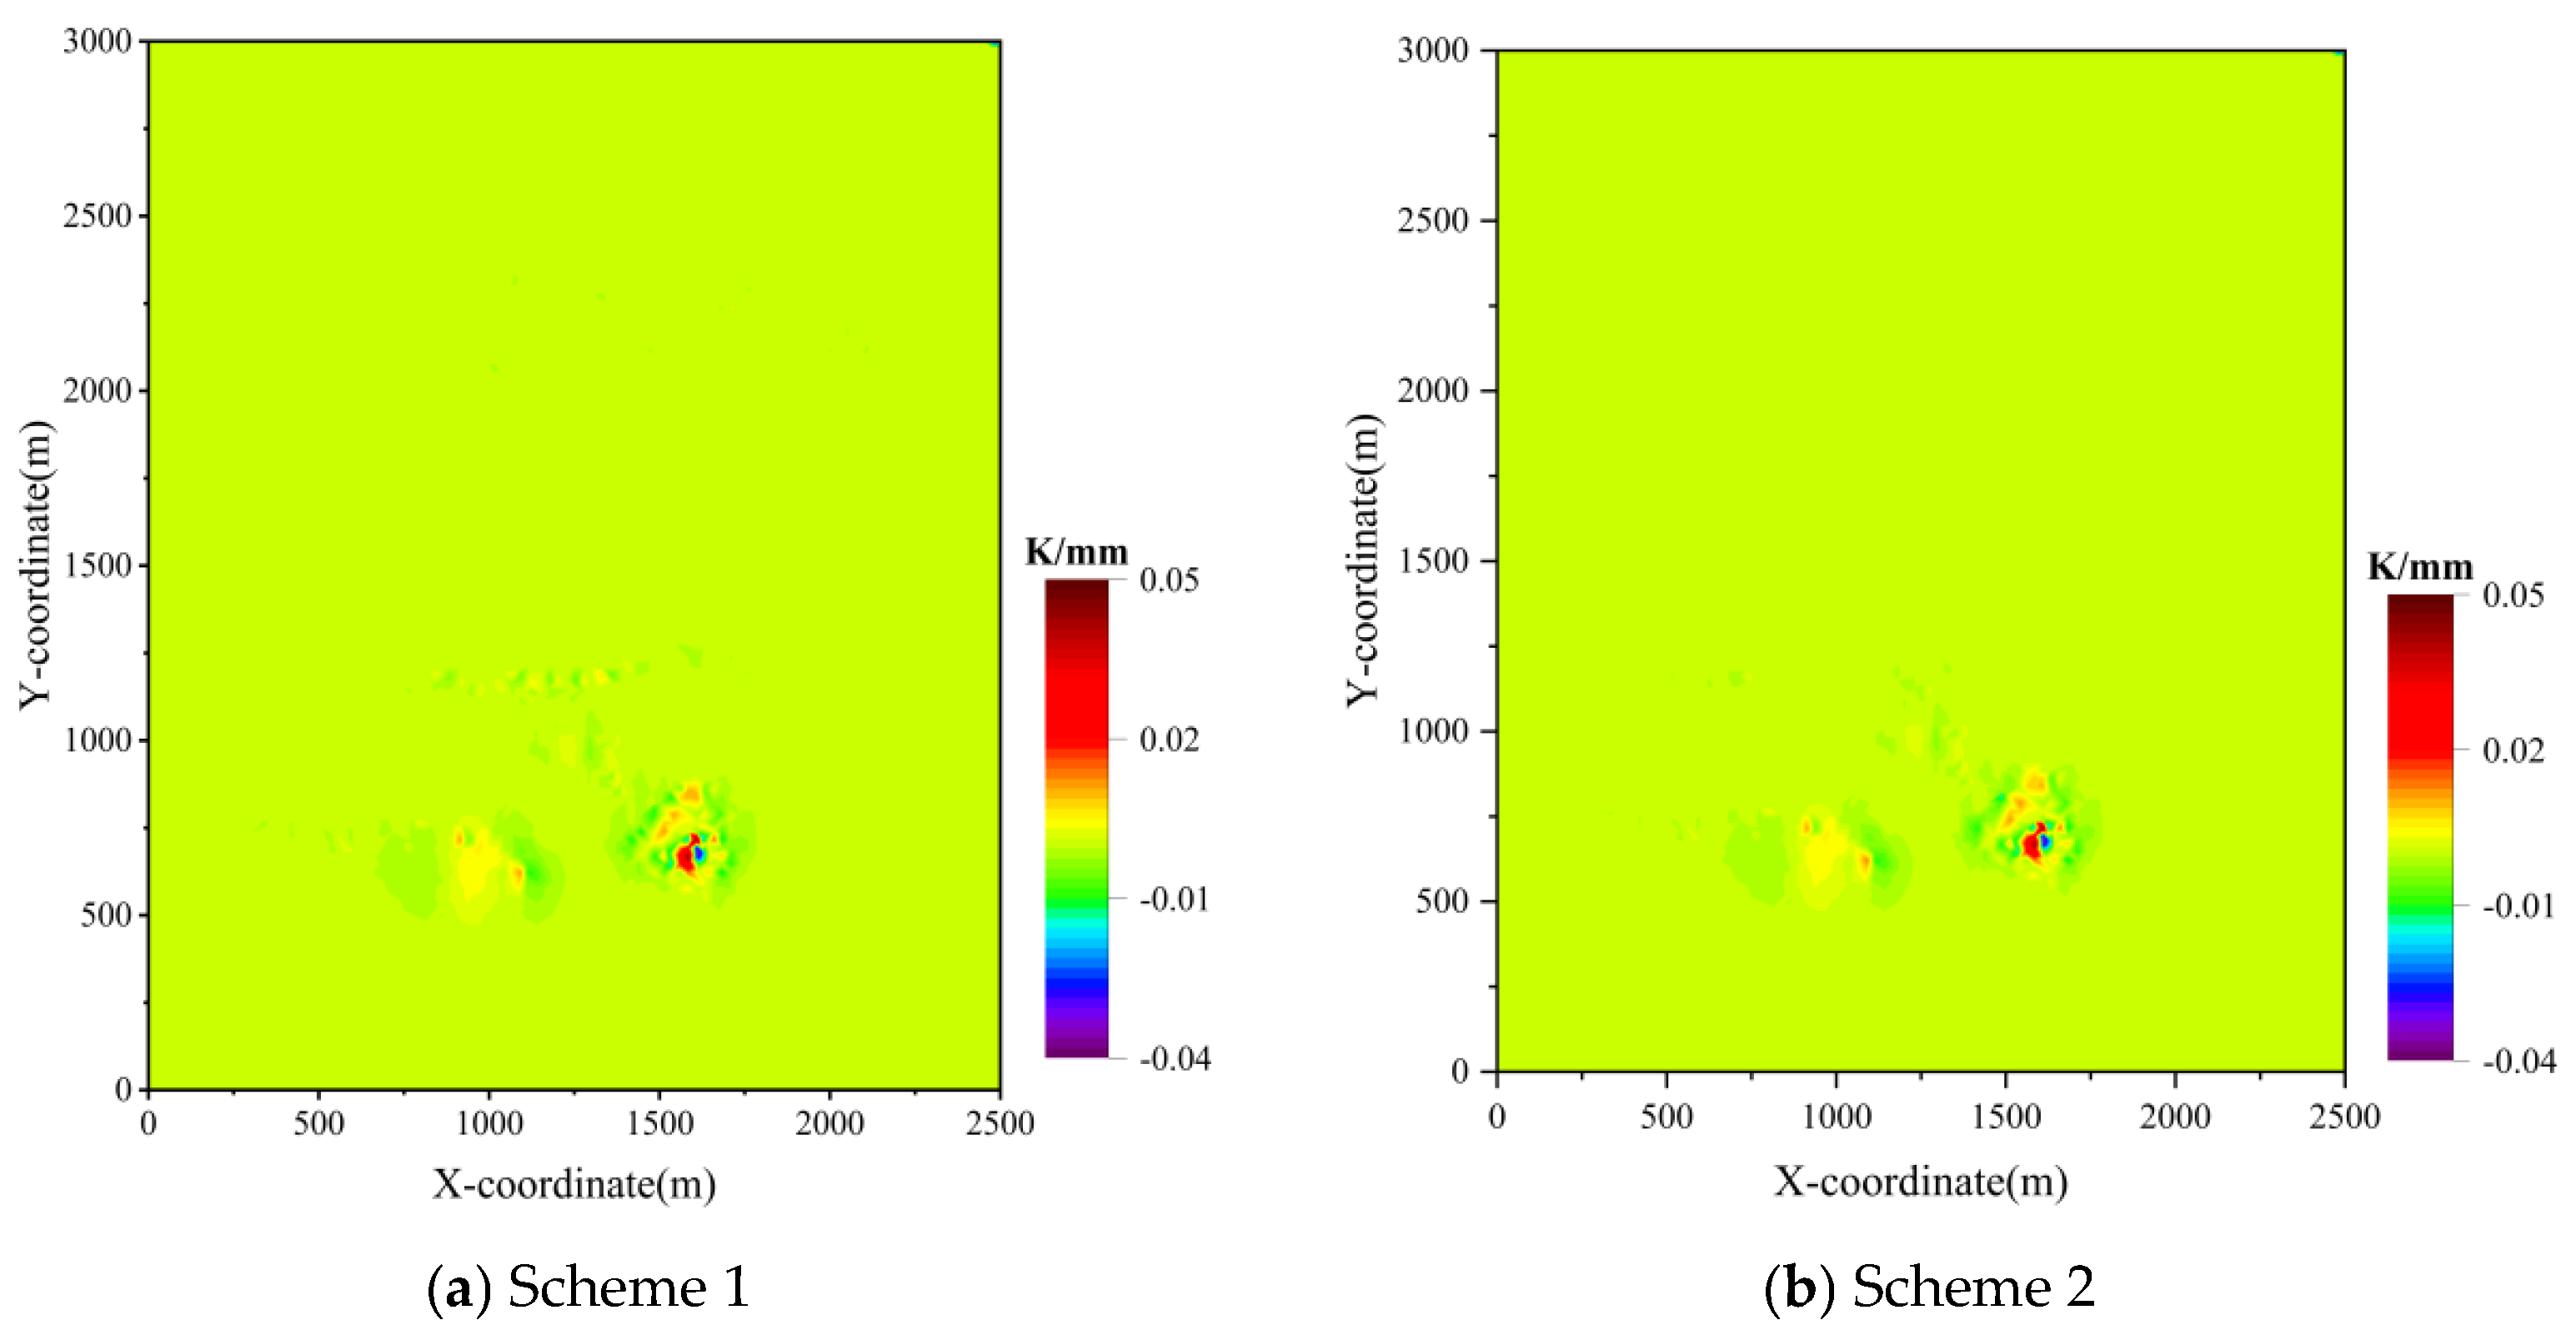
- Terrain curvature
- (4)
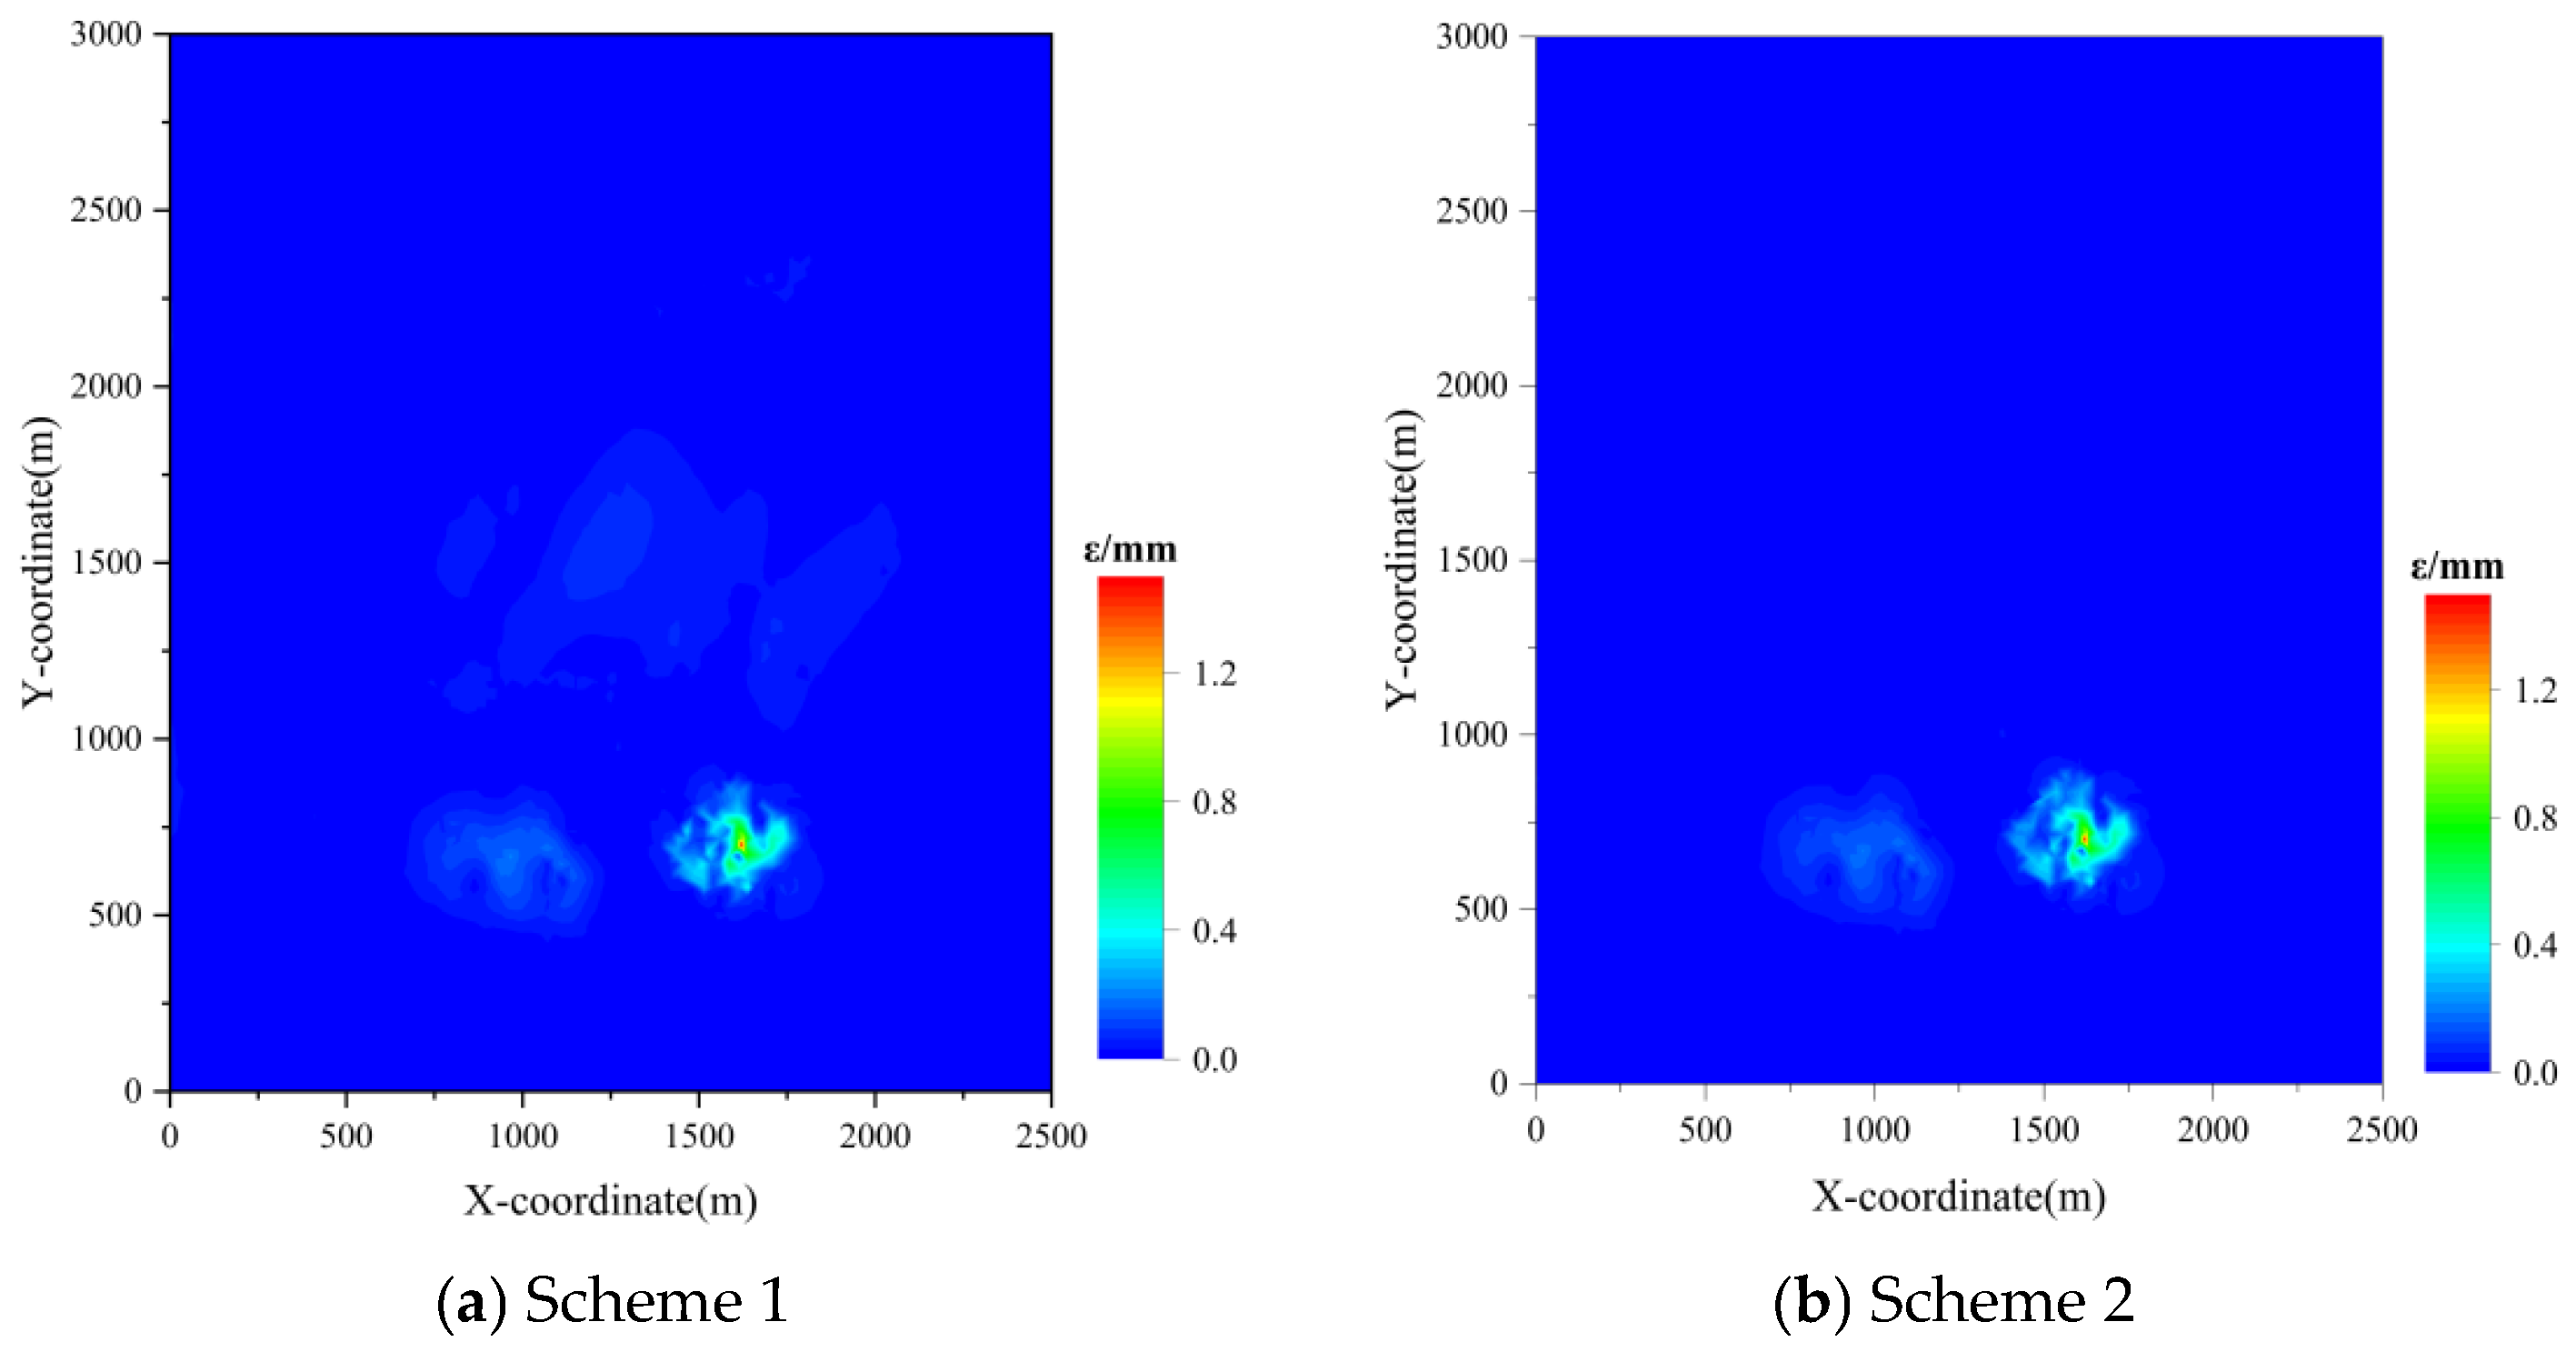
- Lateral deformation
5. Conclusions and Recommendations
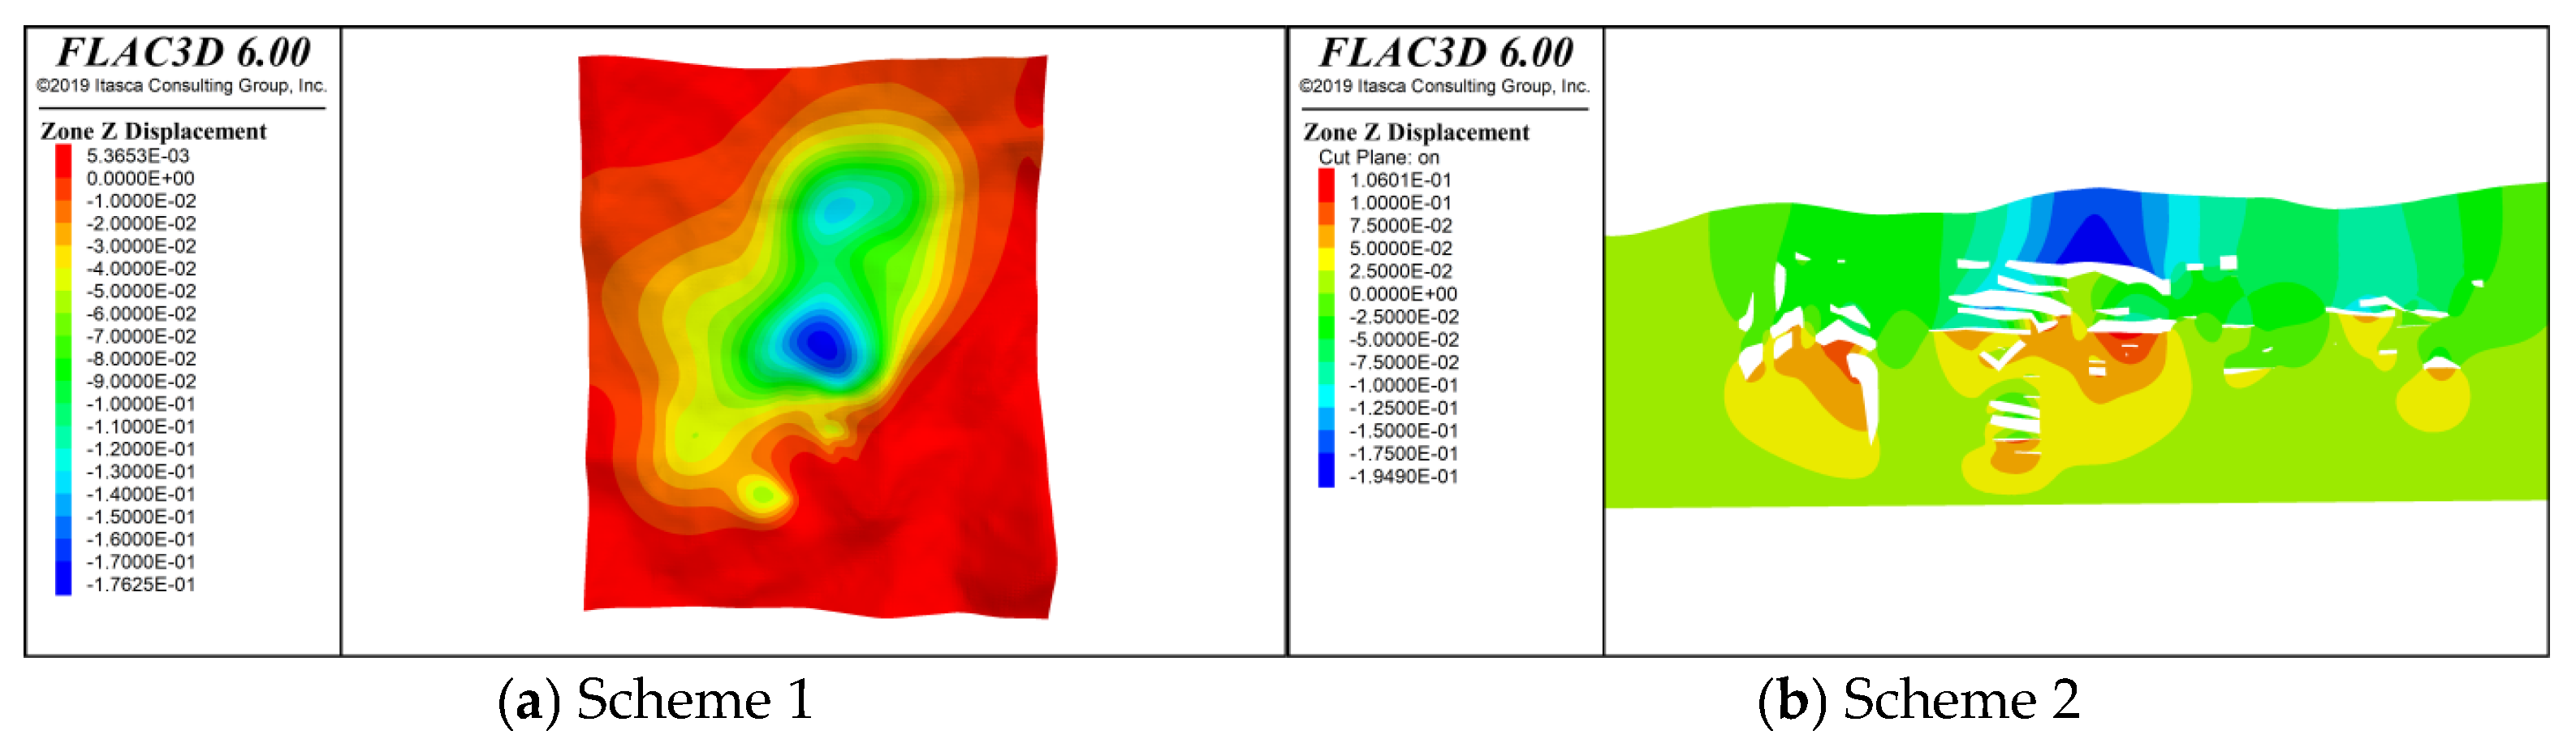
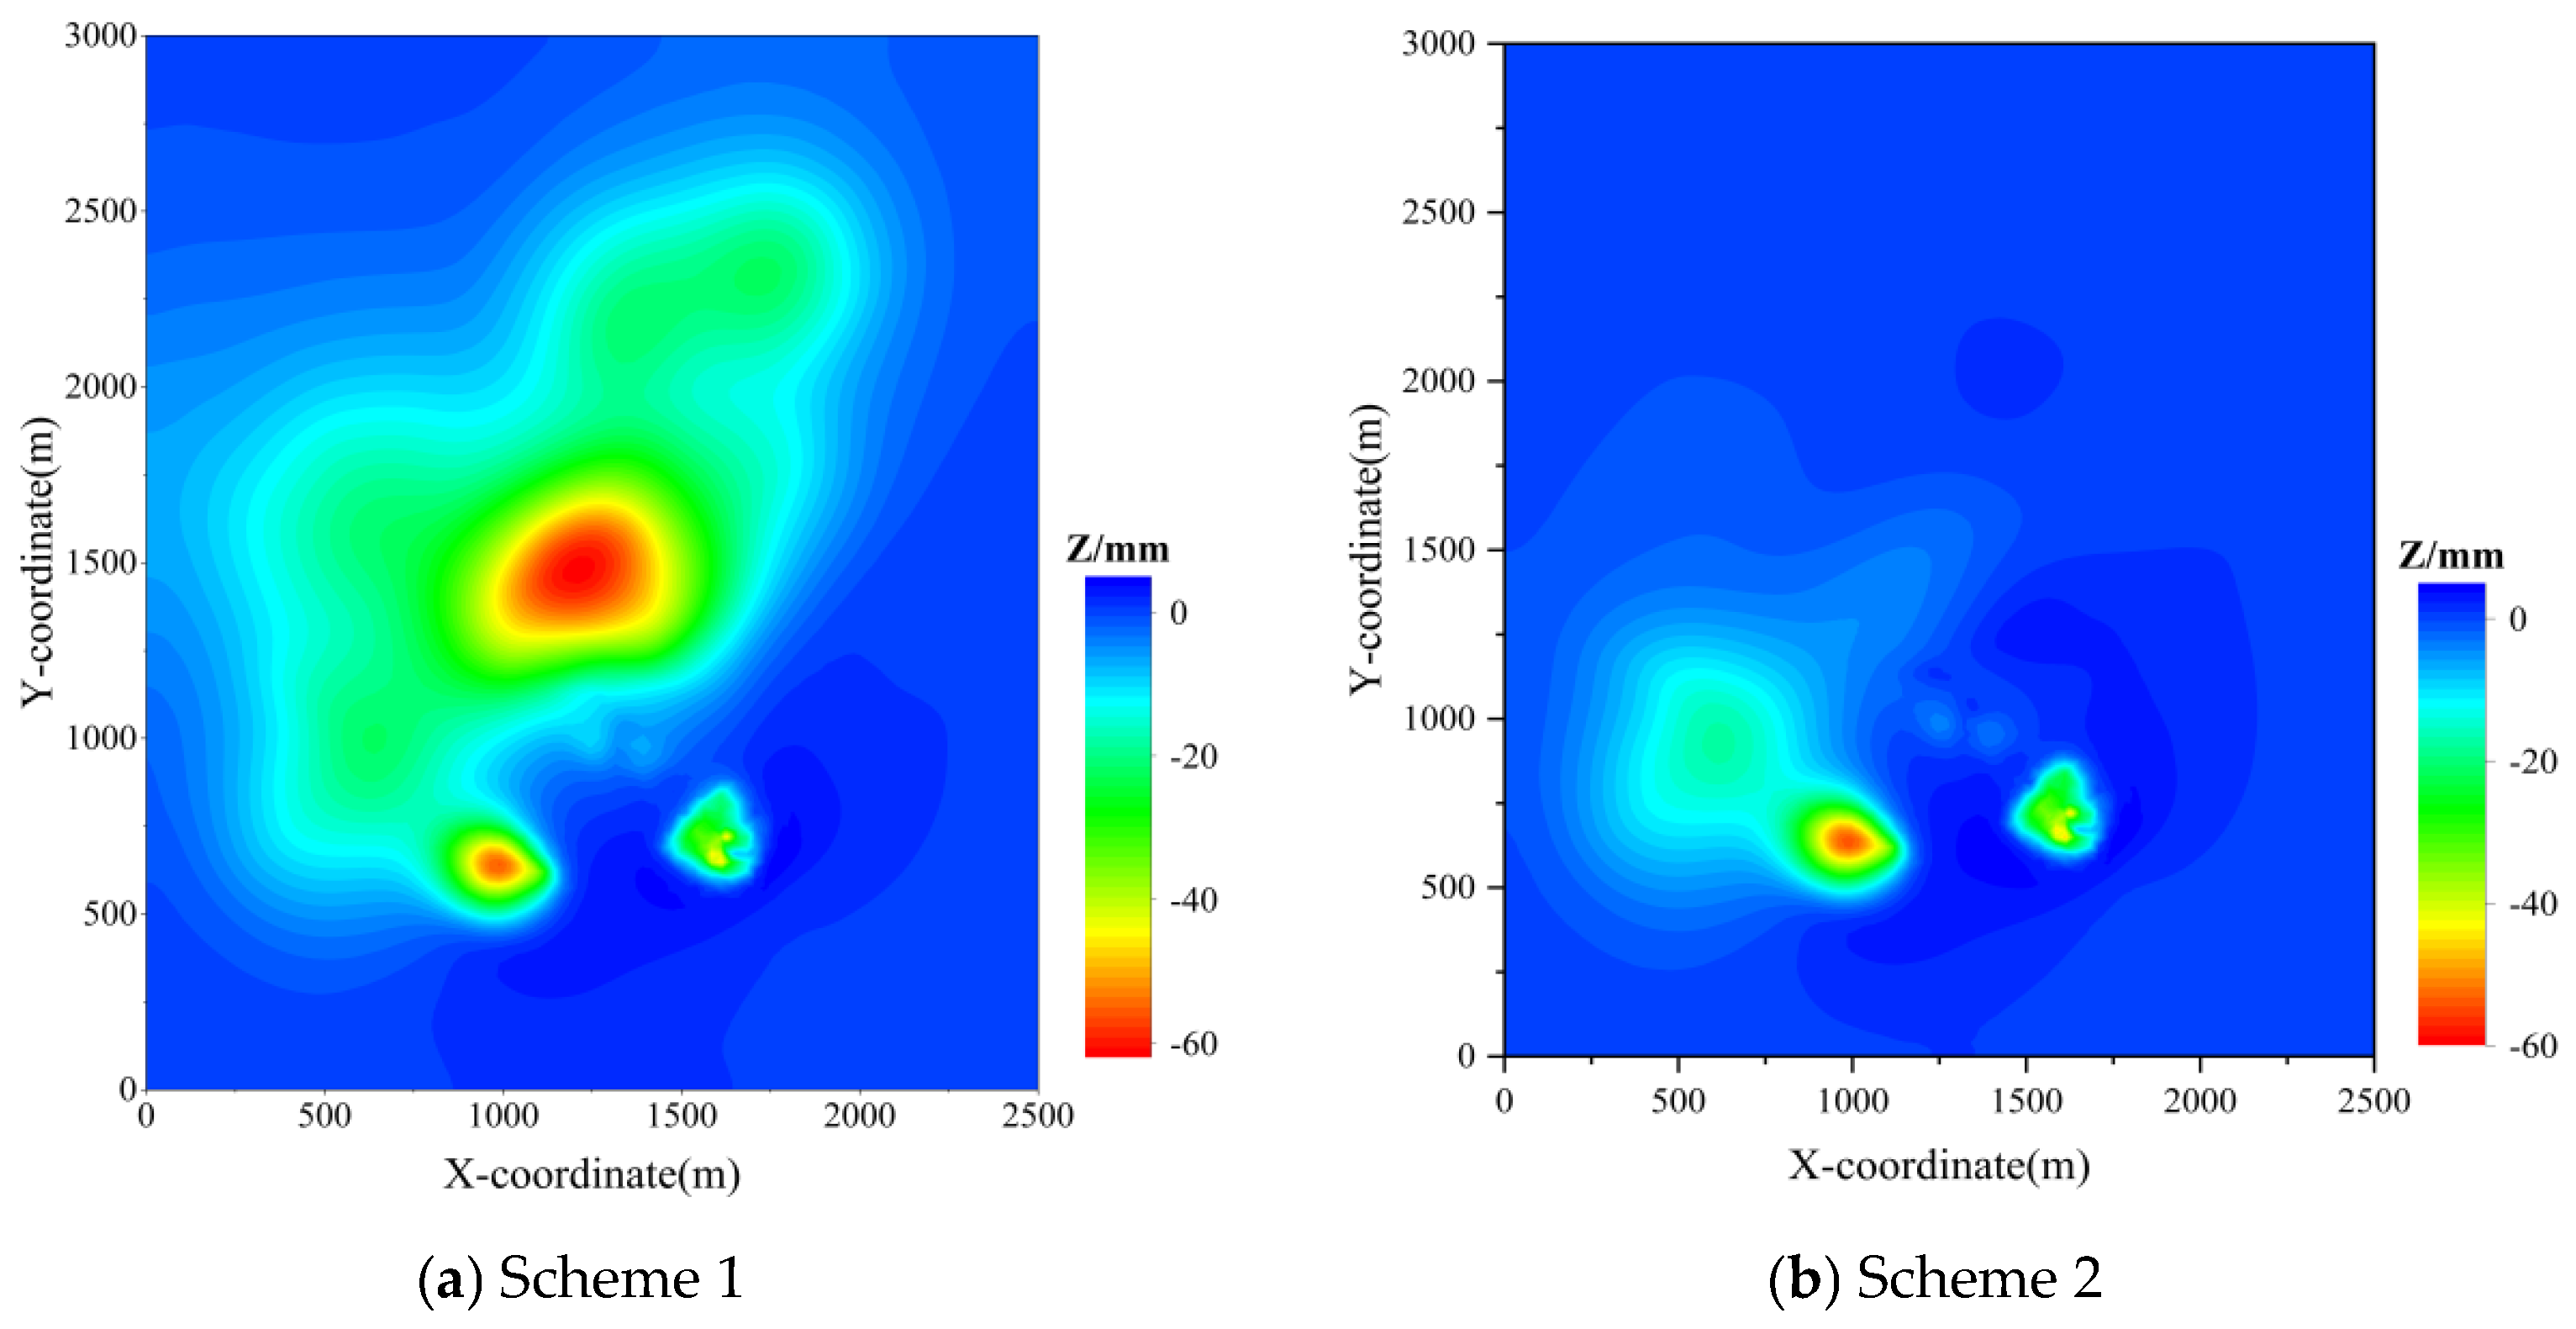
- To ensure that the main building clusters remain within safe limits during the mining and backfilling process, and to guarantee the safety and stability of key structures within the surface movement zone, the backfill ratio for the YZS mining area is carefully considered. Surface subsidence, terrain curvature deformation, ground inclined deformation, and lateral deformation within the simulation range were calculated for two different backfill ratios. By combining these results with stability criteria, an appropriate backfill ratio was selected, providing a reference for practical mine backfilling.
- Considering the actual situation of the mine, a total of 52 surface monitoring points were set up. Under the condition of working condition 1, the settlement value of 7 monitoring points exceeded 30.00 mm, and a large area of subsidence occurred in the YZS mining area. Under the condition of working condition 2, the surface subsidence of 3 monitoring points exceeded 30.00 mm, and the subsidence range of the YZS mining area was also significantly reduced. In addition, after improving the filling rate of the YZS mining area, the terrain curvature deformation, ground inclined deformation, and lateral deformation also decreased to varying degrees, indicating that improving the filling rate of the YZS mining area has a significant effect on the safety and stability of the mine surface. Therefore, it is suggested that the filling rate in the mine using plan 2 (100% of YZS filling, 94% of YH filling, and 90% of BJ filling) should be taken as the actual filling rate.
- It is recommended that the mine establish a comprehensive surface displacement monitoring system to verify the accuracy of the numerical simulations.
Author Contributions
Funding
Institutional Review Board Statement
Informed Consent Statement
Data Availability Statement
Conflicts of Interest
References
- Tzampoglou, P.; Loupasakis, C. Mining geohazards susceptibility and risk mapping: The case of the Amyntaio open-pit coal mine, West Macedonia, Greece. Environ. Earth Sci. 2017, 76, 1–16. [Google Scholar] [CrossRef]
- Zhou, D.W.; Wu, K.; Bai, Z.H.; Hu, Z.Q.; Li, L.; Xu, Y.K.; Diao, X.P. Formation and development mechanism of ground crack caused by coal mining: Effects of overlying key strata. Bull. Eng. Geol. Environ. 2019, 78, 1025–1044. [Google Scholar]
- Qiu, X.Y.; He, X.R.; Cao, R.H.; Qiu, H.J.; Shi, X.Z.; Gou, Y.G.; Li, X.Y.; Zhi, W. Study on the Surface Subsidence Trend of Fill Mining in Underground Mines with Different Mining Depths. Adv. Civ. Eng. 2024, 2024, 4407757. [Google Scholar] [CrossRef]
- Song, G.Y.; Du, K.; Zhang, Y.D.; Li, Z.X.; Hu, L. Study of the Overlying Strata Movement Law for Paste-Filling Longwall Fully Mechanized in Gaohe Coal Mine. Appl. Sci. 2023, 13, 8017. [Google Scholar] [CrossRef]
- Gu, W.; Chen, L.; Xu, D.L. Research on the Overburden Movement Law of Thick Coal Seam Without-Support Gangue-Filling Mining. Minerals 2022, 13, 53. [Google Scholar] [CrossRef]
- Yuan, L.W.; Li, C.Y.; Li, S.M.; Ma, X.S.; Zhang, W.; Liu, D.R.; Wang, G.; Chen, F.; Hou, X. Mine Slope Stability Based on Fusion Technology of InSAR Monitoring and Numerical Simulation. Sci. Program. 2022, 2022, 8643586. [Google Scholar] [CrossRef]
- Liu, X.; Wang, J.; Du, S.; Deng, K.; Chen, G.; Qin, X. Monitoring and Law Analysis of Secondary Deformation on the Surface of Multi-Coal Seam Mining in Closed Mines. Remote Sens. 2024, 16, 3223. [Google Scholar] [CrossRef]
- Liu, Y.; Ge, Y.; Zhang, C.; Ren, F.; Ma, J.; Ren, G. Cylindrical Caved Space Stability Analysis for Extension Prediction of Mining-Induced Surface Subsidence. Geofluids 2021, 2021, 1–13. [Google Scholar] [CrossRef]
- Xu, Z.; Xu, W.; Zhu, Z.; Zhao, J. Research on Monitoring and Stability Evaluation of Ground Subsidence in Gypsum Mine Goaf. Front. Environ. Sci. 2023, 10, 1097874. [Google Scholar] [CrossRef]
- Li, G.; Liu, S.; Ma, F.; Guo, J.; Hui, X. Ground Subsidence Mechanism of a Filling Mine with a Steeply Inclined Ore Body. J. Mt. Sci. 2023, 20, 2358–2369. [Google Scholar] [CrossRef]
- Li, X.; Wang, Y.; Hu, Y.; Zhou, C.; Zhang, H. Numerical Investigation on Stratum and Surface Deformation in Underground Phosphorite Mining Under Different Mining Methods. Front. Earth Sci. 2022, 10, 831856. [Google Scholar] [CrossRef]
- Shi, K.; Wang, S.; Liu, X.; Ma, W.; Chang, Y. Surface Movement and Stability Analysis of Buildings Above Mined-Out Areas. J. Eng. Sci. Technol. Rev. 2024, 17, 228–234. [Google Scholar] [CrossRef]
- Li, H.; Jin, L.; Liu, P. Analysis of Soil Slope Stability Under Underground Coal Seam Mining Using Improved Radial Movement Optimization with Lévy Flight. Mathematics 2024, 12, 1566. [Google Scholar] [CrossRef]
- Jia, H.; Yan, B.; Guan, K.; Liu, H.; Wu, Q.; Yin, Y.; Liu, H. Stability Analysis of Shallow Goaf Based on Field Monitoring and Numerical Simulation: A Case Study at an Open-Pit Iron Mine, China. Front. Earth Sci. 2022, 10, 897779. [Google Scholar] [CrossRef]
- Dai, G.; Li, H.; Liu, C.; Li, H.; Chang, Y.; Chen, Y.; Gao, Y.; Yuan, Y.; Huo, W. Goaf Site Stability Detection in the Overlap Area of Coal Mining Subsidence and Urban Construction. Adv. Civ. Eng. 2024, 2024, 5375733. [Google Scholar] [CrossRef]
- Chen, S.J.; Yin, D.W.; Cao, F.W.; Liu, Y.; Ren, K.Q. An Overview of Integrated Surface Subsidence-Reducing Technology in Mining Areas of China. Nat. Hazards 2016, 81, 1129–1145. [Google Scholar] [CrossRef]
- Liu, H.; Deng, X.; Shi, X.; Wang, Z.; Jia, N.; Yilmaz, E.; Bian, L. A New Index and Control Method of Filling Effect for Cemented Paste Backfill in Coal Mines. Int. J. Min. Reclam. Environ. 2023, 37, 805–825. [Google Scholar] [CrossRef]
- Bai, E.; Guo, W.; Tan, Y.; Li, X.; Shen, C.; Ma, Z. Green Coal Mining Under Buildings by Overburden Grout Injection for Coalmine Sustainable Development of Central China. Heliyon 2023, 9, e18965. [Google Scholar] [CrossRef]
- Gong, Y.; Zha, J.; Guo, Q.; Guo, G. A New Indicator for Estimating the Degree of Mining-Induced Land Subsidence: The Overburden’s Average GSI Value. Sci. Rep. 2024, 14, 332. [Google Scholar] [CrossRef]
- Ma, J.; Ma, C.; Liu, T.; Zhu, X.; Li, S.; Jin, L. Preferential Evaluation of Coal Filling Mining Scheme Under Building Pressure Based on Improved Grey Target Decision-Making Model of Game Theory. Sci. Rep. 2024, 14, 15686. [Google Scholar] [CrossRef]
- Zhao, K.; Liang, N.; Zeng, P.; Wang, W.; Gong, C.; Xiong, L.; Liu, H. Research on Optimization and Numerical Simulation of Layout Scheme of Mining Approach in Downward Slicing and Filling Method. Appl. Sci. 2023, 13, 8688. [Google Scholar] [CrossRef]
- Li, C.; Chen, D.; Yang, K. Filling Parameters and Process Optimization of Mining–Filling Synergistic Coal-Based Solid Waste Paste in Renjiazhuang Mine. Front. Mater. 2023, 10, 1234145. [Google Scholar] [CrossRef]
- Liu, Y.-F.; Wu, X.-H.; Zhu, T.; Wang, X.-J.; Zhang, G.-Y.; Wang, Z.-G. Influence of Mechanical Properties of Filling Paste on Overlying Strata Movement and Surface Settlement. Shock Vib. 2022, 2022, 4687200. [Google Scholar] [CrossRef]
- Yang, Y.; Zhang, M.; Hu, G.; Guan, K. Simulations of Goaf Surface Subsidence via Filling Control. PLoS ONE 2022, 17, e0261740. [Google Scholar] [CrossRef]
- Peck, R.B. Deep excavation and tunneling in soft ground. In Proceedings of the 7th International Conference on Soil Mechanics and Foundation Engineering, Mexico City, Mexico, 1969; pp. 225–281. [Google Scholar]
- Fan, H.; Deng, K. DInSAR Information Extraction Method for Surface Subsidence Monitoring in Mining Area; China University of Mining and Technology Press: Xuzhou, China, 2018; pp. 16–17. [Google Scholar]


| Ground Settlement Value (mm) | Terrain Curvature Deformation (mm/m2) | Surface Tilt Rate (mm/m) | Lateral Deformation (mm/m) |
|---|---|---|---|
| <30 | <0.2 | <3 | <2 |
| Lithologic | Bulk Modulus (GPa) | Shear Modulus (GPa) | Tensile Strength (MPa) | Density (g/cm3) | C (MPa) | Φ (°) |
|---|---|---|---|---|---|---|
| Granite-Porphyry | 14.578 | 8.789 | 7.107 | 2.681 | 5.050 | 31.776 |
| Crystal Tuff | 9.732 | 9.836 | 7.142 | 2.619 | 5.961 | 28.926 |
| Porphyry Ore Body | 11.904 | 9.379 | 9.803 | 2.857 | 5.470 | 26.874 |
| Filling Body | 0.9943 | 0.7573 | 0.912 | 1.797 | 0.845 | 28.285 |
| Monitoring Point | Scheme 1 (mm) | Scheme 2 (mm) | Monitoring Point | Scheme 1 (mm) | Scheme 2 (mm) | Monitoring Point | Scheme 1 (mm) | Scheme 2 (mm) |
|---|---|---|---|---|---|---|---|---|
| BJ1 | 2.76 | 3.58 | HL4 | −21.29 | 0.42 | YH4 | −21.29 | −14.73 |
| BJ2 | 2.93 | 2.61 | GL1 | −20.97 | −2.40 | YH5 | −41.88 | −39.38 |
| BJ3 | −4.54 | −5.75 | GL2 | −20.27 | −0.25 | YH6 | −53.98 | −51.93 |
| BJ4 | −3.94 | −1.39 | GL3 | −19.56 | 0.92 | YH7 | −18.05 | −14.89 |
| BJ5 | 4.03 | 3.52 | GL4 | −14.43 | 0.65 | YH8 | −31.57 | −29.89 |
| BJ6 | 5.00 | 4.19 | GL5 | −4.04 | 0.50 | YH9 | −20.50 | −12.49 |
| BJ7 | 4.40 | 3.43 | GC1 | −1.25 | 0.48 | YH10 | −19.98 | −11.49 |
| BJ8 | 1.93 | 1.20 | GC2 | 0.63 | 0.51 | YH11 | −18.91 | −9.47 |
| BJ9 | 1.56 | 0.77 | GC3 | 1.36 | 1.05 | YH12 | −20.58 | −11.53 |
| BJ10 | −14.18 | −11.19 | GC4 | 1.62 | 1.13 | YH13 | −18.67 | −8.44 |
| BJ11 | −13.50 | −1.97 | GC5 | 1.99 | 1.69 | YH14 | −17.54 | −5.89 |
| BJ12 | −46.50 | −45.54 | GC6 | 0.83 | 0.62 | YH15 | −25.89 | −4.23 |
| CZ1 | −16.21 | −2.56 | GC7 | −16.59 | −1.68 | YH16 | −12.73 | −0.15 |
| CZ2 | −13.24 | 0.12 | GC8 | −2.31 | 0.23 | YH17 | −33.72 | 0.78 |
| CZ3 | −21.34 | 0.40 | GC9 | −41.43 | −1.85 | YH18 | −30.53 | −7.67 |
| HL1 | 3.19 | −1.16 | YH1 | 3.19 | 2.18 | YH19 | −17.23 | −2.30 |
| HL2 | 4.28 | −0.05 | YH2 | 4.28 | 2.52 | |||
| HL3 | −16.58 | 0.75 | YH3 | −16.58 | −14.02 |
Disclaimer/Publisher’s Note: The statements, opinions and data contained in all publications are solely those of the individual author(s) and contributor(s) and not of MDPI and/or the editor(s). MDPI and/or the editor(s) disclaim responsibility for any injury to people or property resulting from any ideas, methods, instructions or products referred to in the content. |
© 2025 by the authors. Licensee MDPI, Basel, Switzerland. This article is an open access article distributed under the terms and conditions of the Creative Commons Attribution (CC BY) license (https://creativecommons.org/licenses/by/4.0/).
Share and Cite
Yang, Z.; Zheng, X.; Guo, Y.; Xu, Z.; Rao, Y.; Zou, Q. Study on Optimization of Filling Schemes and Surface Stability in Multi-Mining Right Intersection Areas. Appl. Sci. 2025, 15, 5317. https://doi.org/10.3390/app15105317
Yang Z, Zheng X, Guo Y, Xu Z, Rao Y, Zou Q. Study on Optimization of Filling Schemes and Surface Stability in Multi-Mining Right Intersection Areas. Applied Sciences. 2025; 15(10):5317. https://doi.org/10.3390/app15105317
Chicago/Turabian StyleYang, Zhihua, Xiaolong Zheng, Yuanshu Guo, Zhiqiang Xu, Yunzhang Rao, and Qingsong Zou. 2025. "Study on Optimization of Filling Schemes and Surface Stability in Multi-Mining Right Intersection Areas" Applied Sciences 15, no. 10: 5317. https://doi.org/10.3390/app15105317
APA StyleYang, Z., Zheng, X., Guo, Y., Xu, Z., Rao, Y., & Zou, Q. (2025). Study on Optimization of Filling Schemes and Surface Stability in Multi-Mining Right Intersection Areas. Applied Sciences, 15(10), 5317. https://doi.org/10.3390/app15105317