1. Introduction
The current production paradigm, characterized by mass customization, entails an increased risk of non-compliance within production systems. The growing complexity of products and the shortening of their life cycles, in fact, lead to a higher likelihood of defects occurring during production [
1]. Non-compliant products pose a serious threat to manufacturers across all sectors. Internally, a defect can incur costly rework in operational expenses, resource allocation, and delivery delays [
2,
3], or even result in scrapping. Thus, the negative impact is not solely economic but also affects the sustainability of production processes. Externally, managing the delivery of non-conforming products to customers generates substantial costs and can damage the brand’s reputation [
4]. Consequently, manufacturers are compelled to deploy quality assurance strategies to mitigate these risks.
As noted by Montgomery [
5], quality assurance comprises the activities that ensure the maintenance of product and service quality levels and the proper resolution of supplier and customer quality issues. One of the key solutions in this domain is inspection, defined by ISO 2859-1 [
6] as any activity—such as measuring, examining, testing or gauging one or more product characteristics—and comparing the results with specified requirements to determine whether each characteristic conforms. Particularly promising are non-destructive inspections, which enable the measurement of certain critical product factors without compromising their integrity [
7]. For example, visual inspections rely exclusively on observation, without physical contact with the products [
8]. Traditionally conducted by human operators, these inspections are essential for upholding quality standards [
9,
10]; however, the performance of human inspectors may vary due to fatigue, distraction, or inconsistent judgment [
11]. This variability can lead to inconsistent inspection results and potentially overlooked non-conformities.
In the modern era of Industry 5.0, technological solutions have increasingly been introduced to support human operators and enhance the overall quality performance of inspection systems [
12,
13]. Indeed, recent advancements in artificial intelligence have shown significant potential to enhance manufacturing and supply chain operations across various domains [
14,
15], with quality control emerging as a particularly promising application area. Fully automated visual inspection systems have been developed to completely replace human activities, relieving operators from physically demanding inspections and providing superior defect detection capabilities. Among fully automated systems, two main categories can be distinguished: semi-fixed solutions, where images are collected by cameras mounted in fixed positions or moving along predefined tracks [
16,
17,
18,
19], and more flexible, albeit more costly, solutions employing robotic or collaborative robotic (cobot) systems for image acquisition [
20,
21,
22,
23]. Between the two extremes—completely automated systems and purely human-based inspections—hybrid systems have emerged. In these configurations, image acquisition is performed manually by operators using hand-held or head-mounted devices, while image processing and defect detection are automated through CNNs [
24,
25,
26,
27]. Hybrid approaches combine high flexibility and effective defect detection with lower investment costs compared to fully automated systems. However, they typically entail higher operational costs due to the need for human intervention and longer acquisition times. It is important to note that these inspection methods are not inherently mutually exclusive. Technological solutions often complement, rather than entirely replace, human activities. This is particularly evident in the field of Human–Robot Collaboration (HRC), where synergistic interactions between humans and machines are actively studied [
12,
28,
29].
Visual inspections thus represent a vital tool for manufacturers in ensuring high production quality. Nevertheless, they are costly, non-value-added activities that must be judiciously integrated into production systems through targeted strategies [
30]. An inspection-oriented quality-assurance strategy seeks to allocate an economically appropriate level of inspection activity by balancing the various costs associated with inspection, repair, replacement due to quality failure and, where applicable, warranty penalties incurred when a non-conforming product is delivered to a customer [
31]. Inspections may be conducted following any operation within a Multi-Stage Manufacturing System (MSMS), and the decision can be made to inspect either all products or only a subset.
The inspection allocation problem, concerning the decision-making process that defines which product characteristics to inspect and at which stage of the production system, has been extensively discussed in the literature since the second half of the 20th century [
30,
31,
32]. However, the scientific literature continues to exhibit important gaps, particularly in developing modeling approaches capable of jointly supporting the selection of suitable inspection technologies and the determination of the optimal sampling rate, defined as the proportion of produced items inspected within a batch, in order to minimize the overall quality-related costs, which encompass prevention, inspection, rework, and failure costs. While recent advancements in inspection technologies raise important questions—such as whether quality checks should be performed by human operators or automated systems—existing research offers limited guidance on how to make these decisions in an integrated and systematic way.
To address this gap, this paper proposes a novel Mixed-Integer Linear Programming (MILP) model that simultaneously identifies the most suitable inspection technologies from a set of available alternatives based on process-specific requirements and optimizes the sampling rate by determining how many products should be inspected, depending on the selected technology and the production system’s operating conditions. In this paper, the three inspection methodologies are considered alternative options, allowing parallel adoption across different stages of the assembly process. While it would theoretically be possible to deploy both a robot and a human operator for inspection tasks at the same station, such a configuration would require a detailed study of their interaction dynamics, which falls outside the scope of this research. The proposed MILP formulation was selected due to its ability to provide exact and interpretable solutions, which are particularly suitable for supporting strategic decision-making processes in quality inspection planning. Although the complexity of the model increases with the size of the problem instance, the computational times remain acceptable for medium-scale instances and consider the strategic scope of the decisions being addressed. It is also acknowledged that heuristic and metaheuristic approaches could be valuable alternatives for very-large-scale instances. In this regard, the MILP model proposed herein can serve as a benchmark for future studies exploring heuristic and metaheuristic approaches. The model was tested on synthetic data to assess its computational limitations and on data coming from a real-life case study in the automotive sector to verify its applicability in a real-world context and derive further insights. In particular, three options of inspection methodologies are considered in the real-world case study: visual inspections performed by human operators, visual inspections performed by human operators using hand-held devices, and visual inspections performed by CNNs, with the necessary images collected via automated solutions such as fixed or mobile cameras. To guide the study, the following research questions are addressed:
How does the structural complexity of the inspection optimization model evolve with respect to key input dimensions, and what are the implications for computational scalability?
What types of inspection technologies and sampling strategies are selected by the model in real-world case studies, and how do these decisions reflect trade-offs between inspection coverage, performance, and cost?
How sensitive are the model’s recommendations to variations in key input parameters?
The remainder of this paper is organized as follows:
Section 2 presents an extensive review of the relevant recent literature on quality inspection allocation, underscoring existing methodologies and identifying the research gaps that motivate our study.
Section 3 introduces the novel MILP model, detailing the mathematical formulation and the experimental design used to validate the model.
Section 4 presents the experimental results obtained from synthetic data and a real-world case study, illustrating model scalability through complexity analysis, the insights from the decision-making and ablation studies, and the findings of the sensitivity analyses.
Section 5 discusses the results, highlighting their implications and the potential of the proposed approach in industrial settings. Finally,
Section 6 concludes the paper by summarizing the main contributions, acknowledging limitations, and outlining promising avenues for future research.
2. Literature Review
The inspection allocation problem in Multi-Stage Manufacturing Systems (MSMSs) has been extensively studied in the scientific literature, with different solution methodologies proposed over time. In this section, we organize the existing contributions into three main clusters based on their solution approaches: (i) heuristic and metaheuristic methods, (ii) MILP models, and (iii) other approaches.
2.1. Heuristic and Metaheuristic Approaches
Given the computational complexity of large-scale inspection planning problems, numerous researchers have turned to heuristic and metaheuristic methods. You et al. [
33]. propose a bi-objective model that allocates inspection resources under strict capacity constraints in flexible manufacturing systems. Their approach minimizes overall costs while balancing inspection station workloads and employs a modified NSGA-II algorithm to efficiently search for near-optimal solutions. Mohammadi et al. also tackled a bi-objective inspection planning problem for serial MSMSs, integrating production and inspection costs with customer satisfaction criteria, and solved it using a metaheuristic approach. Azadeh et al. [
34] introduced a particle swarm optimization algorithm to plan inspections in serial production systems, accounting for fuzzy costs and inspection errors. In addition, Mousavi et al. [
35] proposed an intuitionistic fuzzy grey model that integrates fuzzy set theory and grey relational analysis to assist inspection scenario selection under expert opinion uncertainty. Korytkowski [
36] developed a genetic algorithm considering queuing effects in multi-product, multi-stage production systems, while Van Volsem [
37] combined evolutionary algorithms with simulation models to jointly optimize inspection locations and sampling parameters. These studies underscore the flexibility of heuristic and metaheuristic techniques in managing problem complexity and uncertainty. Nonetheless, they often provide approximate solutions without offering the optimality guarantees of exact methods like MILP.
2.2. MILP Models
Researchers have also adopted MILP formulations to address inspection planning problems, typically focusing on minimizing total quality-related costs while considering various operational constraints. Rezaei-Malek et al. [
38] developed an MILP model that simultaneously plans inspection activities and preventive maintenance in linear-deteriorating, serial MSMSs. Their model minimizes a comprehensive cost function encompassing production, maintenance, inspection, scrapping, replacement, and penalty costs. Bettayeb et al. [
39] proposed an integrated dynamic lot-sizing and inspection planning model, ensuring that the outgoing product quality meets an acceptable quality level (AQL). Their MILP approach links production and inspection decisions but does not consider multiple inspection technologies. Similarly, the robust MILP model by Mohammadi et al. [
40] addresses inspection planning under production uncertainty, using Taguchi loss functions and Monte Carlo simulations to manage variability in manufacturing processes. However, the focus remains on single inspection methodologies. These MILP-based contributions demonstrate the effectiveness of mathematical programming for inspection planning but often operate under simplifying assumptions, such as single-product systems or single-mode inspections.
2.3. Other Approaches
Beyond optimization-based models, several alternative strategies have been proposed for inspection planning. Penn and Raviv [
41] designed a dynamic programming algorithm to configure inspection stations in serial production lines with the objective of maximizing steady-state profit. Vaghefi and Sarhangian [
42] adopted a simulation-based optimization approach, incorporating misclassification errors and stochastic defect rates into inspection planning. Although dynamic programming and simulation-based methods can handle complex system behaviors, their scalability is often limited.
2.4. Summary and Research Gap
Table 1 summarizes the key characteristics of the reviewed papers, organized according to several core principles. The first criterion, product flow, distinguishes between studies considering a single-product production environment and those that address multi-product settings. The second, sampling, identifies whether the inspection strategy includes a defined sampling rate—meaning only a portion of the products is inspected—or assumes full inspection of all units. Detection error refers to whether the model accounts for the possibility of misclassification during inspection; if this column is left blank, it implies that the study assumes perfect detection accuracy. The inspection methodologies criterion indicates whether multiple approaches to inspection, such as human-based and technology-driven methods, are considered. Lastly, the solution approach describes the methods used to address the inspection optimization problem in each study.
Over the years, research on inspection allocation has progressively evolved from abstract, simplified models toward frameworks that better reflect the complexity of real-world manufacturing systems. Early contributions often assumed idealized conditions—such as perfect detection, single-product flows, or unlimited inspection resources—that limited their practical relevance. More recent studies have moved toward integrating typical industrial features and constraints, including multiple product flows, resource limitations (e.g., availability of inspection stations or personnel), detection errors, production variability, and even preventive maintenance scheduling. This shift reflects a broader trend in the literature toward enhancing the industrial applicability of inspection models, driven by the need for robust, cost-effective solutions in diverse and dynamic production environments. Despite these advancements, as highlighted in
Table 1, many existing approaches still fall short of fully capturing the complexity of modern systems—particularly in their limited consideration of multiple inspection technologies, lack of sampling rate optimization, or focus on single-product contexts.
Motivated by existing gaps in the literature, this paper presents a novel MILP model that introduces several new and previously unaddressed capabilities in the context of inspection allocation. Specifically, this is the first model to perform the following:
Simultaneously integrate inspection method selection, optimal sampling rate determination, and detection rate determination within a unified optimization framework.
Handle multi-product production systems featuring multiple, distinct inspection technologies, each with unique cost and accuracy characteristics.
The simultaneous inclusion of these features represents a substantive advancement over prior models, which consider only part of them. By combining these elements, our model offers a more holistic and practically applicable solution for modern industrial inspection planning.
3. Materials and Methods
This section provides a detailed overview of the developed MILP model for quality inspection allocation and of the methodology employed to validate its effectiveness. Specifically,
Section 3.1 defines the problem that the model aims to address.
Section 3.2 outlines the model formulation, presenting the mathematical structure, decision variables, constraints, and the objective function of the MILP model. Lastly,
Section 3.3 describes the experimental design followed to validate the model.
3.1. Problem Statement
Designing and managing quality inspection systems in modern assembly processes presents a complex decision-making challenge. Manufacturers must determine which inspection methodologies to adopt, where to implement them along the assembly line, and how frequently to perform inspections—all while balancing competing costs and operational constraints. These decisions are further complicated by the presence of multiple products and quality characteristics, each potentially requiring different inspection technologies with varying detection capabilities and resource requirements.
One of the central issues in this context is how to allocate inspection activities to minimize the total cost of quality control. This cost includes the investment and operational costs associated with inspection technologies and the financial impact of undetected defects, which may lead to product rework or penalties. Importantly, the choice of inspection frequency—defined by the sampling rate—plays a critical role in this trade-off: increasing the number of inspected products raises variable costs but lowers the risk of defective items reaching customers.
Compounding this challenge is the probabilistic nature of defects and the varying effectiveness of inspection technologies depending on the product and characteristic under examination. Moreover, manufacturers must operate within real-world constraints, such as limited time availability for inspection and rework tasks during each production period. As a result, achieving an optimal inspection strategy requires careful coordination across multiple decision layers, including technology selection, resource allocation, and inspection intensity.
Figure 1 illustrates an assembly station’s typical structure where quality controls must be performed. According to the figure, a total demand
enters the system, and at each assembly station, a subset of products (
) can be selected for quality inspection. Non-compliant units (
) may still be present among those not selected for inspection, with a probability equal to
. Moreover, even among inspected units, some defects may remain undetected, depending on the defect probability (
and the detection capability (
) of the inspection methodology employed. All non-compliant units continue through the assembly process and are delivered to the customers. In contrast, units found to be defective during inspection (
are sent to rework to address the detected non-compliance.
3.2. Model Formulation
The proposed optimization model is formulated as an MILP model that aims to minimize the total costs resulting from investment in inspection methodologies, inspection activities, rework operations, and penalties associated with non-conformities. Binary decision variables are used to model discrete decisions, such as the adoption of inspection methodologies and the activation of inspections for specific quality characteristics. Continuous decision variables are introduced to model operational quantities, such as the number of inspections performed and the number of non-compliant units. The model’s structure is governed by linear relationships among variables, allowing for an exact optimization of the inspection strategy while satisfying operational constraints, such as inspection and rework time limits and inspection feasibility at each station. The sets, parameters, decision variables, constraints, and components constituting the objective function to be minimized are presented in the following sections.
3.2.1. Nomenclature
: set of assembly stations.
: set of products.
: set of quality inspection methodologies.
: set of quality characteristics.
: set of time steps.
: demand for product in period .
: 1, if characteristic of product can be controlled at station . 0, if otherwise.
: time required for quality control of product for characteristic using inspection methodology at station .
: maximum time available for quality control in period .
: time required to repair characteristic of product at station .
: probability of detecting a defect in characteristic of product using inspection methodology at station .
: probability of a defect occurring for characteristic of product .
: annualized investment cost for quality inspection methodology .
: variable cost per inspected unit using quality inspection methodology .
: penalty cost for non-compliance in characteristic of product .
: cost to repair characteristic of product at station .
: total cost for investments in quality inspection methodologies.
: total variable cost for inspection.
: total penalty cost for non-compliance products.
: total rework cost.
: 1, if inspection methodology is adopted at assembly station . 0, if otherwise.
: 1, if inspection methodology is adopted at assembly station for controlling characteristic of product in period . 0, if otherwise.
: number of inspections performed at assembly station for characteristic of product using inspection methodology at period .
: number of non-compliant units of product with defect in characteristic at period .
3.2.2. Objective Function
The objective function, expressed in Equation (1), minimizes the total cost associated with quality control activities. This cost consists of four components: the investment cost
) for the adoption of inspection methodologies, the variable inspection cost (
) related to the number of inspections performed and the type of technology adopted, the penalty cost (
) for non-compliant products delivered to customers, and the rework cost (
) associated with repairing the detected defects.
The investment cost, defined in Equation (2), is calculated as the sum of the costs associated with the adoption of inspection methodologies at the assembly stations, where the installation status is defined by the binary variable
.
The variable inspection cost is directly proportional to the number of inspections
), while the penalty cost is directly proportional to the number of non-compliant products (
), as shown in Equations (3) and (4), respectively. The former reflects the operational expenses associated with performing inspections, whereas the latter accounts for the economic losses due to non-compliant products.
The rework cost, representing the expenses incurred to repair defects detected during quality inspections, is calculated as in Equation (5). The rework cost is directly proportional to the number of defects correctly detected during inspection activities, which depend on the defect probability, the detection probability, and the number of inspections performed (
).
3.2.3. Feasibility Constraints
The following constraints define the operational feasibility and logical structure of the inspection and rework planning. They ensure consistency between the adoption and activation of inspections, manage the allocation of time resources and number of inspections, and model the propagation of non-detected defects through the assembly process.
Equation (6) ensures that an inspection methodology can be used (
) only if it has been installed at the corresponding assembly station (
).
Equation (7) enforces consistency between the activation of an inspection task (
) and the number of inspections performed (
). If the inspection activity is not activated, no inspections can be performed. Conversely, if the inspection is activated, the number of inspections is limited by the total demand for the corresponding product.
Equation (8) ensures that the total inspection time plus the total rework time does not exceed the maximum allowable time for quality control activities in each period. The inspection and rework time are directly proportional to the number of inspections (
).
Equation (9) defines the number of non-compliant products (
). The first term of the equation captures the expected number of defective units among those that are not subjected to inspection, based on the defect probability. The second term represents the expected number of defective units that are inspected but not detected, which depends on both the defect probability and the detection probability associated with the inspection process.
Equation (10) ensures that inspection activities (
) are only assigned to stations where the control of the corresponding quality characteristics is technically feasible, according to the system’s features.
Equation (11) limits each station to adopting (
), at most, one inspection methodology.
Equation (12) ensures that each quality characteristic is inspected (
) by, at most, one inspection methodology at one station, avoiding redundancy.
3.3. Experimental Design
This section outlines the experimental procedure used to assess and validate the performance and robustness of the proposed model. Initially,
Section 3.3.1 illustrates the data used for evaluating the model. Specifically, two distinct datasets have been adopted for the experiments: one synthetically generated and another derived from a real-world case study in the automotive sector. Afterward,
Section 3.3.2 details the experiments conducted using the synthetic dataset. Finally,
Section 3.3.3 focuses on the experiments performed with the real-world dataset.
3.3.1. Data Collection
Two distinct sets of data were used to evaluate the performance of the proposed model: synthetically generated data and data from a real-world case study. The synthetic data were generated to assess the model’s ability to perform across different configurations. The real-world data, drawn from a case study in the automotive sector, provided instead a practical application context for validating the model’s effectiveness in a real-world setting.
Different cardinalities of the sets described in
Section 3.2 were defined for the synthetic data.
Table 2 reports the range of cardinality examined for each set.
For the real-world case study, data were collected from an automotive company involved in quality control operations. The cardinalities of the sets in this case study are shown in
Table 3. Specifically, the set H related to the possible inspection technologies was composed in the case study of three alternatives: human inspections, human inspection assisted with digital tools, and machine vision systems.
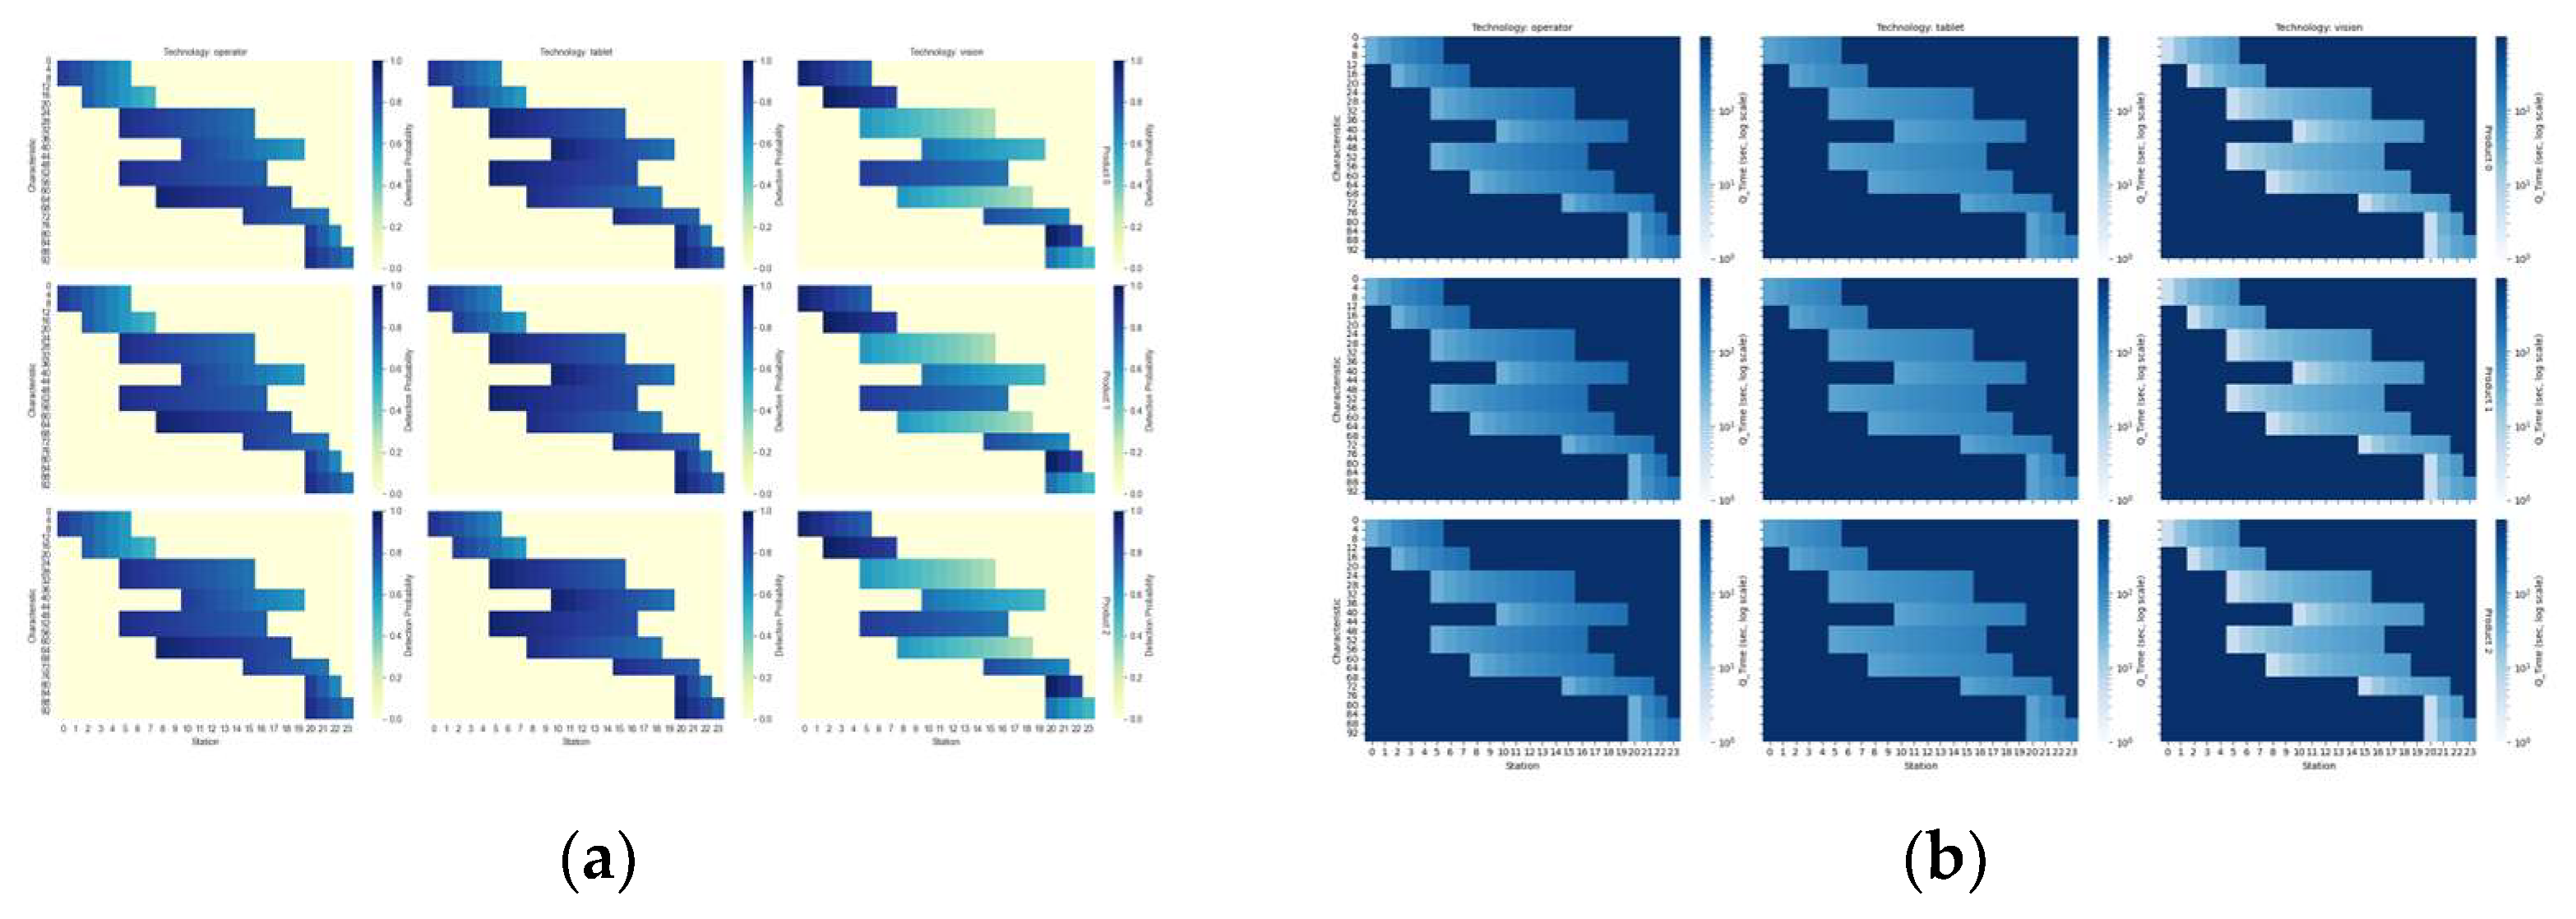
The values of the parameters
and
used in the quality control case study are instead reported in
Figure 2a,b. Each panel is arranged as a grid of heatmaps, where each subplot corresponds to a specific product and technology combination. In every heatmap, the horizontal axis represents the inspection stations, while the vertical axis corresponds to the characteristics being controlled.
Figure 2a displays the inspection time (
) required for each station–characteristic pair. The color intensity suggests that inspections at later stations are typically more time-consuming due to physical layout constraints, workflow accumulation, and technological limitations.
Figure 2b presents the probability of detecting a defect for each combination of station and characteristic. In contrast to the inspection time patterns, detection probabilities generally decrease with higher station indices. This implies that earlier stations tend to be more effective at identifying defects due to better visibility and less interference from downstream processing. Moreover, several station–characteristic combinations show zero probability and a very high inspection time, indicating that inspections are not feasible at those positions. These infeasibilities reflect predefined structural limitations of the production system.
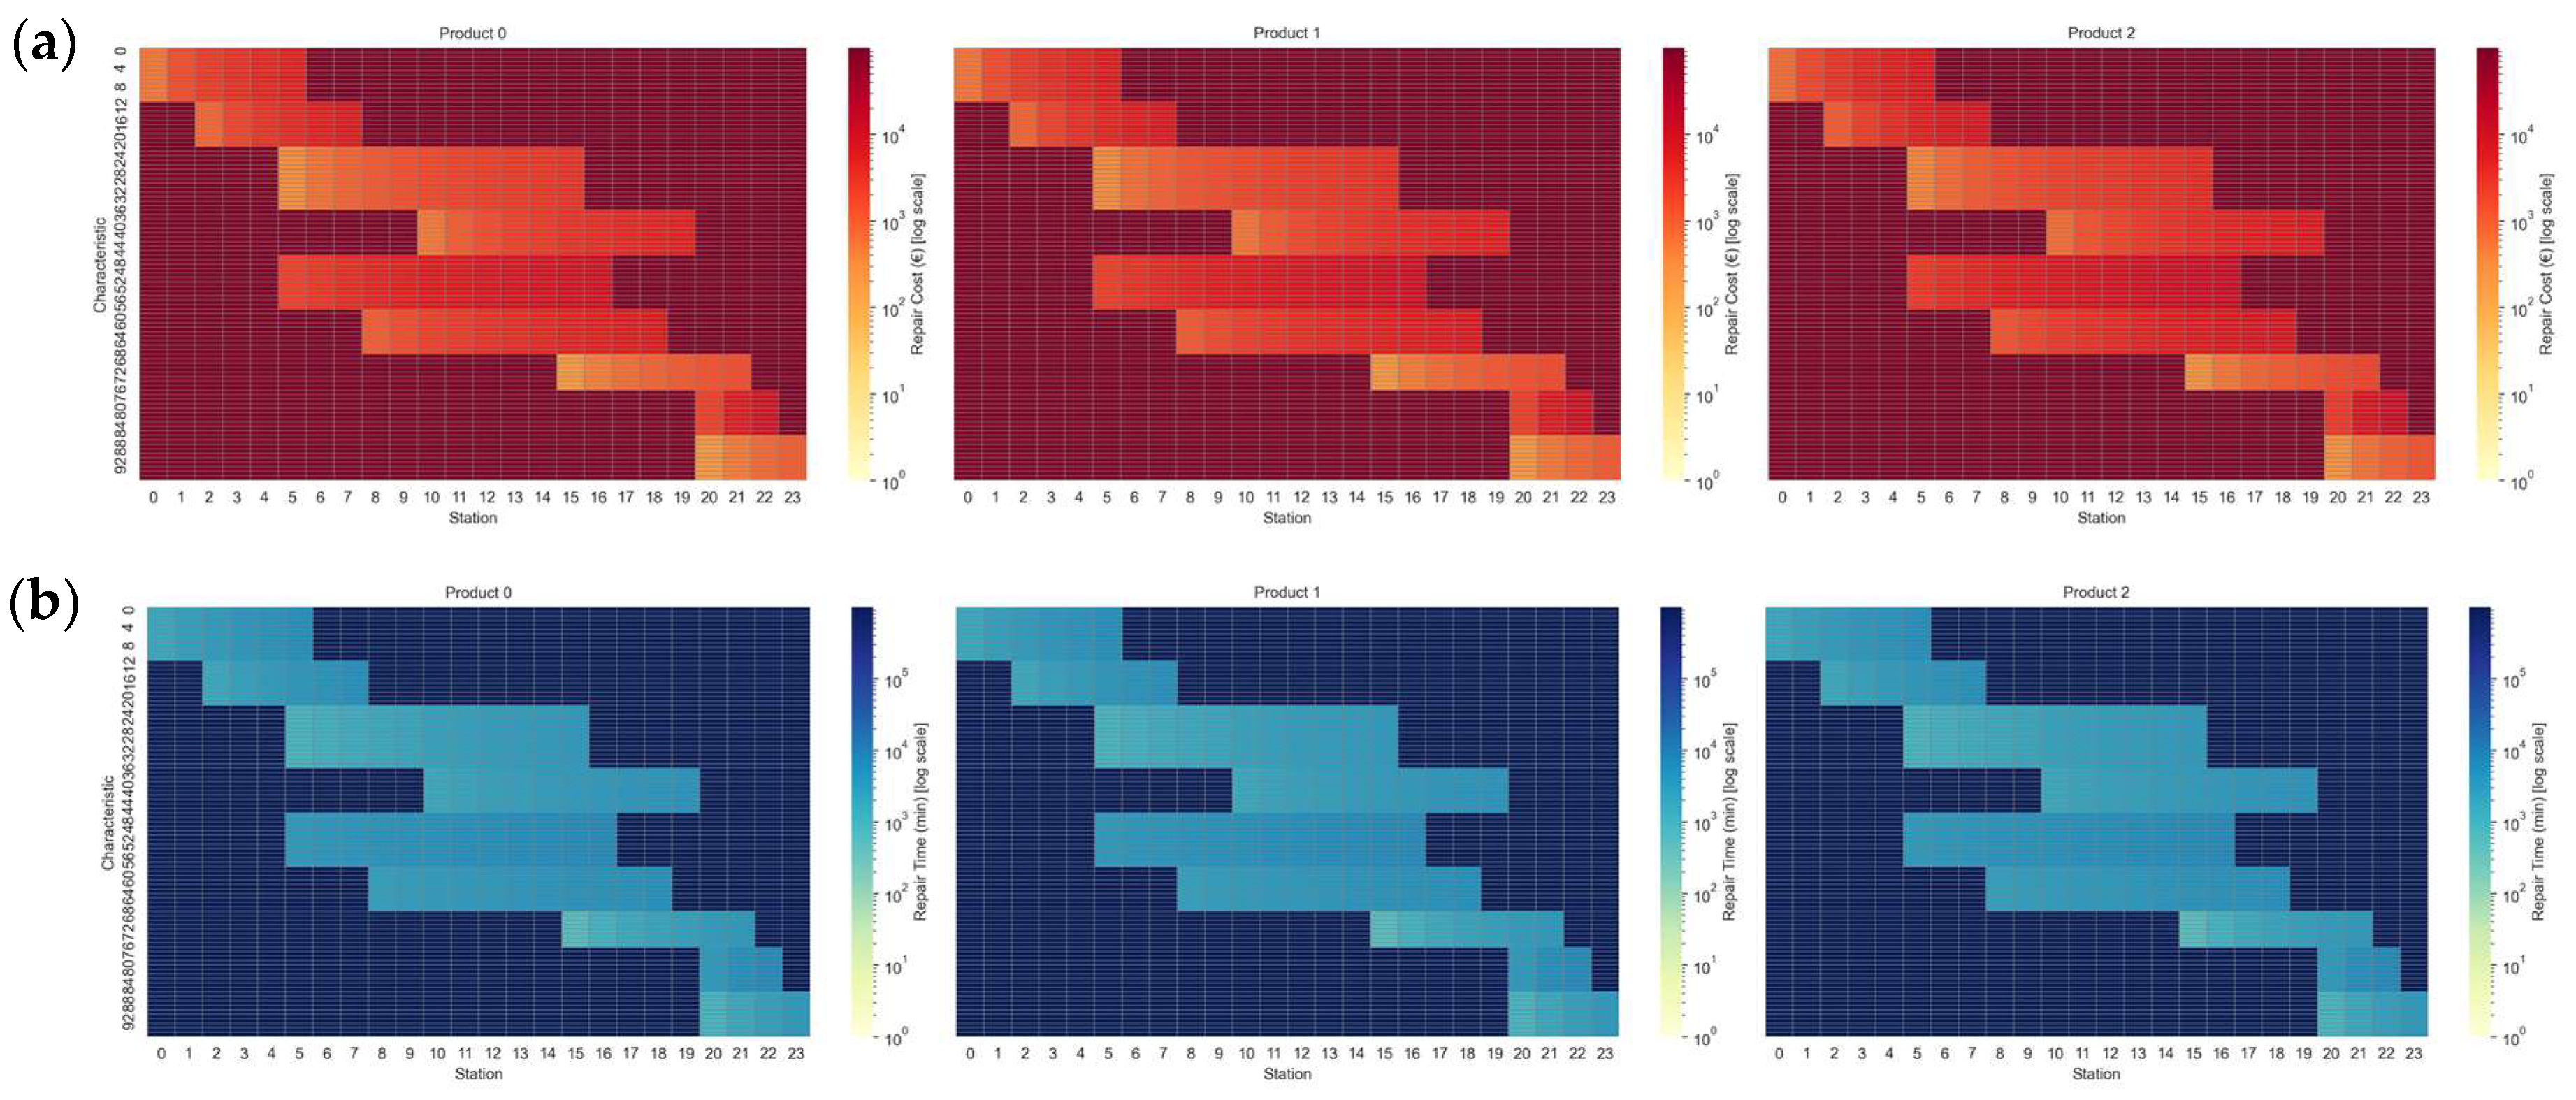
A similar pattern to that reported in
Figure 2b can also be noticed in
Figure 3a,b, representing, respectively, the evolution of the parameter
and
. According to the chart, also in this case, the cost and the time to repair a defect for specific characteristics increase as products progress over the stations.
Lastly,
Figure 4 and
Figure 5 report, respectively, the evolution of the parameter
, and
in the examined case study.
3.3.2. Experiments Performed on Synthetic Data
A complexity analysis was performed recurring to synthetic data by generating multiple instances of the problem by increasing the considered number of products (P), inspection stations (S), product characteristics (K), and time periods (T). These sets were adjusted within the ranges defined in
Table 2 to create progressively larger problem instances. Each generated instance was solved using the MILP model, and the computational time required to solve each instance was recorded in seconds. The experiments thus aimed to measure how the model’s performance (in terms of solution time) is affected as the problem size increases. These tests provide valuable insights into the model’s scalability, helping to understand its efficiency and identify potential bottlenecks as the problem grows.
3.3.3. Experiments Performed on Real-World Data
Three distinct analyses were carried out on the case study data to assess the model’s performance and robustness: a Decision-Making Analysis, an Ablation Analysis, and a Sensitivity Analysis. Each analysis was designed to provide valuable insights into the model’s behavior when applied to real-world quality inspection scenarios.
The Decision-Making Analysis aimed to understand the decisions suggested by the model when applied to the real-world case study. This analysis focused on the model’s ability to optimize the allocation of inspection resources, considering the various constraints and objectives defined by the case study. The results of this analysis provided an overview of the model’s decision-making insight.
Next, an Ablation Analysis was conducted using the same case study data to evaluate the impact of excluding specific features from the proposed model. Four ablated models were created for comparison. The first ablated model was generated by fixing the number of controls (
) to its maximum value, thereby removing its variability. The remaining three ablated models were generated by restricting the model from selecting, in turn, each of the three predefined inspection technologies. A summary of all models included in the Ablation Analysis is presented in
Table 4.
These experiments allowed us to understand how much the inclusion of these features affects both the objective function and the computational time required to solve the problem.
Lastly, a Sensitivity Analysis was conducted to examine how variations in the values of key parameters impact the results obtained from the Ablation Analysis. This analysis focused on understanding the impact of demand (
and defect rate of product (
) variations on the results of the Ablation Analysis.
Table 5 reports the value range of the multipliers adopted to vary demand and defect rate.
3.3.4. Experimental Setup
All experiments were performed on a workstation equipped with an Intel Core i9-10900 CPU at 2.80 GHz and 64 GB of RAM, running a 64-bit operating system. The computational code was developed in Python 3.9.18 using the Pyomo library for model formulation. Gurobi was selected due to its recognized efficiency, robustness, and scalability in solving large-scale and complex MILP problems, which are characteristics of the model formulated in this study. Its advanced presolving techniques, parallel computing capabilities, and industry-leading performance benchmarks make it particularly well suited for addressing the high computational demands of multi-product, multi-method quality inspection system optimization. Sensitivity analyses were conducted using the Optuna framework for automated trial generation and evaluation.
4. Results
This section presents the main findings of the study.
Section 4.1 reports the model complexity analysis.
Section 4.2 discusses the Decision-Making Analysis based on real automotive case study data.
Section 4.3 details the Ablation Analysis, examining the impact on the objective function and computational time when specific model features are removed. Lastly,
Section 4.4 presents the results of the Sensitivity Analysis.
4.1. Model Complexity Analysis
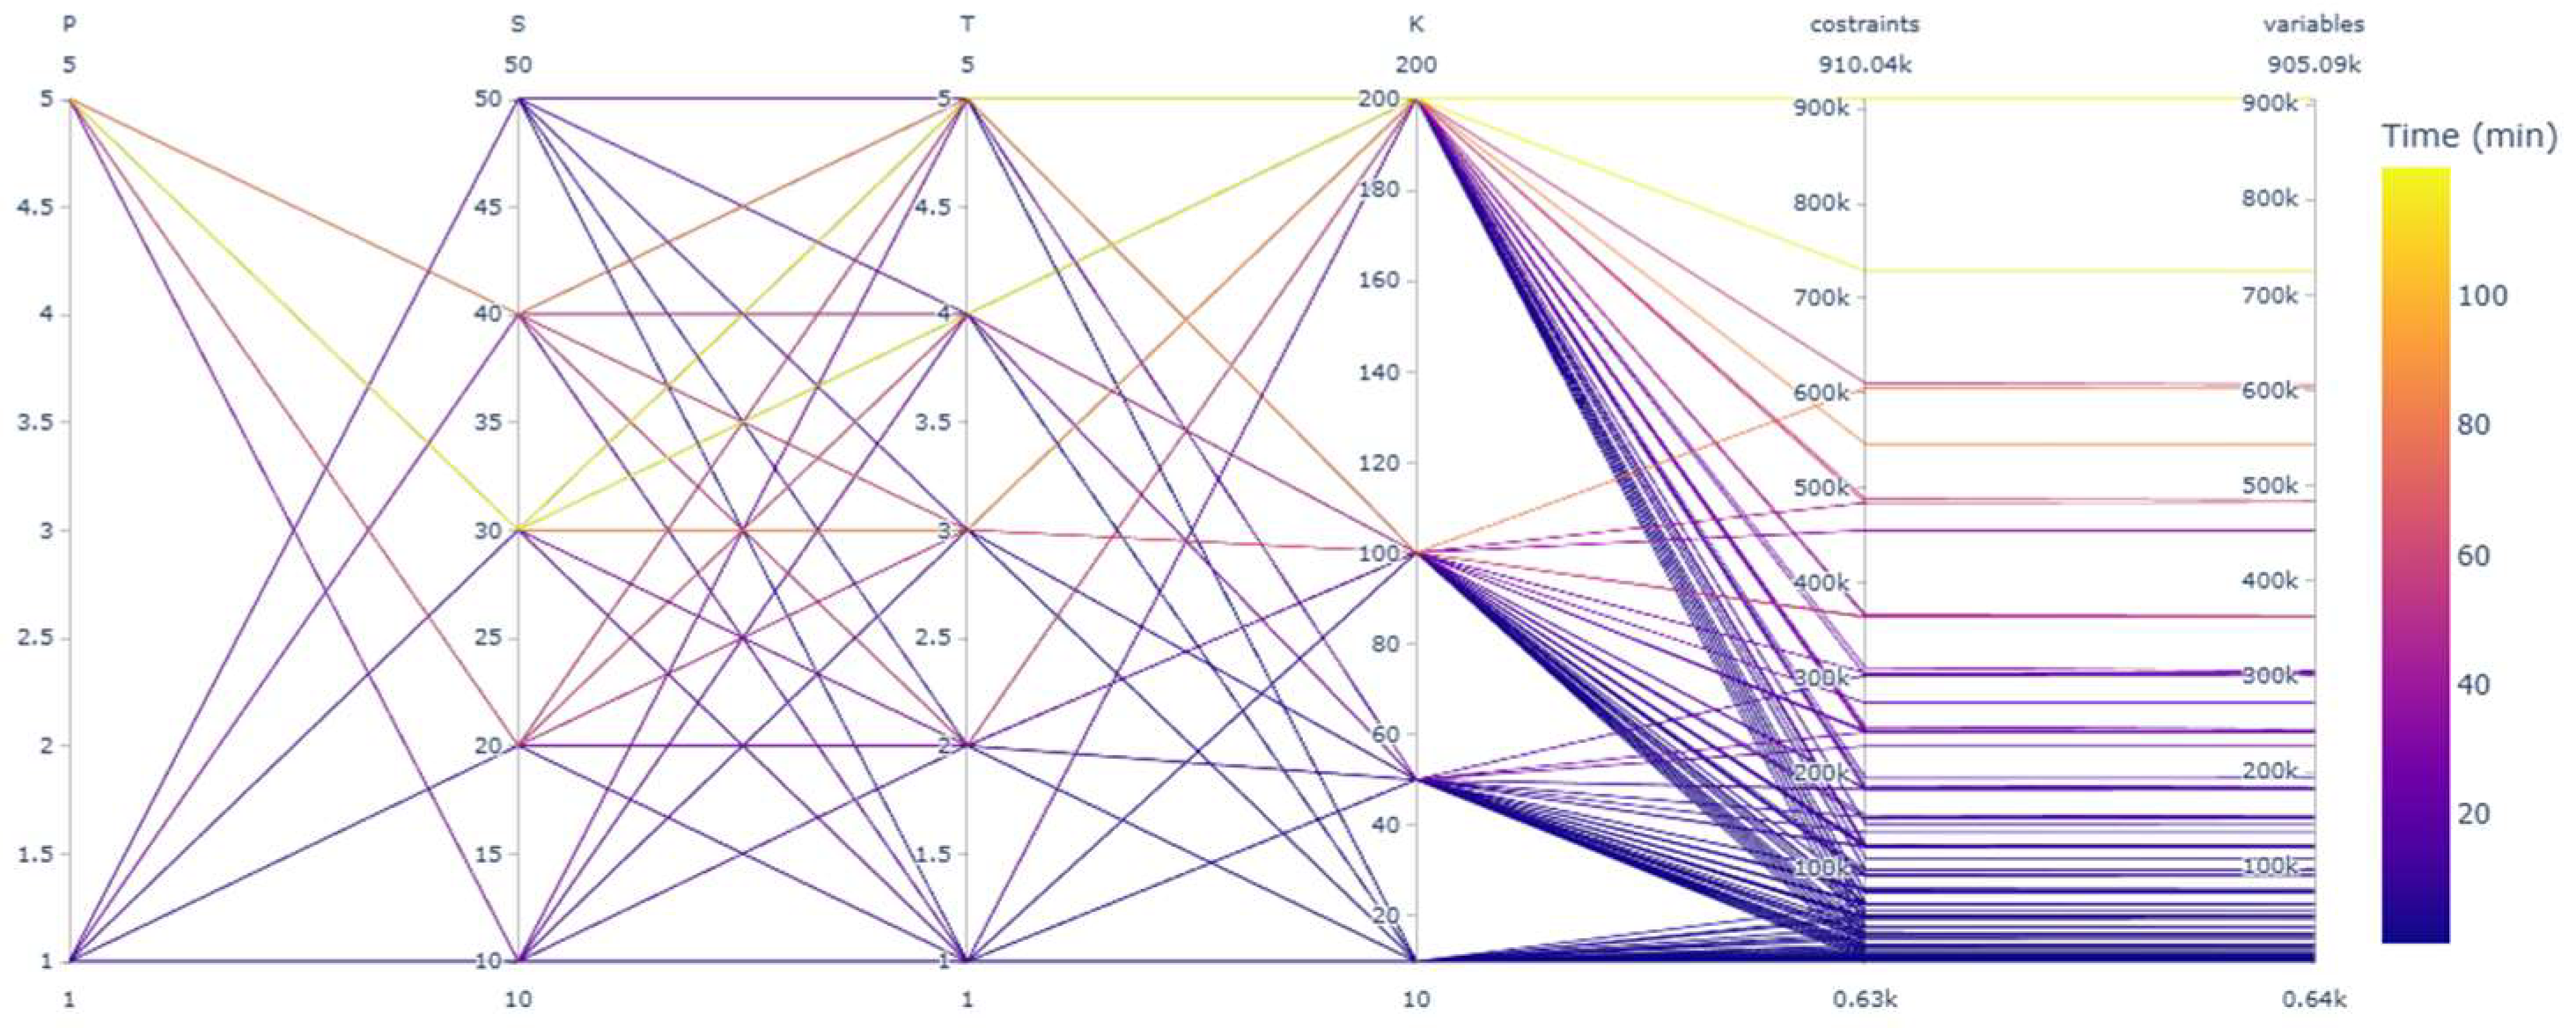
Figure 6 presents a parallel coordinate plot used to examine the relationship between the cardinality of the model sets—P, S, T, and K—and the corresponding computational time, measured in minutes. Each vertical axis represents one set, with individual lines corresponding to different problem instances. The color of each line encodes the computational time.
According to
Figure 6, the solution time increases substantially with the number of characteristics (K) and stations (S), which are the most significant contributors to model dimensionality. These two parameters directly influence the number of decision variables and constraints, leading to an exponential growth in problem size. This is particularly evident for configurations where both K and S are large (e.g., K = 200 and S = 50), which resulted in models with over 900,000 constraints and similar numbers of variables. In such cases, the solution times exceeded 100 min. In contrast, increasing the number of products (P) and time periods (T) had a more modest effect on the computational performance. While these dimensions increase the total number of indexed variables and constraints, their relative contribution to model complexity appears to be lower than that of characteristics and stations. The parallel coordinate visualization also illustrates that there is a strong correlation between the total model size (in terms of constraints and variables) and the solving time, with darker (shorter) time durations associated with smaller-scale instances. However, some variability remains across configurations with similar structural sizes, suggesting that internal sparsity patterns or solver dynamics may also influence performance.
4.2. Decision-Making Analysis
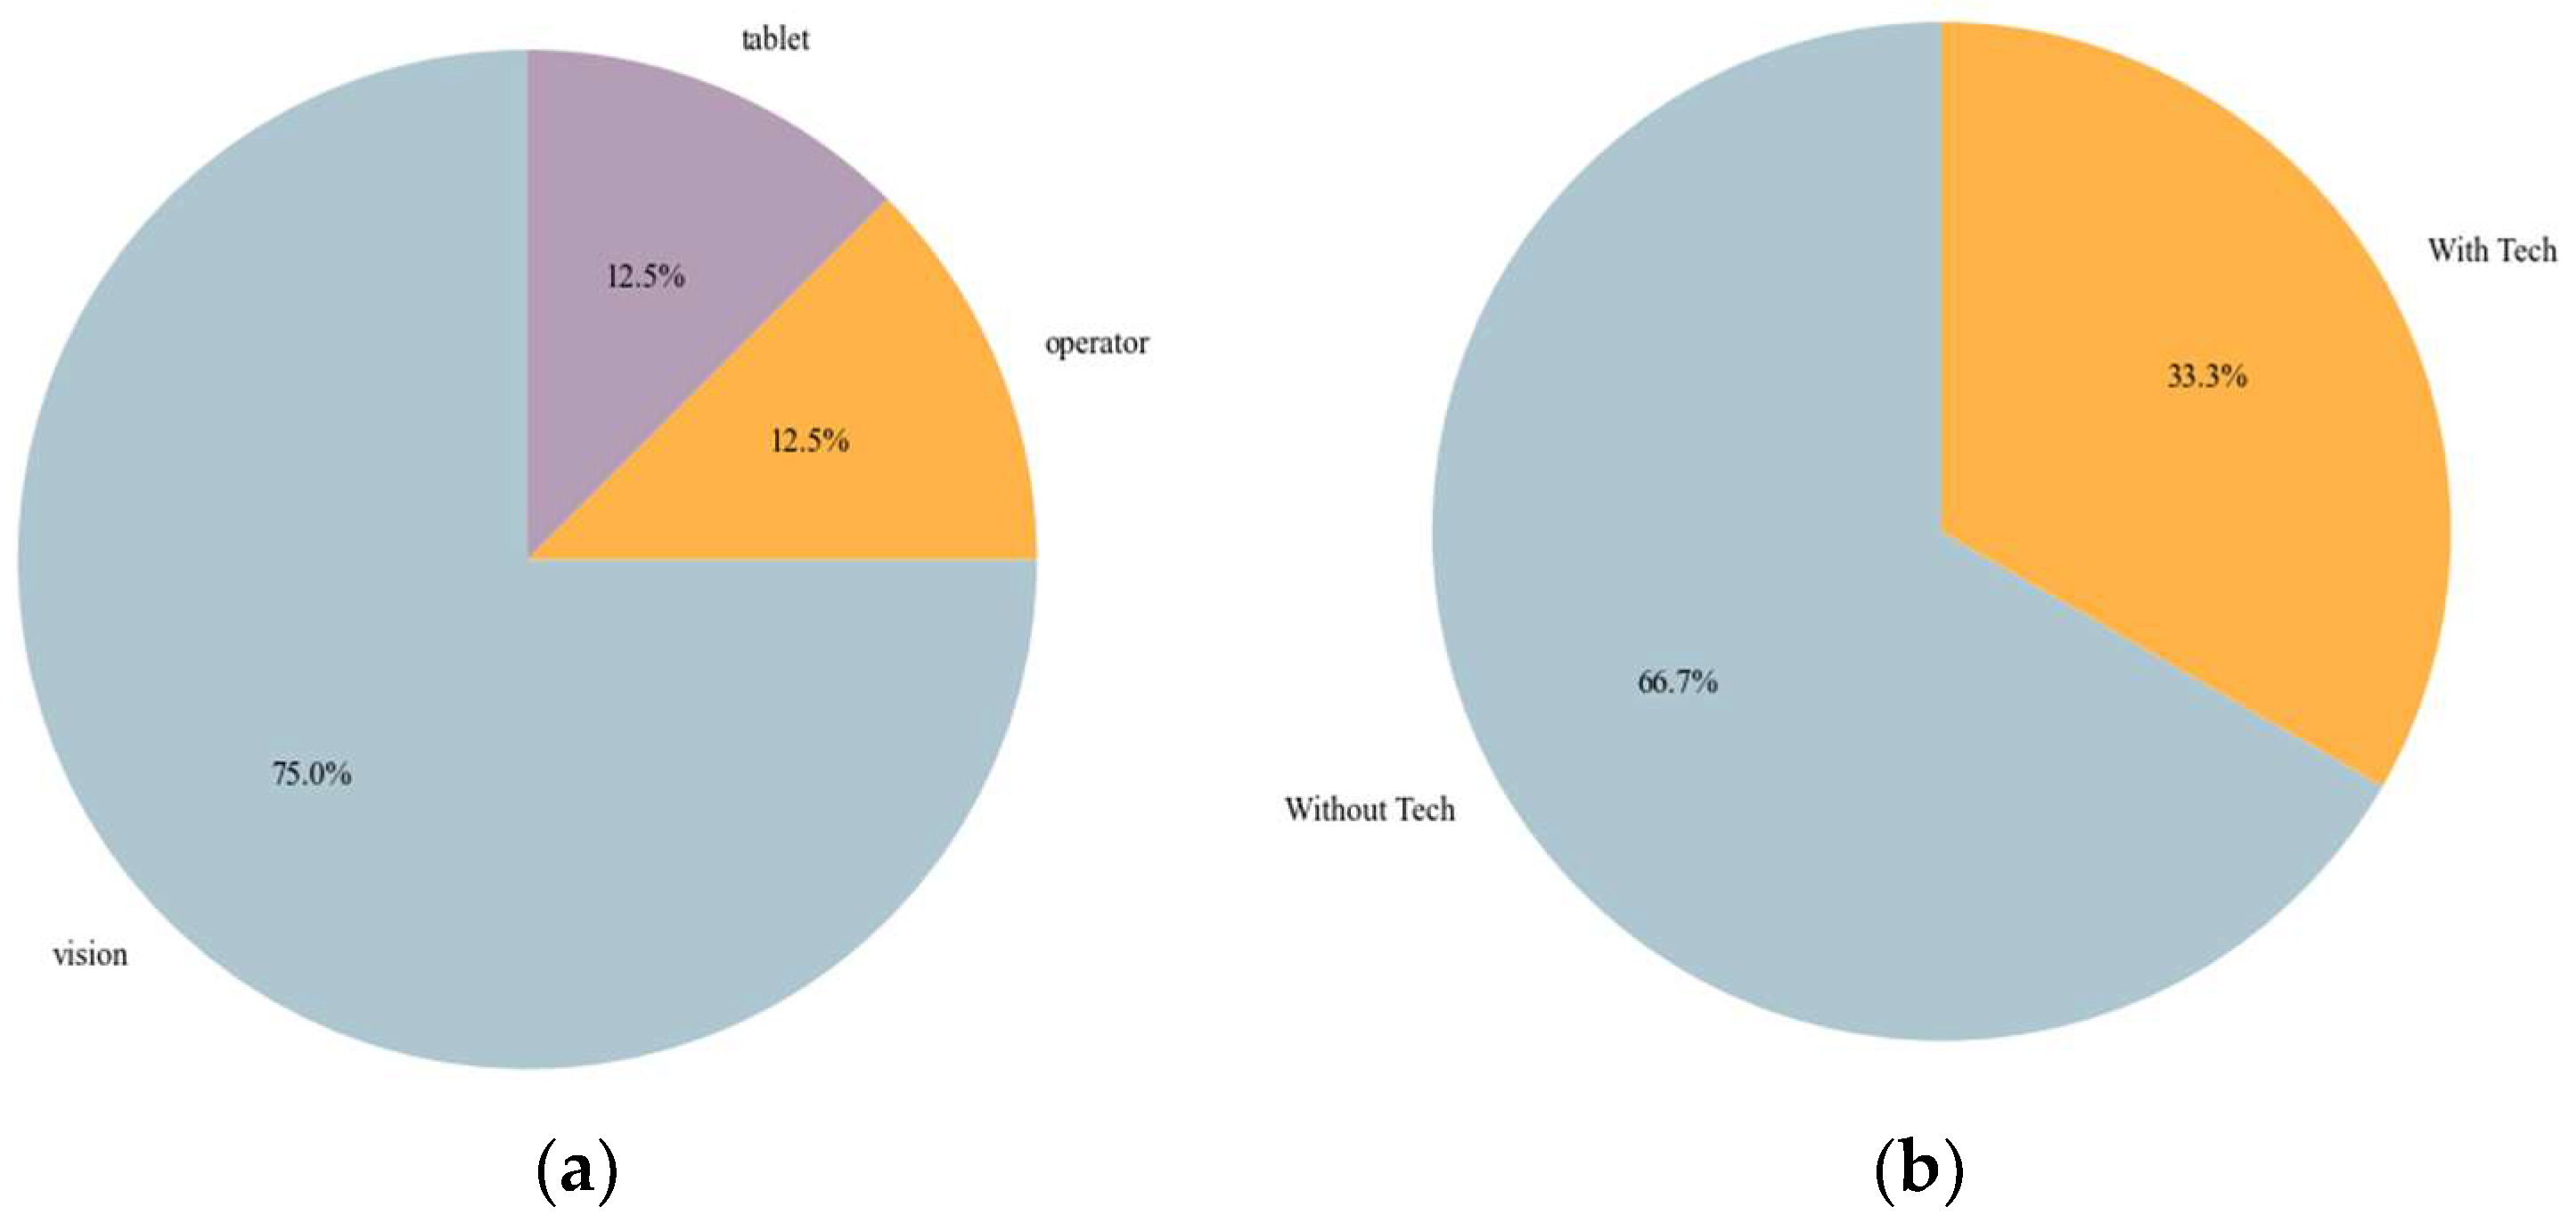
Figure 7 consists of two pie charts summarizing the decisions related to the installation of inspection technologies in the analyzed automotive case study.
Figure 7a shows the installed proportion between the different types of technologies.
Figure 7b depicts, instead, the percentage of stations where technology has been implemented versus those without any technological installations.
According to
Figure 7a, most installed technologies belong to the machine vision category, accounting for 75% of all installations. In contrast, human and human inspections assisted with digital technologies are installed in only 12.5% of cases. This distribution suggests a strong preference for machine vision-based systems in the examined case study, likely due to their higher efficiency and detection accuracy reported in
Figure 1 and
Figure 2. Instead,
Figure 7b illustrates the extent of technology adoption across stations. Only 33.3% of stations are equipped with one technology, while the remaining 66.7% operate without any technological support. This indicates that despite the availability of multiple technologies, their deployment is limited to a subset of the station network. The results reflect a selective installation strategy driven by resource limitations, targeted inspection needs, and strategic allocation of high-performing technologies to specific stations.
Additional decision-making insights related to the examined case study are provided in
Figure 8. Here, the figure shows a bar chart representing the distribution of the sampling rate for the different technologies, plotted on a logarithmic scale on the
y-axis. The
x-axis displays the different values of the sampling rate (which can vary from 0 to 1), while the
y-axis shows the logarithmic count of occurrences for each value. Bars are color-coded by technology.
The results indicate that in most cases where inspection is performed, the model opts to inspect the full available demand using vision-based systems. However, while the sampling rate of 1.0 dominates across all technologies, a non-negligible number of instances exhibit intermediate or partial sampling rates, especially for human inspections and those assisted by digital tools. This suggests that the model leverages variable sampling rates selectively, favoring full inspection only when cost, performance, or time constraints are justified. The presence of partial sampling configurations confirms that, under certain conditions, inspecting a subset of units is the more cost-effective strategy, particularly when using less efficient or more resource-constrained technologies.
4.3. Ablation Analysis
Table 6 presents the results of the Ablation Analysis, comparing the proposed original model (O) against the four variants where specific modeling features are removed. The comparison focuses on two metrics: the change in the objective function value (delta in percentage) and the change in computational time (also in percentage).
The Ablation Analysis demonstrates that the most significant impact is observed when the model is restricted from using machine vision inspection (NO-MVI), resulting in a 42.6% increase in the objective function value compared to the proposed model (P). This substantial degradation highlights machine vision’s critical role in achieving cost-effective quality control strategies. Interestingly, this variant also reduced the computational time by 26.6%, suggesting that removing this option simplifies the search space, albeit at the expense of optimality. Excluding assisted human inspection (NO-HAI) and human inspection (NO-HI) results in much smaller increases in objective value—1.5% and 0.7%, respectively—while yielding noticeable improvements in computational time in the 24–27% range. These findings indicate that while both forms of human-based inspection contribute marginally to solution quality, they increase the model complexity and solution effort. Fixing the sampling rate (MCN) yields the lowest change in the objective function but leads to an 8% increase in the computational time. This suggests that while the model can adapt inspection volumes with little gain in performance for this case study, enforcing fixed control levels introduces additional constraints that may slightly hinder the solver efficiency.
4.4. Sensitivity Analysis
According to
Figure 7a and
Table 6, machine vision technology is the most adopted and impactful technology in the proposed case study.
Figure 9 thus analyzes how much demand and defect rate variations affect objective functions, comparing the proposed original model (O) and the model where machine vision technology is not a possible option to select (NO-MVI). Specifically, the bar plot in
Figure 9a ranks the input variables based on their influence on the loss (objective function degradation), while the contour plot in
Figure 9b illustrates how the variables’ values affect performance degradation.
According to
Figure 9b, removing machine vision led to a measurable increase in the objective function, with relative cost increases ranging from 20.5% to 62.2% depending on the values assumed by demand and defect rate parameters. More specifically, the plot revealed a non-monotonic relationship, with elevated loss occurring in two distinct regions: one at low demand and low defect probability and another at higher demand levels with moderate defect probability. In addition, the feature importance analysis in
Figure 9a indicated that variations in demand had a greater influence on cost outcomes than variations in defect probability.
On the contrary,
Figure 10 illustrates the results of the Sensitivity Analysis when the proposed original model (O) is compared with the one where the number of controls cannot be adjusted based on the situation (MCN).
According to
Figure 10b, the increase in cost associated with forced full inspection ranged from 0.012% to 0.512%, with a mean increase of 0.164% and a median of 0.132%. These results indicate a consistent, albeit moderate, benefit from allowing the model to determine the number of items to inspect. The maximum observed cost increase, 0.512%, occurred in a case with a defect probability multiplier of 0.93 and a demand multiplier of 1.26. This represents a high-demand condition with a moderately elevated quality risk, where excessive inspection activity leads to cost inefficiencies. In general,
Figure 10b reveals that scenarios with higher demand multipliers tend to yield higher cost deltas when full inspection is enforced. Moreover, the relationship with defect probability is more nuanced, as reported in
Figure 10a, suggesting nonlinear effects and potential interactions between the two factors.
5. Discussion
The results presented in this study offer valuable insights into optimizing quality control systems in complex production environments. The proposed optimization model, which integrates technology selection with variable sampling rate decisions, demonstrates strong potential for supporting strategic inspection planning across various operational contexts.
The complexity analysis reveals a critical consideration for model deployment: the scalability of the model is highly sensitive to the number of inspection characteristics and available stations. As these parameters increase, the number of variables and constraints grows exponentially, leading to significant increases in solution time. This suggests that while the model is both flexible and detailed, the careful design of problem instances is crucial to maintain tractability, especially in large-scale applications. Techniques such as dimensionality reduction or hierarchical decomposition may help balance model granularity with computational feasibility. These considerations are particularly important for industries that require scalability, like mass production, where the complexity of the problem grows rapidly.
In examining technology allocation within the automotive case study, the results highlight a clear preference for machine vision systems, which were selected in 75% of installations. This strong preference indicates that automated visual inspection technologies offer substantial economic and operational advantages due to their efficiency and defect detection capabilities. Interestingly, only 33.3% of the stations were equipped with technology, reflecting the model’s selective approach to technology deployment. This targeted strategy suggests that not all stations require technology adoption; instead, investments should be concentrated where they yield the greatest return in terms of inspection coverage, speed, and defect detection. From a managerial standpoint, these findings support the notion that a strategic, selective approach to technological deployment is more cost-effective than blanket technology adoption across the production floor.
The model’s ability to adjust sampling rates dynamically further enhances its value. Full inspections (sampling rate of 1.0) are recommended most often, especially for machine vision technologies, while partial inspections are suggested under conditions where cost and resource constraints are more significant. This flexibility in adapting inspection strategies not only optimizes the allocation of resources but also prevents over-inspection, which is often a problem in traditional fixed-rate inspection policies. The results highlight that this adaptive approach is particularly valuable when using human-based inspection technologies, which may require more resource-intensive processes. By allowing the model to vary sampling rates based on real-time data and production needs, companies can achieve a more agile, cost-efficient quality control strategy.
The Ablation Analysis provides additional insights into the internal dynamics of the model. Removing machine vision from the model resulted in a significant 42.6% increase in the objective function, underscoring the critical role that machine vision plays in achieving optimal inspection strategies. Conversely, excluding human-based inspections led to only a marginal decrease in model performance, though it did reduce the computational effort. This suggests that while human inspections contribute to quality assurance, their impact on the overall cost-effectiveness of the system is relatively limited compared to automated systems. Additionally, the removal of sampling rate flexibility resulted in slightly longer solving times, emphasizing the computational advantage of allowing variable inspection levels. This reinforces the model’s ability to adapt to different operational scenarios, optimizing both quality and efficiency.
The Sensitivity Analysis offers further depth by illustrating how variations in demand levels and defect probabilities influence the model’s performance. The greatest cost increases from excluding machine vision occurred under both low- and high-demand conditions, highlighting the importance of automated inspection systems in both low-volume, high-efficiency contexts and high-volume, high-risk environments. These findings indicate that machine vision’s speed and scalability are essential for maintaining throughput and minimizing defects in diverse production settings. Moreover, the analysis reveals that demand levels are the dominant factor affecting performance variability, with defect probabilities playing a secondary role. This suggests that production managers should align technology adoption with demand forecasting and capacity planning, ensuring that inspection strategies are tailored to the specific conditions of the production environment.
While the current study already includes a comprehensive analysis of the most impactful variables, such as demand and defect rates, future research could explore extending this analysis to include additional secondary variables or multi-factorial scenarios. Such analyses could provide deeper insights into the interactions between various factors, although doing so in this paper might risk complicating the results and potentially confusing the reader. Thus, the focus on the most significant variables ensures that the findings remain clear and accessible. Future work could expand on this by incorporating a wider range of scenarios or applying the model to other industries, which would provide further evidence of its versatility and applicability.
In conclusion, this study demonstrates that an optimization model incorporating technology selection and flexible sampling rates can significantly improve inspection planning outcomes. Machine vision proves to be a cornerstone of modern inspection strategies, while the ability to adapt sampling rates enhances operational efficiency and resource management. These findings suggest that smart, data-driven quality control systems, which move beyond traditional one-size-fits-all approaches, can better balance quality assurance objectives with operational constraints. This approach allows practitioners to adopt more agile and cost-efficient strategies, paving the way for more effective quality control systems in diverse production environments.
6. Conclusions
This paper presented a novel MILP model designed to optimize the selection, allocation, and utilization of different quality inspection methodologies in multi-product assembly systems. The main contribution lies in its ability to simultaneously select the most appropriate inspection methodologies and determine optimal sampling rates, while minimizing total quality-related costs. Compared to existing approaches, the proposed model uniquely integrates heterogeneous inspection methods, explicitly accounts for detection errors, and supports sampling rate optimization in a multi-product environment. According to the literature review (
Table 1), no previous contribution simultaneously addresses all of these aspects within a unified optimization framework.
The model was validated through computational experiments using synthetically generated data and a real-world case study from the automotive sector. The synthetic data allowed for an in-depth analysis of the model’s scalability, revealing that the number of quality characteristics and inspection stations are key drivers of computational complexity. The real-world case study demonstrated the practical applicability of the model, highlighting the benefits of integrating machine vision systems and flexible sampling strategies into quality control planning. The results show that machine vision technologies provide a significant performance advantage, reducing total inspection-related costs by over 40% when compared to scenarios where they are not available.
However, the current model formulation presents some limitations. The current model formulation does not capture the potential improvement in defect detection capabilities over time, recognizing that human operators may enhance their performance as they gain experience. Future extensions could model this learning effect by introducing detection probabilities that progressively improve based on the number of inspections performed by operators, thereby capturing experience accumulation. It is noted that incorporating such learning dynamics would likely introduce nonlinearities into the model, potentially requiring the adoption of heuristic or metaheuristic solution methods to reduce computational complexity. In terms of misclassification errors during inspection, false negatives are already modeled and contribute to penalty costs associated with non-compliance. In contrast, false positives, where compliant units are incorrectly classified as defective, are not modeled. The false positives could lead to unnecessary rework operations and additional resource consumption. Future model enhancements could incorporate both types of misclassification errors to further increase the realism and practical relevance of the inspection planning. Another limitation concerns the empirical validation based on a single real-world case study with relatively limited volume data. Extensive testing was conducted using synthetically generated datasets covering a wide range of problem configurations to mitigate this.
Beyond the automotive sector, the proposed model is applicable to a wide range of discrete manufacturing industries such as electronics, aerospace, and medical device production, where diverse inspection technologies and multi-product lines are prevalent. These sectors similarly face challenges in balancing inspection cost, accuracy, and operational constraints, making the model broadly relevant.
Future research could thus focus on applying the model to a broader set of industrial scenarios to further validate its robustness and generalizability. Furthermore, integrating the model with real-time production monitoring systems (e.g., IoT-enabled inspection data), adapting it for remanufacturing settings, where inspection requirements vary by product condition, or extending it to support dynamic rescheduling in response to process disruptions or quality alerts are interesting avenues worth exploring as potential directions.
Author Contributions
Conceptualization, M.R., C.C., M.G. (Matteo Gabellini), A.R., and M.G. (Mauro Gamberi); data curation, C.C. and M.G. (Matteo Gabellini); Formal analysis, C.C. and M.G. (Matteo Gabellini); funding acquisition, A.R. and M.G. (Mauro Gamberi); investigation, C.C. and M.G. (Matteo Gabellini); methodology, C.C. and M.G. (Matteo Gabellini); project administration, A.R. and M.G. (Mauro Gamberi); resources, A.R.; software, C.C. and M.G. (Matteo Gabellini); supervision, A.R. and M.G. (Mauro Gamberi); validation, C.C. and M.G. (Matteo Gabellini); visualization, M.G. (Matteo Gabellini); writing—original draft, M.R., C.C., M.G. (Matteo Gabellini), A.R., and M.G. (Mauro Gamberi); writing—review and editing, M.R., C.C., M.G. (Matteo Gabellini), A.R., and M.G. (Mauro Gamberi). All authors have read and agreed to the published version of the manuscript.
Funding
This study was carried out within the MICS (Made in Italy—Circular and Sustainable) Extended Partnership and received funding from the European Union Next-Generation EU (PIANO NAZIONALE DI RIPRESA E RESILIENZA (PNRR)—MISSIONE 4 COMPONENTE 2, INVESTIMENTO 1.3—D.D. 1551.11-10-2022, PE00000004). This manuscript reflects only the authors’ views and opinions; neither the European Union nor the European Commission can be considered responsible for them.
Institutional Review Board Statement
Not applicable.
Informed Consent Statement
Not applicable.
Data Availability Statement
The raw data supporting the conclusions of this article will be made available by the authors on request.
Conflicts of Interest
The authors declare no conflicts of interest.
References
- Hinckley, C.M.; Barkan, P. The Role of Variation, Mistakes, and Complexity in Producing Nonconformities. J. Qual. Technol. 1995, 27, 242–249. [Google Scholar] [CrossRef]
- Gabellini, M.; Civolani, L.; Regattieri, A.; Calabrese, F. A Data Model for Predictive Supply Chain Risk Management. In Proceedings of the 9th Changeable, Agile, Reconfigurable and Virtual Production Conference and the World Mass Customization & Personalization Conference, Bologna, Italy, 20–23 June 2023; Springer: Berlin/Heidelberg, Germany, 2023; pp. 365–372. [Google Scholar]
- Gabellini, M.; Civolani, L.; Calabrese, F.; Bortolini, M. A Deep Learning Approach to Predict Supply Chain Delivery Delay Risk Based on Macroeconomic Indicators: A Case Study in the Automotive Sector. Appl. Sci. 2024, 14, 4688. [Google Scholar] [CrossRef]
- Snieska, V.; Daunoriene, A.; Zekeviciene, A. Hidden Costs in the Evaluation of Quality Failure Costs. Eng. Econ. 2013, 24, 176–186. [Google Scholar] [CrossRef]
- Montgomery, D.C. Statistical Quality Control; Wiley: New York, NY, USA, 2009; Volume 7. [Google Scholar]
- ISO 2859-1:1999; Sampling Procedures for Inspection by Attributes. Part 1: Sampling Schemes Indexed by Acceptance Quality Limit (AQL) for Lot-by-Lot Inspection. ISO: Geneva, Switzerland, 1999.
- Lario, J.; Mateos, J.; Psarommatis, F.; Ortiz, Á. A Cost Model for the Investment Feasibility of Quality Inspection Technologies in the Zero Defect Manufacturing Era. Int. J. Prod. Res. 2024, 1–16. [Google Scholar] [CrossRef]
- Dwivedi, S.K.; Vishwakarma, M.; Soni, A. Advances and Researches on Non Destructive Testing: A Review. Mater. Today Proc. 2018, 5, 3690–3698. [Google Scholar] [CrossRef]
- Kujawinska, A.; Vogt, K.; Diering, M.; Rogalewicz, M.; Waigaonkar, S.D. Organization of Visual Inspection and Its Impact on the Effectiveness of Inspection. In Advances in Manufacturing, Proceedings of the 5th International Scientific-Technical Conference, Poznan, Poland, 24–26 October 2017; Springer: Cham, Switzerland, 2017; pp. 899–909. [Google Scholar]
- Aust, J.; Pons, D. Comparative Analysis of Human Operators and Advanced Technologies in the Visual Inspection of Aero Engine Blades. Appl. Sci. 2022, 12, 2250. [Google Scholar] [CrossRef]
- Kolus, A.; Wells, R.; Neumann, P. Production Quality and Human Factors Engineering: A Systematic Review and Theoretical Framework. Appl. Ergon. 2018, 73, 55–89. [Google Scholar] [CrossRef]
- Coronado, E.; Kiyokawa, T.; Ricardez, G.A.G.; Ramirez-Alpizar, I.G.; Venture, G.; Yamanobe, N. Evaluating Quality in Human-Robot Interaction: A Systematic Search and Classification of Performance and Human-Centered Factors, Measures and Metrics towards an Industry 5.0. J. Manuf. Syst. 2022, 63, 392–410. [Google Scholar] [CrossRef]
- Lu, Y.; Zheng, H.; Chand, S.; Xia, W.; Liu, Z.; Xu, X.; Wang, L.; Qin, Z.; Bao, J. Outlook on Human-Centric Manufacturing towards Industry 5.0. J. Manuf. Syst. 2022, 62, 612–627. [Google Scholar] [CrossRef]
- Gabellini, M.; Calabrese, F.; Regattieri, A.; Ferrari, E. Multivariate Multi-Output LSTM for Time Series Forecasting with Intermittent Demand Patterns. In Proceedings of the 27th Summer School Francesco Turco, Sanremo, Italy, 7–9 September 2022; pp. 1–7. [Google Scholar]
- Gabellini, M.; Calabrese, F.; Civolani, L.; Regattieri, A.; Mora, C. A Data-Driven Approach to Predict Supply Chain Risk Due to Suppliers’ Partial Shipments. In Proceedings of the 10th International Conference on Sustainable Design and Manufacturing, Bari, Italy, 18–20 September 2023; Springer: Singapore, 2023; pp. 227–237. [Google Scholar]
- Guo, H.; Bao, Y.; Hu, S.; Luan, C.; Fu, J.; Li, L.; Zhang, Y.; Sun, Y.; Nie, Z. AFCN: An Attention-directed Feature-fusion ConvNeXt Network for Low-voltage Apparatus Assembly Quality Inspection. IET Image Process. 2024, 18, 2093–2104. [Google Scholar] [CrossRef]
- Staněk, R.; Kerepecký, T.; Novozámský, A.; Šroubek, F.; Zitová, B.; Flusser, J. Real-Time Wheel Detection and Rim Classification in Automotive Production. In Proceedings of the 2023 IEEE International Conference on Image Processing (ICIP), Kuala Lumpur, Malaysia, 8–11 October 2023; IEEE: New York, NY, USA, 2023; pp. 1410–1414. [Google Scholar]
- Rio-Torto, I.; Campanico, A.T.; Pinho, P.; Filipe, V.; Teixeira, L.F. Hybrid Quality Inspection for the Automotive Industry: Replacing the Paper-Based Conformity List through Semi-Supervised Object Detection and Simulated Data. Appl. Sci. 2022, 12, 5687. [Google Scholar] [CrossRef]
- Maack, R.F.; Tercan, H.; Meisen, T. Deep Learning Based Visual Quality Inspection for Industrial Assembly Line Production Using Normalizing Flows. In Proceedings of the 2022 IEEE 20th International Conference on Industrial Informatics (INDIN), Perth, Australia, 25–28 July 2022; IEEE: New York, NY, USA, 2022; pp. 329–334. [Google Scholar]
- Zhou, B.; Zhao, L.; Zhang, T.Y.; Zhao, J.B.; Xia, R.B.; Liu, D.H. Aviation Equipment Measurement and Assembly Analysis Method Based on Robotic System. Measurement 2024, 234, 114810. [Google Scholar] [CrossRef]
- Morsi, N.M.; Mata, M.; Harrison, C.S.; Semple, D. Adaptive Robotic System for the Inspection of Aerospace Slat Actuator Mount. Front. Robot. AI 2024, 11, 1423319. [Google Scholar] [CrossRef]
- Mumbelli, J.D.C.; Guarneri, G.A.; Lopes, Y.K.; Casanova, D.; Teixeira, M. An Application of Generative Adversarial Networks to Improve Automatic Inspection in Automotive Manufacturing. Appl. Soft Comput. 2023, 136, 110105. [Google Scholar] [CrossRef]
- Basamakis, F.P.; Bavelos, A.C.; Dimosthenopoulos, D.; Papavasileiou, A.; Makris, S. Deep Object Detection Framework for Automated Quality Inspection in Assembly Operations. Procedia CIRP 2022, 115, 166–171. [Google Scholar] [CrossRef]
- Zhao, D.; Kong, F.; Du, F. An Element Perception and State Recognition Method Oriented to Complex Assembled Product. Eng. Res. Express 2024, 6, 025417. [Google Scholar] [CrossRef]
- Silva, J.; Coelho, P.; Saraiva, L.; Vaz, P.; Martins, P.; López-Rivero, A. Validating the Use of Smart Glasses in Industrial Quality Control: A Case Study. Appl. Sci. 2024, 14, 1850. [Google Scholar] [CrossRef]
- Capela, S.; Silva, R.; Khanal, S.R.; Campaniço, A.T.; Barroso, J.; Filipe, V. Engine Labels Detection for Vehicle Quality Verification in the Assembly Line: A Machine Vision Approach. In CONTROLO 2020, Proceedings of the 14th APCA International Conference on Automatic Control and Soft Computing, Bragança, Portugal, 1–3 July 2020; Springer: Cham, Switzerland, 2021; pp. 740–751. [Google Scholar]
- Ben Abdallah, H.; Jovančević, I.; Orteu, J.-J.; Brèthes, L. Automatic Inspection of Aeronautical Mechanical Assemblies by Matching the 3D CAD Model and Real 2D Images. J. Imaging 2019, 5, 81. [Google Scholar] [CrossRef]
- Charalambous, G.; Fletcher, S.; Webb, P. The Development of a Scale to Evaluate Trust in Industrial Human-Robot Collaboration. Int. J. Soc. Robot. 2016, 8, 193–209. [Google Scholar] [CrossRef]
- Ranz, F.; Hummel, V.; Sihn, W. Capability-Based Task Allocation in Human-Robot Collaboration. Procedia Manuf. 2017, 9, 182–189. [Google Scholar] [CrossRef]
- Rezaei-Malek, M.; Mohammadi, M.; Dantan, J.-Y.; Siadat, A.; Tavakkoli-Moghaddam, R. A Review on Optimisation of Part Quality Inspection Planning in a Multi-Stage Manufacturing System. Int. J. Prod. Res. 2019, 57, 4880–4897. [Google Scholar] [CrossRef]
- Mandroli, S.S.; Shrivastava, A.K.; Ding, Y. A Survey of Inspection Strategy and Sensor Distribution Studies in Discrete-Part Manufacturing Processes. IIE Trans. 2006, 38, 309–328. [Google Scholar] [CrossRef]
- Shetwan, A.G.; Vitanov, V.I.; Tjahjono, B. Allocation of Quality Control Stations in Multistage Manufacturing Systems. Comput. Ind. Eng. 2011, 60, 473–484. [Google Scholar] [CrossRef]
- You, Y.; Duan, G.; Liu, R.; Liu, T.; Huang, M. Inspection Allocation Optimization with Resource Constraints Based on Modified NSGA-II in Flexible Manufacturing Systems. Math. Probl. Eng. 2021, 2021, 3976576. [Google Scholar] [CrossRef]
- Azadeh, A.; Sangari, M.S.; Sangari, E.; Fatehi, S. A Particle Swarm Algorithm for Optimising Inspection Policies in Serial Multistage Production Processes with Uncertain Inspection Costs. Int. J. Comput. Integr. Manuf. 2015, 28, 766–780. [Google Scholar] [CrossRef]
- Mousavi, S.M.; Mirdamadi, S.; Siadat, A.; Dantan, J.; Tavakkoli-Moghaddam, R. An Intuitionistic Fuzzy Grey Model for Selection Problems with an Application to the Inspection Planning in Manufacturing Firms. Eng. Appl. Artif. Intell. 2015, 39, 157–167. [Google Scholar] [CrossRef]
- Korytkowski, P. A Genetic Algorithm with Tournament Selection for Optimising Inspection Allocation in Multiproduct Multistage Production Systems. Int. J. Simul. Process. Model. 2011, 6, 238–244. [Google Scholar] [CrossRef]
- Volsem, S.V. Joint Optimisation of All Inspection Parameters for Multistage Processes: Evolutionary Algorithm and Simulation. Int. J. Innov. Comput. Appl. 2010, 2, 170–177. [Google Scholar] [CrossRef]
- Rezaei-Malek, M.; Tavakkoli-Moghaddam, R.; Siadat, A.; Dantan, J.-Y. A Novel Model for the Integrated Planning of Part Quality Inspection and Preventive Maintenance in a Linear-Deteriorating Serial Multi-Stage Manufacturing System. Int. J. Adv. Manuf. Technol. 2018, 96, 3633–3650. [Google Scholar] [CrossRef]
- Bettayeb, B.; Brahimi, N.; Lemoine, D. Integrated Dynamic Single Item Lot-Sizing and Quality Inspection Planning. Int. J. Prod. Res. 2018, 56, 2611–2627. [Google Scholar] [CrossRef]
- Mohammadi, M.; Siadat, A.; Dantan, J.-Y.; Tavakkoli-Moghaddam, R. Mathematical Modelling of a Robust Inspection Process Plan: Taguchi and Monte Carlo Methods. Int. J. Prod. Res. 2015, 53, 2202–2224. [Google Scholar] [CrossRef]
- Penn, M.; Raviv, T. A Polynomial Time Algorithm for Solving a Quality Control Station Configuration Problem. Discret. Appl. Math. 2008, 156, 412–419. [Google Scholar] [CrossRef]
- Vaghefi, A.; Sarhangian, V. Contribution of Simulation to the Optimization of Inspection Plans for Multi-Stage Manufacturing Systems. Comput. Ind. Eng. 2009, 57, 1226–1234. [Google Scholar] [CrossRef]
- Mohammadi, M.; Dantan, J.-Y.; Siadat, A.; Tavakkoli-Moghaddam, R. A Bi-Objective Robust Inspection Planning Model in a Multi-Stage Serial Production System. Int. J. Prod. Res. 2018, 56, 1432–1457. [Google Scholar] [CrossRef]
Figure 1.
Process flow through the assembly system with integrated inspection and rework activities.
Figure 1.
Process flow through the assembly system with integrated inspection and rework activities.
Figure 2.
(a) Variation in detection probability as a function of technology, product, station, and characteristic; (b) variation in inspection time as a function of technology, product, station, and characteristic.
Figure 2.
(a) Variation in detection probability as a function of technology, product, station, and characteristic; (b) variation in inspection time as a function of technology, product, station, and characteristic.
Figure 3.
(a) Variation in repair cost based on product, station, and characteristic. (b) Variation in repair time based on product, station, and characteristic.
Figure 3.
(a) Variation in repair cost based on product, station, and characteristic. (b) Variation in repair time based on product, station, and characteristic.
Figure 4.
Dependence of defect probability on product and characteristics.
Figure 4.
Dependence of defect probability on product and characteristics.
Figure 5.
Evolution of demand over time for the products examined in the case study.
Figure 5.
Evolution of demand over time for the products examined in the case study.
Figure 6.
Dependence of solving time on the cardinality of the problem sets.
Figure 6.
Dependence of solving time on the cardinality of the problem sets.
Figure 7.
(a) Percentage of adoption of the different inspection technologies; (b) percentage of installation of inspection technologies over the assembly stations.
Figure 7.
(a) Percentage of adoption of the different inspection technologies; (b) percentage of installation of inspection technologies over the assembly stations.
Figure 8.
Distribution of the suggested sampling rate over different technologies.
Figure 8.
Distribution of the suggested sampling rate over different technologies.
Figure 9.
Sensitivity Analysis related to the exclusion of machine vision technology. (a) Relative importance of input parameters. (b) Interaction effects of input parameters on objective function degradation.
Figure 9.
Sensitivity Analysis related to the exclusion of machine vision technology. (a) Relative importance of input parameters. (b) Interaction effects of input parameters on objective function degradation.
Figure 10.
Sensitivity Analysis related to the exclusion of variable sampling rate. (a) Relative importance of input parameters. (b) Interaction effects of input parameters on objective function degradation.
Figure 10.
Sensitivity Analysis related to the exclusion of variable sampling rate. (a) Relative importance of input parameters. (b) Interaction effects of input parameters on objective function degradation.
Table 1.
Literature review summary.
Table 1.
Literature review summary.
| | Modeling Structure | |
|---|
| Reference | Product
Flow | Sampling
Rate
Identification | Detection
Error
Consideration | Inspection Technology Selection | Solution
Approach |
|---|
| [33] | Multi | | ✓ | | Meta-heuristic |
| [43] | Single | ✓ | ✓ | | Meta-heuristic |
| [38] | Single | | ✓ | | MILP |
| [39] | Single | ✓ | | | MILP |
| [40] | Single | | ✓ | | MILP |
| [35] | Single | ✓ | ✓ | | Heuristic |
| [34] | Single | ✓ | ✓ | | Meta-heuristic |
| [36] | Multi | | ✓ | | Meta-heuristic |
| [37] | Single | ✓ | | | Meta-heuristic |
| [42] | Single | ✓ | ✓ | | Simulation-based
optimization |
| [41] | Single | | | | Dynamic
programming |
| This paper | Multi | ✓ | ✓ | ✓ | MILP |
Table 2.
The cardinality of the different sets adopted to generate synthetic data.
Table 2.
The cardinality of the different sets adopted to generate synthetic data.
| Sets | Cardinality |
|---|
| P | [1, 5] |
| S | [10, 20, 30, 40,5 0] |
| K | [10, 50, 100, 200] |
| T | [1, 2, 3, 4, 5] |
Table 3.
Cardinality of the different sets in the real-world case study.
Table 3.
Cardinality of the different sets in the real-world case study.
| Sets | Min Cardinality |
|---|
| P | 3 |
| S | 24 |
| H | 3 |
| K | 96 |
| T | 5 |
Table 4.
Models compared in the Ablation Analysis.
Table 4.
Models compared in the Ablation Analysis.
| Description | ID |
|---|
| Original | O |
| Maximum Control Number | MCN |
| Excludes Human Inspection | NO-HI |
| Excludes Assisted Human Inspection | NO-ASI |
| Excludes Machine Vision Inspection | NO-MVI |
Table 5.
Parameters and value range considered in the Sensitivity Analysis.
Table 5.
Parameters and value range considered in the Sensitivity Analysis.
| Name | Min Value | Max Value |
|---|
| 0.5 | 1.5 |
| 0.5 | 1.5 |
Table 6.
Results of the Ablation Analysis.
Table 6.
Results of the Ablation Analysis.
| ID | Objective Function Delta [%] | Computational Time Delta [%] |
|---|
| O vs. NO-MVI | +42.6 | −26.6 |
| O vs. NO-HAI | +1.5 | −27.1 |
| O vs. NO-HI | +0.7 | −23.8 |
| O vs. MCN | +0.01% | +8.0% |
| Disclaimer/Publisher’s Note: The statements, opinions and data contained in all publications are solely those of the individual author(s) and contributor(s) and not of MDPI and/or the editor(s). MDPI and/or the editor(s) disclaim responsibility for any injury to people or property resulting from any ideas, methods, instructions or products referred to in the content. |
© 2025 by the authors. Licensee MDPI, Basel, Switzerland. This article is an open access article distributed under the terms and conditions of the Creative Commons Attribution (CC BY) license (https://creativecommons.org/licenses/by/4.0/).


