
Experimental Study on Scour Resistance Performance Enhancement of Chongqing Red Clay


Abstract
1. Introduction
2. Test Plan
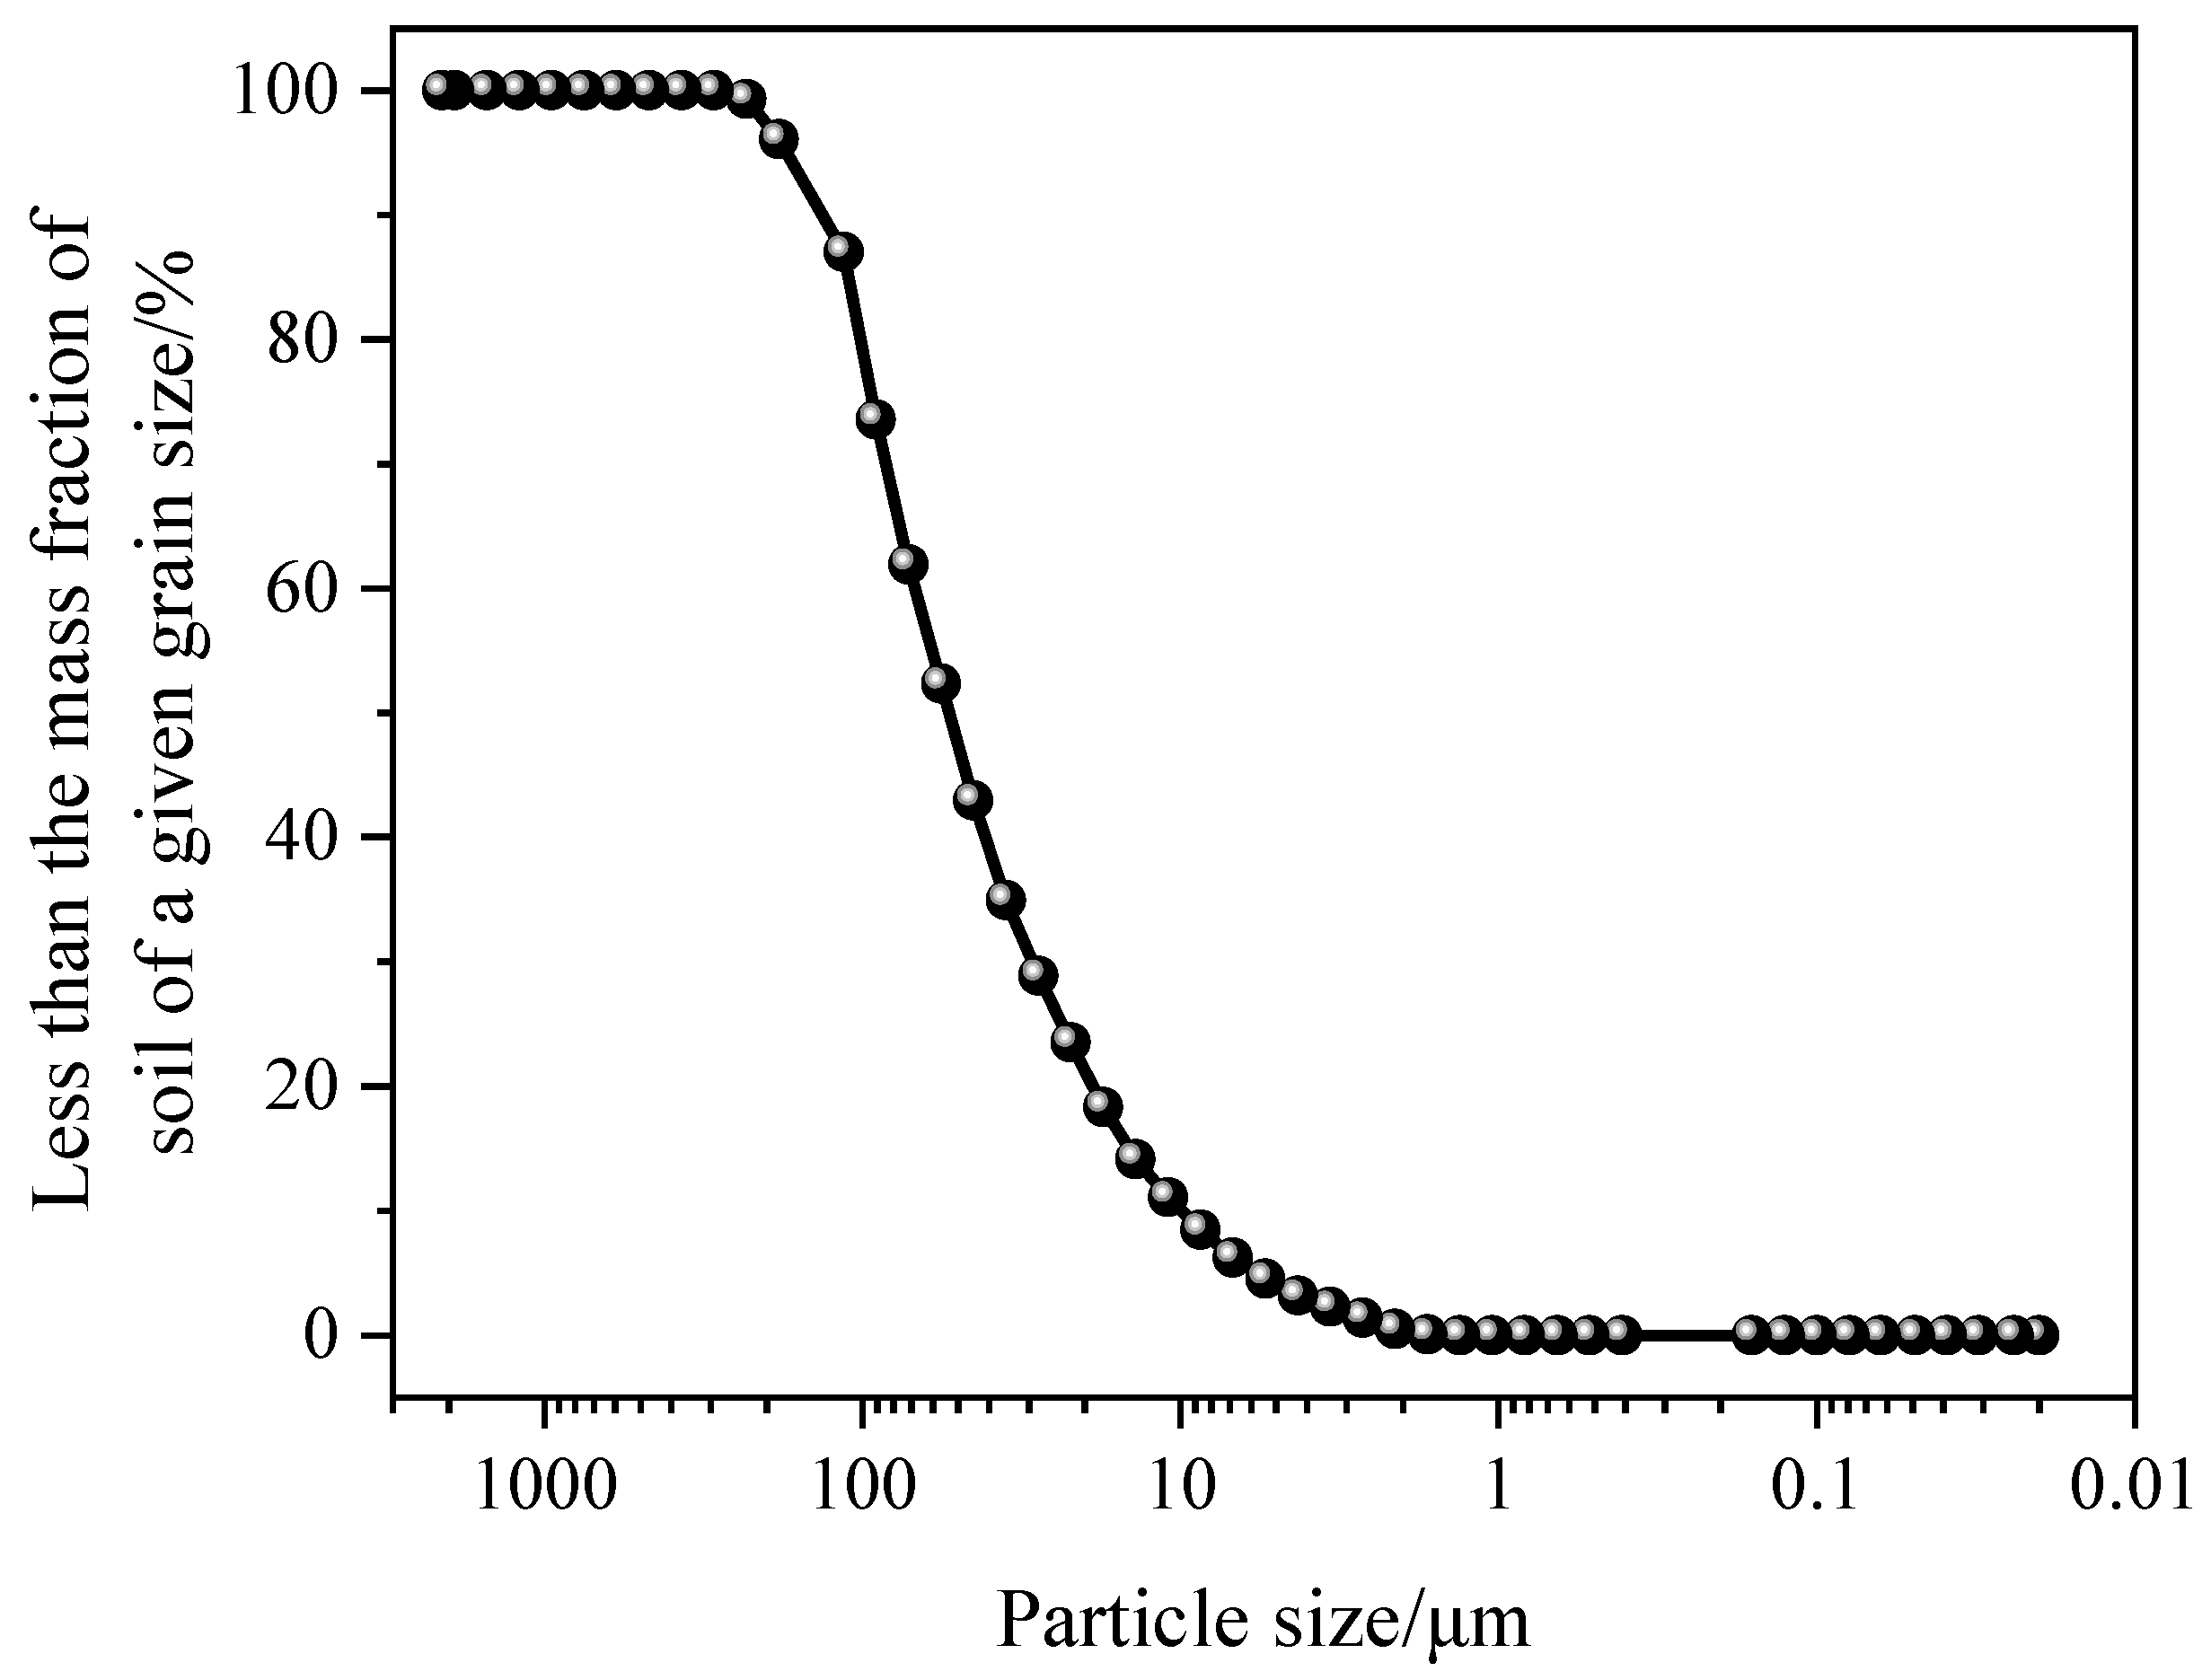
2.1. Material
2.2. Test Proportioning
2.3. Test Methods
2.3.1. Flow Tests
2.3.2. Anti-Dispersion Test
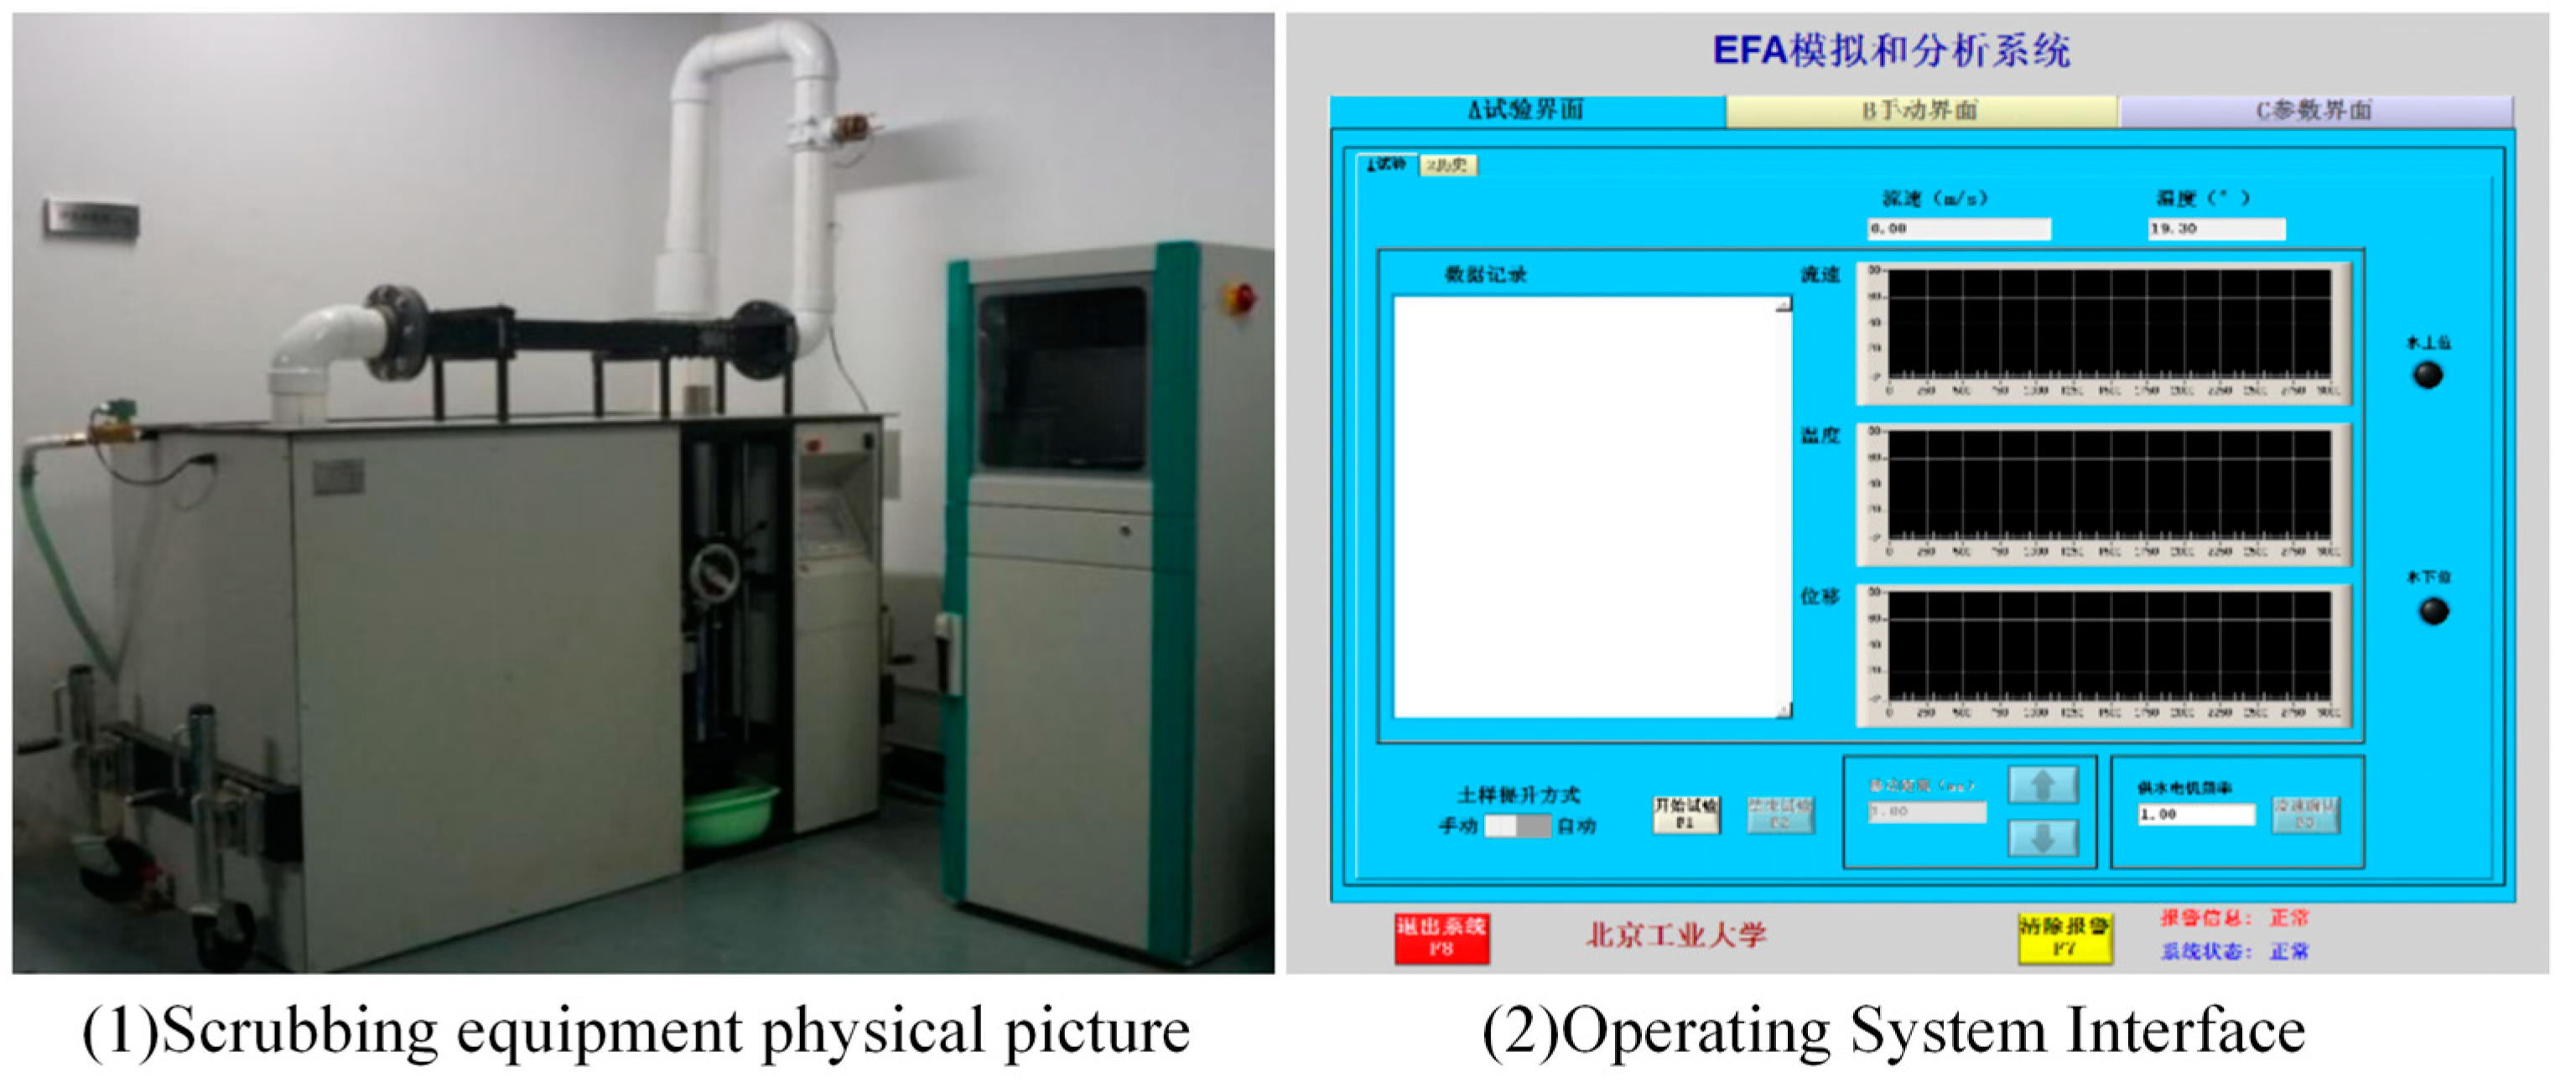
2.3.3. Scour Resistance Test
2.3.4. SEM Tests
2.4. Performance Indicators
3. Results and Discussion
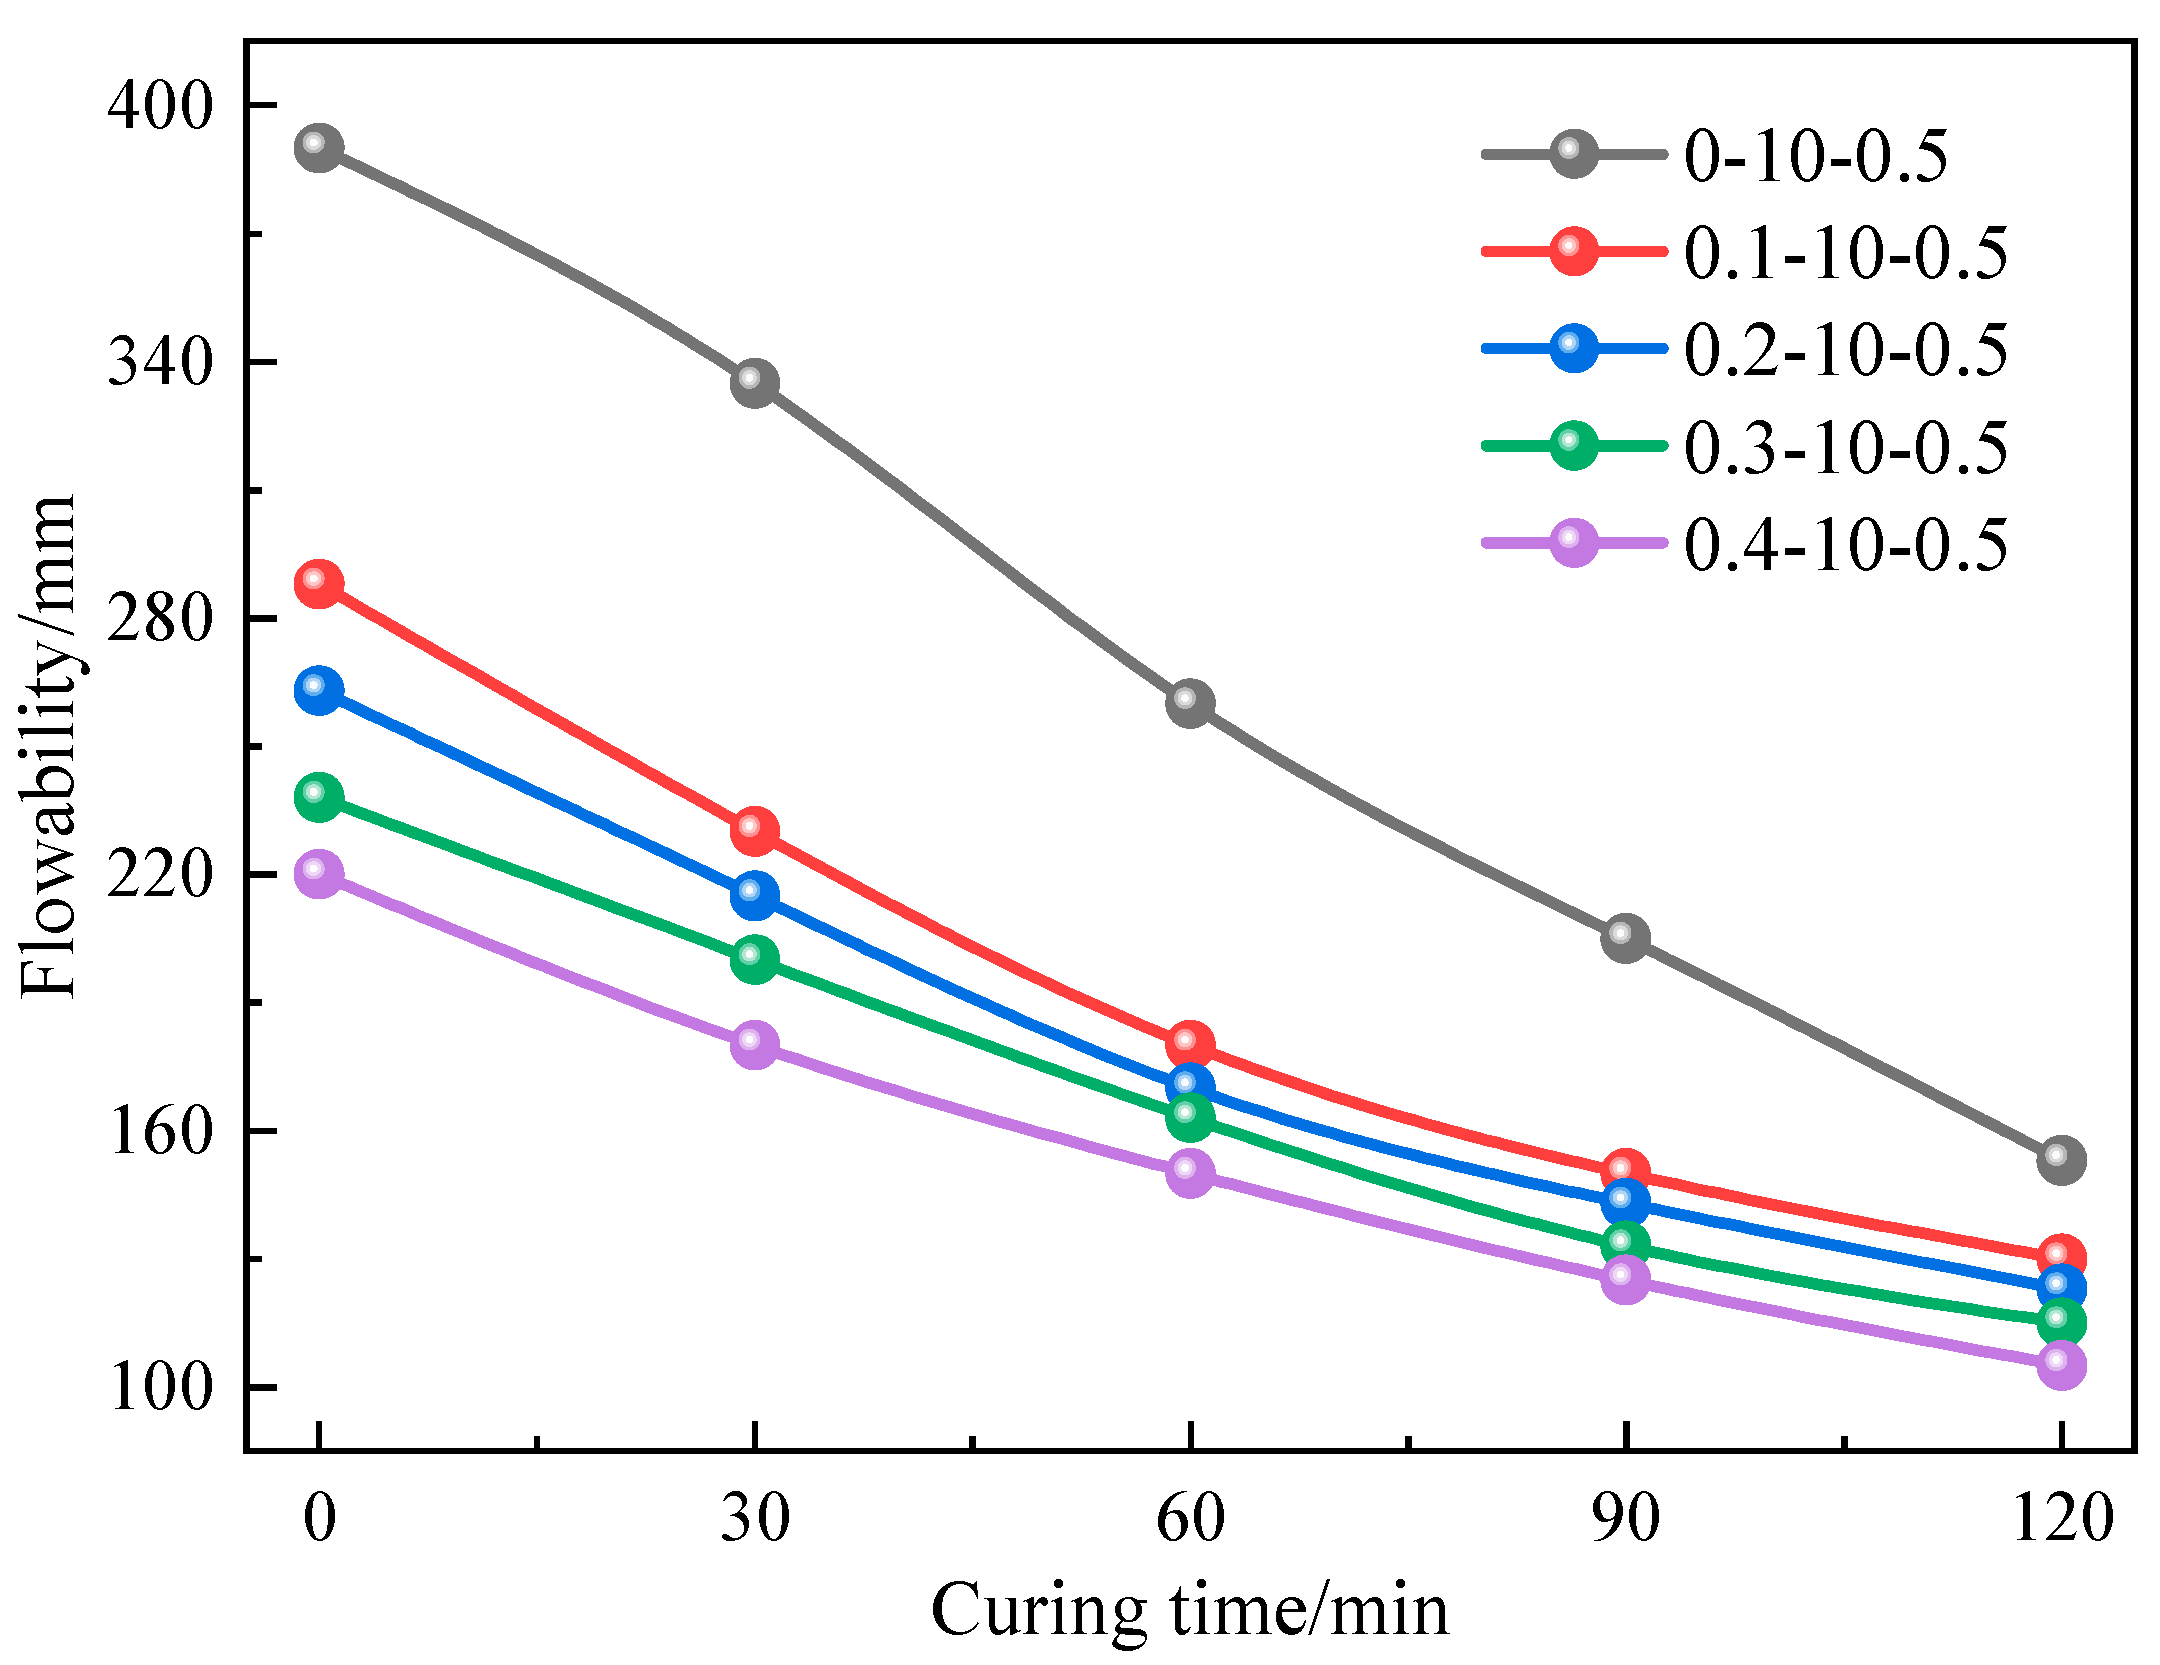
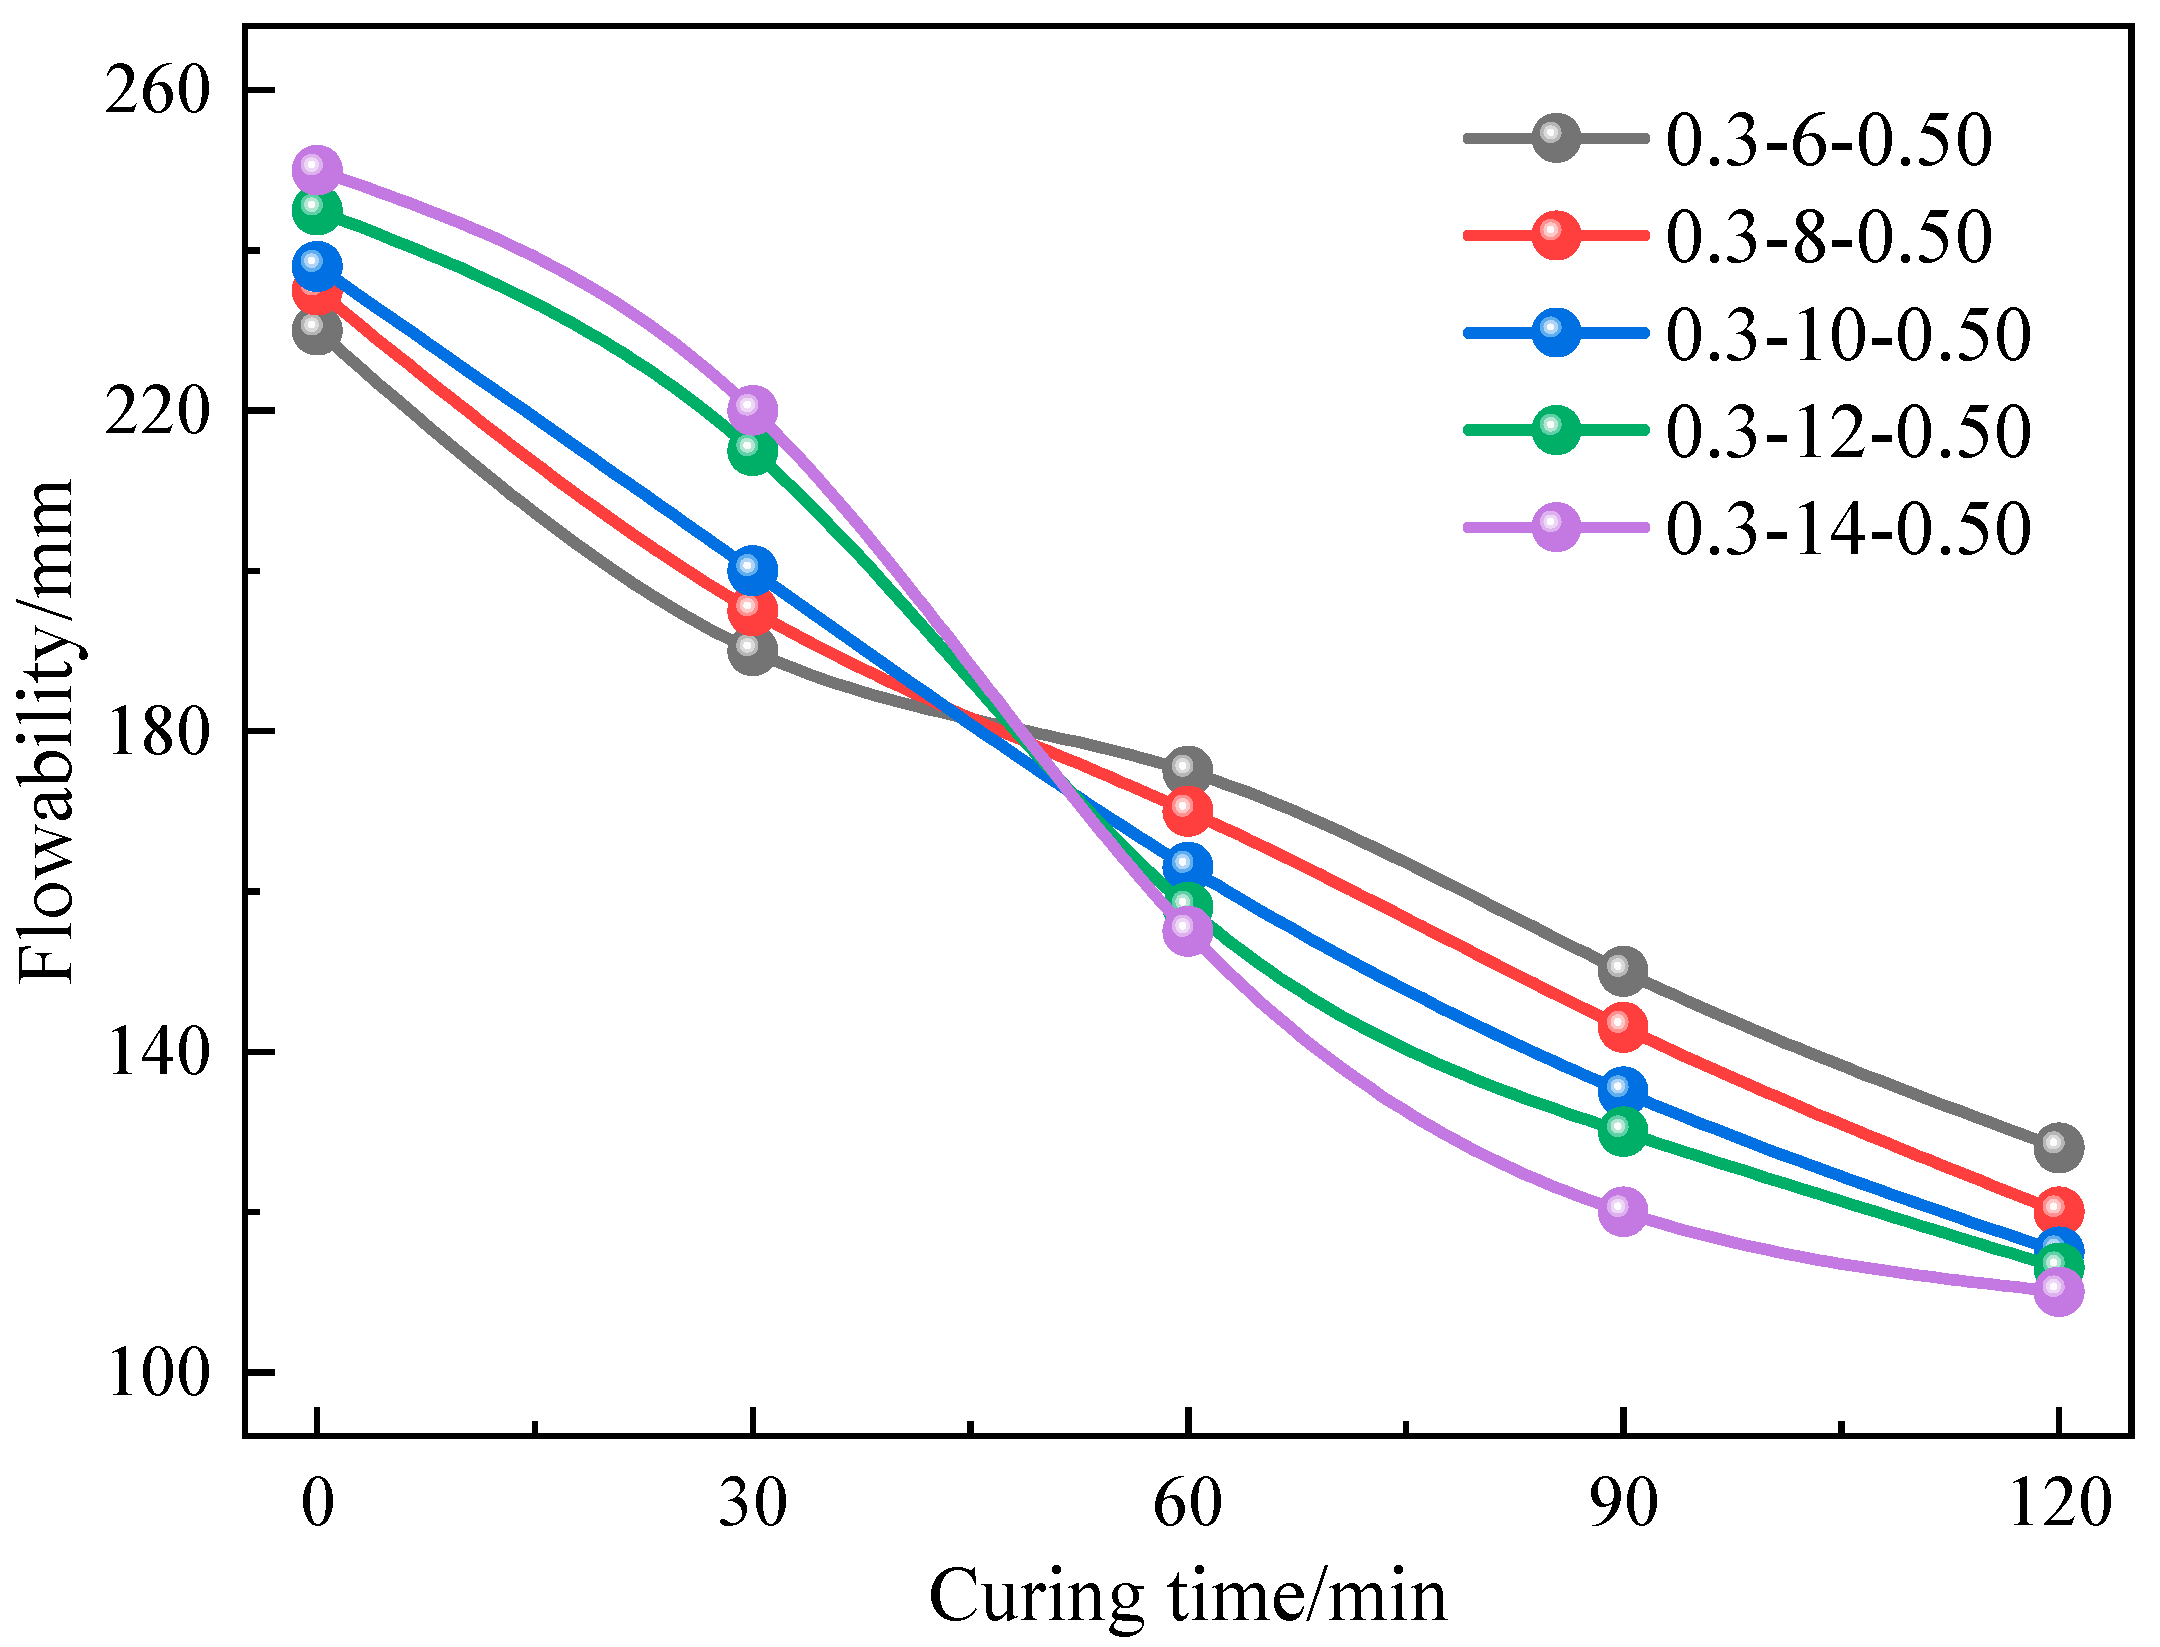
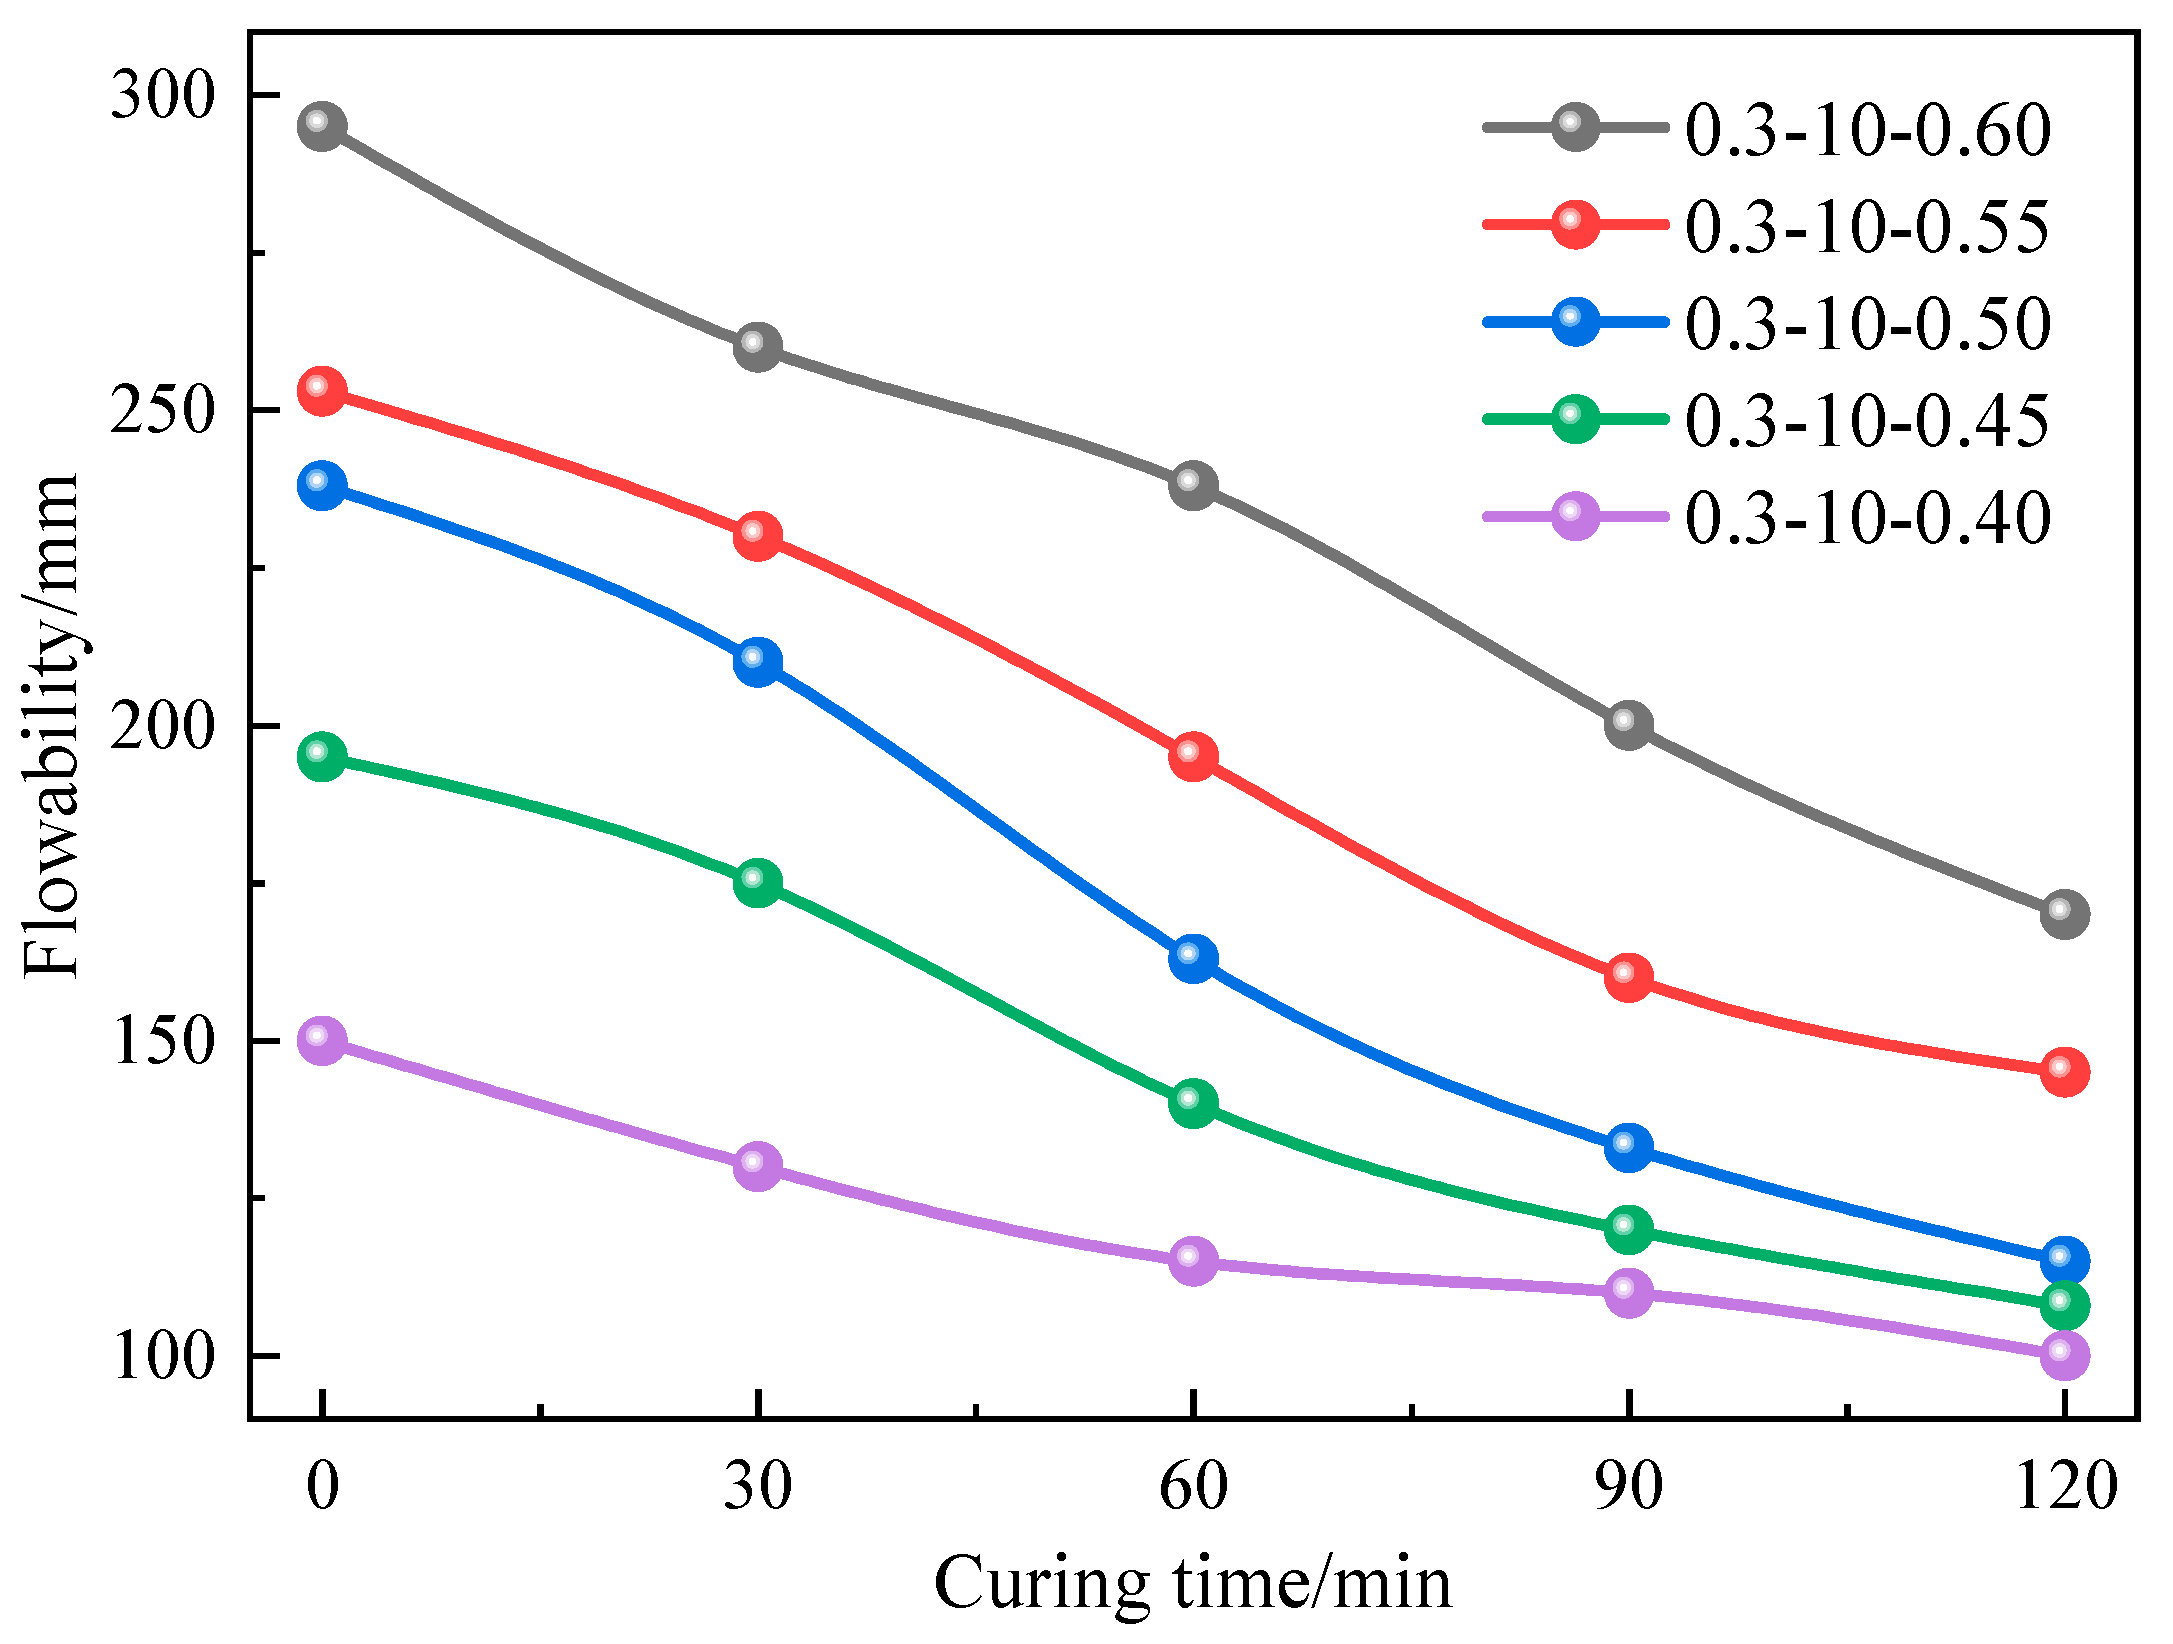
3.1. Mobility Analysis
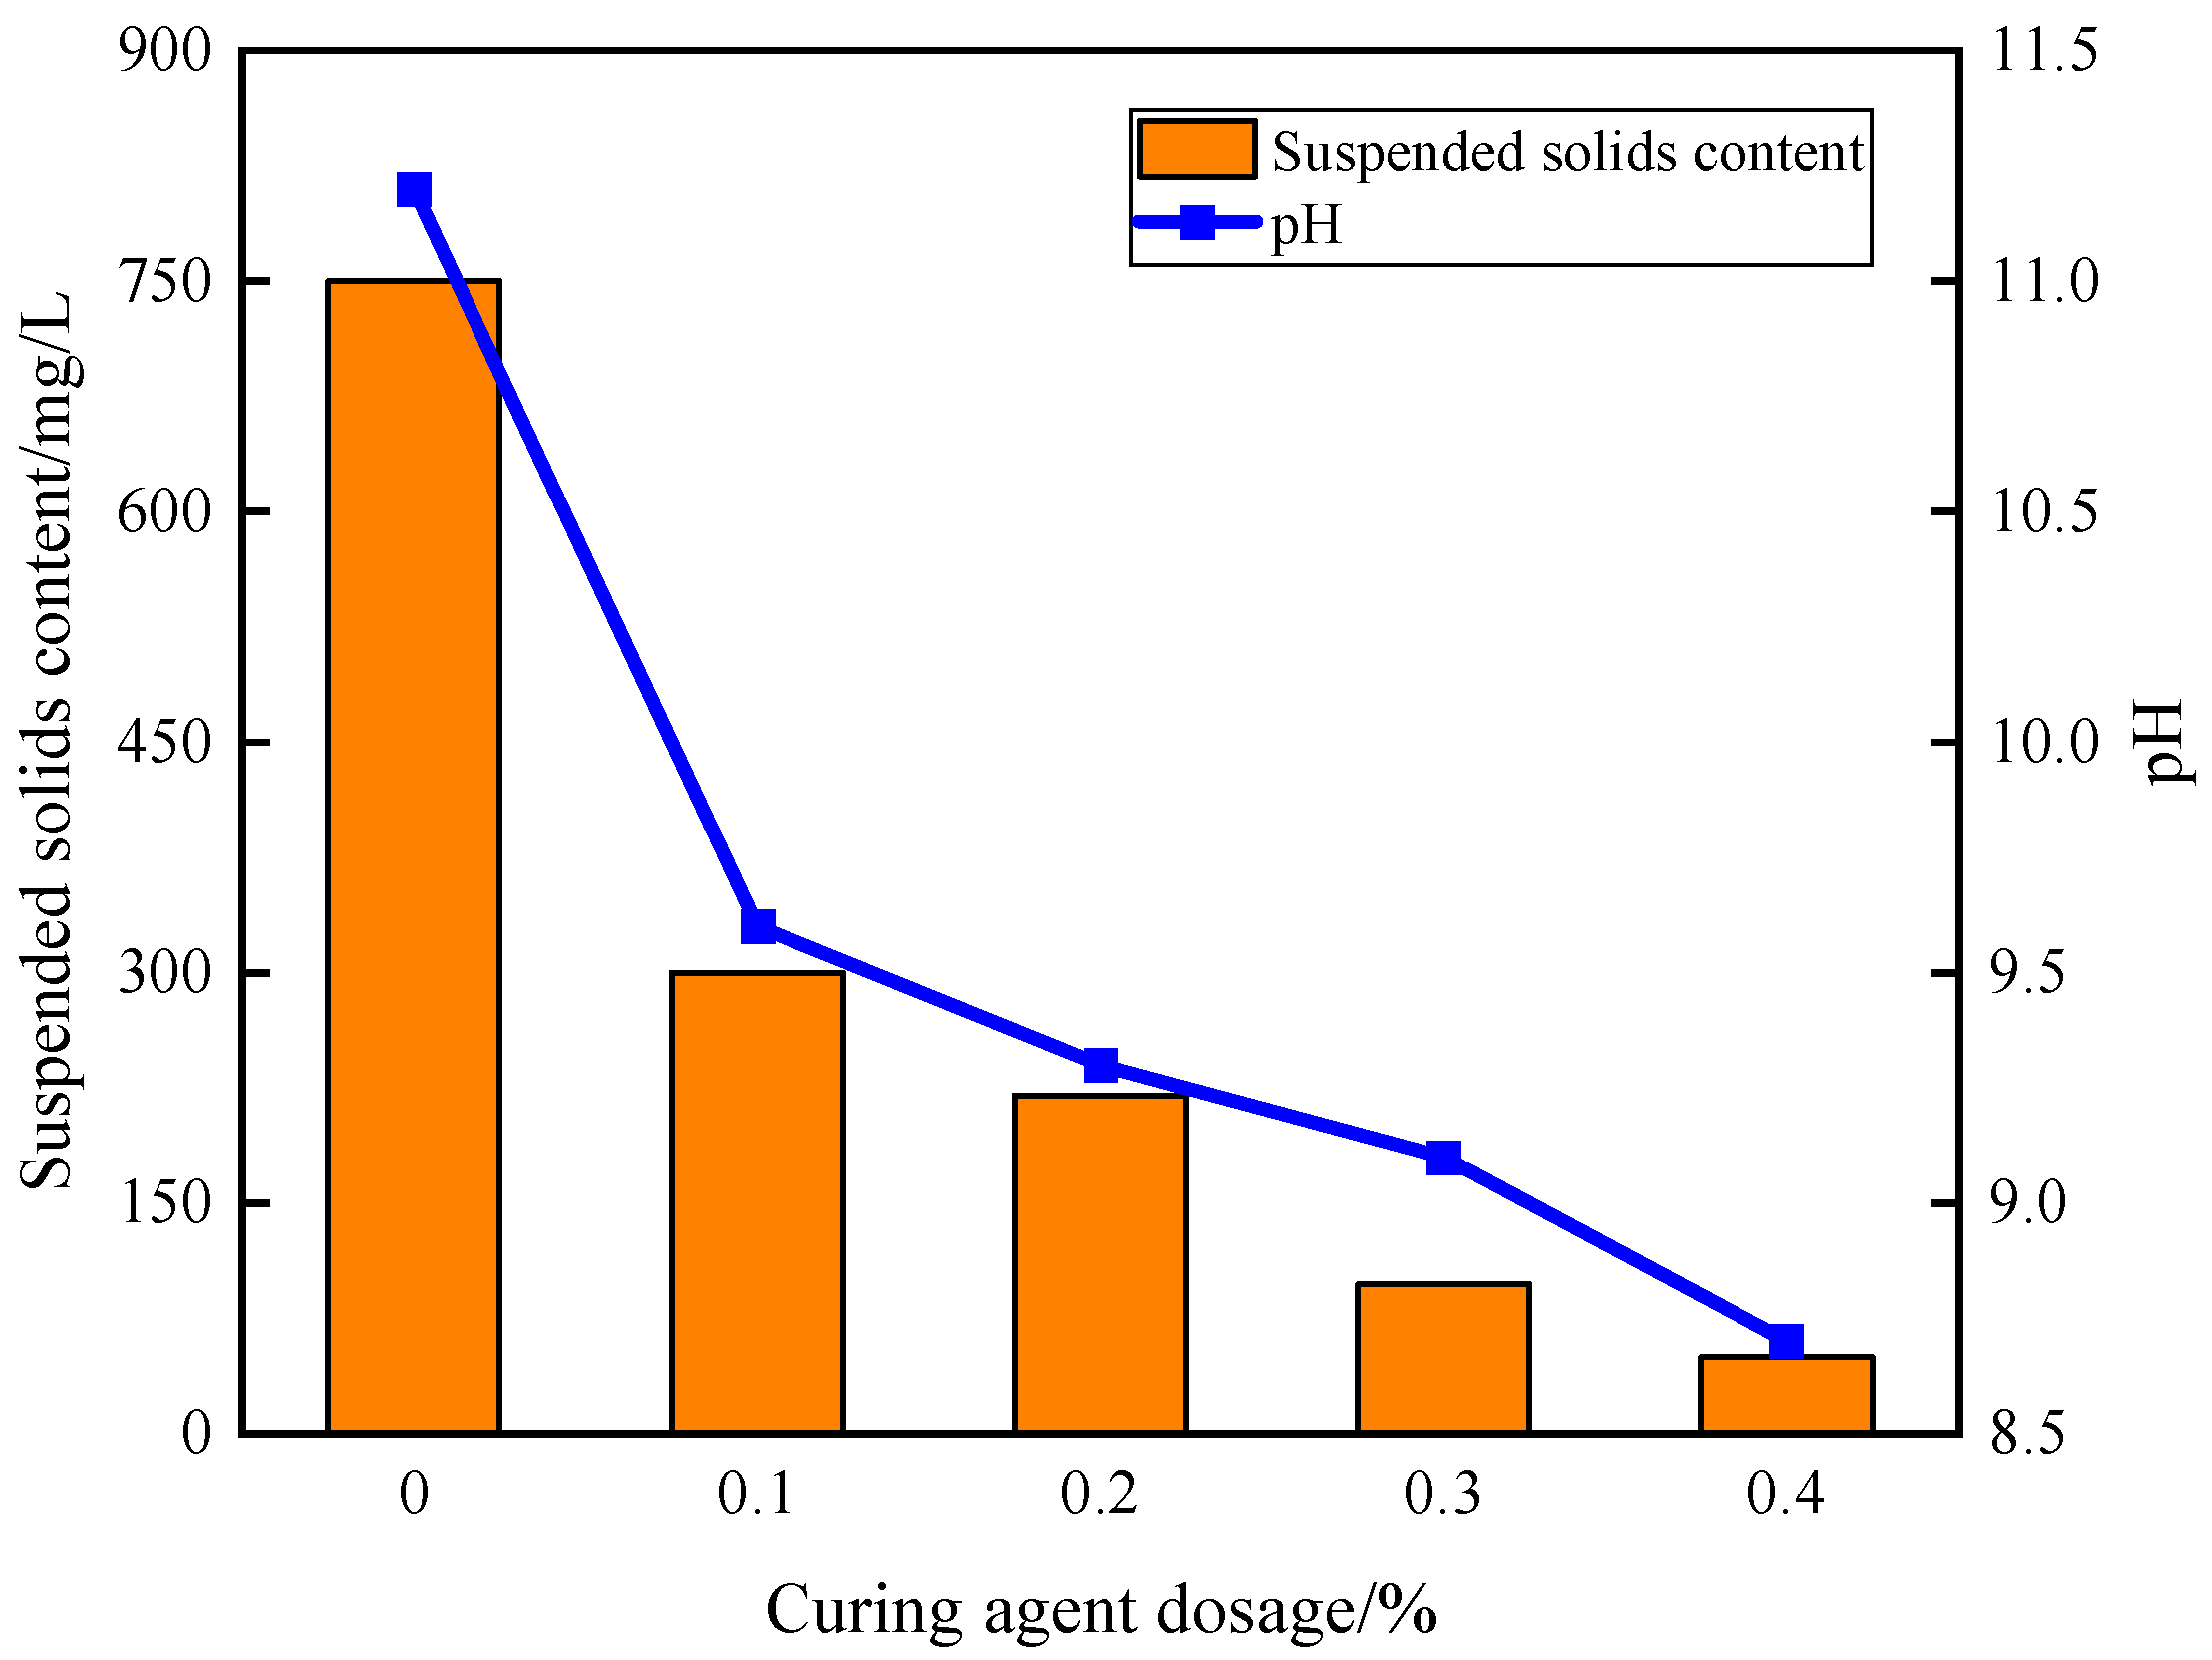
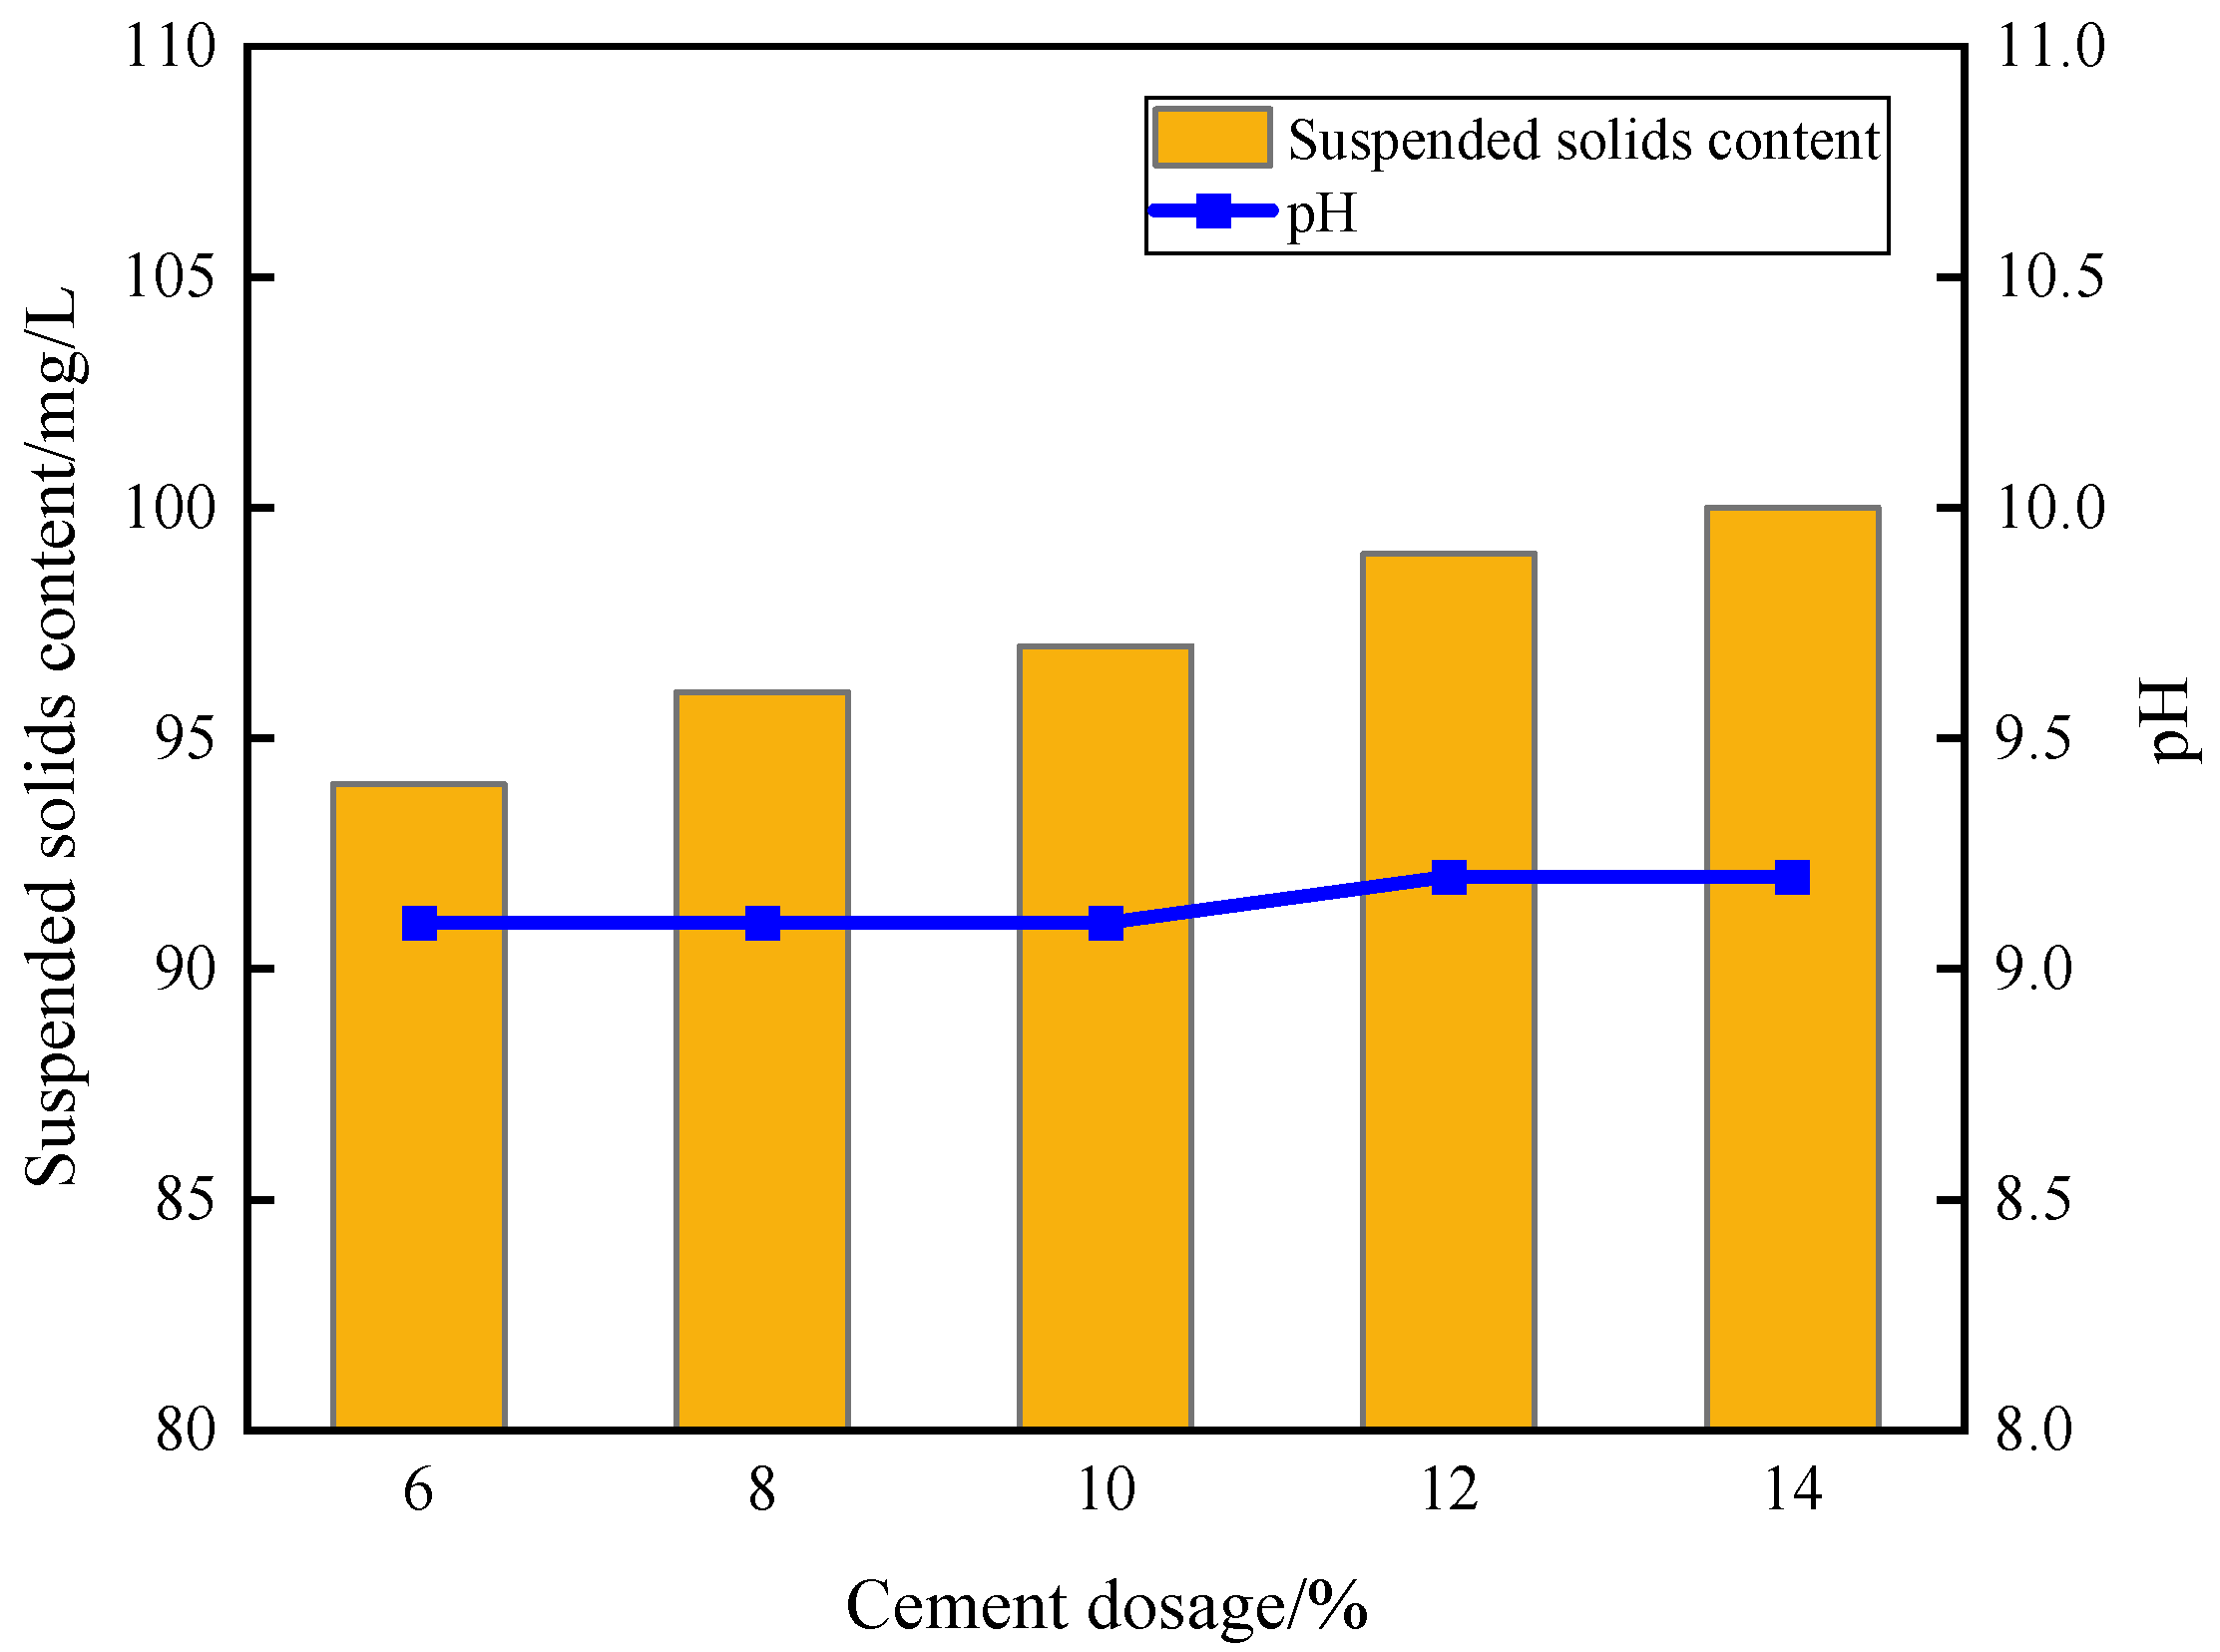
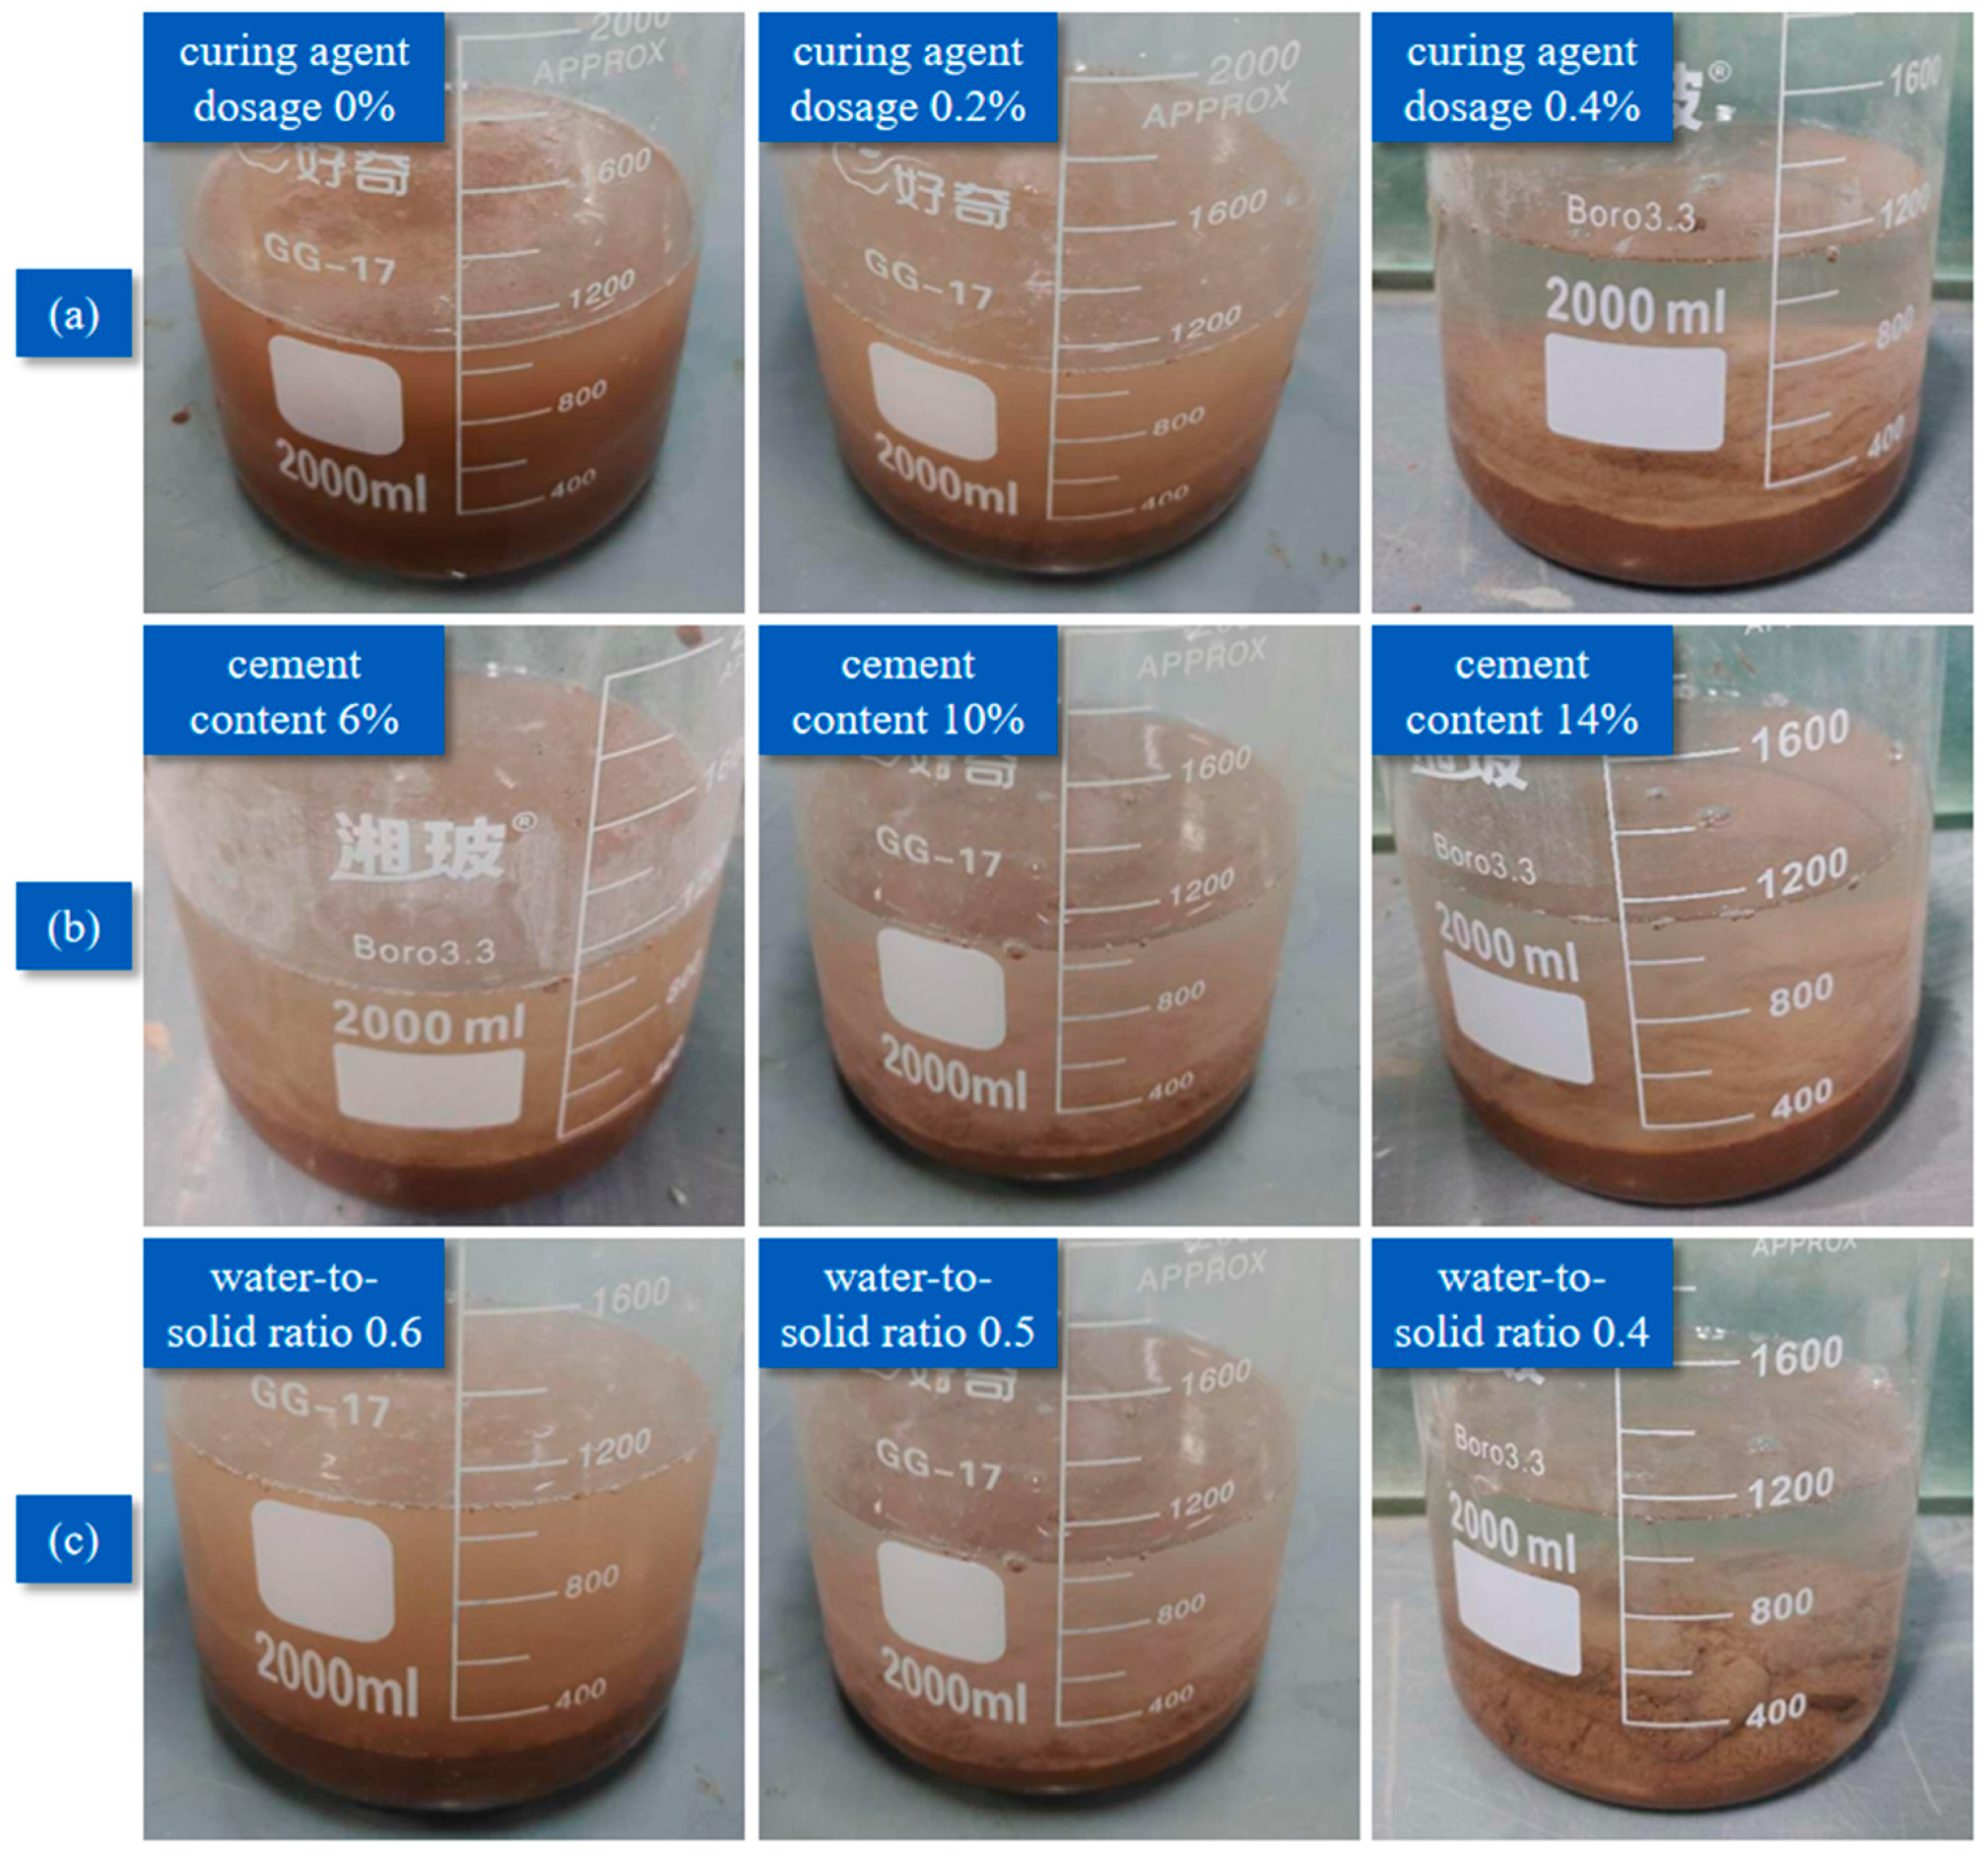
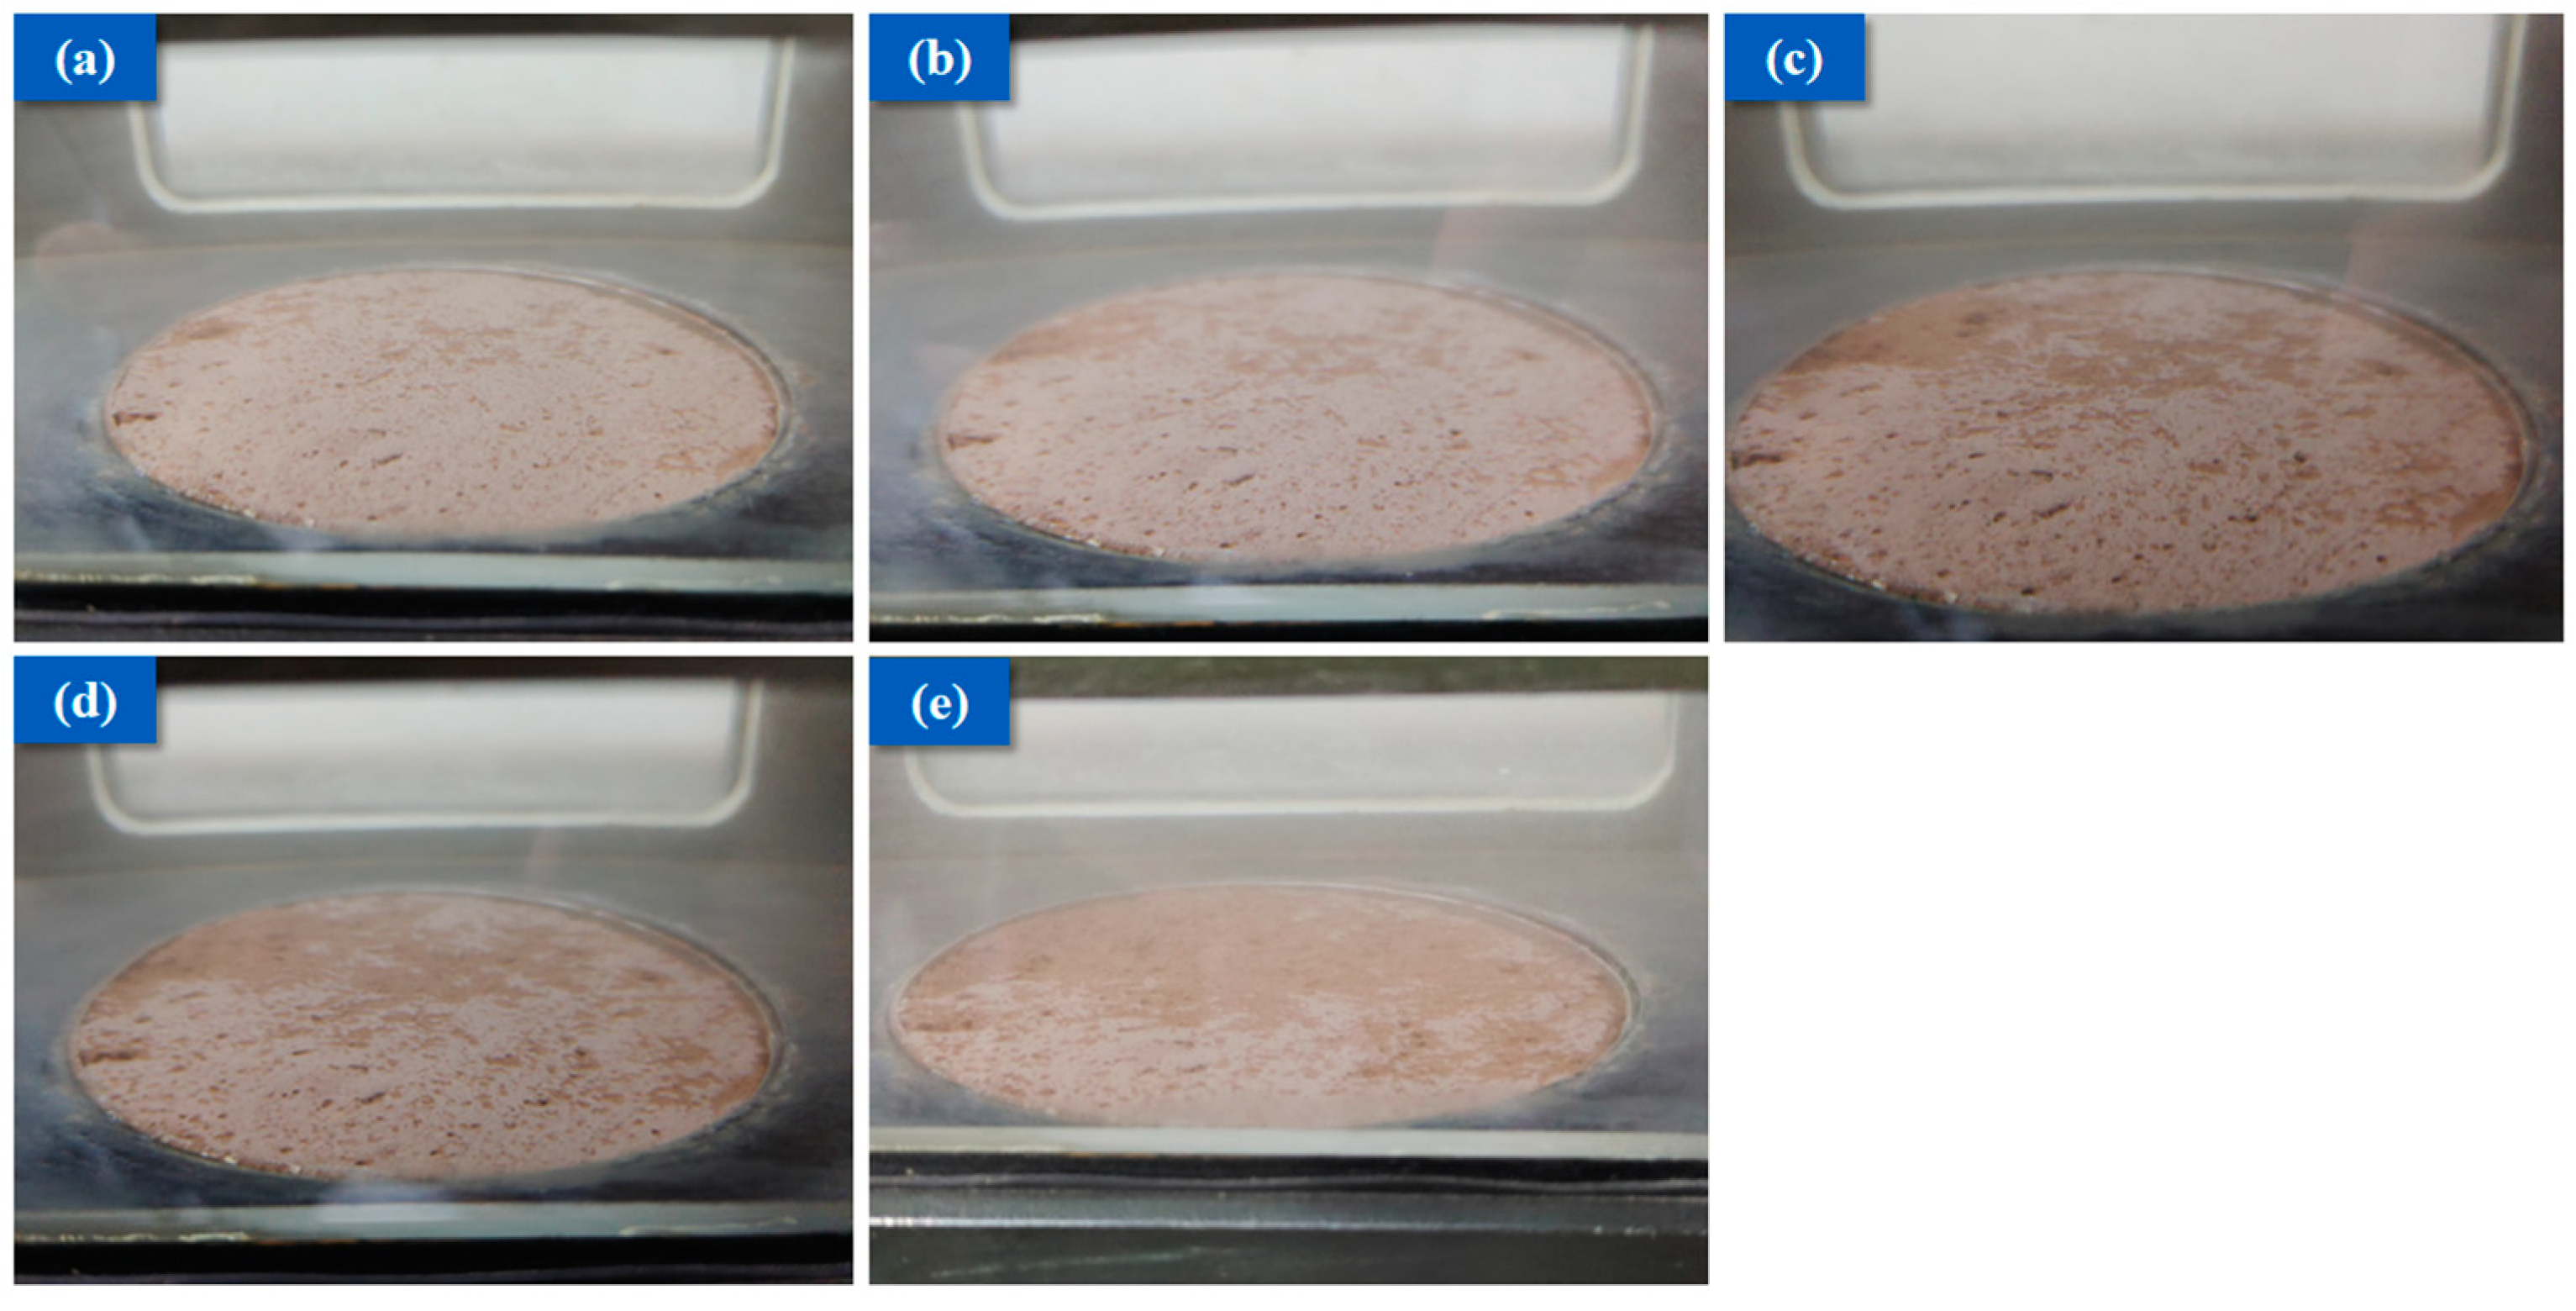
3.2. Anti-Dispersion Analysis
3.3. Relationship Model Between Fluidity and Suspended Matter Content
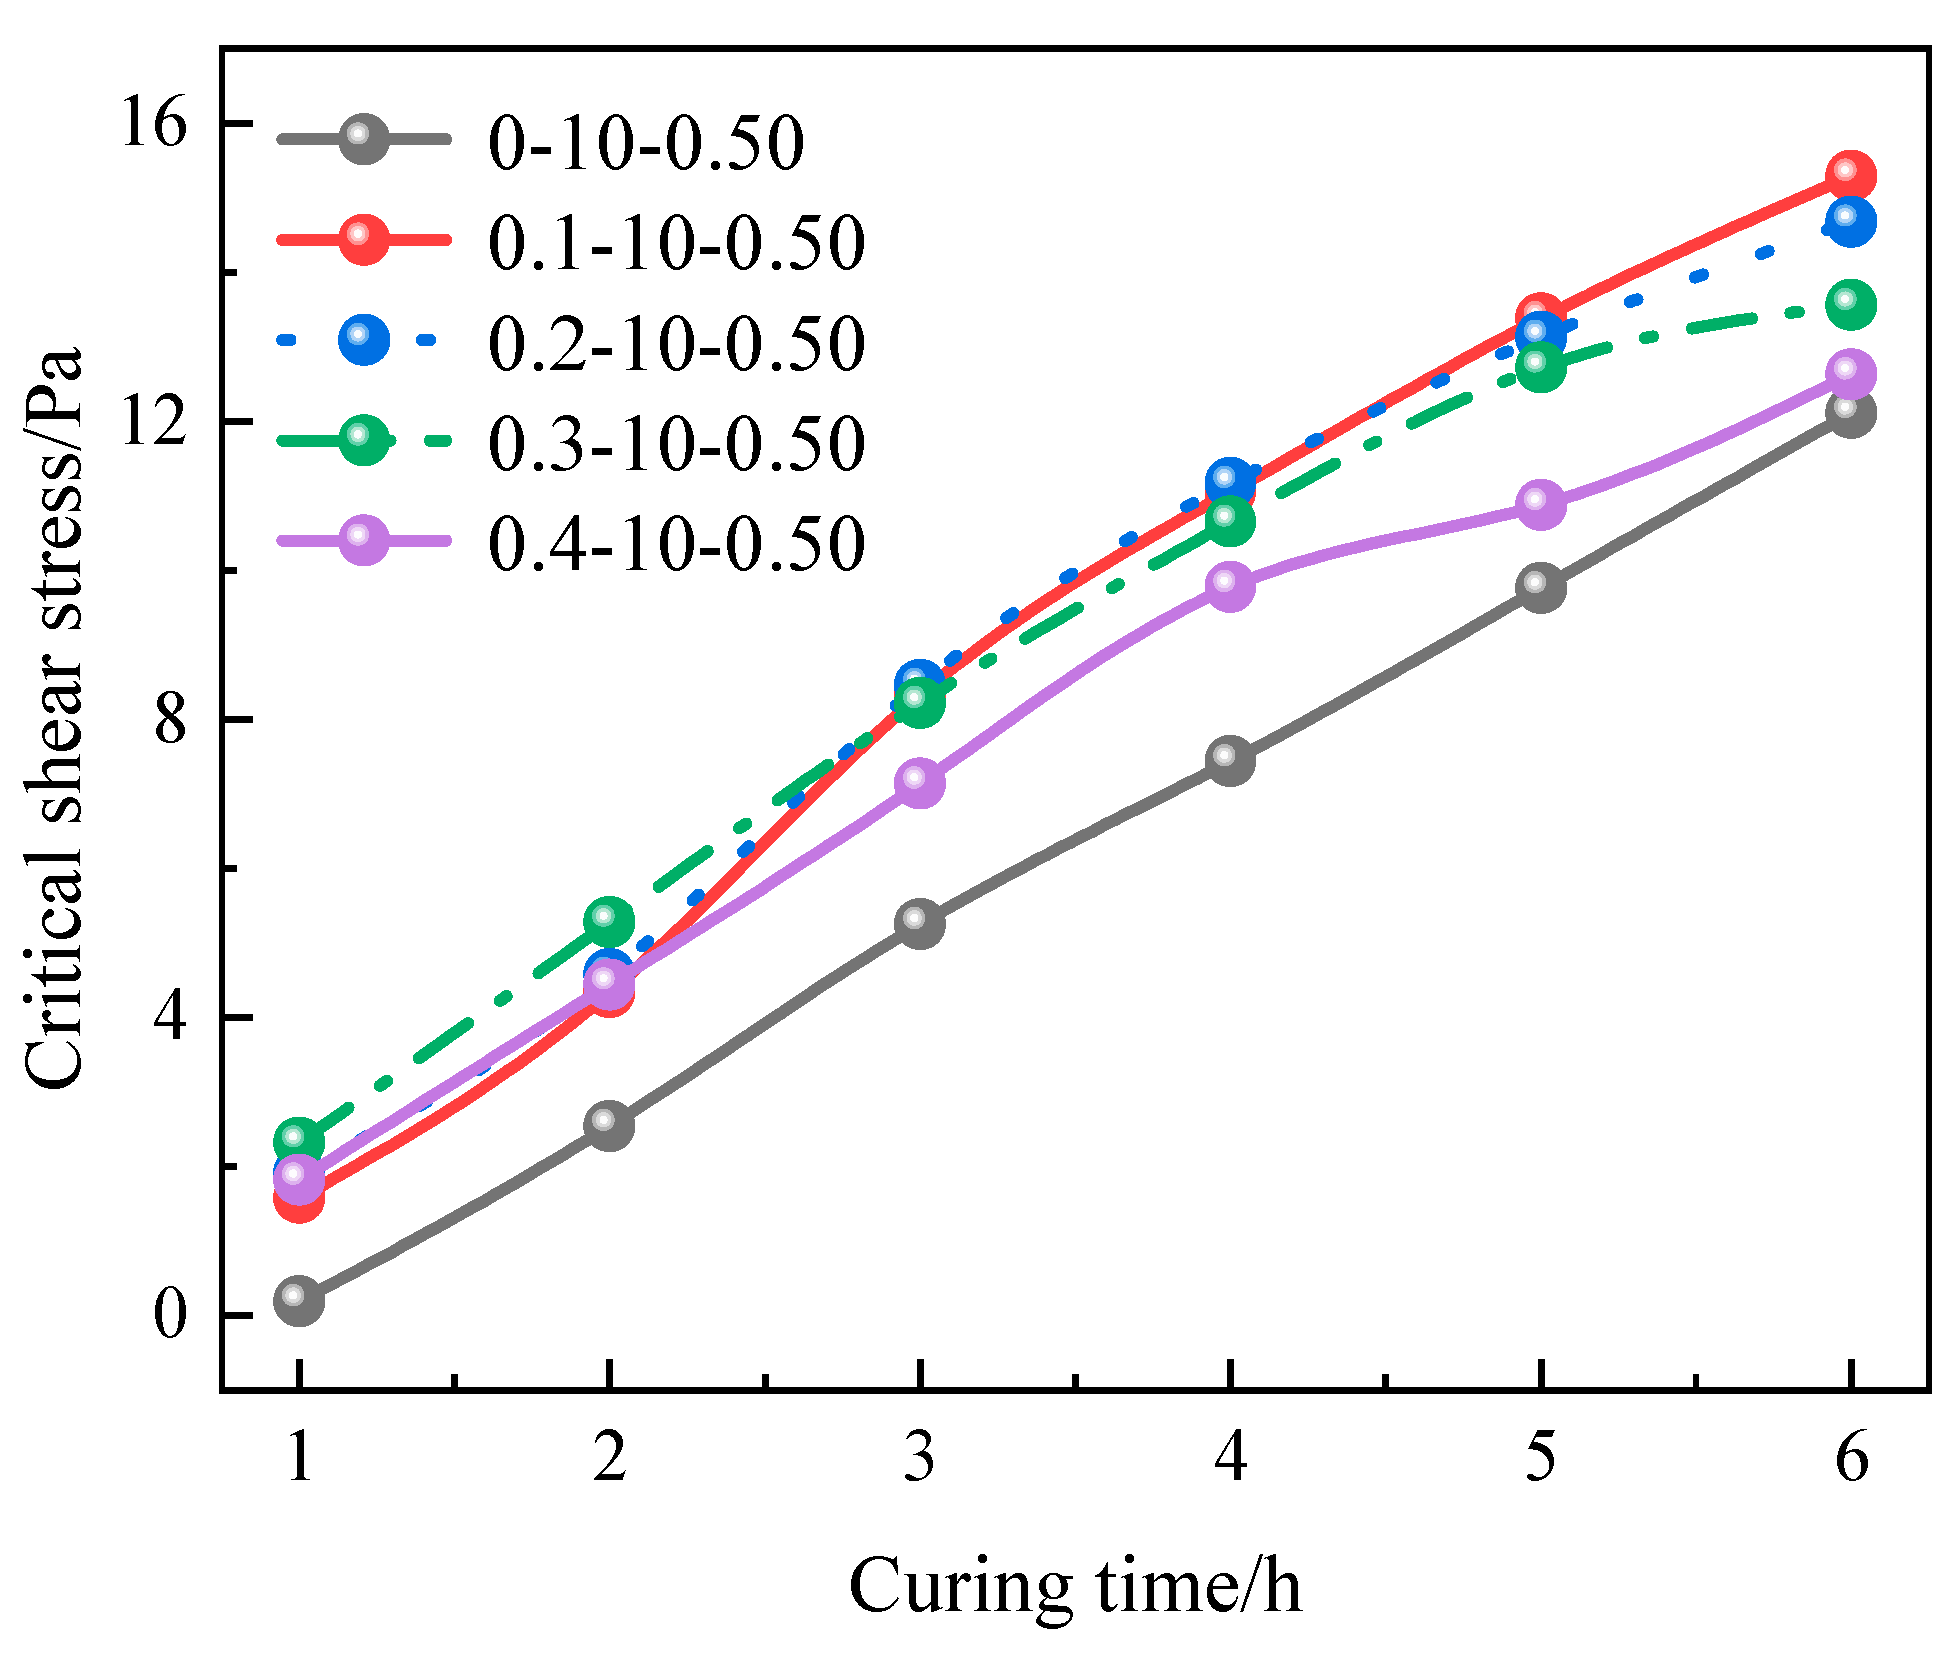
3.4. Scour Resistance Analysis
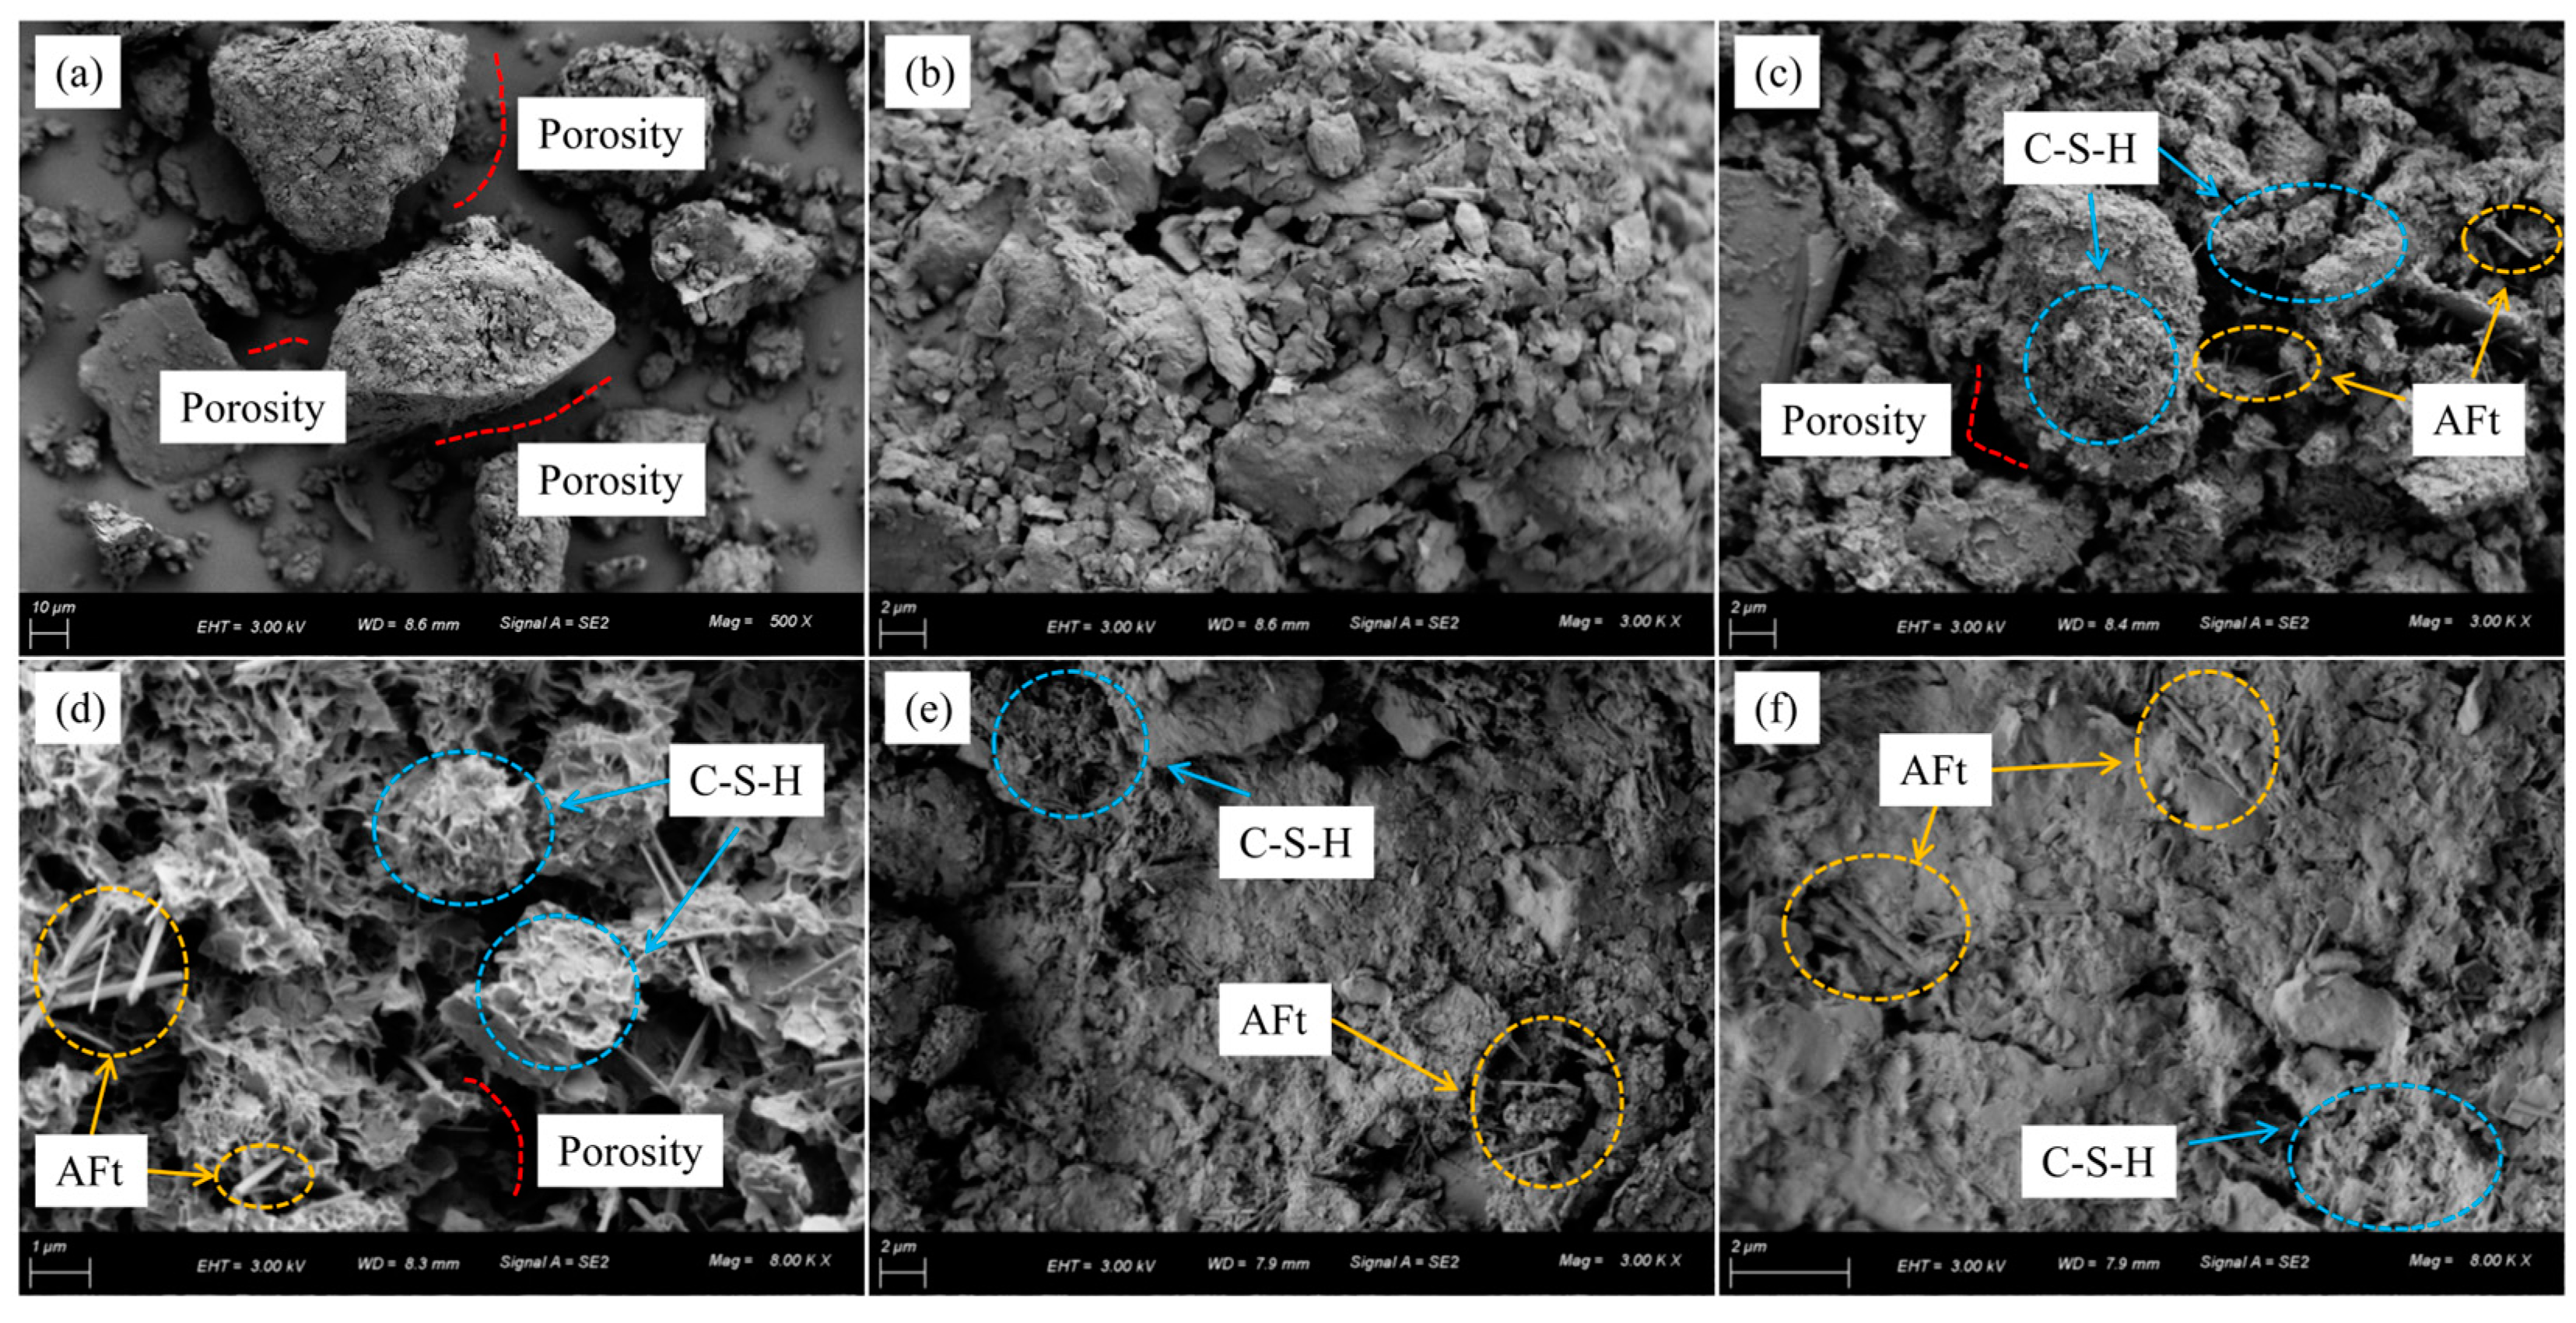
4. SEM Test Results
5. Conclusions
Author Contributions
Funding
Data Availability Statement
Conflicts of Interest
References
- Bento, A.M.; Gomes, A.; Viseu, T. Risk-based methodology for scour analysis at bridge foundations. Eng. Struct. 2020, 223, 111115. [Google Scholar] [CrossRef]
- Liu, L.; Chen, H.K.; Tang, H.M. Study on The Damage Mechanism of Bridge Pier and Foundation by Turbulent Debris Flow. Adv. Mater. Res. 2011, 228, 776–781. [Google Scholar] [CrossRef]
- Govindasamy, A.V.; Briaud, J.L.; Kim, D. Observation method for estimating future scour depth at existing bridges. J. Geotech. Geoenviron. Eng. 2013, 139, 1165–1175. [Google Scholar] [CrossRef]
- Zhu, J.; Wang, Y.; Li, Y. Scour effect on a sea-crossing bridge under combined action of service and extreme seismic loads. J. Cent. South Univ. 2022, 29, 2719–2742. [Google Scholar] [CrossRef]
- Wang, C.; Yu, X.; Liang, F. A review of bridge scour: Mechanism, estimation, monitoring and countermeasures. Nat. Hazards 2017, 87, 1881–1906. [Google Scholar] [CrossRef]
- He, H.; Li, W.; Huang, Y. Bridge scour monitoring based on active heating and temperature measurement method. Struct. Health Monit. 2024, 10, 1177–14759217241282393. [Google Scholar] [CrossRef]
- Klinga, J.V.; Alipour, A. Assessment of structural integrity of bridges under extreme scour conditions. Eng. Struct. 2015, 82, 55–71. [Google Scholar] [CrossRef]
- Kong, X.; Cai, C.S. Scour effect on bridge and vehicle responses under bridge–vehicle–wave interaction. J. Bridge Eng. 2016, 21, 04015083. [Google Scholar] [CrossRef]
- Maroni, A.; Tubaldi, E.; Val, D.V. Using Bayesian networks for the assessment of underwater scour for road and railway bridges. Struct. Health Monit. 2021, 20, 2446–2460. [Google Scholar] [CrossRef]
- Chen, J.; Qu, Y.; Sun, Z. Protection mechanisms, countermeasures, assessments and prospects of local scour for cross-sea bridge foundation: A review. Ocean. Eng. 2023, 288, 116145. [Google Scholar] [CrossRef]
- Chiew, Y.M. Scour protection at bridge piers. J. Hydraul. Eng. 1992, 118, 1260–1269. [Google Scholar] [CrossRef]
- Zarrati, A.R.; Gholami, H.; Mashahir, M.B. Application of collar to control scouring around rectangular bridge piers. J. Hydraul. Res. 2004, 42, 97–103. [Google Scholar] [CrossRef]
- Kumar, V.; Raju, K.G.R.; Vittal, N. Reduction of local scour around bridge piers using slots and collars. J. Hydraul. Eng. 1999, 125, 1302–1305. [Google Scholar] [CrossRef]
- Melville, B.W.; Hadfield, A.C. Use of sacrificial piles as pier scour countermeasures. J. Hydraul. Eng. 1999, 125, 1221–1224. [Google Scholar] [CrossRef]
- Heidarpour, M.; Afzalimehr, H.; Izadinia, E. Reduction of local scour around bridge pier groups using collars. Int. J. Sediment Res. 2010, 25, 411–422. [Google Scholar] [CrossRef]
- Izadinia, E.; Heidarpour, M. Simultaneous use of cable and collar to prevent local scouring around bridge pier. Int. J. Sediment Res. 2012, 27, 394–401. [Google Scholar] [CrossRef]
- Masjedi, A.; Bejestan, M.S.; Esfandi, A. Experimental study on local scour around single oblong pier fitted with a collar in a 180 degree flume bend. Int. J. Sediment Res. 2010, 25, 304–312. [Google Scholar] [CrossRef]
- Chuan, Y.W.; Cheng, J.H.; Han, P.S. Ring columns as pier scour countermeasures. Int. J. Sediment Res. 2011, 26, 353–363. [Google Scholar]
- Parola, A.C.; Mahavadi, S.K.; Brown, B.M. Effects of rectangular foundation geometry on local pier scour. J. Hydraul. Eng. 1996, 122, 35–40. [Google Scholar] [CrossRef]
- Lauchlan, C.S.; Melville, B.W. Riprap protection at bridge piers. J. Hydraul. Eng. 2001, 127, 412–418. [Google Scholar] [CrossRef]
- Korkut, R.; Martinez, E.J.; Morales, R. Geobag performance as scour countermeasure for bridge abutments. J. Hydraul. Eng. 2007, 133, 431–439. [Google Scholar] [CrossRef]
- Tabarestani, M.K.; Zarrati, A.R. Design of stable riprap around aligned and skewed rectangular bridge piers. J. Hydraul. Eng. 2013, 139, 911–916. [Google Scholar] [CrossRef]
- Gui, L.; Li, Y.J.; Li, Z.G. Road performance test and application of TerraZyme solidification soil. Appl. Mech. Mater. 2013, 295, 452–462. [Google Scholar] [CrossRef]
- Wang, C.; Yuan, Y.; Liang, F. Investigating the effect of grain composition on the erosion around deepwater foundations with a new simplified scour resistance test. Transp. Geotech. 2021, 28, 100527. [Google Scholar] [CrossRef]
- Ouyang, H.; Dai, G.; Gao, L. Local scour characteristics of monopile foundation and scour protection of cement-improved soil in marine environment-Laboratory and site investigation. Ocean. Eng. 2022, 255, 111443. [Google Scholar] [CrossRef]
- Wang, A.; Dong, W.; Zhan, Q. Study on long term property of soft soil solidified with industrial waste residue and regenerated fine aggregate. Materials 2023, 16, 2447. [Google Scholar] [CrossRef]
- Jianing, W.; Lei, H.; Chengyou, W. Mechanical properties and microstructure of saline soil solidified by alkali-activated steel slag. Ceram.-Silikáty 2022, 66, 339–346. [Google Scholar]
- Meng, H.; Guan, D.; Cheng, L. Effect of seawater curing on the mechanical properties of solidified high-water content marine dredged clay. Constr. Build. Mater. 2025, 463, 140111. [Google Scholar] [CrossRef]
- Wu, X.; Li, R.; Shu, J. Experimental Study on Engineering Behavior of Solidified Soil for Scour Repair and Protection. China Ocean. Eng. 2024, 38, 625–635. [Google Scholar] [CrossRef]
- Zhou, Y.; Huo, M.; Zhang, L. Strength development and solidification mechanism of soils with different properties stabilized by cement-slag-based materials. Case Stud. Constr. Mater. 2024, 21, e04034. [Google Scholar] [CrossRef]
- Zhang, Z.; Omine, K.; Flemmy, S.O. Evaluation of the improvement effect of cement-stabilized clays with different solidifying agent addition and water content. J. Mater. Cycles Waste Manag. 2022, 24, 2291–2302. [Google Scholar] [CrossRef]
- Thomas, J.J.; Jennings, H.M.; Chen, J.J. Influence of nucleation seeding on the hydration mechanisms of tricalcium silicate and cement. J. Phys. Chem. C 2009, 113, 4327–4334. [Google Scholar] [CrossRef]


| Type of Soil | Natural Moisture Content/% | Liquid Limit/% | Plastic Limit/% | Plasticity Index/% | Density/g·cm−3 |
|---|---|---|---|---|---|
| Red clay | 29.5 | 34 | 19.5 | 14.5 | 1.73 |
| Ignition Loss/% | MgO/% | SO3/% | Cl−/% | Specific Surface Area/m2·kg−1 | Initial Setting Time/min | Final Setting Time/min |
|---|---|---|---|---|---|---|
| 4.50 | 2.01 | 2.29 | 0.01 | 395 | 169 | 252 |
| Specimen Number | Dosage of Curing Agent | Cement Admixture | Water–Solid Ratio |
|---|---|---|---|
| 0-10-0.50 | 0 | 10% | 0.5 |
| 0.1-10-0.50 | 0.1% | 10% | 0.5 |
| 0.2-10-0.50 | 0.2% | 10% | 0.5 |
| 0.3-10-0.50 | 0.3% | 10% | 0.5 |
| 0.4-10-0.50 | 0.4% | 10% | 0.5 |
| 0.3-6-0.50 | 0.3% | 6% | 0.5 |
| 0.3-8-0.50 | 0.3% | 8% | 0.5 |
| 0.3-12-0.50 | 0.3% | 12% | 0.5 |
| 0.3-14-0.50 | 0.3% | 14% | 0.5 |
| 0.3-10-0.60 | 0.3% | 10% | 0.6 |
| 0.3-10-0.55 | 0.3% | 10% | 0.55 |
| 0.3-10-0.45 | 0.3% | 10% | 0.45 |
| 0.3-10-0.40 | 0.3% | 10% | 0.4 |
Disclaimer/Publisher’s Note: The statements, opinions and data contained in all publications are solely those of the individual author(s) and contributor(s) and not of MDPI and/or the editor(s). MDPI and/or the editor(s) disclaim responsibility for any injury to people or property resulting from any ideas, methods, instructions or products referred to in the content. |
© 2025 by the authors. Licensee MDPI, Basel, Switzerland. This article is an open access article distributed under the terms and conditions of the Creative Commons Attribution (CC BY) license (https://creativecommons.org/licenses/by/4.0/).
Share and Cite
Wang, Q.; Wang, D.; Qi, Y.; Wang, S. Experimental Study on Scour Resistance Performance Enhancement of Chongqing Red Clay. Appl. Sci. 2025, 15, 5234. https://doi.org/10.3390/app15105234
Wang Q, Wang D, Qi Y, Wang S. Experimental Study on Scour Resistance Performance Enhancement of Chongqing Red Clay. Applied Sciences. 2025; 15(10):5234. https://doi.org/10.3390/app15105234
Chicago/Turabian StyleWang, Qiusheng, Dalei Wang, Yunpeng Qi, and Shuaikang Wang. 2025. "Experimental Study on Scour Resistance Performance Enhancement of Chongqing Red Clay" Applied Sciences 15, no. 10: 5234. https://doi.org/10.3390/app15105234
APA StyleWang, Q., Wang, D., Qi, Y., & Wang, S. (2025). Experimental Study on Scour Resistance Performance Enhancement of Chongqing Red Clay. Applied Sciences, 15(10), 5234. https://doi.org/10.3390/app15105234