Article

Analysis of Seismic Response Characteristics of Fractured Carbonate Reservoirs Based on Physical Model (Tarim Basin)

1
State Key Laboratory of Petroleum Resources and Prospecting, China University of Petroleum (Beijing), Beijing 102249, China
2
CNPC Key Laboratory of Geophysical Exploration, China University of Petroleum (Beijing), Beijing 102249, China
*
Author to whom correspondence should be addressed.
Appl. Sci. 2024, 14(9), 3775; https://doi.org/10.3390/app14093775
Submission received: 17 March 2024 / Revised: 10 April 2024 / Accepted: 10 April 2024 / Published: 28 April 2024
(This article belongs to the Special Issue State-of-the-Art Earth Sciences and Geography in China)

Abstract

:
Anomalous bright spots, called the string of bead-like response, are typical seismic migration profile features in carbonate fractured reservoirs in the Tarim Basin, and they are indicators of high-quality oil and gas reservoirs. Correctly recognizing the correspondence between fractures and the SBLR can contribute to the efficient drilling of target carbonate fractured reservoirs. Physical models can describe fractured reservoirs more directly and efficiently than real situations and have obvious advantages in accurately and quantitatively designing parameters such as dipping angles and the number of layers of fractured reservoirs. Under such a background, according to the real tectonic characteristics of the Tarim Basin, among the main hydrocarbon reservoirs, fractured reservoirs with various parameters were designed and a physical model was constructed according to the real stratigraphic parameters. After seismic data acquisition and processing, the response characteristics of the string of bead-like response were extracted and summarized from seismic migration profiles for all fractured reservoirs, which provided targeted analyses and discussions on the fracture dipping angle, number of fracture layers, overlying stratigraphic influences, and planar attributes of the fractured reservoirs. In general, the larger the fracture dip, the more difficult it is to identify, while the slope of reflection strength and maximum absolute amplitude attributes can be important markers for fractured reservoir identification. The physical modeling study of fractured reservoirs in this paper can provide a basis for the analysis and prediction of carbonate fractured reservoirs in the Tarim Basin.

1. Introduction

The fracture reservoir is an important type of carbonate reservoir in the Tarim Basin [1]. Due to the complexity of carbonate fracture reservoirs, the large variation in morphology and parameters, and the influence of tectonic factors, difficulties are encountered in clarifying the seismic response characteristics, which creates ambiguity in the seismic prediction of reservoirs. On seismic migration profiles, fractured reservoirs exhibit anomalous bright spots and short-axis, low-frequency strong reflections, which are common features of the Ordovician carbonate formations in the Tarim Basin [2,3,4]. These bright spots are finite in height and consist of one to three peaks and valleys that visually seem like a string of beads. Therefore, they are called the string of bead-like response (SBLR) in seismic explorations [5]. Fracture reservoirs within the Tarim Basin include tectonic fracture-type reservoirs and cave-top collapse fracture development zones, which are distributed in the form of beaches and belts, and dissolution joints formed by karst action, which are in the form of near-vertical or high angles. Fractured reservoirs are widely distributed in carbonate formations and often exhibit non-standard beaded pie, strip, or cluttered reflection features on the seismic migration profiles [6,7,8,9]. Local fracture distribution exhibits strong transverse or longitudinal inhomogeneity [10,11]. Fracture and karst suture systems are the main pore spaces in reservoirs [12]. In practical seismic exploration, the attributes of amplitude and frequency are used with better results for carbonatite seam-hole reservoirs [13,14,15,16].
The essence of the SBLR is the convergence of seismic diffraction from finite-scale fractured reservoirs during the migration process. It is generally considered to be the result of reflection and multi-wave interference between fracture edges, including the top, bottom, and sides of the fracture. The large impedance difference between the fractured reservoir and its surroundings and the limited size of the fractured zone are the two most important factors contributing to the SBLR. Fractures generally consist of soft and porous fills and fluids surrounded by dense carbonate rocks. Low-dipping-angle fractured reservoirs are beach bodies with limited thicknesses, even comparable to the wavelength of seismic waves. Therefore, the bright spots generates on the seismic profile are limited in the vertical direction. Wave propagation within a fracture should be described by the diffraction theory rather than the ray theory. A fracture can be considered as a combination of numerous thin layers, and the SBLR is the stack of all the thin layers of diffraction waves. Established numerical simulations and real seismic data have shown that the seismic reflected characteristics such as the amplitude and frequency of the SBLR are affected by the tectonic morphology, internal structural parameters, surrounding geology, and total volume [17,18,19,20,21,22,23,24].
The SBLR, as an indicator of high-quality reservoirs, has become the main drilling target for current exploration and production in the Tarim Basin [25]. In localized exploration, targeting the SBLR has a success rate of over 80% in hydrocarbon exploration [26]. The widespread development of fractures in the Tarim Basin has an important and positive impact on oil and gas production [27]. Correctly recognizing the correspondence between the SBLR and fractures will contribute to the efficient drilling of target fractured reservoirs and is a significant issue which needs to be addressed urgently in the exploration of oil and gas reservoirs in the Tarim Basin.
Seismic physical simulation is a good method to investigate the characteristics of the SBLR [28]. In the real strata, the seismic profile characteristics of fractured reservoirs are affected by numerous factors, while the structure and parameters are not well defined, which is not conducive to targeted research with seismic profile data [29]. Compared to numerical simulations, physical simulations provide a more direct and consistent method of quantitatively recording data with real stratigraphic information and contain fewer assumptions and limitations [30]. Since the development of the first modern seismic physical modeling system by French [31], seismic physical modeling has been widely applied to investigate wave propagation in complex media in exploration geophysics [32,33,34,35,36,37]. To investigate the SBLR of fractured reservoirs, several seismic physical simulations have been carried out [38,39,40].
Established studies have not carried out targeted research on the SBLR of carbonate fractured reservoirs in the Tarim Basin based on physical models by synthesizing real regional geology. By comprehensively considering the real geology and petrophysical parameters of the Tarim Basin, a seismic physical model that is more compatible with the real observing system was designed to further investigate the fracture reservoir response. In the physical model, fracture reservoirs that include a variety of different dip angles, different fracture layers, and different overlying strata were designed and fabricated. After acquiring seismic data for the physical model, the SBLRs of the fractured reservoirs involved in the carbonate of the Tarim Basin were investigated, and the correspondence between the SBLRs and their corresponding fractured reservoirs was clarified. Finally, the influence of factors such as the fracture dip angle, number of fracture layers, and overlying strata on the SBLR was analyzed, and the fracture reservoirs were further analyzed based on planar attributes.

2. Physical Model Design

The seismic physical modeling experiment was designed for fractured reservoirs with different dips, fracture layers, and overlying strata in the eastern Tarim carbonates to explore the seismic response characteristics of different parameters. A brief description of the design, fabrication, and seismic data acquisition process of the physical model is given as follows:

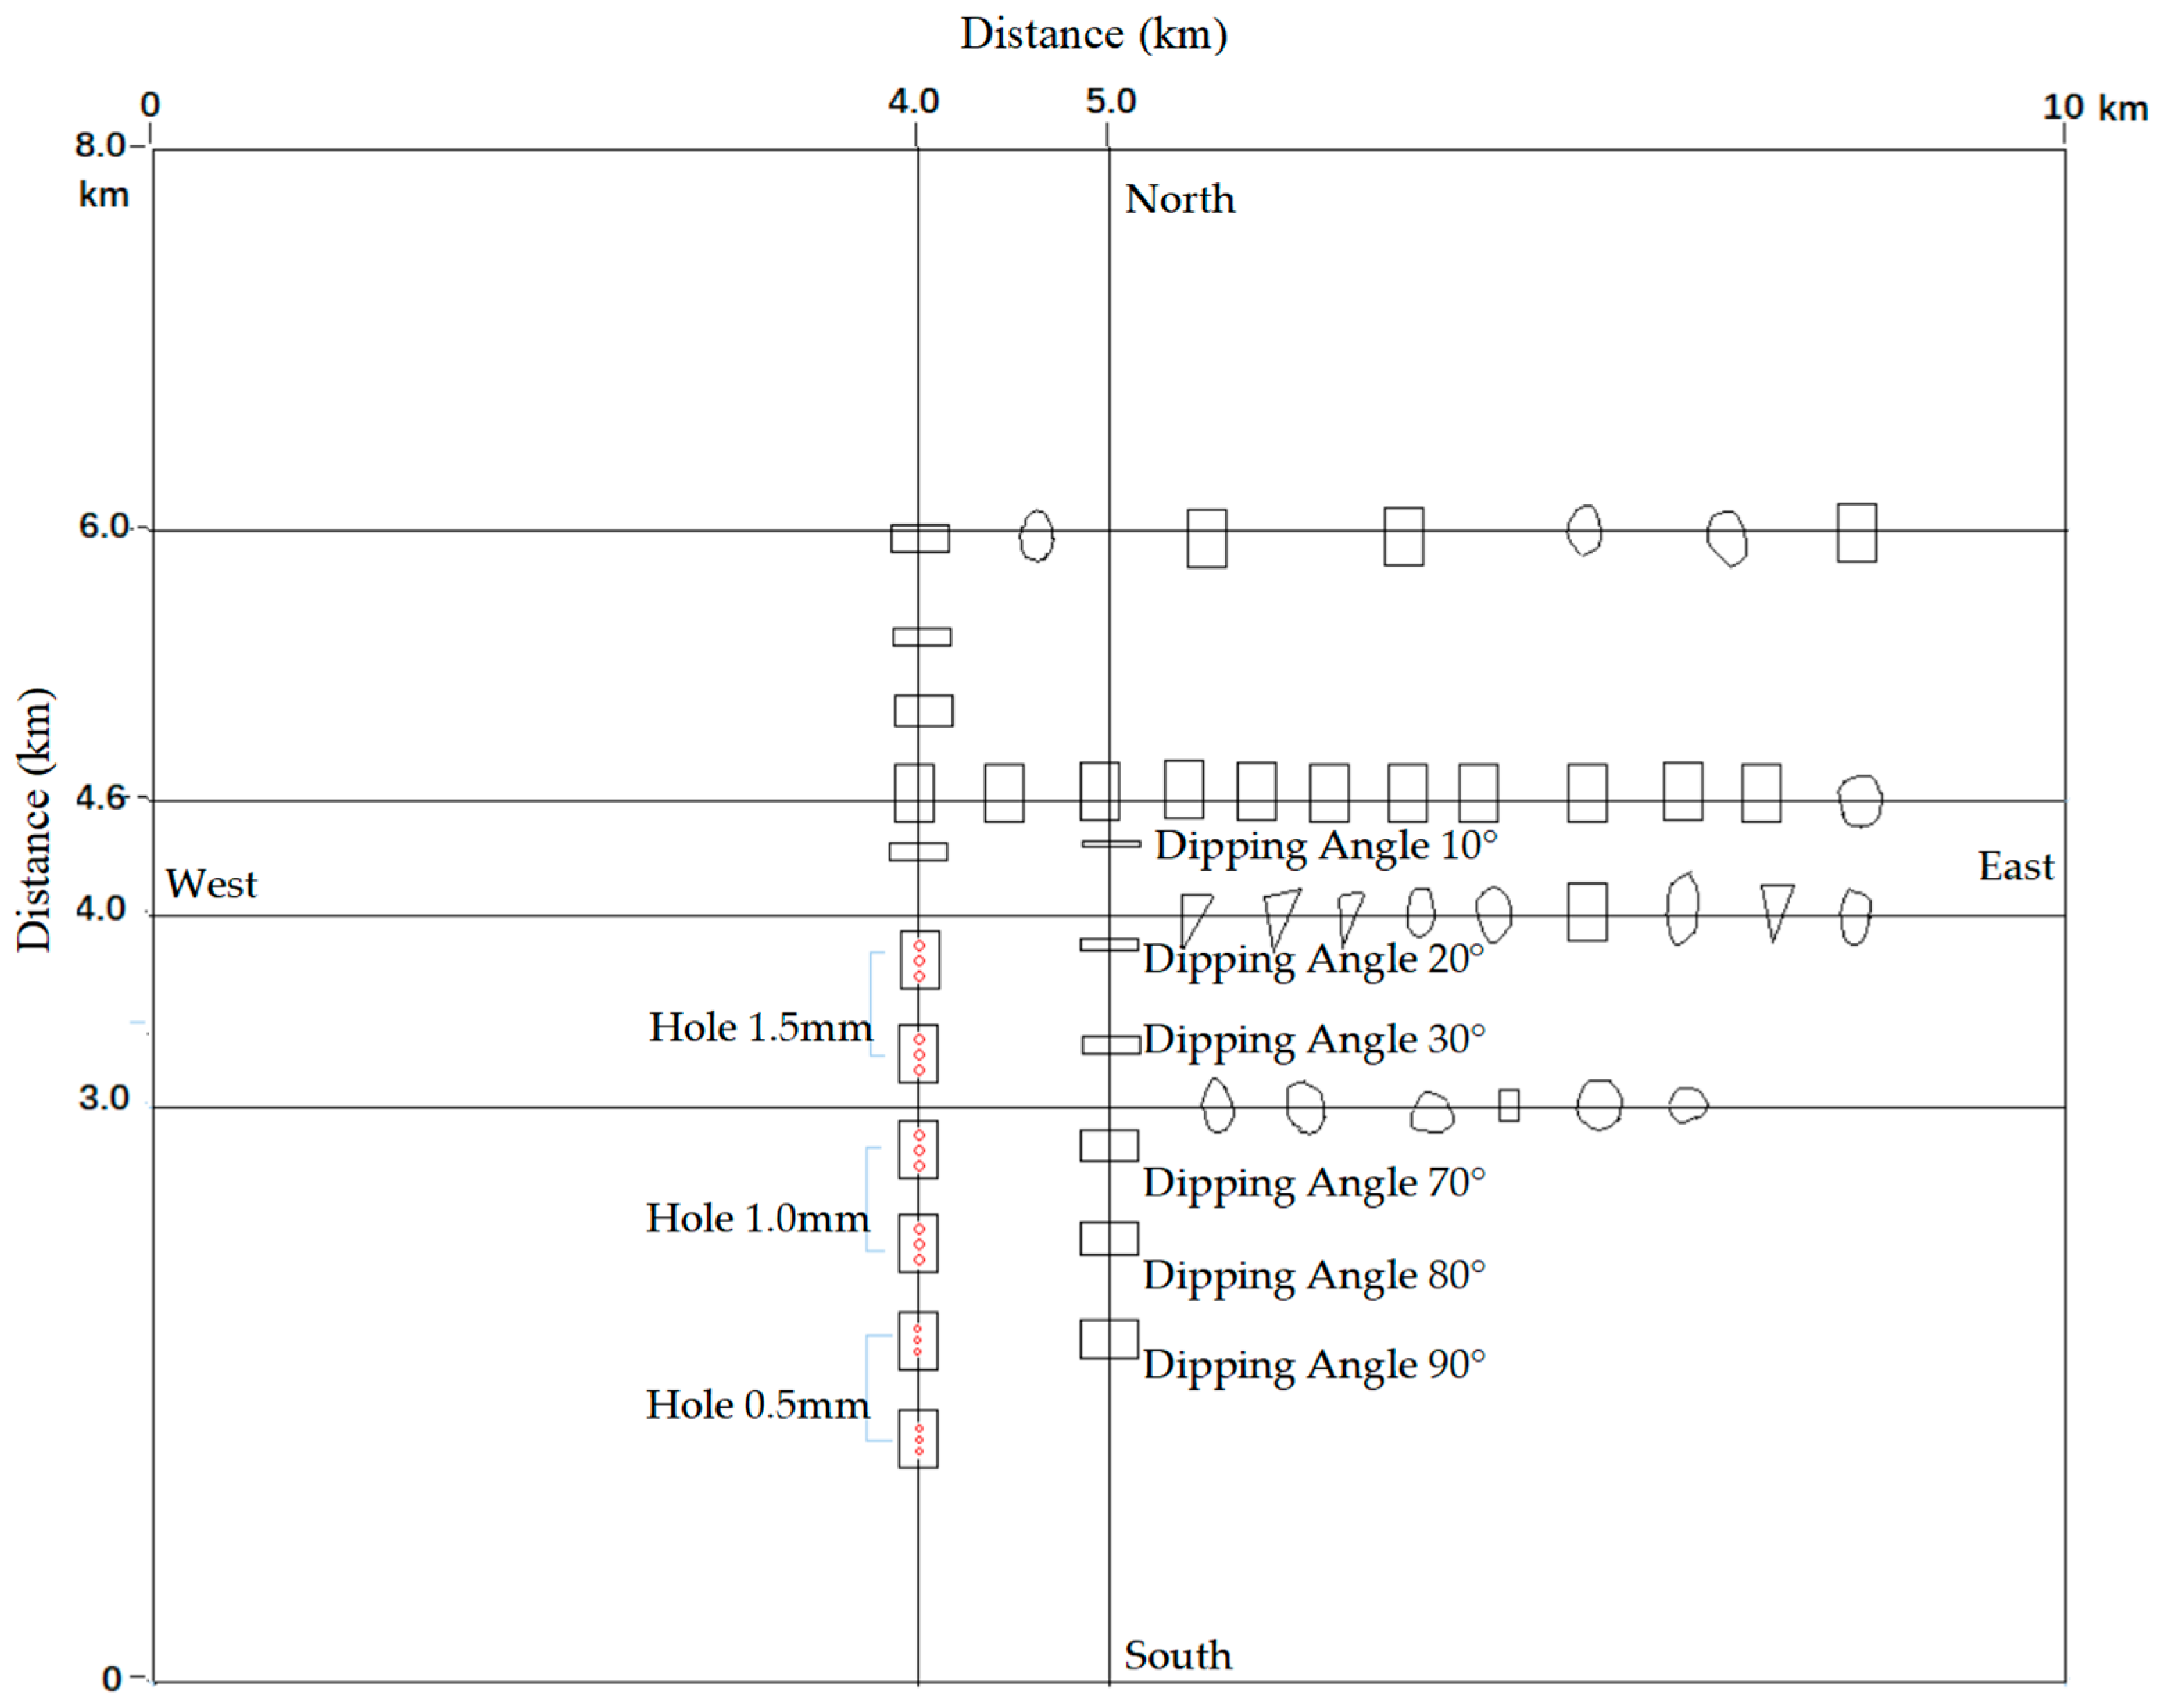
2.1. Model Construction and Parameters

The overall design of the physical model is based on the real geology of the eastern Tarim Basin. Therefore, the physical model models the stratigraphy and internal tectonic morphology of the Yijianfang Formation, the top of the Yingshan Formation, the third member of the Yingshan Formation, the fourth member of the Yingshan Formation, the Penglaiba Formation, and the Cambrian. The Yijianfang Formation was designed with three strong reflective layers in accordance with the real strong reflective interface. The top of the Yingshan Formation, the fourth member of the Yingshan Formation, and the Penglaiba Formation were designed with fracture reservoirs in the middle of the physical model.
The overall depth of the Ordovician carbonate strata in the Tarim Basin is relatively deep, with a P-wave velocity exceeding 6000 m/s, while the P-wave velocity of the fractures is relatively low. Large variations in wave impedance between fractures and surrounding rocks require a mixture of materials with different elastic parameters to be realized. Epoxy resin and rubber are mixed to obtain a low-speed material and epoxy resin with talc to obtain a high-speed material. The P-wave velocity ranges from 1200 to 2630 m/s as the ratio of rubber to epoxy resin varies and from 2640 to 3340 m/s as the ratio of talc to epoxy resin varies. By using a scale factor of 1:2.4, strata can be modeled with velocities ranging from 2880 to 8016 m/s. Detailed parameters are shown in Table 1. In the production of fractures, newspapers were coated with adhesive materials that modeled fracture fillers and then mechanically extruded, plasticized, and cut to obtain fracture reservoirs (Figure 1).
The physical model in this paper consisted of six layers. Because of the limited size and huge depth of the fractured reservoir, the scale factor was set to 1:10,000, and the total modeling area was 10 × 8 km. Physical model profiles were based on continuous well profiles in the central Tarim Basin, and physical model platforms were based on dolomite distribution maps in the central Tarim Basin. The material was processed by bonding multilayer parallel stacks of 2 cm × 3 cm in size to model the 200 m × 300 m fracture reservoirs in the fractured Ordovician carbonate beach body in the Tarim Basin (Figure 2). Fractured reservoirs with different physical parameters were placed in layers 2, 4, and 5 on a north–south line (5000 crossline) in the middle of the model (Figure 3). The first layer of the model, the Yijianfang Formation, was placed in two wedges and one equal-thickness tilted body to model strong reflections from the clastic rocks. A top view of the distribution of caves within the third layer is given in Figure 4.

2.2. Data Acquisition

The fabricated physical model was placed in the seismic data acquisition equipment to collect seismic data (Figure 5). The physical model was placed in a pool and the distance from the water surface to the top surface of the model was controlled to be 245 mm to model the seismic propagation path of a real earthquake from the ground to the target stratum. The ultrasonic transducer used to excite the source and receive the seismic data was located 0.5 mm below the water surface. The main frequency of the source was set to 500 kHz, corresponding to 25 Hz in the real acquisition. The model acquisition 3D observation system was designed based on the real exploration observation system, and its parameters are shown in Table 2. Based on raw seismic data, conventional seismic processing procedures were applied, including noise attenuation, amplitude compensation, multiple wave attenuation, stacking, and post-stack migration [2,41]. Unlike the real industrial seismic data, no static corrections were required because all geophones and sources were placed on the same horizontal plane and the surface of the physical model was flat.

3. Analysis and Discussion of Physical Modeling Results

Prior to data interpretation, data quality analyses were performed to ensure the reliability of the interpreted results. A slice of the seismic data was first given to analyze the fracture energy distribution, and Figure 6 shows an east–west oriented stacking and post-stack seismic profile in the middle of the model. The top and bottom surfaces of the model were clear, and the model seismic profile was consistent with the model design profile as well as the real seismic profile. The SBLR of the central Ordovician fractures could be recognized, and different fractures showed different SBLR characteristics, which were similar to the SBLR of the fractures in the real seismic profile [37,42] and were consistent with the numerical forward simulation results. Overall, the quality of the seismic data was sufficient for further reservoir interpretation.
According to the modeling design profile, the fractured reservoirs were all at the north–south 5000 line. The specific correspondence between the SBLRs in seismic migration profiles and the fractured reservoirs was easily recognized because the physical model had known geometry and physical properties (Figure 7). The seismic profile stretching scale was adjusted using the north–south 5000 line in the model, which facilitated the determination of the SBLR locations of different fractures and the different dips of the fractured reservoirs corresponding to different SBLRs (Figure 8, Figure 9 and Figure 10).

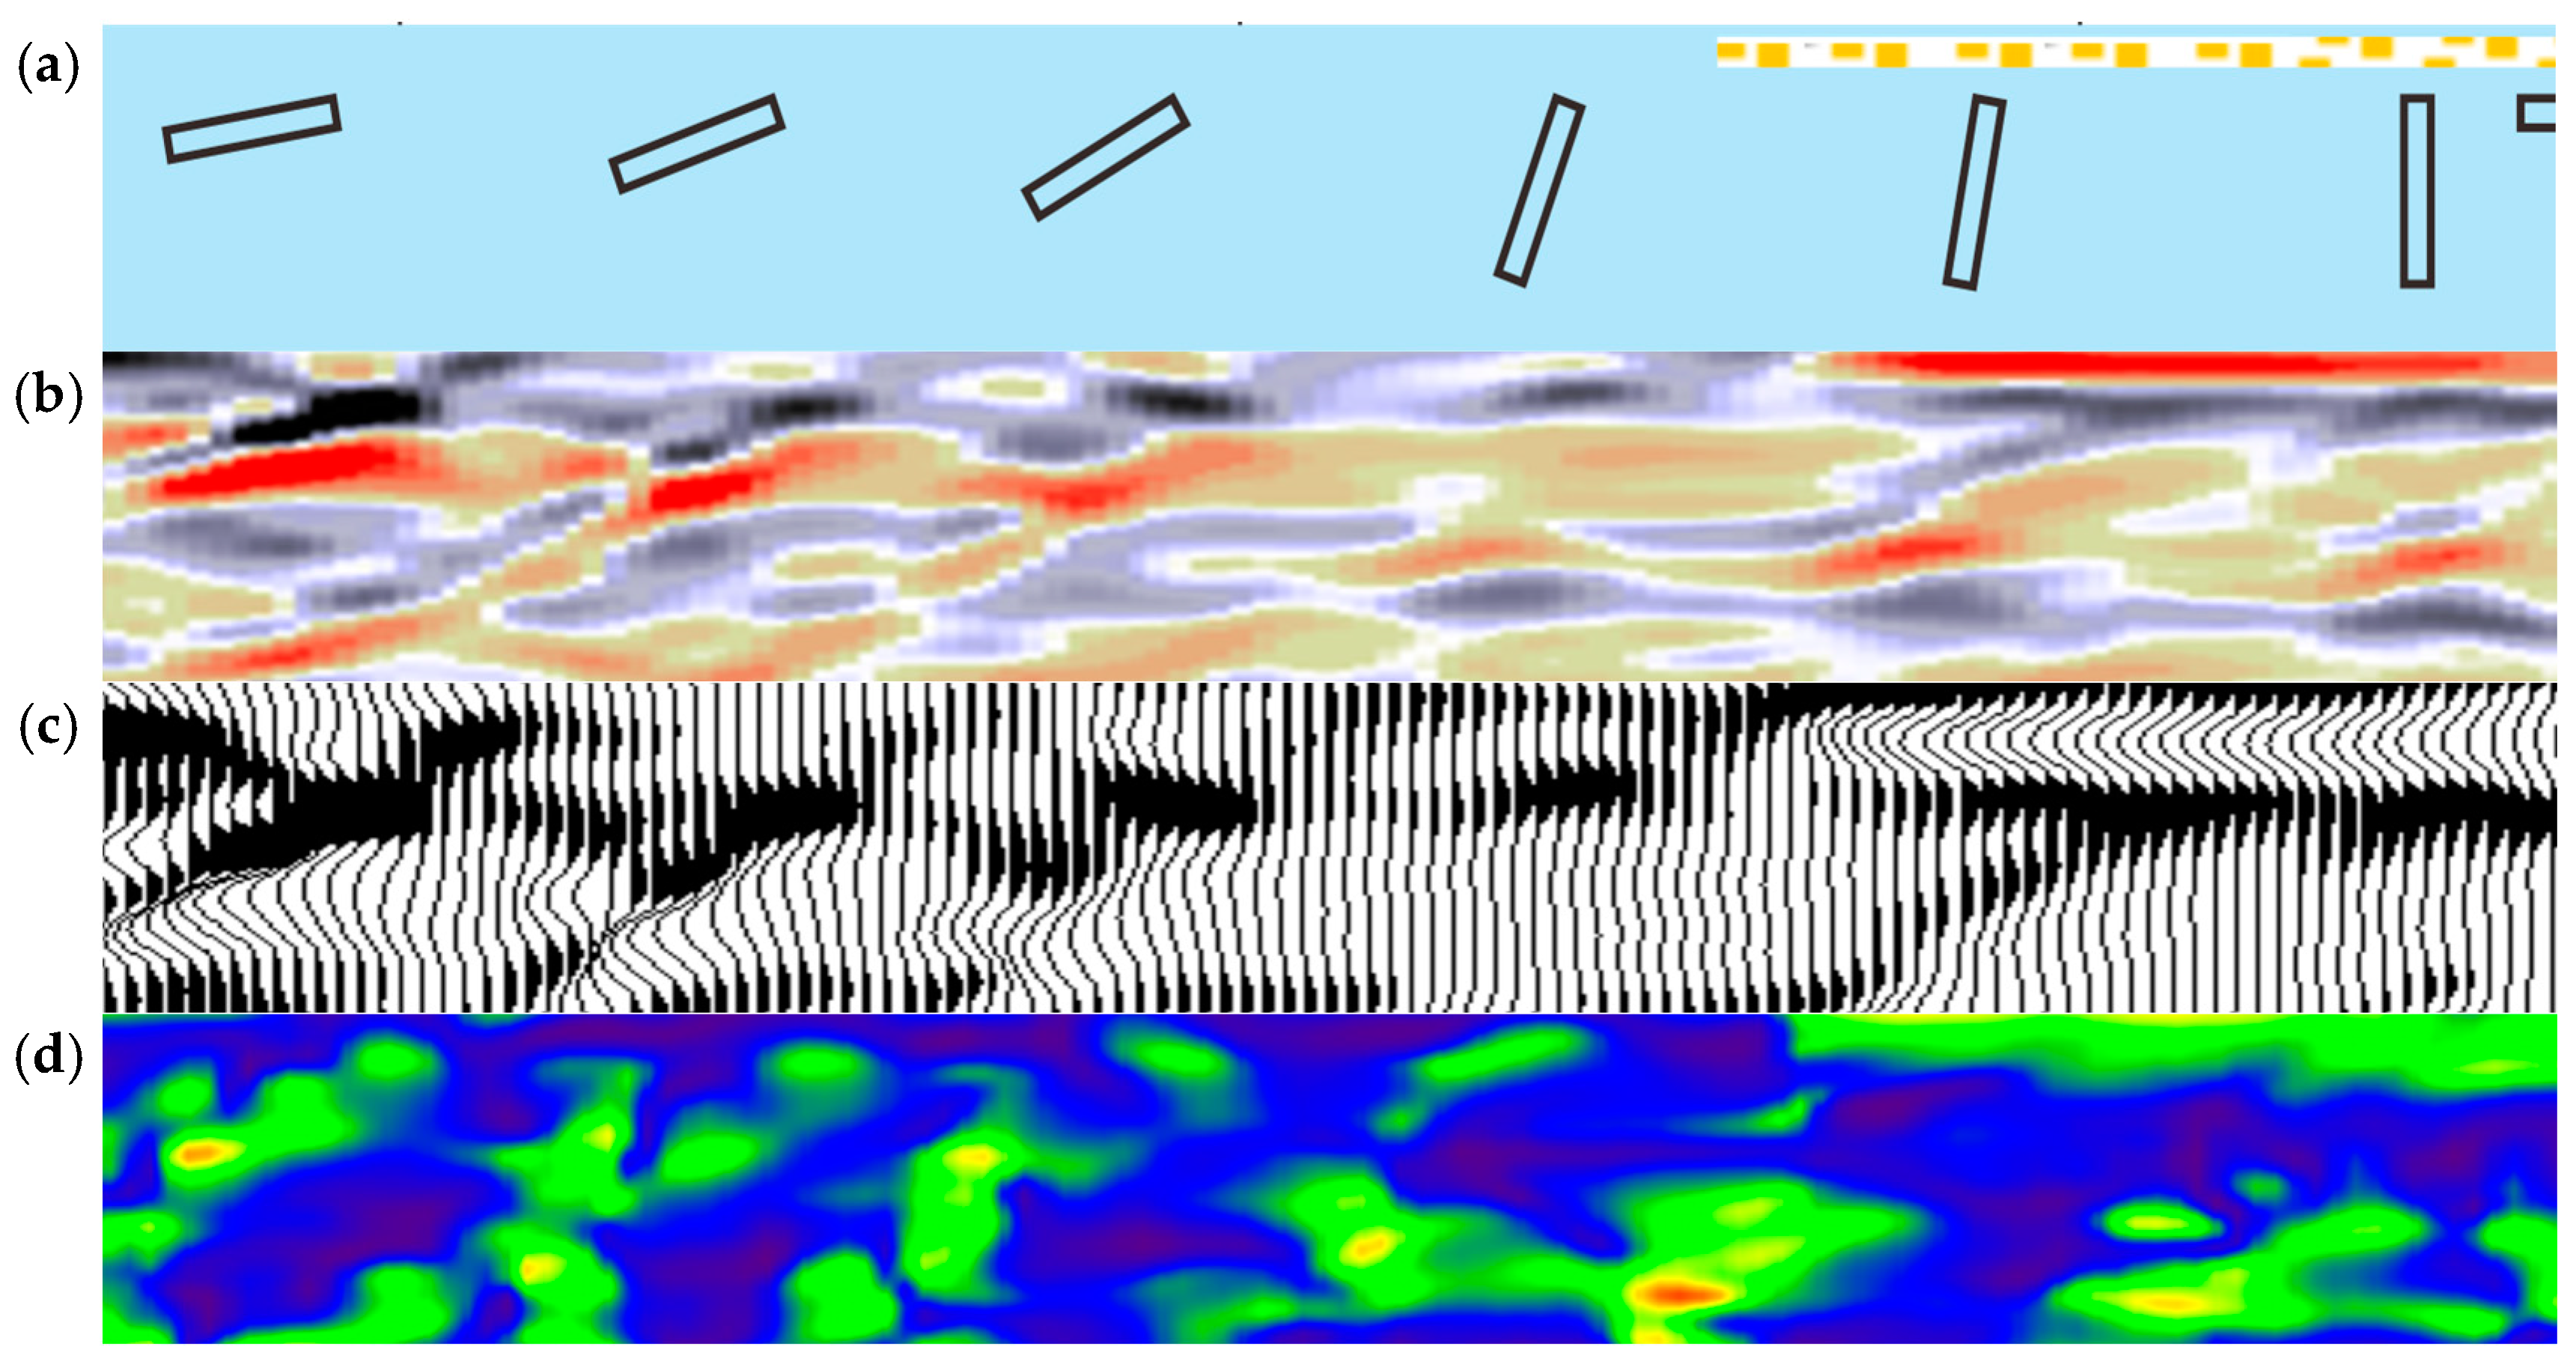
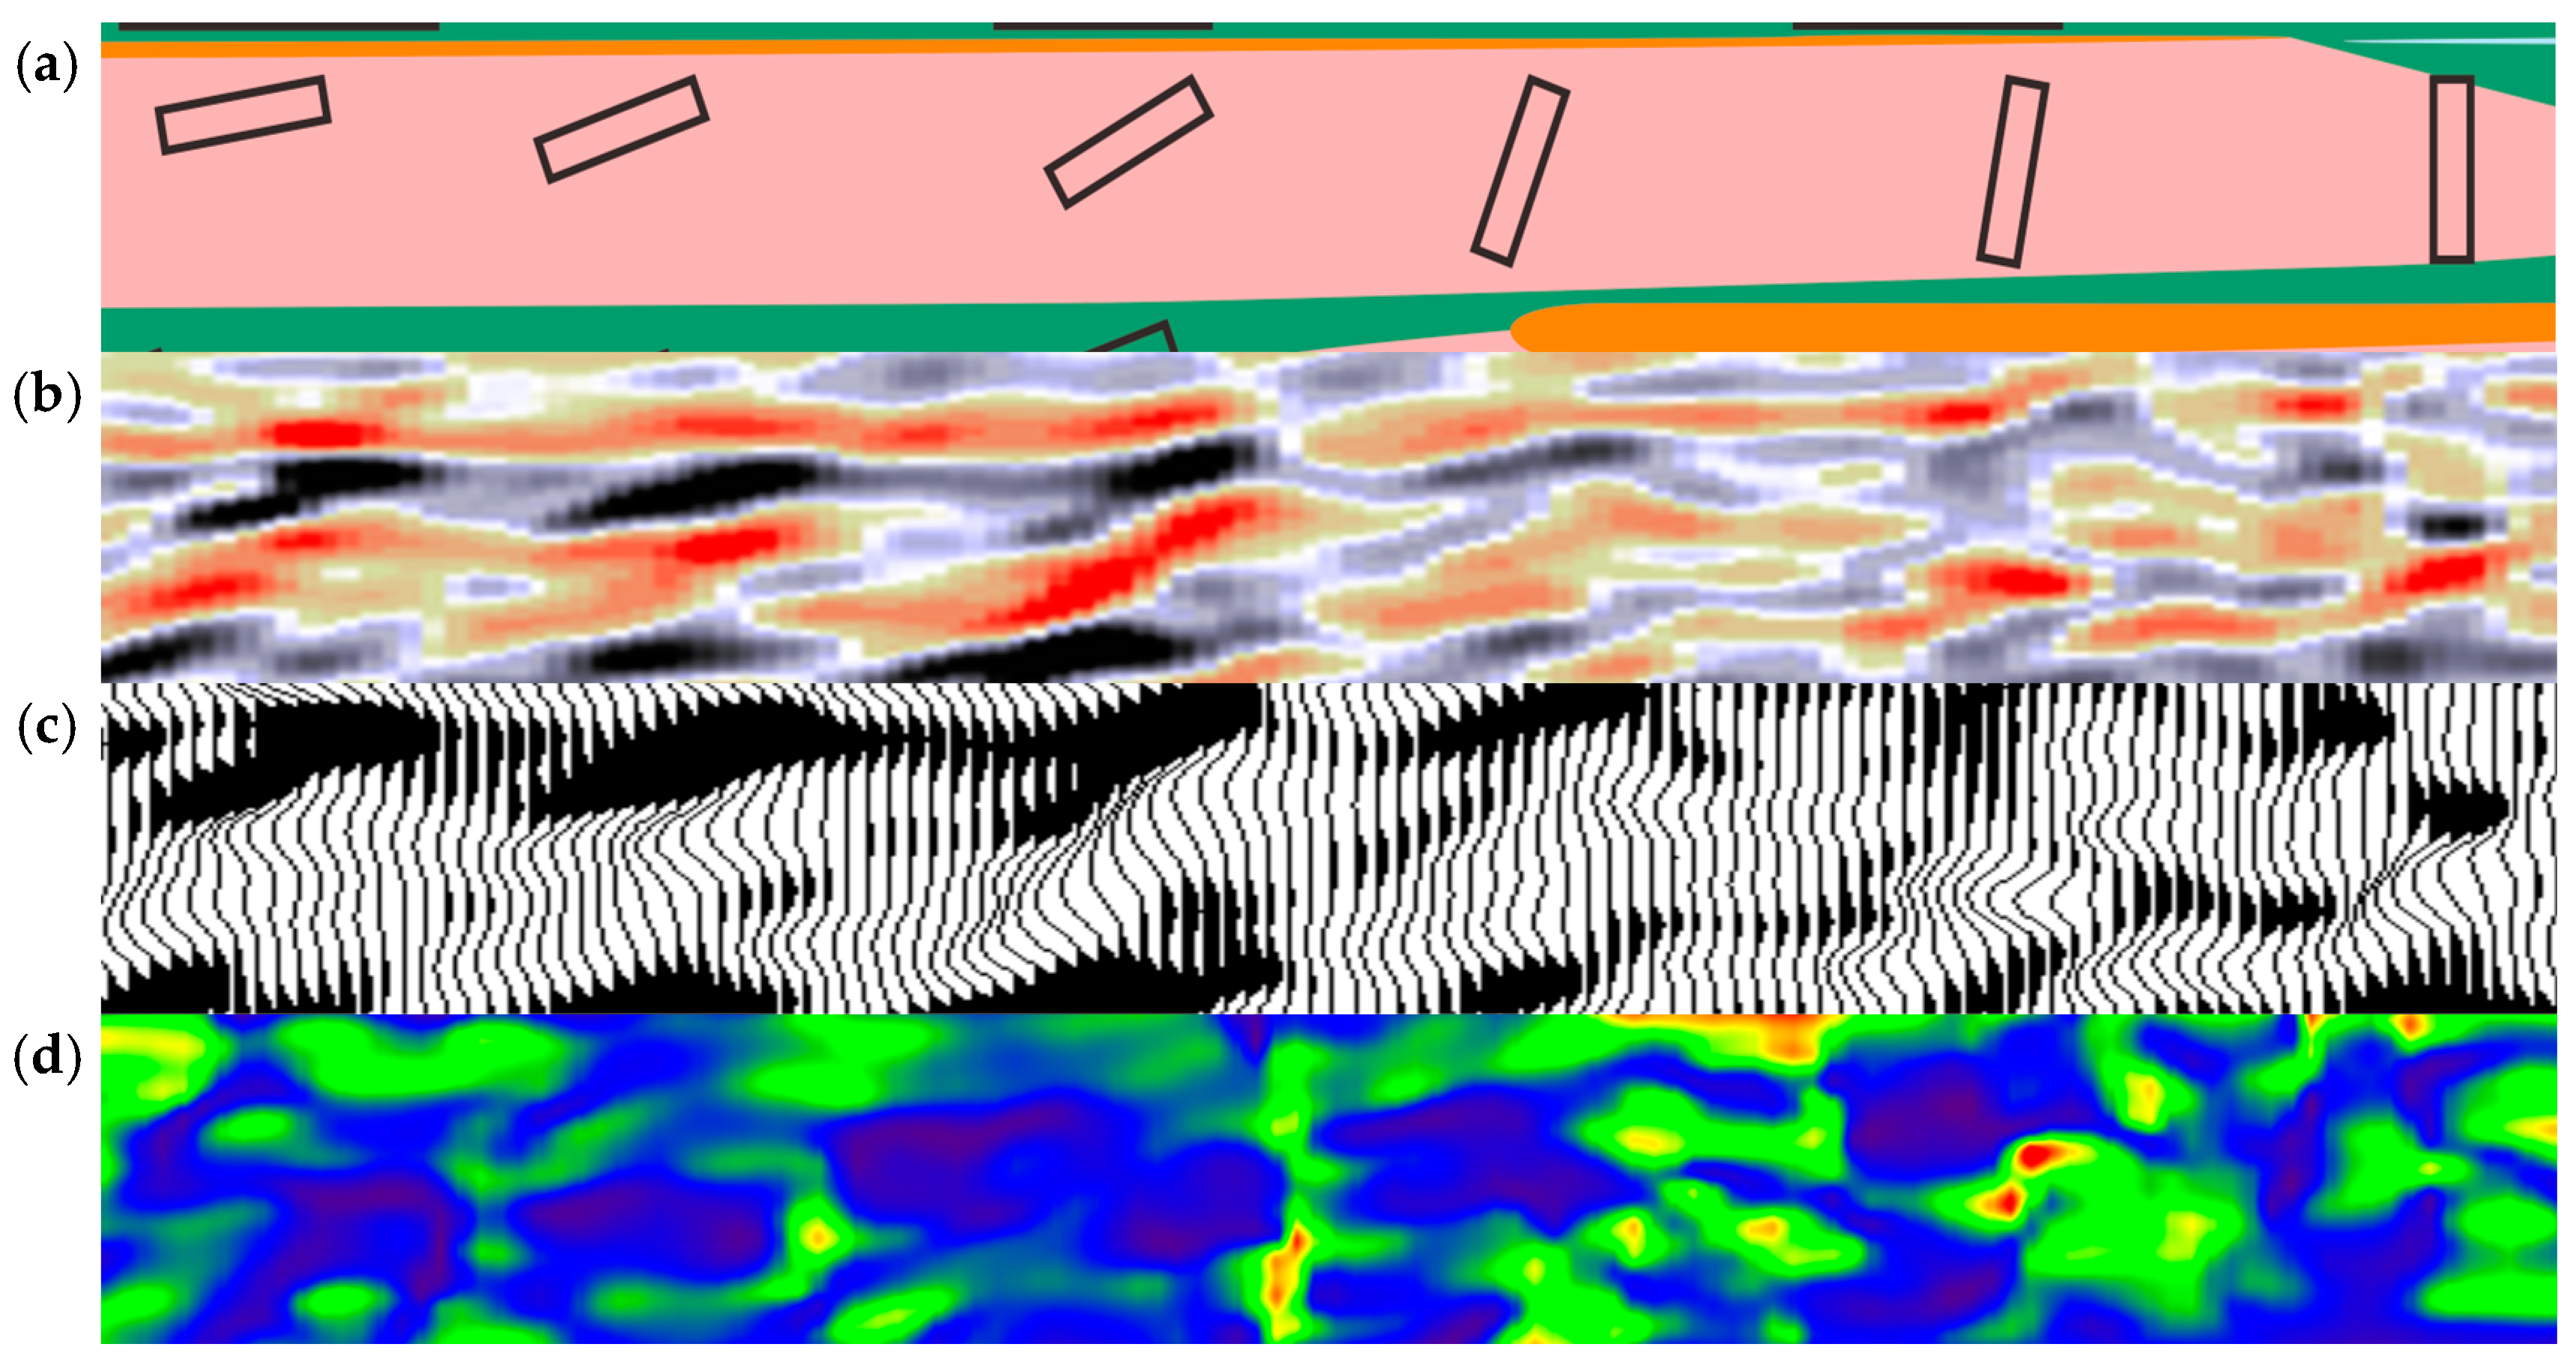
3.1. Fractured Reservoirs with Various Dip Angles

After identifying the fractured reservoir corresponding to the SBLR, the effect of fracture dip on the SBLR was analyzed first. The SBLRs of the top of the Yingshan Formation and the fourth member of the Yingshan Formation were extracted from the seismic migration data, as well as their waveform and frequency profiles. The fractured reservoirs showed a “valley–peak–valley” pattern in the top of the Yingshan Formation (Figure 8 and Figure 9).
When the fracture dipping angle was 0–30°, the SBLRs, also called the string of wide bead responses (SWBRs), were relatively obvious, sheet-like, and easy to recognize. These SWBRs had a right-skewed symmetric waveform pattern of “valley–peak–valley” horizontally, in which the wave peak was stronger, and the energy of the front valley was stronger than that of the latter valley. In the vertical direction, these had relatively weak but generally continuous reflections at the top, strong and continuous reflections in the center, and weak and relatively disorganized reflections at the bottom. When the dipping angle was 10–20°, the events were similar to that of the real fracture, and the continuity of the wave peak was stronger. When the dipping angle was 30°, the events showed an S-shape, and the part of the frequency profile above 25 Hz was similar to the morphology of the reservoir. These results are consistent with real seismic data [18,36,41] and numerical simulations [3,4].
When the dipping angle of the fractured reservoir were a high angle of 70–90°, the events gradually changed from S-shapes to X-shapes, which were tadpole-shaped and messy, and it was difficult to recognize them. The dipping angle of the events was no longer similar to that of the reservoir. When the dipping angle was 70–80°, the top and bottom reflections was stronger, and the center reflection was weaker or even blank. At a dipping angle of 90°, the top and bottom reflections were weaker, the center reflection was stronger, and the events axis was X-shaped, showing a narrow bead-like pattern in the center of the X-shape. In the frequency profile, the morphology and location of the low frequencies were more consistent with the fractured reservoir as the dipping angle increased for high angles from 70° to 90°.
From the seismic and waveform profiles, it was shown that the center maximum amplitude decreased with an increasing dipping angle for low angles from 10° to 30° and increased with an increasing dipping angle for high angles from 70° to 90°. In the frequency profile, the frequency was smaller when the fracture was horizontal; the frequency decreased with an increasing dipping angle from 10° to 90° (Figure 8 and Figure 9).
The comparison of the low-angle fractured reservoir A7 affected by the overlying strongly reflected strata with the other low-angle A1, A2, and A3 fractured reservoirs shows that the low-angle fractured reservoirs affected by the overlying strongly reflected strata had smaller amplitudes and frequencies. The comparison of the high-angle fractured reservoirs A5 and A6, which were affected by the overlying strongly reflected strata, with the fractured reservoir A4, which was not affected, shows that the high-angle fractured reservoirs were relatively less affected (Table 3).
In general, when the dipping angle of the fracture was smaller, the seismic reflected wave from the fracture had a superposition effect with that from other strata, which were smaller in frequency and larger in amplitude. When the dipping angle was larger, the superposition effect decreased, with a relatively smaller amplitude and larger frequency. At high dipping angles, as the angle increased, the velocity and density anomalies were more concentrated in the vertical direction; therefore, the amplitude increased and the frequency decreased.

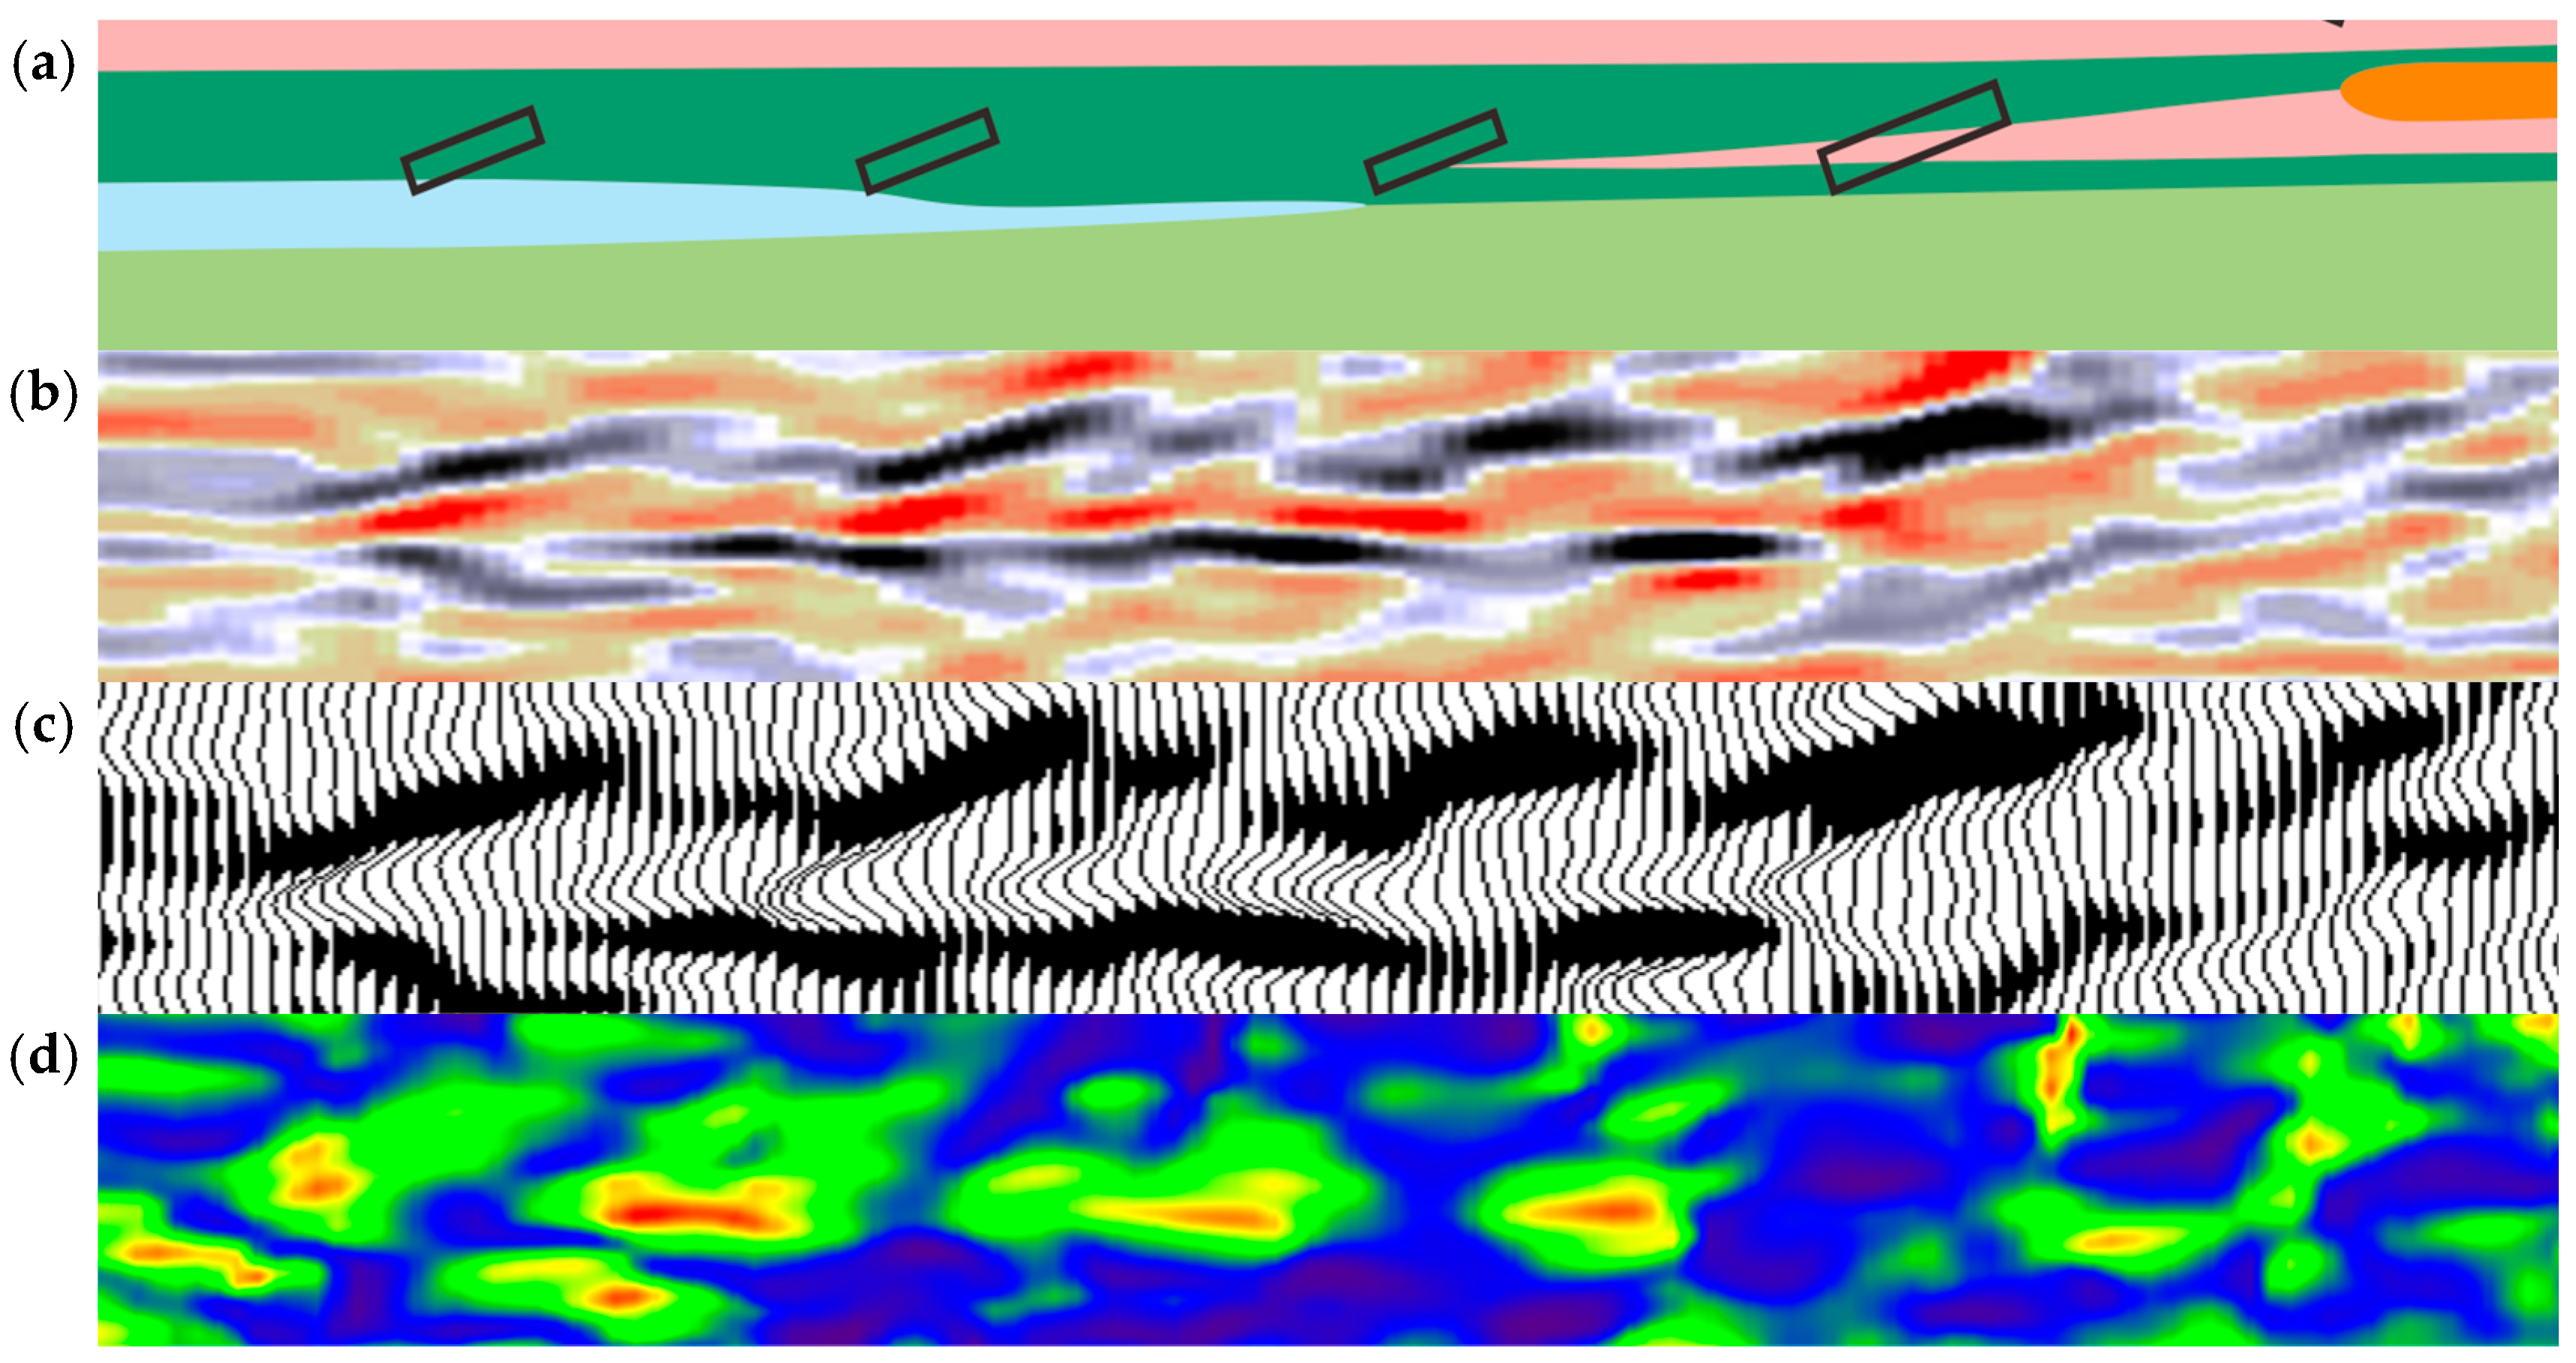
3.2. Fractured Reservoirs with Various Layers

The number of fracture layers also has a decisive influence on the seismic response characteristics of an SWBR. The SWBRs of fractured reservoirs were extracted with the same dip angle and different fracture layer numbers in the Penglaiba Formation (Figure 10).
From the seismic profile, the morphology of the low-dipping-angle fractured reservoirs in the Penglaiba Formation was the same as that of the top of the Yingshan Formation and the fourth member of the Yingshan Formation. The SWBR of the fractured reservoirs with the same dip angle showed a gradual increase in the center maximum amplitude with the increase in the number of fractured layers. From the seismic and waveform profiles, as the number of fractured layers increased, the events of the center peak of the SWBR coarsened and thickened. For the fractured reservoirs with more than 15 layers, the events showed obvious delamination. From the frequency profile, fractured reservoirs with the same dip angle had a decreasing frequency as the number of fractured layers increased.
With the same frequency of the wavelet of the seismic data, the specific number of fracture layers, thickness, P-wave velocity, density, and other parameters caused interference which influenced the seismic response characteristic in the frequency profiles. In the low-dipping-angle fractured reservoirs of the Penglaiba Formation in the Tarim Basin, the frequency decreased as the number of fracture layers increased to 5, 10, 15, and 20 (Figure 10).
When the number of fracture layers was 5–10, the events were similar to the morphology and location of the fractured reservoirs at frequency profiles greater than 25 Hz, and the events were more difficult to recognize when the number of layers was 15–20.

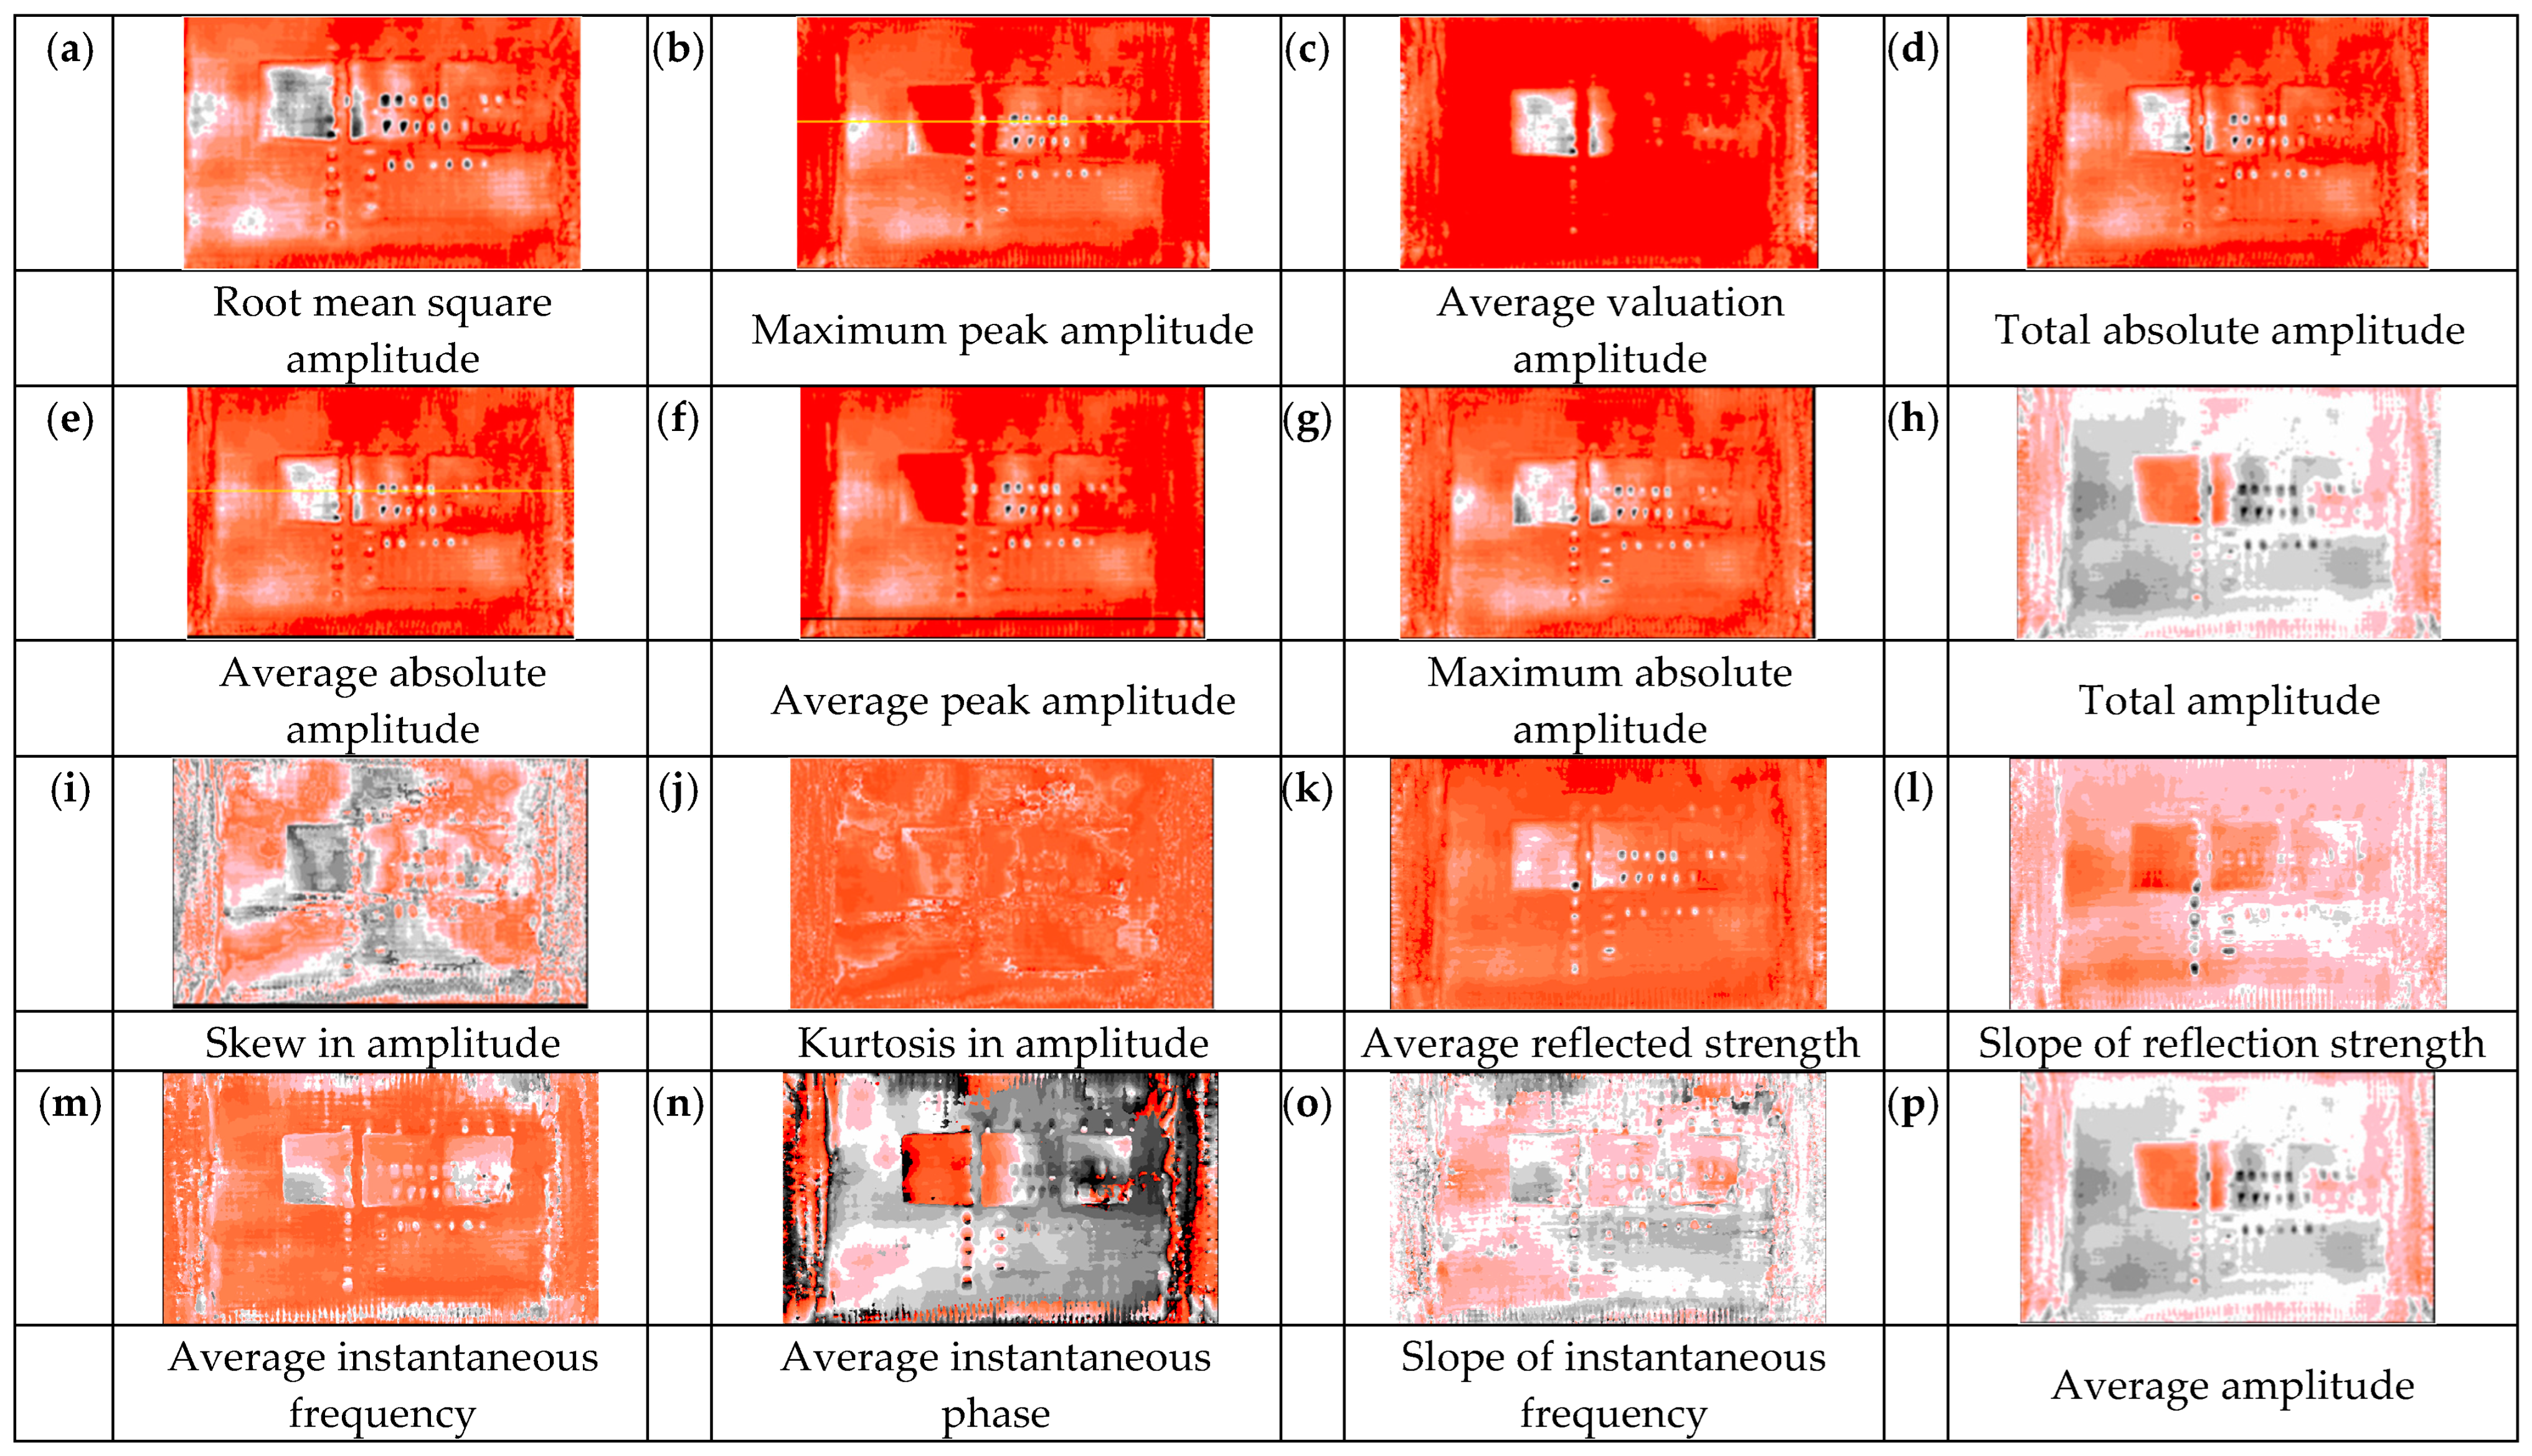
3.3. Planar Attribute Characterizations of Fractured Reservoirs

The planar attribute characterization of fractured reservoirs is an integral part of seismic data interpretation. In this paper, different planar attributes of the top of the Yingshan Formation were extracted for comparison with different fractured reservoir planar morphologies known from the model (Figure 11 and Figure 12).
For different fractured reservoirs, the slope of reflection strength attribute and the maximum absolute amplitude attribute performed better relative to other attributes. Fractured reservoirs were easier to recognize in these two attributes. These two attributes exhibited a reservoir morphology and area that were more consistent with the real reservoir and less disturbed by the overlying strata. Comparing these two attributes, the slope of reflection strength attribute was relatively cluttered and the maximum absolute amplitude attribute was clearer. These two attributes can be used as quality attributes for identifying carbonate fractures at different angles in the Tarim Basin.
Dipping angle fractures with a low angle of 10–30° were easier to identify on the maximum absolute amplitude attribute. Fractured reservoirs in inclined morphology had an elliptical shape along the long axis of the reservoir in the slope of reflection strength attribute. The ratio of the area of a 10° attribute to its real plane area was more than 60% of the total area. Fractures underneath the overlying strong reflections could also be identified with this attribute.

4. Conclusions

In this paper, a physical model was designed based on the real tectonic distribution and target reservoirs in the Tarim Basin, and the seismic profile response characteristics of short axis, low frequency, and strong amplitude in fractured carbonate reservoirs with different parameters were investigated. Although the signal-to-noise ratio of the physically modeled data was typically higher than that of real data, it could also provide a reference for recognizing seismic response characteristics. After the acquisition of the real data obtained from the physical model and seismic data processing, the reflected events of the designed strata and fractured reservoirs could be identified and were in the same position as the designed ones on the seismic stacking and migration profiles, which proved the validity and correctness of the construction of the physical model and the acquisition and processing of the seismic data. The effect of fracture reservoir groups with different parameters on the seismic response characteristics has been analyzed. For fractured reservoirs with different dipping angles, the difficulty of identification gradually increased with an increasing dipping angle, while the morphology of reflected events varied greatly. For fractured reservoirs with different numbers of fracture layers, the more layers there were, the lower the frequency was, while when the number of layers exceeded 15, the reflected event was slightly separated. In terms of planar attributes, the slope of reflection strength and maximum absolute amplitude attributes had a clear advantage for the identification of fractured reservoirs. It is worth mentioning that the maximum absolute amplitude attribute enabled the identification of fracture reservoirs located below the overlying strong reflections. For more complex conditions, more detailed and larger-size physical model design and fabrication can achieve a higher resolution of seismic data to investigate the seismic response characteristics of fractured carbonate reservoirs more precisely. These aspects represent the future needs of the petroleum industry and the direction of our further research.

Author Contributions

Methodology, L.W.; Investigation, L.W., B.D. and J.W.; Writing—original draft, L.W.; Writing—review & editing, B.D.; Supervision B.D. and J.W. All authors have read and agreed to the published version of the manuscript.

Funding

This work was supported by the National Natural Science Foundation of China (41804105) and the National Science & Technology Major Project (2017ZX05005004).

Data Availability Statement

Data is contained within the article.

Conflicts of Interest

The authors declare no conflict of interest.

References

  1. Wang, R.; Yang, J.; Chang, L.; Zhang, Y.; Sun, C.; Wan, X.; Wu, G.; Bai, B. 3D Modeling of Fracture-Cave Reservoir from a Strike-Slip Fault-Controlled Carbonate Oilfield in Northwestern China. Energies 2022, 15, 6415. [Google Scholar] [CrossRef]
  2. Zeng, J.; Stovas, A.; Huang, H.; Ren, L.; Tang, T. Prediction of Shale Gas Reservoirs Using Fluid Mobility Attribute Driven by Post-Stack Seismic Data: A Case Study from Southern China. Appl. Sci. 2021, 11, 219. [Google Scholar] [CrossRef]
  3. Sun, D.; Pan, J.; Yong, X.; Han, J.F.; Zhang, H.Q.; Gao, J.H.; Wang, H.B. Formation mechanism of vertical “long string beads” in carbonate reservoir. Oil Geophys. Prospect. 2010, 45, 101–104+239+251. [Google Scholar] [CrossRef]
  4. Sun, D.; Yang, L.; Chen, J. Seismic Response Characteristics of Fractured-Vuggy Reservoirs in Deep Carbonate Horizons of Tarim Basin. Xinjiang Pet. Geol. 2018, 39, 633–642. [Google Scholar] [CrossRef]
  5. Xu, C.; Di, B.; Wei, J. Fluid identification of carbonate cave reservoir based on seismic physical modeling. Geophys. Prospect. Pet. 2014, 53, 116–124. [Google Scholar]
  6. Xiao, M.; Cao, Y.; Zhang, X. The research on the ancient Karst of ordovician reservoir in Block 4 of Tahe oilfield. Pet. Geol. Eng. 2010, 24, 31–33+140. [Google Scholar]
  7. Wang, H.; Liu, W.; Zheng, D.; Jing, B.; Dong, R.; Zhang, X.; Li, S. Types and causes of “none-string beads” fracture-cavity reservoirs in Ordovician carbonate of Tarim basin. Nat. Gas Geosci. 2011, 22, 982–988. [Google Scholar]
  8. Qiu, P.; Mu, Z.; Jiang, Y.; Liu, F.; Lou, F.; Li, Y. Seismic Response Characteristics of Fractured Reservoirs-Taking Tight Sandstone Reservoirs in Central Sichuan as an Example. Nat. Gas Oil 2011, 29, 49–53+87–88. [Google Scholar]
  9. Ding, J. Research on the performance characteristics of carbonate reservoirs with high-angle fractures. Calc. Technol. Geophys. Geochem. Explor. 2019, 41, 712–717. [Google Scholar] [CrossRef]
  10. Pyrak-Nolte, L.J. Fracture anisotropy: The role of fracture-stiffness gradients. Lead. Edge 2007, 26, 1124–1127. [Google Scholar] [CrossRef]
  11. Cao, Z.; Xiang, Y.L.; Liu, J.; Qin, X.; Sun, S.; Li, Z.; Cao, Z. Carbonate fractured gas reservoir prediction based on P-wave azimuthal anisotropy and dispersion. J. Geophys. Eng. 2018, 15, 2139–2149. [Google Scholar] [CrossRef]
  12. Zhao, W.; Shen, A.; Qiao, Z.; Zheng, J.; Wang, X. Carbonate karst reservoirs of the Tarim Basin, northwest China: Types, features, origins, and implications for hydrocarbon exploration. Interpretation 2014, 2, SF65–SF90. [Google Scholar] [CrossRef]
  13. Yan, X.; Guan, P.; Wang, S. Seismic response characteristics and prediction of carbonate rock fractured-vuggy systems in the Tarim Basin. Oil Gas Geol. 2007, 6, 828–835. [Google Scholar]
  14. Lang, X.; Peng, S.; Kang, H. Study on Geophysical Response Characteristic and Prediction Methodology of Fractured and Cavernous Carbonate Reservoir. Acta Sci. Nat. Univ. Pekin 2012, 48, 775–784. [Google Scholar] [CrossRef]
  15. Wang, J.; Zhang, H.; Chen, F. Characteristics and prediction of marine fractured carbonate rock reservoir in Y area of North Tarim Uplift, Xinjiang, China. J. Chengdu Univ. Technol. (Sci. Technol. Ed.) 2013, 40, 394–398. [Google Scholar] [CrossRef]
  16. Chen, G.; Pan, J.; Guan, W.; Huang, L.J.; Tan, L. Geophysical Characteristics in Carbonatite Carst Reservoirs. Nat. Gas Explor. Dev. 2005, 28, 43–46. [Google Scholar]
  17. Maultzsch, S.; Chapman, M.; Liu, E.; Li, X.Y. Modelling frequency-dependent seismic anisotropy in fluid-saturated rock with aligned fractures: Implication of fracture size estimation from anisotropic measurements. Geophys. Prospect. 2010, 51, 391–392. [Google Scholar] [CrossRef]
  18. Dong, R.; Han, J.; Zhang, Y. Application of Fracture-Cave Quantitative Technique for Carbonate Reservoir of Yingshan Formation of Lower Ordovician in North Slope of Tazhong Area, Tarim Basin. Xinjiang Pet. Geol. 2011, 32, 314–317. [Google Scholar]
  19. Li, S.; Liu, W.; Gao, J. Application of forward modeling to research of carbonate cave response. Lithol. Reserv. 2011, 23, 106–109. [Google Scholar]
  20. Li, S.; Wang, H.; Yong, X.; Liu, W.; Gao, J.; Li, S. Seismic Response Mechanism of Carbonate Caverns and Influence Factors in Tazhong Area. Xinjiang Pet. Geol. 2011, 32, 305–307. [Google Scholar]
  21. Ma, L.; Gu, H.; Li, Z.; Lv, S.S. Simulation of carbonate fracture-cavern reservoir reflection characteristics with forward modeling. Oil Geophys. Prospect. 2015, 50, 290–297. [Google Scholar] [CrossRef]
  22. Cui, Z.; Xiong, X.; Gong, S. Carbonate Fractured Reservoir Modeling and Its Numerical Simulation. Sci. Technol. Eng. 2017, 17, 177–180. [Google Scholar]
  23. Wang, Z.; Deng, G.; Wen, H.; Ding, W.; Wang, X. The application of pre-stack fracture prediction technique in tahe oilfield carbonate reservoirs. Chin. J. Eng. Geophys. 2018, 15, 65–72. [Google Scholar]
  24. Wang, Z.; Wen, H.; Hu, W. Study on spatial location prediction method of fractured—Vuggy carbonate reservoir in tahe oilfleid. Chin. J. Eng. Geophys. 2019, 16, 433–438. [Google Scholar]
  25. Yang, P.; Sun, S.Z.; Liu, Y.; Li, H.; Dan, G.; Jia, H. Origin and architecture of fractured-cavernous carbonate reservoirs and their influences on seismic amplitudes. Lead. Edge 2012, 31, 140–150. [Google Scholar] [CrossRef]
  26. Zeng, H.; Wang, G.; Janson, X.; Loucks, R.; Xia, Y.; Xu, L.; Yuan, B. Characterizing seismic bright spots in deeply buried, Ordovician Paleokarst strata, Central Tabei uplift, Tarim Basin, Western China. Geophysics 2011, 76, B127–B137. [Google Scholar] [CrossRef]
  27. Zhou, P.; Tang, Y.; Yin, H.; Zhao, S.; Mo, T.; Zhang, X.; Zhu, W.; Li, C. Relationship between characteristics of fracture belt and production of Keshen 2 gas reservoir in Kelasu tectonic zone, Tarim Basin. Nat. Gas Geosci. 2017, 28, 135–145. [Google Scholar]
  28. Wang, R.; Liu, B. Applicability Analysis of Pre-Stack Inversion in Carbonate Karst Reservoir. Energies 2022, 15, 5598. [Google Scholar] [CrossRef]
  29. Mahgoub, M.; Bashir, Y.; Bery, A.; Noufal, A. Four-Dimension Seismic Analysis in Carbonate: A Closed Loop Study. Appl. Sci. 2022, 12, 9438. [Google Scholar] [CrossRef]
  30. Luo, M.; Takanashi, M.; Nakayama, K.; Ezaka, T. Physical modeling of overburden effects. Geophysics 2007, 72, T37–T45. [Google Scholar] [CrossRef]
  31. French, W.S. Two-dimensional and three-dimensional migration of model-experiment reflection profiles. Geophysics 1974, 39, 265–277. [Google Scholar] [CrossRef]
  32. Cheadle, S.P.; Brown, R.J.; Lawton, D.C. Orthorhombic anisotropy; a physical seismic modeling study. Geophysics 1991, 56, 1603–1613. [Google Scholar] [CrossRef]
  33. Luo, M.; Arihara, N.; Wang, S.; Di, B.; Wei, J. Abnormal transmission attenuation and its impact on seismic-fracture prediction—A physical modeling study. Geophysics 2006, 71, D15–D22. [Google Scholar] [CrossRef]
  34. Evans, S.G.; Guthrie, R.; Roberts, N.; Bishop, N.F. The Disastrous 17 February 2006 Rockslide-Debris Avalanche on Leyte Island, Philippines: A Catastrophic Landslide in Tropical Mountain Terrain. Nat. Hazards Earth Syst. Sci. 2007, 7, 89–101. [Google Scholar] [CrossRef]
  35. Wandler, A.; Evans, B.; Link, C. AVO as a fluid indicator: A physical modeling study. Geophysics 2007, 72, C9–C17. [Google Scholar] [CrossRef]
  36. Wong, J.; Hall, K.W.; Gallant, E.V.; Bertram, M.B.; Lawton, D.C. Seismic physical modeling at the University of Calgary. In Proceedings of the SEG Houston 2009 International Exposition and Annual Meeting, Houston, TX, USA, 25–30 October 2009; pp. 2642–2646. [Google Scholar]
  37. Wang, S.; Li, X.-Y.; Di, B.; Brooth, D. Reservoir fluid substitution effects on seismic profile interpretation: A physical modeling experiment. Geophys. Res. Lett. 2010, 37, L1030. [Google Scholar] [CrossRef]
  38. Wang, L.; Wei, J.; Huang, P.; Di, B.; Qin, S. Study of seismic physical modelling of fractured reservoirs. Pet. Sci. Bull. 2017, 2, 210–227. [Google Scholar] [CrossRef]
  39. Li, Q. Quantitative Analysis for Seismic Attribute of Carbonate Caves Base on the Physical Model; China University of Petroleum: Beijing, China, 2016. [Google Scholar]
  40. Zhao, Q.; Qu, S.; Xue, S.; Zhang, M. Study on the seismic response characteristics on the physical model of carbonate cave. Geophys. Prospect. Pet. 2010, 49, 351–358+400+17–18. [Google Scholar] [CrossRef]
  41. Xiao, L.; Zhang, Z.; Gao, J. Ground Roll Attenuation of Multicomponent Seismic Data with the Noise-Assisted Multivariate Empirical Mode Decomposition (NA-MEMD) Method. Appl. Sci. 2022, 12, 2429. [Google Scholar] [CrossRef]
  42. Wang, S.; Cao, H.; Jin, W.; Cai, Y. Seismic response and prediction of fracture-cavity system in carbonate reservoir: A case study in the Ka-1 field. Geophys. Prospect. Pet. 2005, 44, 421–427. [Google Scholar]
Figure 1. Physical modeling design of fractured reservoirs.
Applsci 14 03775 g001
Figure 2. Characteristics of fractured reservoirs. (a) View of the reservoirs’ immersion angles; (b) view of the reservoirs’ distributions.
Applsci 14 03775 g002
Figure 3. The design of the north–south 5000 profile in the physical model. A1–A7, B1–B6, and C1–C4 show the fractured reservoir in the top of the Yingshan Formation, the fourth member of the Yingshan Formation, and the Penglaiba Formation, respectively. The specific physical parameters are shown in Table 1.
Applsci 14 03775 g003
Figure 4. Fracture reservoirs’ locations and modeling plans with the major formations and lithologies labeled.
Applsci 14 03775 g004
Figure 5. Three-dimensional seismic data acquisition.
Applsci 14 03775 g005
Figure 6. Seismic profiles of the east–west 4600 line. (a) Stacking profile. (b) Post-stack migration profile.
Applsci 14 03775 g006
Figure 7. The migration profile of the north–south 5000 line. The red, blue, and green boxes contain the seismic response of the fractured reservoirs in the top of the Yingshan Formation, the fourth member of the Yingshan Formation, and the Penglaiba Formation, respectively.
Applsci 14 03775 g007
Figure 8. Model and results in the top of the Yingshan Formation. The profile location is identical to that of the red box in Figure 7. (a) Model of fracture reservoirs. (b,c) are the color and waveform plots of the migration results, respectively. (d) Frequency attribute.
Applsci 14 03775 g008
Figure 9. Model and results in the fourth member of the Yingshan Formation. The profile location is identical to that of the blue box in Figure 7. (a) Model of fracture reservoirs. (b,c) are the color and waveform plots of the migration results, respectively. (d) Frequency attribute.
Applsci 14 03775 g009
Figure 10. Model and results in the Penglaiba Formation. The profile location is identical to that of the green box in Figure 7. (a) Model of fracture reservoirs. (b,c) are the color and waveform plots of the migration results, respectively. (d) Frequency attribute.
Applsci 14 03775 g010
Figure 11. Plan view of reservoirs in the top of the Yingshan Formation.
Applsci 14 03775 g011
Figure 12. Attribute slices at the top of the Yingshan Formation. The attribute name is below the attribute.
Applsci 14 03775 g012
Table 1. Parameters of physical model of the fractured carbonate reservoirs in the Tarim Basin.
FractureStratumDipping Angle (°)Fracture LayersPhysical ModelReal Measurement
P-Wave
Velocity (m/s)
Density (g/m3)P-Wave
Velocity (m/s)
Density (g/m3)
A1The top of the Yingshan FormationLow101525901.1162162.03
A2201525901.1162162.03
A3301525901.1162162.03
A4High701525901.1162162.03
A5801525901.1162162.03
A6901525901.1162162.03
A7Low01525901.1162162.03
B1The fourth member of the Yingshan FormationLow102024271.0658251.94
B2202024271.0658251.94
B3302024271.0658251.94
B4High702024271.0658251.94
B5802024271.0658251.94
B6902024271.0658251.94
C1The Penglaiba Formation20524791.1259502.05
C2201026201.1162882.03
C3201525901.1162162.03
C4202024271.0658251.94
Table 2. Parameters of the 3D seismic observation system.
Physical ModelGeological Model
Receiver lines2323
Short lines2929
Receiver line interval35 mm350 m
Shot line interval35 mm350 m
Trace interval2.5 mm25 m
Shot interval5 mm50 m
Number of traces491491
Sampling points40964096
Sampling interval0.2 μs2 ms
Bin1.25 × 1.25 mm25 × 25 m
Dominant frequency500 kHz25 Hz
Table 3. Correspondence between fractured reservoirs and responses in the top of the Yingshan Formation.
NumberDipping AngleFormImageWaveformFrequency
A7Applsci 14 03775 i001Applsci 14 03775 i002Applsci 14 03775 i003Applsci 14 03775 i004
A110°Applsci 14 03775 i005Applsci 14 03775 i006Applsci 14 03775 i007Applsci 14 03775 i008
A220°Applsci 14 03775 i009Applsci 14 03775 i010Applsci 14 03775 i011Applsci 14 03775 i012
A330°Applsci 14 03775 i013Applsci 14 03775 i014Applsci 14 03775 i015Applsci 14 03775 i016
A470°Applsci 14 03775 i017Applsci 14 03775 i018Applsci 14 03775 i019Applsci 14 03775 i020
A580°Applsci 14 03775 i021Applsci 14 03775 i022Applsci 14 03775 i023Applsci 14 03775 i024
A690°Applsci 14 03775 i025Applsci 14 03775 i026Applsci 14 03775 i027Applsci 14 03775 i028
Disclaimer/Publisher’s Note: The statements, opinions and data contained in all publications are solely those of the individual author(s) and contributor(s) and not of MDPI and/or the editor(s). MDPI and/or the editor(s) disclaim responsibility for any injury to people or property resulting from any ideas, methods, instructions or products referred to in the content.

