Article

Multi-Objective Optimization for Winter Heating Retrofit in Rural Houses of Cold Regions: A Case Study in the Wusu Area

1
School of Architecture and Art, Hebei University of Engineering, Handan 056009, China
2
School of Architecture, Tianjin University, Tianjin 300072, China
*
Author to whom correspondence should be addressed.
Appl. Sci. 2024, 14(9), 3760; https://doi.org/10.3390/app14093760
Submission received: 26 March 2024 / Revised: 22 April 2024 / Accepted: 25 April 2024 / Published: 28 April 2024
(This article belongs to the Section Applied Thermal Engineering)

Abstract

:
In regions of China experiencing severe cold, the duration of the winter heating season significantly contributes to elevated heating energy consumption in rural dwellings. This study focuses on typical brick-and-concrete rural homes in the Wusu area. Utilizing the Rhino–Grasshopper parametric modeling platform, it aims to minimize heating-related carbon emissions and the overall costs associated with retrofitting. The approach involves improving the insulation properties of the building envelope to reduce energy requirements. Additionally, the study incorporates solar photovoltaic systems atop rural homes, building upon low-carbon, passive, energy-efficient design principles. By examining the influence of various factors on rural housing energy consumption, the research employs the entropy weight method to identify the most effective design solutions. The goal is to explore strategies for the energy-efficient retrofitting of rural dwellings in areas faced with harsh winter conditions, aligning with the objectives and preferences of Applied Sciences. The simulation results reveal the following: (1). In comparison with the baseline scenario, 42.2% of the optimized solutions within the Pareto frontier satisfy the current standards for 75% energy savings in energy-efficient residential design. (2). The lowest recorded thermal consumption index for the buildings can reach 12.427 W/m2, at which point the rate of energy savings is elevated to 79.5%. (3). Within the solutions identified by the Pareto frontier, 80% exhibit initial investments that are lower than the cost savings over the lifecycle due to reduced energy consumption ( d C g < 0), demonstrating the economic feasibility of the proposed retrofitting strategies.

1. Introduction

As the number of rural dwellings in village areas continues to rise, undertaking energy-saving and consumption reduction retrofits on these structures is of immediate practical importance. According to the “China Building Energy Efficiency Annual Development Report 2020 (Rural Housing Special Topic)”, approximately 110 million tons of standard coal equivalent (tec) are consumed in rural area buildings, leading to about 420 million tons of CO2 emissions from building operations [1,2]. In cold regions, the main energy consumption of rural residences occurs during the heating season. Specifically, in the Wusu area, the heating period extends to 183 days, with historical temperatures dipping as low as −29 °C. Furthermore, scattered coal remains the predominant heating method during winter in Wusu, with coal consumption far exceeding electricity use and displaying an annual increasing trend. This situation underscores the urgent need for energy efficiency and carbon reduction efforts.
Recent research has extensively explored the energy consumption renovation of existing buildings, with some scholars achieving mature studies in the energy consumption simulation and renovation of the enclosing structures of rural houses. For instance, Furtado A and others have enhanced the energy efficiency of existing buildings by up to 70% through the renovation of enclosing structures with different materials filled into the masonry of exterior walls [3]. Faezeh Bagheri Moghaddam and colleagues have shown that constructing green walls on the south-facing side of buildings can reduce overall energy consumption by 28% [4]. LM López-Ochoa and others optimized the insulation thickness of walls and roofs to significantly lower total heating costs [5]. Zhao J’s analysis revealed that the total heating demand during the heating season was reduced by 52.5% after renovating all enclosing structures [6]; Hou J and others increased the insulation thickness of the exterior walls of rural traditional houses, improving the energy-saving rate by 29.5% [7]. Huang J and others conducted an energy-saving renovation of existing residential buildings based on the whole lifecycle cost, finding that enhancing window performance did not necessarily achieve the best economic benefits [8]. Ma L and others selected the optimal solution for adding sunspaces to rural houses in severely cold areas through the entropy method, concluding the best optimization scheme for these added sunspaces [9]. Wang J utilized OpenStudio for numerical simulations of annual energy consumption in tubular houses, discovering that energy consumption could be reduced by 1.6% to 30.5% through various retrofit measures. The study posits that employing solar energy in sunrooms is the most effective strategy, with an energy-saving rate of 28% [10]. Shao T evaluated the impact of different design factors on heating energy consumption through simulations on typical architectural models. The research optimized a combination of design parameters for reducing energy consumption in Zhalantun rural residences, establishing a hierarchy and significance of design factors affecting energy consumption [11]. Tahsildoost employed a multi-criteria decision-making tool to prioritize retrofitting strategies for rural houses under various climatic conditions [12]. Lili Zhang and colleagues discovered a positive correlation between the proportion of Trombe walls on the southern side of buildings and the indoor temperatures [2]. In their empirical study on ultra-low-energy buildings, Schnieders et al. found that heating energy consumption was reduced by 80% compared to conventional buildings, while overall energy savings reached 50% [13]. T.I. Neroutsou and team identified an optimal retrofit strategy for residential buildings in London, achieving a 61% reduction in total energy consumption and an 85% decrease in thermal load [14]. Raphael Wu and his research group concluded that optimizing the external walls or overall building enhancements during the winter can decrease heating requirements by more than 50% [15]. Charisi et al. reported a 13.65% reduction in energy consumption after installing 200 mm of expanded polystyrene insulation on building exteriors [16]. Using DesignBuilder software, Liang X focused on retrofitting the exterior and window structures of rural homes in Beijing, noting an approximate 60% savings in annual heating energy post-retrofit [17]. YeR and collaborators demonstrated that incorporating Trombe walls and solar absorption coatings in cold regions can lead to a 40% savings in building energy consumption [18]. It is evident that factors such as building orientation, ventilation performance and air tightness, solar radiation gain, window-to-wall ratio (WWR), and window shading mutually influence the thermal performance and energy efficiency of buildings [19,20].
Some scholars have focused on building energy-saving renovations that combine passive and active strategies, verifying the good applicability of solar energy systems in severely cold regions, which are economically advantageous and have significant energy-saving and emission-reduction effects [21,22]. Shahryar Habibi and others studied energy-saving renovations involving the addition of photovoltaic panels, EPDM membranes, and insulation layers to roofs, finding that such renovations could reduce energy consumption and enhance overall building performance [23]. Kapicioglu, A, and others demonstrated the cost-effectiveness of ground-source heat pumps in remote areas through simulations of these systems supported by a hybrid renewable energy-powered generation system using eQUEST [24]. Liu Q and others optimized the architectural structure and insulation measures of rural houses through orthogonal experiments and designed a solar-assisted heating system for energy savings [25]. Xu J studied the addition of solar photovoltaic systems to passive rural house renovations, showing good economic benefits [26]. Gao Y and others renovated rural houses under low-carbon and zero-carbon scenarios, indicating that both passive and active energy-saving renovations significantly improve the carbon emissions of rural houses [27]. Further, some scholars have analyzed the energy-saving renovations of buildings using actual measurement data, with practical results demonstrating significant energy-saving effects in renovated rural houses, as shown by Li J and others comparing the heating energy consumption differences between solar active heating and traditional small coal-fired boilers [28]. Zhang Ye proposed a new type of solar thermal storage floor radiant heating system for office buildings in Urumqi based on experimental setups [29], and Li J tested the indoor thermal environment of rural houses before and after renovation, indicating a significant energy-saving effect post-renovation [30]. Luo C’s research identified the most effective energy-saving measures for energy-efficient buildings as improving the performance of air conditioning systems and enhancing the thermal performance of walls and windows [31]. Chen Y proposed a comprehensive energy system based on Solar-Assisted Ground Source Heat Pump (SGSHP), achieving performance coefficients of 4.2 with solar collectors installed and 3.5 without [32]. Ma L conducted an analytical study on the impact of utilizing solar spaces on the heating energy consumption of rural residences, focusing on three aspects: type of glass in solar spaces, type of filling gas, and thickness of the gas layer [33]. Aleksandra Siudek and others studied the energy efficiency and CO2 emissions of renewable energy in new construction and renovations in rural areas [34]. Gang Li and colleagues proposed a new method of energy utilization in rural areas, demonstrating that rooms heated with the new system are more comfortable and economically perform better than those with traditional systems [35].
The optimization design of building envelopes is a prerequisite for improving building performance. With the development of science and technology, the use of performance simulation and algorithm optimization to achieve multi-objective optimization of building performance has become widely used in architectural design and retrofitting. In the field of architecture, multi-objective optimization can be linked with energy consumption simulation software such as EnergyPlus, Ecotect, and TRNSYS and with software like MATLAB or Python to focus on optimizing energy savings, carbon emissions, and economic performance [36]. Chen and others have developed an optimization framework on the Python platform to simulate the minimum carbon emissions, indoor discomfort hours, and overall costs of buildings [37]. Ascione and colleagues integrated EnergyPlus and MATLAB tools to optimize the energy consumption, thermal comfort, economic, and environmental impacts of office buildings, obtaining Pareto frontier solutions [38].
Researchers have combined architectural simulation tools such as Ecotect and EnergyPlus with optimization algorithms to identify optimal energy-saving solutions [39]. Moreover, these optimization algorithms can balance choices between the set objective functions and constraints of the design variables [40]. Among these, genetic algorithms are favored for handling non-linear problems in building performance optimization and for exploring global optimal solutions while avoiding local optima [41]. Scholars have applied genetic algorithms to optimize building energy consumption [42,43].
In recent years, architectural performance simulation and optimization have often been conducted on the parametric platform Rhino–Grasshopper, utilizing energy plugins such as Ladybug Tools and Honeybee. Typically, simulations for building energy consumption are conducted based on relevant algorithms, using building energy consumption as either a single objective or incorporating it within multi-objective optimizations. Kiss B and colleagues developed an optimization framework for apartment residences using variables such as geometric shape, envelope construction, shading devices, and types of heating sources, which improved the environmental impact performance by 60–80% [44]. Ana Vukadinović and others optimized residential buildings based on energy consumption and thermal comfort, proposing solutions based on analysis of Pareto frontier solutions [45]. N. Abdou and colleagues performed multi-objective optimization on residential buildings based on an economic efficiency, energy consumption, and thermal comfort standards, selecting building orientation, window types, window-to-wall ratio, thermal transmittance of the envelope, and permeability as parameters for retrofitting [42]. N. Abdou and colleagues conducted multi-objective optimization on residential buildings based on economic, energy consumption, and thermal comfort criteria. They demonstrated that improving the building envelope effectively reduces energy consumption, achieving energy savings of over 21% in the Morocco region [42].
CNY Y. and others used the Octopus plugin for parametric modeling of dormitory building clusters to optimize the building’s spacing, floor height, and balcony width [46]. Yu H. constructed a multi-objective optimization model for a library in a cold region, focusing on building energy consumption and indoor light environment, and conducted a simulation analysis to optimize the atrium space [47]. Tian Y. used a genetic algorithm to optimize office buildings in cold regions, studying the relationship between design parameters, building energy consumption, and light-thermal comfort [48]. Gao Y. and others built an optimization design framework for rural residences in the north, aiming to reduce heating energy consumption and improve thermal comfort, and analyzed design solutions for L-shaped and U-shaped rural houses [49]. Xu K. and Wang Y. used performance objectives such as thermal climate index, heat radiation, and sky openness, employing Ladybug and Honeybee simulation plugins and the Wallacei genetic optimization plugin, to optimize the architectural layout of university campuses [50].
Existing studies primarily focus on the retrofitting of building envelopes. With the advancement of energy conservation and carbon reduction efforts, there has been a gradual integration of renewable energy sources to lower the energy consumption of rural dwellings. However, a comprehensive optimization strategy for the energy retrofit of existing rural houses in severely cold areas remains lacking. This paper selects single-story brick–concrete rural houses in the Wusu area as the research subject, aiming to optimize their energy efficiency with a focus on reducing carbon emissions and retrofit costs during the heating period. Using the current operational conditions of these rural houses as the baseline model, the study explores retrofitting the building envelope and applying solar photovoltaic systems. The goal is to provide beneficial references for the retrofit of rural houses in the Wusu area and theoretical support for the construction of new rural residences.

2. Research Methods

2.1. Multi-Objective Optimization Algorithm

Intelligent optimization algorithms are a category of algorithms inspired by natural and social behaviors, designed to solve complex optimization problems, particularly those that are difficult to address with traditional mathematical methods. These algorithms typically exhibit strong global search capabilities, effectively finding near-optimal solutions within vast search spaces. Key intelligent optimization algorithms include genetic algorithm (GA), particle swarm optimization (PSO), ant colony optimization (ACO), simulated annealing (SA), and others.
In the realm of intelligent algorithms, genetic algorithms (GAa) and their improved versions play a dominant role, followed by particle swarm optimization (PSO) [51]. Basic genetic algorithms primarily focus on single-objective optimization, iterating towards optimal solutions through selection, crossover, and mutation processes. The NSGA-II (Non-dominated Sorting Genetic Algorithm II), developed by Srinivas and Deb, is among the most widely used genetic algorithms. It is a rapid, non-dominated, multi-objective optimization algorithm based on Pareto optimal solutions [52,53]. NSGA-II’s elite preservation strategy ensures that high-quality individuals from the parent population are directly carried over to the next generation, preventing the loss of non-inferior solutions. This algorithm is known for its fast performance, high efficiency, and strong convergence, simplifying the complexity of non-inferior quality genetic algorithms [54].
Researchers like Penna have utilized TRNSYS combined with the NSGA-II genetic algorithm for optimizing single-family homes, aiming to reduce energy costs and discomfort times, with results showing more than a 57% reduction in energy consumption [55]. Chaturvedi, S., has demonstrated the application of the NSGA II algorithm in multi-objective building optimization under operational uncertainties [56]. Rabani proposed an optimization solution for automatically identifying the best configurations of windows, envelopes, shading systems, and energy supply systems for an office building in Norway [57]. Ascione combined Energy Plus with NSGA-II to optimize the design of residential buildings in Spain, balancing window sizes, types of glass, and external walls and roofs for heating and cooling demands [58]. Ferrara used the PSO algorithm in GenOpt to optimize buildings for energy, cost, and acoustic performance, while also incorporating analyses with the NSGA-II algorithm [59]. Delgarm, taking buildings in Iran as an example, used Energy Plus and NSGA-II for optimizing building orientation, window area, and window shading, showing a total energy consumption reduction of 23.8–42.2% [60].
As research and the evolution of algorithms progress, scholars are also experimenting with a variety of algorithms like NSGA-III [37,61], SPEA-II [62], HypE [63], MOPSO, and MOEA/E [41,64]. Usman, M., and others achieved optimal passive design for single-family homes in different climates by coupling the NSGA-III genetic algorithm with the building energy simulation tool TRNSYS [65]. Mostafazadeh used an improved version of the NSGA-III algorithm, prNSGA-III, as the research optimization algorithm [61].
From the above, it’s clear that researchers have employed various evolutionary algorithms to optimize architectural design. Delgarm and others used the multi-objective artificial bee colony (MOABC) algorithm to maximize building energy efficiency and indoor thermal comfort in different climate zones of Iran [66]. Delgarm and his team also used the multi-objective particle swarm optimization (MOPSO) algorithm to evaluate schemes based on annual heating, cooling, and lighting energy consumption standards [67]. Hamdy and others compared commonly used optimization algorithms in architectural design, including NSGA-II, MOPSO, two-phase optimization using a genetic algorithm (PR GA), elitist non-dominated sorting evolution strategy (ENSES), and multi-objective dragonfly algorithm (MODA), with PR GA showing higher repeatability and a larger solution space, followed by NSGA-II [68].
Ant colony optimization (ACO) is a metaheuristic algorithm inspired by the behavior of ants [69]. It is a global stochastic optimization algorithm capable of solving complex nonlinear problems without the need for derivatives of the objective function. Initially developed for discrete optimization problems, it has evolved to address continuous variables, leading to the development of continuous domain ant colony optimization (ACOr). Bamdad K and others have conducted extensive research on the ant colony optimization algorithm (ACO), developing the continuous domain ant colony optimization (ACOR) algorithm in 2017 for optimizing commercial buildings in Australia, and comparing ACOR with the Nelder–Mead (NM) algorithm, particle swarm optimization with inertia weight (PSOIW), and a hybrid particle swarm optimization with the Hooke–Jeeves (PSO-HJ) algorithm. Results showed that ACOR could find better solutions in less time, saving over 11.4% of energy even with common energy-saving measures [70]. In 2018, Bamdad K, and others developed a modified version of the ant colony optimization algorithm for mixed variables (ACOMV-M), which converged to similar quality solutions with about 50% fewer simulations [71]. Subsequently, ant colony optimization was applied in model predictive control directions, with Bamdad, K. and others using ant colony optimization (ACO) algorithms from different starting points to solve multiple model predictive control (MPC) optimization problems, demonstrating that ACO provides high-quality optimized control sequences while also requiring shorter computation times, achieving fairly good solutions within 15 min [72].
This research faces a classic multi-objective decision-making problem, aiming to find a reasonable balance between minimizing per-unit building area heating carbon emissions and overall cost minimization. Although using efficient insulation materials and incorporating photovoltaic technology can effectively reduce energy consumption and carbon emissions, this typically comes with higher initial investments and maintenance costs. Conversely, aiming to minimize costs may correspond to a high-carbon emission scheme. To address this conflict, this study opts to use the NSGA-II algorithm provided by the Wallacei X 2.7 tool for optimization. This algorithm generates a range of Pareto frontier solutions, offering multiple trade-off options between carbon emissions and costs. Through the visual display of these solutions, decision-makers can more clearly see the trade-offs between different schemes, thereby making a choice between the two objectives.

2.2. Selection of Multi-Objective Decision-Making Methods

Facing the Pareto frontier solutions derived from multi-objective optimization, decision theory is applied for further analysis and decision-making. Common decision theories include multi-criteria decision analysis (MCDA), group decision theory, and behavioral decision theory, among which MCDA is commonly used to assess multiple feasible solutions on the Pareto frontier. By weighing the importance of different objectives, MCDA can help decision-makers choose the most suitable solution. Common methods include the weighted sum method, the analytic hierarchy process (AHP), and the technique for order preference by similarity to the ideal solution (TOPSIS).
When the results of multi-objective optimization require selection by a team or group, group decision theory can be chosen. Issues studied in group decision-making typically have characteristics of autonomy, coexistence, and consensus. Decision-makers have relatively independent decision-making power and choices, and their decisions or actions are not dominated by power factors, but there may be mutual constraints and influences between decision-makers and other group members. Additionally, members of group decision-making are considered as a whole. The outcomes or actions ultimately made by the group should be schemes that all group members can unanimously accept [73]. Commonly used methods, such as the Delphi method and majority voting, are employed to integrate the preferences of group members to achieve collective decision-making. Li D. and others used the analytic hierarchy process and the Delphi expert consultation method to establish an evaluation system for the energy-saving suitability of nearly zero-energy building envelopes in different climate zones [74].
Behavioral decision theory explores “how people actually make decisions” and “why they make decisions this way”, starting with the Allais paradox in 1953 and the Edwards paradox in 1961 [75]. Behavioral decision theory emphasizes psychological factors in the decision-making process, applicable in multi-objective optimization scenarios where decision-makers can understand how they evaluate different solutions and explore the psychological mechanisms behind their preferences.
In typical multi-objective optimization problems, no single solution can achieve the optimum for all performance indicators simultaneously; all non-dominated solutions are on the Pareto frontier. In this context, the entropy weight method, as an objective weighting method, plays an important role in multi-criteria decision analysis by eliminating the impact of subjective human factors and providing objective evaluation criteria [76]. It is used to determine the weights of various indicators by analyzing the variability of each indicator, effectively avoiding the subjectivity of weight determination and the problem of information overlap between multiple indicators.
Facing the Pareto frontier solutions derived from multi-objective optimization, decision-makers need to apply appropriate decision theories for further analysis and selection. Common decision theories include multi-criteria decision analysis (MCDA), group decision theory, and behavioral decision theory. Among these theories, MCDA is particularly suitable for evaluating multiple feasible solutions on the Pareto frontier, allowing decision-makers to identify which schemes best meet their preferences by comparing the relative advantages of different solutions. Common MCDA methods include the weighted sum method, the analytic hierarchy process (AHP), and the technique for order preference by similarity to the ideal solution (TOPSIS), each with its own unique advantages and applicable in different situations. The weighted sum method is suitable when decision-makers can clearly quantify the weight of each objective; AHP helps decision-makers understand and evaluate each decision criterion through pairwise comparisons; while TOPSIS makes decisions based on the comparison of each scheme’s distance from an ideal solution.
When determining the relative importance of each objective, objectivity is crucial. The entropy weight method provides an objective way to determine the weights of various decision criteria, reflecting the amount of information and variability of the criteria. The smaller the entropy value of an indicator, the lower its uncertainty and the greater its weight, indicating its higher importance in the evaluation. C. L. Hwang and K. Yoon proposed the TOPSIS method, which ranks alternatives based on the shortest distance to the ideal solution and the furthest distance from the negative ideal solution [77]. The entropy weight method is an objective way to determine weights, used in the TOPSIS method to determine attribute weights [78].
Combining the entropy weight method with TOPSIS, known as the entropy weight TOPSIS method, not only enhances the objectivity of weight determination but also enhances the scientific and rational nature of the decision-making process. The entropy weight TOPSIS method, by quantifying each scheme’s relative distance to the ideal and negative ideal solutions, provides a clear, quantified decision-support tool, helping to choose the best scheme from many feasible Pareto optimal solutions that meet the needs and context of the decision-makers [76]. Therefore, this paper opts for a comprehensive decision-making based on the entropy weight TOPSIS method, selecting the optimal solution from the Pareto solution set. According to research by Chen and others, normalization is the most commonly used method in entropy weight TOPSIS calculations [79]. The detailed steps of the entropy weight TOPSIS method are as follows:
The entropy weight method is an objective weighting method used in multi-criteria decision analysis to determine the weights of various indicators. By measuring the variability of each indicator, it effectively prevents the subjective determination of weights and the information overlap among multiple indicators. An indicator’s entropy value is inversely proportional to its certainty level; the smaller the entropy value, the lower the uncertainty and, consequently, the higher its weight. This indicates that the indicator has a higher significance in the evaluation [80].
Given that the original data may vary in dimension and magnitude, they are first subject to dimensionless processing through range standardization, with the formula as follows for positive indicators:
r i j = x i j min x i max x i min x i
For negative indicators, the standardization formula is as follows:
r i j = max x i x i j max x i min x i
In the formula, x i j represents the original value of the j-th evaluation object on the i-th indicator, and r i j represents the corresponding standardized value. After standardizing the data, the weight of each indicator is calculated using the following formula:
p i j = r i j j = 1 n r i j
In the formula, n represents the number of evaluation objects.
Entropy is used to measure the variability of an indicator, with the formula as follows:
e i = 1 ln n j = 1 n p i j ln p i j
The coefficient of variation reflects the amount of effective information an indicator carries. The larger the coefficient of variation, the greater the weight of the indicator. The formula is as follows:
d i = 1 e i
Finally, by normalizing the coefficients of variation for all indicators, the weights of each indicator can be obtained. These weights reflect the relative importance of each indicator in the overall evaluation. The formula for this process is as follows:
w i = d i i = 1 m d i
In the formula, m represents the total number of indicators.
The next step involves determining the positive and negative ideal solutions. The positive ideal solution consists of the maximum values from each column, while the negative ideal solution is composed of the minimum values from each column. The standardized matrix Z at this stage is as follows:
Z = z 11 z 12 z 1 m z 21 z 22 z 2 m z n 1 z n 2 z n m
Positive ideal solution:
Z + = Z 1 + ,   Z 2 + , Z m + = m a x z 11 , z 21 , z n 1 ,   m a x z 12 , z 22 , z n 2 , m a x z 1 m , z 2 m , z n m
Negative ideal solution:
Z + = Z 1 + , Z 2 + , Z m + = m i n z 11 , z 21 , z n 1 ,   m i n z 12 , z 22 , z n 2 , m i n z 1 m , z 2 m , z n m
To construct the weighted matrix, each column of the standardized matrix Z is multiplied by the corresponding weights, as shown in the algorithm:
Z = ω 1 z 11 ω 2 z 12 ω m z 1 m ω 1 z 21 ω 2 z 22 ω m z 2 m ω 1 z n 1 ω m z n 2 ω m z n m
The Euclidean distance can be used to calculate the distance between the evaluation object and both the positive and negative ideal solutions, incorporating weights:
D i + = j = 1 m ω j Z j + z i j 2
D i = j = 1 m ω j Z j z i j 2
The distance to the negative ideal solution is used to calculate the evaluation object’s closeness to the optimal solution, with scores ranging from 0 to 1, where a higher score indicates a better result. To calculate the relative closeness of each scheme, the following equation is used:
S i = D i D i + + D i
This method is used to address multi-attribute or multi-criteria decision-making problems, taking into account the weight of each objective to seek a choice under multiple objective trade-offs [81]. Through the genetic algorithm, a set of solutions on the Pareto frontier is obtained, and the relative closeness of the numerous feasible solutions is further calculated. The retrofit scheme with the highest score is considered the best solution. Usman, M., and others used the TOPSIS method to select the optimal design parameters from the Pareto frontier solutions. Mostafazadeh and others also utilized the TOPSIS method to choose the final strategy [61]. Wang, M., and colleagues, based on the entropy weight TOPSIS decision theory, considered the performance objectives of CEC, ADH, NSE, and GC comprehensively, seeking the best trade-off solution from the set of Pareto optimal solutions, resulting in the best energy-saving scheme, the most comfortable scheme, and the best trade-off scheme in terms of passive design parameters [36].
The performance simulation and multi-objective optimization systems are integrated within the Rhino and Grasshopper platforms. Energy consumption simulation calculations are performed using Ladybug and Honeybee to invoke EnergyPlus [82]. The multi-objective optimization algorithm employs the NSGA-II algorithm provided by the Wallacei X tool. The entropy weight TOPSIS method is used to comprehensively rank the Pareto frontier solutions in order to select the optimal rural housing retrofit scheme.

3. Model Development

3.1. Development of the Baseline Rural House Model

Based on the Heating Degree Days (HDD18) and Cooling Degree Days (CDD26) criteria set forth by the XJJ001-2021 “Energy Efficiency Design Standards for Residential Buildings in Severe Cold and Cold Regions”, the Wusu area falls within the severe cold zone 1C. Field surveys were carried out in Dongliang Village, with their specific locations depicted in Figure 1, to collect fundamental data on typical rural houses.
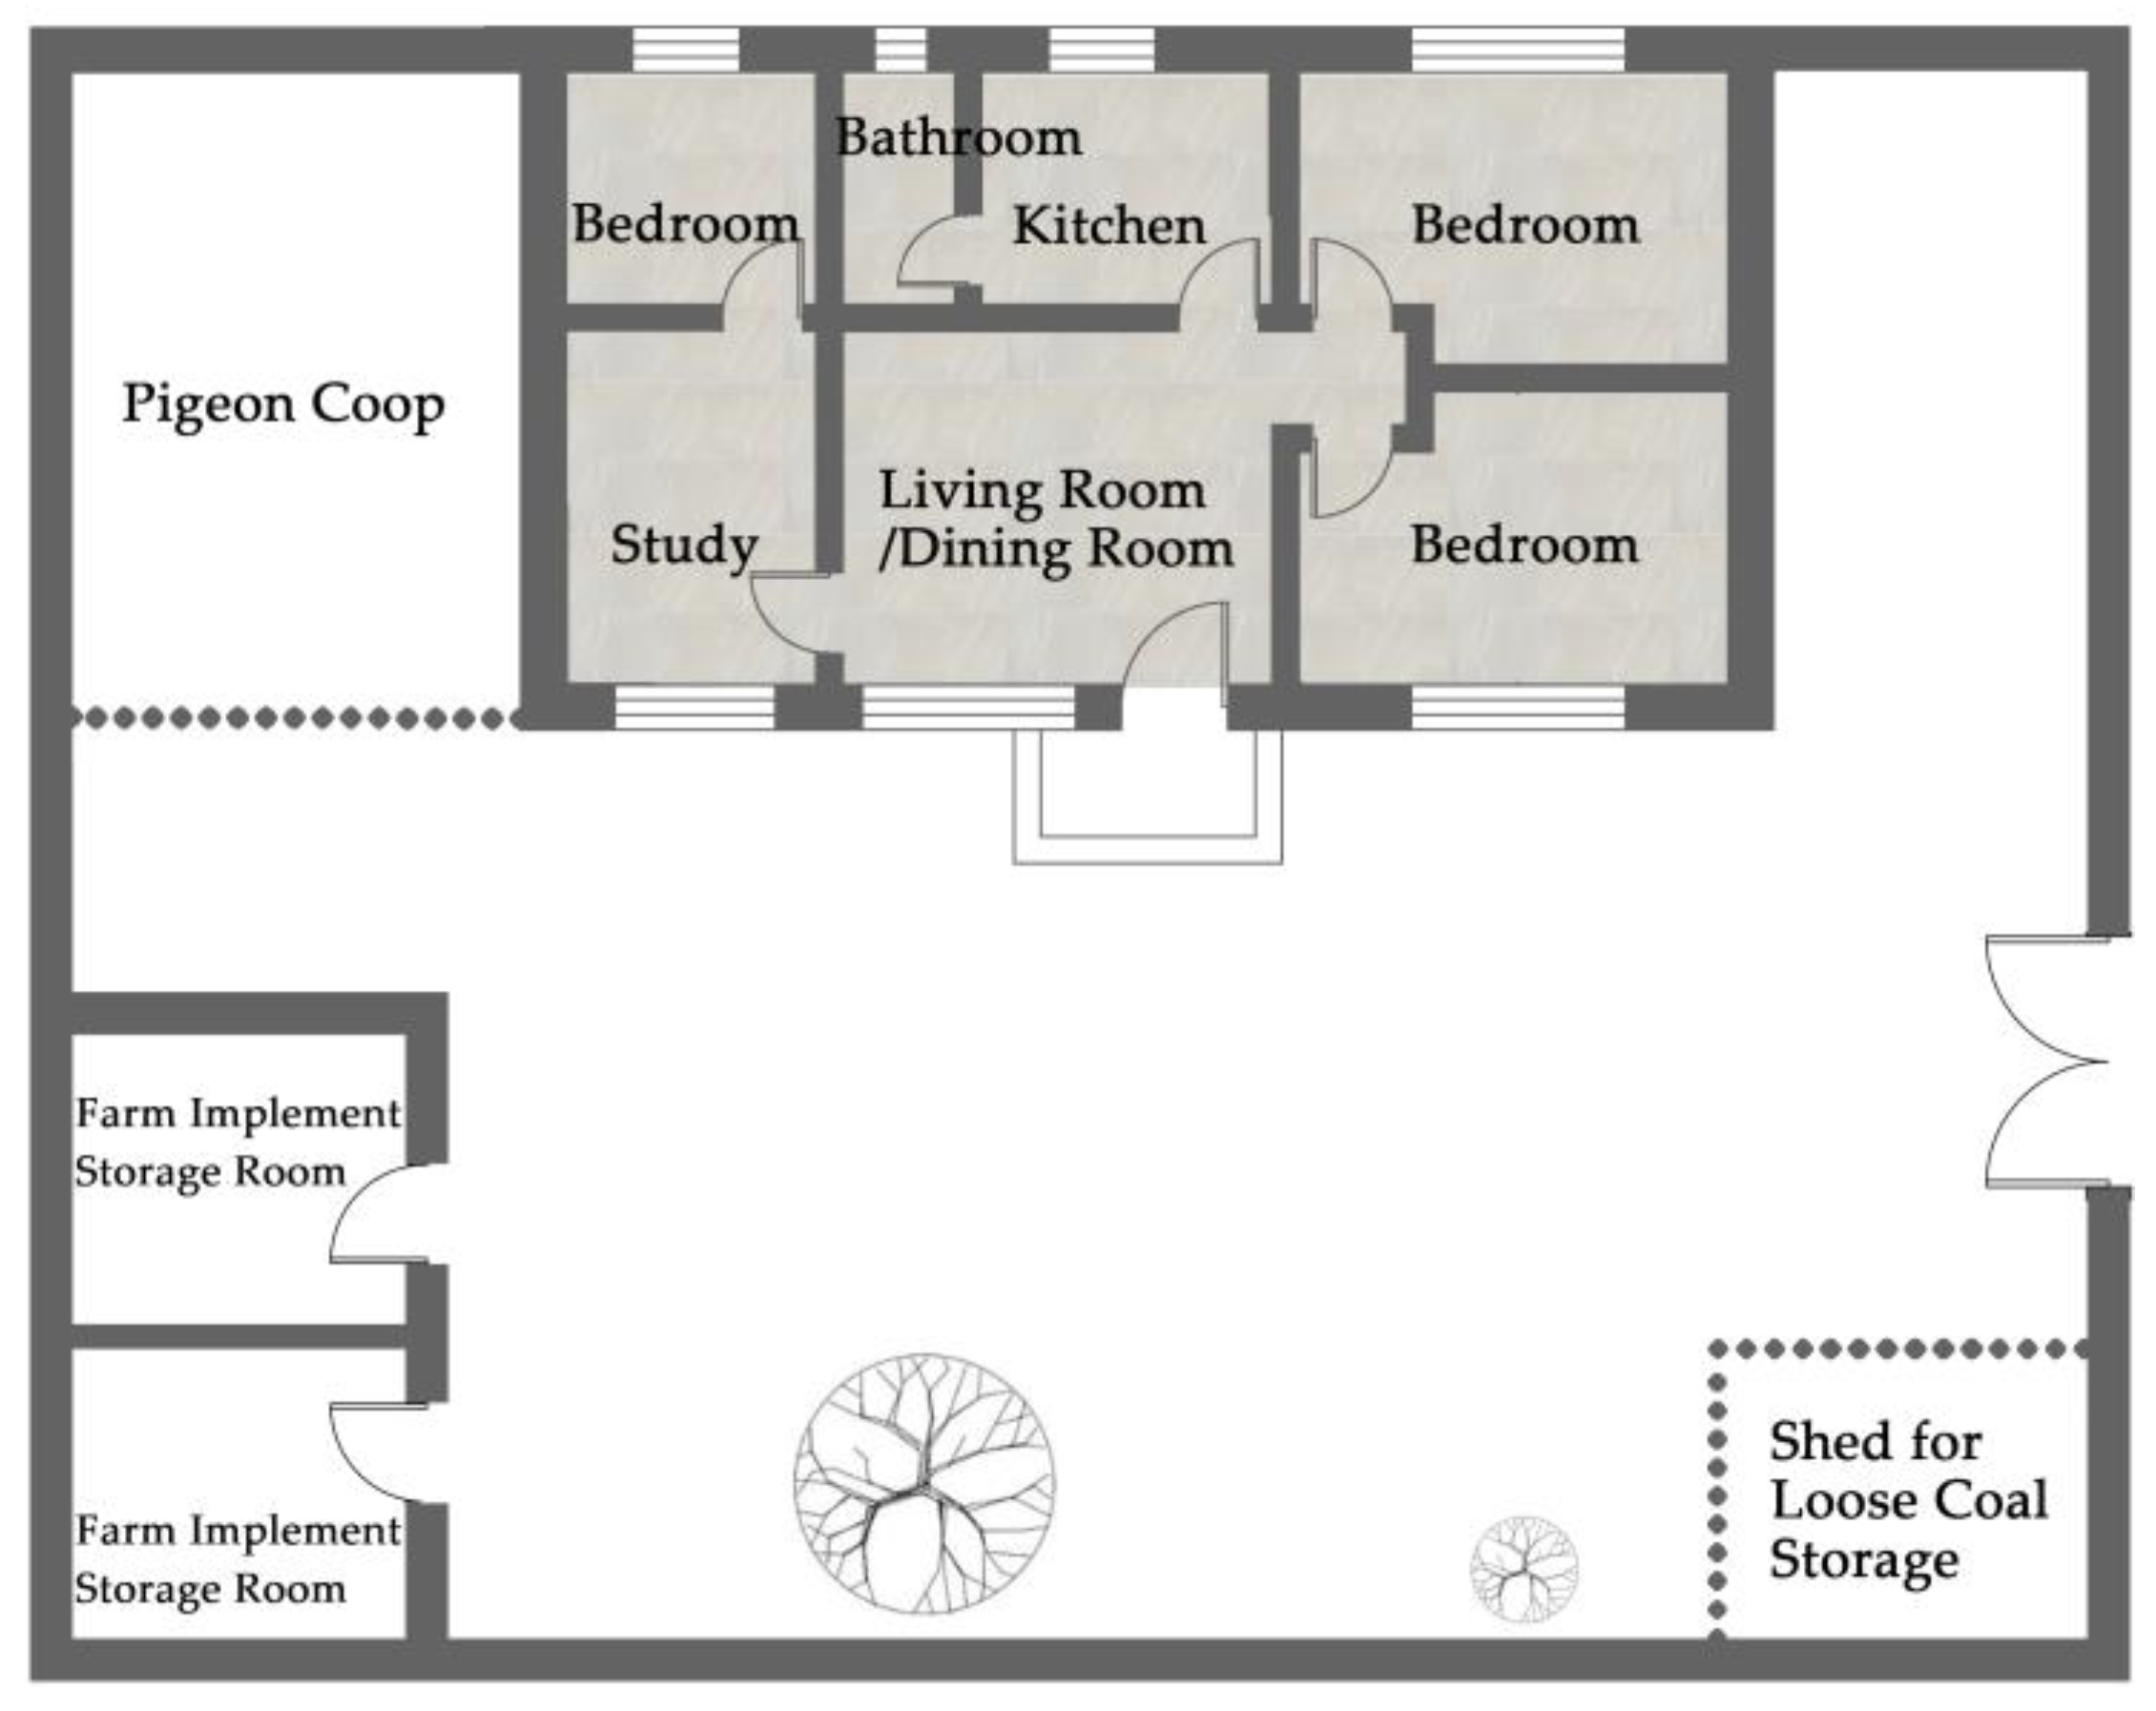
Field research indicates that the primary structural form of rural houses in the Wusu area is brick–concrete construction. The main structures typically feature 490 mm brick walls with roofs made of cast-in-place concrete sloping roofs. Interior floors are compacted earth with a layer of cement mortar or concrete padding before tiling. Windows are generally made of single-layer plastic steel, but due to the construction quality in rural areas, the sealing performance of some windows may not be guaranteed. To combat the cold winter, rural houses tend to minimize their external surface area. A smaller form factor means that the building’s external surface area is relatively small compared to its volume, which helps maintain indoor temperature by reducing heat loss through external walls during winter, thereby reducing heating demands and saving energy. The research shows that the thermal transmittance coefficients of the existing rural residential envelope structures in the Wusu area are all higher than the requirements of energy-saving design standards, and the window-to-wall ratio of the south wall is lower than the specified value of the design standards. A single-story brick–concrete rural house in Dongliang Village was selected as the subject for constructing the baseline rural house model, with model information and construction practices as shown in Figure 2 and Table 1.
For rural residences, it is possible to opt for a household on-grid photovoltaic (PV) power generation system, which connects the solar PV system to the electric grid. Its operational mode involves the solar PV cells producing direct current (DC) electricity under sunlight. Under the overcharge protection of the controller, the current generated by the PV system is converted into alternating current (AC) by the inverter to power the heating equipment, with the surplus electricity fed into the national grid. As the heating duration increases, the proportion of building energy consumption and cost borne by building insulation initially increases and then decreases, whereas the proportion of building energy consumption and cost borne by the solar energy system first decreases and then increases [83].
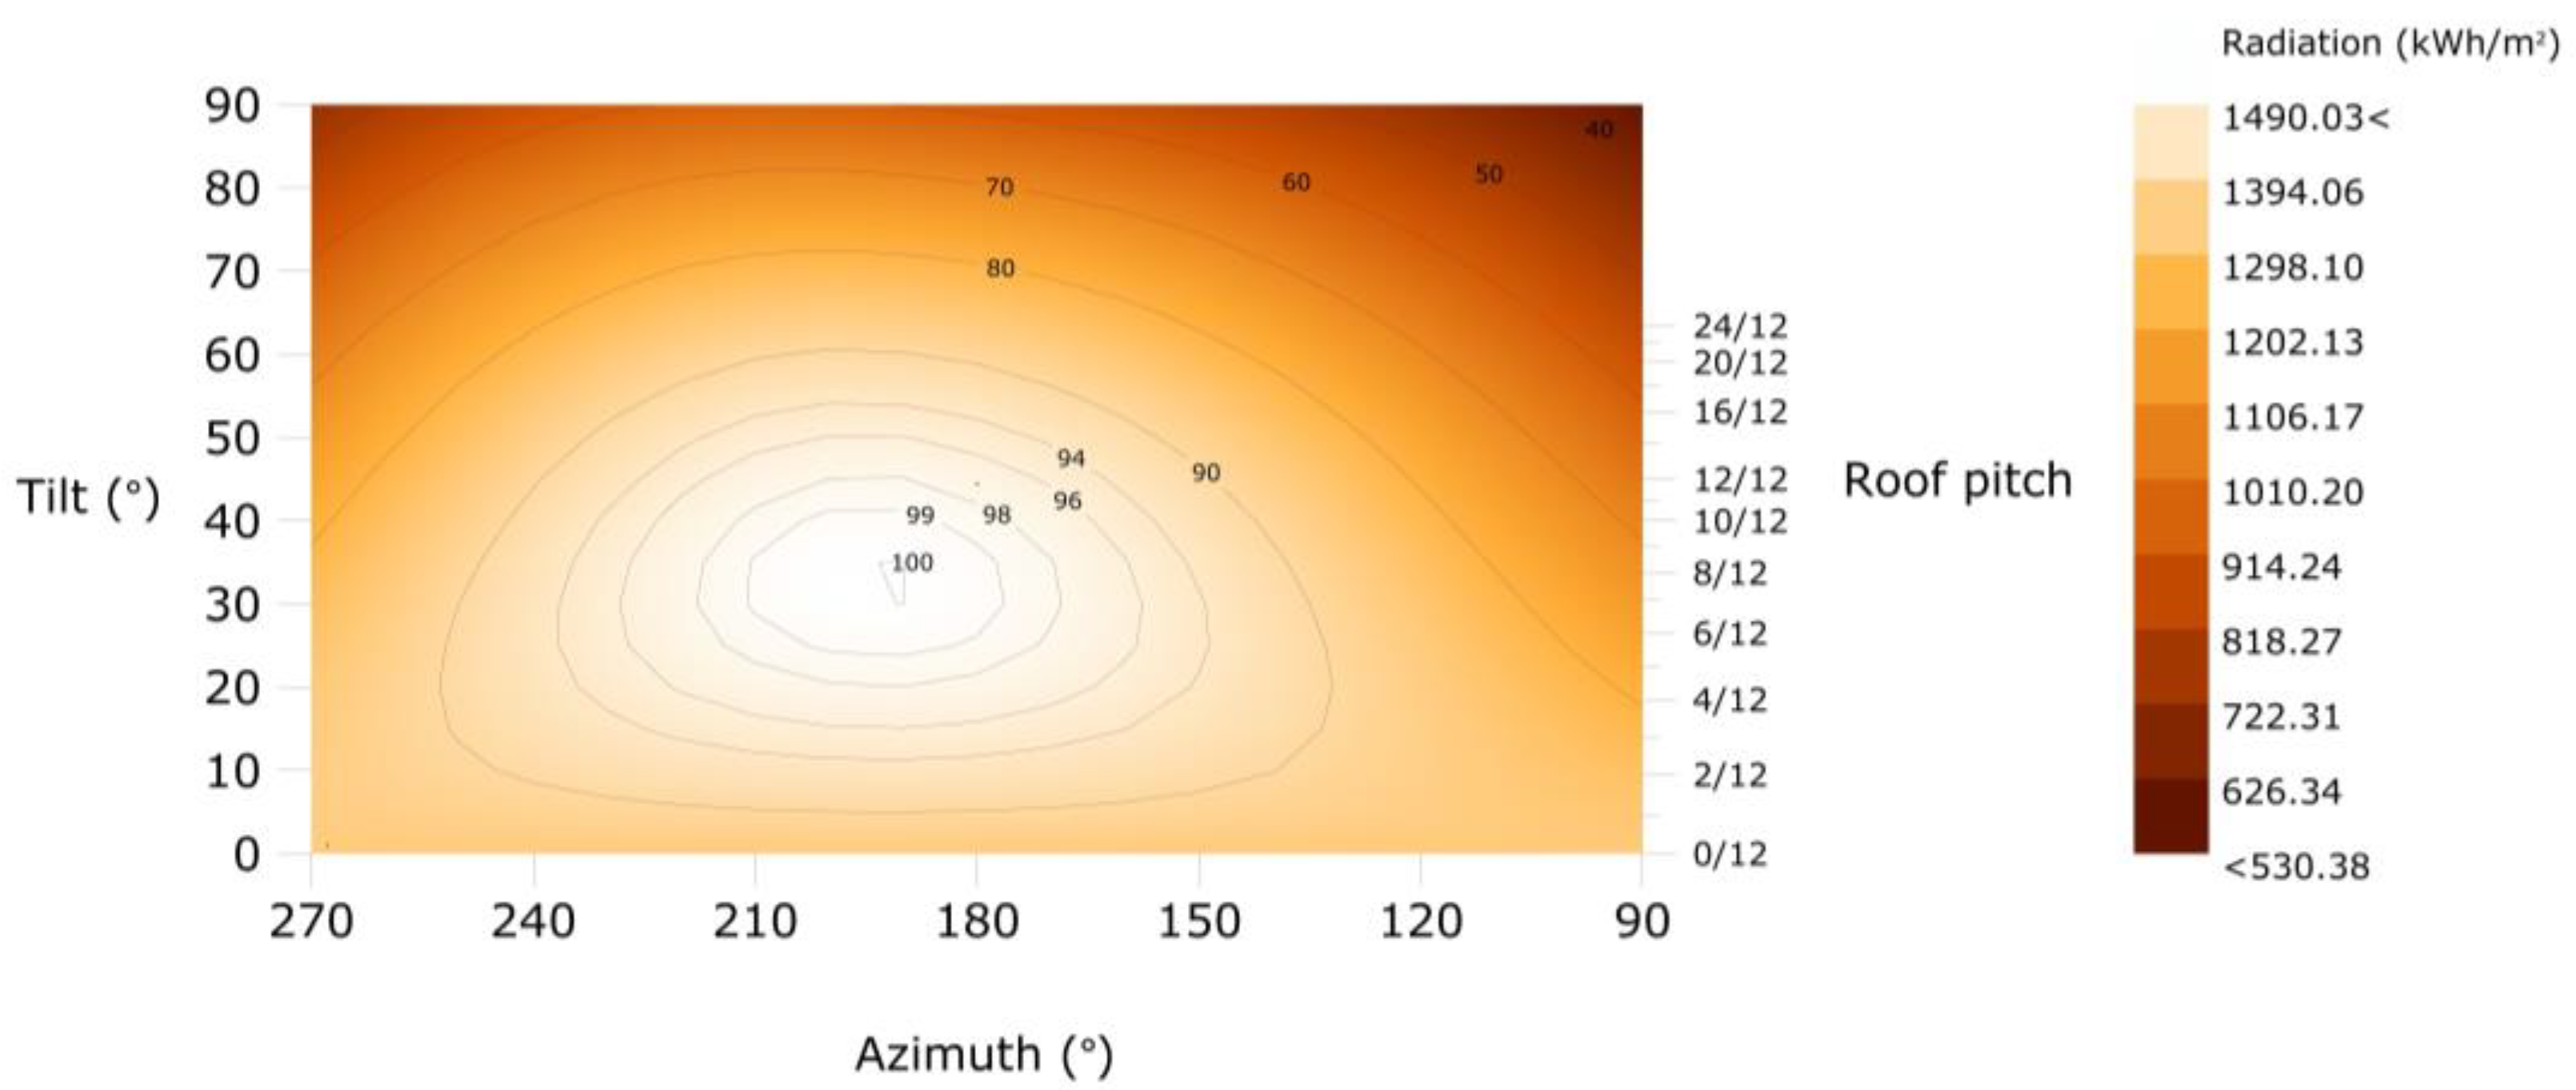
Using Ladybug to analyze solar radiation and the performance of solar photovoltaic (PV) panels in the Wusu area (latitude: 44.43, longitude: 84.67), it was found that the optimal annual tilt angle for installing PV panels in the Wusu area is 35.0°, as shown in Figure 3, with the highest radiation reaching 1490 kWh/m2. However, due to the significant difference in solar radiation between summer and winter, the optimal tilt angles for summer and winter are notably different. The optimal tilt angle for PV panels in summer is 22°, while in winter, due to the lower solar altitude angle, the optimal tilt angle is 54°. It is important to note that when the tilt angle exceeds the optimal value, the amount of radiation received by the PV cells decreases with the increase in tilt angle. Frequently adjusting the tilt angle of the PV panels would increase the cost and maintenance workload. Therefore, to achieve a higher energy collection efficiency throughout the year, this paper selects the annual optimal tilt angle for simulation calculations.

3.2. Operational Parameters of the Baseline Rural House Model

Survey and measured data indicate that during the heating season, the 24-h average indoor temperature in unheated rural houses remains at 4.7 °C. In contrast, in rural houses where heating measures are implemented, the 24-h average indoor temperature was maintained between 16 °C and 25 °C during the period from 20 January to 25 January 2022. This method of maintaining temperature is influenced by the farmers’ own perception of cold and their economic situation [84].
Based on the current status of rural houses and the autonomous region’s building energy-saving design standards, the operational parameters for the baseline rural house model are set as follows: For the severe cold C zone, the heating period is from 15 October to 15 April of the following year, totaling 183 days. Heating equipment operates throughout the day, with the indoor heating temperature set at 20 °C. The indoor person density is 0.02 people/m2, with an average metabolic rate of 0.9 met (1 met = 58.15 W/m2), winter average clothing thermal resistance of 1.2 clo (1 clo = 0.155 m2·K/W), and ventilation rate of 0.5 h−1. Indoor lighting power is 5 W/m2, and equipment power density is 3.8 W/m2, with operating times from 8:00 to 9:00 and 20:00 to 24:00. For the heating period energy consumption simulation, meteorological data in EPW format from the CSWD database of the China Meteorological Administration is used.
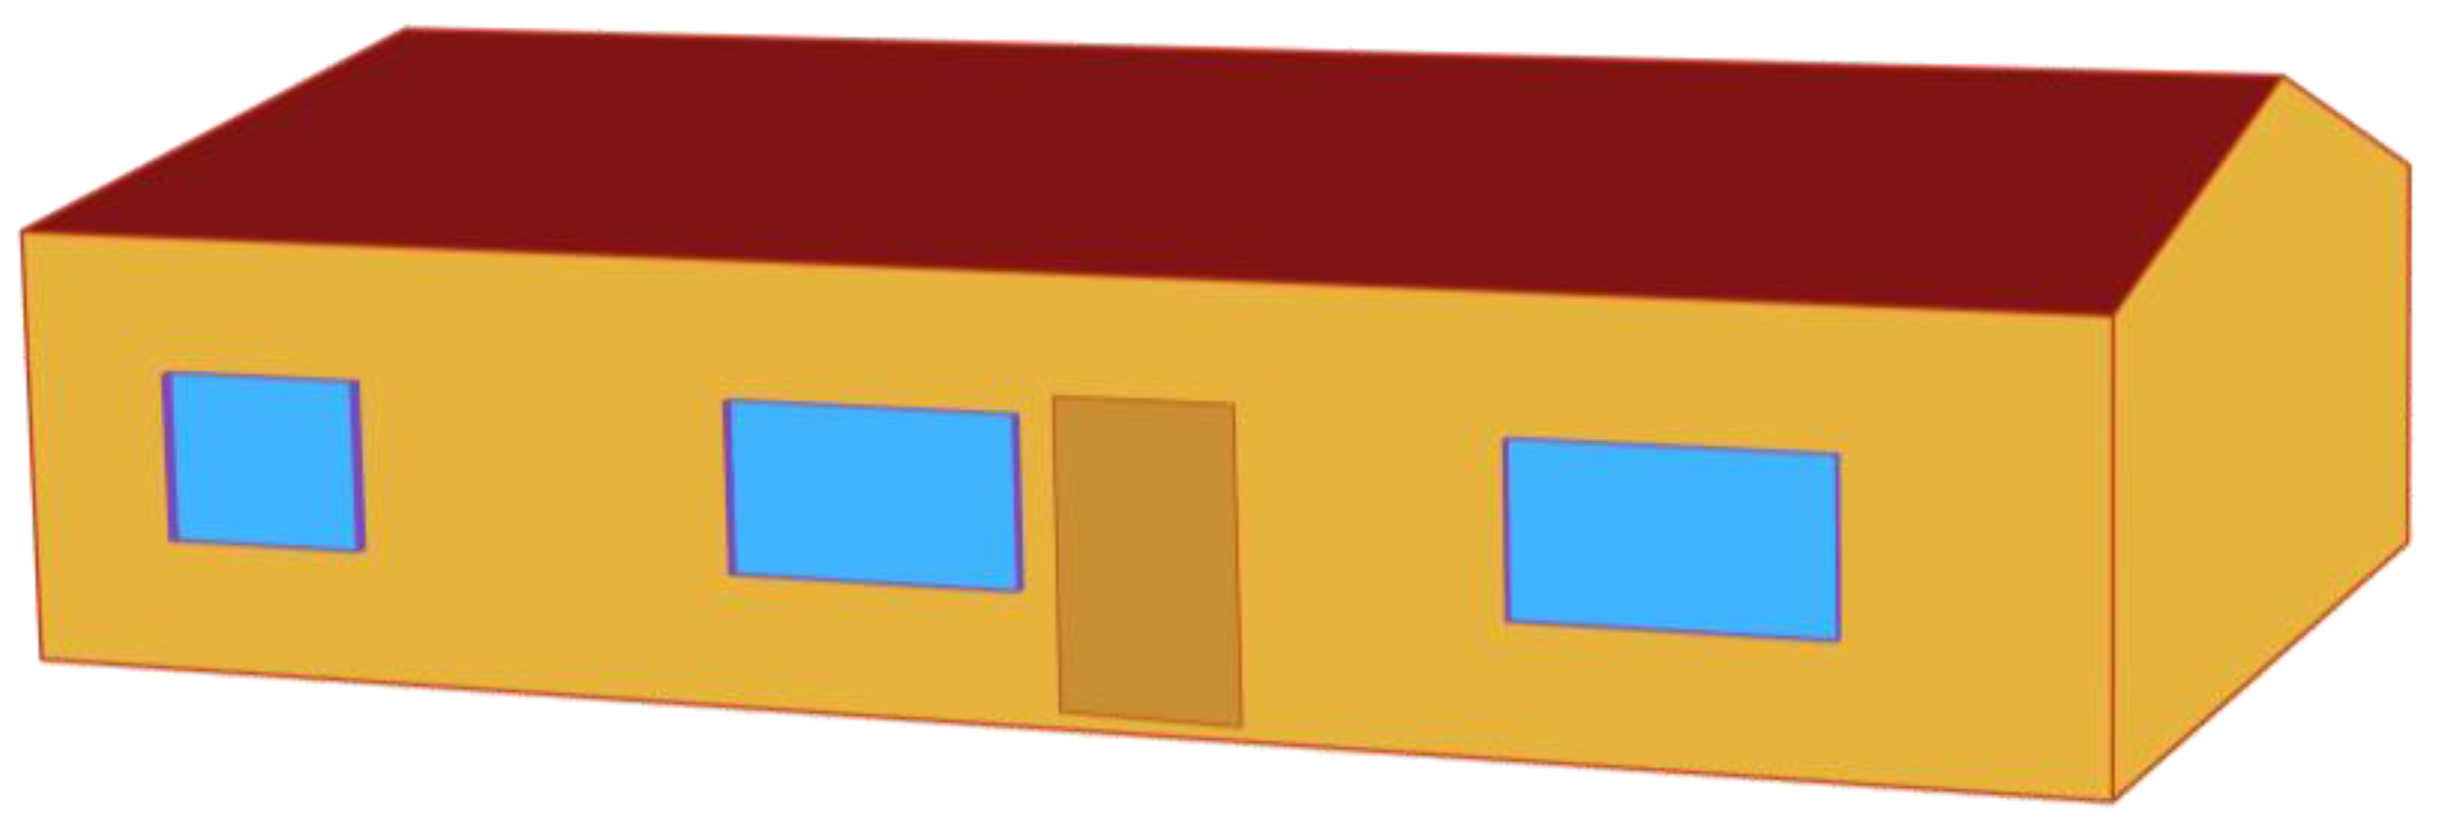
In this study, the building energy consumption model was established using Rhino–Grasshopper, with Ladybug Tools employed as the building performance simulation tool for heating energy consumption simulations. Grasshopper integrates plugins such as EnergyPlus and OpenStudio, and energy consumption calculations are performed using Ladybug and Honeybee to invoke EnergyPlus [82]. Its accuracy has been widely validated [85,86,87]. The benchmark rural dwelling energy consumption model created using Rhino–Grasshopper’s visualization is shown in the Figure 4, with heating energy consumption simulated using Ladybug Tools. The results indicate that as temperatures drop, the demand for heating increases, primarily from November to March of the following year. The total heating energy consumption simulation value is 35,920.08 kWh, as shown in Figure 5b’s heating energy consumption chart; the average winter heating coal usage of 7.2 tons is calculated based on the measured average daily coal consumption during winter for the benchmark rural dwelling, as shown in Figure 5a for daily coal consumption, using Type III bituminous coal. At this time, the thermal efficiency of the heating system is 88%, resulting in a heating energy consumption of 39,312 kWh during the heating period, with an error rate of 8.6% compared to the simulation value. Therefore, the results of the energy consumption simulation calculations are considered quite accurate and reliable.
Rural residences often have smaller capacity photovoltaic systems installed on their roofs, mainly for household electricity use. These systems typically utilize photovoltaic panels, and in some cases, photovoltaic tiles may replace traditional tiles on sloped roofs. This study opts for monocrystalline silicon photovoltaic panels for simulation, installing panels produced by a certain manufacturer at the optimal annual tilt angle of 35°. Table 2 provides detailed parameters of the photovoltaic modules used in the simulation, which employs the Hay diffuse anisotropic model to analyze inclined radiation.

3.3. Baseline Rural House Measure Variable Settings

Based on the constructed model, optimizing the variables of the building envelope involves focusing on the thickness and type of insulation material, which are key to the optimization of the building’s envelope structure. Therefore, the thickness of the insulation layer for external walls and roofs, as well as the type of insulation material, are considered as measure variables. The performance of exterior windows, which is primarily affected by their thermal transmittance (U-value) and size, directly influences indoor heating energy consumption. Hence, the window-to-wall ratio is included as a design parameter to seek optimization that reduces heat transfer losses, effectively decreasing heating energy consumption and improving the building’s heating energy efficiency.
The names of the optimization variables, their value ranges, and initial investment costs are shown in Table 3. The upper limit of the change interval for the insulation layer thickness and the thermal transmittance of external windows encompasses the limits prescribed by the autonomous region’s standards in the “Energy Efficiency Design Standards for Residential Buildings in Severe Cold and Cold Regions”. The prices for insulation materials and doors/windows are set based on data from the Xinjiang government procurement website and market research to ensure the model’s realism and feasibility. The price of EPS insulation board is 260 CNY/m3, XPS extruded board is 600 CNY/m3, and rock wool board is 310 CNY/m3.
In severe cold regions, the effective operation of solar heating systems is highly dependent on the good performance of the building’s envelope structure. When the performance of the envelope structure is poor and the building itself has a high heating thermal load, it becomes impractical for the solar system to provide heating on its own. Therefore, improving the insulation performance of the envelope structure is fundamental to reducing heating energy consumption. In the rural houses of the Wusu area, this paper simulates the use of a hybrid model that combines photovoltaic with electric heating for the heating system. When the solar assurance rate is insufficient, the system switches to electric heating, utilizing subsidized electricity rates to ensure heating efficiency.

4. Objective Function Setting

4.1. Heating Carbon Emissions per Unit Building Area

Surveys indicate that in the Wusu area, rural residents are busier in the fields during the summer, leading to lower occupancy rates during the day and infrequent use of cooling equipment. In contrast, heating is required throughout the day in winter. Therefore, this study targets the carbon emissions from heating per unit of building area during the heating season as the objective for retrofitting the baseline rural house. Meteorological parameters use the typical meteorological year data for Wusu City downloaded from the EnergyPlus official website, with other operational parameters as previously described.
The carbon emissions of a building include those from construction, operation, demolition, and the production and transportation of building materials. After retrofitting, carbon emissions can be defined as the sum of the following components: (1) implicit and direct carbon emissions during the production and transportation of retrofit materials, and (2) direct and indirect carbon emissions from heating and cooling during the operational phase. A life cycle carbon emission analysis is applicable to new construction and may not fully apply to the retrofitting of existing buildings. The electricity consumption by solar photovoltaic systems, which is provided by the systems themselves without consuming external grid electricity, is therefore not considered in the carbon emission calculations, as solar systems contribute to reducing electricity consumption for heating.
Currently, there are four main methods for calculating carbon emissions internationally: the measurement method, the input–output method, the material balance method, and the emission factor method [88]. The emission factor method calculates carbon emissions based on the statistical average amount of gas emitted per unit of product produced under normal economic and management conditions [89]. This paper focuses on the impact of different retrofit measures on carbon emissions during the heating period, paying particular attention to heating carbon emissions in the operational phase after retrofitting, using the emission factor method to calculate C E C O 2 values. Lower values indicate better environmental performance of the building. According to the basic formula revised by IPCC in 2006, “Greenhouse gas emissions = Activity data × Emission factor”, the accounting scope considers only CO2 greenhouse gases, with the calculation formula as follows:
C E C O 2 = E × E F C O 2
In the formula, C E C O 2 represents the carbon emissions per unit area of heating for the rural house, measured in kgCO2/m2; E is the heating energy consumption per unit building area, measured in kw·h/m2; C E C O 2 is the CO2 emission factor for a specific type of energy, measured in kgCO2/KW·h [90]. For electricity, E F C O 2 adopts the value from the “2019 Annual Emission Reduction Project Regional Power Grid Baseline Emission Factor for China” for the northwest regional power grid, which is converted to 0.8922 kgCO2/KW·h.

4.2. Global Cost

The economic evaluation indicators for a building’s lifecycle typically include Net Present Value (NPV), Annuity (NA), Internal Rate of Return (IRR), Cost-Effectiveness Ratio (a), and Payback Period, among others. In the recast of the EU Energy Performance of Buildings Directive (EPBD) 2010, global cost (Cg) is introduced as an indicator to measure the economic efficiency of energy-saving buildings throughout their lifecycle. Global cost considers the initial incremental investment costs brought by energy-saving technologies and the benefits from energy cost savings during the calculation period. This indicator calculates costs associated only with energy-saving technology-related components, including insulation layers and exterior windows, excluding the costs of building structural base components, as well as costs arising from material transportation and environmental impacts of construction. This allows for a preliminary assessment of the lifecycle economic efficiency of buildings during the retrofitting phase [91].
The difference in global cost before and after retrofitting the baseline rural house, d C g , is the difference between the global cost after retrofitting, C g j , and the global cost before retrofitting, C g r e f . This difference intuitively reflects the lifecycle benefits brought by the retrofit investment. The calculation formula is as follows:
d C g = C g j C g r e f
C g j = C 1 + i = 1 25 C e , i × R d i A f l o o r
R d i = 1 + 1 + R R i R R
R R = R i R e 1 + R e
In the formula, C 1 represents the initial investment cost (in CNY); C e , i is the energy cost in the year i (in CNY), with an annual energy cost increase rate of 3.5%; R d i is the discount rate in the year i; A f l o o r is the total building area in square m2; R R is the real interest rate; R e is the energy price increase rate, set at 1.2% [92]; and R i is the market interest rate, set at 4.25% [92]. The calculation period is set to 25 years, and the service life of active photovoltaic components is also considered to be 25 years, because the accuracy of economic calculation results beyond 30 years can be affected [91]. If d C g > 0, it indicates that the retrofitting scheme is economically unfeasible; if d C g   < 0, it indicates that the retrofitting scheme is economically feasible, and the smaller the d C g value, the better the lifecycle economic benefit of the retrofitting scheme.
In this study, the direction of optimization is to adjust design parameters to minimize the values of C E C O 2 and d C g . The function can be expressed as follows:
M i n f 1 x = C E C O 2 , f 2 x = d C g , x = x 1 , x 2 , x 3 x n
In this case, the optimization goal is naturally to find the set of parameters x that minimize the objective functions f 1 x and f 2 x . In this study, there is no need to convert maximization problems into minimization problems as the values of the objective functions are already indicators of minimization.

4.3. Payback Period

The payback period refers to the time required for the added benefits of a project to compensate for the investment made. It is a key indicator for assessing the feasibility of rural house retrofit projects. This study focuses on reducing energy consumption through passive envelope improvements and integrated photovoltaic panels, without considering construction costs. The initial investment includes the cost of insulation materials, installation fees, and the cost of photovoltaic components. This paper also considers the additional costs of using grid electricity to supplement electric heating when photovoltaic generation is insufficient to meet all heating needs.
According to the “Notice on the Adjustment of Electricity Prices for the Xinjiang Power Grid by the Development and Reform Commission of the Autonomous Region”, the unified electricity price for dispersed electric heating to households is 0.22 CNY/kWh. The “Scheme for Perfecting the New Energy Pricing Mechanism in Our Region” issued by the Development and Reform Commission of the Xinjiang Uygur Autonomous Region specifies the on-grid electricity price as 0.262 CNY/kWh. By comparing these costs with the long-term energy-saving benefits, the calculation formula is as follows:
t = c c 1 c 2 c 3
In the formula, t is the payback period (years); c is the total initial investment cost; c 1 is the annual energy saving cost (savings); c 2 is the annual operation and maintenance cost; and c 3 is the cost of supplementing electric heating with grid electricity.

5. Results

5.1. Analysis of Optimal Solution’s Objective Performance

Based on the simulation results from EnergyPlus, the initial values for the optimized variables of the baseline building and the heating energy consumption per unit of building area are presented in Table 4. These values exceed the current standards for residential buildings, which require a 75% energy saving rate.
Simulating the selected photovoltaic (PV) components reveals that from May to September, and as shown in Figure 6, the solar irradiance is abundant, gradually decreasing with the change in the sun’s elevation angle, where the irradiance on an inclined surface is slightly higher than on a flat surface. The electricity generation from the PV components is lowest in November, with some energy loss through the inverter. From May to September, the output of electricity can reach up to 900 kWh. During the winter heating period, the PV components generate a total of 3603.23 kWh of electricity, which can be fed into the grid during the summer without the need for additional energy consumption.
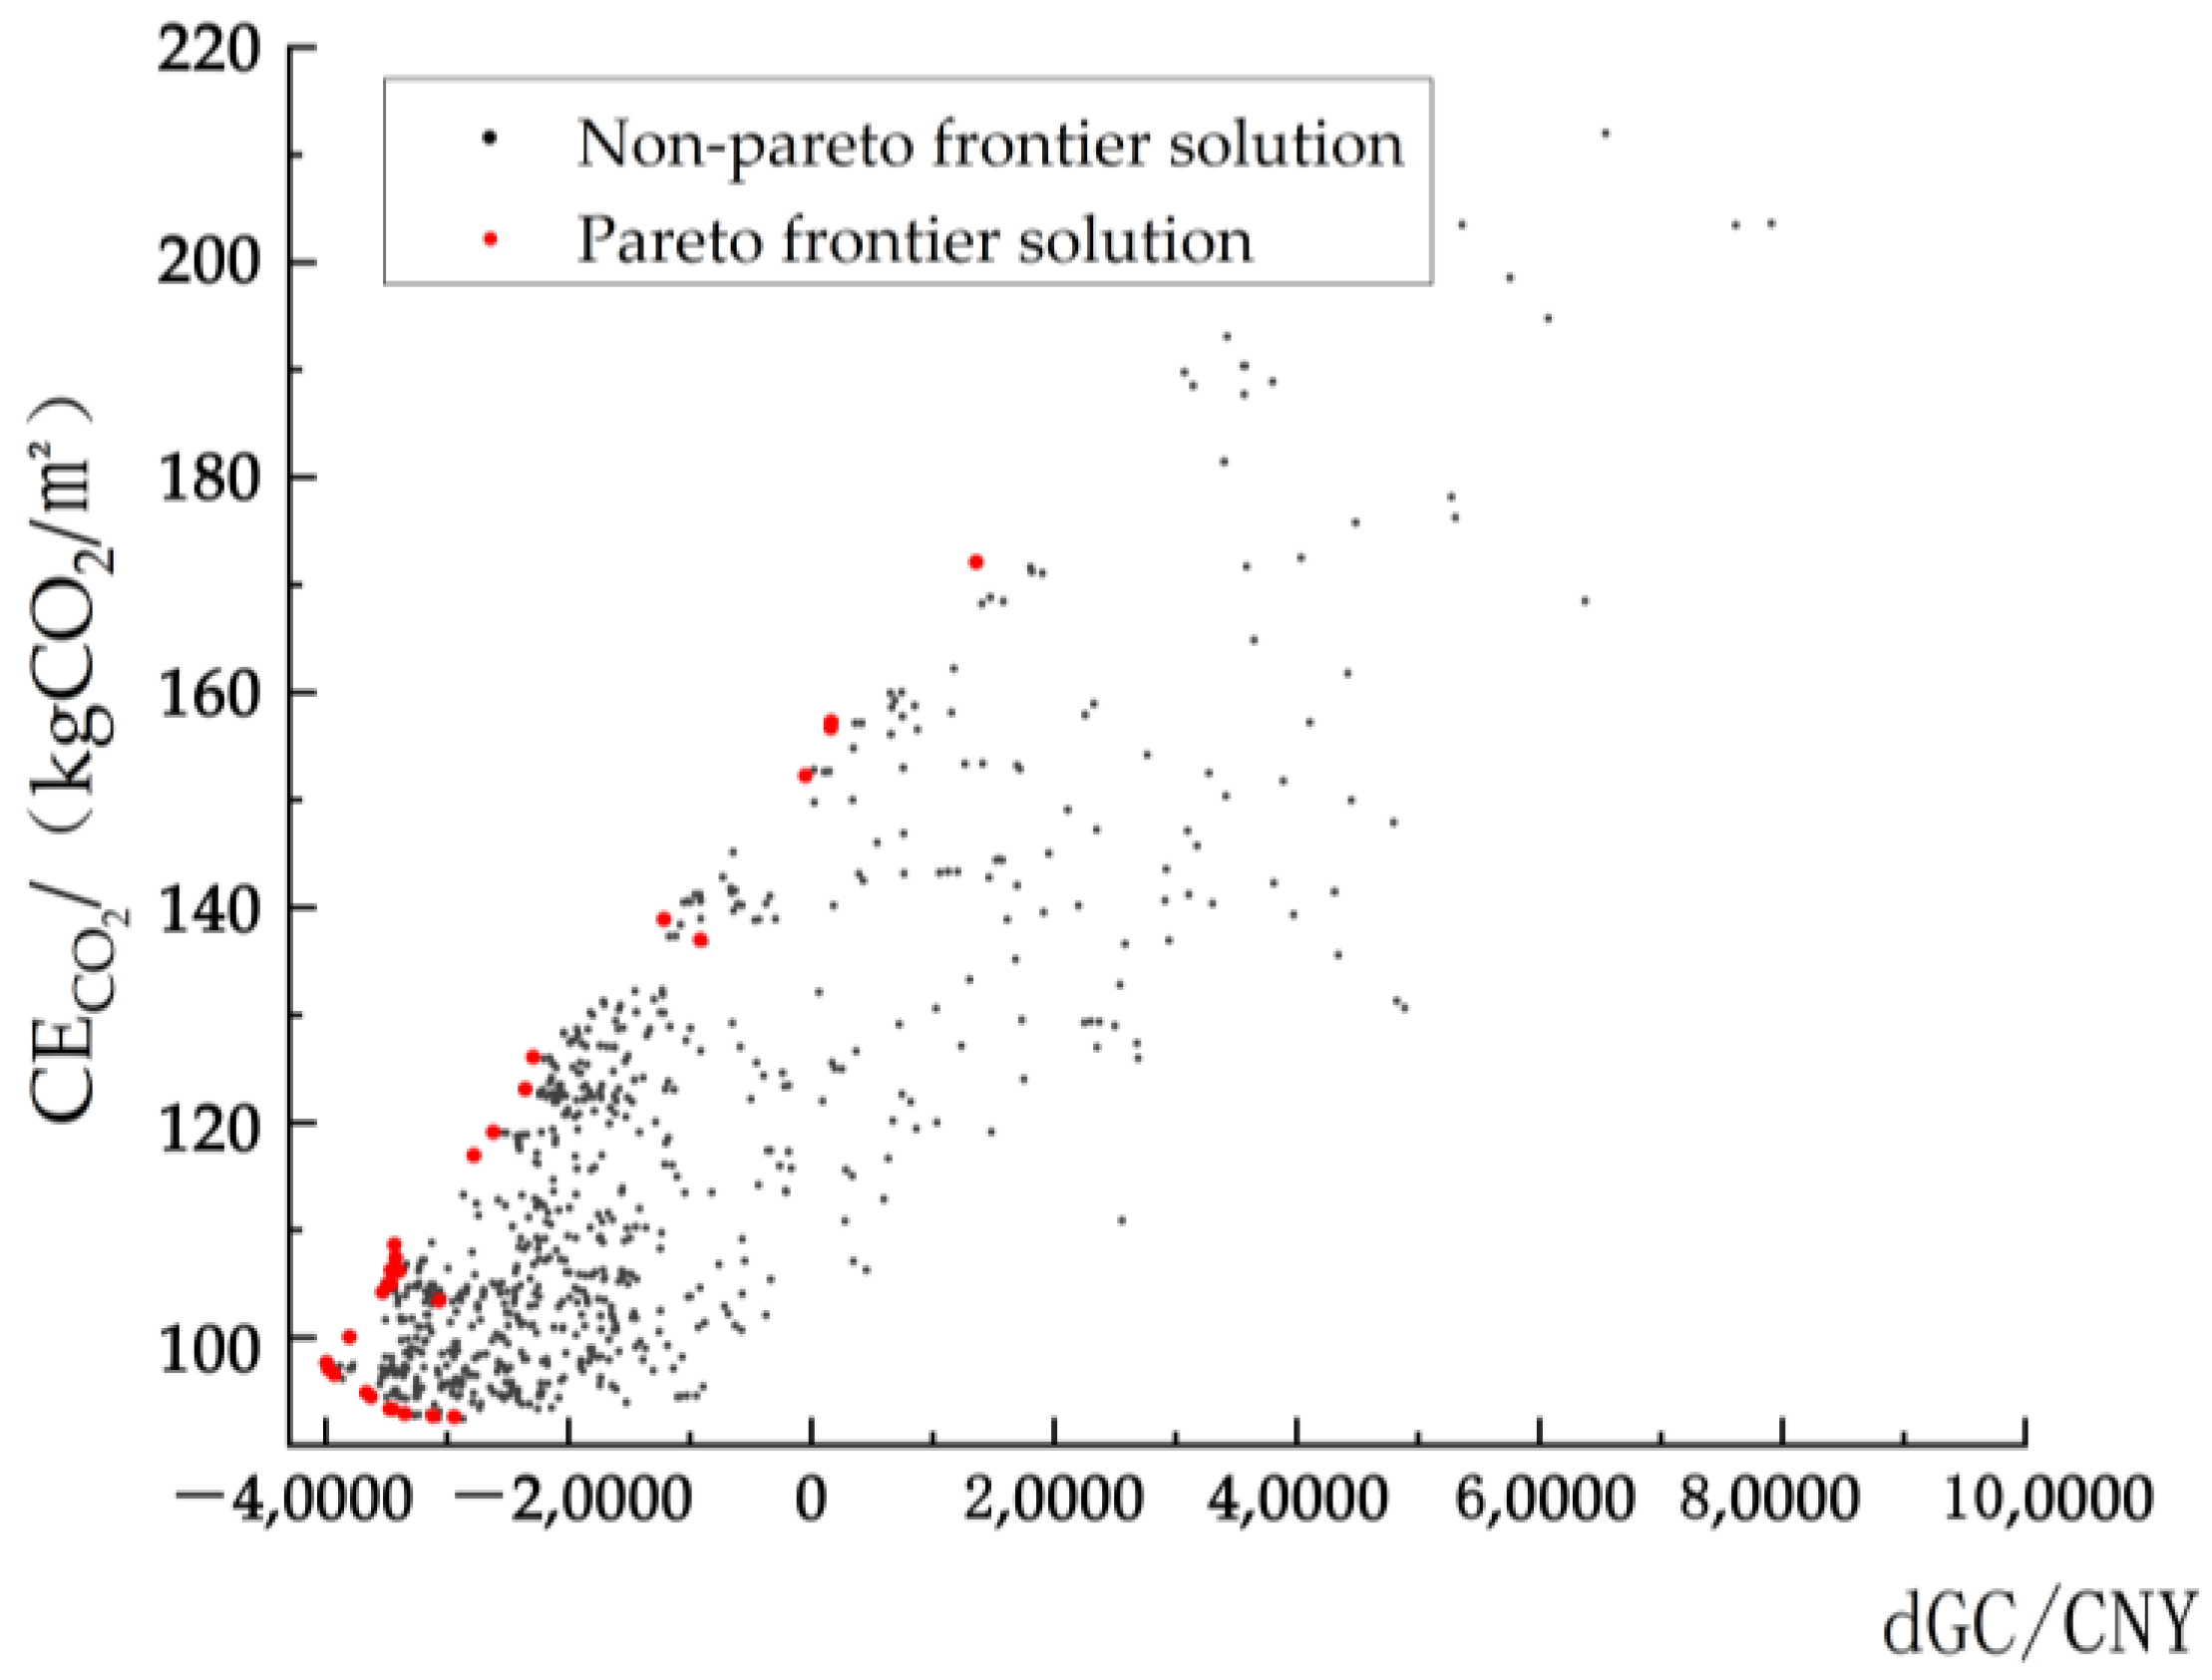
For setting optimization algorithm parameters, reference is made to related research. Under the premise of ensuring the accuracy of the Pareto solution set and reasonable computation time, the settings for the NSGA-II optimization algorithm are as follows: a population size of 50, a number of generations of 20, a crossover probability of 0.9, and a mutation probability of 0.1. The maximum number of iterations is used as the termination condition for optimization. After comprehensive optimization, the Pareto solution set under the control of objectives is obtained, as shown in Figure 7. Overall, it is evident that the various retrofit measure variables for the rural house all have significant optimization potential.
After 20 generations of calculation, the multi-objective optimization tends towards convergence, yielding 64 Pareto optimal solutions for the rural house retrofit. As the cost of the rural house retrofit increases, the trend of reducing building energy consumption slows down from rapid to gradual. The solutions in the set all show heating energy consumption significantly better than the initial energy consumption values of the baseline building, with per unit area carbon emissions also lower than the initial carbon emission values of the baseline building. The trend in winter heating energy consumption and the global cost of rural house retrofit are inversely related, indicating that the optimization objectives are mutually constrained and cannot achieve optimum simultaneously.
The diagram shows a series of retrofitting schemes obtained after 20 generations of optimization, which display varying degrees of trade-offs between cost reduction and energy consumption. These trade-offs reflect the mutual constraints of the optimization objectives. As a scatter plot representing different retrofitting schemes, each point on the plot indicates two key performance indicators of a retrofitting scheme: the vertical axis represents carbon emissions C E C O 2 , and the horizontal axis represents the incremental global cost d C g . It is evident that there are schemes with d C g < 0, indicating that these retrofitting schemes are economically viable. The smaller the value of d C g , the better the economic benefit during the operational phase of the rural dwelling.
The red points in the diagram represent the Pareto frontier solutions obtained through the NSGA-II algorithm, indicating that these points achieve a better trade-off between carbon emissions and cost. The distribution of data points shows that as the cost increment d C g increases, the carbon emissions C E C O 2 gradually decrease, although the rate of reduction slows down. Within the Pareto frontier, lower cost increments correspond to lower carbon emissions, indicating that significant reductions in energy consumption and carbon emissions can be achieved through moderate retrofit investments.
From an overall perspective, the unit area heating load can be reduced from 211.51 kW·h/m2 to 109.72 kW·h/m2. Among them, within the Pareto optimal solution set, those satisfying a 75% energy-saving rate account for 42.2%. The minimum building heat consumption index can reach 12.427 W/m2, resulting in an energy-saving rate of 79.5%. Among these, 80% of the renovation plans have initial investments lower than the lifecycle energy-saving costs ( d C g < 0). This indicates that adding photovoltaic components to improve the enclosure structure is economically feasible for reducing heating power consumption.

5.2. Factor Analysis Based on Entropy-Weighted TOPSIS

Building on this, the obtained Pareto solution set is analyzed to compare the heating carbon emissions and overall costs of various plans. Through the entropy weighting method, the data is normalized and weighted, resulting in the outcomes for seven key indicators, as shown in Table 5.
The entropy weighting results highlight the insulation thickness of external walls as the most significant factor, followed by the south-facing window-to-wall ratio, roof insulation thickness, story height, north-facing window-to-wall ratio, and east–west facing window-to-wall ratio, in descending order of impact. This indicates that energy-saving optimizations for rural houses in the region should prioritize reducing the thermal conductivity of external walls and increasing the south-facing window-to-wall ratio. Subsequently, improving the performance of roof insulation materials and adjusting the design of window-to-wall ratios in other directions should be considered. Specifically, minimizing or avoiding windows in the east–west orientation can optimize the overall energy-saving effect.
According to the calculation steps of the entropy weight TOPSIS method, after standardizing the values of each criterion, they are multiplied by the entropy weights previously determined to calculate the closeness coefficient C. This coefficient represents the overall performance of each scheme across all criteria, meaning that the higher the C value, the closer the scheme is to the ideal solution after considering all evaluation criteria. The results are shown in Figure 8.
The graph clearly shows significant fluctuations in the C values, indicating considerable differences in the quality of the retrofitting schemes. About 25% of the schemes perform well, as these retrofitting strategies are closer to the ideal solution, with their relative closeness exceeding 0.7.
Within the Pareto front solution, 20% of the plans are not economically viable, and the carbon reduction per unit of building area is less than 47.93 kg CO2/m2. Compared to the baseline model, the maximum carbon reduction per unit of building area is achieved by Plan 43, with a value of 112.01 kg CO2/m2, whereas Plan 62 has the highest economic feasibility, with a d C g of −34,434.56 CNY, but the carbon reduction per unit of building area is 100.67 kg CO2/m2. Hence, a higher investment in rural house optimization does not necessarily lead to greater carbon reduction. Balancing the carbon reduction per unit area and d C g objectives, Plan 38 is identified as the optimal, with heating period carbon reduction and a global cost increase of 108.65 kg CO2/m2 and −31,818.74 CNY, respectively, reducing building heating carbon emissions while also offering good economic benefits.
The study utilizes roof-distributed “self-consumption with surplus to grid” for simulation, assuming that the degradation of the solar photovoltaic power generation system does not exceed 20% throughout its lifecycle [93], with a first-year degradation of 2% and no more than 0.5% per year thereafter. The calculated annual average photovoltaic power generation during the heating period is 3603.23 kWh, with 4583.77 kWh fed into the grid. Taking into account the saved heating electricity due to envelope structure renovation, Plan 38, Plan 43, and Plan 62 have payback periods of 12.51, 13.37, and 12.53 years, respectively.

5.3. Solar Contribution Rate

The solar contribution rate intuitively reflects the performance differences between solar photovoltaic systems and electric heating during the heating period in the Ussuri region’s building heating cycle. This analysis selects a compromise solution to compare the energy generated by the photovoltaic system during operation with the building’s total thermal load throughout the heating cycle [22].
As indicated in Figure 9, from December to February of the following year, it was characterized by low solar altitude angles and weather conditions such as rain and snow that reduced the efficiency of solar photovoltaic systems. Especially in January and February, frost formation at night adversely affects solar collectors, decreasing the absorption efficiency of the collectors. As midday temperatures rise and the frost melts, the solar system almost ceases to generate heat during this period. To meet the indoor thermal load demand, electric heating becomes a necessary choice. In October and April, due to ample solar radiation, the solar system’s contribution rate exceeds 100%, and as the internal thermal load of the farmhouse decreases, the photovoltaic system can generate extra heat.

6. Discussion

In architectural performance optimization research, objective functions are commonly based on economic aspects such as life cycle cost, total investment cost, or building operation cost; energy aspects like electrical load; and environmental aspects such as carbon emissions [94]. In this paper, the optimization objective functions are per unit area heating carbon emissions and the global cost increment of retrofitting. This study has validated that retrofitting strategies, which enhance the insulation performance of the building envelope and add photovoltaic systems to roofs in rural residences in the Wusu area, can significantly reduce heating energy and carbon emissions. Zhen M. and others have proposed that the form factor of rural residences, the window-to-wall area ratio, and the thermal transmittance coefficient of the envelope are positively correlated with heating energy consumption in the severely cold regions of Northeast China [95], collectively indicating that establishing a heating energy consumption prediction model in severely cold regions can provide a basis for energy-saving retrofits for rural dwellings.
The entropy weight TOPSIS method is used in this study to evaluate retrofitting schemes obtained through the NSGA-II algorithm. The results indicate that adding additional insulation to the exterior walls has the greatest impact on heating energy consumption, followed by the control of the south-facing window-to-wall ratio and the addition of insulation to the roof. Jin H. and others, taking residential design in a severely cold village as an example, used the NSGA-II algorithm to filter design parameter combinations related to energy consumption and cost, obtaining a set of Pareto non-dominated solutions and a global balance solution, and selecting different technical templates for various needs [96]. Lu H. and others took a new rural residential building in a cold region as the research object to simulate and analyze the impact of the thermal performance of various envelopes on building heating energy consumption, noting that the exterior walls have the greatest potential for energy savings, with a potential of 18.35%, windows at 15.64%, and the roof at 4.53% [97]. In addressing multi-objective research problems, the selection of the NSGA-II algorithm is feasible, and the conclusions drawn from the study of the impact of envelope structures on heating energy consumption in cold regions are in line with the trends observed in this study, indicating that in both severely cold and cold regions, greater attention should be paid to the insulation of exterior walls, windows, and roofs.
Analysis of the Pareto frontier solutions indicates that the per unit area heating carbon emissions can be reduced to 78.76 kg CO2/KW·h, of which the solutions meeting the 75% energy-saving design standard of the autonomous region account for 42.2%, demonstrating the potential for sustainable development in rural housing. The best retrofitting scheme selected through the entropy weight TOPSIS method combines the retrofit of the building envelope and the application of photovoltaic systems, achieving an energy-saving rate of 79.5%. Compared with Ding Y.’s research on the thermal performance of vertical building envelopes in rural housing in the Hohhot–Baotou–Ordos region, the optimized scheme reached an energy-saving rate of up to 76.69% [98]. This proves the energy-saving effect of envelope structure optimization and shows that adding photovoltaic systems to rural housing can further enhance energy savings, validating the correctness of envelope structure optimization and the significant role of photovoltaic systems in promoting energy savings in rural dwellings.
Furthermore, this study indicates that in the transitional heating season of October and April, the solar contribution rate of the photovoltaic system exceeds 100%, where the surplus energy can be utilized by metering transmission to the grid or battery storage. In winter, when the solar incident angle is low and snowfall reduces the efficiency of solar collectors, the photovoltaic system should be combined with electric heating to ensure stable heating during the heating season. Zhang J. and others, through measured and numerical simulation of different thermal inertia building envelopes and delay times in low-energy buildings in severely cold regions, controlled strategies to maximize the use of peak–valley electricity prices, significantly reducing the operating time of the electric heating system in the heating system [22], further enhancing the sustainability and energy independence of rural housing.

7. Conclusions

Improving the building’s structural performance and reducing the economic costs of heating are key to promoting carbon reduction in rural house heating systems. Installing photovoltaic power systems on building roofs offers good economic benefits and significant energy-saving and emission-reduction effects. Effectively utilizing measures such as external wall and roof insulation, the performance of transparent envelope structures, and clean energy can achieve optimal energy-saving and cost-effectiveness. The differentiated performance of various retrofitting plans for rural houses in terms of each target performance is as follows:
The carbon emission per unit area of heating has been reduced from a high of 109.76 kg CO2/KW·h to 78.76 kg CO2/KW·h. Among the Pareto front solutions, 42.2% meet the autonomous region’s current energy-saving residential design standard of a 75% energy-saving rate; the lowest building thermal consumption index can reach 12.427 w/m2, at which point the energy-saving rate has reached 79.5%. In all retrofitting plans, 64% have d C g < 0; within the Pareto front solutions, 80% of the plans with d C g < 0 indicate that improving the envelope structure and adding photovoltaic components are economically feasible in reducing heating energy consumption.
Balancing the carbon emissions from heating and the overall cost increase from retrofitting, the balanced solution for the retrofit of the rural house is identified: the net height of the house is 2.80 m, the external wall is insulated with 280 mm thick EPS polystyrene board, the insulation thickness of the roof is 240 mm, and the type of external window chosen is type 5 (6 mm translucent low-E, 12 mm argon gas, and 6 mm transparent), with a south-facing window-to-wall ratio controlled at 0.3 and a north-facing window-to-wall ratio of 0.09, without adding external shading. At this point, the corresponding carbon emission per unit building area is 82.11 kg CO2/m2, and the global cost increase is −31,818.74 CNY. The addition of photovoltaic system components yields an annual electricity output of 8187 kWh, with a total output of 191,661 kWh over 25 years. The photovoltaic system reduces standard coal emissions by 19.28 kgce/(m2·a) and carbon emissions by 0.834 kg/(m2·a) over its operational cycle. At this point, the payback period for the investment in the heating retrofit of the rural house is 12.51 years, demonstrating good economic and environmental benefits.
This study employs the NSGA-II genetic algorithm-based multi-objective optimization plugin, Wallacei, to balance per unit area carbon emissions and the global cost increment of retrofitting, constructing a multi-objective optimization approach suitable for winter heating in rural dwellings in the Wusu area. By analyzing the Pareto frontier solutions, the study evaluates the impact of each optimization scheme on winter heating energy consumption and economic costs, proposing energy-saving and emission-reduction solutions under the premise of economic viability. It also highlights some limitations. Firstly, due to geographical location and manpower constraints, the sample size is limited, with the research perspective focused on the Wusu area. Despite being in the same cold region, there are differences in climate characteristics, cultural backgrounds, and residents’ living habits across regions. There is a need for targeted energy-saving retrofit designs for rural dwellings that maintain the characteristics and continuity of regional architecture while meeting energy-saving and emission-reduction requirements. Further analysis of their socio-economic benefits should be conducted to ensure the economic feasibility of the retrofitting schemes. Moreover, this study is limited to analyzing the current typical climate conditions without predicting or assessing the potential impacts of future climate changes.
Additionally, the current analysis and research are only targeted at rural residences in the plain areas of the Wusu region, where farming is the primary mode of production, without considering other rural residences in the mountainous regions that rely on nomadic lifestyles. Different production methods and changes in terrain may affect the optimization direction and results. Future research will focus on analyzing the energy consumption of the residences of nomadic populations and improving living comfort. Further studies will also explore the interaction between rural housing and the power grid, optimizing the integration of storage systems and photovoltaic power generation, and analyzing energy and comfort optimization during the operational phase of rural dwellings to enhance the validity of the results.

Author Contributions

H.X.: conceptualization, methodology, supervision, review and editing; H.G.: conceptualization, methodology, software, investigation, writing, visualization, project administration; W.H.: conceptualization, supervision, methodology, review; B.Y.: Conceptualization, Supervision; J.Z.: supervision, review; H.Z.: methodology, data reduction. All authors have read and agreed to the published version of the manuscript.

Funding

This research was funded by the Hebei Province Key Research and Development Plan Project, grant number 21374502D.

Institutional Review Board Statement

Not applicable.

Informed Consent Statement

Not applicable.

Data Availability Statement

The raw data supporting the conclusions of this article will be made available by the authors on request.

Conflicts of Interest

The authors declare no conflicts of interest.

References

  1. Tsinghua University Building Energy Conservation Research Center. China Building Energy Efficiency Annual Development Report 2020; China Building Industry Press: Beijing, China, 2020. [Google Scholar]
  2. Zhang, L.L.; Hou, Y.Y.; Liu, Z.A.; Du, J.F.; Xu, L.; Zhang, G.M.; Shi, L. Trombe wall for a residential building in Sichuan-Tibet alpine valley—A case study. Renew. Energy 2020, 156, 31–46. [Google Scholar] [CrossRef]
  3. Furtado, A.; Rodrigues, H.; Arede, A.; Varum, H. A experimental characterization of seismic plus thermal energy retrofitting techniques for masonry infill walls. J. Build. Eng. 2023, 75, 106854. [Google Scholar] [CrossRef]
  4. Moghaddam, F.B.; Mir, J.M.F.; Yanguas, A.B.; Delgado, I.N.; Dominguez, E.R. Building Orientation in Green Facade Performance and Its Positive Effects on Urban Landscape Case Study: An Urban Block in Barcelona. Sustainability 2020, 12, 9273. [Google Scholar] [CrossRef]
  5. López-Ochoa, L.M.; Las-Heras-Casas, J.; López-González, L.M.; García-Lozano, C. Energy Renovation of Residential Buildings in Cold Mediterranean Zones Using Optimized Thermal Envelope Insulation Thicknesses: The Case of Spain. Sustainability 2020, 12, 2287. [Google Scholar] [CrossRef]
  6. Zhao, J.; Zhou, B.; Bai, Y.; Gao, J.; Qiang, T. Suitability and economic analysis of existing building energy savingreconstruction in cold plateau region. J. Xi’an Univ. Archit. Technol. 2023, 55, 774–782. [Google Scholar] [CrossRef]
  7. Hou, J.W.; Zhang, T.; Liu, Z.A.; Hou, C.P.; Fukuda, H. A study on influencing factors of optimum insulation thickness of exterior walls for rural traditional dwellings in northeast of Sichuan hills, China. Case Stud. Constr. Mat. 2022, 16, e01033. [Google Scholar] [CrossRef]
  8. Huang, J.E.; Wang, S.S.; Teng, F.H.; Feng, W. Thermal performance optimization of envelope in the energy-saving renovation of existing residential buildings. Energy Build. 2021, 247, 111103. [Google Scholar] [CrossRef]
  9. Ma, L.; Hu, H.; Li, Q.; Jv, Z.; Jiang, W.; Li, D. Selecting Optimally the Rural Residence’s Additional Sunspace by Orthogonal Experiment and Entropy Method in the Severe Cold Area. Build. Energy Effic. 2022, 50, 118–124. [Google Scholar]
  10. Wang, J.; Gao, W.J.; Wang, Z.; Zhang, L.T. Analysis of Energy Performance and Integrated Optimization of Tubular Houses in Southern China Using Computational Simulation. Appl. Sci. 2021, 11, 9371. [Google Scholar] [CrossRef]
  11. Shao, T.; Zheng, W.X.; Jin, H. Analysis of the Indoor Thermal Environment and Passive Energy-Saving Optimization Design of Rural Dwellings in Zhalantun, Inner Mongolia, China. Sustainability 2020, 12, 1103. [Google Scholar] [CrossRef]
  12. Tahsildoost, M.; Zomorodian, Z. Energy, carbon, and cost analysis of rural housing retrofit in different climates. J. Build. Eng. 2020, 30, 101277. [Google Scholar] [CrossRef]
  13. Schnieders, J.; Feist, W.; Rongen, L. Passive Houses for different climate zones. Energy Build. 2015, 105, 71–87. [Google Scholar] [CrossRef]
  14. Neroutsou, T.; Croxford, B. Lifecycle costing of low energy housing refurbishment: A case study of a 7 year retrofit in Chester Road, London. Energy Build. 2016, 128, 178–189. [Google Scholar] [CrossRef]
  15. Wu, R.; Mavromatidis, G.; Orehounig, K.; Carmeliet, J. Multiobjective optimisation of energy systems and building envelope retrofit in a residential community. Appl. Energy 2017, 190, 634–649. [Google Scholar] [CrossRef]
  16. Charisi, S. The role of the building envelope in achieving nearly-zero energy buildings (nZEBs). Procedia Environ. Sci. 2017, 38, 115–120. [Google Scholar] [CrossRef]
  17. Liang, X.; Wang, Y.; Zhang, Y.; Jiang, J.; Chen, H.; Zhang, X.; Guo, H.; Roskilly, T. Analysis and optimization on energy performance of a rural house in Northern China using passive retrofitting. Energy Procedia 2017, 105, 3023–3030. [Google Scholar] [CrossRef]
  18. Ye, R.; Fang, X.; Zhang, Z. Numerical Study on Energy-Saving Performance of a New Type of Phase Change Material Room. Energies 2021, 14, 3874. [Google Scholar] [CrossRef]
  19. Yu, W.; Li, B.; Jia, H.; Zhang, M.; Wang, D. Application of multi-objective genetic algorithm to optimize energy efficiency and thermal comfort in building design. Energy Build. 2015, 88, 135–143. [Google Scholar] [CrossRef]
  20. Yong, S.-G.; Kim, J.-H.; Gim, Y.; Kim, J.; Cho, J.; Hong, H.; Baik, Y.-J.; Koo, J. Impacts of building envelope design factors upon energy loads and their optimization in US standard climate zones using experimental design. Energy Build. 2017, 141, 1–15. [Google Scholar] [CrossRef]
  21. Wang, Z.; Li, L.; Zhao, F.; Yao, B.; Yue, Y.; Ni, P. Key technologies of nearly zero energy for public building in Guanzhong. J. Xi’an Univ. Archit. Technol. 2022, 54, 718–727. [Google Scholar] [CrossRef]
  22. Zhang, J.; Qi, D. Experimental Research on Solar Heating System for Prefabricated Low-energy Buildings in Cold Building. Energy Effic. 2022, 50, 93–99. [Google Scholar]
  23. Habibi, S.; Obonyo, E.A.; Memari, A.M. Design and development of energy efficient re-roofing solutions. Renew. Energy 2020, 151, 1209–1219. [Google Scholar] [CrossRef]
  24. Kapicioglu, A.; Kale, C. Techno-economic analysis of ground source heat pump powered by hybrid photovoltaic-wind-diesel systems in a temperate climate region. J. Therm. Anal. Calorim. 2023, 148, 8443–8457. [Google Scholar] [CrossRef]
  25. Liu, Q.; Guan, Q.; Zhang, M.; Liu, X.; Li, Z.; Wang, Y.; Guo, H. Optimum design of solar energy-assisted heating for typical rural residential buildings in north China. Renew. Energy Resour. 2020, 38, 447–452. [Google Scholar] [CrossRef]
  26. Xu, J. Economic Analysis of Different Energy-saving and Emission-reduction Schemes of Rural Houses in Beijing. Build. Energy Effic. 2023, 51, 132–136+144. [Google Scholar]
  27. Gao, Y.; Luo, S.; Yuan, J.; Wang, S. Objective and Double Carbon Scenario Simulation “Double Substitution” Rural Houses Renovation in Hebei Province Based on Multi-dimensional. Build. Sci. 2022, 38, 179–189. [Google Scholar] [CrossRef]
  28. Li, J.; Wang, L.; Li, X.; Zhen, X.; Si, Z.; Feng, R.; Wang, N. Experimental study on active solar heating for new rural residence in northwest China. Renew. Energy Resour. 2016, 34, 1680–1685. [Google Scholar] [CrossRef]
  29. Zhang, Y.; Chen, C.; Wang, W.; Ma, Y.; Qi, D.; Jiang, H.; Wang, R. Experimental study on solar phase change storage floor radiant heating system application to an office building in Urumgi. Heat. Vent. Air Cond. 2016, 46, 101–109. [Google Scholar]
  30. Li, J.; Xu, X.; Yao, X.; Zhao, J. Analysis of Passive Reform and Operation Effect of Rural House during the lnitial Stage of Heating in Xinjiang. Sci. Technol. Eng. 2020, 20, 5332–5337. [Google Scholar]
  31. Luo, C.; Gong, Y.L.; Ma, W.B.; Zhao, J. Building Energy Efficiency in Guangdong Province, China. Therm. Sci. 2019, 23, 3251–3262. [Google Scholar] [CrossRef]
  32. Chen, Y.B.; Chen, Z.S.; Chen, Z.; Yuan, X. Dynamic modeling of solar-assisted ground source heat pump using Modelica. Appl. Therm. Eng. 2021, 196, 117324. [Google Scholar] [CrossRef]
  33. Ma, L.Y.; Zhang, X.; Li, D.; Arici, M.; Yildiz, Ç.; Li, Q.; Zhang, S.; Jiang, W. Influence of sunspace on energy consumption of rural residential buildings. Sol. Energy 2020, 211, 336–344. [Google Scholar] [CrossRef]
  34. Siudek, A.; Klepacka, A.M.; Florkowski, W.J.; Gradziuk, P. Renewable Energy Utilization in Rural Residential Housing: Economic and Environmental Facets. Energies 2020, 13, 6637. [Google Scholar] [CrossRef]
  35. Li, G.; Chi, L.; Guo, J.; Liu, C.; Luo, Y.; She, C. Numerical simulation on indoor thermal comfort of a new integrated rural heating system. Procedia Eng. 2015, 121, 1111–1117. [Google Scholar] [CrossRef]
  36. Wang, M.; Chen, C.; Fan, B.; Yin, Z.; Li, W.; Wang, H.; Chi, F.A. Multi-Objective Optimization of Envelope Design of Rural Tourism Buildings in Southeastern Coastal Areas of China Based on NSGA-II Algorithm and Entropy-Based TOPSIS Method. Sustainability 2023, 15, 7238. [Google Scholar] [CrossRef]
  37. Chen, R.; Tsay, Y.-S.; Ni, S. An integrated framework for multi-objective optimization of building performance: Carbon emissions, thermal comfort, and global cost. J. Clean Prod. 2022, 359, 131978. [Google Scholar] [CrossRef]
  38. Ascione, F.; Bianco, N.; Mauro, G.M.; Napolitano, D.F. Building envelope design: Multi-objective optimization to minimize energy consumption, global cost and thermal discomfort. Application to different Italian climatic zones. Energy 2019, 174, 359–374. [Google Scholar] [CrossRef]
  39. Aram, K.; Taherkhani, R.; Šimelytė, A. Multistage optimization toward a nearly net zero energy building due to climate change. Energies 2022, 15, 983. [Google Scholar] [CrossRef]
  40. Pallis, P.; Gkonis, N.; Varvagiannis, E.; Braimakis, K.; Karellas, S.; Katsaros, M.; Vourliotis, P.; Sarafianos, D. Towards NZEB in Greece: A comparative study between cost optimality and energy efficiency for newly constructed residential buildings. Energy Build. 2019, 198, 115–137. [Google Scholar] [CrossRef]
  41. Zhou, Z.; Anwar, G.A.; Dong, Y. Performance-based bi-objective retrofit optimization of building portfolios considering uncertainties and environmental impacts. Buildings 2022, 12, 85. [Google Scholar] [CrossRef]
  42. Abdou, N.; Mghouchi, Y.E.; Hamdaoui, S.; Asri, N.E.; Mouqallid, M. Multi-objective optimization of passive energy efficiency measures for net-zero energy building in Morocco. Build. Environ. 2021, 204, 108141. [Google Scholar] [CrossRef]
  43. Jiang, W.; Ju, Z.; Tian, H.; Liu, Y.; Arıcı, M.; Tang, X.; Li, Q.; Li, D.; Qi, H. Net-zero energy retrofit of rural house in severe cold region based on passive insulation and BAPV technology. J. Clean. Prod. 2022, 360, 132198. [Google Scholar] [CrossRef]
  44. Kiss, B.; Szalay, Z. Modular approach to multi-objective environmental optimization of buildings. Autom. Constr. 2020, 111, 103044. [Google Scholar] [CrossRef]
  45. Vukadinović, A.; Radosavljević, J.; Đorđević, A.; Protić, M.; Petrović, N. Multi-objective optimization of energy performance for a detached residential building with a sunspace using the NSGA-II genetic algorithm. Sol. Energy 2021, 224, 1426–1444. [Google Scholar] [CrossRef]
  46. Yuan, Y.; Han, Y.; Liang, J.; Sun, C. A Study on Community Form Optimization in the Severe Cold Zones Based on Solar Radiation Utilization. South Archit. 2018, 14–18. [Google Scholar]
  47. Yu, H. Research on Multi-Objective Optimization of Spatial Form of Library in Cold Region Based on Lighting and Energy Consumption; Harbin Institute of Technology: Harbin, China, 2019. [Google Scholar]
  48. Tian, Y. Research on Performance Optimization Design of Office Building in Cold Area; Tianjin University: Tianjin, China, 2020. [Google Scholar]
  49. Gao, Y.; Luo, S.; Chi, J.; Yuan, J. A Multi-objective Optimisation Evaluation Method for the Low-carbon Renovation of Rural Houses. South Archit. 2022, 61–68. [Google Scholar]
  50. Xu, K.; Wang, Y. Parametric design of intensive campus building layout based on environmental performance optimization. Build. Energy Effic. 2023, 51, 125–131+144. [Google Scholar]
  51. Si, B.; Liu, F.; Li, Y. Metamodel-Based Hyperparameter Optimization of Optimization Algorithms in Building Energy Optimization. Buildings 2023, 13, 167. [Google Scholar] [CrossRef]
  52. Deb, K.; Pratap, A.; Agarwal, S.; Meyarivan, T. A fast and elitist multiobjective genetic algorithm: NSGA-II. IEEE Trans. Evol. Comput. 2002, 6, 182–197. [Google Scholar] [CrossRef]
  53. Ghaderian, M.; Veysi, F. Multi-objective optimization of energy efficiency and thermal comfort in an existing office building using NSGA-II with fitness approximation: A case study. J. Build. Eng. 2021, 41, 102440. [Google Scholar] [CrossRef]
  54. Zhao, L.; Zhang, W.; Wang, W. BIM-based multi-objective optimization of low-carbon and energy-saving buildings. Sustainability 2022, 14, 13064. [Google Scholar] [CrossRef]
  55. Penna, P.; Prada, A.; Cappelletti, F.; Gasparella, A. Multi-objectives optimization of Energy Efficiency Measures in existing buildings. Energy Build. 2015, 95, 57–69. [Google Scholar] [CrossRef]
  56. Chaturvedi, S.; Rajasekar, E.; Natarajan, S. Multi-objective building design optimization under operational uncertainties using the NSGA II algorithm. Buildings 2020, 10, 88. [Google Scholar] [CrossRef]
  57. Rabani, M.; Madessa, H.B.; Nord, N. Achieving zero-energy building performance with thermal and visual comfort enhancement through optimization of fenestration, envelope, shading device, and energy supply system. Sustain. Energy Technol. 2021, 44, 101020. [Google Scholar] [CrossRef]
  58. Ascione, F.; De Masi, R.F.; de Rossi, F.; Ruggiero, S.; Vanoli, G.P. Optimization of building envelope design for nZEBs in Mediterranean climate: Performance analysis of residential case study. Appl. Energy 2016, 183, 938–957. [Google Scholar] [CrossRef]
  59. Ferrara, M.; Vallee, J.C.; Shtrepi, L.; Astolfi, A.; Fabrizio, E. A thermal and acoustic co-simulation method for the multi-domain optimization of nearly zero energy buildings. J. Build. Eng. 2021, 40, 102699. [Google Scholar] [CrossRef]
  60. Delgarm, N.; Sajadi, B.; Delgarm, S.; Kowsary, F. A novel approach for the simulation-based optimization of the buildings energy consumption using NSGA-II: Case study in Iran. Energy Build. 2016, 127, 552–560. [Google Scholar] [CrossRef]
  61. Mostafazadeh, F.; Eirdmousa, S.J.; Tavakolan, M. Energy, economic and comfort optimization of building retrofits considering climate change: A simulation-based NSGA-III approach. Energy Build. 2023, 280, 112721. [Google Scholar] [CrossRef]
  62. Zhu, L.; Wang, B.; Sun, Y. Multi-objective optimization for energy consumption, daylighting and thermal comfort performance of rural tourism buildings in north China. Build. Environ. 2020, 176, 106841. [Google Scholar] [CrossRef]
  63. Luo, Z.; Lu, Y.; Cang, Y.; Yang, L. Study on dual-objective optimization method of life cycle energy consumption and economy of office building based on HypE genetic algorithm. Energy Build. 2022, 256, 111749. [Google Scholar] [CrossRef]
  64. Xu, Y.; Zhang, G.; Yan, C.; Wang, G.; Jiang, Y.; Zhao, K. A two-stage multi-objective optimization method for envelope and energy generation systems of primary and secondary school teaching buildings in China. Build. Environ. 2021, 204, 108142. [Google Scholar] [CrossRef]
  65. Usman, M.; Frey, G. Multi-objective techno-economic optimization of design parameters for residential buildings in different climate zones. Sustainability 2021, 14, 65. [Google Scholar] [CrossRef]
  66. Delgarm, N.; Sajadi, B.; Delgarm, S. Multi-objective optimization of building energy performance and indoor thermal comfort: A new method using artificial bee colony (ABC). Energy Build. 2016, 131, 42–53. [Google Scholar] [CrossRef]
  67. Delgarm, N.; Sajadi, B.; Kowsary, F.; Delgarm, S. Multi-objective optimization of the building energy performance: A simulation-based approach by means of particle swarm optimization (PSO). Appl. Energy 2016, 170, 293–303. [Google Scholar] [CrossRef]
  68. Hamdy, M.; Nguyen, A.-T.; Hensen, J.L. A performance comparison of multi-objective optimization algorithms for solving nearly-zero-energy-building design problems. Energy Build. 2016, 121, 57–71. [Google Scholar] [CrossRef]
  69. Socha, K.; Dorigo, M. Ant colony optimization for continuous domains. Eur. J. Oper. Res. 2008, 185, 1155–1173. [Google Scholar] [CrossRef]
  70. Bamdad, K.; Cholette, M.E.; Guan, L.; Bell, J. Ant colony algorithm for building energy optimisation problems and comparison with benchmark algorithms. Energy Build. 2017, 154, 404–414. [Google Scholar] [CrossRef]
  71. Bamdad, K.; Cholette, M.E.; Guan, L.; Bell, J. Building energy optimisation under uncertainty using ACOMV algorithm. Energy Build. 2018, 167, 322–333. [Google Scholar] [CrossRef]
  72. Bamdad, K.; Mohammadzadeh, N.; Cholette, M.; Perera, S. Model Predictive Control for Energy Optimization of HVAC Systems Using Energy Plus and ACO Algorithm. Buildings 2023, 13, 3084. [Google Scholar] [CrossRef]
  73. Xiong, Y. Research on Decision Making of Old Residential Renovation Project for Group Preference Analysis; Harbin Institute of Technology: Harbin, China, 2021. [Google Scholar]
  74. Li, D.; Wang, Y.; Deng, Q. Study on evaluation system of energy-saving suitability of building envelope structure with near zero energy consumption. J. Shenyang Jianzhu Univ. 2020, 36, 131–139. [Google Scholar]
  75. Huang, C. Behavioral decision theory and empirical research methods of decision-making behavior. Econ. Surv. 2006, 5, 102–105. [Google Scholar] [CrossRef]
  76. Su, H.; Ma, L.; Zhan, X. Optimization Design of CFRP Battery Casing Based on Entropy Weight—TOPSIS. Compos. Sci. Eng. pp. 1–8. Available online: http://kns.cnki.net/kcms/detail/10.1683.TU.20240417.1522.013.html (accessed on 24 April 2024).
  77. Hwang, C.-L.; Yoon, K. Multiple Attribute Decision Making: Methods and Applications a State-of-the-Art Survey; Springer Science & Business Media: Berlin, Germany, 2012; Volume 186. [Google Scholar]
  78. Li, H.; Huang, J.; Hu, Y.; Wang, S.; Liu, J.; Yang, L. A new TMY generation method based on the entropy-based TOPSIS theory for different climatic zones in China. Energy 2021, 231, 120723. [Google Scholar] [CrossRef]
  79. Chen, P. Effects of normalization on the entropy-based TOPSIS method. Expert Syst. Appl. 2019, 136, 33–41. [Google Scholar] [CrossRef]
  80. Wang, X.; Chen, Y.; Hu, J.; Mu, F. Analysis on the difference of supply level of public service facilities in Five Northwestern Provinces. J. Xi’an Univ. Archit. Technol. 2022, 54, 797–806. [Google Scholar] [CrossRef]
  81. Shih, H.-S.; Shyur, H.-J.; Lee, E.S. An extension of TOPSIS for group decision making. Math. Comput. Model. 2007, 45, 801–813. [Google Scholar] [CrossRef]
  82. Miao, Z.; Wang, J.; Guo, J. Study on Multi-objective Optimization Design Method of Rural Houses in Cold Regions Based on Spatial Hierarchical Logics. South Archit. 2023, 71–79. [Google Scholar]
  83. Zhang, Y.; Liu, Y.; Chen, Y.; Che, R.; Zhou, L. Optimization design of active and passive solar combined heating in Lhasa based on zero energy consumption constraint. J. Xi’an Univ. Archit. Technol. 2021, 53, 811–818+834. [Google Scholar] [CrossRef]
  84. Yuan, P.; Duan, M.; Wang, Z. Review of Data Acquisition Methods for End-use Energy Consumption of Chinese Rural Residences. Build. Sci. 2019, 35, 143–153. [Google Scholar] [CrossRef]
  85. Zhang, T.; Hu, Q.; Ding, Q.; Zhou, D.; Gao, W.; Fukuda, H. Towards a rural revitalization strategy for the courtyard layout of vernacular dwellings based on regional adaptability and outdoor thermal performance in the gully regions of the Loess Plateau, China. Sustainability 2021, 13, 13074. [Google Scholar] [CrossRef]
  86. Xue, Y.; Liu, W. A study on parametric design method for optimization of daylight in commercial building’s atrium in cold regions. Sustainability 2022, 14, 7667. [Google Scholar] [CrossRef]
  87. Besbas, S.; Nocera, F.; Zemmouri, N.; Khadraoui, M.A.; Besbas, A. Parametric-Based Multi-Objective Optimization Workflow: Daylight and Energy Performance Study of Hospital Building in Algeria. Sustainability 2022, 14, 12652. [Google Scholar] [CrossRef]
  88. Li, Y.; Zhang, K.; Li, J. Comparative analysis of carbon emission throughout the life cycle of residential buildings and carbon reduction strategy. J. Xi’an Univ. Archit. Technol. 2021, 53, 737–745. [Google Scholar] [CrossRef]
  89. Meng, J. Research on Carbon Emission Calculation and Influencing Factors of Prefabricated Building Construction; Southwest Jiaotong University: Chengdu, China, 2018. [Google Scholar]
  90. Gao, Y.; Hu, K.; Ding, C.; Yao, S.; Yuan, J. Multi-objective Optimization for Low-carbon Retrofit of “Double Substitution” Rural Houses in Hebei Plain. Sci. Technol. Eng. 2021, 21, 8565–8573. [Google Scholar]
  91. Wu, D.; Liu, L.; Li, X.; Liu, C. Research on the Technologies of Passive Low Energy Buildings on the Basis of Multi-ObjectiveOptimization Methodby Taking Cold Zone Residential Buildings for Example. J. South China Univ. Technol. 2018, 46, 98–104+120. [Google Scholar]
  92. Li, Q.; Yang, X.; Yang, W. BlM-based LCA and LCC Study on Small Scale Energy Efficient Buildings. South Archit. 2017, 45–50. [Google Scholar]
  93. Wang, R.; Wang, H.; Fan, T.; Zhang, S. Design of Rooftop Photovoltaic Solar Thermal System Based on Different Area Ratios. Sci. Technol. Eng. 2021, 21, 14576–14581. [Google Scholar]
  94. Carpino, C.; Chen Austin, M.; Mora, D.; Arcuri, N. Retrofit Measures for Achieving NZE Single-Family Houses in a Tropical Climate via Multi-Objective Optimization. Buildings 2024, 14, 566. [Google Scholar] [CrossRef]
  95. Zhen, M.; Sun, C.; Dong, Q. Optimal design of rural residential thermal environment in Northeast cold region. J. Harbin Inst. Technol. 2016, 48, 183–188. [Google Scholar]
  96. Jin, H.; Shao, T. Research on the design of passive low-energy houses in villages and towns in cold regions based on multi-objectives. Contemp. Archit. 2021, 51–54. [Google Scholar]
  97. Lu, H.; Wang, Y. Analysis of the influence of enclosure structure performance on heating energy consumption of new rural residential buildings in cold areas. Build. Energy Effic. 2018, 46, 61–63. [Google Scholar]
  98. Ding, Y. Comparative Study on Thermal Performance of Vertical Envelope Structure of Rural Residential Buildings in Hu Bbao E Area; Inner Mongol University of Technology: Hohhot, China, 2021. [Google Scholar]
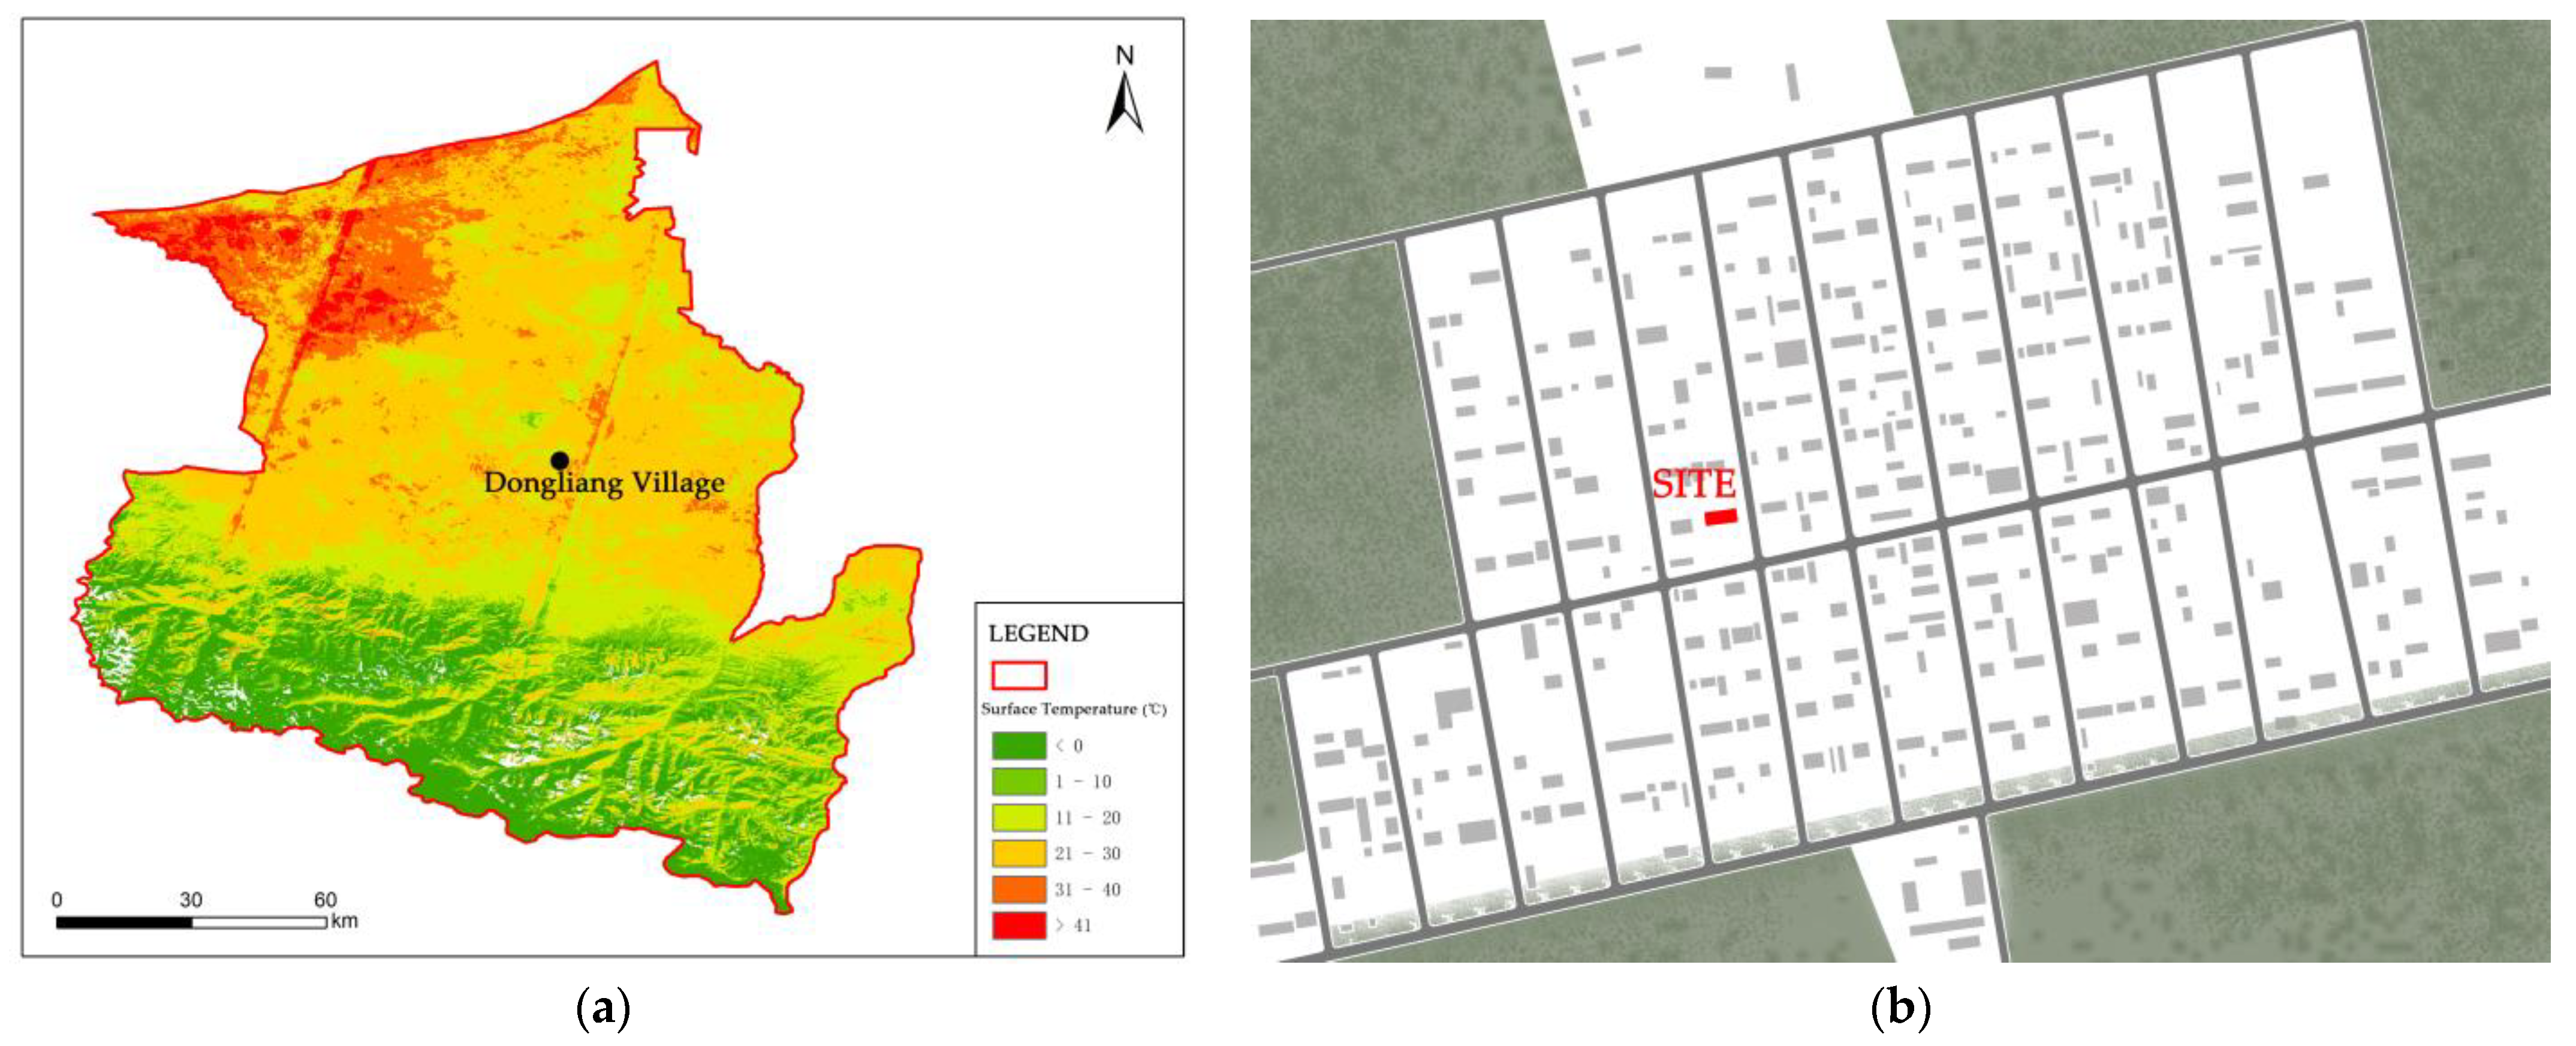
Figure 1. (a) Scope of the Wusu area; (b) overview of Dongliang Village (“SITE” represents the location of the benchmark rural homestead).
Applsci 14 03760 g001
Figure 2. Brick and concrete rural house floor plan.
Applsci 14 03760 g002
Figure 3. Solar radiation as a function of panel tilt/orientation.
Applsci 14 03760 g003
Figure 4. Rural dwelling energy consumption model.
Applsci 14 03760 g004
Figure 5. (a) Daily coal consumption; (b) heating energy consumption and temperature diagram.
Applsci 14 03760 g005
Figure 6. (a) Monthly output electricity; (b) monthly flat-plane irradiance.
Applsci 14 03760 g006
Figure 7. Solution set.
Applsci 14 03760 g007
Figure 8. Relative closeness coefficient C value of the retrofitting schemes.
Applsci 14 03760 g008
Figure 9. Comparison of thermal load during the heating period.
Applsci 14 03760 g009
Table 1. Standard rural house enclosure structure.
Enclosure StructureStructure (from Outer to Inner)Heat Transfer Coefficient W/(m2·K)
External Wallceramic tile, 20 mm cement mortar, 490 mm porous brick KP1, and 20 mm mixed mortar0.95
Roof20 mm cement mortar, 120 mm cast-in-place reinforced concrete, and 20 mm mixed mortar3.79
Exterior WindowPlastic steel window2.8
Interior Wall20 mm mixed mortar, 300 mm porous brick KP1, and 20 mm mixed mortar1.40
Floor20 mm cement mortar, 100 mm concrete cushion layer, and compacted soil3.25
Exterior DoorSingle-layer steel fire door1.76
Table 2. Parameters of photovoltaic modules.
ParameterValueParameterValue
Component TypeMonocrystalline SiliconPeak Power Voltage (V)34.7
Number of Components20Peak Power Current (A)10.96
Component Size (mm)1755 × 1038 × 30Irradiance Gref (W/m2)1000
Maximum Power PMAX (W)380Power Temperature Coefficient (%/°C)−0.34
Open Circuit Voltage Voc (V)41.44Bifacial Coefficient0.7
Short Circuit Current Isc (A)11.67Rated Cell Operating Temperature (°C)45
Table 3. Retrofit measure variables.
Retrofit AreaParameter VariableValue RangeSimulation Step SizeInitial Investment
External WallEPS Board10–300 mm10 mm260 CNY/m3
XPS Board10–300 mm10 mm600 CNY/m3
Rock Wool Board10–300 mm10 mm310 CNY/m3
RoofEPS Board10–300 mm10 mm260 CNY/m3
XPS Board10–300 mm10 mm600 CNY/m3
Rock Wool Board10–300 mm10 mm310 CNY/m3
Farmhouse Story HeightStory Height2700–3600 mm100 mm/
Window-Wall RatioSouth-facing window/wall ratio0.20–0.450.01/
North-facing window/wall ratio0–0.250.01/
East/west-facing window/wall ratio0–0.300.01/
Window Type6 mm clear, 12 mm air, and 6 mm clear2.8 W/(m2·K)Select by type780 CNY/m2
6 mm high-transmittance low-E, 12 mm air, and 6 mm clear1.9 W/(m2·K)800 CNY/m2
6 mm medium-transmittance low-E, 12 mm air, and 6 mm clear1.8 W/(m2·K)800 CNY/m2
6 mm high-transmittance low-E, 12 mm argon, and 6 mm clear1.5 W/(m2·K)820 CNY/m2
6 mm medium-transmittance low-E, 12 mm argon, and 6 mm clear1.4 W/(m2·K)820 CNY/m2
Triple glazing (5 mm clear, 12 mm air, 5 mm clear, 12 mm air, and 5 mm clear)1.7 W/(m2·K)880 CNY/m2
Triple glazing (5 mm medium-transmittance low-E, 12 mm air, 5 mm low-E, 12 mm air, and 5 mm clear)1.2 W/(m2·K)920 CNY/m2
Photovoltaic ModulesAngle35°875 CNY/m2
Area36.43 m2Number of component blocks
Table 4. Initial Performance of the Baseline Building.
TypeExterior Wall Additional Insulation LayerRoof Additional Insulation LayerFloor Height (m)South-Facing WWRNorth-Facing WWRHeating Load per Unit of Building Area (kWh/m2)
Baseline BuildingNoneNone3.00.230.10211.51
Table 5. Results of entropy weight calculation.
IndicatorEntropy ValueDifference CoefficientWeightRank
Story height0.960.040.1124
Roof insulation thickness0.950.050.1393
External wall insulation thickness0.920.080.2171
East-facing WWR0.910.090.2416
North-facing WWR0.970.030.0925
South-facing WWR0.950.050.1402
West-facing WWR0.980.020.0597
Disclaimer/Publisher’s Note: The statements, opinions and data contained in all publications are solely those of the individual author(s) and contributor(s) and not of MDPI and/or the editor(s). MDPI and/or the editor(s) disclaim responsibility for any injury to people or property resulting from any ideas, methods, instructions or products referred to in the content.