1. Introduction
The deformation modulus of a rock mass is one of the most salient design parameters in a variety of rock engineering applications, but it is also one of the hardest to evaluate. This is because, as well as intact blocks, a rock mass contains a large number of discontinuities that strongly influence its deformation performance, especially in hard rock. These discontinuities have a certain regularity on a macroscopic scale, but they are actually randomly distributed from the perspective of engineering impact. Moreover, the geometric characteristics of discontinuities, such as their length, occurrence, aperture, and filling, vary between different parts of the engineering rock mass. These characteristics greatly complicate the determination of the deformation modulus of the mass. To date, several approaches have been taken to resolving this problem, including obtaining the deformation modulus through (1) in situ testing, such as plate loading or jacking tests, (2) empirical methods, which use the relationship between the deformation modulus of the rock mass and its quality classification or a geological index such as the RMR (rock mass rating), GSI (geological strength index), Q-system, or RQD (rock quality designation), (3) geophysical methods, usually seismic wave velocity tests, and (4) estimates from equivalent continuous models. Of these methods, in situ tests are time-consuming and expensive, limiting their application in small and medium rock engineering operations, or at the initial stages of a project. Moreover, due to differences in rock mass structure and the size effect of rock mass deformation tests, in situ tests can only represent the deformation performance at a certain point, so many researchers and geological engineers have tended towards the use of empirical methods to provide information on the modulus of deformation.
Empirical estimation is performed using a variety of methods, most of which establish a correlation between various rock mass classifications or a single geological index and the deformation modulus [
1,
2,
3,
4,
5,
6,
7,
8,
9,
10,
11,
12,
13]. These correlations are useful for practical applications. Importantly, these rock mass classifications and geological indicators are readily available in the field.
Among the commonly used rock mass quality grading systems, the RMR and Q systems are mainly used in underground engineering. The BQ (basic quality) system is the Chinese standard for engineering classification of rock masses [
14] and is applicable in various rock engineering operations. Similar to the RMR method, this system classifies rock mass quality through two steps. Firstly, the basic quality of the rock mass is assessed using the geological index of uniaxial compressive strength (UCS) and the rock intactness index (K
v). Both of these are quantitative indexes that can be obtained through laboratory or in situ testing, thus reducing the influence of subjective factors relating to the geological engineer. Secondly, the final rating for the rock mass is obtained by adjusting this value considering the groundwater, ground stress, and discontinuities according to different rock engineering operations, for example, a dam foundation, slope, or tunnel. This paper first introduces the BQ method, and then proposes a new relationship between the BQ method and the deformation modulus of rock masses based on data from in situ measurements from three large hydropower stations in China.
2. The BQ Rock Mass Quality Classification Method
2.1. Brief Review of the BQ System
The BQ system was first proposed to evaluate the stability of engineering rock masses and assist the design of support measures in July 1995. It has been adopted as the national standard and has been applied successfully in most rock engineering fields. It was developed based on 157 domestic civil engineering cases (i.e., 30 underground metal mines, 55 underground hydropower caverns, 21 underground defense constructions, 21 railway and highway tunnels, 21 building foundations, 8 coal mines, and 1 underground civil air defense construction). The qualities of these rock masses were evaluated on the basis of the parameters that control engineering rock mass stability, using the following equation:
Here:
is the basic quality of the rock mass.
is the uniaxial compressive strength (), in .
is the rock intactness index, which can be calculated from the seismic wave velocity within the rock mass, V
pm, and that within intact rock, V
pr, using the following formula:
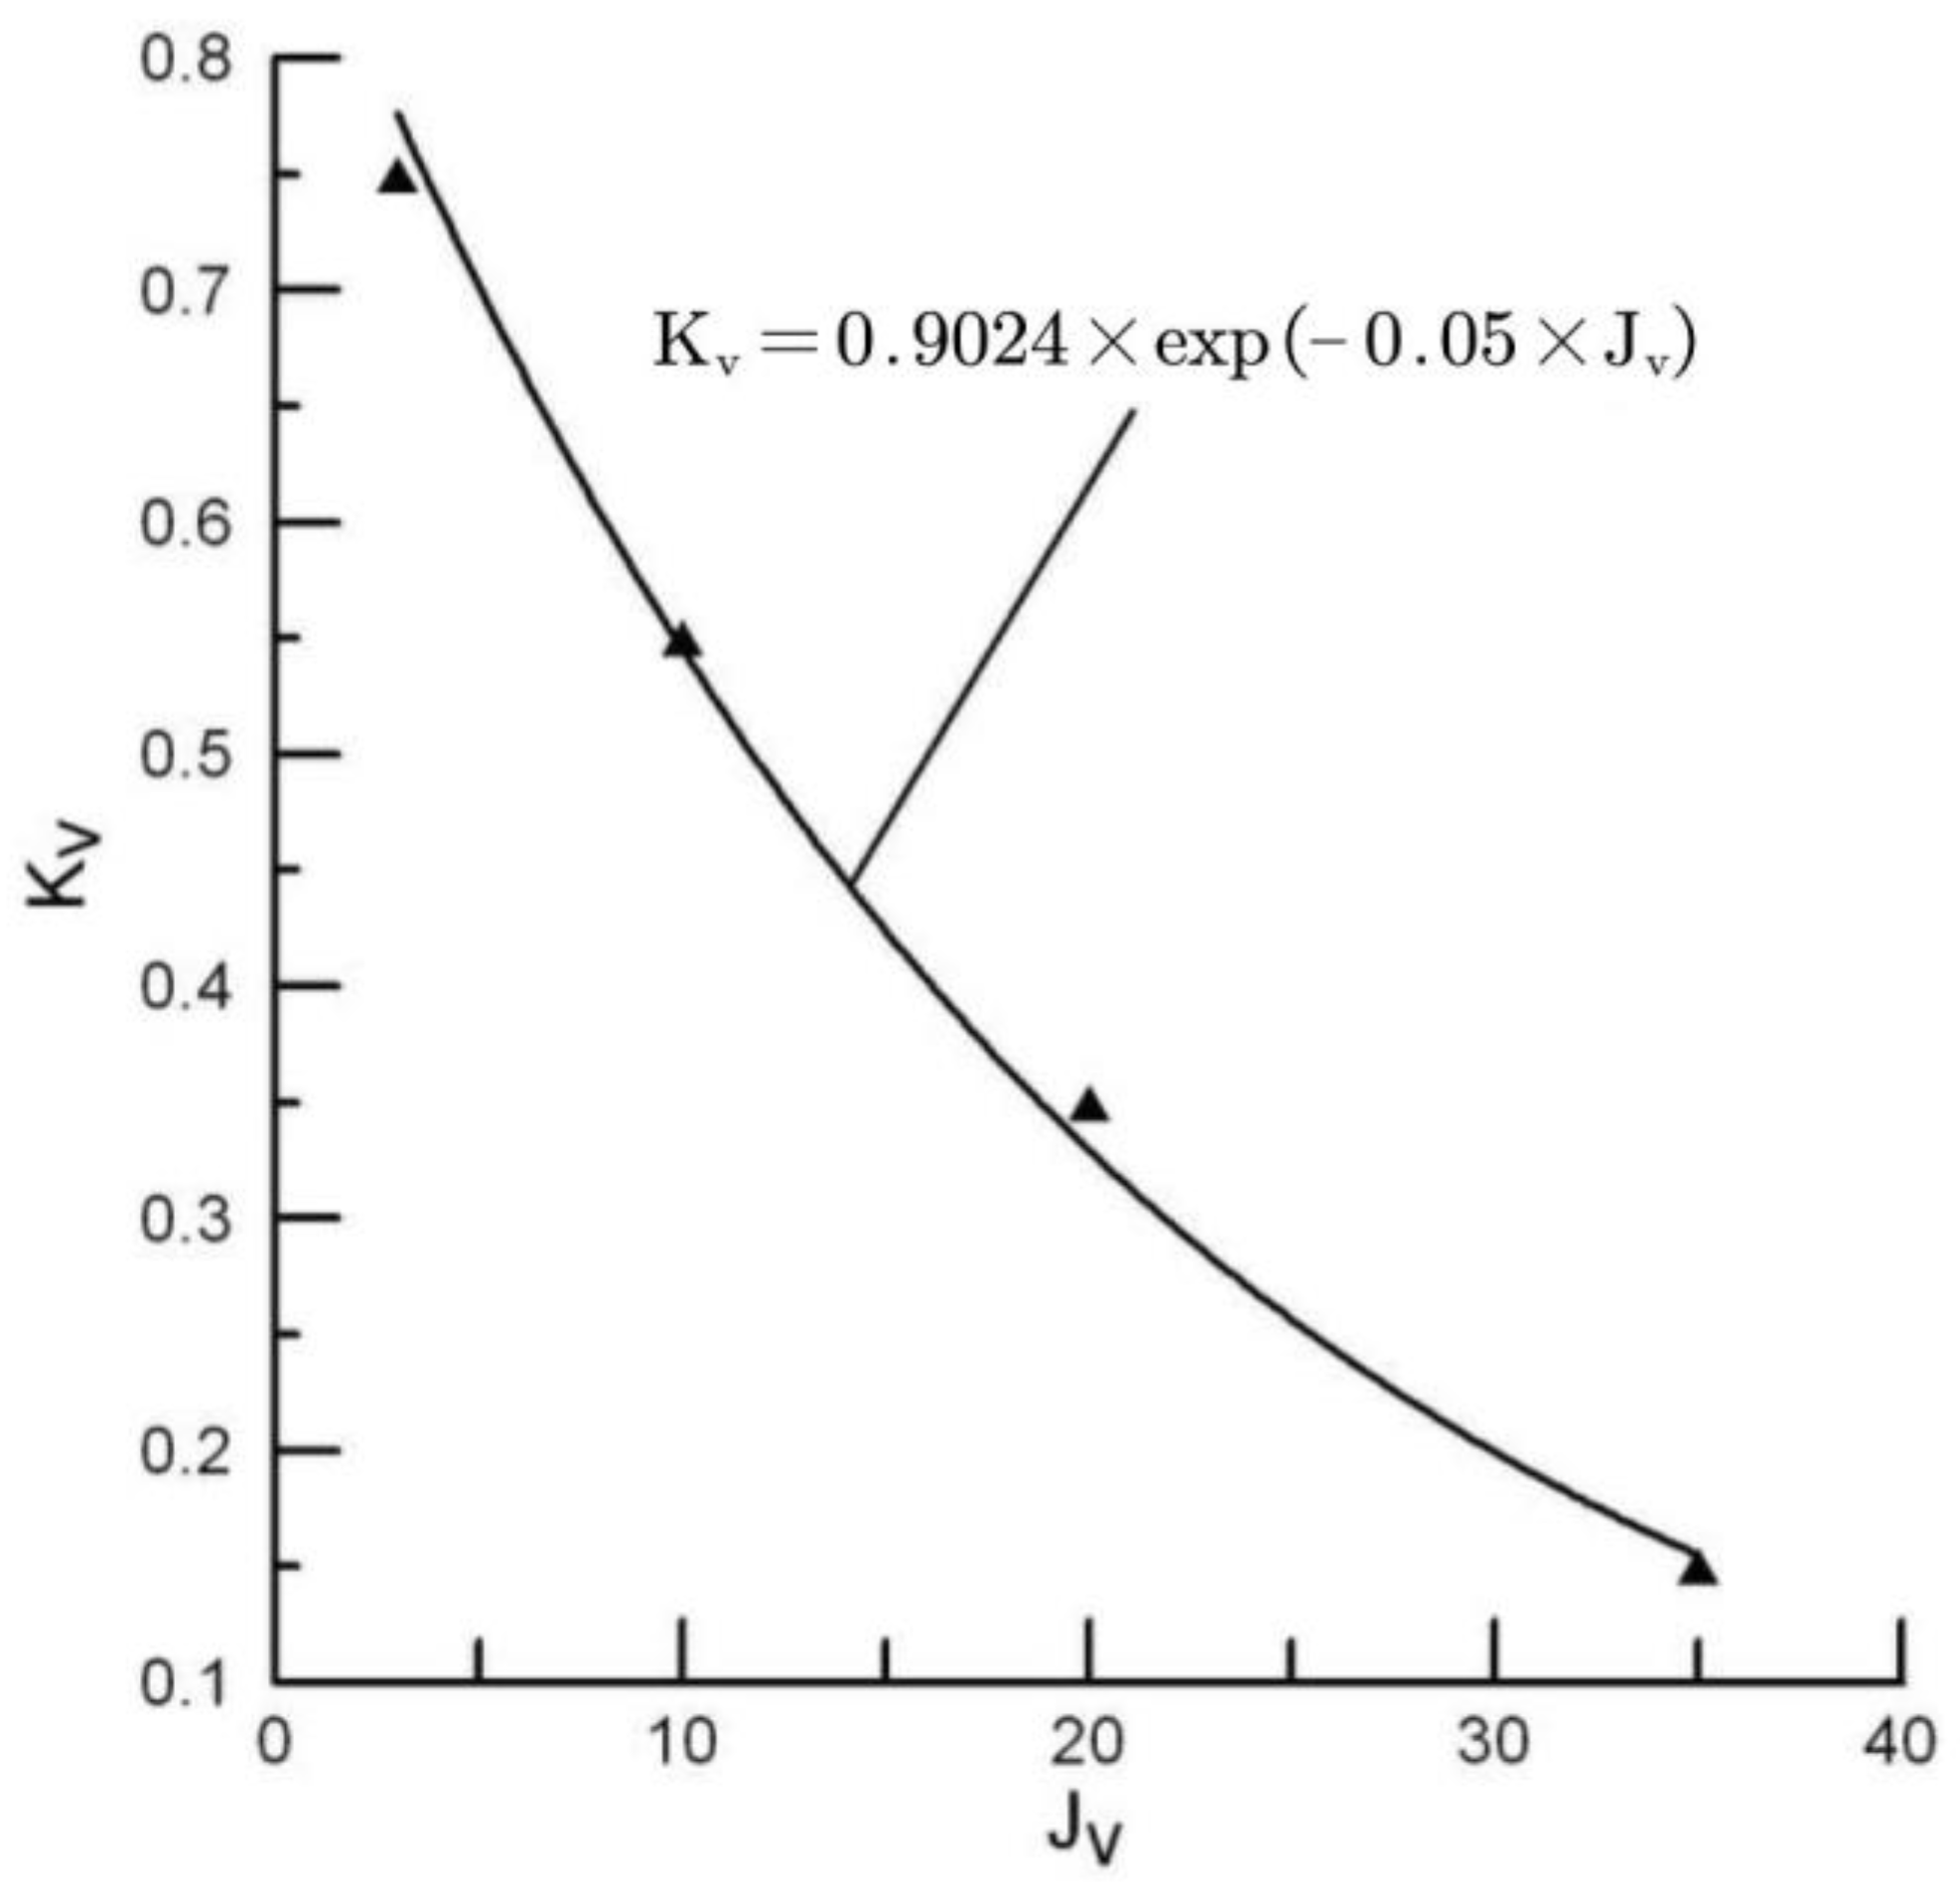
The rock intactness index (
) can also be obtained by measuring the volumetric joint count within the rock mass (
). The relationship between these values is shown in
Table 1 and
Figure 1 (GB/T 50218-2014, 2014) [
14].
Two important constraint criteria should be applied when applying Equation (1) to obtain the BQ value: (1) when the condition that is met, should be substituted for ; (2) when , should be substituted with the equation .
The BQ system divides rock masses into five classes according to the value obtained with Equation (1) (
Table 2).
To date, the BQ method has seen widespread use in diverse rock engineering projects in China [
15,
16,
17,
18,
19,
20], and has proved a suitable classificatory method for evaluating rock mass quality.
2.2. Correlation between the BQ Value and Rock Mass Deformation Modulus
The BQ system suggests deformation modulus values for rock masses of different BQ grades on the basis of data from in situ measurements. The base data were gathered from 897 samples in 65 projects and cover 21 rock types, including granite, dolomitic limestone, limestone, sandstone, tuff, marble, shale, and mudstone. A total of 89, 184, 262, 184 and 178 of these samples are classified as having a basic quality rating of I, II, III, IV, and V, respectively. The maximum measured value is 72.2 GPa (fresh and intact plagioclase granite), and the minimum is 0.003 GPa (cataclastic fault rock). The statistical results for the deformation modulus of rock masses of each rating are shown in
Table 3.
The deformation moduli recommended by the BQ system, according to
Table 3, are shown in
Table 4.
As can be seen from
Table 4, an interval, rather than a single value, is suggested for the deformation modulus of each BQ class. The system does not provide any further information on how to determine the modulus of deformation for a specific BQ value. This makes it necessary to establish a quantitative formula by which it can be estimated, as with the correlations between RMR, Q-system, etc. and the rock mass deformation modulus. With this aim in mind, this paper collects more than 60 in situ measurements from the Laxiwa hydropower station, Zhen’an pumped storage power station, and Maerdang hydropower station in China, including six rock types (breccias, monzonite, metasandstone, granite, marble, and granodiorite). The BQ value at each test point is also quantitatively calculated. A new relationship between the deformation modulus and the BQ value is then proposed on the basis of the results. Further, the paper develops indirect estimation formulas based on the existing empirical formula and the relationship between BQ and other rock mass classification schemes.
3. Engineering and Geological Background, Test Methods, and Results
3.1. Maerdang Hydropower Station
The Maerdang dam and hydropower project is located in the main channel of the Yellow River, about 5 km upstream of the town of La Jia, Ma Qin County, Qinghai province, in the hinterland of the Qinghai Tibet Plateau. The area has a seismic intensity level VII. Its barrage is a rock-fill dam with a maximum height of 215 m, and a normal water level of el. 3275 m.
The rock mass of the dam foundation is mainly Middle and Upper Triassic metasandstone, along with Mesozoic monzonite and tertiary breccias, all of which can be classified as hard rock. The development law of discontinuities in the three rock masses is basically the same, which can be generally divided into four groups, all in a flat, straight, and closed state.
The deformational properties of the dam foundation rock mass were investigated using a total of 26 plate loading deformation tests, of which 11 were on metasandstone, 13 on monzonite, and 2 on breccia. Additionally, to obtain the BQ value and subsequently establish the relationship between this and the deformation modulus of the rock mass, the seismic wave velocity along the adit wall near each test site was measured, and a detailed survey was performed on joints in the rock mass. The experimental methods strictly followed the guidelines outlined in the Code for rock tests in water and hydropower projects (SL/T 264-2020) [
21].
Because an intensely weathered rock mass cannot normally be used as a dam foundation, the deformation tests were mainly carried out in slightly or moderately weathered rock masses: 19 were slightly weathered, 6 were moderately weathered, and only 1 was intensely weathered. The tests were divided into horizontal and vertical tests, according to the loading direction; the former was conducted on the adit wall, and the latter on the floor (shown in
Table 5).
All test points were machined by hand. The diameter of the rock surface was in the order of 60 cm, and that of the bearing plate was 40 cm. Surface undulation was limited to less than 5 mm. A total of five loading and unloading cycles were carried out at a time-controlled loading rate, with a minimum load of 1.280 MPa and a maximum of 9.088 MPa. The deformation modulus of the rock mass was calculated according to the formula of the local load on the surface of a semi-infinite elastic body assumed to be uniform, continuous, and isotropic. Considering that the actual load of a tall dam is generally very high and the deformation modulus is relatively higher at low stress, the final deformation modulus for each test point was determined as the mean value of the deformation modulus calculated for the last three loading stages.
3.2. Laxiwa Hydropower Station
The Laxiwa dam site is located at the Longyangxia outlet section of the Yellow River, with seismic intensity level VII. It is a double-curvature concrete arch dam with a maximum height of 250 m.
The Laxiwa dam site is situated in a Mesozoic Indosinian granite formation with a medium coarse-grained structure. The main mineral components are quartz, feldspar, biotite, and hornblende. Rock joints generally have high dip angles, are straight and closed, and can be divided into four groups according to their extension direction.
More than 60 plate loading tests were carried out at the selected dam site, of which only 16 were characterized in detail to estimate BQ values (
Table 6).
Deformation tests were performed using the aforementioned method. Most of the test loads were 7~11 MPa, suitable values for reflecting the deformation characteristics of a rock mass under heavy load.
3.3. Zhen’an Pumped Storage Power Station
The Zhen’an pumped storage power station is located in Yuehe Township, Shangluo City, Shaanxi Province, about 128 km away from Xi’an. The seismic intensity in the dam site area is level VI. Its key components include an upper reservoir, lower reservoir, water conveyance system, underground powerhouse, switch station, and other facilities. The lower reservoir, situated in the main channel of the Moon River, features a maximum dam height of 94 m and a normal water level of elevation 944 m. On the other hand, the upper reservoir, nestled in the Jinpen valley on the right bank of the Moon River, boasts a maximum dam height of 120 m and a normal water level of elevation 1386 m. The barrage is constructed as a concrete-faced rock-fill dam.
The dam site of the upper reservoir primarily rests upon Middle Devonian strata (marble and crystallized limestone) and Indosinian intrusive granodiorite. The rock mass exhibits 3–4 sets of rock joints across all types, with the bedding plane of crystallized limestone featuring a low-angle dip, while others exhibit medium or high dip angles. Nearly all of the rock joints are straight and closed.
The lower reservoir dam site is mainly composed of Indosinian intrusive granodiorite. Its joints have very similar characteristics to those in the upper reservoir rocks.
A total of 24 in situ plate loading rock mass deformation tests were carried out in two types of rock: marble and granodiorite. Ten were in slightly weathered rock, and fourteen in moderately weathered rock.
Table 7 lists the results of the tests.
4. Estimation of Deformation Modulus Based on BQ
It can be seen from the above that the rock masses at the test sites are mainly moderately or slightly weathered, with only two being intensely weathered. The BQ values at the test sites range between 284 and 681, corresponding to rock mass ratings of I to IV.
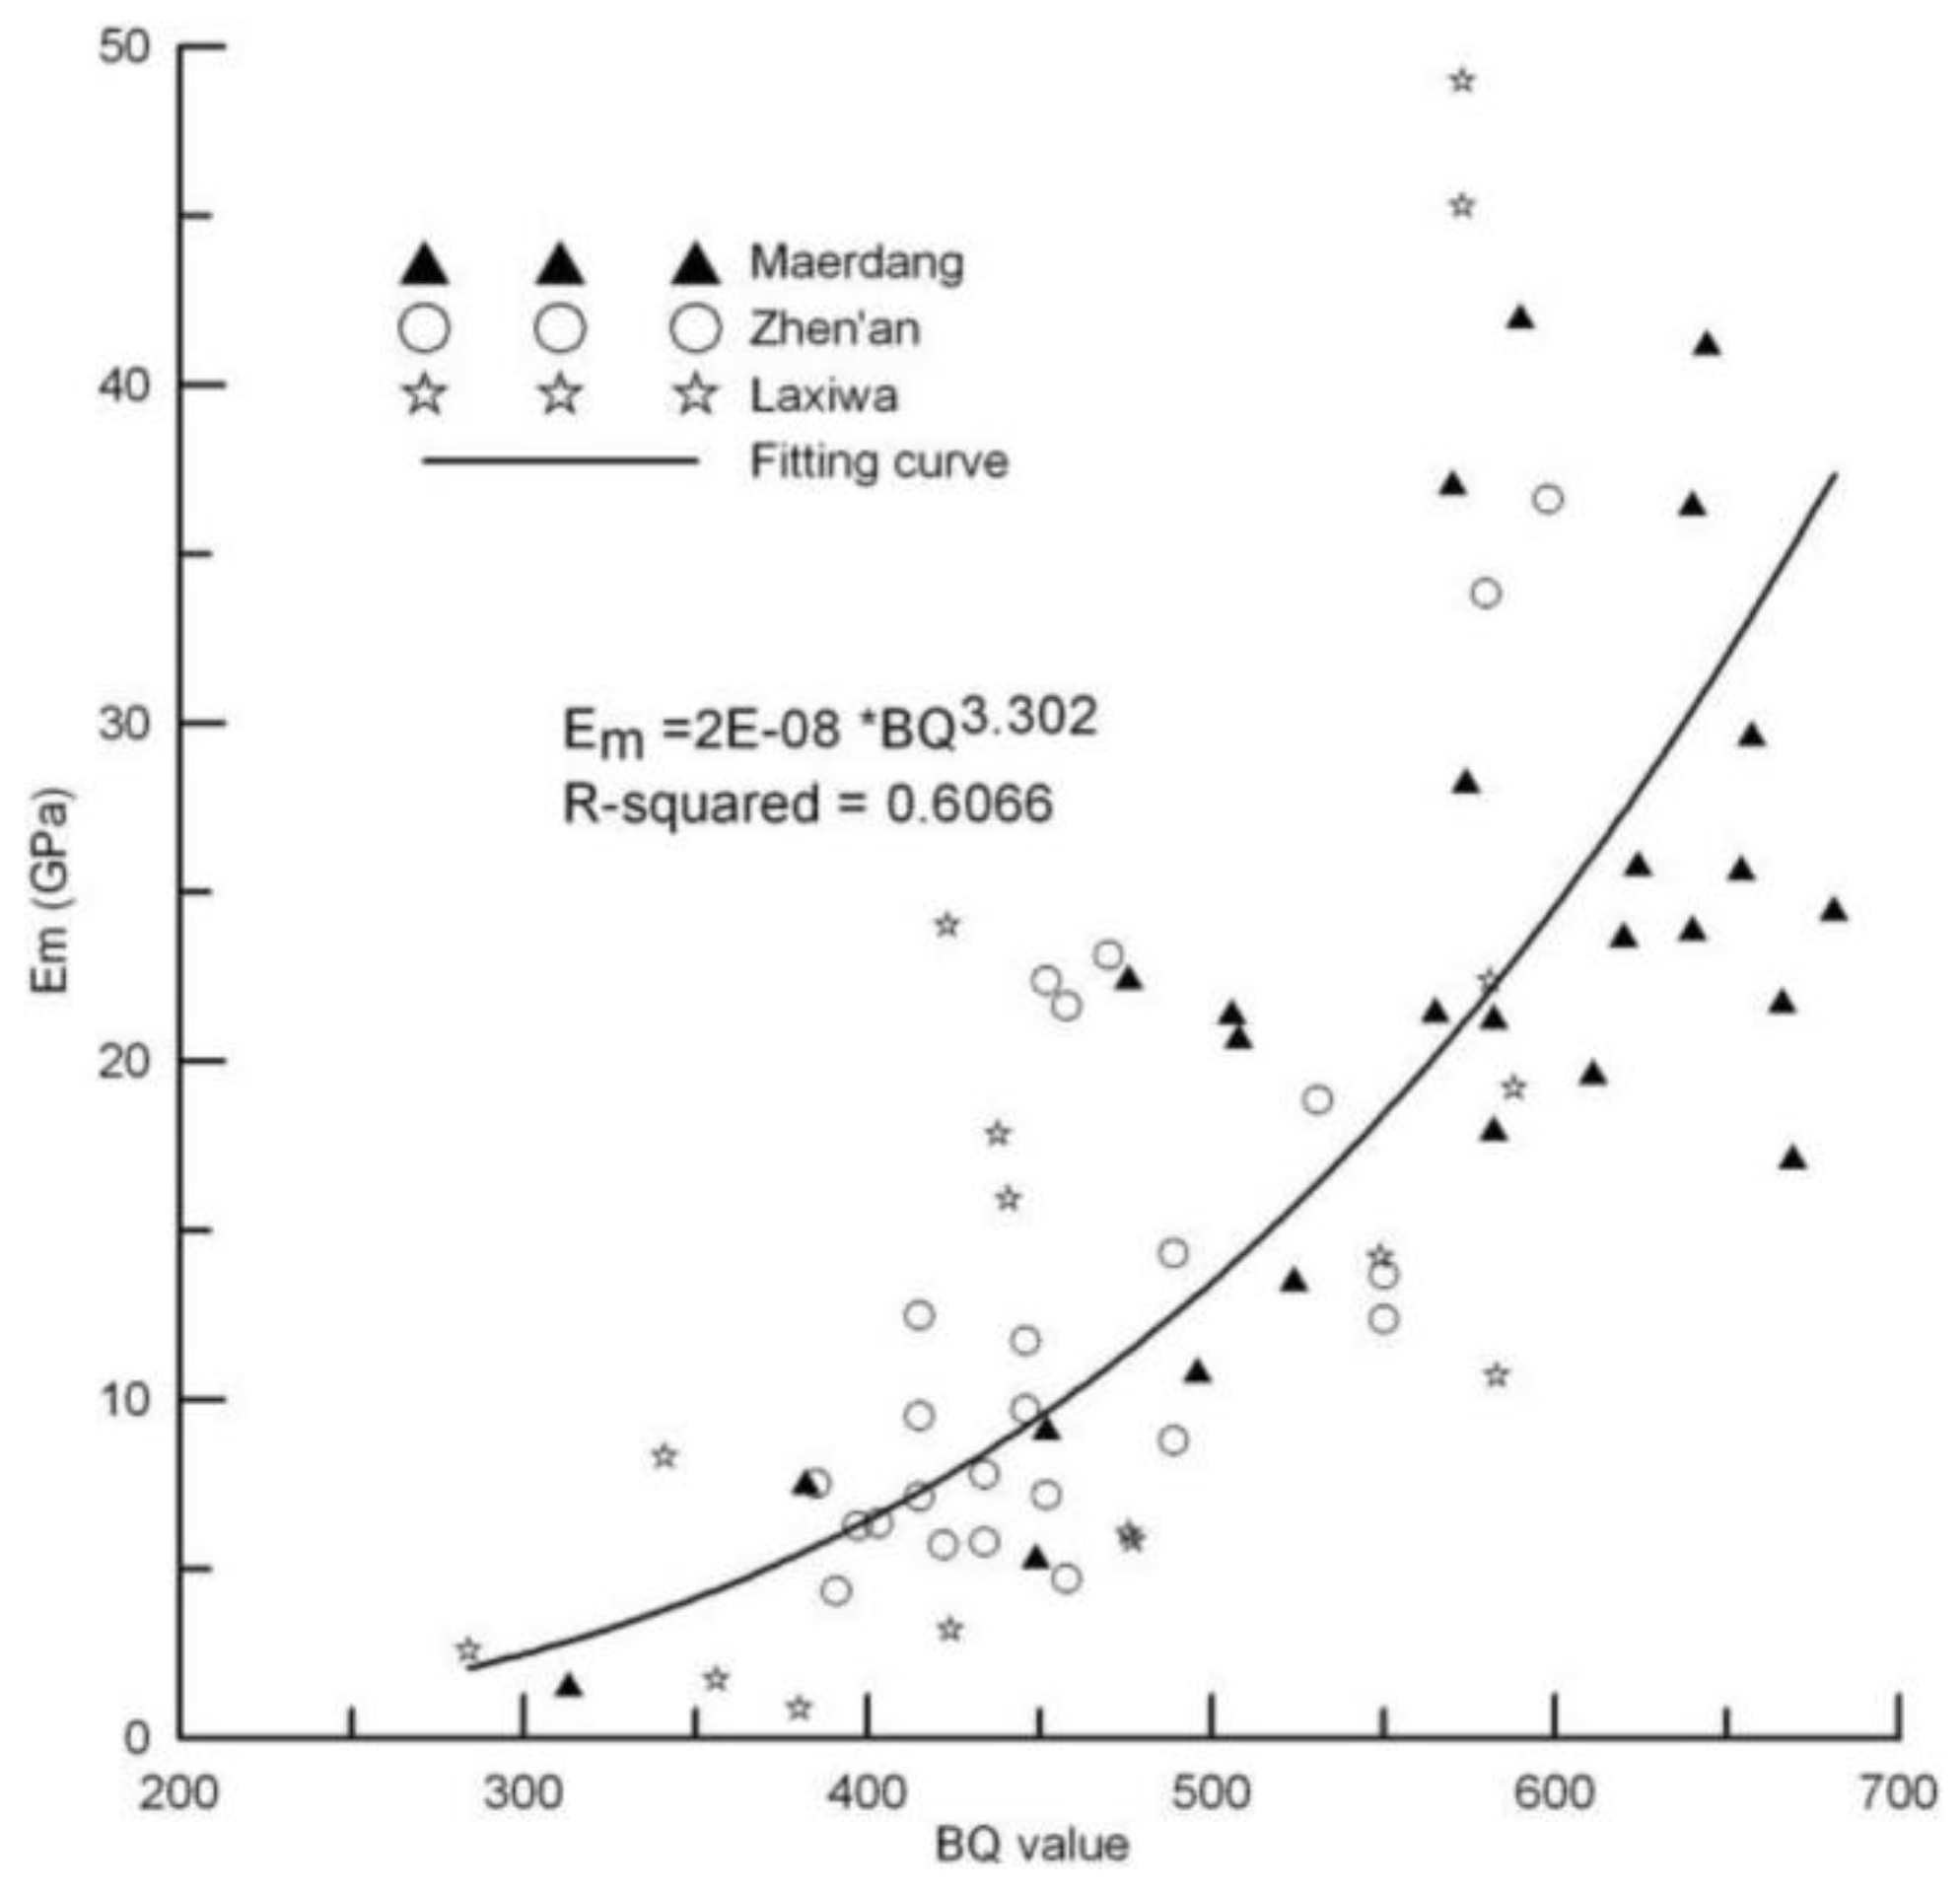
Table 8 shows the range and mean value of the deformation moduli obtained via the plate loading tests of rock masses of different grades at the three hydropower stations, and
Figure 2 reflects the relationship between these deformation moduli and the BQ value.
As shown in
Figure 2, the relationship between the deformation moduli of the rock masses and their BQ values can be expressed as the power function:
where
is the deformation modulus of the rock mass in GPa.
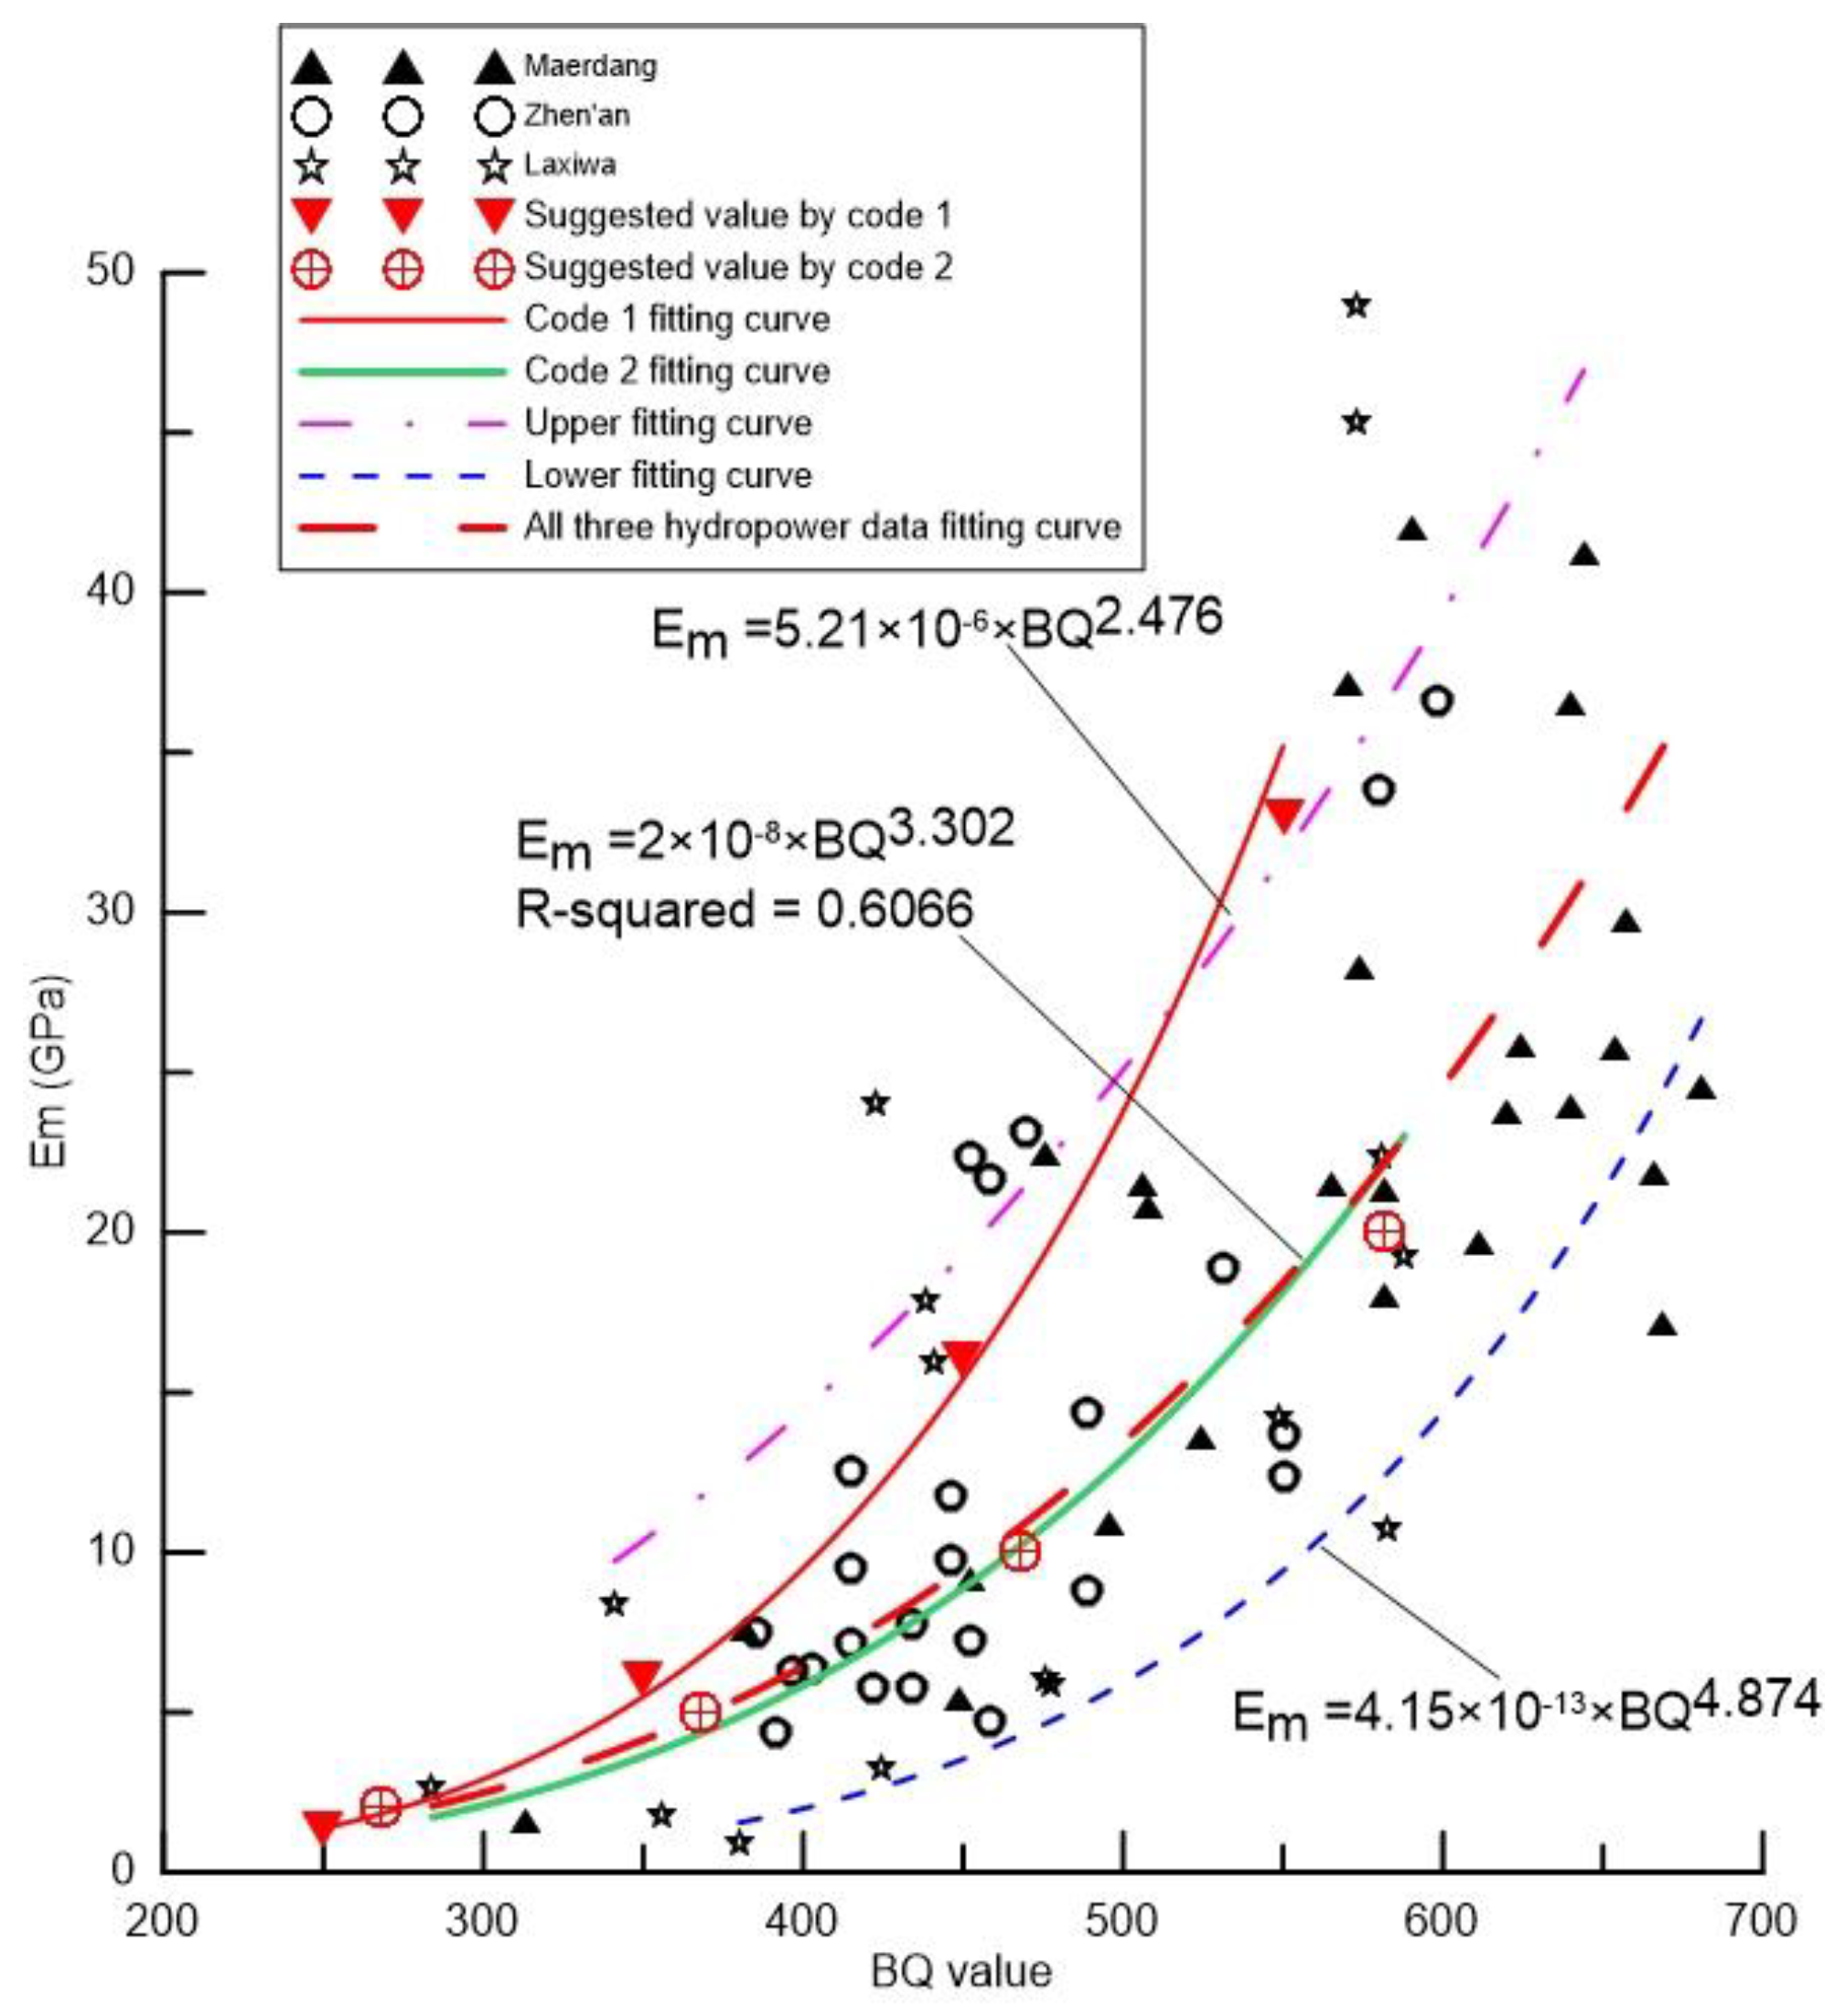
Although the rock mass deformation modulus has a good relationship with the BQ value, it still lies within in a certain range at the same BQ value. It is therefore necessary to fit upper and lower bounding curves to the scatter data (
Figure 3).
In addition, the deformation moduli suggested by the Chinese current specifications are also scattered in
Figure 3. “Code 1” in the figure refers to the Chinese Standard for engineering classification of rock masses (GB/T50218-2014) [
14]. It can be seen that the recommended values of the specification are located between the fitting median and the highest values, more closely approaching the upper fit line.
As mentioned before, the deformation test results quoted by Code 1 are derived from various rock mass projects, most of which require a relatively lower test load than is relevant for hydropower projects. The Code 1 dataset will have yielded relatively high values because a lower test load corresponds to a higher deformation modulus, especially for a high-quality rock mass (the first loading-unloading cycle should be excluded, as most joint closure takes place during this stage).
Code 2 in the figure refers to the Chinese Code for engineering geological investigation of water resources and hydropower (GB50487-2008) [
22], which also gives proposed values for the rock mass deformation modulus according to the rock mass quality classification. Although this classification uses an independent system, it is roughly consistent with Code 1 when transforming the classification index into a BQ value (
Table 9).
As shown in
Figure 3, the deformation moduli suggested by Code 2 are very close to the fitting curve, showing that Formula (3) established in this paper provides good predictions of the deformation modulus of a dam foundation rock mass based on the BQ value.
5. Indirect Estimation of the Deformation Modulus Based on the Relationship between BQ and Other Classification Schemes
Many methods of indirect estimation of the deformation modulus have been studied and used in practical engineering, including the RMR and Q-system methods.
Table 10 lists the formulas widely used in the above methods.
Code 1 puts forward a regression equation relating BQ to RMR based on statistical analysis of more than 200 sets of measured data:
Song et al. (2012) also established a correlation between BQ and RMR when studying the rock mass quality at Maerdang hydropower station:
The above two formulas establish a bridge between BQ and RMR. Also, RMR has the following correlations with the Q-system classification:
These relationships and the correlations listed in
Table 10 can be used to develop a series of formulas for predicting the rock mass deformation modulus from the BQ value (
Table 11).
Figure 4 shows the curves derived from Formulas (7)–(14) to predict the deformation modulus of a rock mass, plus the measured mean values of the deformation modulus for class I to V rock masses according to Code 1 and the values recommended by Code 2.
It should be noted that Code 1 is a general standard that is applicable to various rock projects, while Code 2 was designed for dam foundations, where there is a heavy load. This difference may be the main reason for the difference between the values recommended by the two codes. As mentioned above, the deformation modulus is related to the test load. Within a certain range, the modulus of a poor quality rock mass may differ little under different loads. However, for a rock mass of good quality, a large test load can cause more deformation than a small load, thus making the modulus value lower.
In general rock mass engineering (not including projects with a large load such as the foundation of a high dam), it can be seen from
Figure 4 that Formulas (8), (10) and (11) provide good fits for the measured mean values (according to Code 1); Formulas (3), (12) and (13) provide a relatively low predicted value; and the other formulas have different limitations or deficiencies.
For the engineering of high dam foundations where the load is heavy, only Formula (3) (
Figure 3 and
Figure 4) provides a good fit for the values suggested by Code 2; most of the other formulas predict an excessively high value.
Based on the above, it is proposed that Formulas (8) and (11), and especially Formula (10) (given its exceptionally good fit to the mean measured Code 1 values), should be used to predict the deformation modulus of rock masses in general rock mass engineering; for rock projects where there is a large load, Formula (3), which was established in this paper, is recommended.
The above established formulas originate from different engineering projects and involve the transformation of different related relationships. Therefore, although the aforementioned formulas can predict the deformation modulus of rock masses well, there may still be certain inaccuracies in certain situations. In view of this, further analysis and verification using some numerical methods may help to correctly understand the deformation characteristics of rock masses.
6. Conclusions
Based on data from 66 sets of in situ measurements from three large hydropower stations in China and the BQ values at each test point, this study established a formula (Formula (3)) for predicting the deformation modulus. The formula shows a good fit to the values suggested by the Chinese Code for engineering geological investigation of water resources and hydropower (GB50487-2008) and is thus suitable for making estimations in rock projects where there is a large load. For general rock engineering, Formula (3) predicts relatively low values, so indirect estimation methods based on the relationship between BQ and other classification schemes were developed. Among those, Formulas (8), (10), and (11) are recommended, due to their good fits to measured data.
Based on the above, the formula for estimating the deformation modulus of rock masses based on the BQ system established in this paper is not only applicable to hydropower engineering, but also to other engineering projects.


