Article

Texture Analysis in [18F]-Fluciclovine PET/CT Aids to Detect Prostate Cancer Biochemical Relapse: Report of a Preliminary Experience

by
Laura Travascio
1,†,
Sara De Novellis
2,†,
Piera Turano
2,
Angelo Domenico Di Nicola
1,
Vincenzo Di Egidio
3,
Ferdinando Calabria
4,
Luca Frontino
1,
Viviana Frantellizzi
5,
Giuseppe De Vincentis
5,
Andrea Cimini
6 and
Maria Ricci
7,*
1
Nuclear Medicine Operative Unit, Santo Spirito Hospital, 65100 Pescara, Italy
2
Medical Physics Operative Unit, Santo Spirito Hospital, 65100 Pescara, Italy
3
Radiology Operative Unit, Santo Spirito Hospital, 65100 Pescara, Italy
4
Department of Nuclear Medicine and Theragnostics, Mariano Santo Hospital, 87100 Cosenza, Italy
5
Department of Radiological Sciences, Oncology and Anatomo-Pathology, Sapienza University of Rome, 00161 Rome, Italy
6
Nuclear Medicine Unit, St. Salvatore Hospital, 67100 L’Aquila, Italy
7
Nuclear Medicine Unit, Cardarelli Hospital, 86100 Campobasso, Italy
*
Author to whom correspondence should be addressed.
These authors contributed equally to this work.
Appl. Sci. 2024, 14(8), 3469; https://doi.org/10.3390/app14083469
Submission received: 28 November 2023 / Revised: 26 March 2024 / Accepted: 4 April 2024 / Published: 19 April 2024
(This article belongs to the Special Issue Bioinformatics in Healthcare to Prevent Cancer and Children Obesity)

Abstract

:
Background. As artificial intelligence is expanding its applications in medicine, metabolic imaging is gaining the ability to retrieve data otherwise missed by even an experienced naked eye. Also, new radiopharmaceuticals and peptides aim to increase the specificity of positron emission tomography (PET) scans. Herein, a preliminary experience is reported regarding searching for a texture signature in routinely performed [F18]Fluciclovine imaging in prostate cancer. Materials and methods. Twenty-nine patients who underwent a PET/computed tomography (CT) scan with [18F]Fluciclovine because of biochemical prostate cancer relapse were retrospectively enrolled. First- and second-order radiomic features were manually extracted in lesions visually considered pathologic from the Local Image Features Extraction (LIFEx) platform. Statistical analysis was performed on a database of 29 lesions, one1 per patient. The dataset was split to have 20 lesions for the model training set and 9 lesions for the validation set. The Wilcoxon–Mann–Whitney test was used on the training set to select the most significant features (p-value < 0.05) predicting the dichotomous outcome in a univariate analysis. Results. The best model for predicting the outcome was found to be a multiple logistic linear regression model with two features as variables: an intensity histogram type and a gray-level size zone-based type. Conclusions. Texture analysis of [F18]Fluciclovine PET scans helps in defining prostate cancer relapse in a daily clinical setting.

1. Introduction

The extraction of radiomic features from digital medical tomographic images through mathematical models has gained interest in the Nuclear Medicine community, giving an opportunity to relate semiquantitative variables to outcomes for evidence-based clinical guidance [1,2,3]. Indeed, the clinical application of a radiomic model can be challenging because of the heterogeneity of the data collected, the lack of robustness of the radiomic features themselves, and bias derived from pre- and post-processing factors [4].
Innumerable radiomic features can be used alone or in combination with clinical variables such as size, shape, or, when talking about prostate cancer, serum prostate-specific antigen (PSA) to pursue precision medicine in order to predict the right treatment for the right patient [5]. First-order features describe individual voxels values, not accounting for spatial relationships between voxels. They report size, shape, and count density-; mean, median, max, and min intensity, and their skewness, kurtosis, uniformity, and randomness. Second-order textural features group voxels with similar statistics and are useful for measuring tumor heterogeneity. GreyThe Gray-Level Co-occurrence Matrix (GLCM) and Gray-level Run Length Metrix (GLRLM), respectively, account for the spatial relationships of pairs of pixels or voxels with predefined gray-level intensities and the spatial distribution of runs of consecutive pixels with the same gray level. Higher-order statistics search for pattern repetitions in the data [1,6,7].
Collecting radiomic features (RFs) requires several discrete steps, including either image acquisition, which has to be standardized at intra- and inter-institutional levels; the segmentation of the volume of interest (usually operator-dependent and therefore representing a critical phase); or the mathematical extraction of quantitative descriptors (statistical outputs) [2,4].
When extracted from functional imaging, namely positron emission tomography (PET) scans, these features signify aspects of radiotracer intensity (concentration), heterogeneity, and shape within the tumor, reflecting biological characteristics with potential value in the prediction of disease progression and aggressiveness [8,9].
Prostate cancer (PCa) biochemical recurrence (BCR) is detected early by a progressive increase in PSA serum levels over time in spite of castrate testosterone levels [10,11]. Specifically, BCR occurs in 20–40% of PCa patients after radical prostatectomy (RP) and in 30–50% of cases after radiotherapy (RT) within ten years [12]. Recurrence of prostate disease with metastatic disease occurs in one-third of men who experience BCR within 15 years of RP. Nonetheless, once BCR occurs, the right therapeutic approach depends on whether the disease is localized or disseminated, and functional imaging may address the right treatment. Conventional imaging, such as bone scans, computed tomography (CT), and magnetic resonance (MR), may fail to accurately assess the extent of recurrent disease, whilst eventual extrapelvic disease excludes patients from salvage radiation therapy [13,14].
[18F]Fluciclovine (anti-1-amino-3-F18-fluorocyclobutane-1-carboxylic-acid, i.e., [18F]FACBC) is a radiopharmaceutical that was recently approved by the US FDA (2016) and EMA (2018) for use in cases of biochemical relapse in prostate cancer. [18F]FACBC [15] is a radiolabeled analog of levorotatory leucine, taken up via the human L-type amino acid transporter (LAT) and alanine–serine–cysteine transporter systems (ASCT2), which are overexpressed in protein-synthetizing tissues and in many carcinomas, including prostate cancer [16]. Once in the cell, [18F]FACBC uses the same channel to exit unmodified, peaking in pathologic prostate tumors and physiologic pancreas tissue between 4 and 10 min after i.v. injection, decreasing within 15 min, progressively accumulating in muscles and red marrow. Minimal to no activity accumulates in the bladder, which rarely interferes with deep pelvis images examination. PET imaging to assess Pca relapse, therefore, begins 3–5 min after radiotracer injection, caudal to cranial. [18F]Fluciclovine uptake in tissues is compared to that in the blood pool, bone marrow, and liver, respectively being mild, moderate, and intense, respectively [16].
The aims of this study were to investigate whether a texture analysis of [18F]Fluciclovine PET scan in Pca patients can be routinely performed and to search for a radiomic signature that could predict prostate cancer aggressiveness alone or combined with clinical variables (PSA at diagnosis, PSA at [18F]Fluciclovine scan).

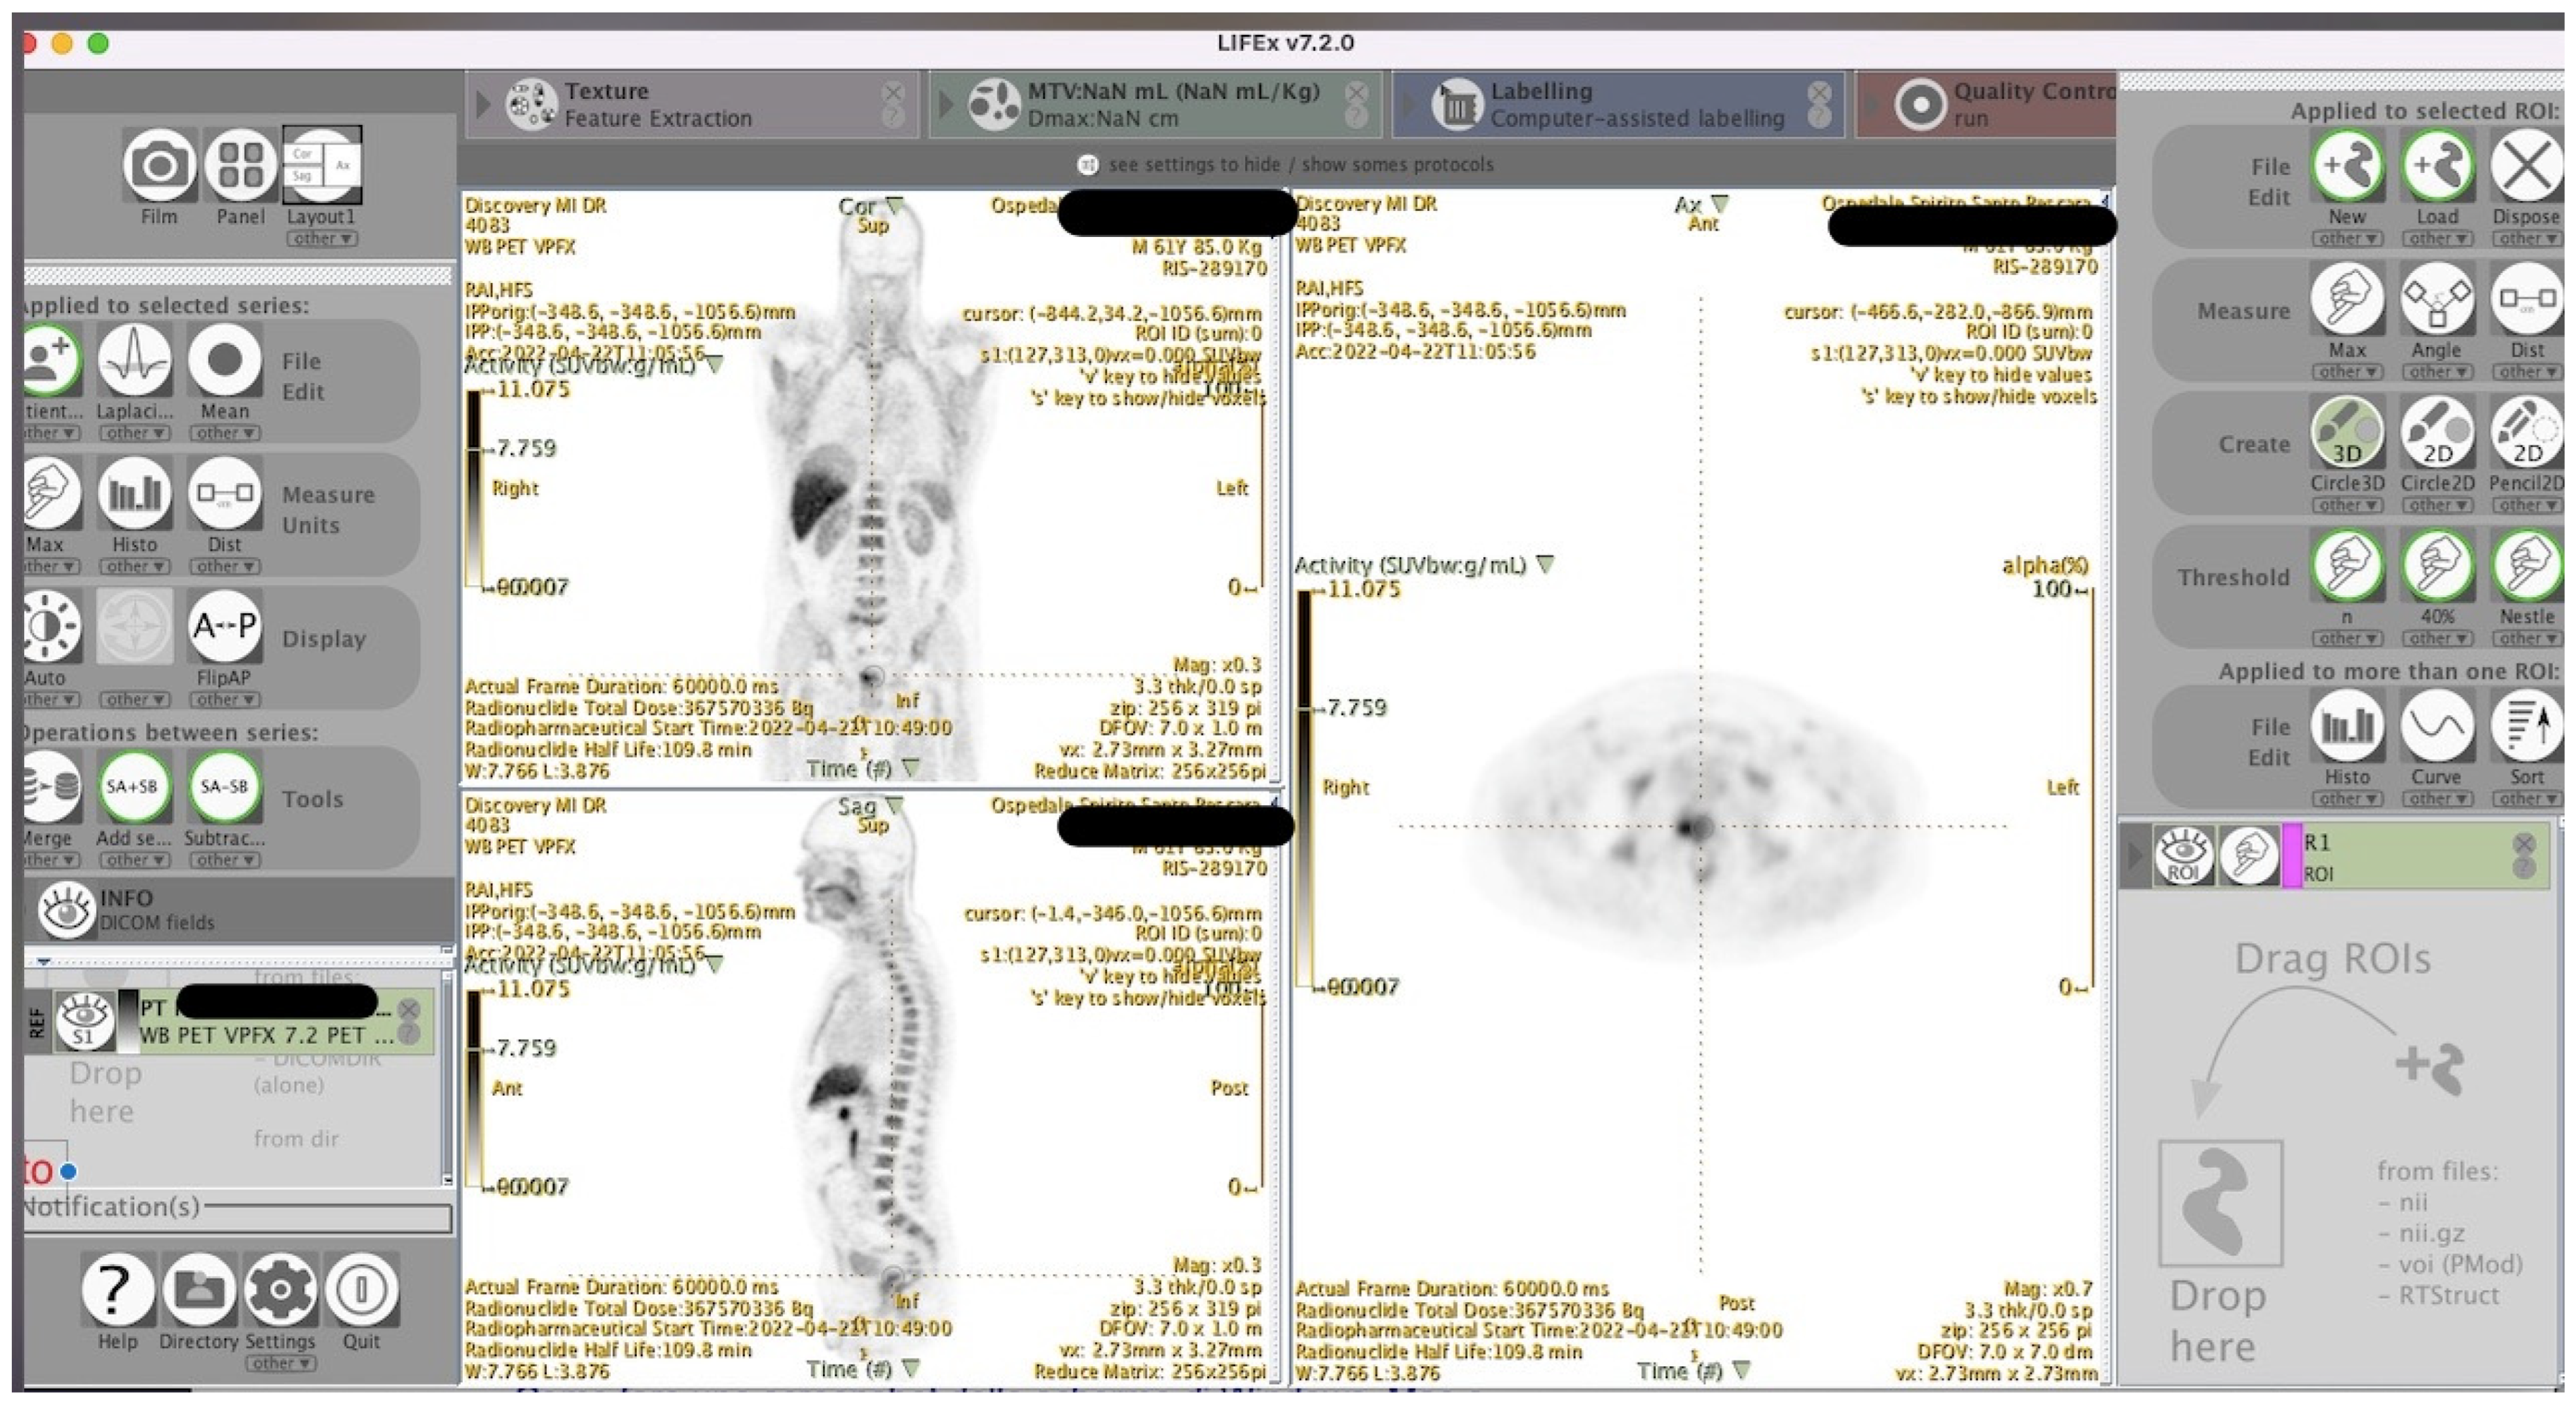
2. Materials and Methods
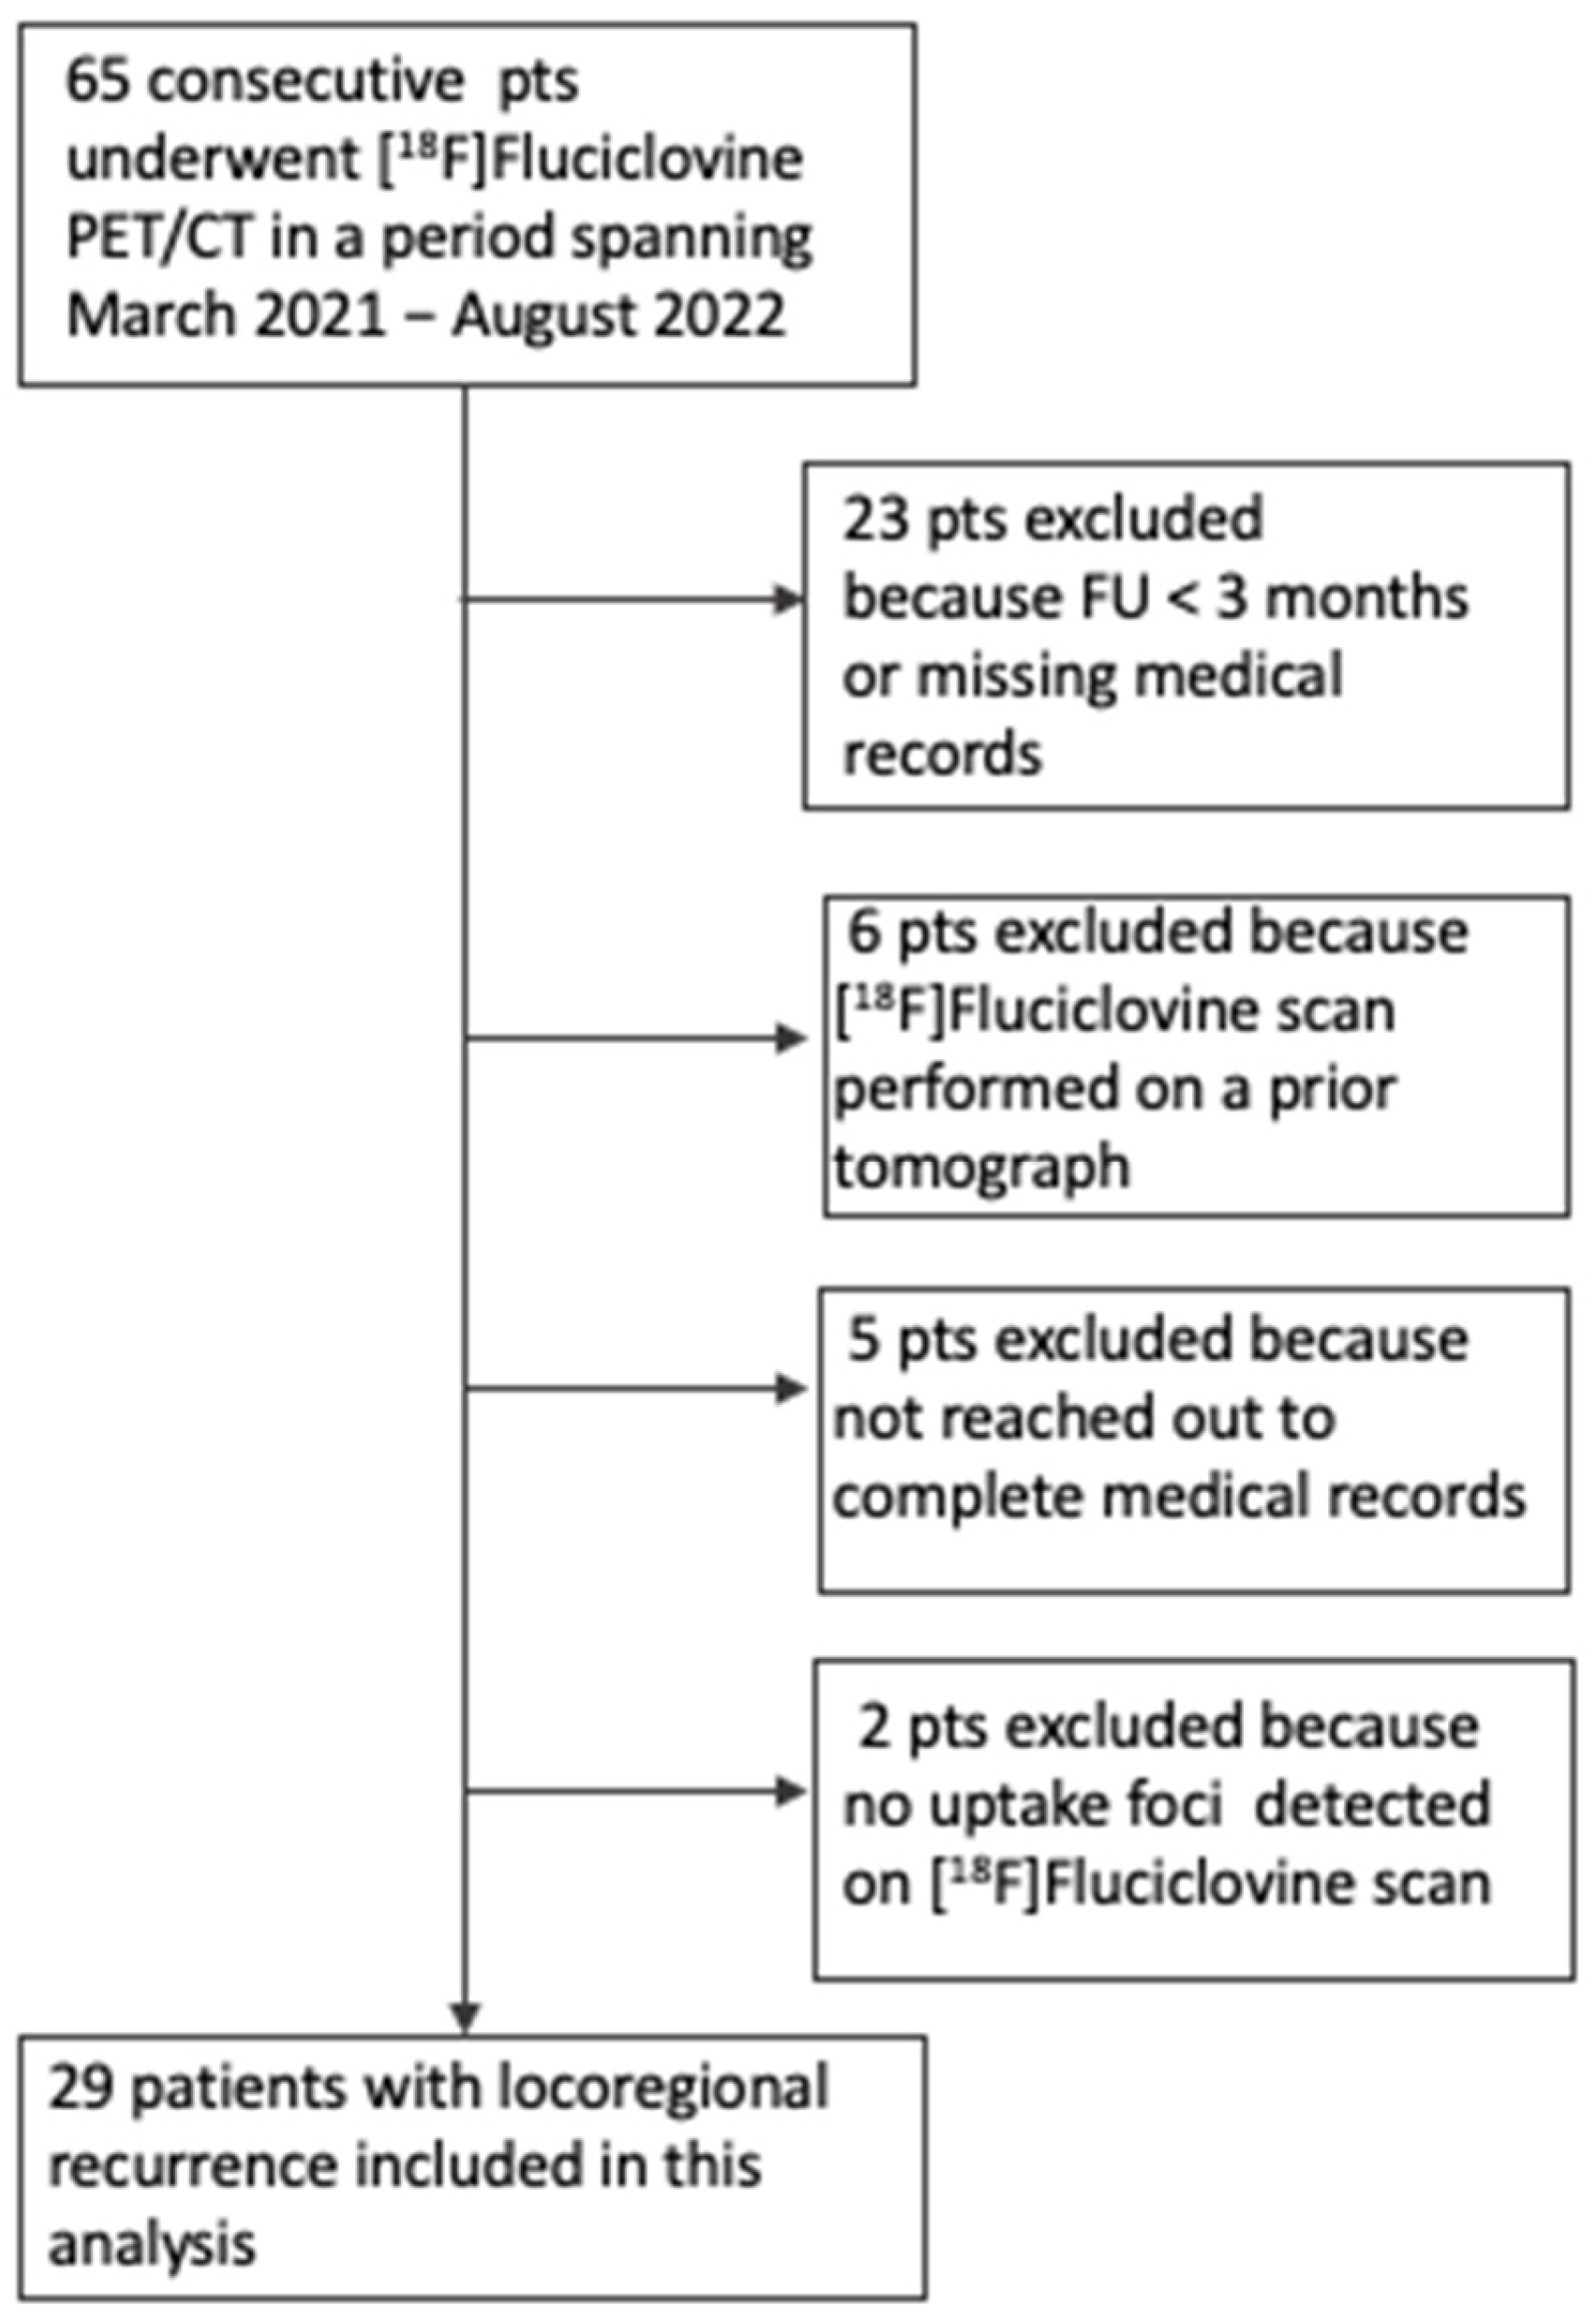
2.1. Population

Our study population retrospectively included consecutive patients affected by Pca who underwent a [F18]FACBC PET/CT scan between June 2021 and August 2022 at the Nuclear Medicine Unit of Santo Spirito Hospital, Pescara, Italy. The patients included had cito- or histologically proven Pca that had already been definitively treated—either by radical prostatectomy (RP), transurethral resection of the prostate (TURP), exclusive prostate bed radiation therapy (RT), or androgenic deprivation therapy (ADT)—with a progressive increase in serum PSA up to 3 ng/mL, suggestive of biochemical relapse. Only patients with PSA ≤ 3 ng/mL within 3 months underwent [F18]Fluciclovine PET/CT examination. Both cito/histological results (Gleason score) and PSA at diagnosis, i.e., before biopsy/surgical procedures (clinical variables), were registered.
Every patient was called back in November 2022 to complete the collection of medical records (serum PSA, [F18]F-Choline or [F18]Fluciclovine PET/CT, MR or any change in therapy) and end follow-up.
Patients were excluded from our study population when medical records (Gleason score, PSA at diagnosis) were not available, or when [F18]Fluciclovine PET/CT was performed on a different tomograph, or when the follow-up after [F18]Fluciclovine PET was <3 months.

2.2. Image Acquisition

[F18]Fluciclovine PET/CT scans were performed at the Nuclear Medicine Unit of Spirito Santo Hospital, Pescara, according to present imaging guidelines [14]. All patients fasted 4 h before their PET/CT scan and were asked to avoid any significant physical exercise 24 h prior to the scan. Patients stopped voiding 30 min before radiopharmaceutical injection and image acquisition.
Whole For each patient, a whole-body PET/CT scan was performed, from the proximal thigh to the vertex, starting at 3–5 min after the intravenous (i.v.) injection of 370 MBq of [F18]FACBC on a PET/CT MI DR scanner (GE Healthcare, Chicago, IL, USA). A low-dose CT scan was performed for attenuation correction and anatomic correlation.

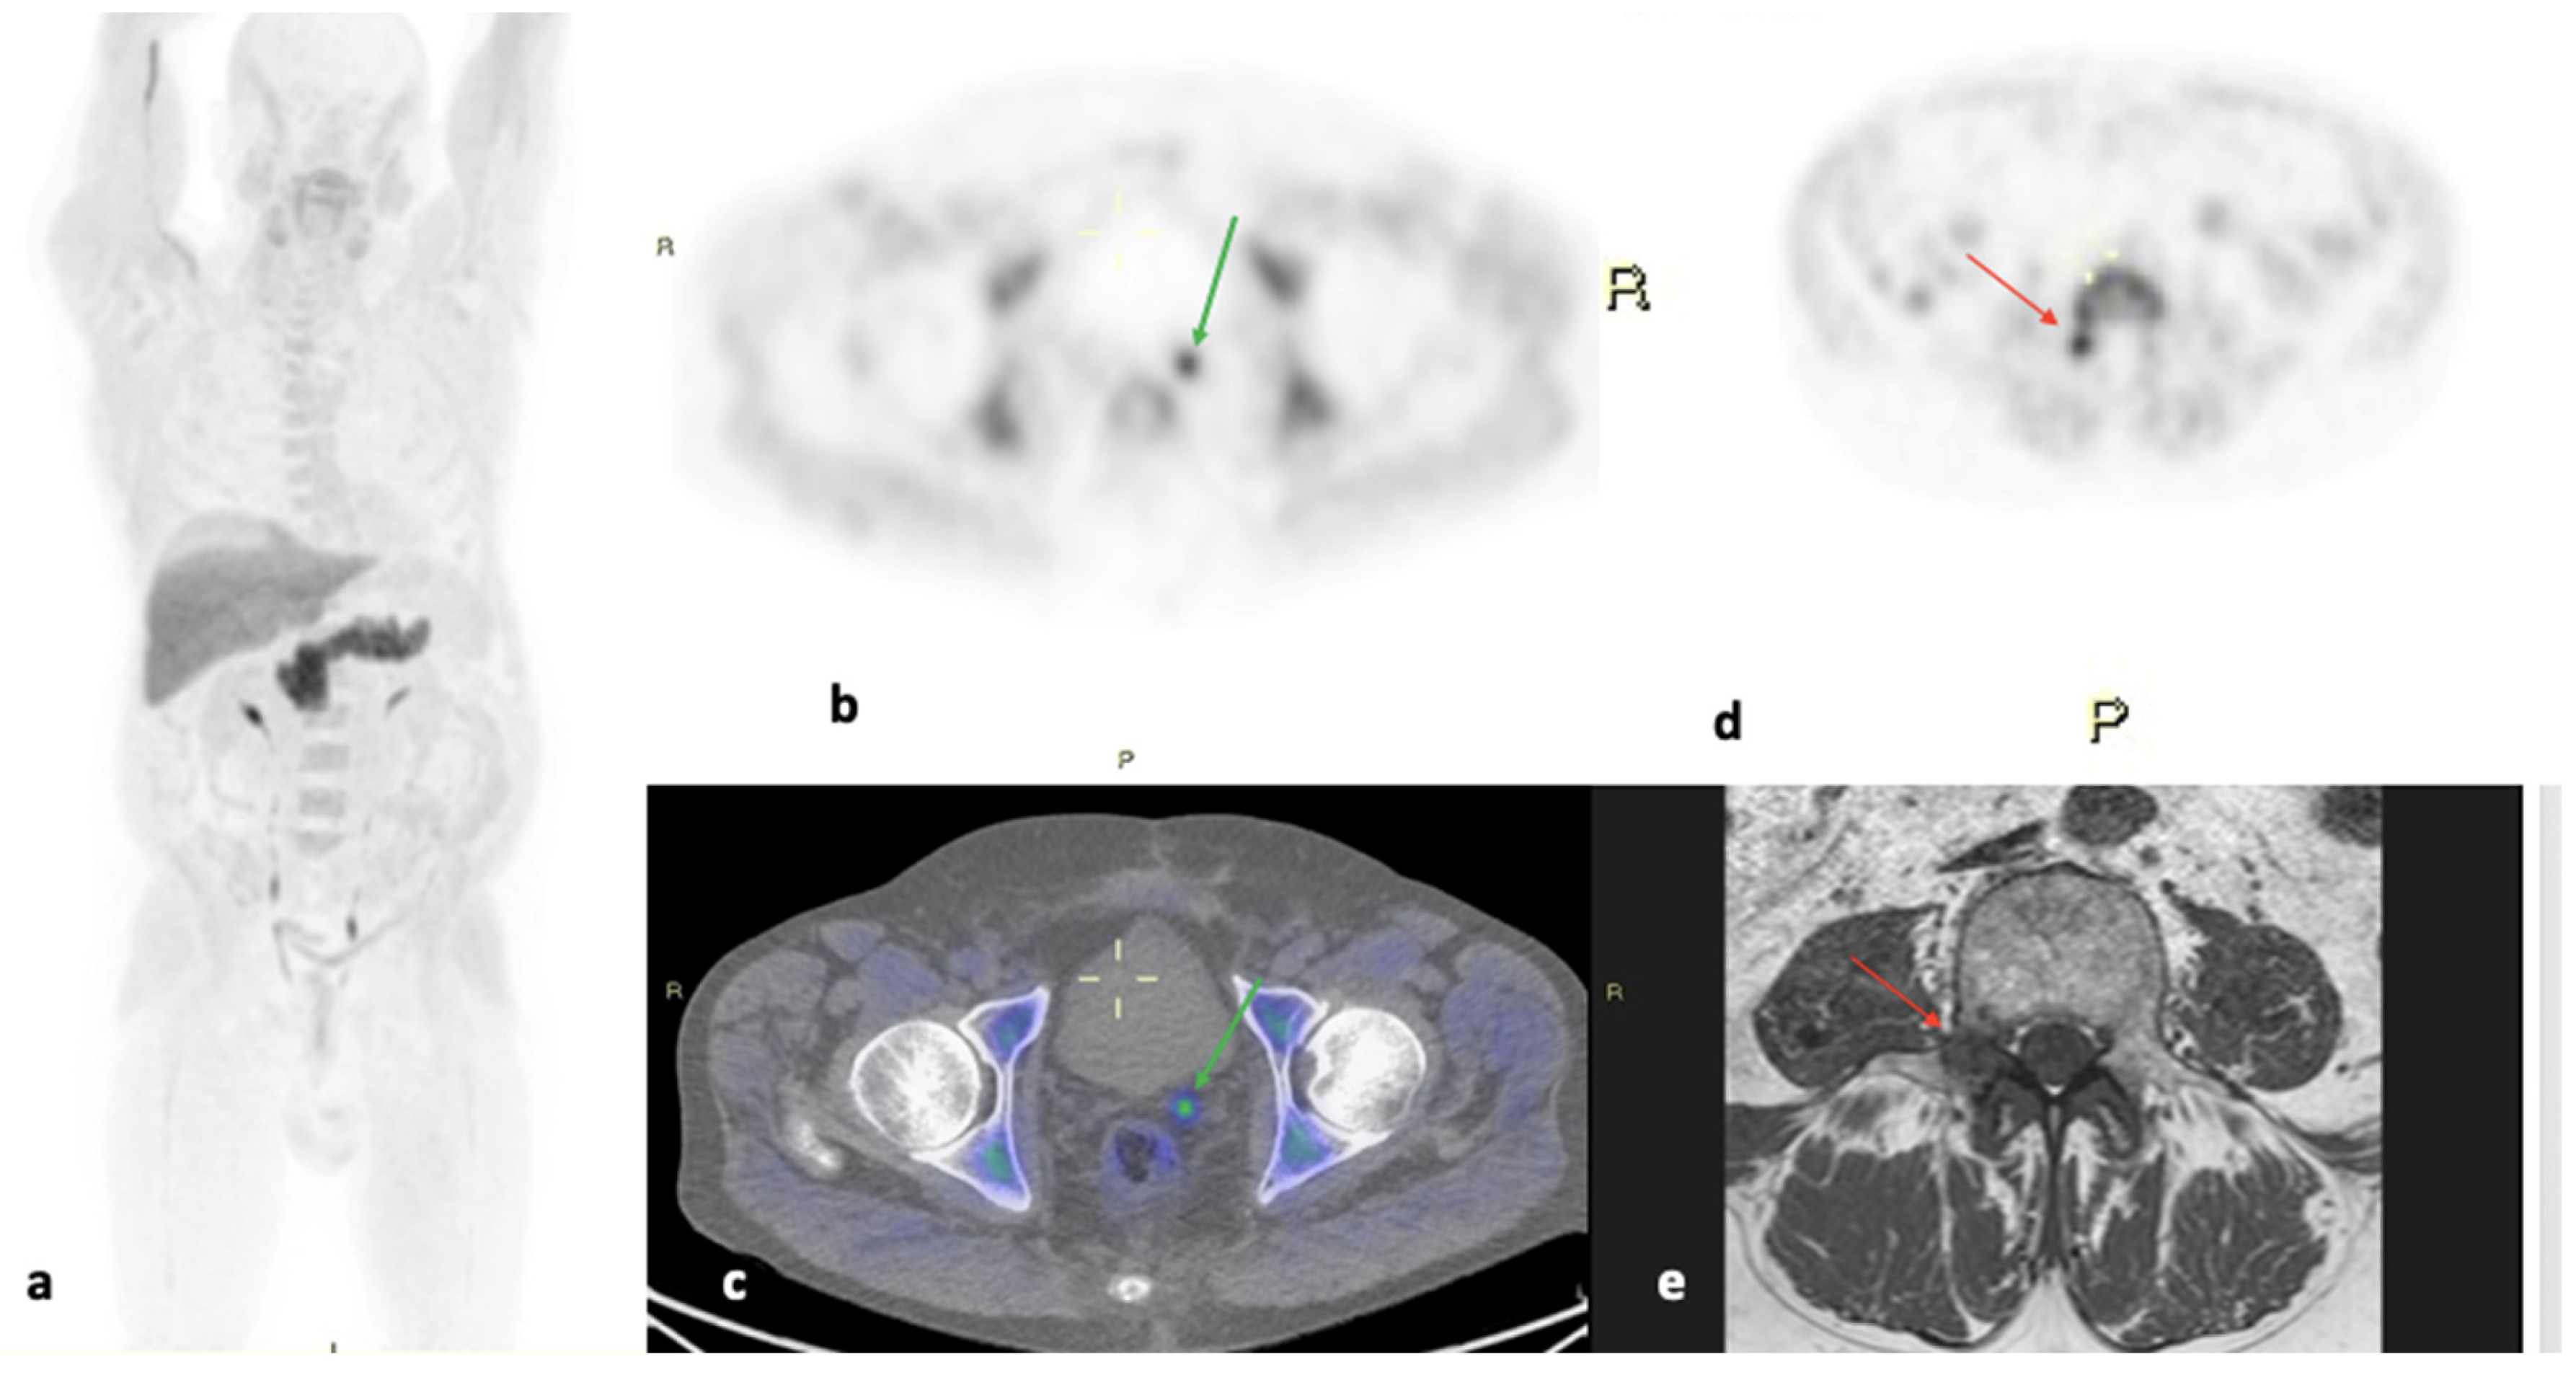
2.3. Image Interpretation

Images were reviewed by one board-certified Nuclear Medicine physician (L.T., 15 years of experience in PET/CT imaging) using appropriate software (Advantage 4.7). Any area with [18F]FACBC uptake intensity higher than background uptake that could not be classified as physiological activity was considered potentially pathologic; its grade of uptake (maximum standardized uptake value, i.e., SUVmax) was registered and compared with the reference value (mean standardized uptake value, i.e., SUVmean) measured on the blood pool or bone marrow. For each patient, sites with pathological uptake were annotated.

2.4. Extraction and Selection of Radiomic Features

First- and second-order radiomic features (RFs) were extracted by L.T. in lesions visually considered pathologic on [F18]Fluciclovine PET scan from the Local Image Features Extraction (LIFEx) platform, drawing a manual 3D region of interest (ROI) on DICOM-converted images (example in Figure 1). Each ROI was verified on axial, sagittal, and coronal views to exclude physiological activity from adjacent structures.
A total of 114 RFs were extracted for each ROI, and among these, the Wilcoxon–Mann–Whitney test (lowest p value) selected 13 robust RFs to be tested on our sample.
S.D.N., a specialist in medical physics, monitored the RF extraction procedure carried out by L.T, readily revising the collected data for robustness and quality assurance.

2.5. Statistical Analysis

Statistical analysis was performed on a database of 29 lesions, 1 per patient.
The dataset was split to have 20 lesions for the model training set and 9 lesions for the validation set. The chosen dichotomous outcome is the presence (1) or absence (0) of Pca recurrence in the available follow-up period.
The Wilcoxon–Mann–Whitney test, the most accurate and robust method for selecting features with a non-Gaussian distribution, was used on the training set to select the most significant features (p-value < 0.05) predicting the dichotomous outcome in a univariate analysis.
The resulting features were used as variables in a multiple logistic linear regression with two unknowns. The most significant feature, i.e., the one with the lowest p-value, was selected as the first variable for model creation. Several logistic linear regression models were elaborated with two variables: the feature with the lowest p-value was combined with one of the other significant (p-value < 0.05) features.
The best predictive model was the logistic model that showed the highest AUC and was evaluated via a validation test. The Receiver Operating characteristic (ROC) curves show the 95% confidence intervals of the area under the curve (AUC), calculated using the bootstrap method with 1000 iterations. The cut-off threshold was selected maximizing the Youden Index (J), and values of sensitivity and specificity at the best threshold were calculated. Statistical analysis was performed using R software (version 3.6.1, Wien, Austria) and dedicated packages [17].

3. Results

Sixty-five patients underwent [18F]Fluciclovine PET/CT between March 2021 and August 2022. Overall, 36/65 patients were excluded (Figure 2) because their follow-up period was <3 months or because medical records for them were missing (23/36 patients); because their [18F]Fluciclovine scan was performed on a prior PET/CT tomograph (6/36 patients); because they could not be contacted to ensure we had complete medical records for them (5/36 pts); or because no uptake foci were detectable on their [18F]Fluciclovine scan and no RFs could be extracted (2/36 pts). Finally, 29 patients with locoregional recurrence were included in this analysis.
In Table 1, medical records of the population included are shown. Follow-up in our population spanned 8.6 ± 4.8 months (mean ± SD). Overall, 10/29 patients biochemically relapsed 10 years after the first curative Pca approach.
PSA levels, registered both at diagnosis and before [18F]Fluciclovine PET/CT, did not predict the outcome (data not shown).
[18F]Fluciclovine revealed significant focal uptake in the prostatic bed or in Douglas’ space. In 4/29 patients, however, [18F]Fluciclovine also imaged six bone foci of uptake, interpreted as metastatic and confirmed at follow-up (Figure 3). These four findings were not included in the radiomic signature analysis.
Textural records of the 29 patients enrolled in this study are shown in Table 2.
After [18F]Fluciclovine PET/CT, the therapeutic approach progressed from antiandrogenic therapy to abiraterone or to radiation therapy in 29/29 patients.
Our univariate analysis found four IBSI features to be significant; two were of the histogram intensity type, i.e., generated by discretizing the original set of gray levels into gray-level bins, and the other two were of the GLSZM (Gray-Level Size Zone Matrix) type, which counts the number of groups of linked voxels. IntensityHistogramSkewness showed the lowest p-value.
The logistic linear models with these two variables analyzed are as follows:
  • Model I: IntensityHistogramSkewness and INTENSITY.HISTOGRAM_MinimumHistogramGradientGreyLevel.SUVbw.IBSI.RHQZ.
  • Model II: IntensityHistogramSkewness and GLSZM_SmallZoneEmphasis.IBSI.5QRC.
  • Model III: IntensityHistogramSkewness and GLSZM_SmallZoneHighGreyLevelEmphasis.IBSI.HW1V.
The model displaying the best AUCs is Model II, with the variables IntensityHistogramSkewness and GLSZM_SmallZoneEmphasis; its AUC was 0.82 on the training set and 0.95 on the validation set.
A summary of the predicted performance of the three models is shown in Table 3, while the ROC curves are shown in Figure 4.

4. Discussion

Radiomics and Deep Learning (DL) approaches for medical tomographic images, first established in radiology, have reached the nuclear medicine community as part of the effort to catch reproducible data usually missed by even a skilled naked eye. Standardized Uptake Value, Metabolic Tumor Volume, and Total Lesion Glycolysis are semiquantitative data now routinely employed for diagnosis and monitoring [18F]FDG avid disease. When using non-FDG tracers, semiquantitative variables can be provided by radiomics. A discrete number of radiomic-based papers looking for radiomic signatures in PET oncologic images have been published [3,18], but, in order to validate the use of radiomic features in PET image interpretation, intra- and inter-institutional variability in acquisition protocols and PET tomographs, both affecting RFs in their repeatability and reproducibility, still has to be overcome [19]. In fact, the standardization of images collected in several NM departments is mandatory for the validation of a radiomic model. Our retrospective analysis enrolled 29 patients, which is the main limitation of this analysis, though the patients were homogeneous in the clinical indication for their [18F]Fluciclovine scans, carried out on the same tomograph, with fixed activity and time of acquisition. Also, the same nuclear medicine consultant and medical physicist reviewed the [18F]Fluciclovine images and manually extracted RFs. With the acquisition protocol being so strict, the implementation of study populations from other Nuclear Medicine facilities could be feasible if the PET scanners used have similar characteristics.
The aim of our study was to find a radiomic signature in [18F]fluciclovine PET/CT scans that could possibly be useful in establishing Pca relapse alone or combined with clinical variables, namely PSA levels at relapse. However, when going through the data, the radiomic model was not integrated with the clinical data because, as an inclusion criterion, each patients’ PSA already meant disease recurrence had taken place. Furthermore, the patients enrolled in this study had been treated by either radical prostatectomy or radiotherapy, with a relatively different cut-off significant for biochemical relapse, while PSA kinetics, which are more accurate [20,21], were not available when scheduling [18F]Fluciclovine scans.
Indeed, our radiomic training set detected [18F]Fluciclovine uptake sites with a higher probability to be specific for recurrence. Initially, 114 RFs were extracted, but only IntensityHistogramSkewness and GLSZM_SmallZoneEmphasis.IBSI.5QRC were robust and significant in predicting the clinical outcome. Roughly, skewness is a single-pixel or single-voxel feature that describes the shape of the intensity distribution of data, reflecting the asymmetry of the data distribution curve. GLSZM_SmallZoneEmphasis counts groups (so-called zones) of interconnected neighboring pixels or voxels with the same gray level. Other than these two features depicting Model II, IntensityHistogramSkewness and INTENSITY.HISTOGRAM_MinimumHistogramGradientGreyLevel.SUVbw.IBSI.RHQZ and IntensityHistogramSkewness and GLSZM_SmallZoneHighGreyLevelEmphasis.IBSI.HW1V in model I and III, respectively, had AUCs that were not so dissimilar from those of model II, highlighting that skewness and the zones of gray-level patterns can describe a radiomic signature in clinical settings. These results, however, refer to our preliminary experience and need further validation with an increased sample size and reduced “small size” bias.
In August 2023, when searching “radiomic AND PET/CT AND prostate” on the Pubmed database, 82 results were found (https://pubmed.ncbi.nlm.nih.gov/?term=radiomics+AND+PET%2FCT+AND+prostate (accessed on 27 November 2023)). Only 2 out of these 82 results pertain to studying [F18]F-fluciclovine radiomic features in prostate cancer [22,23]. Kang et al. [22] searched for an image biomarker using Haralick texture features in prostate bed, pelvic lymph nodes, and extrapelvic metastases in 28 prostate cancer patients with biochemical relapse. In particular, they found three textural features (contrast, variance, and correlation) negatively associated with the probability of BCR and incorporated them into their radiomic model to enhance the probability of predicting BCR. Our aim and results were slightly different, and it has to be noted that they did consider PSA as a clinical variable in combination with RFs, while, in our sample, PSA was not significant in predicting the outcome. On the other hand, Lee et al. [23] studied 233 patients with BCR from Pca with [18F]Fluciclovine, proposing a deep learning approach when studying the pelvis. A 2D-CNN slice-based approach showed the best performance in detecting abnormal [F18]F-FACBC foci of uptake, with promising results. Hopefully, our knowledge and experience with radiomics tools can grow once trained. A similar study on the prognostic value of RFs in [F18]-choline PET/CT, carried by Alongi and coll. [24], proved that a radiomic approach could potentially be useful in a daily clinical setting of Pca BCR and found RFs useful for N, M, and T lesions. Our sample also showed distant metastases, mainly bony, that PSA alone could not predict. In particular, six bone metastases were registered in four patients but were excluded from the final analysis because it would have not significantly influenced our statistical results. As previously reported in other PET tracers employed in Pca [25,26], a flare phenomenon was seen in 7/29 patients in our population, all ongoing ADT therapy (data not shown), and 4/7 were diagnosed with bony metastases in the same [F18]Fluciclovine scan, confirmed at subsequent follow-up. It might have been interesting to scan these seven patients with [F18]F-FDG in order to calculate metastases’ aggressiveness.

5. Conclusions

This single-center retrospective study reports a preliminary experience proving that a radiomic signature of [18F]FACBC PET/CT can be easily found. PSA levels at diagnosis and at [18F]Fluciclovine was not significant in this small sample population in addressing prostate cancer aggressiveness, as the patients included had been previously treated either by surgery or radiation therapy or ADT. These are promising results that have to be confirmed in larger sample populations and with longer follow-up periods.

Author Contributions

Conceptualization, L.T.; methodology, S.D.N.; software, L.F.; validation, V.F. and G.D.V.; formal analysis, L.T. and S.D.N.; resources, F.C. and A.C.; data curation, S.D.N.; writing—original draft preparation, L.T.; writing—review and editing, M.R.; supervision, A.D.D.N., V.D.E. and P.T. All authors have read and agreed to the published version of the manuscript.

Funding

This research received no external funding.

Institutional Review Board Statement

The study was conducted in accordance with the Declaration of Helsinki.

Informed Consent Statement

Informed consent was obtained from all subjects involved in the study.

Data Availability Statement

The raw data supporting the conclusions of this article will be made available by the authors on request.

Conflicts of Interest

The authors declare no conflicts of interest.

References

  1. Gillies, R.J.; Kinahan, P.E.; Hricak, H. Radiomics: Images Are More than Pictures, They Are Data. Radiology 2016, 278, 563–577. [Google Scholar] [CrossRef] [PubMed]
  2. Ha, S.; Choi, H.; Paeng, J.C.; Cheon, G.J. Radiomics in oncological PET/CT: A methodological overview. Nucl. Med. Mol. Imaging 2019, 53, 14–29. [Google Scholar] [CrossRef] [PubMed]
  3. Cook, G.J.R.; Azad, G.; Owczarczyk, K.; Siddique, M.; Goh, V. Challenges and Promises of PET Radiomics. Int. J. Radiat. Oncol. Biol. Phys. 2018, 102, 1083–1089. [Google Scholar] [CrossRef] [PubMed]
  4. van Timmeren, J.; Cester, D.; Tanadini-Lang, S.; Alkadhi, H.; Baessler, B. Radiomics in medical imaging—“How-to” guide and critical reflection. Insights Imaging 2020, 11, 91. [Google Scholar] [CrossRef] [PubMed]
  5. Sanduleanu, S.; Woodruff, H.C.; De Jong, E.E.; Van Timmeren, J.E.; Jochems, A.; Dubois, L.; Lambin, P. Tracking tumor biology with radiomics: A systematic review utilizing a radiomics quality score. Radiother. Oncol. 2018, 127, 349–360. [Google Scholar] [CrossRef] [PubMed]
  6. Rizzo, S.; Botta, F.; Raimondi, S.; Origgi, D.; Fanciullo, C.; Morganti, A.G.; Bellomi, M. Radiomics: The facts and the challenges of image analysis. Eur. Radiol. Exp. 2018, 2, 36. [Google Scholar] [CrossRef] [PubMed]
  7. Mayerhoefer, M.E.; Materka, A.; Langs, G.; Häggström, I.; Szczypiński, P.; Gibbs, P.; Cook, G. Introduction to Radiomics. J. Nucl. Med. 2020, 61, 488–495. [Google Scholar] [CrossRef] [PubMed]
  8. Cavinato, L.; Pegoraro, M.; Ragni, A.; Sollini, M.; Erba, P.A.; Ieva, F. Imaging-based representation and stratification of intra-tumor heterogeneity via tree-edit distance. Sci. Rep. 2022, 12, 19607. [Google Scholar] [CrossRef]
  9. Chowdhury, R.; Ganeshan, B.; Irshad, S.; Lawler, K.; Eisenblatter, M.; Milewicz, H.; Rodrigues-Justo, M.; Miles, K.; Ellis, P.; Groves, A.; et al. The use of molecular imaging combined with genomic techniques to understand the heterogeneity in cancer metastasis. Br. J. Radiol. 2014, 87, 20140065. [Google Scholar] [CrossRef] [PubMed]
  10. Cookson, M.S.; Aus, G.; Burnett, A.L.; Canby-Hagino, E.D.; D’Amico, A.V.; Dmochowski, R.R.; Eton, D.T.; Forman, J.D.; Goldenberg, S.L.; Hernandez, J.; et al. Variation in the definition of biochemical recurrence in patients treated for localized prostate cancer: The American Urological Association Prostate Guidelines for Localized Prostate Cancer Update Panel report and recommendations for a standard in the reporting of surgical outcomes. J. Urol. 2007, 177, 540–545. [Google Scholar]
  11. Roach, M., 3rd; Hanks, G.; Thames, H., Jr.; Schellhammer, P.; Shipley, W.U.; Sokol, G.H.; Sandler, H. Defining biochemical failure following radiotherapy with or without hormonal therapy in men with clinically localized prostate cancer: Recommendations of the RTOG-ASTRO Phoenix Consensus Conference. Int. J. Radiat. Oncol. Biol. Phys. 2006, 65, 965–974. [Google Scholar] [CrossRef] [PubMed]
  12. Artibani, W.; Porcaro, A.B.; De Marco, V.; Cerruto, M.A.; Siracusano, S. Management of Biochemical Recurrence after Primary Curative Treatment for Prostate Cancer: A Review. Urol. Int. 2018, 100, 251–262. [Google Scholar] [CrossRef] [PubMed]
  13. Kim, E.H.; Siegel, B.A.; Teoh, E.J.; Andriole, G.L.; LOCATE Study Group. Prostate cancer recurrence in patients with negative or equivocal conventional imaging: A role for 18F-fluciclovine-PET/CT in delineating sites of recurrence and identifying patients with oligometastatic disease. Urol. Oncol. 2021, 39, 365.e9–365.e16. [Google Scholar] [CrossRef] [PubMed]
  14. Gusman, M.; Aminsharifi, J.A.; Peacock, J.G.; Anderson, S.B.; Clemenshaw, M.N.; Banks, K.P. Review of 18F-Fluciclovine PET for Detection of Recurrent Prostate Cancer. Radiographics 2019, 39, 822–841. [Google Scholar] [CrossRef] [PubMed]
  15. Sun, A.; Liu, X.; Tang, G. Carbon-11 and fluorine-18 labeled amino acid tracers for positron emission tomography imaging of tumors. Front. Chem. 2018, 5, 124. [Google Scholar] [CrossRef]
  16. Nanni, C.; Zanoni, L.; Bach-Gansmo, T.; Minn, H.; Willoch, F.; Bogsrud, T.V.; Edward, E.P.; Savir-Baruch, B.; Teoh, E.; Ingram, F.; et al. [18F]Fluciclovine PET/CT: Joint EANM and SNMMI procedure guideline for prostate cancer imaging-version 1.0. Eur. J. Nucl. Med. Mol. Imaging 2020, 47, 579–591. [Google Scholar] [CrossRef] [PubMed]
  17. Autorino, R.; Gui, B.; Panza, G.; Boldrini, L.; Cusumano, D.; Russo, L.; Nardangeli, A.; Persiani, S.; Campitelli, M.; Ferrandina, G.; et al. Radiomics-based prediction of two-year clinical outcome in locally advanced cervical cancer patients undergoing neoadjuvant chemoradiotherapy. Radiol. Med. 2022, 127, 498–506. [Google Scholar] [CrossRef]
  18. Limkin, E.J.; Sun, R.; Dercle, L.; Zacharaki, E.I.; Robert, C.; Reuzé, S.; Schernberg, A.; Paragios, N.; Deutsch, E.; Ferté, C. Promises and challenges for the implementation of computational medical imaging (radiomics) in oncology. Ann. Oncol. 2017, 28, 1191–1206. [Google Scholar] [CrossRef] [PubMed]
  19. Traverso, A.; Wee, L.; Dekker, A.; Gillies, R. Repeatability and Reproducibility of Radiomic Features: A Systematic Review. Int. J. Radiat. Oncol. Biol. Phys. 2018, 102, 1143–1158. [Google Scholar] [CrossRef] [PubMed]
  20. Paller, C.J.; Olatoye, D.; Xie, S.; Zhou, X.; Denmeade, S.R.; Eisenberger, M.A.; Antonarakis, E.S.; Carducci, M.A.; Rosner, G.L. The effect of the frequency and duration of PSA measurement on PSA doubling time calculations in men with biochemically recurrent prostate cancer. Prostate Cancer Prostatic Dis. 2014, 17, 28–33. [Google Scholar] [CrossRef] [PubMed]
  21. Vickers, A.J.; Brewster, S.F. PSA Velocity and Doubling Time in Diagnosis and Prognosis of Prostate Cancer. Br. J. Med. Surg. Urol. 2012, 5, 162–168. [Google Scholar] [CrossRef] [PubMed]
  22. Kang, H.; Kim, E.E.; Shokouhi, S.; Tokita, K.; Shin, H.W. Texture Analysis of F-18 Fluciclovine PET/CT to Predict Biochemically Recurrent Prostate Cancer: Initial Results. Tomography 2020, 6, 301–307. [Google Scholar] [CrossRef]
  23. Lee, J.J.; Yang, H.; Franc, B.L.; Iagaru, A.; Davidzon, G.A. Deep learning detection of prostate cancer recurrence with 18F-FACBC (fluciclovine, Axumin®) positron emission tomography. Eur. J. Nucl. Med. Mol. Imaging 2020, 47, 2992–2997. [Google Scholar] [CrossRef] [PubMed]
  24. Alongi, P.; Stefano, A.; Comelli, A.; Laudicella, R.; Scalisi, S.; Arnone, G.; Barone, S.; Spada, M.; Purpura, P.; Bartolotta, T.V.; et al. Radiomics analysis of 18F-Choline PET/CT in the prediction of disease outcome in high-risk prostate cancer: An explorative study on machine learning feature classification in 94 patients. Eur. Radiol. 2021, 31, 4595–4605. [Google Scholar] [CrossRef] [PubMed]
  25. Malaspina, S.; Ettala, O.; Tolvanen, T.; Rajander, J.; Eskola, O.; Boström, P.J.; Kemppainen, J. Flare on [18F]PSMA-1007 PET/CT after short-term androgen deprivation therapy and its correlation to FDG uptake: Possible marker of tumor aggressiveness in treatment-naïve metastatic prostate cancer patients. Eur. J. Nucl. Med. Mol. Imaging 2023, 50, 613–621. [Google Scholar] [CrossRef] [PubMed]
  26. Available online: https://uroweb.org/guidelines/prostate-cancer (accessed on 30 August 2023).
Figure 1. Example of LIFEx platform tools used to extract radiomics features from [F18]Fluciclovine PET/CT scan drawing a manual 3D region of interest (ROI) on DICOM-converted images. One hundred and fourteen radiomic features (RFs) were extracted for each ROI. Thirteen robust RFs were tested on our sample.
Applsci 14 03469 g001
Figure 2. Flowchart showing patients included in the present study.
Applsci 14 03469 g002
Figure 3. Maximum intensity projection (a), [18F]Fluciclovine PET (b), and PET/CT (c) axial view of locoregional recurrence of Pca (green arrow), as seen in our series in a patient (61 yo). This recurrence occurred 6 years after radical prostatectomy, PSA 1.34 ng/mL. In (d), a bone focus of [18F]Fluciclovine uptake, interpreted as metastasis, on the right pedicle of L4 (red arrow) in the same patient is shown, which was then confirmed by MR (e).
Applsci 14 03469 g003
Figure 4. ROC curves of the models with training set and validation set for each model of logic linear regression. Model II, with IntensityHistogramSkewness and GLSZM_SmallZoneEmphasis, displayed the best area under the curve (AUC) values, with an AUC of 0.82 on the training set and 0.95 on the validation set.
Applsci 14 03469 g004
Table 1. Medical records (mean ± SD) of the 29 patients included in the study.
Age at Diagnosis (yo, Mean ± SD)66 ± 7
Gleason ScoreNo. Patients%
nd13
3 + 226
3 + 3619
3 + 41239
3 + 513
4 + 3516
4 + 426
4 + 513
5 + 313
PSA at diagnosis (mean ± SD) 14.25 ± 14.9 ng/mL
<4 ng/mL26
4 ÷ 10 ng/mL1548
>10 ng/mL1342
PSA at fluciclovine PET/CT
<1 ng/mL1239
1 ÷ 2 ng/mL929
>2 ng/mL929
Time to relapse (years)
<1 year413
1 ÷ 3 years723
3 ÷ 5 years26
5 ÷ 10 years826
>10 years1032
Table 2. Textural records of 29 patients. MORCOMP1: morphological compactness; IHKURTOSIS: Intensity Histogram Kurtosis; IHSkewness: Intensity Histogram Skewness; GLCMDIVa: GLCM_Difference Variance; NGTDMCom: NGTDM_Complexity; NGTDMStr: NGTDM_Strenght; GLSSlZE: GLSZM_SmallZoneEmphasis; GLSLGLZE: GLSZM_Low GrayLevelZone Emphasis; GLSSZHLE: GLSZM_SmallZoneHighGreyLevelEmphasis; GLSGLNU: GLSZM_GreyLevelNonUniformity; GLSZSNU: GLSZM_ZoneSizeNonUniformity; GLSNZSNU:GLSZM_NormalizedZoneSizeNonUniformity; GLSZMZP: GLSZM_ZonePercentage.
Radiomic FeaturesMeanSD
MORCOMP10.0450.017
IH_KURTOSIS1.521.90
IH_IntensityHistogramSkewness.
SUVbw
0.820.69
GLCMDIVa2.673.04
NGTDMCom118.35156.29
NGTDMStr3.403.61
GLSZMSlZE0.350.13
GLSLGLZE0.040.04
GLSSZHLE44.3445.74
GLSLHGLE95,043.98133,545.82
GLSGLNU3.712.99
GLSZSNU10.4913.80
GLSNZSNU0.180.07
GLSZMZP0.100.18
Table 3. Logistic linear models with two variables.
SensitivitySpecificityThresholdJ_IndexAUCLow_AUCHigh_AUC
TrainingValidationTrainingValidationTrainingValidationTrainingValidationTrainingValidationTrainingValidationTrainingValidation
Model I10060501000.360.620.50.680.21700.60.2911
Model II66.678087,5100.690.790.540.882.29950.630.8111
Model III91.6780751000.360.950.670.881.25900.60.6811
Disclaimer/Publisher’s Note: The statements, opinions and data contained in all publications are solely those of the individual author(s) and contributor(s) and not of MDPI and/or the editor(s). MDPI and/or the editor(s) disclaim responsibility for any injury to people or property resulting from any ideas, methods, instructions or products referred to in the content.

