Article

Study on the Macro-Fine Mechanical Behavior of Ore Flow Based on the Discrete Element Method

1
School of Mining Engineering, University of Science and Technology Liaoning, Anshan 114051, China
2
Green Mining Engineering Research Center of Metal Mineral Resources of Liaoning Province, Anshan 114051, China
*
Author to whom correspondence should be addressed.
Appl. Sci. 2024, 14(8), 3457; https://doi.org/10.3390/app14083457
Submission received: 13 March 2024 / Revised: 16 April 2024 / Accepted: 17 April 2024 / Published: 19 April 2024
(This article belongs to the Special Issue Advanced Methodology and Analysis in Coal Mine Gas Control)

Abstract

:
The mechanical behavior associated with the flow of ore-rock bulk materials is an important factor leading to the instability and failure of the shaft wall of the ore storage section in ore passes. It is of great significance for accurately understanding the stability failure characteristics of the shaft wall in the ore storage section in the ore-drawing process to understand the flow characteristics and internal mechanical transfer mechanism of ore-rock bulk. The flow characteristics, contact compactness, stress distribution characteristics, and contact force probability distribution of the ore-rock bulk are analyzed by the discrete element method, which realizes the quantitative characterization of the damage degree of ore-rock flow and reveals the damage mechanism of the shaft wall in the storage section of the ore pass. The results show that (1) in the process of ore-rock particle flow in the ore pass storage section, the macroscopic flow pattern of ore-rock particles changes from a “—” shape to a “V” shape, and the friction between ore-rock particles, particles, and the ore-pass wall is an important reason for the change of the macroscopic flow pattern; (2) the probability distribution of contact force strength between the particles decreases exponentially in the whole ore-drawing process, in which the strong force chains play a major role in the stability of the bulk system; and (3) the overpressure frequency and overpressure coefficient could be used to quantitatively characterize the wall damage degree under the action of ore-rock flow. The dynamic lateral pressure fluctuates periodically in exponential form and decreases, and the dynamic load formed by the ore-rock flow mainly acts on the lower part of the ore storage section.

1. Introduction

The wear and damage of the ore-pass wall is a common problem in mine production, which not only reduces the service life of the ore pass but also greatly increases safety hazards in mine production. The flow characteristics of ore-rock bulk materials (which consist of different-sized ore-rock blocks) and their accompanying mechanical behavior are the main causes of the deformation, instability, and collapse of the ore pass [1,2,3]. Therefore, it is of great significance to study the distribution law of the main force sources and the distribution characteristics of the damaged areas, to reveal the wear mechanism and to ensure the stability of the ore-pass wall.
In order to improve the service life of the ore pass in mines, many scholars have conducted in-depth research based on the theories of fluid mechanics, contact mechanics, and ore drawing. For example, Liu et al. [4] established a theoretical equation under the non-point drawing-point according to the stochastic medium draw theory, taking the draw-point as the moving boundary based on the fact of the ore-drawing process. Huang et al. [5] proposed an experimental technique for the impact damage of rock blocks based on an impact test, which is helpful in analyzing the fragmentation for impact damage of the ore-pass wall under impact load. Chi et al. [6] qualitatively analyzed the migration law of ore-rocks in the ore storage section via the two-dimensional flow network. Zhao et al. [7], with the help of Hertz contact theory and kinematics theory, conducted the quantitative characterization of the volume damage of the shaft wall. Jin et al. [8] studied the characteristics of particle percolation from the perspective of ore drawing. Classical mechanics has made great achievements in the study of ore-rock flow, but in the actual production process, the complex geological environment and harsh operating conditions of the ore pass make it difficult to directly analyze the flow characteristics and mechanical behavior of the stored materials in the ore pass, which affect the normal production of the mine. For this reason, it is urgent to seek a new method to analyze the ore-rock flow in the storage section of an ore pass.
With the rise of simulation in engineering mechanics, the discrete element method (DEM) has become the mainstream method for studying the mechanical behavior of bulk particles [9]. Many scholars have carried considerable research on discontinuous media based on the discrete element method. For example, Yang et al. [10] created storage materials in the ore pass using randomly distributed spheres and irregular polyhedral and studied the change rule of the impact force on the ore-pass wall and the materials in the ore pass storage section, as well as the change of the voidage of ore-rock. Sato and Tang [11] simulated the characteristics of the ore-rock flow in rectangular and vertical ore passes by using the 3D discrete element method and found that the square-section ore pass is preferable. Based on the summary of a series of numerical experiments using the discrete element method, Hadjigeorgiou and Lessard [12] studied the effects of the ore pass geometry, shape, and size distribution of ore-rock block on the ore-rock flow in the ore pass. According to the established SRM model, Esmaieli et al. [13] analyzed the effects of stress–structure interaction on the stability of the ore pass and the ore-rock impact on the ore-pass wall. Yuan et al. [14], based on the discrete element analysis method, found that the change in wheat-grain flow mode was the main reason for the arch formation inside the bulk and the local overpressure on the silo wall. Montellano et al. [15] analyzed the flow characteristics of glass beads and corn particles in the central unloading process from the perspectives of flow pattern, packing density, and stress distribution. By studying the changes in the force chain network, Pengkai et al. [16] analyzed the mechanism of the influence of the friction coefficient of the silo wall on the lateral pressure of the silo wall during the discharge of the rectangular hopper. Cheng et al. [17] analyzed the variation characteristics of the ore-rock block flow field and the mesoscopic-stress field in the discharge process of a shallow circular silo and explained the mechanical behavior of the ore-rock fragment on the silo wall from the perspective of the ore-rock flow. Feng et al. [18] studied the influence of ore-rock flow on the dynamic lateral pressure of the silo wall and analyzed the stress characteristics of the silo wall under the arch effect during ore drawing. Pacheco-Martinez et al. [19] studied the flow characteristics of the ore-rock particles inside the silos under different vibration frequencies and believed that the tangential motion of the silo wall effectively contained the formation of the Janssen effect. Using physical experiments and DEM numerical simulations, David Žurovec et al. [20] experimentally validated the mathematical derivation of Janssen’s theory, providing important information and insights for the design of storage facilities. Considering the problem of the static packing assumption of the Janssen model, Windows-Yule et al. [21] explored the stress redistribution of particles in a container with a laterally moving sidewall, and extended and improved the model for characterizing the constrained dynamic system. Haiyang Zhao et al. [22], using the DEM numerical simulation method, studied the static stress distribution in confined granular columns, and found that the lateral pressure coefficient is not a constant value that decreases gradually to a constant with the packing depth.
Presently, research on granular flow and other related aspects mainly focuses on grain silos, storage bins, and the hanging of the ore pass, and few involve the mechanical damage of the ore-pass wall. Moreover, the existing research still lacks an understanding of the macro-flow and micromechanical behavior of ore-rock bulk particles. Therefore, this paper analyzes the flow characteristics of ore-rock bulk via the discrete element method. On this basis, the contact density, internal stress distribution, contact force distribution, and so on are discussed, and the mechanical evolution mechanism of the bulk system and the stress characteristics of the ore pass of the storage section are revealed in the process of ore-rock flow, which lays a foundation for future study on the stability of the ore-pass wall.

2. Physical Test

2.1. Determination of Ore-Rock Particle Parameters

The mechanical parameters (such as density, particle size distribution, grading, internal friction angle, and cohesion) of the ore-rock bulk materials play an important role in the overall fluidity of the storage materials and the force condition of the ore-pass wall. In order to ensure the accuracy of the experimental results, waste rock from a certain mine was crushed and screened into different sizes in the laboratory to keep its mechanical properties close to the ore-rock bulk in situ. According to the previous studies on the physical parameters of bulk materials, the bulk density of the broken stones, which was obtained by the water injection method [23], was 2050 kg/m3. On this basis, the quartering method was used to scale the building stone samples, the particle size distribution, and the mass proportion of the scaled samples were obtained by using different grid screens, as shown in Table 1.
Using the slump test device, as shown in Figure 1, the natural repose angle of the fine-size particle bulk is 38.6°, and the internal friction angle and cohesion of the ore-rock bulk are obtained indirectly by measuring the natural repose angle [24].

2.2. Construction of the Central Unloading Model

Taking the ore pass of an iron mine in Northeast China as an example, the parameters of the ore pass storage section are 32 m high and 6 m in diameter, and the parameters of the ore-drawing funnel below the storage section are as follows: height—6.4 m, width of ore-drawing port—3 m, and sidewall angle—72°. Combined with the actual geometric size and production conditions of the ore pass, the geometric similarity ratio of 1:20 was selected to construct the physical similarity experiment platform. In the physical model, the ore-pass storage section and the ore-drawing funnel have the same center line; the height of the storage section H is 1.6 m, the diameter D is 0.3 m, the height of the funnel h is 0.32 m, the width of the ore-drawing port A is 0.15 m, and the angle of the funnel side wall is 72°, as shown in Figure 2. In addition, before building the model, the inside of the acrylic silo was polished with sandpaper to simulate the friction effect of the ore pass on the ore-rock bulk in the process of ore drawing.
According to the existing research results, for the central drawing model, the lateral pressure on both sides of the ore-pass wall was not different [25]. Therefore, in this paper, nine pressure sensors of the type HZC-TD1-30 KG, which is produced by Chengying Sensor Ltd. in Bengbu City of China, were uniformly arranged on the left side wall along the geometric center line of the ore pass to record the change in the lateral pressure on the ore-pass wall in real time.

3. Construction of the Numerical Model

3.1. Determination of the Contact Model and Detailed Parameters

In the two-dimensional simulation of particle flow, particles are usually simplified to disc-shaped objects, which is the basis of model iterative calculation and the precondition of mechanical equilibrium. Because the ore-rock particles in nature are mostly irregular blocks with sharp edges, this will lead to large errors in mechanical simulation calculation between ore-rock particles. The calculation time can be shortened, and the results can be achieved close to the irregular block motion, by adjusting the rolling friction coefficient between the particles and restricting the rotational ability of the particles [26,27]. Based on this, the anti-rotation linear contact model and the linear contact model built-in PFC were selected, respectively, for the ore-rock particles and the wall in this paper.
The anti-rotation contact model, which is based on the linear contact model, mainly considers the effective modulus, the normal and tangential stiffness ratio K*, and the anti-rotational friction coefficient of the particles. Specifically, the effective modulus of the ore material in this study is determined to be E* at 350 MPa according to the elastic modulus, and the normal and tangential stiffness ratio K* is 1.0. The collapse measurement model established by PFC was used for determining the anti-rotational friction coefficient, which is based on the same value of the numerical model’s natural repose angle obtained according to the physical test. After adjusting the anti-rolling friction coefficient and different mesoscopic parameters many times, the anti-rotational friction coefficient was finally determined to be 0.7. The established collapse measurement model is shown in Figure 3, and the mesoscopic parameters are shown in Table 2.
It should be pointed out that the ore-rock bulk density given in Table 2 is the same as the physical experimental value. The main reason for this is that the gravity density of the waste-rock block measured by the laboratory is 3050 kg/m3. According to the loosening coefficient of 1.50 of the ore-rock bulk provided by the mine, the ore-rock bulk density is calculated to be 2033 kg/m3 simply by the gravity density of the waste rock being divided by the loosening coefficient. Considering that there may be some errors in this treatment method, the ore-rock bulk density is simply adjusted to 2050 kg/m3, as shown in Table 2, and this is just a coincidence.

3.2. Establishment of the Numerical Model

According to the geometric parameters of the ore pass in situ, as shown in Section 2.2 in this paper, when the numerical model is established, the center of the drawing port is considered as the coordinate origin, and the total height of the ore storage section and the ore-drawing funnel is 38.4 m, as shown in Figure 4a. In order to monitor the lateral pressure of the ore-pass wall, 9 monitoring points, numbered 1–9 from bottom to top, are arranged along the left shaft wall at 4 m intervals. For observing the flow state of the ore-rock bulk, the ore-rock particles with different colors are placed in layers every 4 m upward from the lower to upper in the ore storage section, there are seven layers.
For analyzing the micromechanical changes during the ore-rock bulk flowing in the ore pass, the ore-rock stress is monitored by the method of measuring the circle [28,29]. A total of 18 columns and 53 measurement circles are arranged in the storage section of the ore-pass from bottom to top. Columns 1 to 6 are called Group 1; 7 to 12 are named Group 2; and 13 to 18 are named Group 3. The radius of each measurement circle is set to 1 m. By using surfer software, the coordination number and internal stress recorded via the measurement circle were used to draw the stress distribution cloud map in the Y-direction, so as to quantitatively characterize the micromechanical change characteristics of the stored ore-rock bulk. By using surfer software, the coordination number and internal stress recorded by the measurement circle were used to draw the stress distribution cloud map in the Y-direction so as to quantitatively characterize the micromechanical change characteristics of the stored ore-rock bulk, as shown in Figure 4b.
It should be noted that during the physical experiment, the geometric size of the ore pass and the size of the ore-rock particles in the case mine were scaled according to the ratio of 1:20. However, in numerical analysis, these were modeled according to the actual size of the mine, which is very different from the method proposed by Di Renzo, Bierwisch and Radl et al. [30,31,32]. The authors’ intention is to verify the consistency of the results of different methods and to conform to the actual situation of the ore pass in the case mine.

3.3. Reliability Analysis of the Numerical Models

Figure 5 shows the comparison of the static lateral pressures obtained, respectively, by numerical simulation, the physical similarity experiment, and the theoretical calculation. The theoretical lateral pressure value of the shaft wall is calculated according to Janssen’s theory [33].
Although this study did not carry out more relevant research based on Janssen theory, and only compared the lateral pressure calculated results of the Janssen equation with those of physical experiments and numerical simulations, it can be seen from Figure 5 that the static lateral pressure values obtained by the three methods have a good consistency. Based on the physical similarity experiment, it is found that the maximum errors between the numerical simulation and the theoretical calculation via the Janssen formula are, respectively, 11.8% and 18.1%; this indicates that the numerical model has a certain reliability in the process of analyzing the characteristics of the pressure distribution on the side wall of the ore pass.
Unfortunately, in the physical experiment and numerical simulation, the ore-rock storage height of the studied ore storage section in the ore pass was limited to 32 m, i.e., the maximum ore storage height of the ore pass in the case mine site, and the pressure curve obtained by these two methods did not show the pressure saturation phenomenon.
The pressure fluctuation phenomenon in the experimental curve may be related to the rotation and mobility of the ore-rock blocks in bulk systems caused by the gravitational compaction of the stored materials [10,34]. The rotation and mobility of the large and irregular blocks in the bulk system will change their contact mode (such as point, line, and surface contact [24]), which results in a decrease in the voidage of the bulk and the changing of the force transfer effect of granular particles.

4. Flow Characteristics and Stress Distribution of Ore-Rock Bulk

4.1. Flow Characteristics of Ore-Rock Bulk

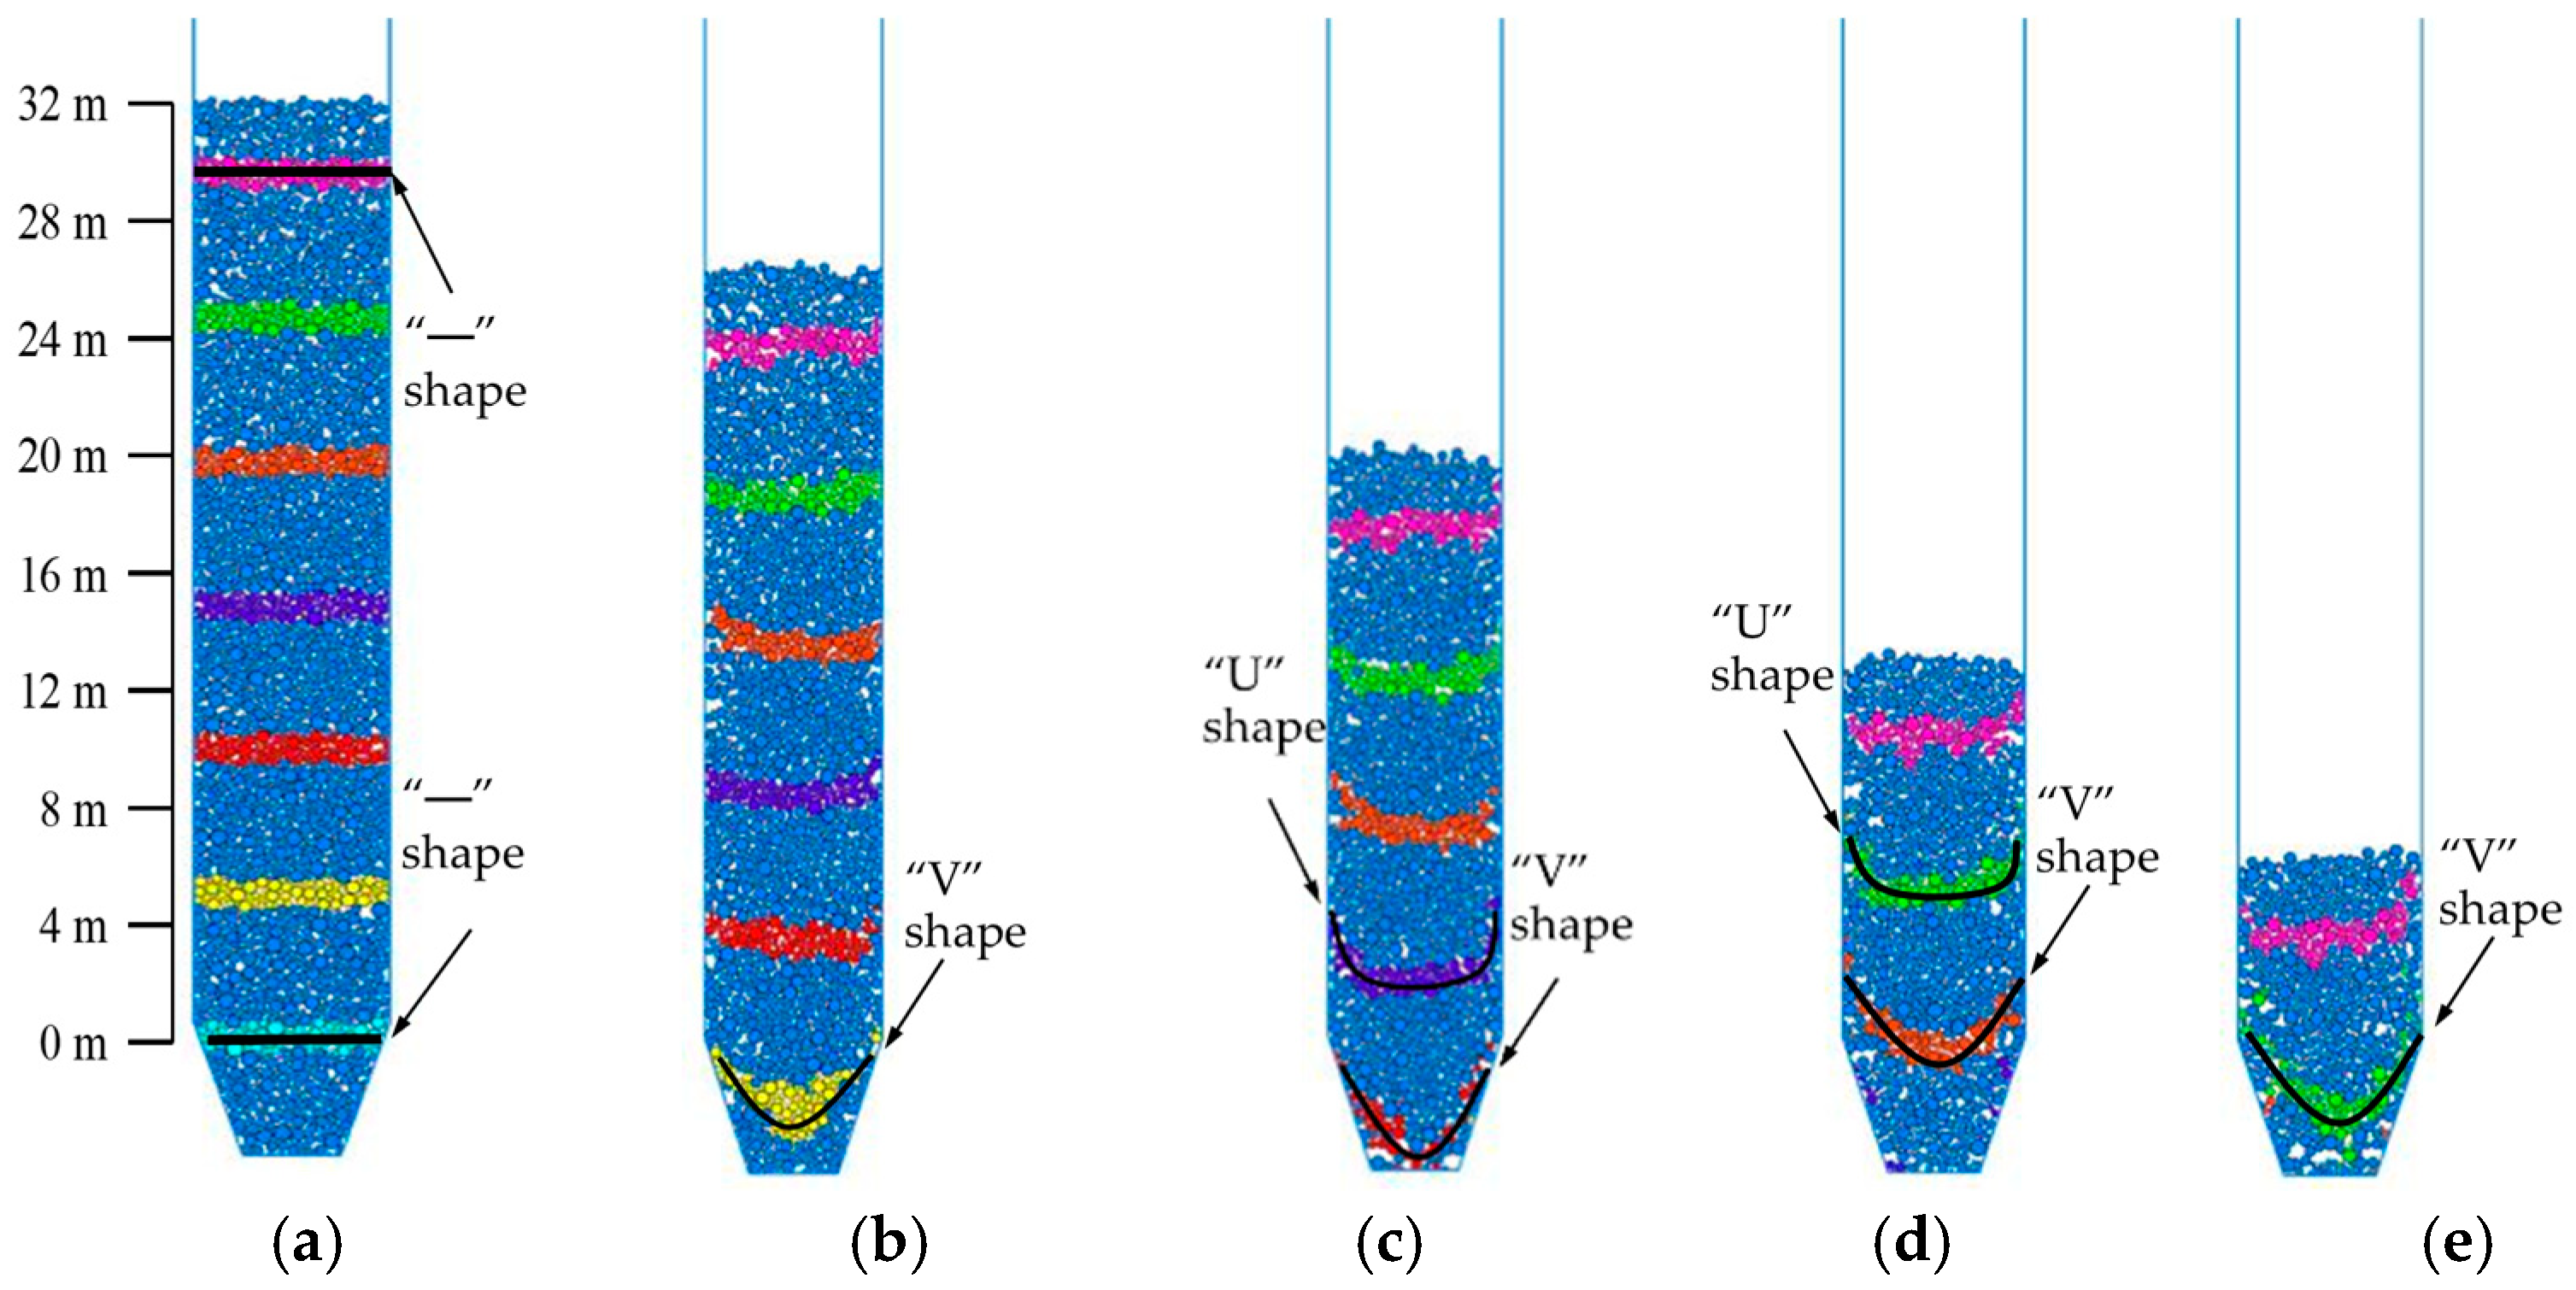
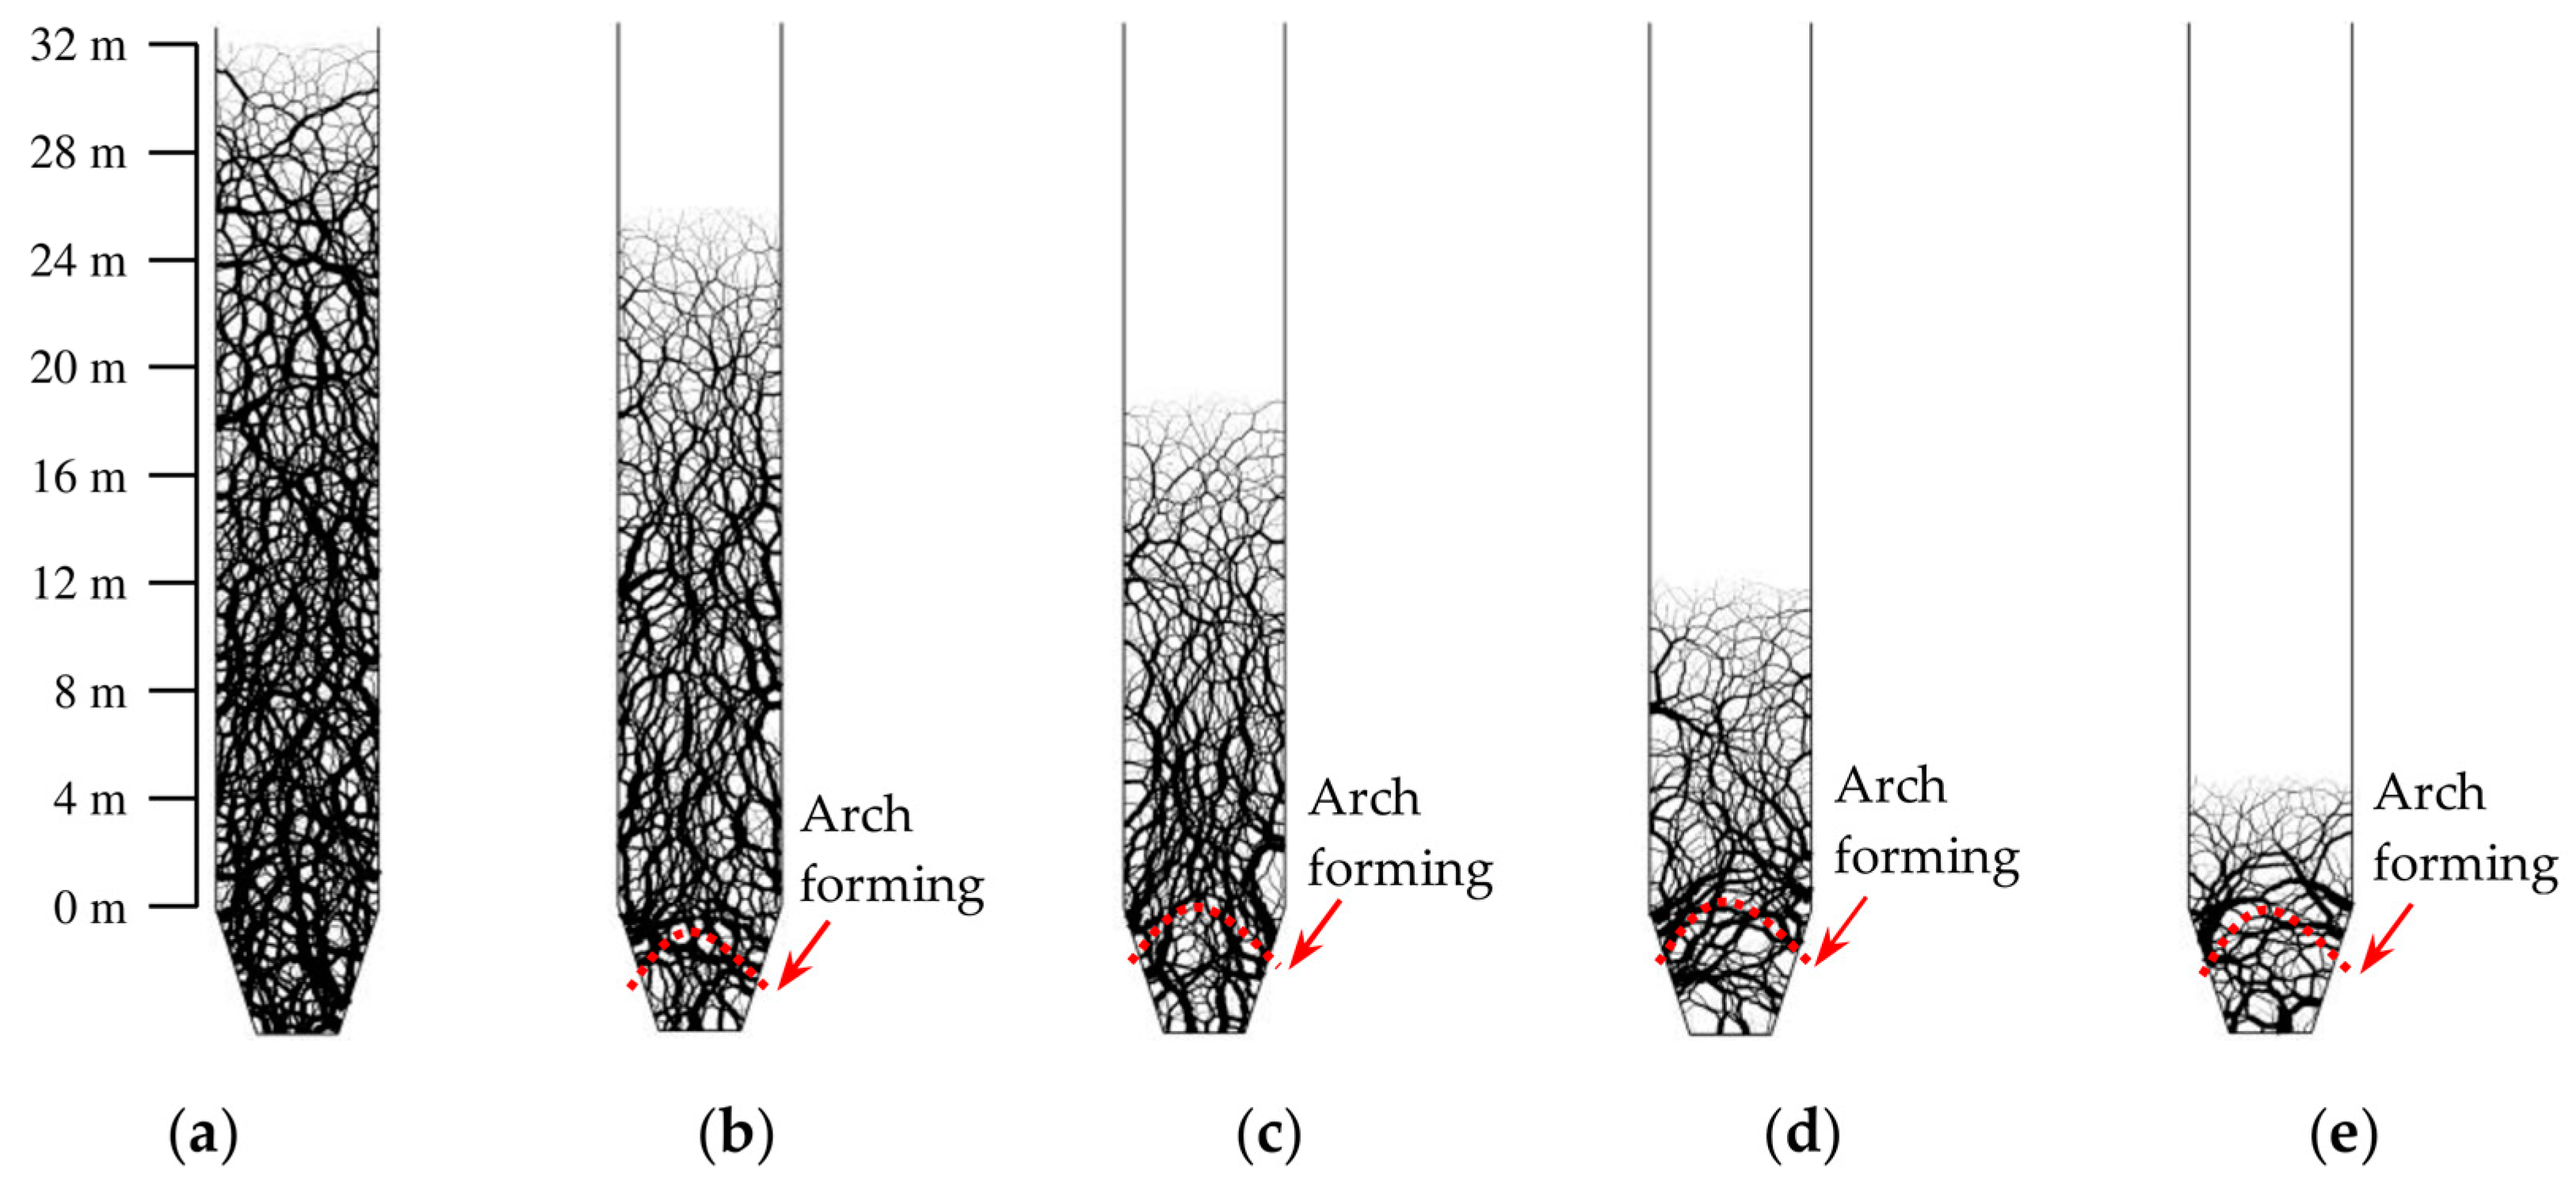
According to the actual process of ore drawing from the ore pass in the mine, a numerical simulation of a one-time drawing was carried out. During the ore drawing, the stored particles leave the ore pass under the action of gravity. When the volume of drawn ore-rock particles is greater than or equal to 5 m3, the ore drawing is suspended. When the internal force in the storage bulk reaches a new equilibrium, the one-time ore drawing is over. Repeating the above process, it is found that the ore-rock particles were completely drawn out from the ore pass 22 times, and the ore-drawing test is over. When ore drawing for the 21st time, the ore-rock particles near the pressure measuring point of No. 1 have been drawn out; therefore, Figure 6 shows the macroscopic flow characteristics of ore-rock for ore drawing 0~20 times.
Before the ore drawing begins, because the stress between the ore-rock particles is in a state of equilibrium, there is no movement trend of rotation, slide, slip, etc., and the ore-rock particles keep the original spatial shape and arrangement mode and distribute uniformly in the ore pass storage section. Each layer of labeling particles is distributed as a “—” shape.
At the beginning of the ore drawing, the ore-rock at the ore-drawing port is drawn out first and releases a certain space. Due to the influence of the interaction force between the particles and the friction resistance of the shaft wall, the velocity of the ore-rock decreases with the increase in the distance from the ore-drawing port. As a result, the ore-rock flowing inside the ore pass and the funnel presents the characteristics of high velocity of the ore-rock near the geometric center of the storage section; the low velocity of them near the shaft wall; and leads the labeling-particle layers distributed as a “U” shape. The distribution of labeling-particle layers within the height range of 0 m~10 m in the upper storage section of the drawing funnel is in the transition from a “—” shape to a “U” shape, but within the height range of 10 m~24 m, they are still distributed in the character similar to a “—” shape. With the increase in the ore-drawing times, the “U”-shaped distribution characteristics of each labeling layer become more and more obvious. Due to the influence of the interaction force between the ore-pass wall and the ore-rock particles inside the drawing funnel, and the extra boundary constraints by the funnel, the shape of the labeling layer leads to a change from a “U” to a “V” distribution. Finally, the labeling particles layer is drawn out from the funnel as a “V”-shape flow characteristic.

4.2. Stress Distribution of the Ore-Rock Bulk

4.2.1. Contact Density of Ore-Rock Bulk

The coordination number (Zi) is the average contact number between the particles of the ore-rock bulk, which reflects the quality and density of the internal contact of ore-rock particles to a certain extent. Therefore, the evolution law of internal micromechanics in ore-rock particles’ flow process can be directly studied by analyzing the coordination number [35]. The formula for calculating coordination number is as follows [36]:
Z i = 2 N C N P
where NC is the actual contact number of bulk particles (normal contact force is greater than 0) and NP is the total number of particles in the bulk.
It should be noted that when the number of contacts of a single particle is only 1, or there is no other particle in contact with it, it is considered that this particle has no contribution to the micromechanics of the entire particle system and should be ignored. In order to facilitate the statistics of the coordination number changes in each labeling layer, the average value of the coordination number Za is introduced, and its calculation formula is as follows:
Z a = i = 1 3 Z i 3
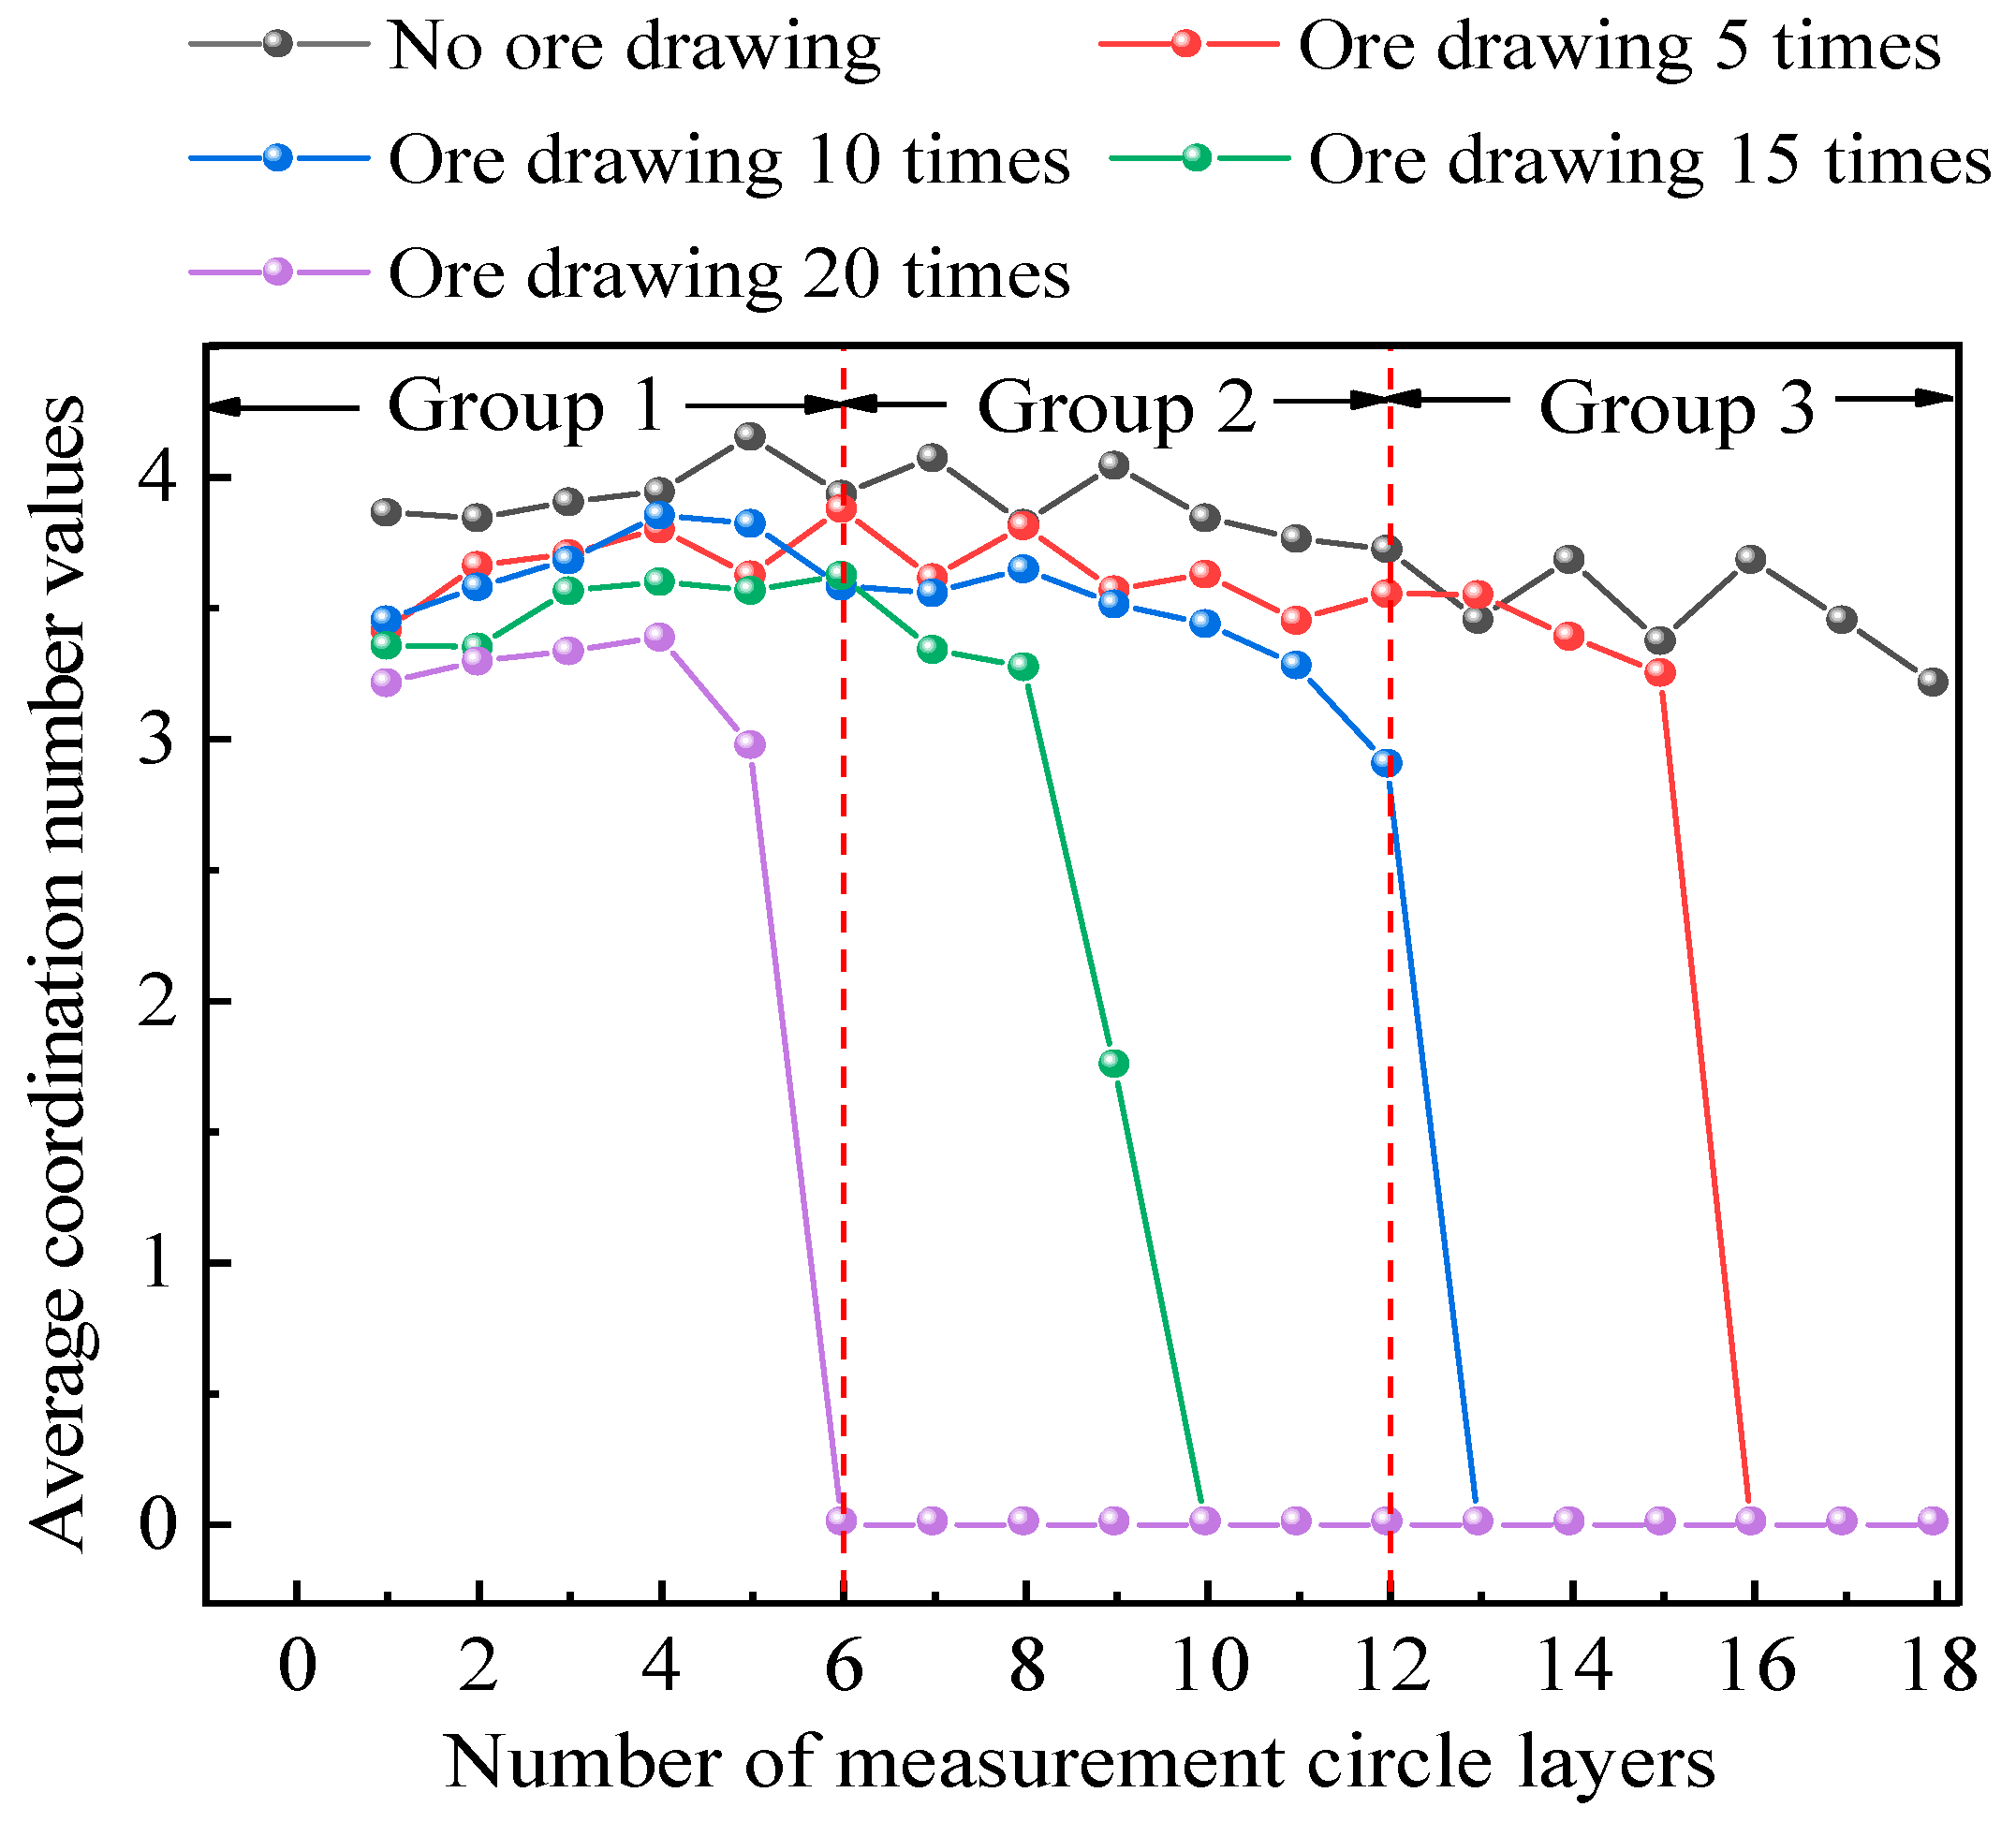
According to the coordination Za obtained by the monitoring during the numerical simulation, the change curve of the average value of the labeling-particle layer at different ore-drawing times was drawn, as shown in Figure 7. The coordination numbers monitored by 1~6 measurement circles were divided into Group 1, those measured by 7~12 were divided into Group 2, and those measured by 13~18 were divided into Group 3.
It can be seen from Figure 7 that the average coordination numbers at different positions in the ore-rock bulk are different to some extent during the whole ore-drawing process—the closer to the bottom of the ore pass, the greater the average coordination number, which also indicates that the ore-rock bulk is more compact. This phenomenon reflects the influence of the action of ore-rock particles’ gravity.
It can also be seen from Figure 7, that before the ore drawing begins, the average coordination number of Groups 1 to 3 is about 3.84~4.15, 3.72~3.2~4.05, and 3.21~3.68, respectively. The change relationship of the coordination numbers of different groups is Group 3 > Group 2 > Group 1, while the corresponding coordination number of each group has the opposite fluctuation rule. When the ore-rock was drawn five times, the coordination numbers of Group 1 gradually increased from 3.41 to 3.87, that of Group 2 fluctuated to decrease and was similar to the change rule of the coordination numbers without ore drawing, and that of Group 3 decreased rapidly from 3.54 to 0. When ore drawing 10 times, the coordination numbers of Group 1 increased from 3.44 to 3.85, and those of Group 2 and Group 3 decreased exponentially with the increase in the number of measurement circles and finally stabilized at about 0. With the increase in the ore-drawing times, the change rule of the coordination numbers of each group is almost consistent, decreasing exponentially to 0.
According to the above analysis, it can be seen that due to the effect of the inertia force generated by the particles flowing and the bulk gravity of ore-rock bulk in the range of Groups 2 and 3 during the entire ore-drawing process, the ore-rock particles’ coordination numbers in the range of the measurement circles of Group 1 fluctuate and then decrease. This indicates that the ore-rock particles in this region tend to have a state of compact contact with high contact strength compared to that of loose contact with small contact strength. Affected by the ore-rock drawing out, the coordination number of Group 2 is lower than that of Group 1, the ore-rock particles move toward having a dense contact strength with high strength from having loose contact with low strength, but the degree is not as high as that of Group 1. The coordination number of Group 3 was affected by the ore drawing (the height of the stored ore-rock declined and there were no ore-rock particles above Group 3), and the coordination numbers gradually decreased after the ore drawing began.

4.2.2. Stress Distribution Characteristics of Ore-Rock Bulk

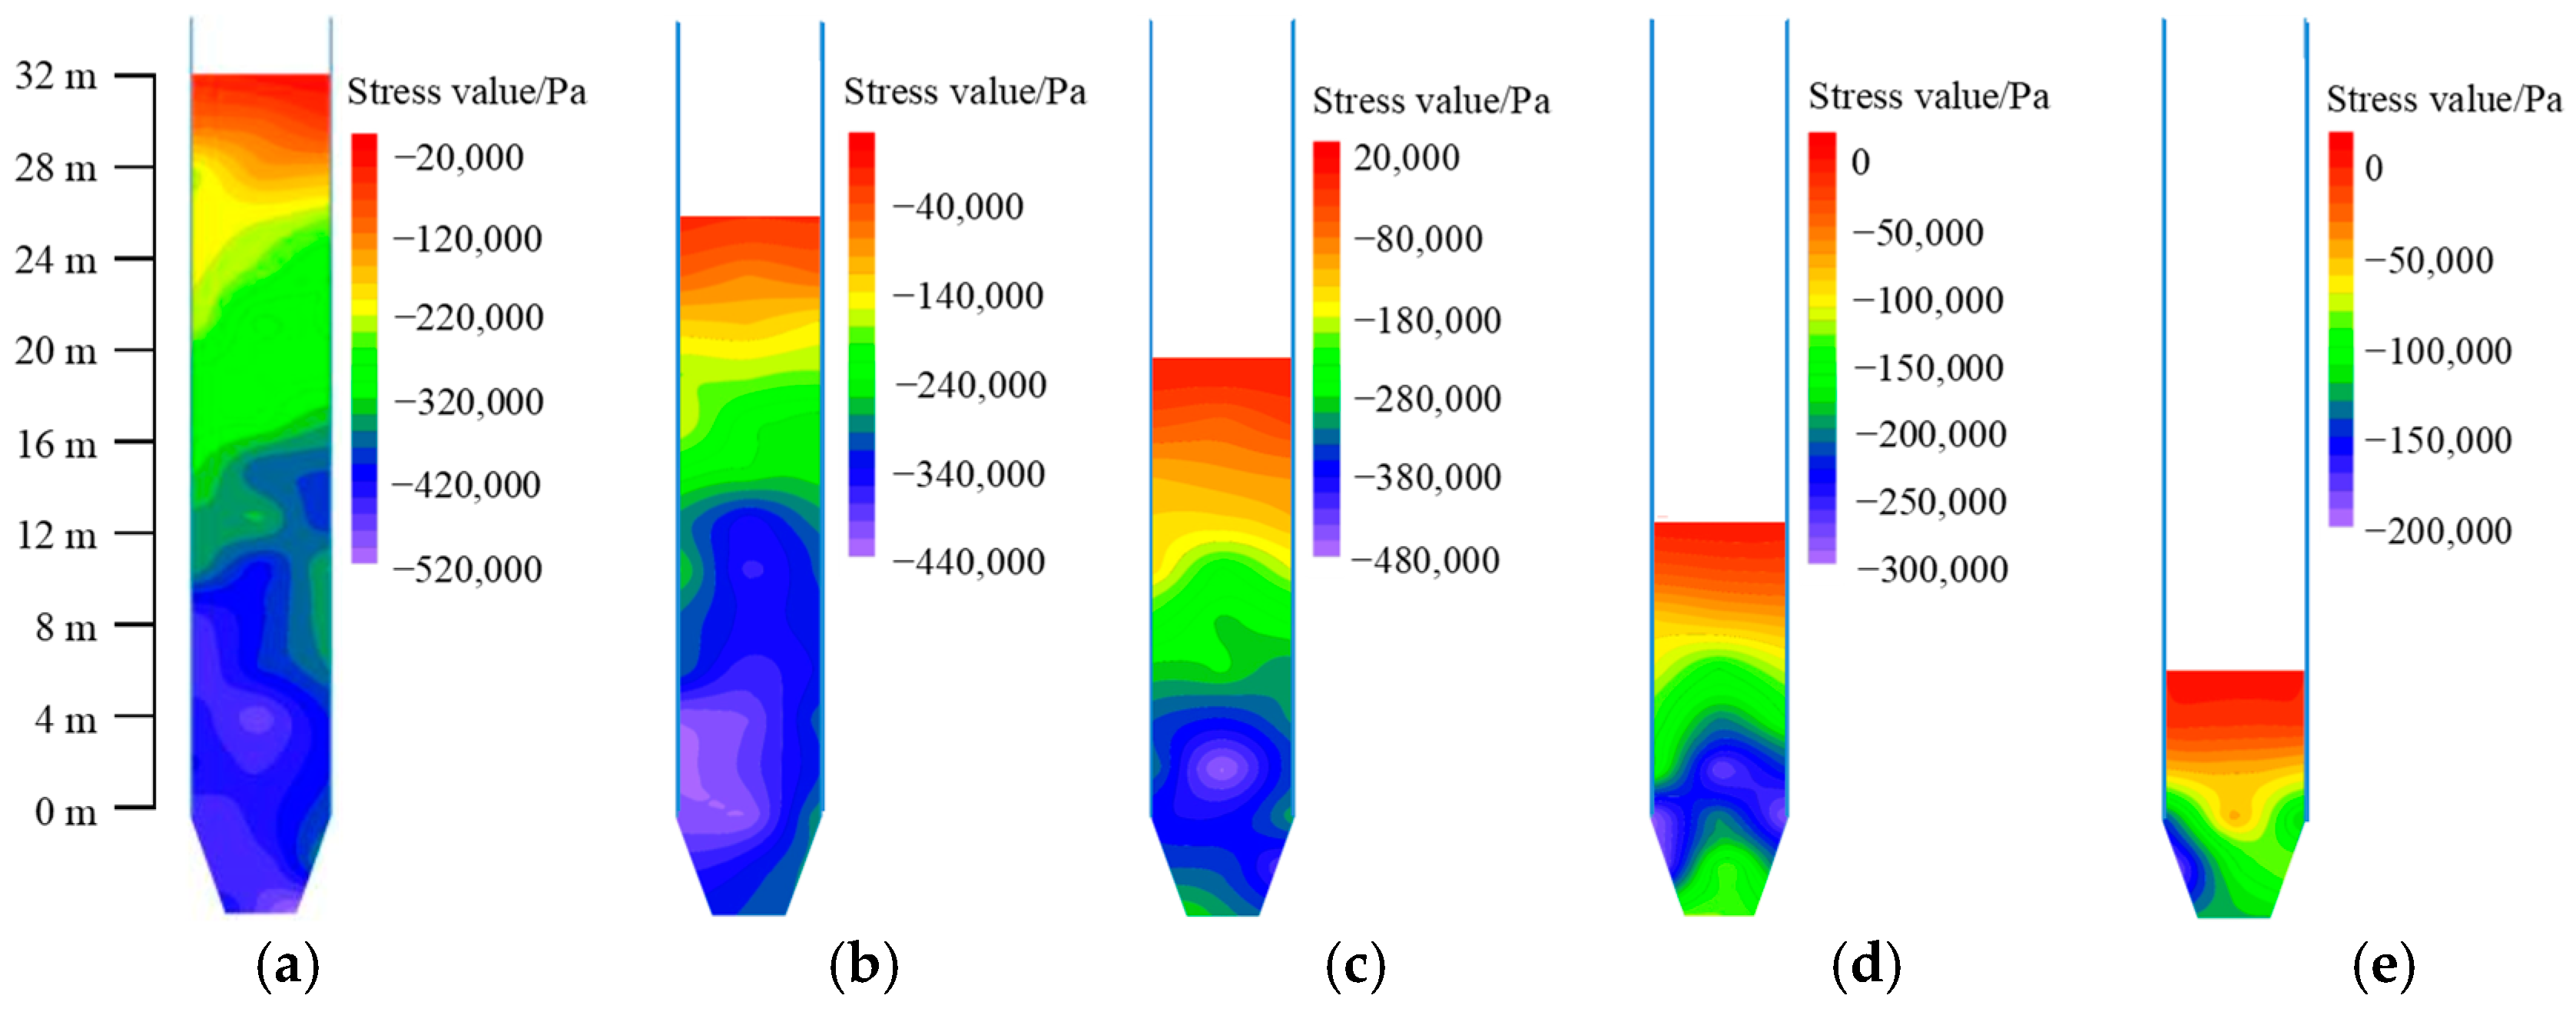
A stress distribution nephogram is a common method used to intuitively analyze the characteristics of stress changes within the bulk [28]. During stress monitoring, stress measurement circles are arranged on the surface of ore-rock particles for stress monitoring and surfer software is used to draw the monitored stress data into a stress cloud map. According to the data gained by the stress measurement circle, the stress distribution nephogram is shown in Figure 8.
It can be seen from Figure 8 that, before the ore drawing begins, the ore-rock bulk has a large stress concentration phenomenon in the range of 0–16 m, and the stress increases with the increase in the shaft depth. When the ore-rock was drawn 5 times, the stress value of the ore-rock in the ore pass decreased to a different degree—that is, the high-stress (blue part) area decreased. this indicates that the decrease in the amount of ore-rock in the storage section is the main reason for the stress change and the area decrease in the high stress. With the increase in the ore-drawing times, the total amount of ore-rock in the ore pass is constantly decreasing, and the high-stress concentration area is gradually reduced to the drawing funnel from the range of 0–16 m. When the ore-rock in the storage section is completely moved into the drawing funnel, the high-stress area in the storage section completely disappears.
It is worth noting that in the entire process of ore drawing, although the range of the high-stress concentration area in the ore storage section continues to decrease with the ore-rock drawing out, the storage section in the range of 0~16 m and the drawing funnel are the main areas of high-stress concentration. As a result, the ore-pass wall in this area would bear a larger stress, making it easy to produce a large number of fine cracks and causing damage to the ore-pass wall.

4.2.3. Contact Force Evolution Characteristics of Ore-Rock Bulk

As a macroscopic expression of microscopic contact force, the force chain can reflect the microscopic mechanical behavior of ore-rock particles [10,37]. However, due to the inhomogeneity of the spatial distribution of contact force between the ore-rock particles, it is very challenging to directly characterize the evolution of the contact force network quantitatively, and the application of a contact force probability distribution curve can reflect the distribution of the contact force between particles from the perspective of contact force [38]. Taking the total contact force F between particles as an example, the normal and tangential contact force vector and average contact force f n of any particle i in the ore-rock particle system are normalized. The calculation formula is as follows [39]:
f = F f n
where f is the normalized processing result of the total contact force, f n is the average contact force, f n = i = 1 N i F N i , i is the random particle number, and Ni is the total number of particles.
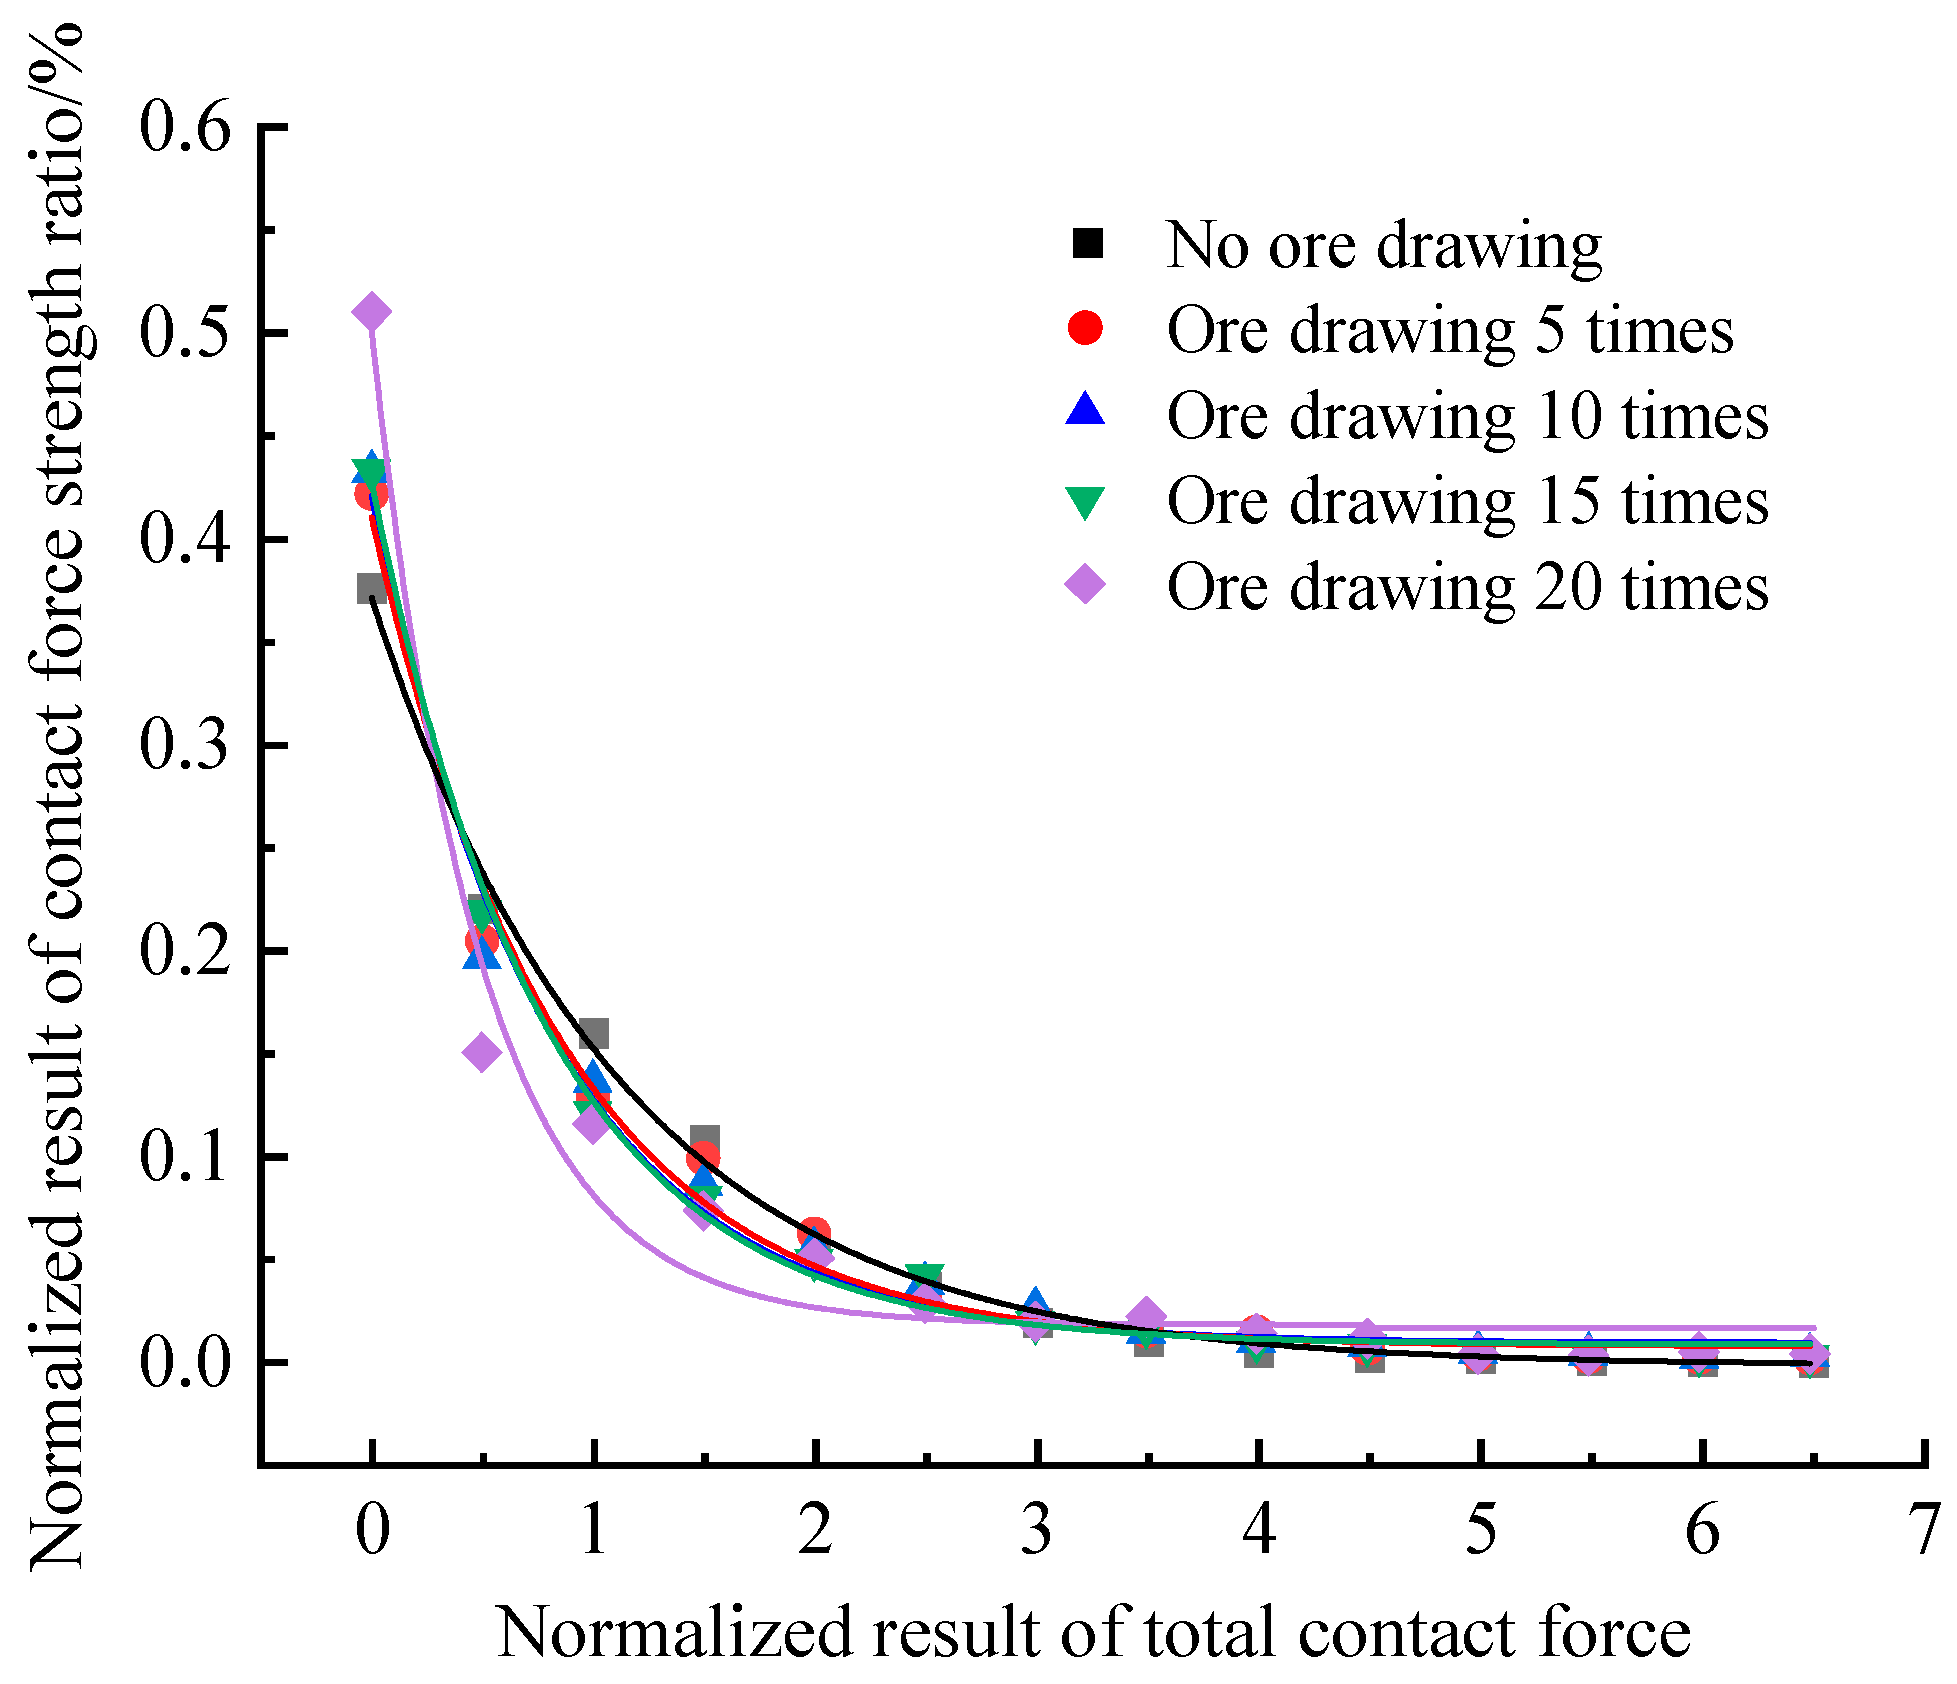
In the process of studying the macro- and micromechanical variation characteristics of ore-rock bulk, the normalization treatment of the resultant force is used to quantitatively analyze the contact force distribution characteristics inside the bulk [23]. Based on Formula (3), Figure 9 shows the probability distribution curve of the contact force between ore-rock particles. The horizontal coordinate, which is divided into several intervals at 0.5 intervals, is the normalized result of the total contact force f, and the numbers of contact forces in each interval are calculated respectively. The ordinate reflects the normalized result of the contact force strength, which represents the percentage of the number of contact forces P(f) in the f interval of the total number of contact forces.
There are five curves in Figure 9, which represent, respectively, the change characteristics of contact force before the ore drawing begins and when the ore draws 5, 10, 15, and 20 times. It can be seen from the probability distribution of contact force strength in Figure 9 that the contact force strength accounts for 85% in the range of 0.0~2.0, while it accounts for less than 15% in the range of 2.0~7.0. This shows that the weak force chains are the main component, while the strong force chain is the important component of the force chain network, and the strong and weak force chains are interwoven to form the force chain network, which maintains the stability of the whole bulk system. At the same time, with the increase in ore-drawing times, the force chains in the whole bulk system continue to break and recombine under the action of the tangential forces, and the proportion of weak force chains decreases exponentially, while that of strong chains tends to be stable. This indicates that the ore-rock particles contained in the weak force chain contribute little to the stability of the whole system, while those in the strong force chain play an important role in the stability of the whole system.
It is found that after normalization, the distribution of contact force strength between ore-rock particles decreased exponentially, which indicates that the ore-rock flow in the ore-drawing process has a significant effect on the Probability Distribution Function (PDF) between particles. In addition, according to the variation characteristics of the PDF, the exponential function y = A 1 × e x m + A 2 is used to fit it, and the fitted PDF of the contact force is shown in Table 3. It can be seen from Table 3 that all fitting coefficient R2 is greater than 0.97, indicating that the PDF of the contact force has a good fitting effect.
Figure 10 shows the characteristics of the contact force chains in ore-rock particles at different ore-drawing times. In this figure, the deeper the black line, the greater the contact force of ore-rock blocks. During the entire ore-drawing process, due to the influence of gravity, the color of the contact force chain gradually deepens from top to down. That is, the contact force gradually increases. According to the statistics of the strong and weak force chains respectively, the ratio of the strong and the weak force chains is about 1:17, which indicates that the weak force chain is the main component of the force chain network in the contact force chain of ore-rock particles, while the proportion of the strong force chain is relatively small. The force chain network composed of the strong and weak force chains interwoven maintains the stability of the whole ore-rock bulk. With the increase in ore-drawing times, the strong and weak force chains inside the particle system continuously break and transfer under the action of ore-rock flow, and the proportion of the weak force chains decreases exponentially, which indicates that the number of ore-rock particles contained in the weak force chains increases gradually, but contributes less to the stability of the whole bulk system. Meanwhile, the number of ore-rock particles contained in the strong force chains gradually decreases but contributes more to the stability of the whole bulk system.
It can also be seen from Figure 10 that the distribution characteristics of the strong and weak force chains show that the contact strength between ore-rock particles increases with the increase in the depth of stored ore-rock, and the contact between ore-rock particles becomes closer; especially the characteristic before ore drawing is obvious. This phenomenon reflects that the contact strength between ore-rock particles is obviously affected by the ore-rock’s gravity compaction. The effect of gravity compaction, based on the study results of Tempone, P., et al. [40], is mainly manifested in that it changes the contact mode between irregular ore-rock particles and reduces the voidage of the particle system.
It seems that the material stored in the ore pass has a strong compression effect before the ore drawing, which is only a manifestation of the gravity compaction of the stored materials. Before ore drawing begins, as shown in Figure 10a, the stored ore-rock material in the ore pass seems to be in a static state, but in fact, due to the irregularity of the ore-rock blocks, the geometric center of each block does not coincide with its gravity center, resulting in the rotation and movement of the ore-rock block in the particle system and constantly changing its spatial arrangement form and the contact mode between particles until it can no longer overcome the resistance from the other particles. As a result, the contact strength between the ore-rock blocks reaches the maximum value, and the voidage of the bulk system reaches the minimum value. As shown in Figure 10b,c, with the ore-rock near the funnel port drawing out, the upper ore-rocks continue to move toward the funnel, the void ratio of the stored materials in ore pass increases, and the contact degree of ore-rock blocks decreases. So, the distribution state of strong and weak force chains also changes before and during ore drawing.

4.3. Lateral Pressure Distribution of the Shaft Wall in the Storage Section

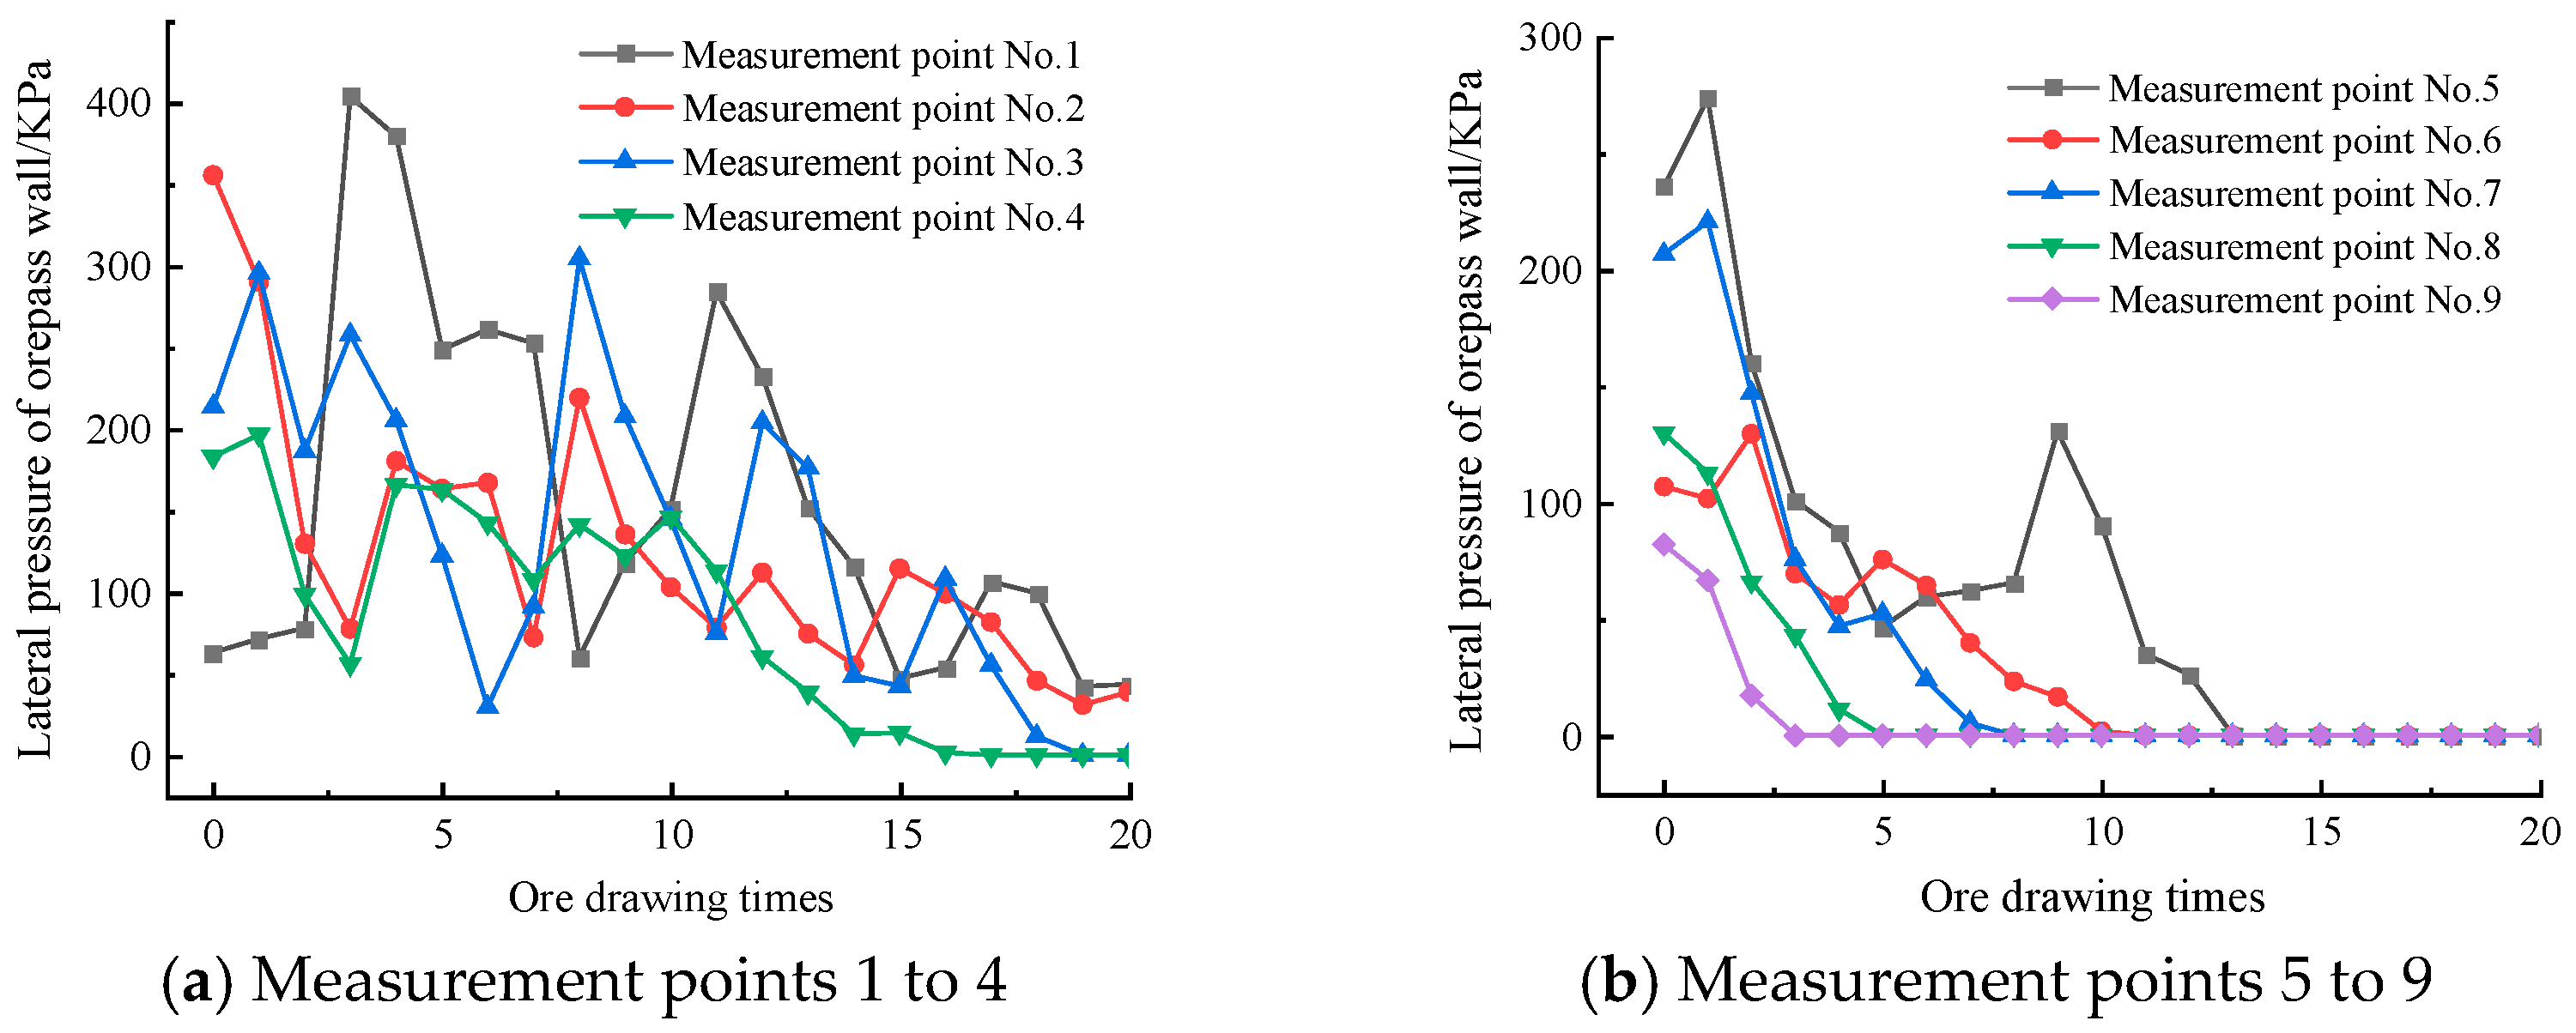
In the storage section, the important reason for the change of ore-rock stress on both sides of the ore-pass wall is that the particles change their internal spatial distribution and flow characteristics during the flow process [41]. However, because of the effect of the discontinuity of contact between the ore-rock bulk and the ore-pass wall, it is difficult to accurately characterize the change mechanism of the wall stress by the change of the dynamic lateral pressure of the shaft wall. The overpressure coefficient and overpressure times can be used to reveal the mechanical mechanism of the stress change of the ore-pass wall. According to the elevation position of each measuring point, measuring points 1–4 and 5–9 are divided into the lower and the upper part of the storage section, respectively, and the change characteristics of the lateral pressure at each measuring point are gained in real time, as shown in Figure 11.
It can be seen from Figure 11 that, in the process of ore drawing, the dynamic lateral pressure on the shaft wall of each measuring point basically fluctuates exponentially and decreases, and the pressure value increases gradually from top to bottom (point 9 to 1), while that of some measuring points (point 1 and 3~7) increases significantly compared with the static lateral pressure before ore drawing. The maximum pressure value appears after a period of ore-drawing time, and not at the moment of initial drawing. At the beginning of ore drawing, the loose ore-rock body will produce the phenomenon of the particles’ rotation, and they will slip under the action of their own gravity, which breaks the initial mechanical equilibrium and causes the mechanical behavior of “arch forming-arch collapsing” continuously inside the stored materials. The formation of the arch, which may be instantaneous and unstable, causes the increase in the lateral pressure value of the measuring point near the arch foot—that is, the “over-pressure phenomenon”. The collapse of the arch leads to the instantaneous decrease in the lateral pressure value near the measuring point. The phenomenon of “arch forming- arch collapsing” occurs alternately in the process of ore-rock flow, which results in the exponential fluctuation decreasing of dynamic lateral pressure at each measuring point and the peak lateral pressure appearing after a period of time. This is consistent with the results of previous research on bulk and spontaneous arch formation during ore-rock flow [42,43].
Also, the overpressure data at each measuring point of the ore-pass wall under different ore-drawing times are counted in real time, which is shown in Table 4.
It can be seen from Table 4 that the degree of the overpressure phenomenon at each measuring point is different under different ore-drawing times. In the 1~9 measuring points, the accumulated overpressure of point 1 is 15 times, that of point 3 is 3 times, and that of points 4~7 is only 1 time. This indicates that the frequency of the overpressure phenomenon in the lower part of the storage section is much greater than that in the upper part, and the closer the measuring point at the bottom of the storage section, the greater the frequency of the overpressure phenomenon. This is due to the speed and acceleration gradually increasing and the movement intensity of ore-rock particles gradually rising when the ore drawing began. At this time, a strong dynamic load is generated on the wall of the ore storage section, causing the phenomenon of overpressure and the increase in dynamic lateral pressure on the wall. With the continuous increase in ore-drawing times (the total amount of the ore-rock in the shaft is constantly reduced), the dynamic lateral pressure of the wall will inevitably decline even if the movement of the ore-rock particles is intense. When the lower area of the storage section bears the secondary impact load caused by the broken arch in the ore-rock bulk, and the additional gravity compaction of the upper covered ore-rock particles, the dynamic lateral pressure, overpressure coefficient, and overpressure frequency of the shaft wall are led to increase. As a result, the overpressure coefficient of measuring point 1 is the largest, followed by the point 3. The peak overpressure coefficient of measuring point 1 is about five times that of point 6; this further indicates that the overpressure coefficient is positively correlated with the storage depth in the process of ore-rock flow. In a word, with the largest overpressure frequency and the largest overpressure coefficient, the damage degree of the ore-pass wall will be greater. The deeper the storage depth, the greater the overpressure coefficient. The phenomenon of overpressure occurs the most frequently, and in the measuring point area where the overpressure coefficient value is the largest, the damage degree of the well wall will be greater. Therefore, from the perspective of overpressure frequency and overpressure coefficient, the damage degree of the lower storage section is much greater than that of the upper storage section.

5. Conclusions

Based on the discrete element analysis method, the flow characteristics, the mechanical evolution mechanism of the ore-rock particles in the ore-drawing process, and the stress characteristics of the wall of the ore-pass storage section are studied. A method for characterizing the damage degree of the ore-pass wall using the overpressure coefficient and overpressure frequency is proposed. The main conclusions of this study are as follows:
The important factors affecting the ore-rock’s macroscopic flow pattern are the friction between ore-rock particles, particles, and the shaft wall, and the constraint of funnel boundary. In the ore-drawing process, the macro-shape of rock particles with different flow rates gradually changes from a “—” shape to a “U” shape, and finally, a “V” shape is drawn out.
The study of coordination number variation characteristics between ore-rock particles shows that under the different ore-drawing times, the average coordination numbers between ore-rock particles near the bottom of the ore pass are larger than that in the upper part of the ore pass. When the ore is drawn 5 times, the average coordination number of measuring circles No. 1–6 (near the bottom of the ore pass) increased from 3.41 times to 3.87; after ore drawing 10 times, it increased to 3.85; and the average coordination numbers measured by measuring circles No. 7–18 (located in the upper part of measuring circles No. 1–6), depending on the position of the measuring circle, decreased continuously from the top to the bottom, until they were 0. This causes the density and stress concentration to become more and more obvious, and the range of the high-stress concentration area decreases with the decrease in the total amount of stored ore-rock. The shaft wall and funnel at the bottom of the storage section are under the action of high stress, which makes it easy to produce a large number of fine cracks, causing damage to the ore-pass wall.
With the increase in the ore-drawing times, the probability distribution of the contact force strength decreases exponentially. The strong and weak force chains in the ore-rock bulk constantly break and transfer under the action of ore-rock flow, and the number of ore-rock particles contained in the weak force chains gradually increased, while that in the strong force chains gradually reduced. However, the strong force chains play a leading role in ensuring the stability of the whole bulk structure system.

Author Contributions

Methodology, software, formal analysis, data curation, writing—original draft, funding acquisition, Z.X.; Software, investigation, resources, data curation, Z.D.; Conceptualization, methodology, formal analysis, writing—review and editing, project administration, funding acquisition, Z.L.; Resources, data curation, visualization, supervision, C.M. All authors have read and agreed to the published version of the manuscript.

Funding

The work was supported by the National Natural Science Foundation of China (Grant No. 52204137, Grant No. 51774176), the Natural Science Foundation of Liaoning Province (Grant No. 2022-BS-281), and the Outstanding Young Scientific and Technological Talents Project of Liaoning University of Science and Technology (Grant No. 2023YQ10).

Data Availability Statement

The detailed data are available upon request. The data are not publicly available due to privacy.

Conflicts of Interest

The authors declare no conflicts of interest.

References

  1. Jiang, W. The study of arching mechanism of ores in chute based on discontinuous deformation analysis. Int. J. Digit. Content Technol. Its Appl. 2013, 7, 190. [Google Scholar]
  2. Alex, M.R.; Verne, M.; Sanjay, N.; Ting, R. Experimental and numerical investigation of high-yield grout ore pass plugs to resist impact loads. Int. J. Rock Mech. Min. Sci. 2014, 70, 1–15. [Google Scholar]
  3. Hadjigeorgiou, J.; Stacey, T.R. The absence of strategy in orepass planning, design, and management. J. South. Afr. Inst. Min. Metall. 2013, 113, 795–801. [Google Scholar]
  4. Liu, H.; He, R.; Li, G.; Sun, D.; Li, P. Development of gravity flow draw theory and determination of its parameters. Int. J. Rock Mech. Min. Sci. 2023, 171, 105582. [Google Scholar] [CrossRef]
  5. Huang, Y.; Cao, P.; Wang, Y. Motion situation and kinetic energy analysis for ore pass of underground mine. Appl. Mech. Mater. 2011, 90–93, 383–386. [Google Scholar] [CrossRef]
  6. Ma, C.; Lu, Z.X.; Yin, Y.; Cao, P. Prediction model for the migration trajectory and velocity of ore-rock bulks in an orepass storage section. Chin. J. Eng. 2021, 43, 627–635. [Google Scholar]
  7. Zhao, Y.; Ye, H.W.; Lei, T.; Wang, C.; Wang, Q.Z.; Long, M. Theoretical study of damage characteristics on ore pass wall based on the erosion-wearing theory. Chin. J. Rock Mech. Eng. 2017, 36, 4002–4007. [Google Scholar]
  8. Jin, A.; Chen, S.; Sun, H.; Zhao, Y.; Qin, X.; Ju, Y.; Gao, Y. Characteristics of particle percolation based on inhomogeneous particle size distribution. J. Cent. South Univ. (Sci. Technol.) 2020, 51, 1673–1681. [Google Scholar]
  9. Cundall, P.A.; Strack, O.D.L. A discrete numerical model for granular assemblies. Geotechnique 1979, 29, 47–65. [Google Scholar] [CrossRef]
  10. Yang, Y.; Deng, Z.; Lu, Z. Effects of ore-rock falling velocity on the stored materials and the force on the shaft wall in a vertical orepass. Mech. Adv. Mater. Struct. 2023, 30, 3455–3462. [Google Scholar] [CrossRef]
  11. Sato, A.; Tang, H. Analysis of Ore Pass Hang-Ups in Long Vertical Ore Passes by 3-D DEM. Int. J. Min. Eng. Miner. Process. 2020, 9, 1–11. [Google Scholar]
  12. Hadjigeorgiou, J.; Lessard, J.F. Numerical investigations of ore pass hang-up phenomena. Int. J. Rock Mech. Min. Sci. 2007, 44, 820–834. [Google Scholar] [CrossRef]
  13. Esmaieli, K.; Hadjigeorgiou, J.; Grenon, M. Stability analysis of the 19A ore pass at Brunswick Mine using a two-stage numerical modeling approach. Rock Mech. Rock Eng. 2013, 46, 1323–1338. [Google Scholar] [CrossRef]
  14. Yuan, F.; Pang, K.; Dong, C.; Xu, Z. The PFC3D numerical simulation on dynamic pressures and flow of sidedraw silos. Eng. Mech. 2016, 33, 301–305. [Google Scholar]
  15. González-Montellano, C.; Gallego, E.; Ramírez-Gómez, Á.; Ayuga, F. Three dimensional discrete element models for simulating the filling and emptying of silos: Analysis of numerical results. Comput. Chem. Eng. 2012, 40, 22–32. [Google Scholar] [CrossRef]
  16. Xu, P.; Duan, X.; Qian, G.; Zhou, X.G. Dependence of wall stress ratio on wall friction coefficient during the discharging of a 3D rectangular hopper. Powder Technol. 2015, 284, 326–335. [Google Scholar] [CrossRef]
  17. Cheng, Q.; Sun, W.; Lu, S. Discrete element analysis of squat silo under eccentric drawing by PFC3D. J. Civ. Eng. Manag. 2016, 33, 43–47. [Google Scholar]
  18. Feng, Y.; Liu, J. Research on the dynamic evolution of overpressure coefficient of grain unloading into arch in silos. Chin. J. Appl. Mech. 2020, 37, 1036–1042+1388–1389. [Google Scholar]
  19. Pacheco-Martinez, H.; Van Gerner, H.J.; Ruiz-Suárez, J.C. Storage and drawing of a granular fluid. Phys. Rev. E Stat. Nonlinear Soft Matter Phys. 2008, 77 Pt 1, 021303. [Google Scholar] [CrossRef]
  20. Žurovec, D.; Hlosta, J.; Nečas, J.; Zegzulka, J. Monitoring bulk material pressure on bottom of storage using DEM. Open Eng. 2019, 9, 623–630. [Google Scholar] [CrossRef]
  21. Windows-Yule CR, K.; Mühlbauer, S.; Cisneros, L.T.; Nair, P.; Marzulli, V.; Pöschel, T. Janssen effect in dynamic particulate systems. Phys. Rev. E 2019, 100, 022902. [Google Scholar] [CrossRef] [PubMed]
  22. Zhao, H.; An, X.; Wu, Y.; Qian, Q. DEM modeling on stress profile and behavior in granular matter. Powder Technol. 2018, 323, 149–154. [Google Scholar] [CrossRef]
  23. Chen, Q.; Liu, E.; Wang, S. Characteristics of ore contact force in ellipsoid ore drawing law. J. Min. Saf. Eng. 2021, 38, 1210–1219. [Google Scholar]
  24. Zhou, J. Study on the natural resting angle of loose ores. Nonferrous Met. 1983, 35, 24–29. [Google Scholar]
  25. Kejin, L.; Zhaoran, X.; Shihao, W. Discrete element-based simulation of silo storage unloading arch formation process and silo wall pressure distribution. Trans. Chin. Soc. Agric. Eng. 2018, 34, 277–285. [Google Scholar]
  26. Wensrich, C.M.; Katterfeld, A. Rolling friction as a technique for modelling particle shape in DEM. Powder Technol. 2012, 217, 409–417. [Google Scholar] [CrossRef]
  27. Iwashita, K.; Oda, M. Rolling resistance at contacts in simulation of shear band development by DEM. J. Eng. Mech. 1998, 124, 285–292. [Google Scholar] [CrossRef]
  28. Chen, S.; Xia, Z.; Feng, F.; Yin, D. Numerical study on strength and failure characteristics of rock samples with different hole defects. Bull. Eng. Geol. Environ. 2021, 80, 1523–1540. [Google Scholar] [CrossRef]
  29. Sun, H.; Zhao, L.S.; Wei, L.C.; Jia, J.Z.; Zhou, S.G. Numerical study of the influence of multiple parameters on hang-ups: Insight from a structural and mechanical characteristics analysis. Rock Mech. Rock Eng. 2024. [Google Scholar] [CrossRef]
  30. Di Renzo, A.; Napolitano, E.S.; Di Maio, F.P. Coarse-grain DEM modelling in fluidized bed simulation: A Review. Processes 2021, 9, 279. [Google Scholar] [CrossRef]
  31. Bierwisch, C.; Kraft, T.; Riedel, H.; Moseler, M. Three-dimensional discrete element models for the granular statics and dynamics of powders in cavity filling. J. Mech. Phys. Solids 2009, 57, 10–31. [Google Scholar] [CrossRef]
  32. Radl, S.; Radeke, C.; Khinast, J.G.; Sundaresan, S. Parcel-based approach for the simulation of gas-particle flows. In Proceedings of the 8th International Conference on CFD in Oil & Gas, Metallurgical and Process Industries, Trondheim, Norway, 21–23 June 2011. [Google Scholar]
  33. Chen, X. Extension of classical Janssen loose mass pressure theory and its application in mining engineering. Chin. J. Geotech. Eng. 2010, 32, 315–319. [Google Scholar]
  34. Raúl, L.C.; Miguel, A.F.; Fernando, L. Experimental study of gravity flow under confined conditions. Int. J. Rock Mech. Min. Sci. 2014, 67, 164–169. [Google Scholar]
  35. Shi, C.; Zhang, Q.; Wang, S. Numerical simulation techniques and applications of granular flow (PFC5.0). Rock Soil Mech. 2018, 39, 36. [Google Scholar]
  36. Oda, M. Co-ordination number and its relation to shear strength of granular material. Soils Found. 1977, 17, 29–42. [Google Scholar] [CrossRef]
  37. Radjai, F.; Wolf, D.E.; Jean, M.; Moreau, J.J. Bimodal character of stress transmission in granular packings. Phys. Rev. Lett. 1998, 80, 61. [Google Scholar] [CrossRef]
  38. Majmudar, T.S.; Behringer, R.P. Contact force measurements and stress-induced anisotropy in granular materials. Nature 2005, 435, 1079–1082. [Google Scholar] [CrossRef]
  39. Azéma, E.; Radjai, F. Force chains and contact network topology in sheared packings of elongated particles. Phys. Rev. E 2012, 85, 031303. [Google Scholar] [CrossRef]
  40. Tempone, P.; Landro, M.; Fjær, E. 4D gravity response of compacting reservoirs: Analytical approach. Geophysics. 2012, 77, G45–G54. [Google Scholar] [CrossRef]
  41. Maiti, R.; Das, G.; Das, P.K. Experiments on eccentric granular drawing from a quasi-two-dimensional silo. Powder Technol. 2016, 301, 1054–1066. [Google Scholar] [CrossRef]
  42. Cannavacciuolo, A.; Barletta, D.; Donsì, G.; Ferrari, G.; Poletto, M. Arch-Free flow in aerated silo discharge of cohesive powders. Powder Technol. 2009, 191, 272–279. [Google Scholar] [CrossRef]
  43. Han, G.; Gong, Q.; Zhou, S. Particle flow simulation analysis of micro-mechanism of soil arching effect of friction-type geotechnical materials. Rock Soil Mech. 2013, 34, 1791–1798. [Google Scholar]
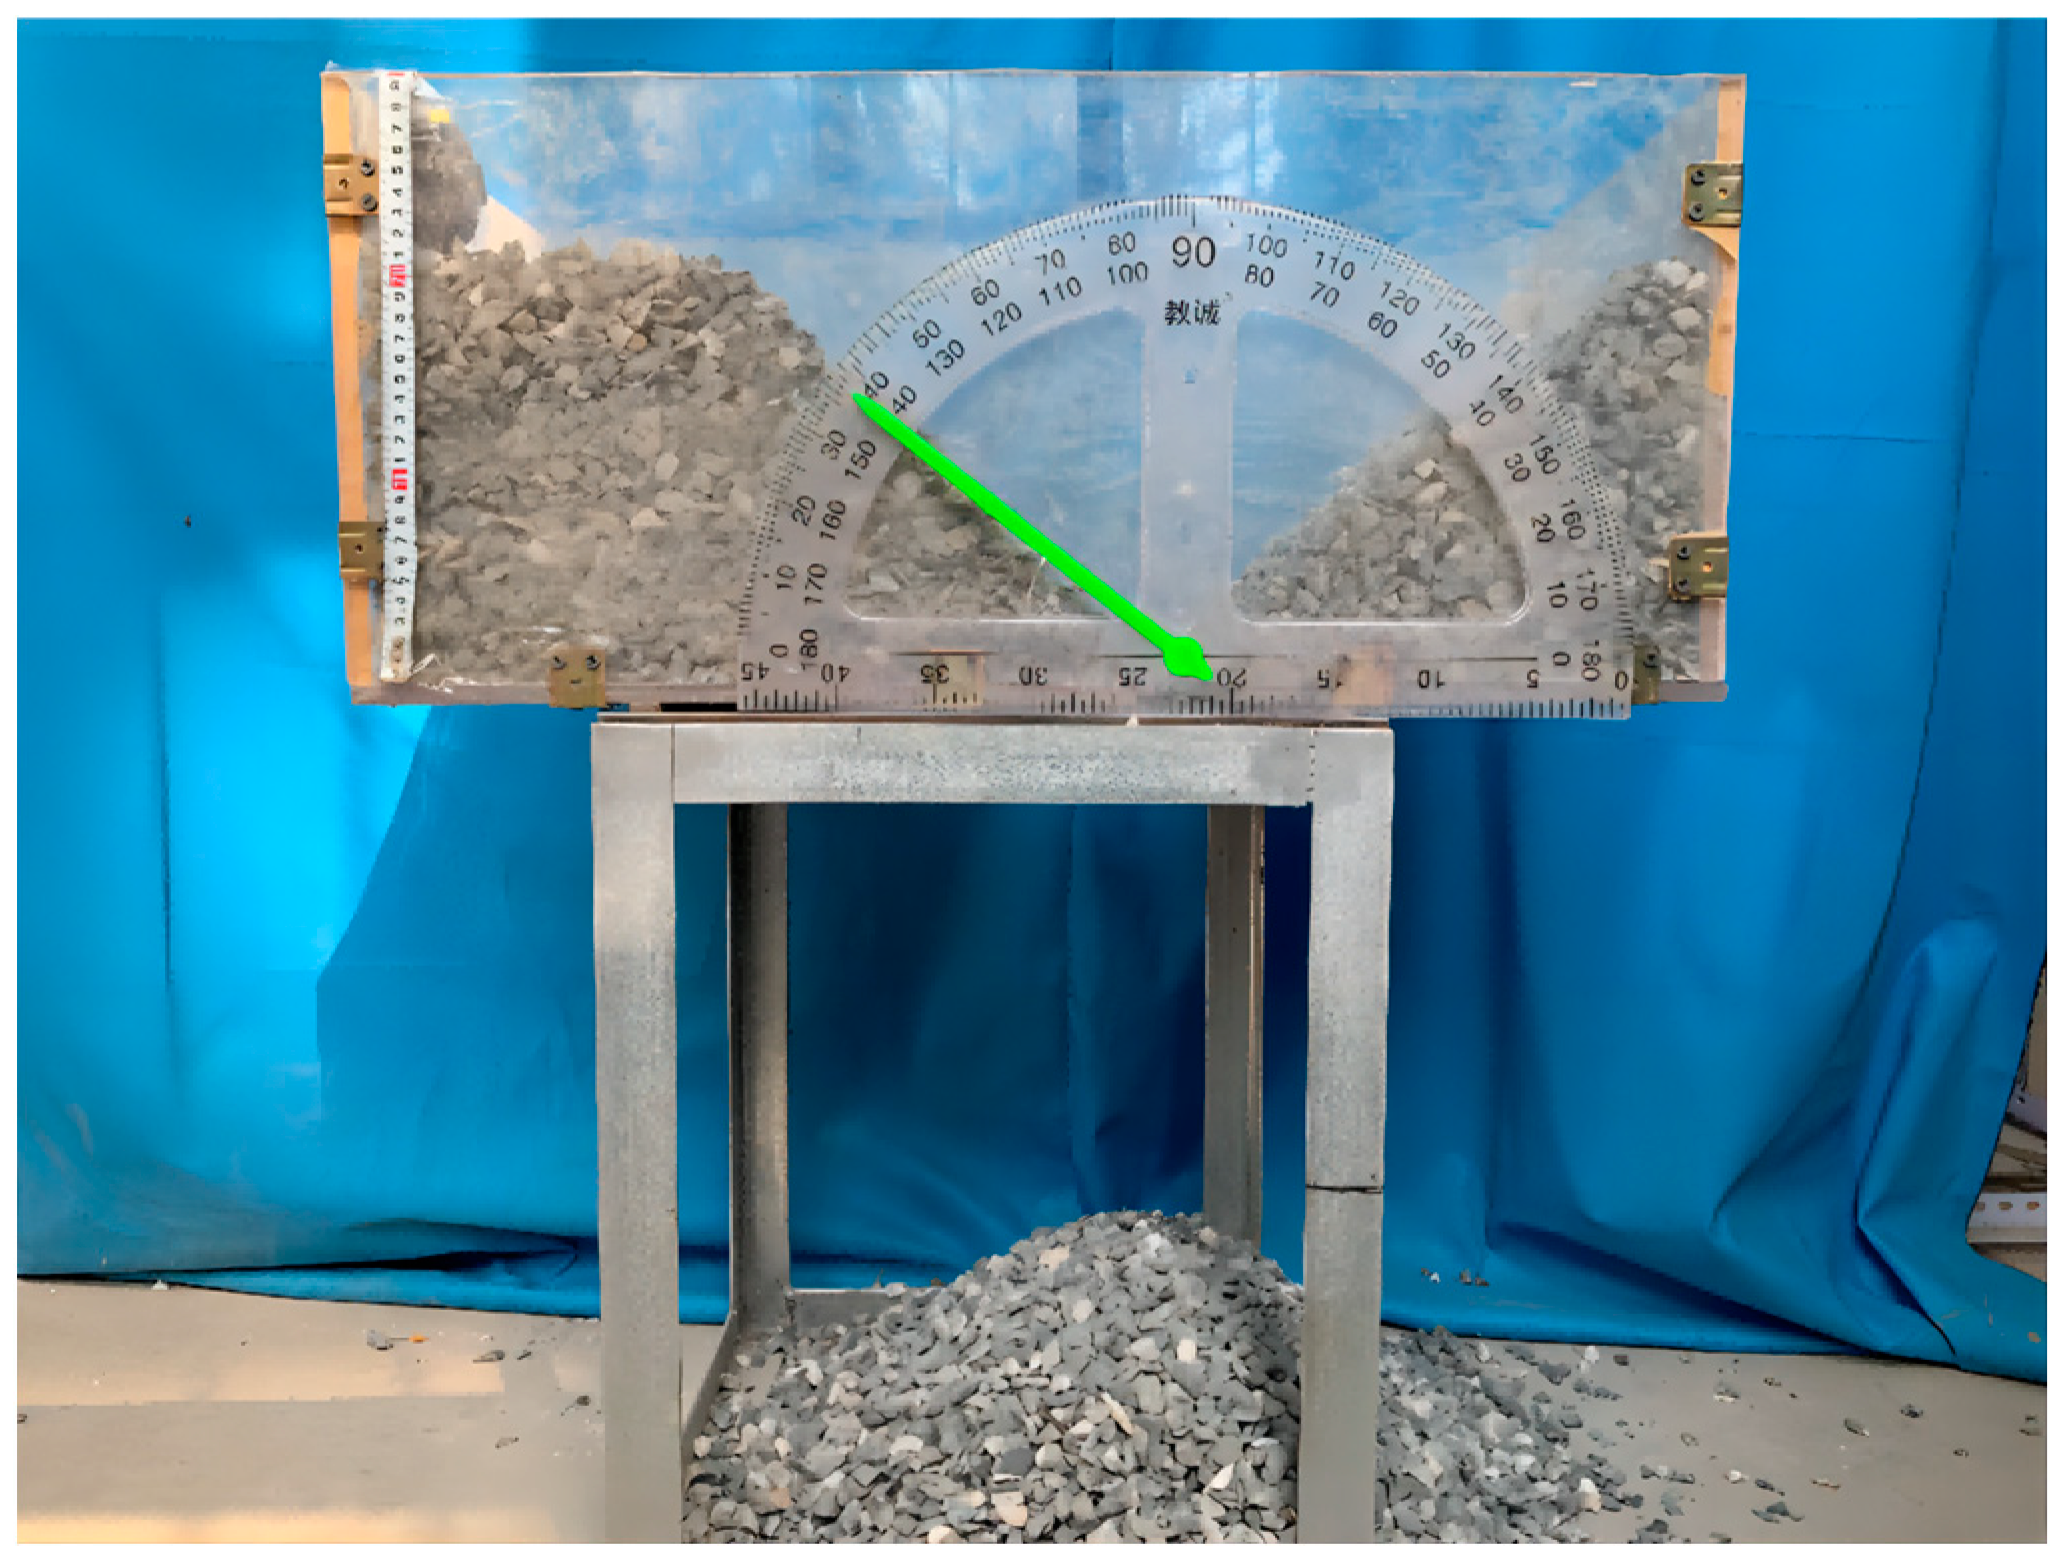
Figure 1. Slump test device for measuring the natural repose angle of the stone bulk. The green arrow in the figure is the pointer of the protractor.
Applsci 14 03457 g001
Figure 2. Physical similarity model.
Applsci 14 03457 g002
Figure 3. Discrete element collapsed measurement model with the particle size in a range of 0.1 m~0.6 m.
Applsci 14 03457 g003
Figure 4. Ore-drawing model of ore pass and measurement circle layout.
Applsci 14 03457 g004
Figure 5. Comparison of lateral pressures on ore-pass wall obtained by numerical simulation, physical test and Janssen theoretical calculation. The green dashed line shows the maximum height of the ore-rock stored in the ore pass and that in 2D and 3D experiments.
Applsci 14 03457 g005
Figure 6. Macroscopic ore-rock flow characteristics at different ore-drawing times. (a) Before ore drawing begin; (b) Ore drawing for 5 times; (c) Ore drawing for 10 times; (d) Ore drawing for 15 times and (e) Ore drawing for 20 times.
Applsci 14 03457 g006
Figure 7. Distribution pattern of coordination numbers inside the ore-rock bulk under different ore-drawing times.
Applsci 14 03457 g007
Figure 8. Stress distribution characteristics of ore-rock bulk at different ore-drawing times. The compressive stress obtained in the PFC numerical simulation is negative, and the tensile stress is positive [28]. The greater the compressive stress, the brighter the blue and purple color, indicating that the ore-pass wall is more obviously squeezed by the ore-rock particles. Tensile stress in this figure may be caused by the “arch forming-arch collapsing” phenomenon inside the stored materials when the particles move downward during ore drawing. (a) Before ore drawing begin; (b) Ore drawing for 5 times; (c) Ore drawing for 10 times; (d) Ore drawing for 15 times and (e) Ore drawing for 20 times.
Applsci 14 03457 g008
Figure 9. Probability distribution of contact force for the bulk system at different ore-drawing times.
Applsci 14 03457 g009
Figure 10. Distribution of force chain contact morphology in ore-rock particles at different ore-drawing times. The red dotted lines in (be) show where the arch might be formed under the action of the strong force chains. (a) Before ore drawing begin; (b) Ore drawing for 5 times; (c) Ore drawing for 10 times; (d) Ore drawing for 15 times and (e) Ore drawing for 20 times.
Applsci 14 03457 g010
Figure 11. Characteristics of the dynamic lateral pressure change at each measuring point of the shaft wall.
Applsci 14 03457 g011
Table 1. Particle size distribution and mass proportion of ore-rock bulks.
Particle size/mm5~1010~1515~2020~2525~30
Quality Percentage/%1525302010
Table 2. Mesoscopic parameters of the numerical model.
TypesNormal Stiffness/(N/m)Tangential Stiffness/(N/m)Ore-Rock Bulk Density/(kg/m3)Friction CoefficientAnti-Rotation Friction CoefficientParticle Size/mNumber of Particles/N
Ore particles3.33 × 1093.33 × 10920500.70.70.1~0.613,468
Wall3.33 × 1093.33 × 1090.65
Table 3. Fitting function for the probability distribution of the internal contact force of the bulk at the partial different ore-drawing times.
Ore-Drawing Times/TimeFitting Functional EquationFitting Coefficient R2
0 y = 0.37387 × e x 1.13352 0.00329 0.996
5 y = 0.40365 × e x 0.85799 0.00615 0.988
10 y = 0.41238 × e x 0.80218 0.00789 0.987
15 y = 0.42004 × e x 0.79039 0.00720 0.995
20 y = 0.48422 × e x 0.49188 0.01676 0.971
Table 4. Overpressure data of each measurement point under different ore-drawing times.
RegionMeasurement Point NumberNumber of Overpressure/TimeMaximum Overpressure Factor
Lower part of the storage section1156.4
200
331.42
411.07
Upper part of the storage section511.16
611.21
711.06
800
900
Disclaimer/Publisher’s Note: The statements, opinions and data contained in all publications are solely those of the individual author(s) and contributor(s) and not of MDPI and/or the editor(s). MDPI and/or the editor(s) disclaim responsibility for any injury to people or property resulting from any ideas, methods, instructions or products referred to in the content.