Abstract
The market economy means that only those companies that are characterised by the generation of positive economic results and liquidity can function, survive and thrive. Due to the importance of the coal industry in economic and social terms—due to the number of people employed in the coal industry—it is necessary to constantly search for methods to improve management and business efficiency. This paper proposes the use of artificial neural networks to group mines into sets of similar mines. These sets can be used to make different business decisions for these companies. These sites can be easily compared with each other, in search of the areas that need to be restructured. In addition, developing pro-efficiency strategies for designated groups of similar mines is simpler than for each mine individually. This reduces the number of such studies in real terms and allows effective business measures to be applied more quickly.
1. Introduction
The free market economy and strong competition between enterprises necessitates that managers constantly seek and modify methods to effectively manage their companies. Continuous market, technical-technological and assortment changes make it necessary to solve organisational and structural problems in the management process that did not exist before. The rapid development of the economy and new technologies means that what was good and effective yesterday is no longer good today. The competitive macro-environment requires constant analysis and correction of the applied methods and management techniques, so that the enterprise can survive and continuously develop. At the same time, a prerequisite for the existence of enterprises is their economic separation from the economic environment, expressed, among other things, through the profitability of their activities.
The management of a large number of diversified enterprises operating within one industry calls for solutions that simplify and accelerate the development of effective business strategies and decision making based on them. Poland’s mining companies are generally concentrated in two large enterprises—Jastrzębska Spółka Węglowa S.A. and Polska Grupa Górnicza—which together employ over 50,000 people. The management of both companies is constantly faced with the challenge of developing business strategies that take into account the diversity of individual mining operations. This is a difficult, labour-intensive and time-consuming task, but an essential one. In this situation, it becomes necessary to search for methods to optimise these activities. This is all the more important, because the hard coal mining industry in Poland has been undergoing restructuring and rehabilitation measures for many years.
Therefore, it is advisable to search for and identify methods, techniques and means by which managers can achieve better results in the course of managing mining enterprises and preparing changes, and to define corrective and adaptive programmes and activities.
The direction proposed in this article is the division of the described set into similar groups, which enables the development and selection of business action strategies for separated subsets of mining enterprises, significantly reducing their number and development time. In addition, in the designated groups of mining enterprises, it provides the possibility of making comparisons amongst themselves, which creates additional possibilities for diagnosing, for example, areas of excess employment or generation that result in unjustified costs.
Dividing a large group into smaller similar groups can be compared, for example, to dividing a large group of students into groups of people with similar levels of English proficiency. Such divisions make it possible to develop and apply appropriate programmes of study for a large number of individuals that are targeted to a few groups covering those individuals, thus increasing efficiency and development time.
It is also important to be able to use the groupings to apply benchmarking within the grouped companies.
The method proposed in this article for grouping similar mining enterprises into sets allows faster diagnosis of areas requiring changes in the sphere of resource management of these enterprises, as well as using methods, by means of comparative actions between the groups and the development of different paths, to optimise business decisions for different groups of mines. The designated groups can provide valuable material for further in-depth analysis and forecasts.
Self-Organizing Map (SOM) artificial neural networks were used to group similar mining enterprises into sets. SOM networks do not require supervision at the learning stage. During learning, these networks detect the significant features of links between signals by themselves. The basis of self-organisation is the observation that global ordering of the network is made possible by self-organising activities carried out locally at different points in the network, independently of each other. As a result of the input signals supplied, neurons are activated to varying degrees, adapting through changes in their synaptic weight values to the activity of the learning patterns. In the learning process, there is a tendency for the values of the weights to increase: larger stimulus signals, larger values of the weights, greater neuronal activity. In doing so, there is differentiation among groups of neurons. Certain neurons (or groups of neurons) specialise in activating to specific patterns, outperforming others in their activity [1]. Self-Organizing Map is a type of neural network often used in clustering issues. Unlike the other frequently used types of networks, they use teacherless learning algorithms. This means that during training, no knowledge of the target result is needed; little needs to be known about the characteristics of the input data. In addition to clustering tasks, SOM networks can be used to detect problem-specific features—hence, another name that often appears—SOFM (Self Origination Feature Map).
2. Methods of Grouping Objects into Sets of Similar Objects
Clustering is one of the most popular exploratory data analysis techniques. It involves dividing a dataset into subsets such that data points in the same subset (cluster) are similar to each other, while data points in different clusters are different. Different measures of similarity can be used, such as Euclidean distance or the strength of correlational relationships.
Mining companies in Poland are an interesting testing ground. They are multi-site-multi-branch companies, with different levels of profitability, employment and operating conditions, making it impossible to develop and apply the same business strategy for all sites. Therefore, it seems purposeful to search for methods to group mines into typologically similar sets for comparison purposes, and to develop analogous business models for typologically similar groups. Comparisons made within the groups also become a source of information on the need for changes in certain areas of management, or to replicate good practices that work in other similar facilities.
The method of stochastic taxonomy, which has a long tradition in the issue under consideration, can be used to group mining companies into statistically similar sets. The first time the term ‘taxonomy’ was used to refer to the classification of objects can be found in De Candolle [2]. Over the years that followed, the method was developed and applied to the classification of various research objects [2,3,4,5,6,7,8].
The method groups objects (e.g., mining companies) into sets characterised by a high degree of similarity and heterogeneity with respect to other sets.
Based on taxonomic measures, the studied objects are classified into so-called typologically similar groups. By dividing objects into typologically similar groups, sets of objects are obtained that are homogeneous with respect to the set criteria.
The designated statistically homogeneous sets concentrate objects characterised by similar qualitative features, and provide a basis for comparative analysis for any objects outside the sets as well as within the sets.
Typological division of objects into statistically homogeneous sets is made on the basis of parameters, features that are relevant to the purpose of the study.
In recent years. other approaches have also been developed, including those using artificial intelligence methods such as cluster analysis methods, e.g., clustering with the EM algorithm or the k-means method, as well as neural networks [9,10,11,12,13,14,15].
The cluster analysis algorithm using the EM (expectation value maximization) method can be used to solve diverse research problems. It is useful wherever one seeks to group objects on the basis of similarity of variance [16]. The term “cluster analysis” was introduced almost a century ago by R. Tryon [17], and later developed by R. Cattell [18]. The use of cluster methods has increased significantly over the past 30 years [16]. Cluster analysis has been applied in various fields, including economics and sociology [19].
The k-means algorithm is an iterative algorithm that divides a dataset into K predefined distinct clusters, with each data point belonging to only one cluster. As a result of the calculation, the data points inside the clusters are as similar as possible, with maximum cluster diversity. Data points to a cluster are assigned in such a way that the sum of the squares of the distances between the data points and the cluster centroid (the arithmetic mean of all data points belonging to that cluster) is minimised. The lower the variability within clusters, the more homogeneous (similar) the data points in the same cluster. The k-means algorithm is very popular and used in various applications such as market segmentation, document clustering, image segmentation and compression, etc. [20].
The use of neural networks for clustering datasets generally means using Kohonen networks. These are self-organising learning networks of the competitive-with-competition type. This is different from an unsupervised learning organising algorithm. These networks are applied to a multidimensional data space, and allow one to obtain a two-dimensional structure that preserves the topology of the input set [21]. This network consists of neurons located in two layers—input and output. Each neuron of the input layer is coupled to all the neurons of the output layer. Learning the network involves iteratively modifying the weights of the output layer neurons so that they reflect the input variables as closely as possible. The weights that the output neurons obtain form centroids. Thus, groups are formed by elements at the shortest distance from a given centroid, and cluster around it.
Kohonen networks have many applications across fields—pattern recognition, medical applications, telecommunications, robotics, product management, data mining and processing or macroeconomic analysis of regions and countries [22,23,24].
However, in analysing the available literature, we did not find research results on grouping mining companies into typologically similar sets using the described methods, which prompted us to undertake research in this area.
The purpose of these divisions is to use them in management practice to optimise activities and programs to increase the efficiency of individual homogeneous groups of mining enterprises.
3. The Research Method Used
In the conducted research, artificial neural networks were used to divide the considered set of mining companies into similar subsets. Self-organising networks (called Kohonen networks after their creator [22]) were used. They are distinct from the neural networks most commonly used in various studies. While most networks are learnt in the “with teacher” mode, the Kohonen network is taught “without a teacher”. In ‘with-teacher’ learning, the learning data contain instances describing both input and output variables, whereas in ‘without-teacher’ learning, only instances involving input variables alone occur. This means that the Kohonen network attempts to learn the structure of the data. Consequently, one possible application of this type of network is exploratory data analysis. A Kohonen network can learn to recognise clusters present in the input data and simultaneously associate similar classes of data together. Thanks to the projection made by the Kohonen network, a better understanding of the data can be gained, which in turn makes it possible to improve the process of further analysis and use of the data—either with the same neural network or with other tools. A Kohonen network makes it possible to carry out classification according to the internal logic of the data itself, rather than based on some arbitrary criteria adopted.
The networks in question have only two layers: an input layer and an output layer. The neurons in the output layer, which form the topological map, are considered as if they were distributed in space according to some fixed pattern—usually in the form of a two-dimensional square mesh [25].
Artificial neural networks use a simplified neuron model, which assumes that a weighted sum of input signals is calculated; when it exceeds a threshold level, the signal is fed to the output. The activation function f can be of various forms, such as linear, logistic, hyperbolic tangent, as well as others such as exponential and sine, among others.
As noted earlier, SOM networks do not require a target score to be specified. Instead, where the neuron weights are not very different from the input vector (learning data), this area of the network (neuron weights) is modified to be even closer to the class of which the input vector is a member [26]. The idea of SOM networks was proposed by Kohonen, who provided the following algorithm for learning the network [27,28]:
- The weights of the neurons are initialised (random numbers of small value).
- A vector X containing the learning data is randomly selected from the learning dataset and fed into the input of the network.
- For each neuron, the Euclidean distance d of its weights W from the drawn vector is calculated. The neuron whose weights are closest is referred to as the Best Matching Unit (BMU). The distance d is determined from the following relation (Equation (1)):where n—length of the vector of learning data, k—neuron number and N—number of neurons.
- In the next step, the BMU neighbourhood radius r is calculated. This is a value that decreases with each iteration. It is calculated from the following (Equation (2)):where it—iteration number, —initial neighbourhood radius and λ—constant characterising the decrease in radius as a function of iterations.
- The weights of all neurons within the neighbourhood radius (including the BMU— < r) are modified to be more similar to the input vector. The closer a neuron is to the BMU, the more its weights are modified, according to the following relation (Equation (3)):
- The learning factor L is modified according to the following relation (Equation (4)):where it—the number of iterations, —the initial learning factor and μ—a constant characterising the decrease in the learning factor as a function of the number of iterations.
- There is a return to step 2 until the set number of iterations is reached.
After a sufficiently large number of iterations, the algorithm makes it possible to obtain a map of stable zones. Ultimately, interpreting the results obtained can make it possible to find invisible patterns in the data.
The essence of neural networks is that we have no information about how the division was carried out. This is also the method’s strength—it does not use arbitrary division criteria, but finds them on its own.
Once the Kohonen network has been taught to correctly recognise the structure of the data presented, it can be used as a tool to carry out data visualisation in order to gain a better understanding of the data. The problem arises of checking whether the network has been sufficiently trained. One way to do this is to analyse the frequency of wins (the number of wins of each neuron during the presentation of learning data). This number can be used to check whether sufficiently distinct clusters have already been formed in the Kohonen map [25].
In the studies conducted, network learning was stopped when a preset number of iterations was reached. The number of iterations was determined by performing multiple calculations. The maximum number of iterations was defined as the number beyond which the division of the considered set of cases into similar subsets no longer changed. The number of iterations was assumed to be 30,000 for all considered cases of calculation.
4. The Data Characterising the Mines: The Adopted Structure of the SOM Network and the Results of the Calculations
For the cluster analysis used, it was necessary to select an appropriate set of diagnostic data, which are the inputs to the algorithm. In this study, selection was carried out as suggested by D. Tarka, that the input variables should have substantive properties and some of the formal properties analysed in the research [29]. Thus, with the above in mind, the following parameters of mining concentration in coal mines of year X were adopted for the cluster analysis (Table 1):

Table 1.
Mining concentration parameters in coal mines in year X.
- o
- average daily output,
- o
- length of longwall front,
- o
- output per meter,
- o
- intensity of preparatory works,
- o
- number of total active longwalls,
- o
- average longwall length.
The values given in Table 1 were used in the SOM network learning process, which was carried out using Statistica™. Networks of two, four (Figure 1), eight and sixteen neurons were considered. The number of similar sets determined was equal to the number of neurons in the SOM network.
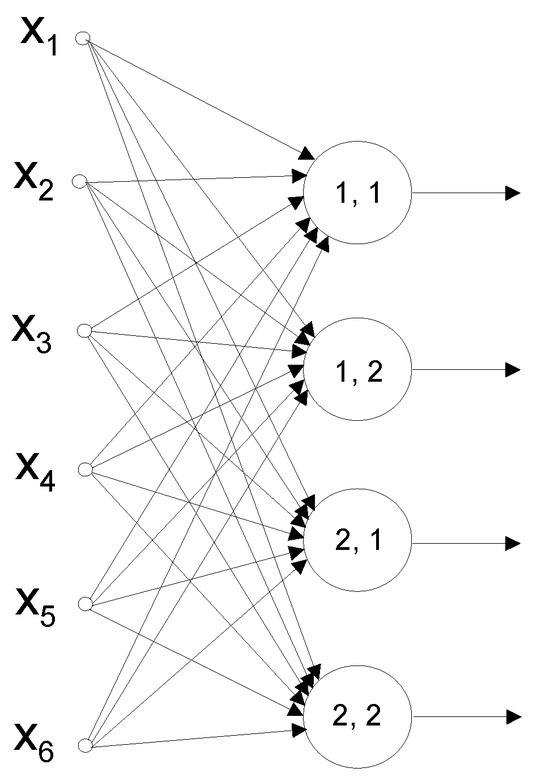
Figure 1.
SOM network with four neurons.
Determining the size of the learning set, i.e., the correct number of instances required to teach a neural network, poses significant problems in the general case. There are some heuristic rules that make the number of instances required dependent on the size of the network. One of the simplest states that the number of instances should be ten times the number of connections present in the network. In fact, the number of instances required also depends on the complexity of the functional dependency being modelled. However, this dependency generally has an unknown form, so it is difficult to come up with a truly exhaustive and accurate recipe for how many elements of a learning sequence are really indispensable. In smaller datasets, the network may not be sufficiently learned. In such a situation, simple models are preferred [25]. For such a small number of data as in the presented research, splitting the dataset into subsets of learning, test and validation data is not possible. The problem of a small number of cases is frequently encountered in research, and has therefore resulted in rich literature—e.g., [30,31]. A comprehensive review of publications on this issue can be found in ref. [32].
In the case of this research, the results of which are presented herein, this problem was solved by limiting the number of subsets into which the considered set of mining plants was divided (Table 1).
There is no universal algorithm to determine the number of similar groups, and thus the number of neurons in a Self-Organising Map network. Often, as a rule of thumb, we can assume that the SOM network should contain 5√n neurons, where n is the number of datasets in the training set. This is usually a large enough number to capture the dominant patterns in the data.
In the course of this study, the breakdowns of mines into 16, 8, 4 and 2 groups were analysed. The rejection of the division into 16 and 8 groups was due to the large number of groups with individual mines, while the grouping into only 2 sets was too general and did not allow generalisation of the information present in the dataset. By way of elimination, therefore, it was decided that grouping into 4 sets would be used for further research.
The described course of action led to the following division of the analysed coal mines in Poland into four distinct groups:
- o
- Group 1: 1 2 3 4 10 17 20 23 24 25 27 30 36
- o
- Group 2: 13 16 18 39
- o
- Group 3: 7 26 28 37
- o
- Group 4: 5 6 8 9 11 12 14 15 19 21 22 29 31 32 33 34 35 38
Group 4 is the largest group, with 18 mines, followed by Group 1 with 13 mines. The other two concentrate 4 mines each (Figure 2).
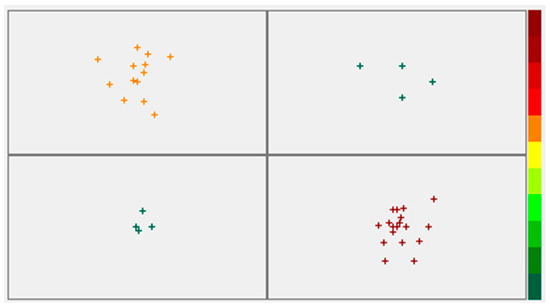
Figure 2.
Division of mines into similar sets (the colour scheme on the right is a scale of the distance of the cases from the winning neuron).
Table 2, Table 3, Table 4 and Table 5 below present the resulting division into 4 groups of similar mines in Poland.
Table 2.
Group 1 of mines.
Table 3.
Group 2 of mines.
Table 4.
Group 3 of mines.
Table 5.
Group 4 of mines.
Further efforts to increase the effects of operations should be carried out for the designated four groups.
The validity of this division is evidenced by the determined median unit cost of production for each of the diagnosed sets. The unit cost of production has a major impact on the profitability of mines. The amount of revenue is determined by the selling price of coal, over which mines have no influence, while the lowest possible production unit cost can be shaped by optimising production. Mines with the lowest cost are the leaders in production efficiency. The data in Table 6 were used to calculate the median cost, and the results of the calculations are summarised in Table 7 and Figure 3. Two of the four sets of mines group mines for which the median unit cost of production ranks below the median unit cost for all mines, while the next two sets are above the median. The result of this division can be used for further in-depth analysis and pro-efficiency measures.
Table 6.
Unit costs of production.
Table 7.
Median unit costs of production per crop.
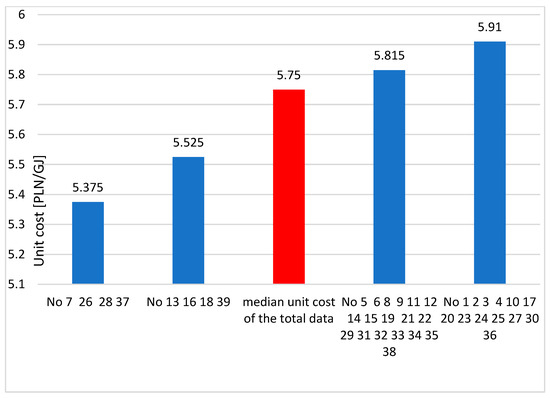
Figure 3.
Median unit costs of production in designated groups of similar mines.
Mines in which the median unit cost is high in the presented analysis should first be subjected to optimisation measures based on analyses of, for example, financial, physical and human resources, in order to take pro-efficiency measures or search for areas generating these higher costs in relation to the other analysed mines, and eliminate them.
The information obtained for the areas analysed can provide the background for further analysis and forecasting of potential changes. The use of computer-based computing techniques greatly facilitates and speeds up the computational process presented, but it should be remembered that this process is not just about calculations. The qualitative aspect of the analysis is extremely important, during which the diagnosticians’ knowledge, experience and ability to infer and synthesise the data become paramount.
The results obtained from the application of the SOM network were compared with the results from grouping the considered group of mines using the k-means method. Using the k-means method, the set of mines was assumed to be divided into 4 subsets, and the Statistica package was used for the calculations. The Euclidean distance, determined after normalising to 1 the data from Table 1, was used as the distance measure. Initial cluster centres were determined in such a way that they constituted cases set so that the distances between centres reached maximum values. A detailed description of the procedure for determining the initial cluster centres can be found in ref. [25]. The aim of the centre selection procedure used is to maximise the initial distances between clusters.
As a result of the calculations, a division of the mines into similar groups was obtained, which is shown in Table 8. In order to facilitate the comparison of the results, the division obtained with the artificial neural network is also given in this table.
Table 8.
Results of division into 4 groups of similar mines.
In Table 8, mines that were classified into the same group by both methods are shown in bold. Such concordance occurred for 29 of the 39 mines considered, i.e., in almost 75% of the cases. In both methods, it is necessary to determine the number of groups into which the entire input population is divided. Often, this number results from the specifics of the problem (e.g., successful diagnosis, unsuccessful diagnosis, credit granted, not granted—the population is divided into two subsets); however, in some cases, it has to be adopted arbitrarily.
It should be noted, however, that in the case of the k-means method, assumptions had to be made regarding the type of distance measure used and how the initial cluster centres were determined. These arbitrary assumptions have an impact on the cluster analysis results obtained. The use of SOM networks does not interfere so directly with the results obtained. Hence, it is reasonable to use SOM networks in the clustering method proposed in this paper.
5. Summary and Conclusions
The presented method developed to group similar mines into sets using artificial neural networks (i.e., SOM) to optimise business decisions has a real, practical application. The advantage of using SOM in the presented method is that the user does not have to specify a set of indicators relevant to the assumed purpose of grouping objects or binding relations between them. The division into similar groups is made on the basis of criteria found by the artificial neural network itself at the learning stage. This means that it is not possible to provide the criteria that the network used to divide the mining sites into similar groups. On the other hand, it means that it is possible to apply criteria that we are not able to formulate; relatively speaking, they are not known. Such an approach has been successfully used in business decisions concerning the granting of credit, stock market operations, medical diagnoses using the results of diagnostic tests, control of power grids and many other applications. Considering other methods of artificial intelligence, only the use of expert systems provides information on how a system’s response is determined.
The clustering effect is achieved by the fact that the network, in the process of self-organisation, tries to separate the input data by distinguishing certain classes of similarity among them. This works in such a way that among the input objects (described by the input signals), groups of them are detected (quite automatically) in which signals similar to each other can be placed, which, at the same time, are clearly different from the signals assigned to other groups. Such clustering of data is very useful in many applications, and a number of specialised mathematical techniques have been developed to analyse the data (usually statistically), and to create just such groups of data. The aforementioned techniques, called cluster analysis, have found use, among others, in economics, or in medicine—to investigate which symptoms indicate different variations of the same disease, and which already indicate the presence of a new, possibly unknown disease entity [33]. This led the authors to develop a new method of grouping similar mines into sets, in order to increase management efficiency and their transformation. For example, decisions to merge mines into larger organisations were generally made on the basis of a single criterion—geographical proximity—without considering other factors. It seems reasonable to use the proposed method in this area as well.
At the same time, it should be emphasised that the groupings were established on the basis of relevant business indicators. The unit cost of production is the basic indicator in determining a mine’s profitability. The validity of the method used and the appropriateness of the groupings can be demonstrated by the median of unit production costs in the individual groups of mining enterprises, which indicates a median cost below the average for the entire population for two groups, and an above average cost for another two.
By dividing mines into similar groups, the efficiency of business operations can be increased in real terms by developing optimal management strategies tailored to the specifics of each set of mines, rather than to each individual mine. This reduces the number of such studies in real terms and allows effective measures to be applied more quickly. The divisions obtained also indicate the groups of mines where it is advisable to apply business optimisation measures first. Mines with a unit cost of production higher than the median cost of all analysed mines should be subjected to pro-efficiency measures first. In addition, mines from groups with a unit cost of production below the median set for the entire group of mines can become a benchmark for the others.
In a market economy, only those companies that are characterised by the generation of a positive economic result and liquidity can function, last and grow. In view of the importance of the coal industry in economic and social terms—due to the number of people employed in the coal industry—it is necessary to continuously seek methods to improve management and business efficiency.
Author Contributions
Conceptualisation, M.W. and P.B.; data curation, M.W. and P.B.; formal analysis, M.W. and P.B.; funding acquisition, M.W. and P.B.; investigation, M.W. and P.B.; methodology, M.W. and P.B.; project administration, M.W. and P.B.; resources, M.W. and P.B.; software, M.W. and P.B.; validation, M.W. and P.B.; visualisation, M.W. and P.B.; writing—review and editing, M.W. and P.B. All authors have read and agreed to the published version of the manuscript.
Funding
The presented investigation is supported by the statutory activity of the Faculty of Mining, Safety Engineering and Industrial Automation, Silesian University of Technology, Poland.
Data Availability Statement
The original contributions presented in the study are included in the article, further inquiries can be directed to the corresponding author.
Conflicts of Interest
The authors declare no conflicts of interest.
References
- Osowski, S. Sieci Neuronowe w Ujęciu Algorytmicznym; Wydawnictwa Naukowo-Techniczne: Warszawa, Poland, 1996. [Google Scholar]
- De Candolle, A. Theorie Élémentaire de la Botanique; Déterville: París, France, 1813. [Google Scholar]
- Hellwig, Z. Zastosowanie metody taksonomicznej do typologicznego podziału krajów ze względu na poziom ich rozwoju oraz zasoby i strukturę wykwalifikowanych kadr. Prz. Stat. 1968, 4, 307–326. [Google Scholar]
- Kaufmann, A.; Faure, R. Badania Operacyjne na co Dzień; PWN: Warsaw, Poland, 1968. [Google Scholar]
- Lance, G.N.; Williams, W.T. A General Theory of Classificatory Sorting Strategies, 1. Hierarchical Systems. Comput. J. 1967, 9, 373–380. [Google Scholar] [CrossRef]
- Valdecasas, A.G.; Pelaéz, M.L.; Wheeler, Q.D.; de Carvalho, M.R. Evidence-Based Taxonomy: Labels as Illocutionary Acts. Taxonomy 2022, 2, 339–346. [Google Scholar] [CrossRef]
- De Carvalho, M.R.; Ebach, M.C.; Williams, D.M.; Nihei, S.S. Trefaut Rodrigues, The taxonomic impediment: A shortage of taxonomists, not the lack of technical approaches. Zool. J. Linn. Soc. 2021, 193, 381–387. [Google Scholar]
- De Carvalho, M.R.; Ebach, M.C.; Williams, D.M.; Nihei, S.S.; Rodrigues, M.T.; Grant, T.; Silveira, L.F.; Zaher, H.; Gill, A.C.; Schelly, R.C.; et al. Does counting species count as taxonomy? On misrepresenting systematics, yet again. Cladistics 2014, 30, 322–329. [Google Scholar] [CrossRef]
- Bello, E.; Becerra, J.M.; Valdecasas, A.G. Counting on taxonomy. Nature 1992, 357, 531. [Google Scholar] [CrossRef]
- Figueroa-Zúñiga, J.; Toledo, J.G.; Lagos-Alvarez, B.; Leiva, V.; Navarrete, J.P. Inference Based on the Stochastic Expectation Maximization Algorithm in a Kumaraswamy Model with an Application to COVID-19 Cases in Chile. Mathematics 2023, 11, 2894. [Google Scholar] [CrossRef]
- Zakkour, A.; Perret, C.; Slaoui, Y. Stochastic Expectation Maximization Algorithm for Linear Mixed-Effects Model with Interactions in the Presence of Incomplete Data. Entropy 2023, 25, 473. [Google Scholar] [CrossRef]
- Meng, X.L.; van Dyk, D. The EM algorithm—An old folk-song sung to a fast new tune. J. R. Stat. Soc. 1997, 59, 511–567. [Google Scholar] [CrossRef]
- Ng, S.K.; Krishnan, T.; McLachlan, G.J. The EM Algorithm. In Handbook of Computational Statistics; Springer: Berlin/Heidelberg, Germany, 2011; pp. 139–172. ISBN 978-3-642-21550-6. [Google Scholar] [CrossRef]
- Akdemir, D.; Somo, M.; Isidro-Sanchéz, J. An Expectation-Maximization Algorithm for Combining a Sample of Partially Overlapping Covariance Matrices. Axioms 2023, 12, 161. [Google Scholar] [CrossRef]
- Lartigue, T.; Durrleman, S.; Allassonnière, S. Deterministic Approximate EM Algorithm; Application to the Riemann Approximation EM and the Tempered EM. Algorithms 2022, 15, 78. [Google Scholar] [CrossRef]
- Nielsen, F.S. The stochastic EM algorithm: Estimation and asymptotic results. Bernoulli 2000, 6, 457–489. [Google Scholar] [CrossRef]
- Gore, P. Cluster Analysis. In Handbook of Applied Multivariate Statistics and Mathematical Modelling; Tinsley, H., Brown, S., Eds.; Academic Press: San Diego, CA, USA, 2000. [Google Scholar]
- Tryon, R. Cluster Analysis; McGraw-Hill: New York, NY, USA, 1939. [Google Scholar]
- Cattell, R. A note on correlation clusters and cluster search methods. Psychometrica 1944, 9, 169–184. [Google Scholar] [CrossRef]
- Han, W.-J.; Wang, J.S.-H. Changing employment and work schedule patterns over the 30 working years. Int. J. Environ. Res. Public Health 2022, 19, 13677. [Google Scholar] [CrossRef]
- Dabbura, I. K-means Clustering: Algorithm, Applications, Evaluation Methods, and Drawbacks. Available online: https://towardsdatascience.com/k-means-clustering-algorithm-applications-evaluation-methods-and-drawbacks-aa03e644b48a (accessed on 30 March 2024).
- Kohonen, T. Self-organized formation of topologically correct feature maps. Biol. Cybern. 1982, 43, 59–69. [Google Scholar] [CrossRef]
- Lasek, M.; Myzik, A. Sieci neuronowe Kohonena w przeprowadzaniu analiz danych: Próba wykorzystania w eksploracji danych dotyczących jednostek terytorialnych. Probl. Zarządz. 2012, 10, 124–147. [Google Scholar]
- Ptak-Chmielewska, A.; Chłon-Dominczak, A. Spatial Conditions Supporting Sustainable Development of Enterprises on Local Level. Sustainability 2021, 13, 2292. [Google Scholar] [CrossRef]
- StatSoft, Elektroniczny Podręcznik Statystyki PL, Krakow. 2006. Available online: http://www.statsoft.pl/textbook/stathome.html (accessed on 30 March 2024).
- Miranda, E.; Suñé, J. Memristors for Neuromorphic Circuits and Artificial Intelligence Applications. Materials 2020, 13, 938. [Google Scholar] [CrossRef]
- Amir, A. Self Organizing Map (SOM) with Practical Implementation, The Art of Data Scicne. 2019. Available online: https://medium.com/machine-learning-researcher/self-organizing-map-som-c296561e2117 (accessed on 30 March 2024).
- Nunes da Silva, I.; Hernane Spatti, D.; Andrade Flauzino, R.; Bartocci Liboni, L.H. Self-Organizing Kohonen Networks. In Artificial Neural Networks; Springer: Berlin/Heidelberg, Germany, 2017; pp. 157–172. [Google Scholar]
- Tarka, D. Własności cech diagnostycznych w badaniach typu taksonomicznego. Ekon. I Zarządz. 2010, 2, 194–203. [Google Scholar]
- Lu, S.; Segall, R.S. Multi-SOM: An Algorithm for High-Dimensional, Small Size Datasets. Syst. Cybern. Inform. 2013, 11, 41–46. [Google Scholar]
- Shanthi, S. A Novel SOM Ensemble Classification Technique for Limited Data. In Futuristic Trends for Sustainable Development and Sustainable Ecosystems; IGI Global: Hershey, PA, USA, 2022; pp. 76–88. [Google Scholar] [CrossRef]
- Kokol, P.; Kokol, M.; Zagoranski, S. Machine learning on small size samples: A synthetic knowledge synthesis. Sci. Prog. 2022, 105, 1–16. [Google Scholar] [CrossRef]
- Tadeusiewicz, R.; Gąciarz, T.; Borowik, B.; Leper, B. Odkrywanie Właściwości Sieci Neuronowych Przy Użyciu Programów w Języku C#; Wydawnictwa PAU: Krakow, Poland, 2007. [Google Scholar]
Disclaimer/Publisher’s Note: The statements, opinions and data contained in all publications are solely those of the individual author(s) and contributor(s) and not of MDPI and/or the editor(s). MDPI and/or the editor(s) disclaim responsibility for any injury to people or property resulting from any ideas, methods, instructions or products referred to in the content. |
© 2024 by the authors. Licensee MDPI, Basel, Switzerland. This article is an open access article distributed under the terms and conditions of the Creative Commons Attribution (CC BY) license (https://creativecommons.org/licenses/by/4.0/).