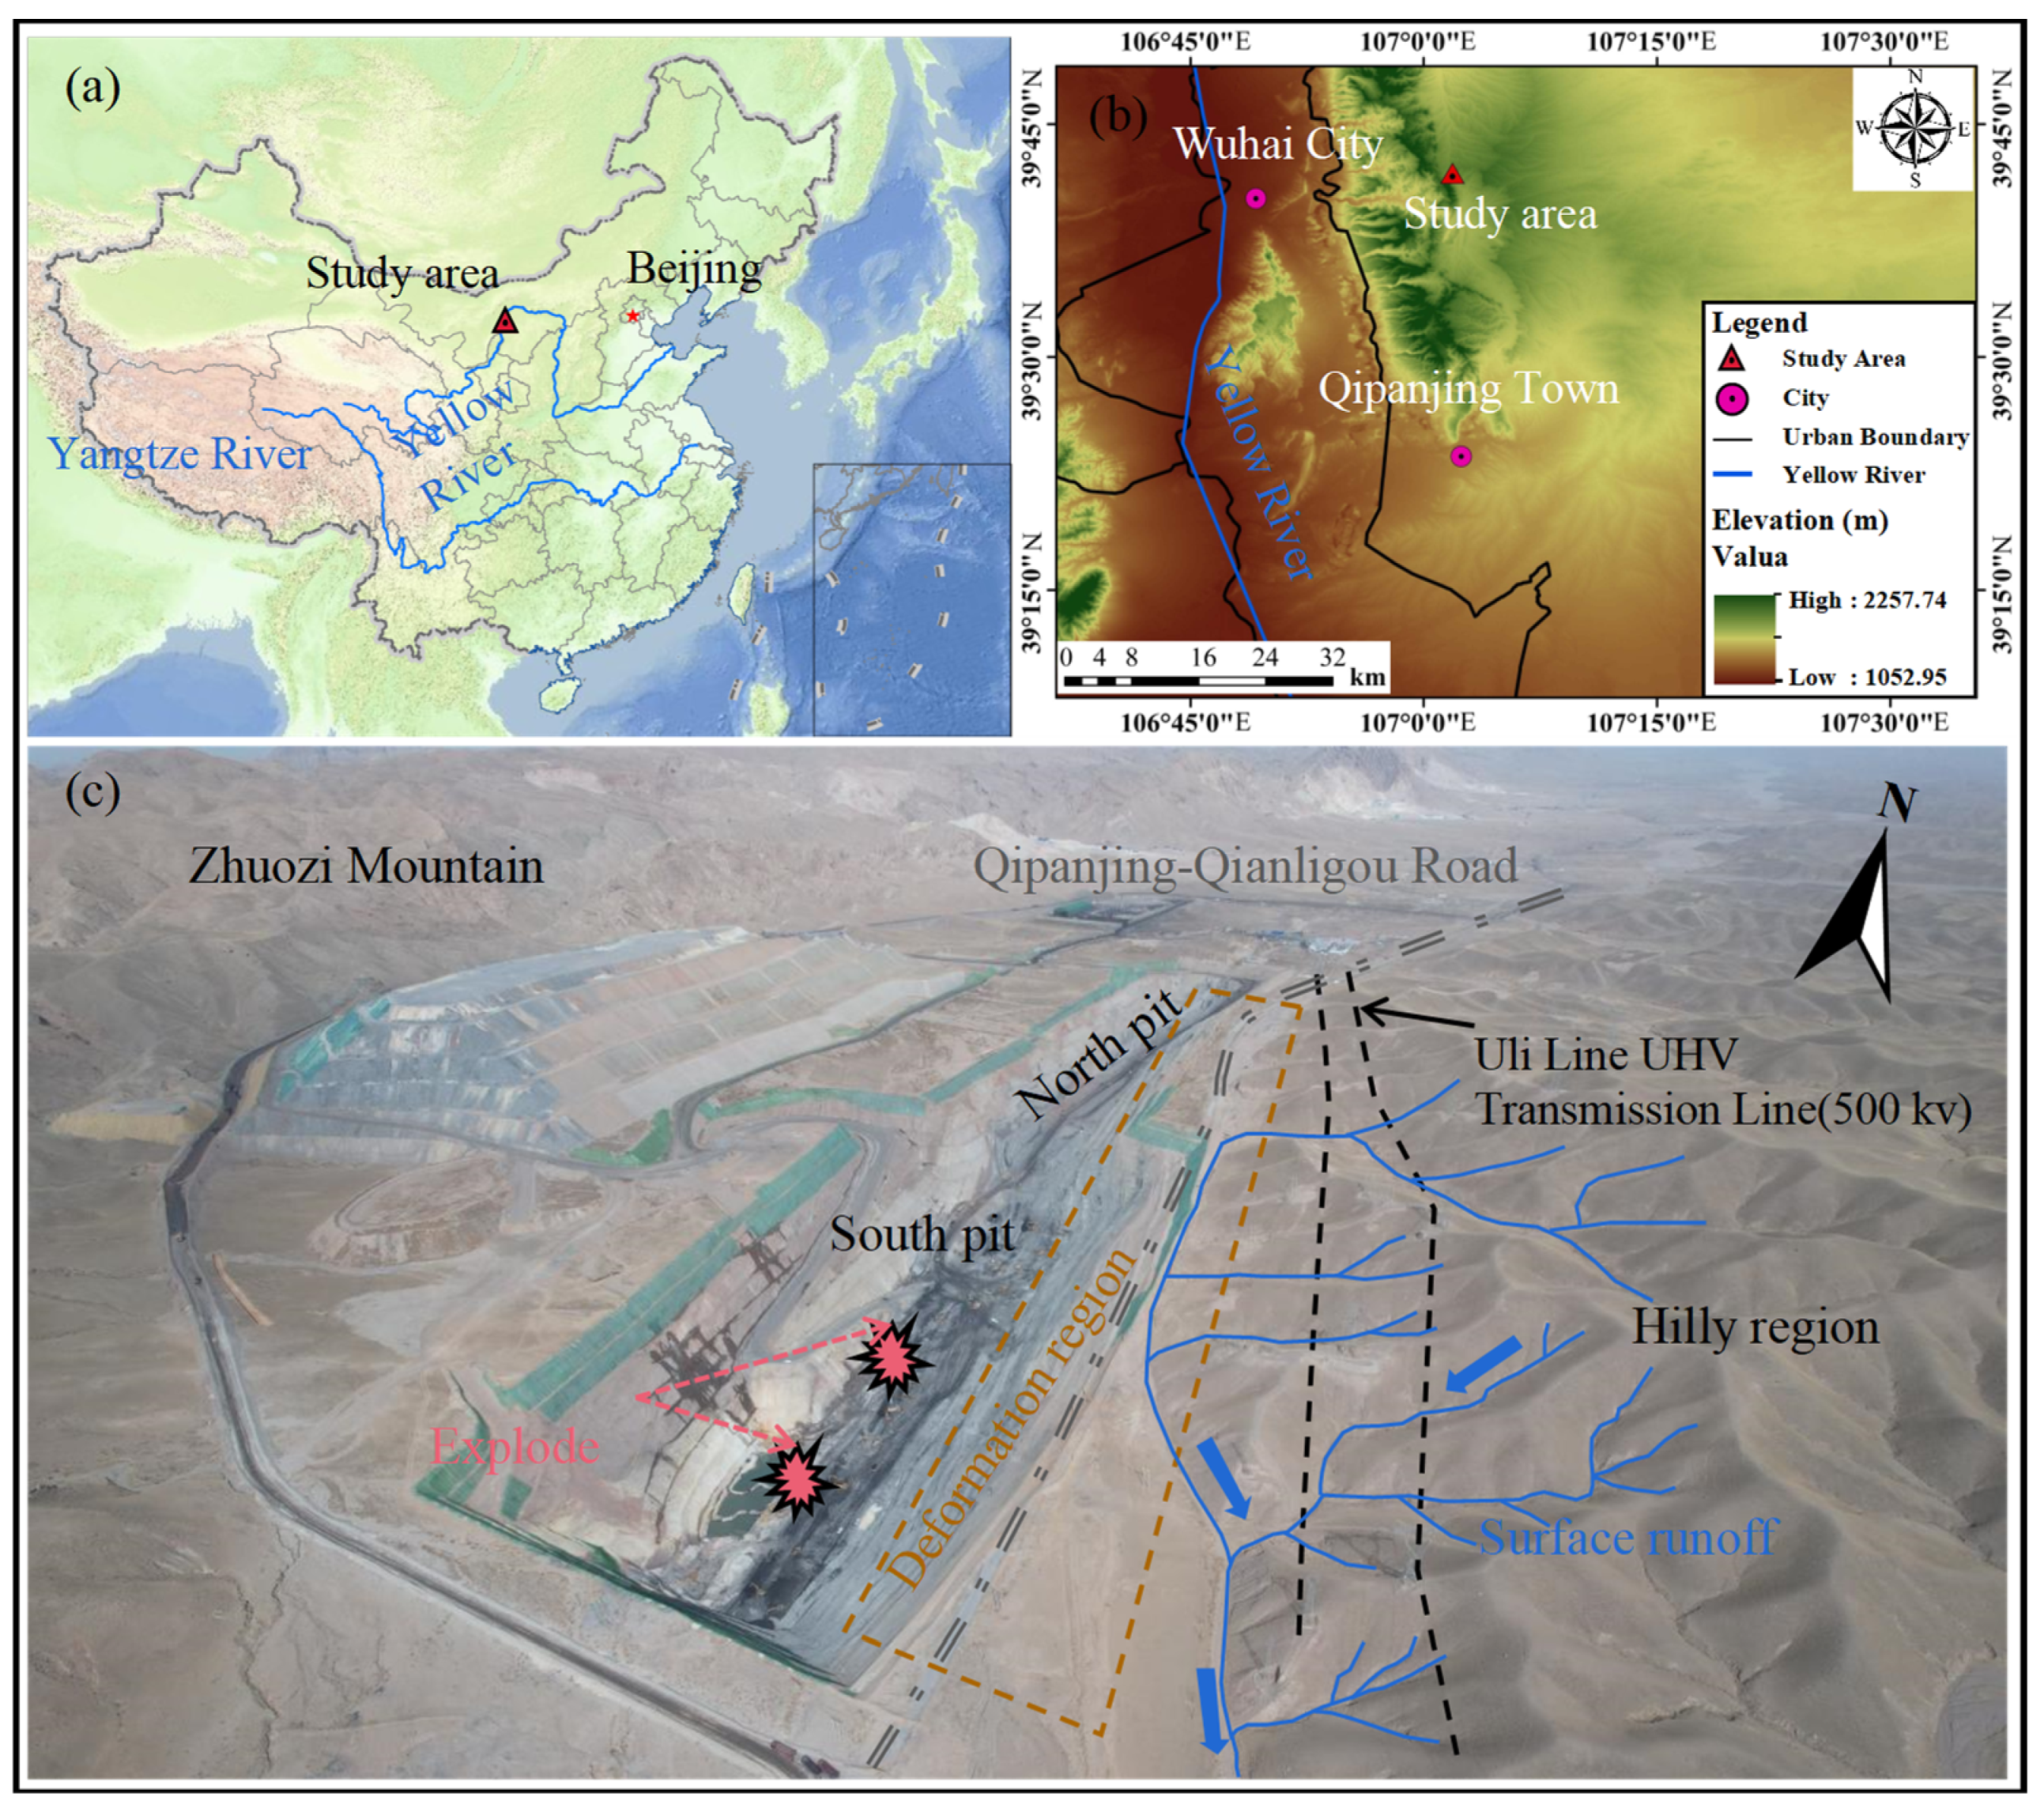
Figure 1.
Geological location of the Wolong open-pit coal mine. (a) Location of the study area; (b) Digital elevation model; (c) Panoramic view of open pit.
Figure 1.
Geological location of the Wolong open-pit coal mine. (a) Location of the study area; (b) Digital elevation model; (c) Panoramic view of open pit.
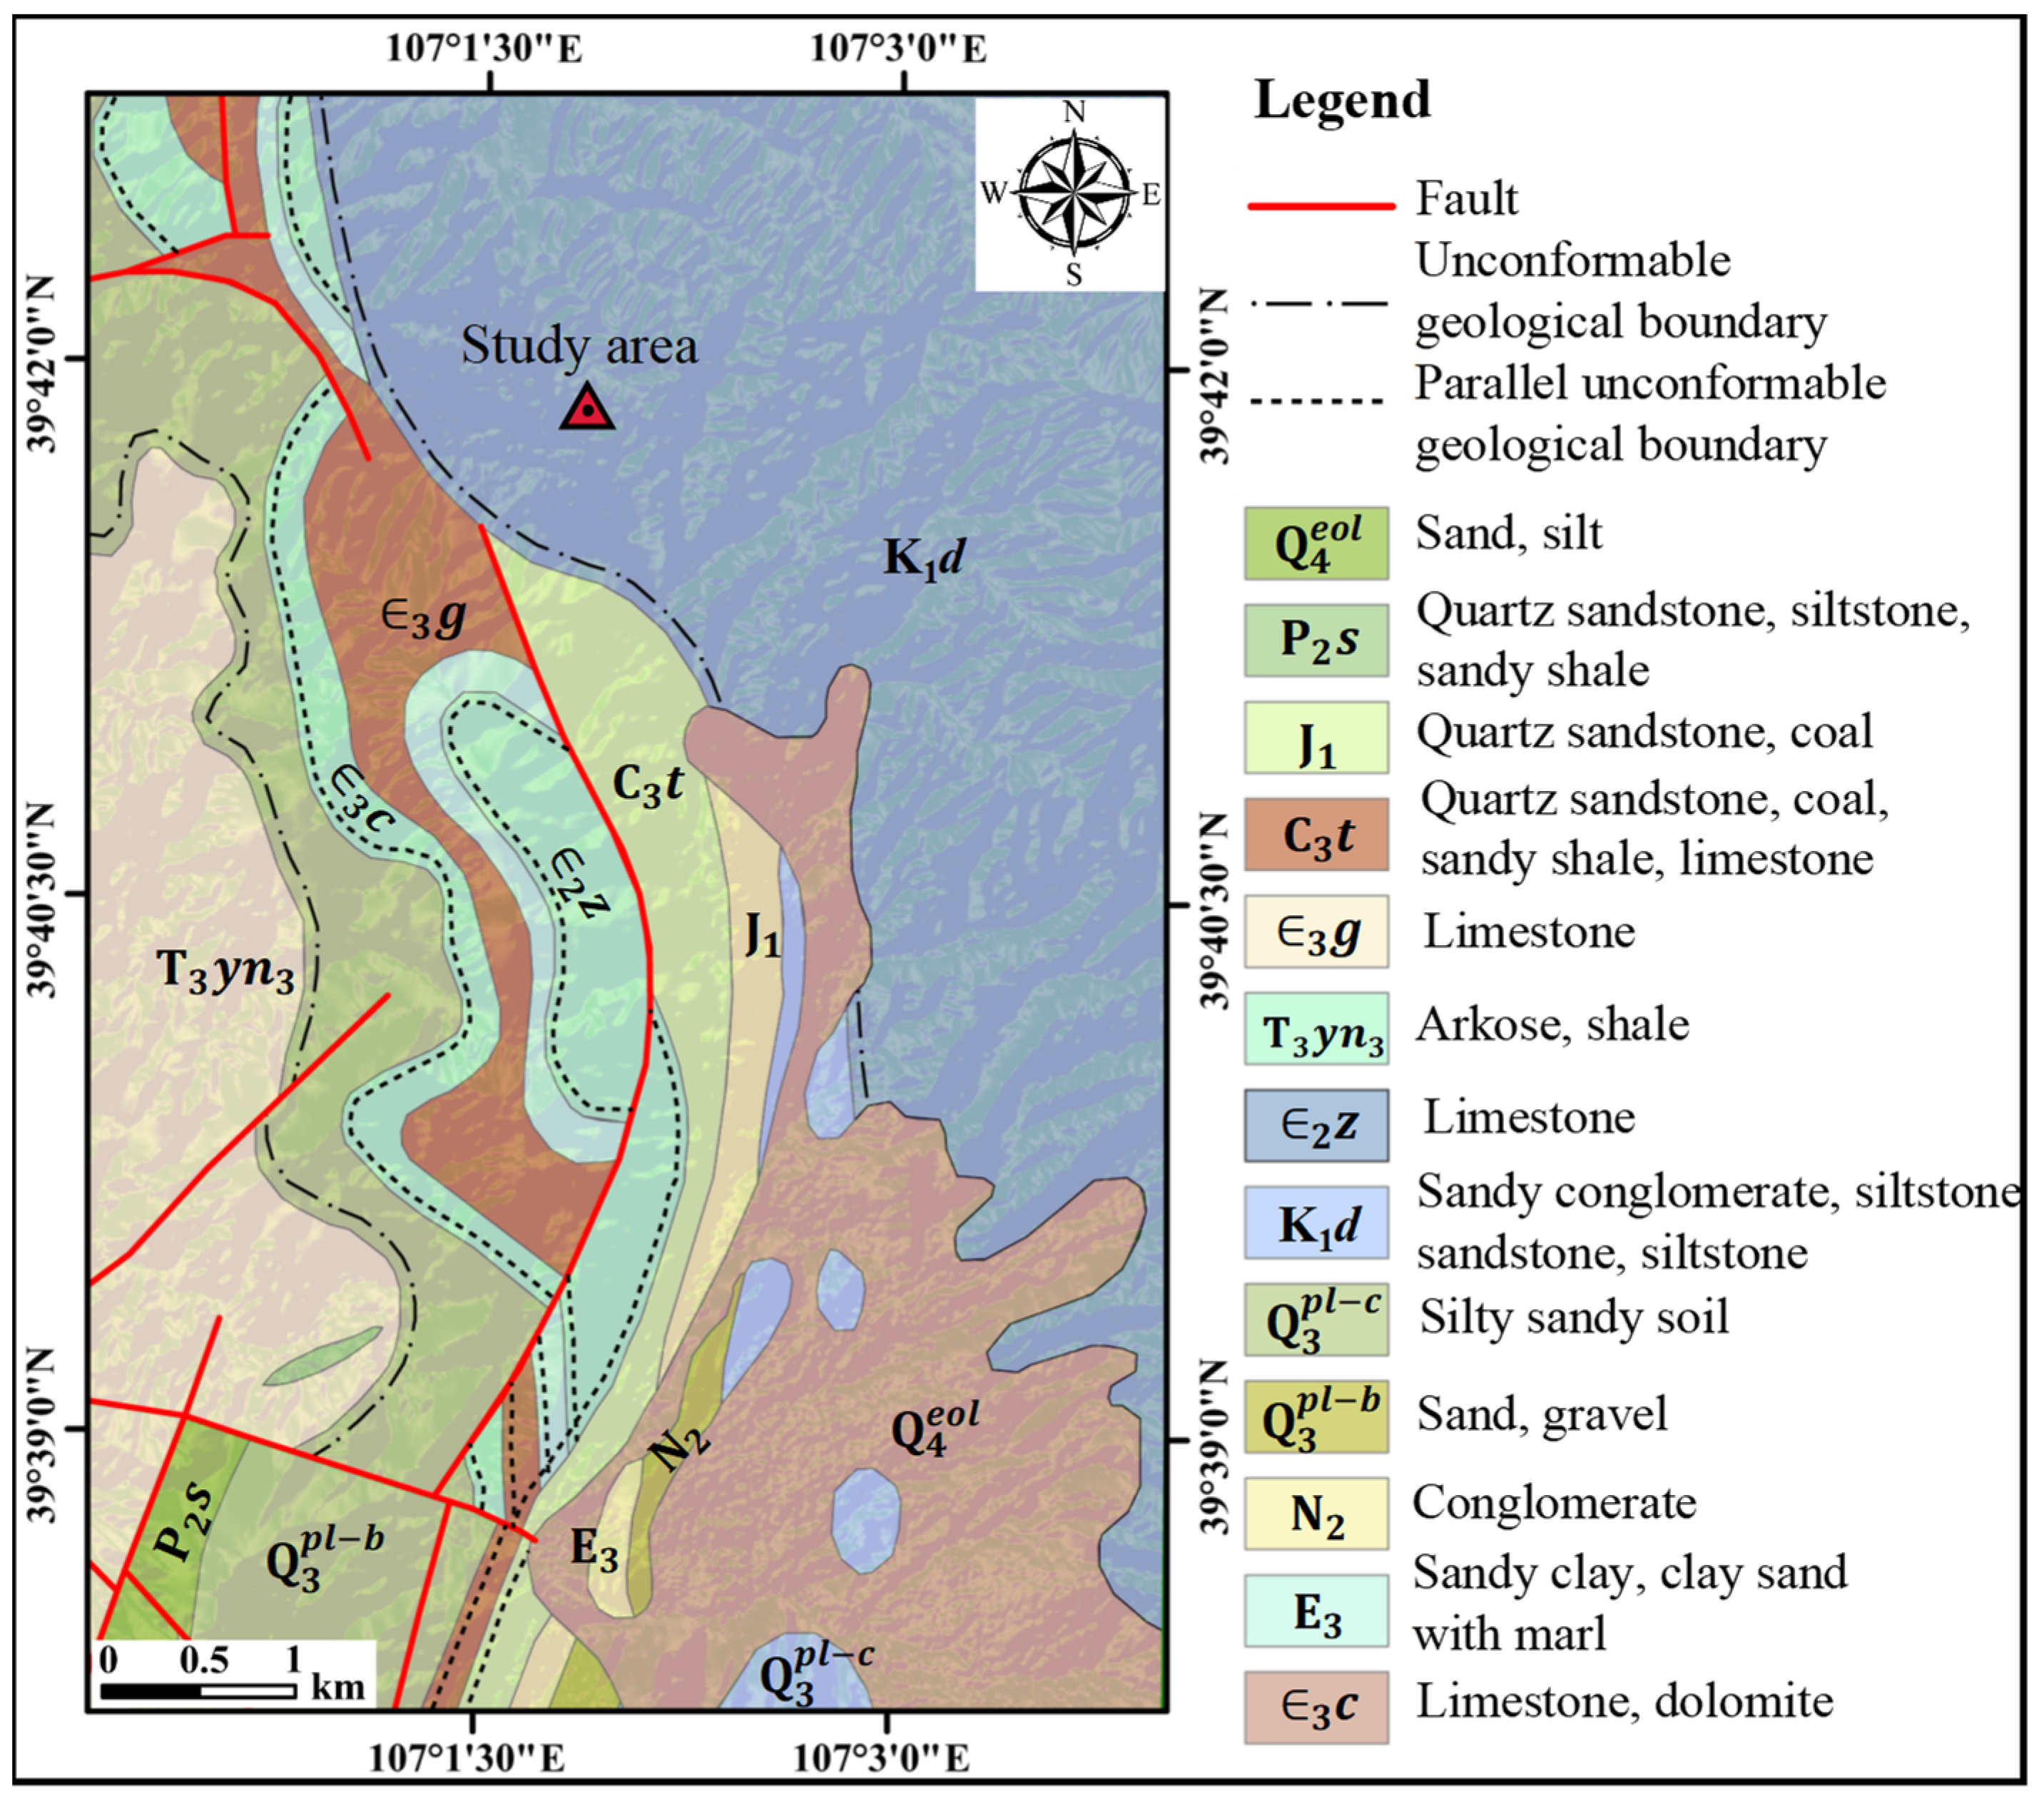
Figure 2.
Topographic and geological map.
Figure 2.
Topographic and geological map.
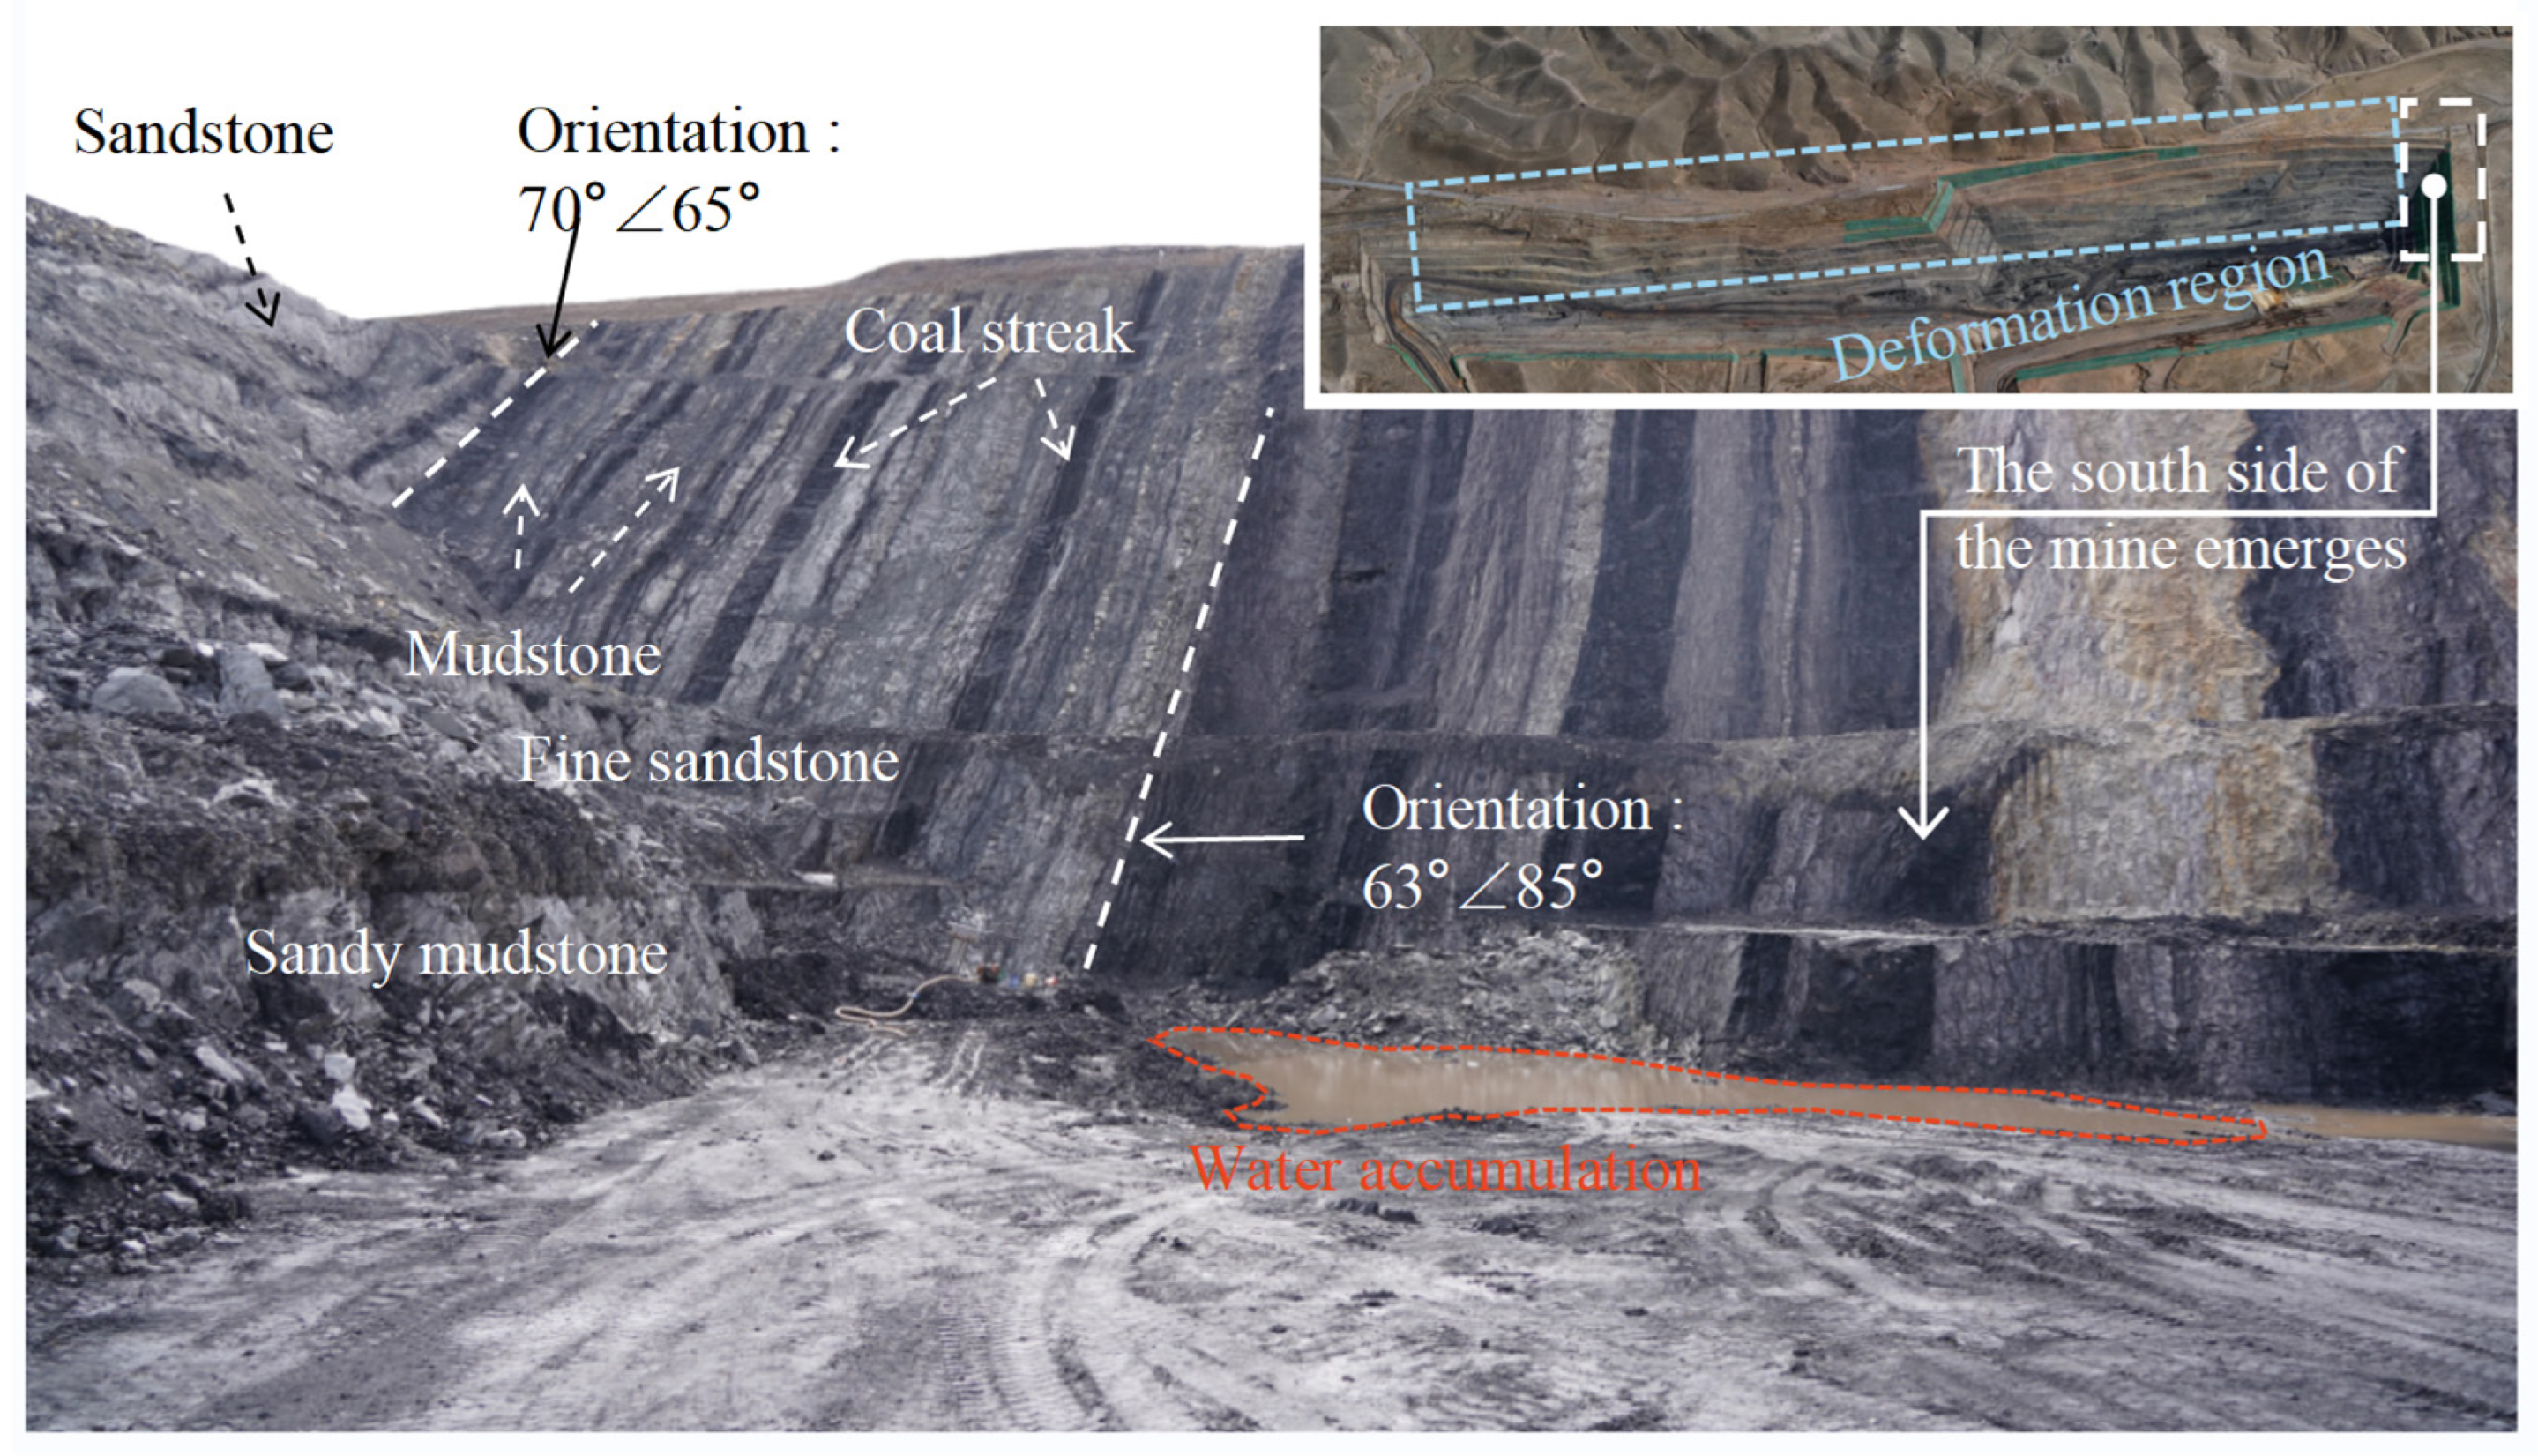
Figure 3.
Stratigraphic structure of the Wolong open-pit coal mine.
Figure 3.
Stratigraphic structure of the Wolong open-pit coal mine.
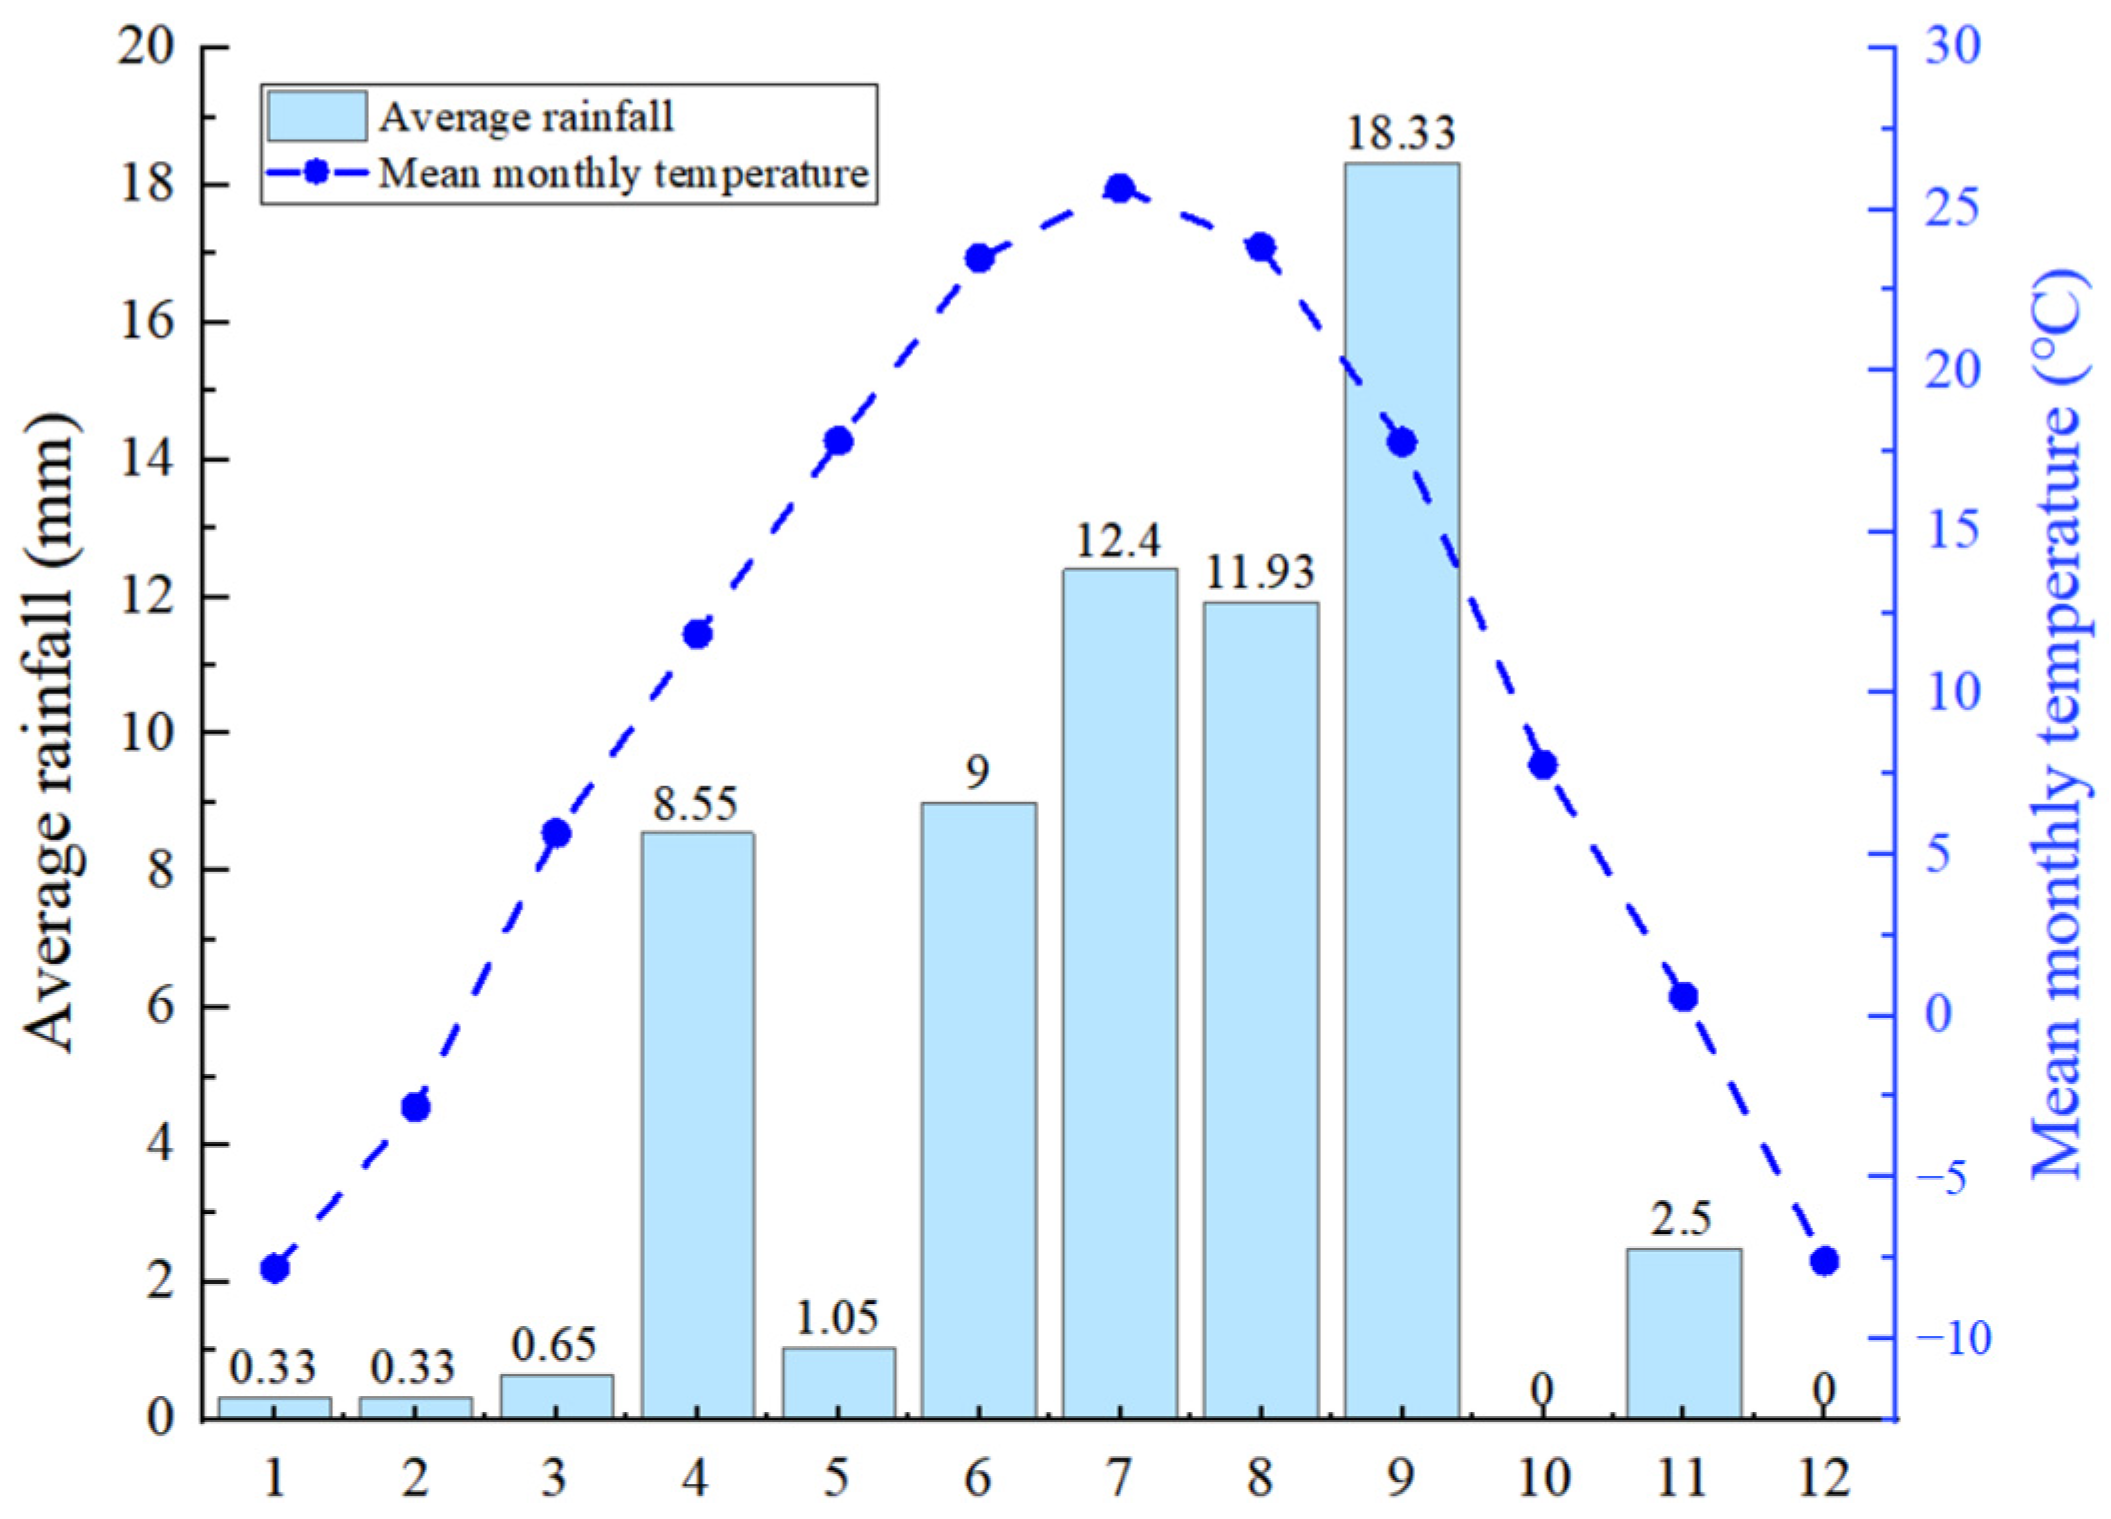
Figure 4.
Average monthly precipitation and average monthly temperature from 2018 to 2023.
Figure 4.
Average monthly precipitation and average monthly temperature from 2018 to 2023.
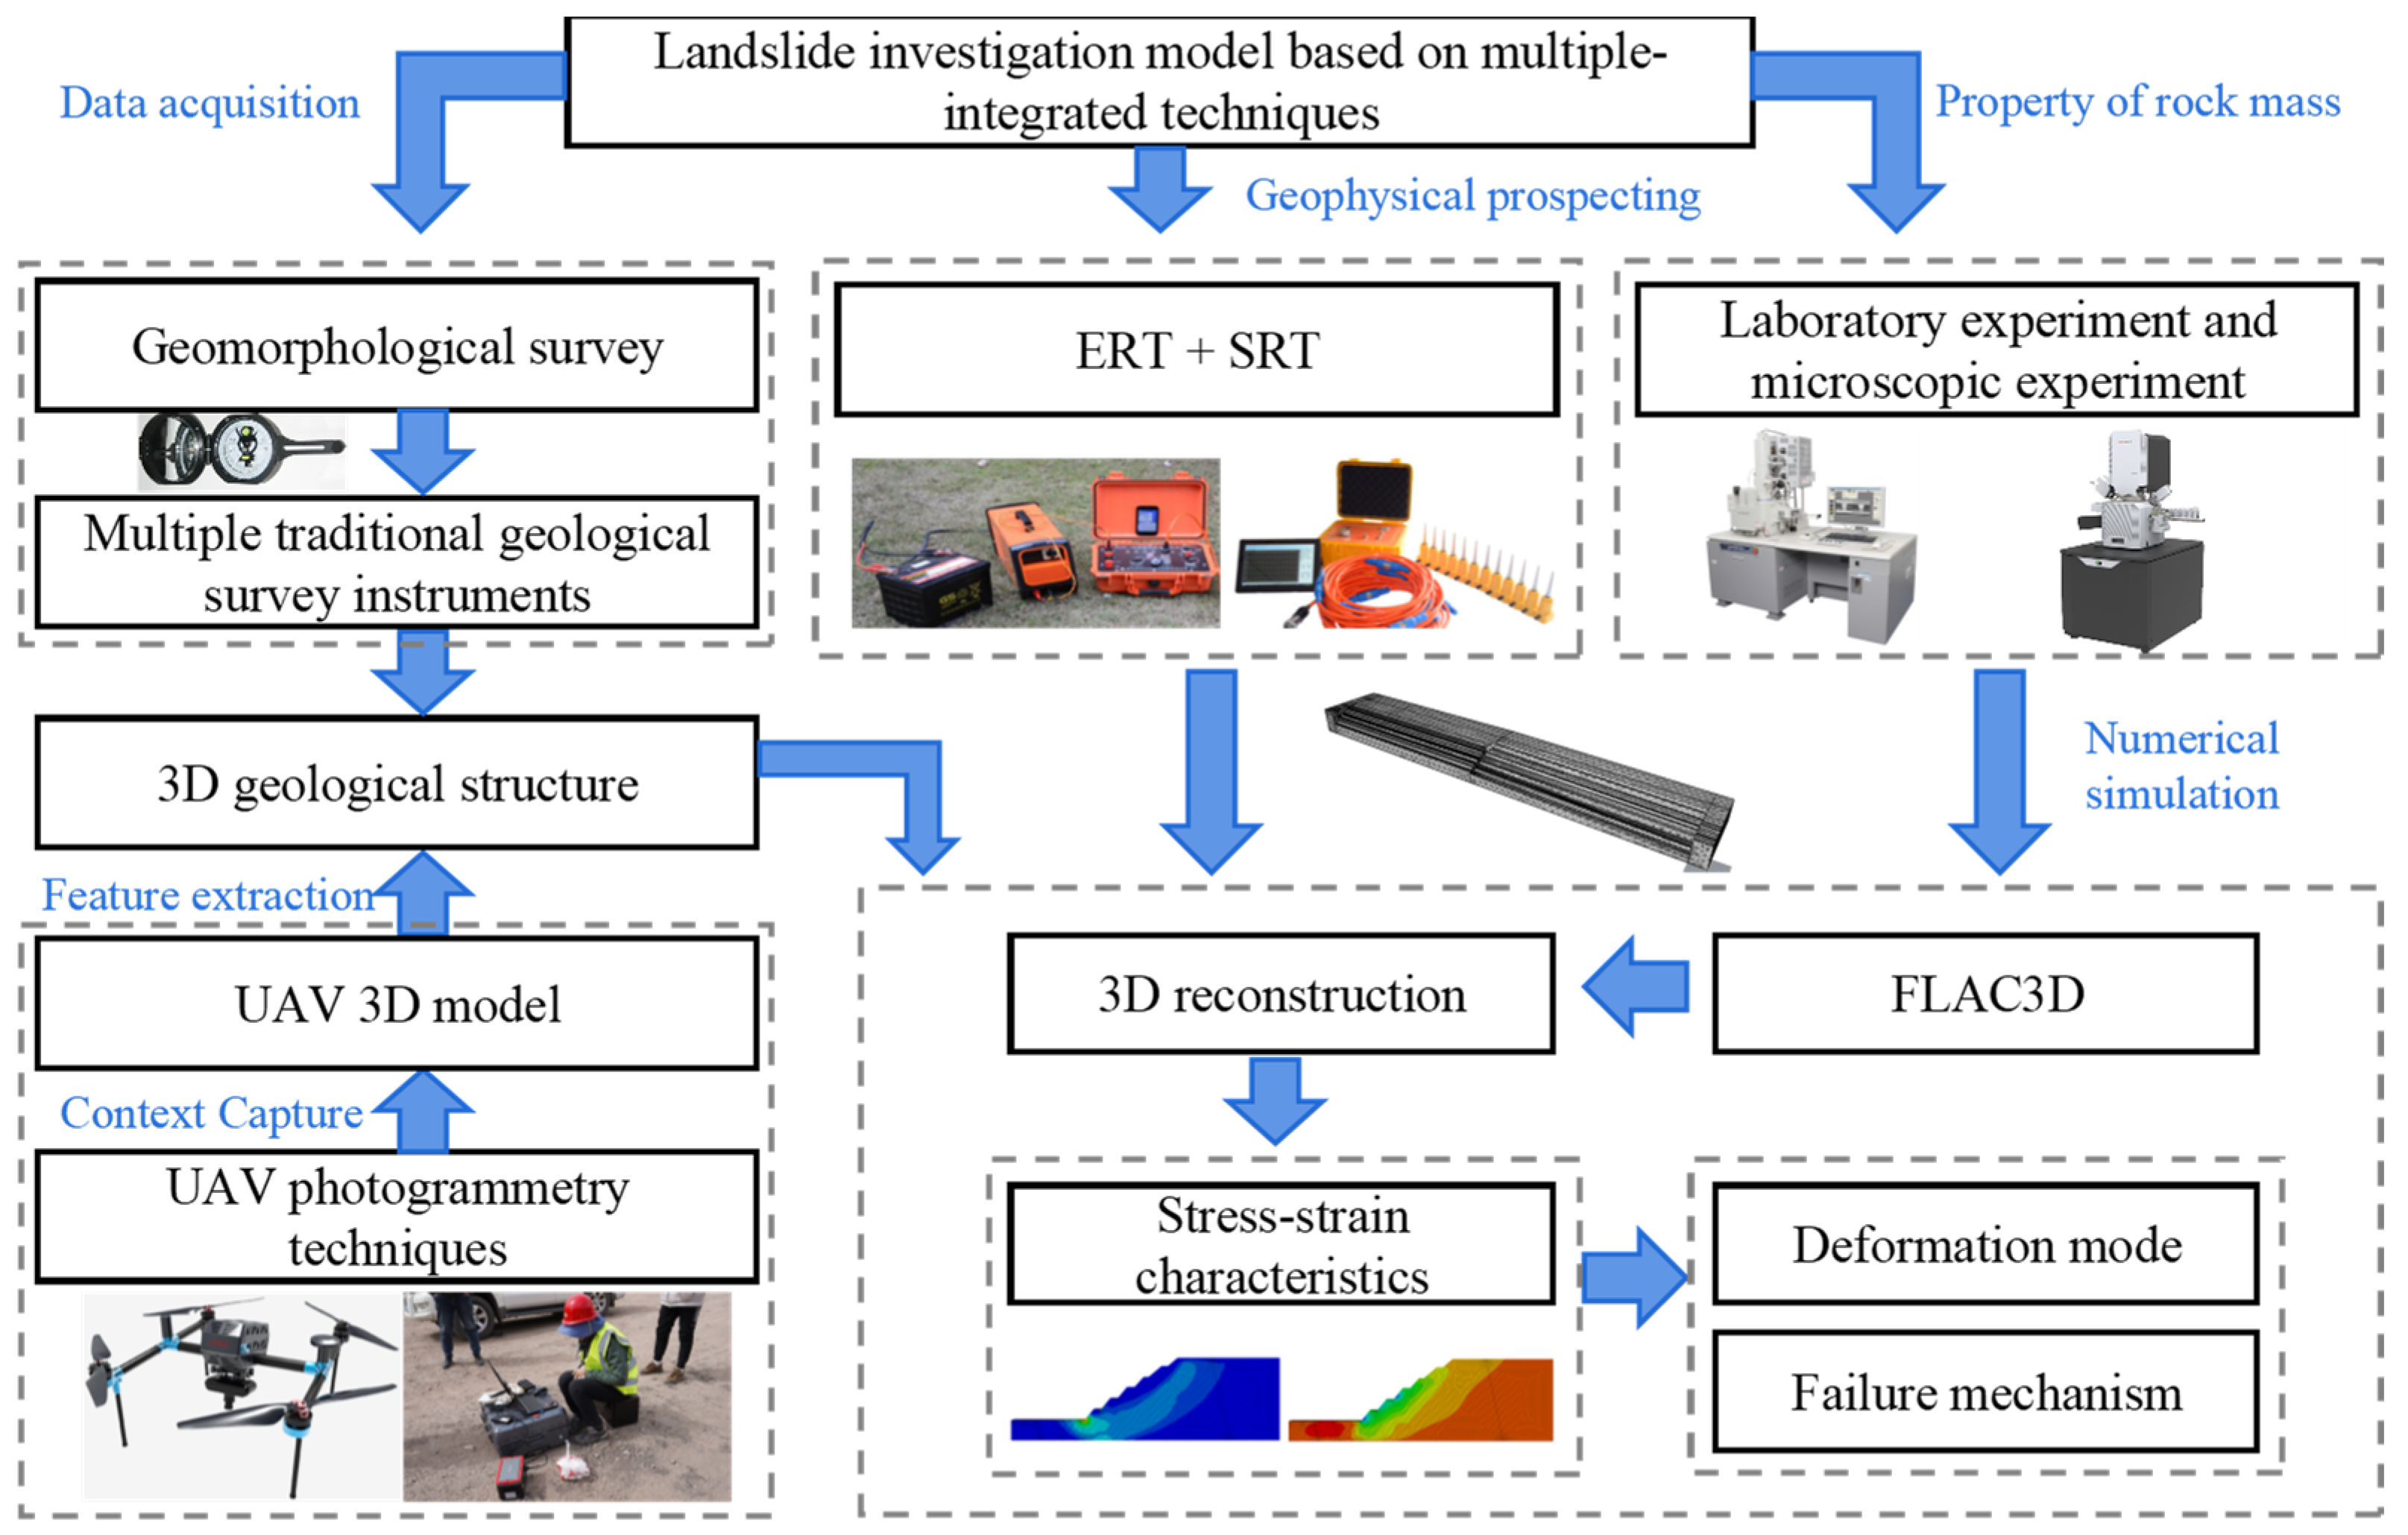
Figure 5.
Flow chart of multiple-integrated techniques for landslide investigations.
Figure 5.
Flow chart of multiple-integrated techniques for landslide investigations.
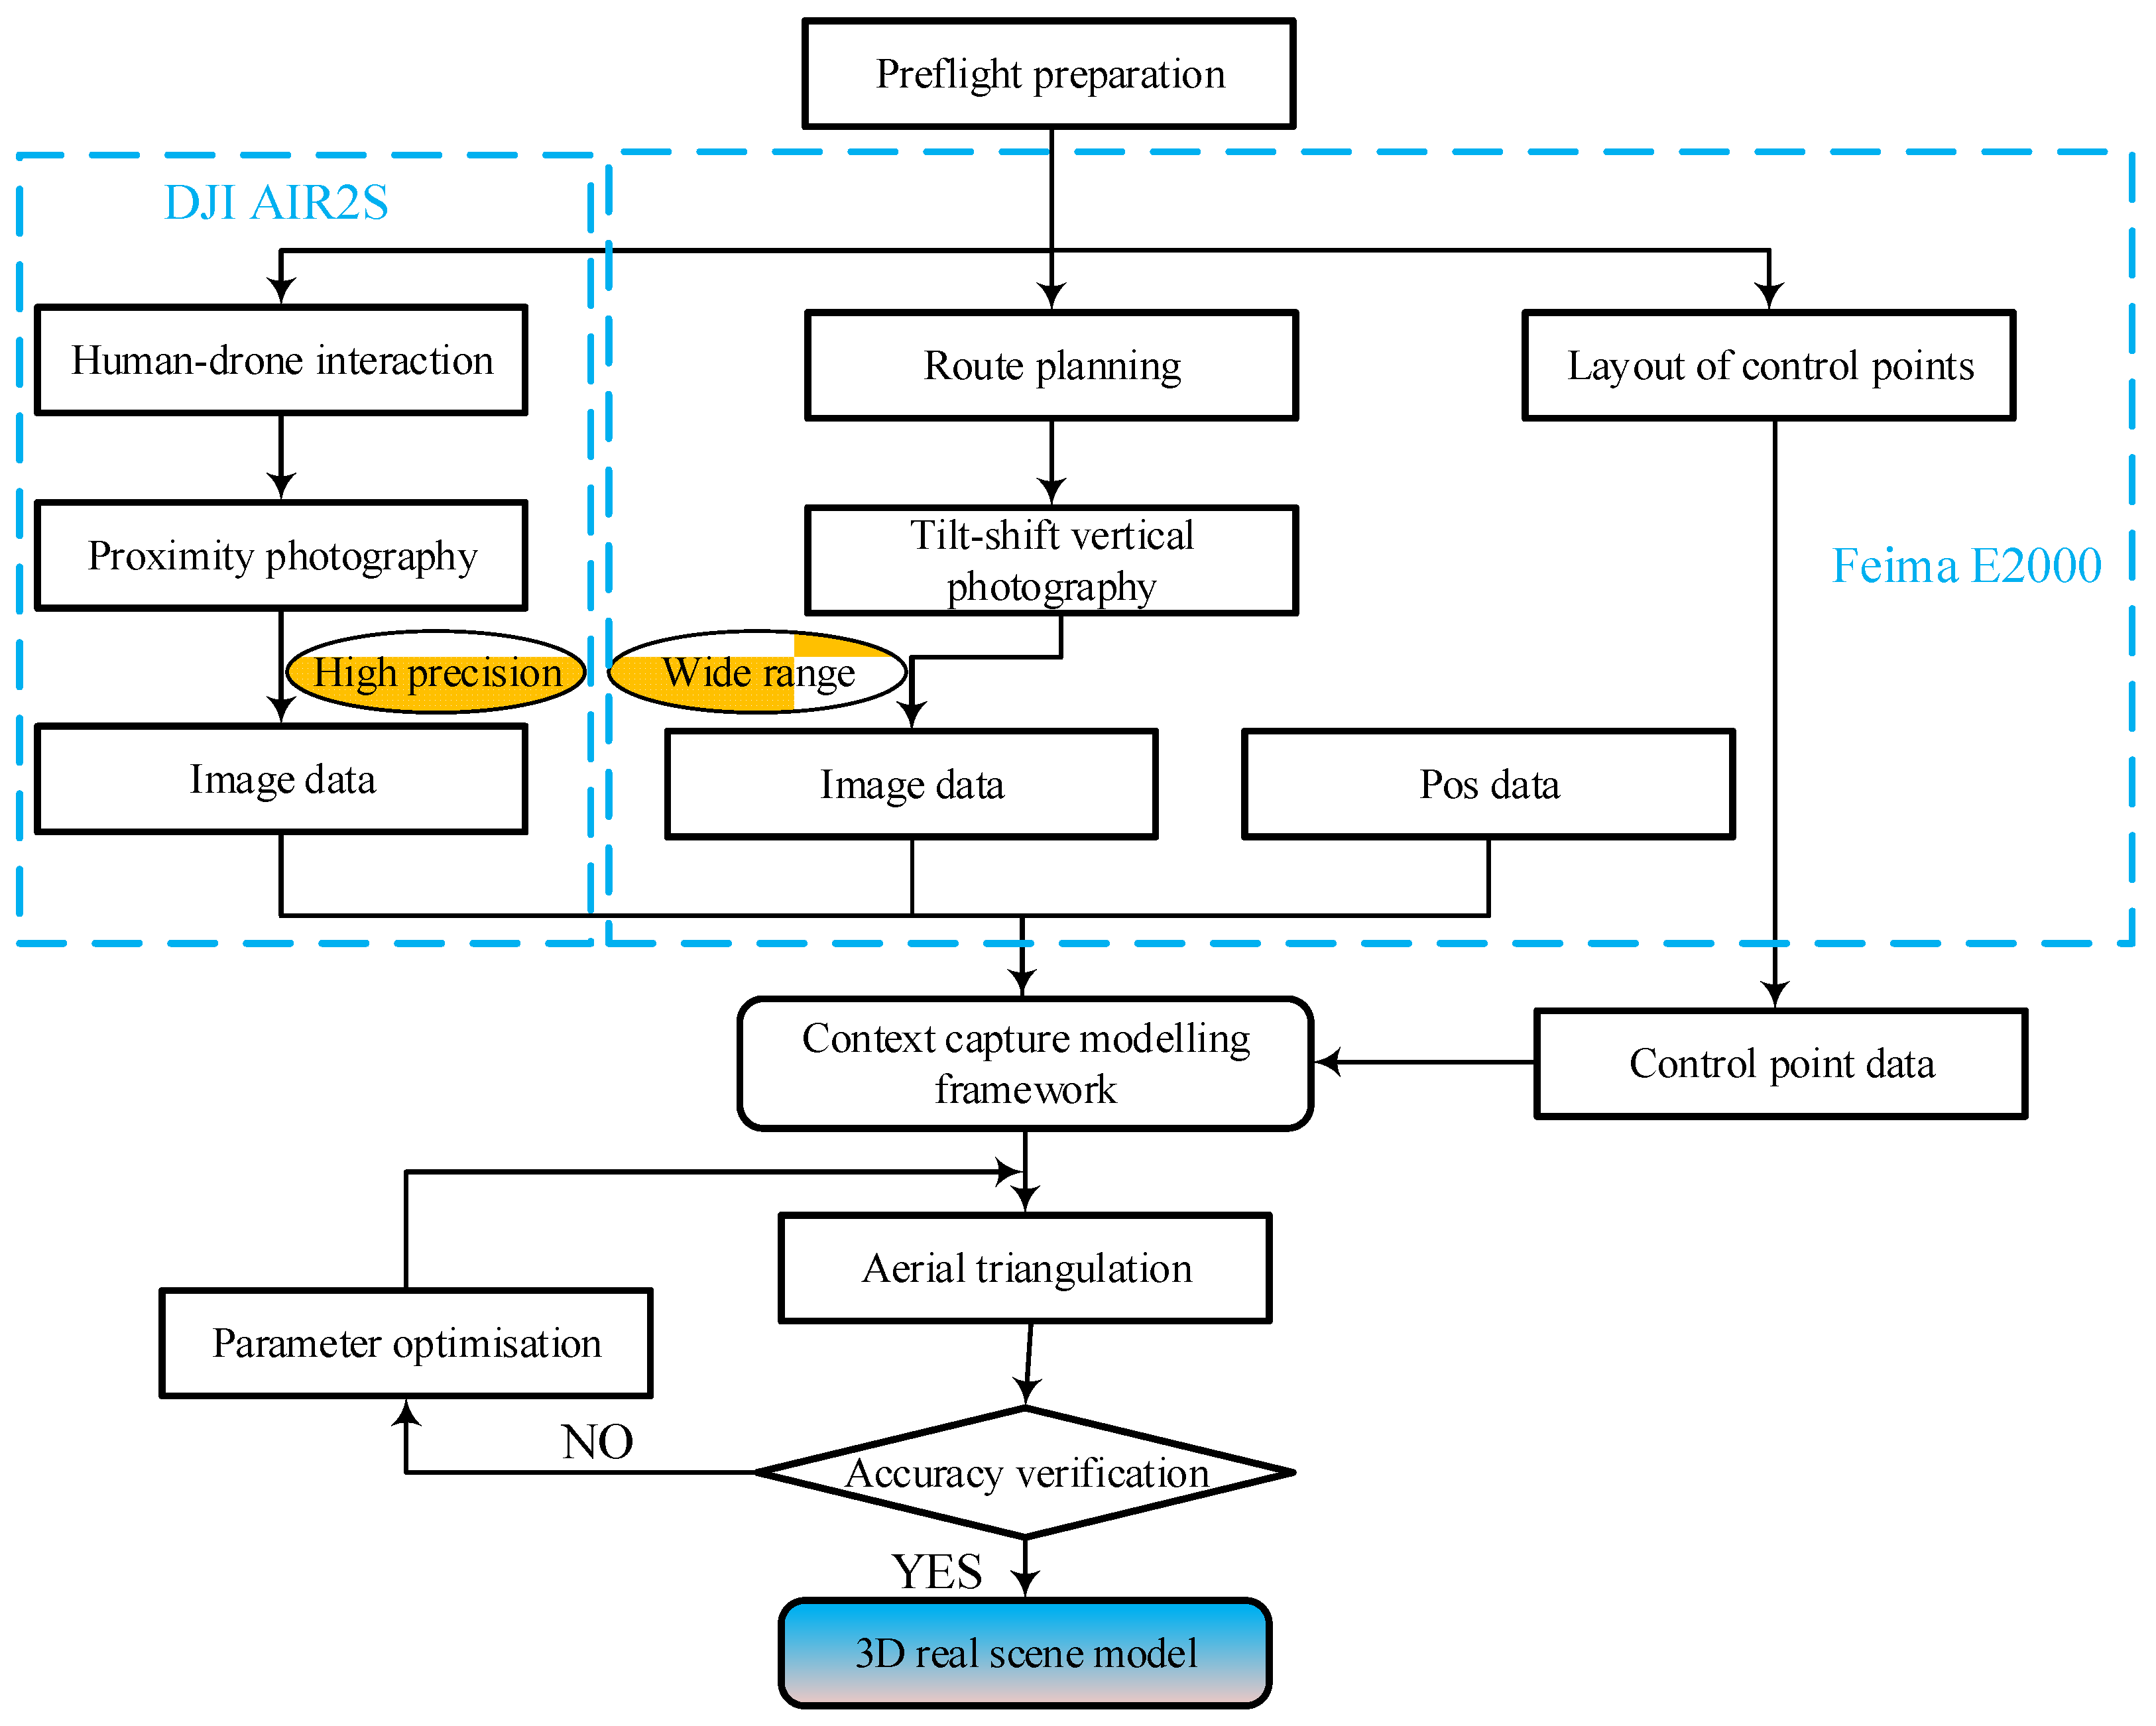
Figure 6.
3D model construction process based on UAV photogrammetry technology.
Figure 6.
3D model construction process based on UAV photogrammetry technology.
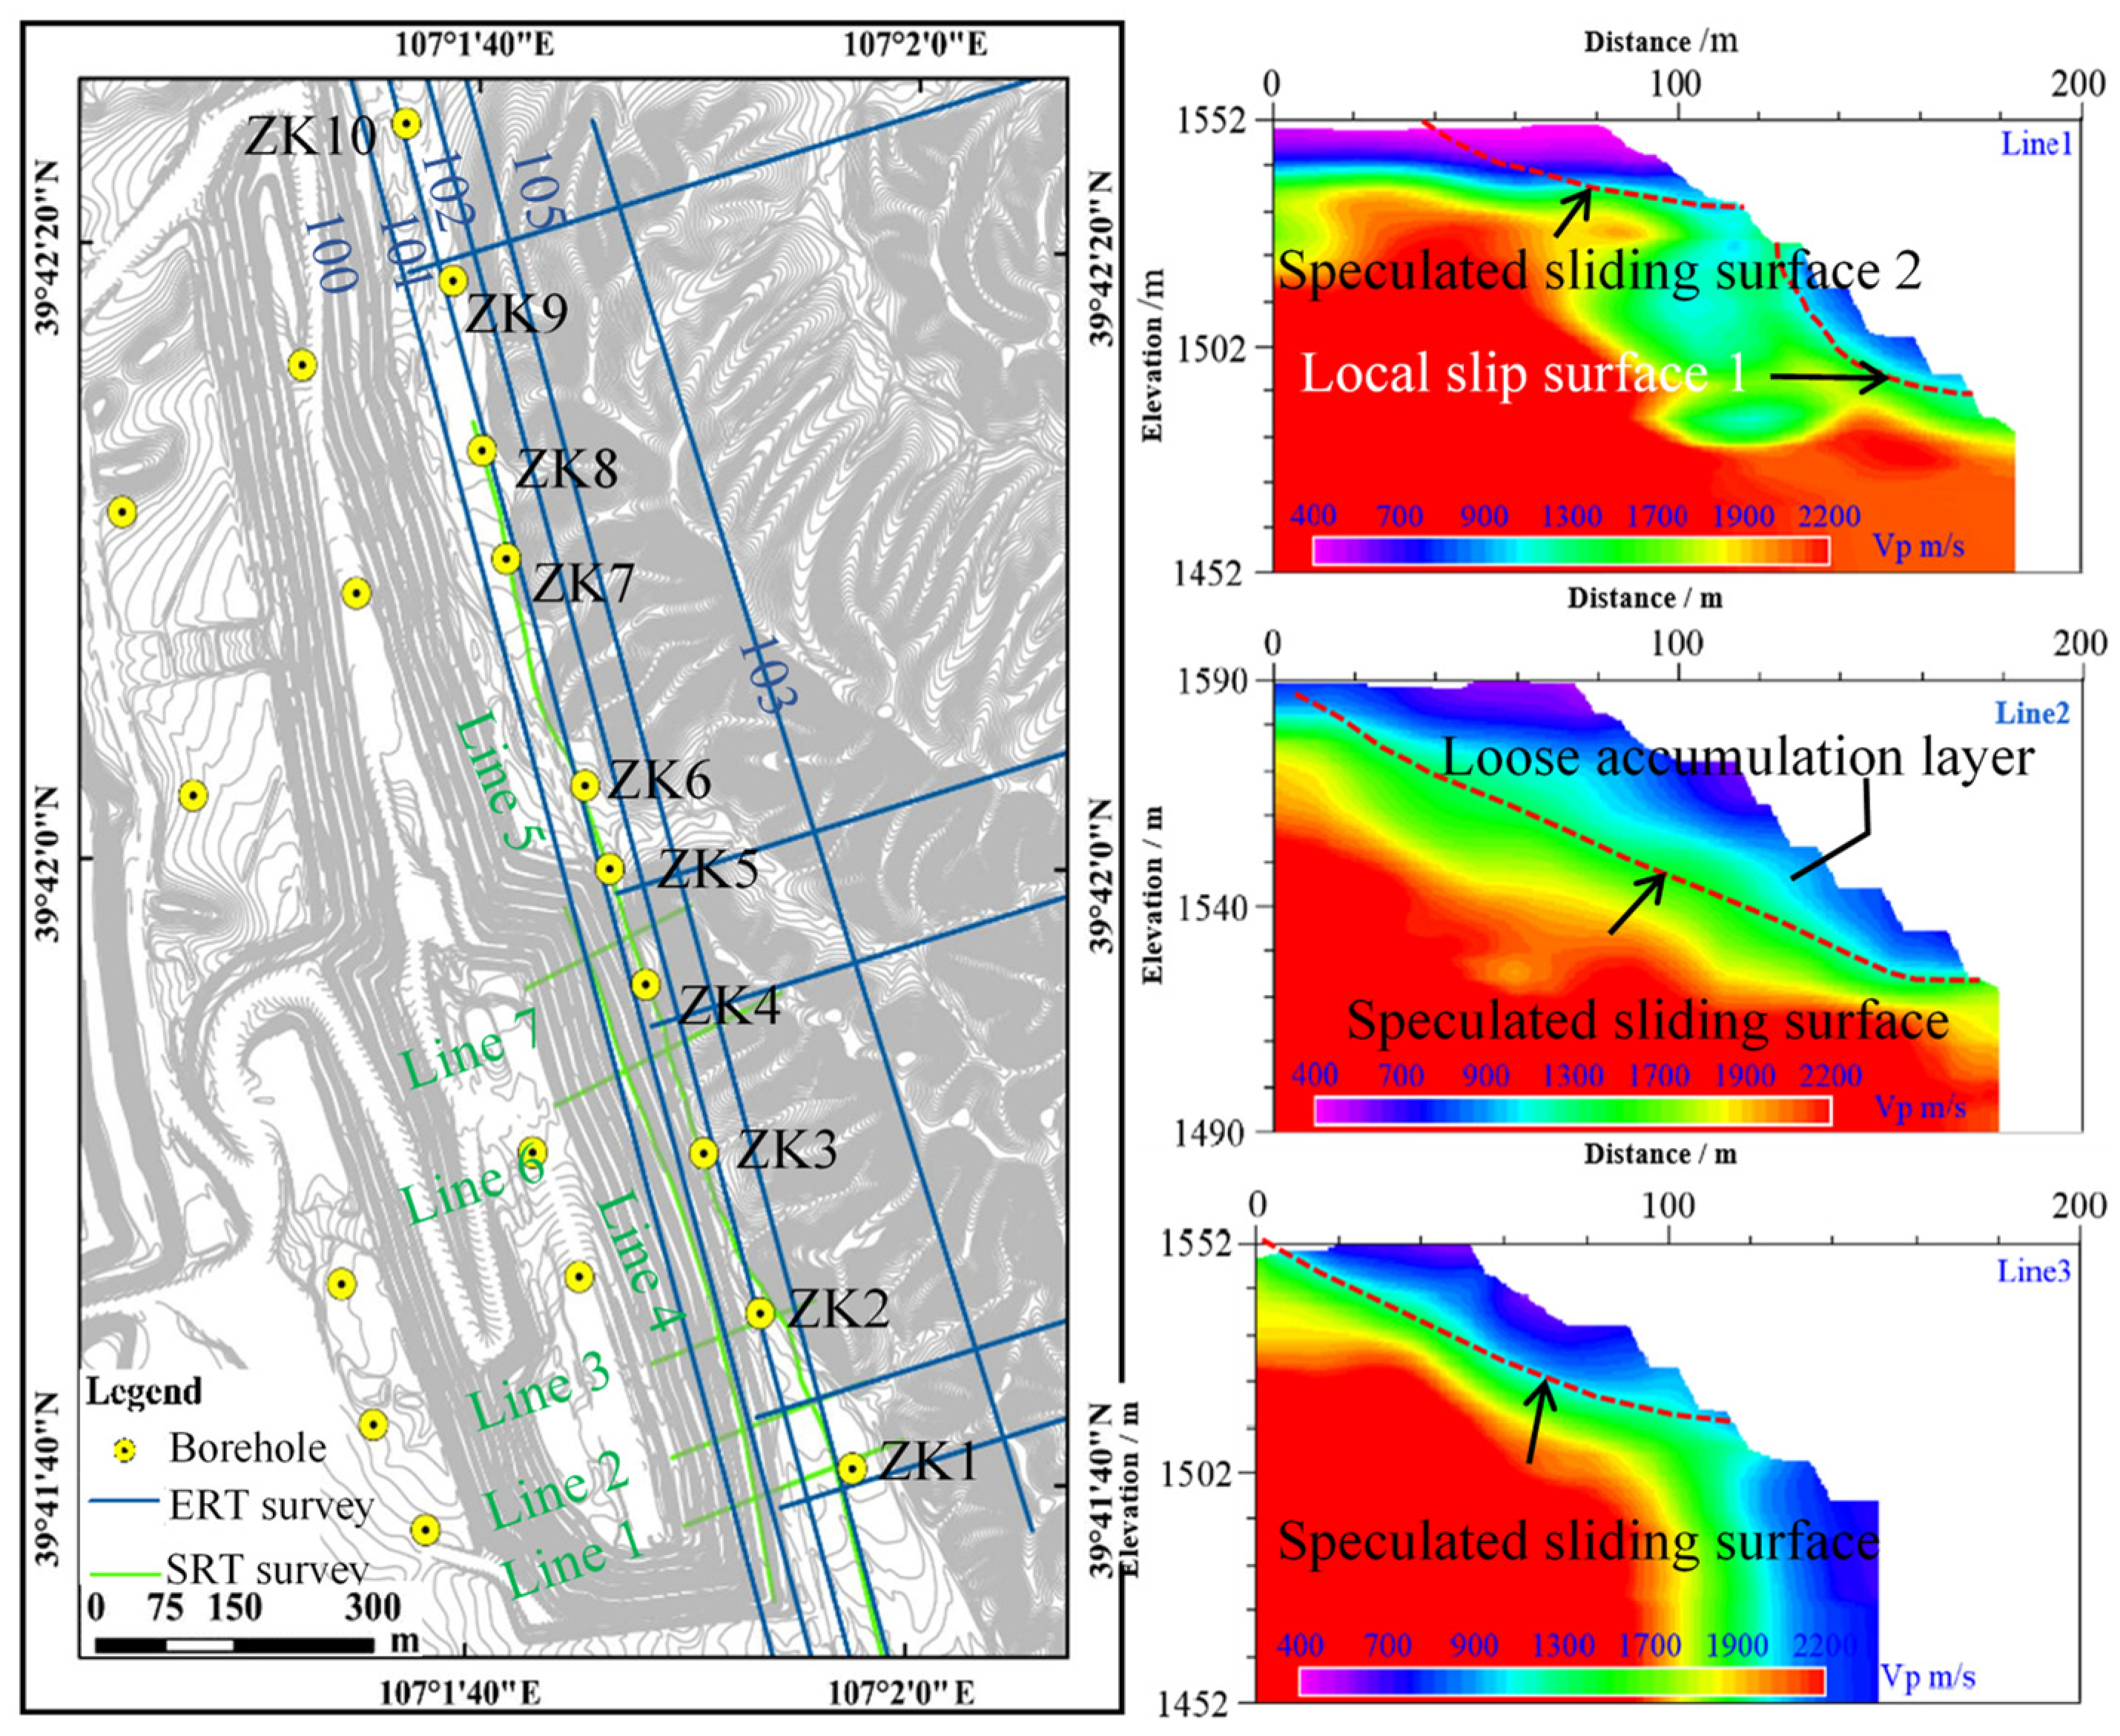
Figure 7.
Layout of engineering geophysical exploration and borehole and interpretation results by SRT survey.
Figure 7.
Layout of engineering geophysical exploration and borehole and interpretation results by SRT survey.
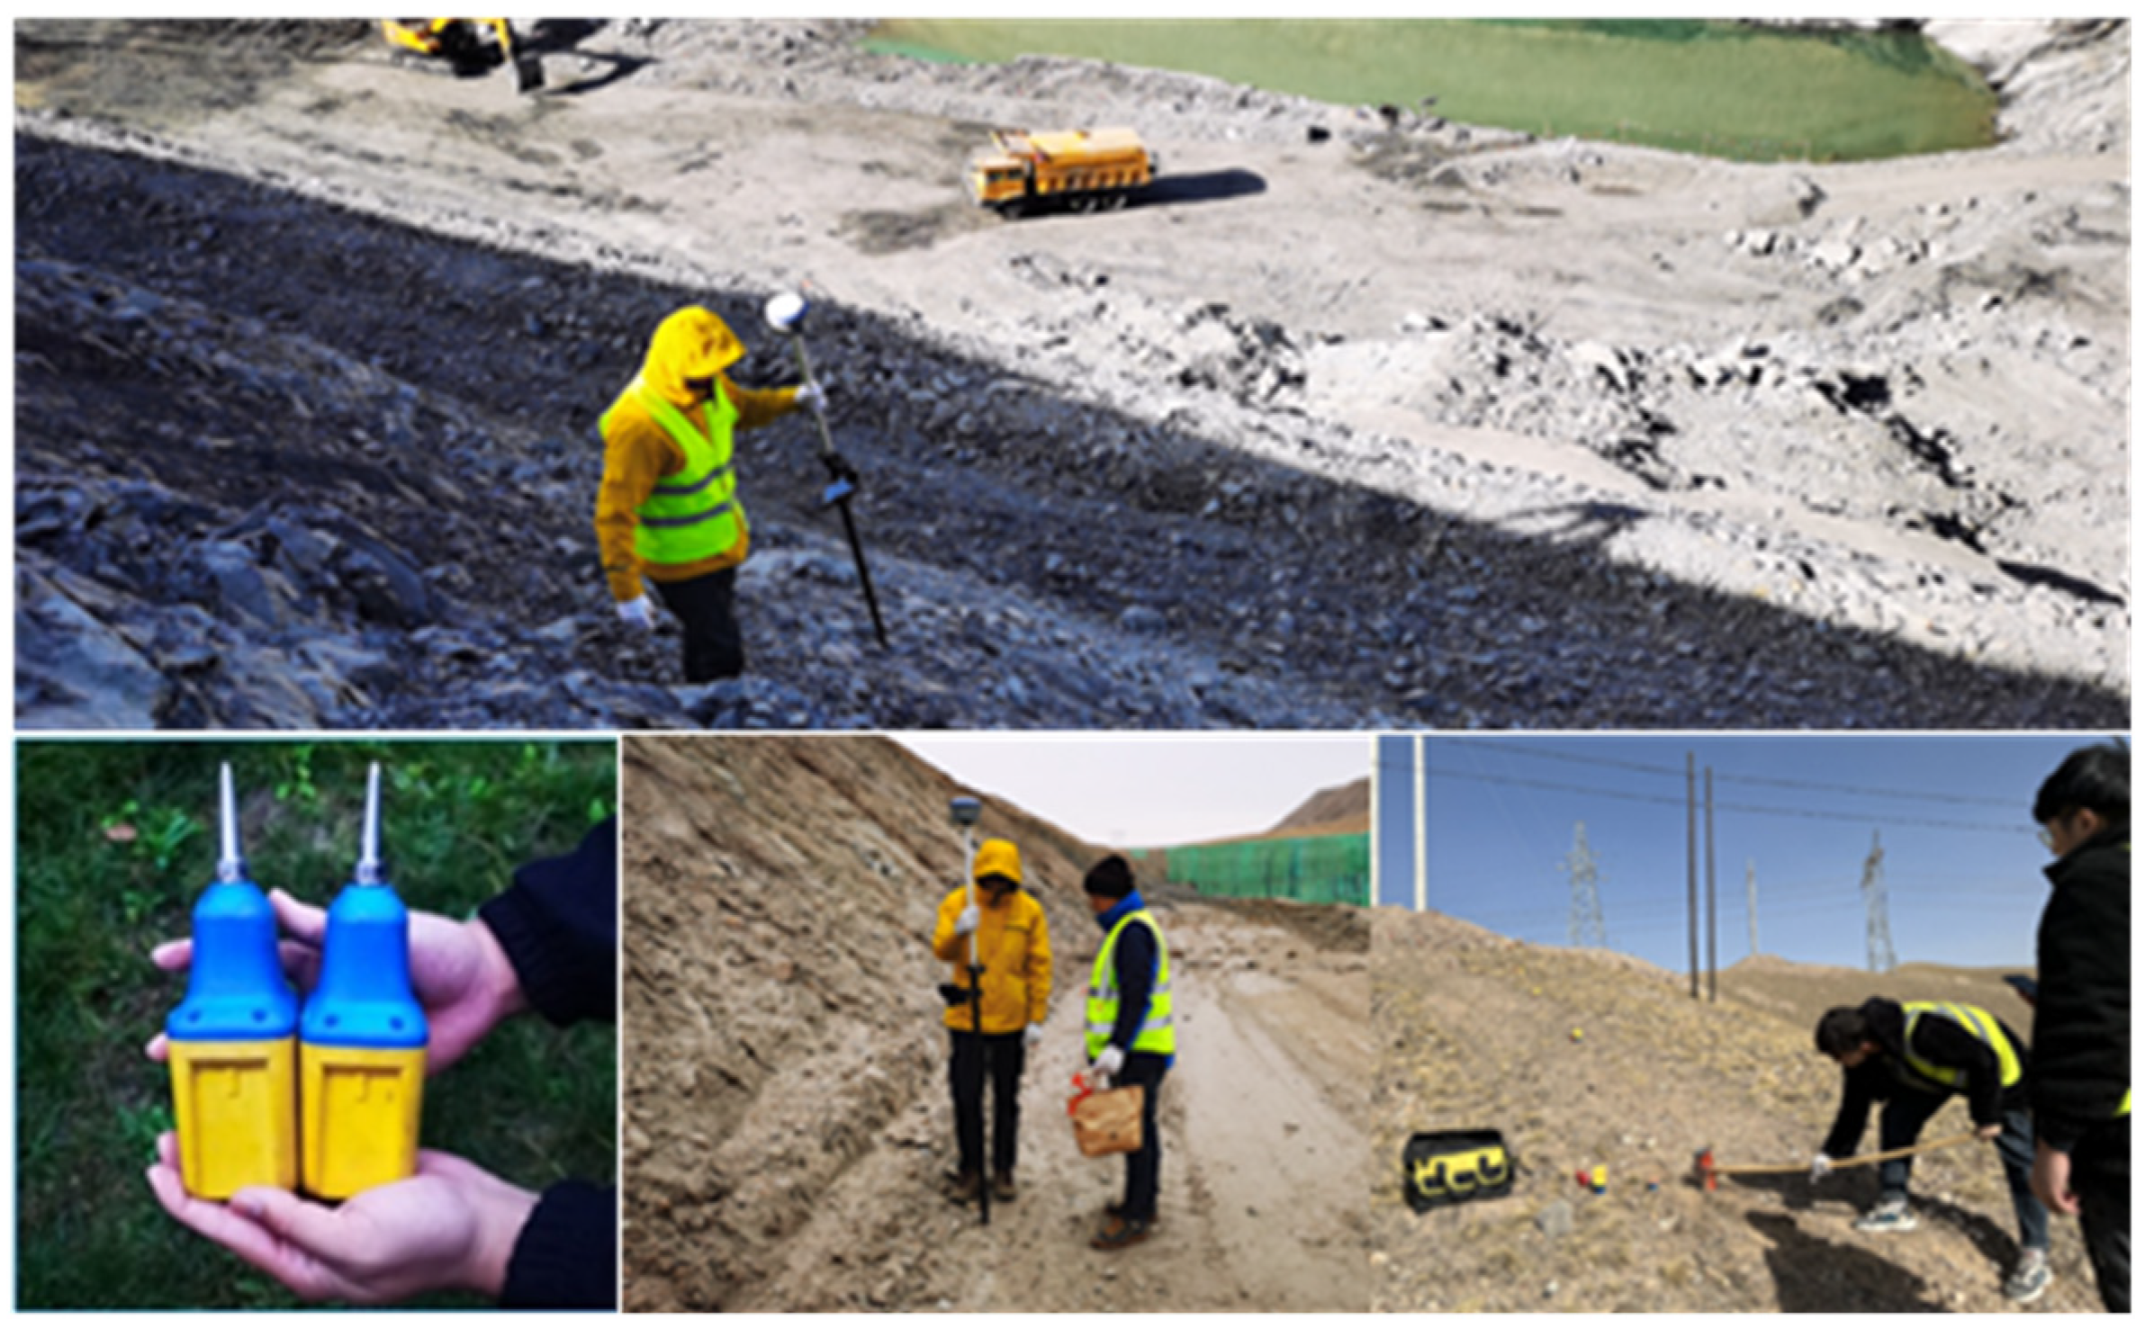
Figure 8.
Field workflow for SRT survey.
Figure 8.
Field workflow for SRT survey.
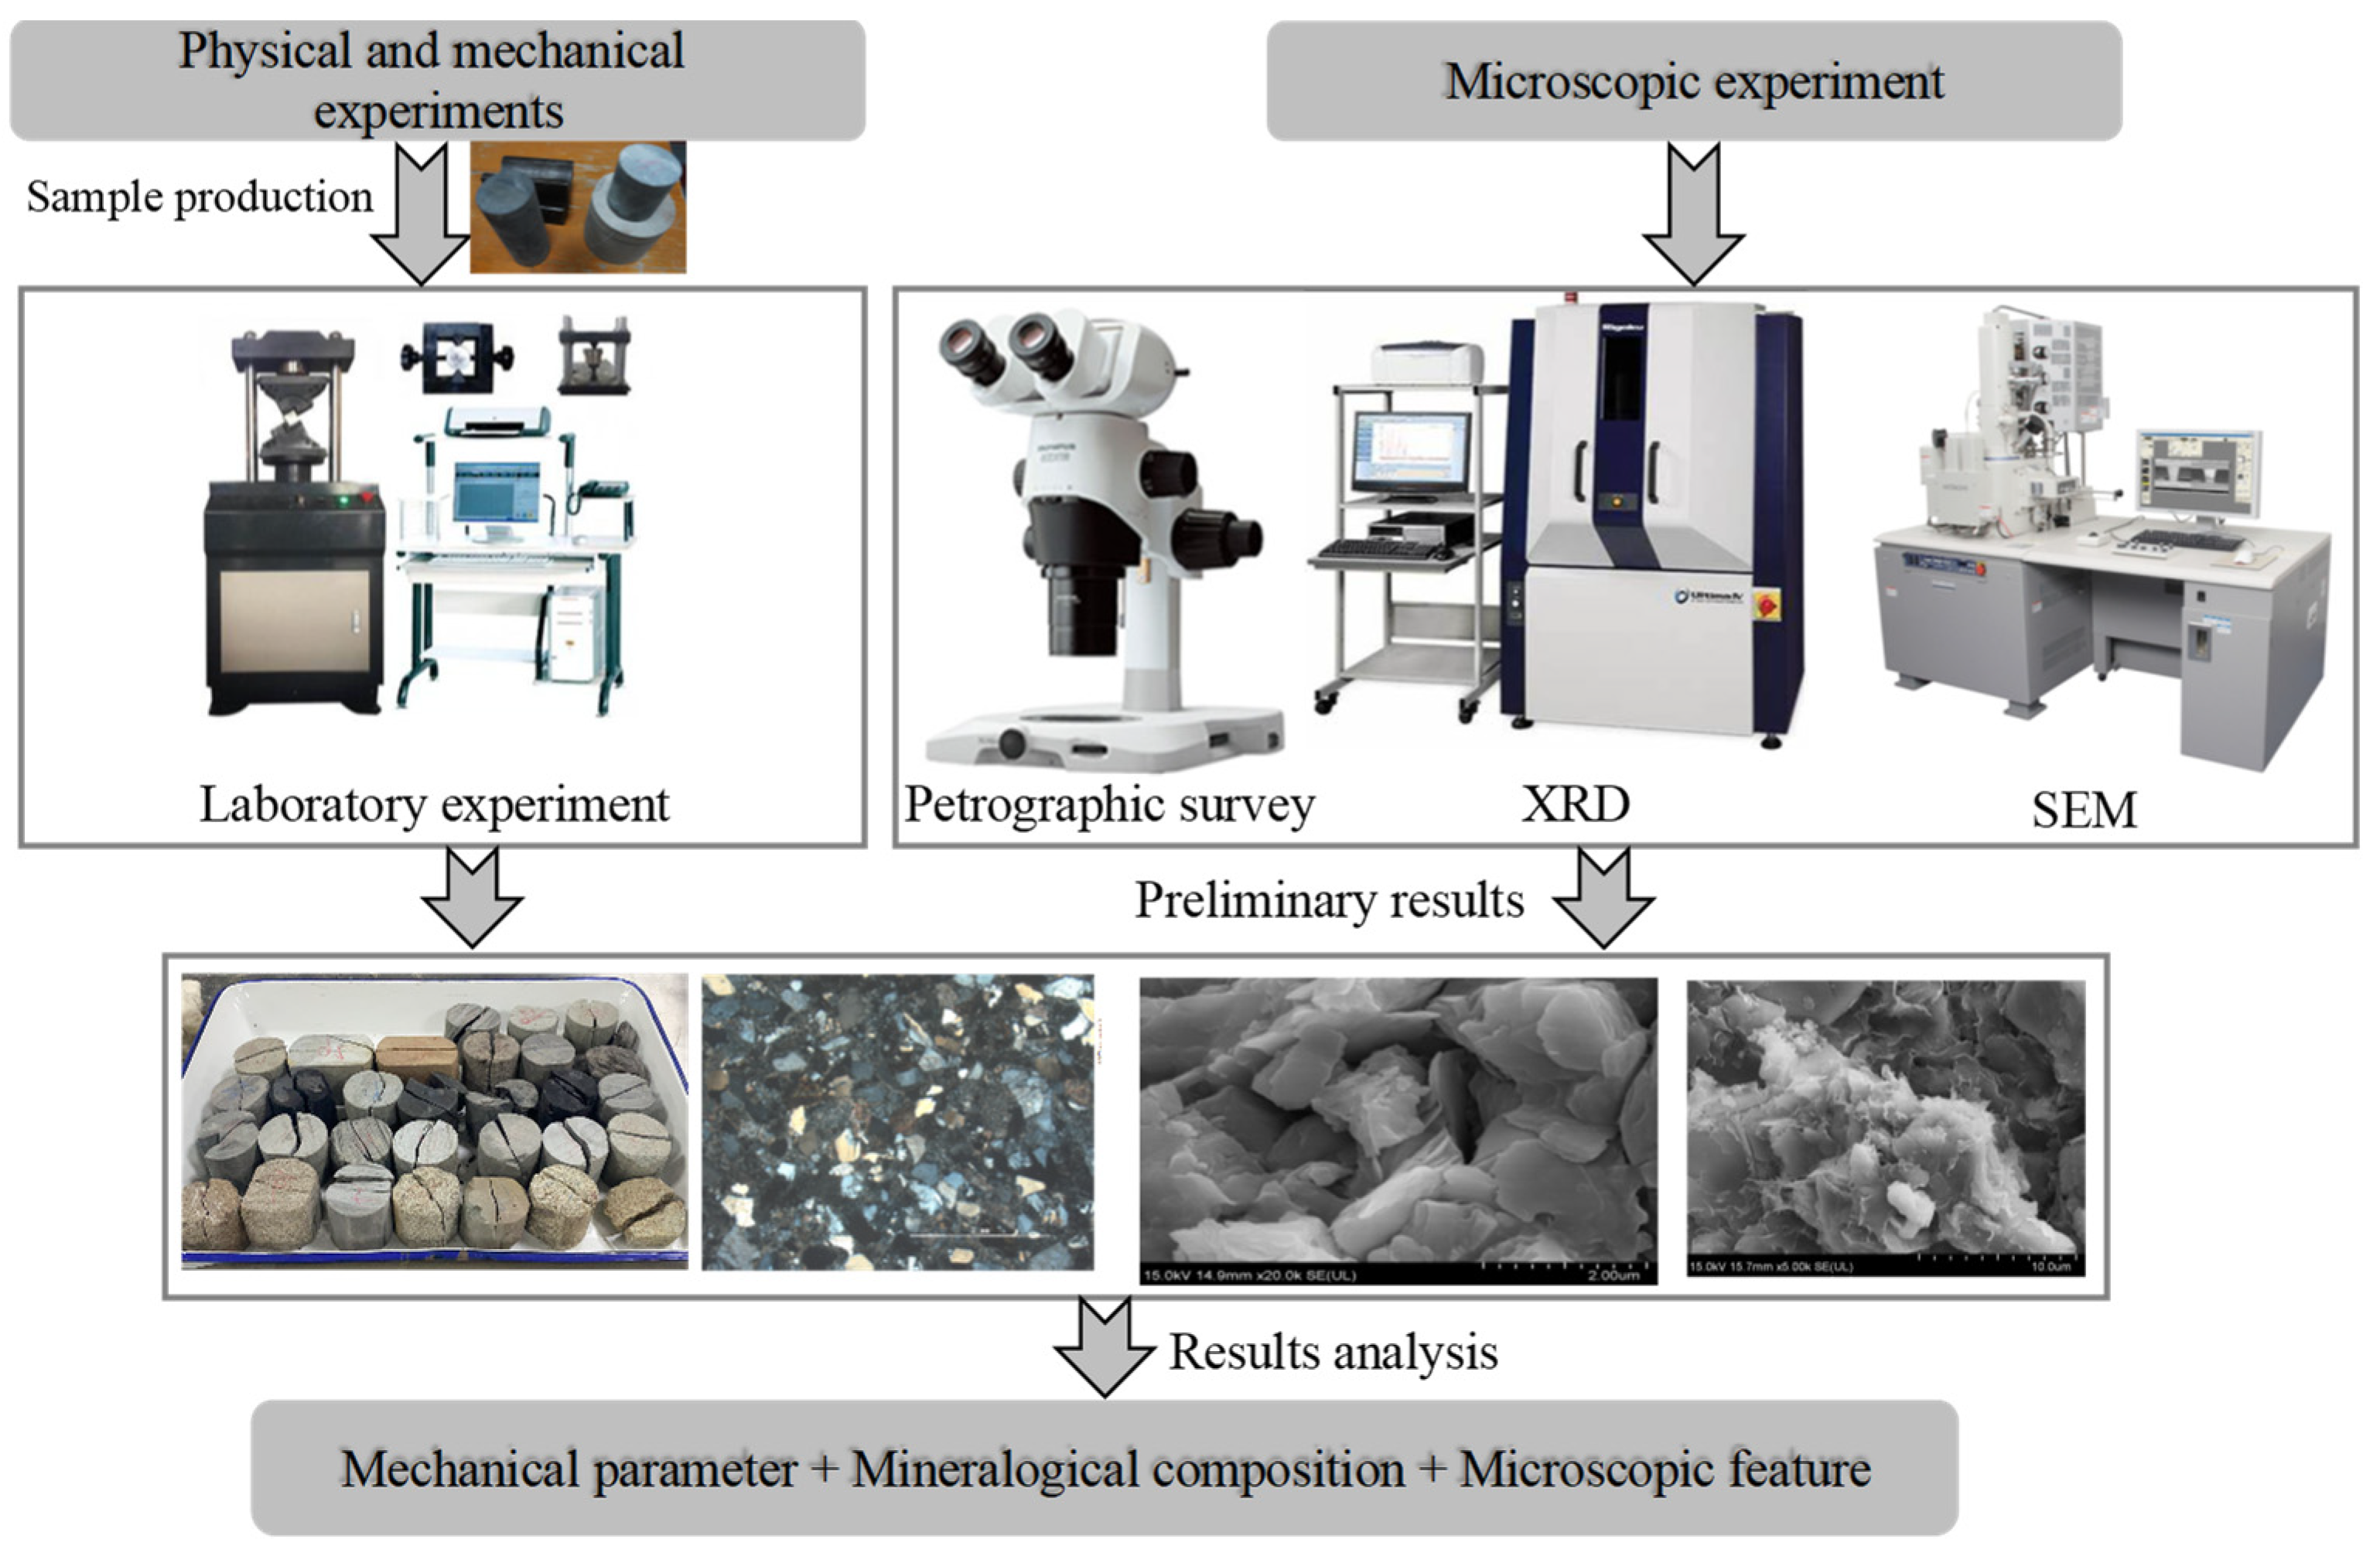
Figure 9.
Flowchart of the laboratory testing of rock masses.
Figure 9.
Flowchart of the laboratory testing of rock masses.
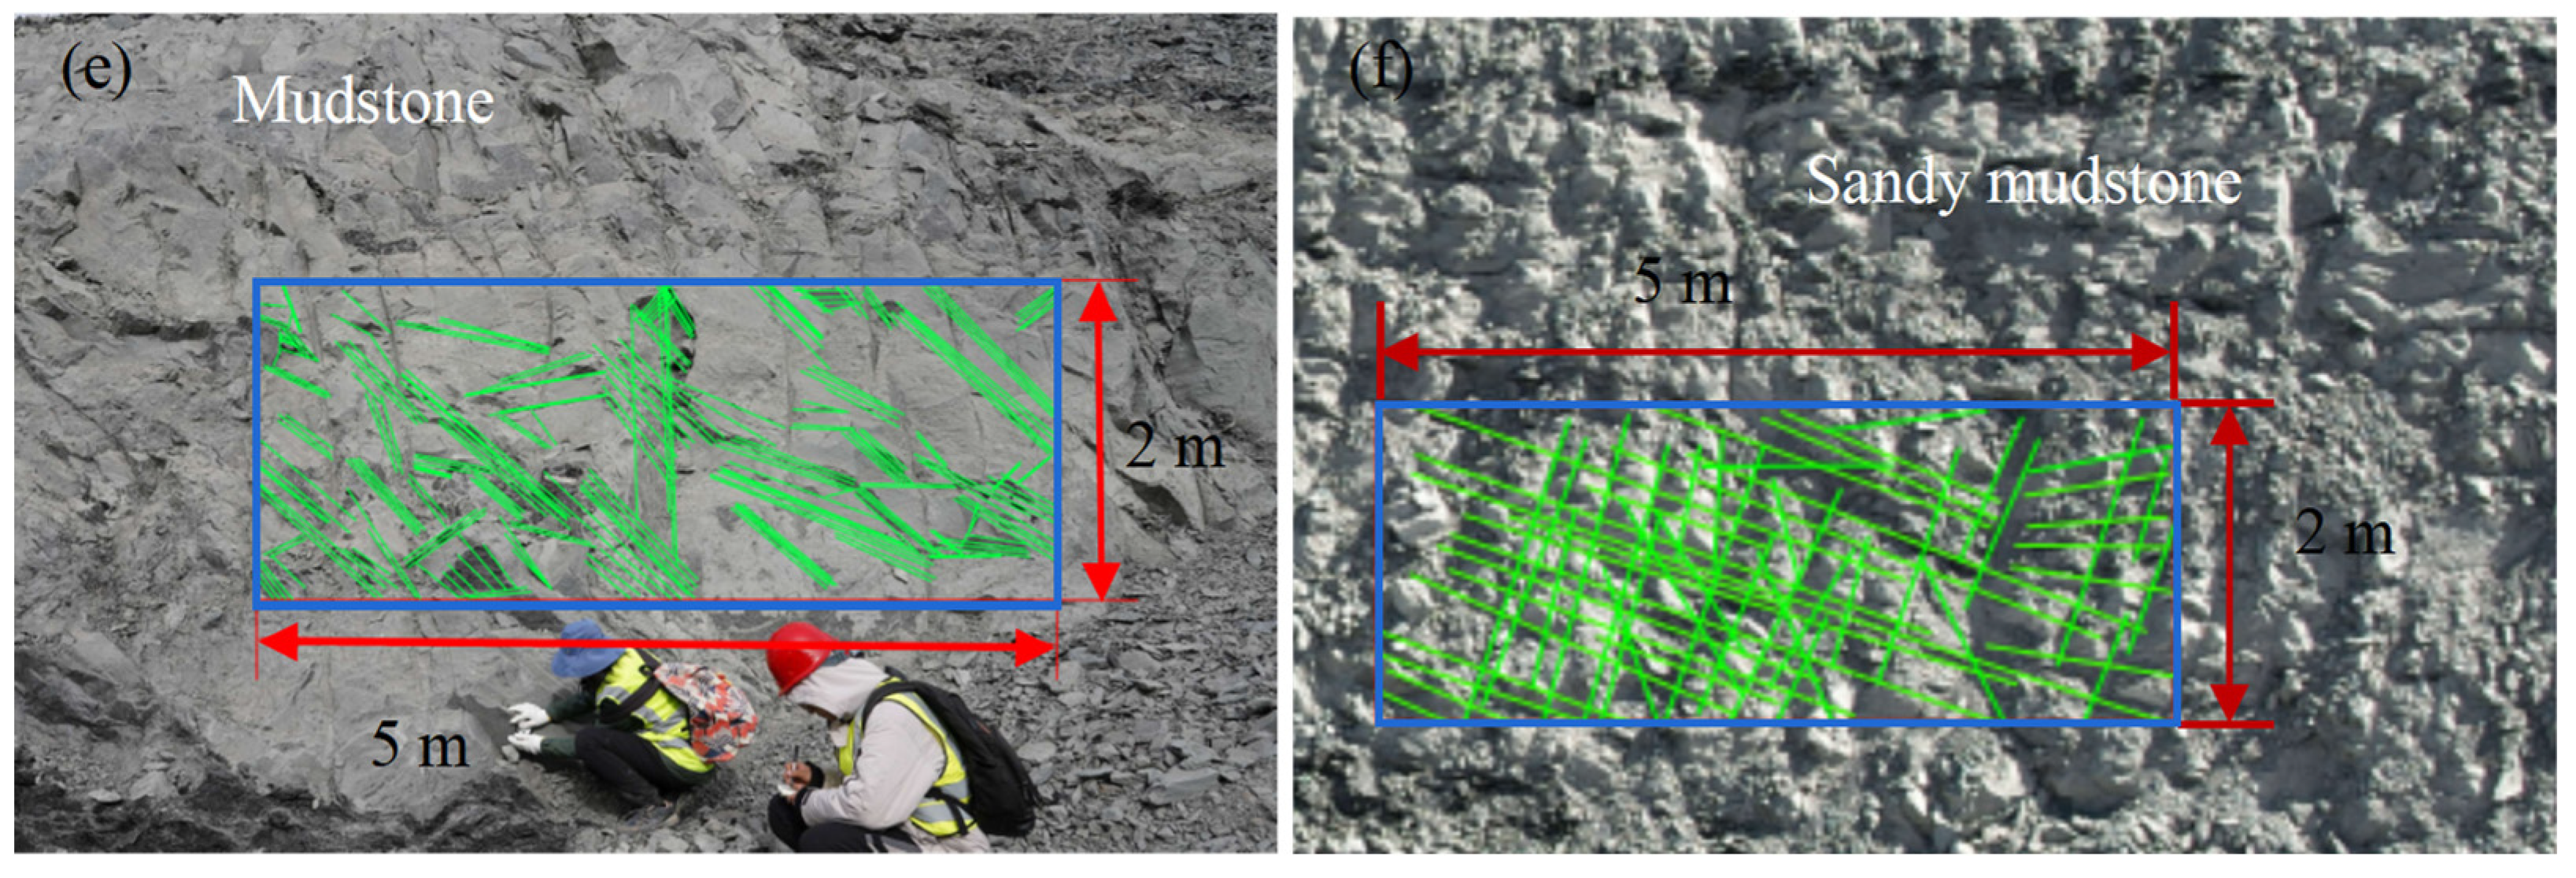
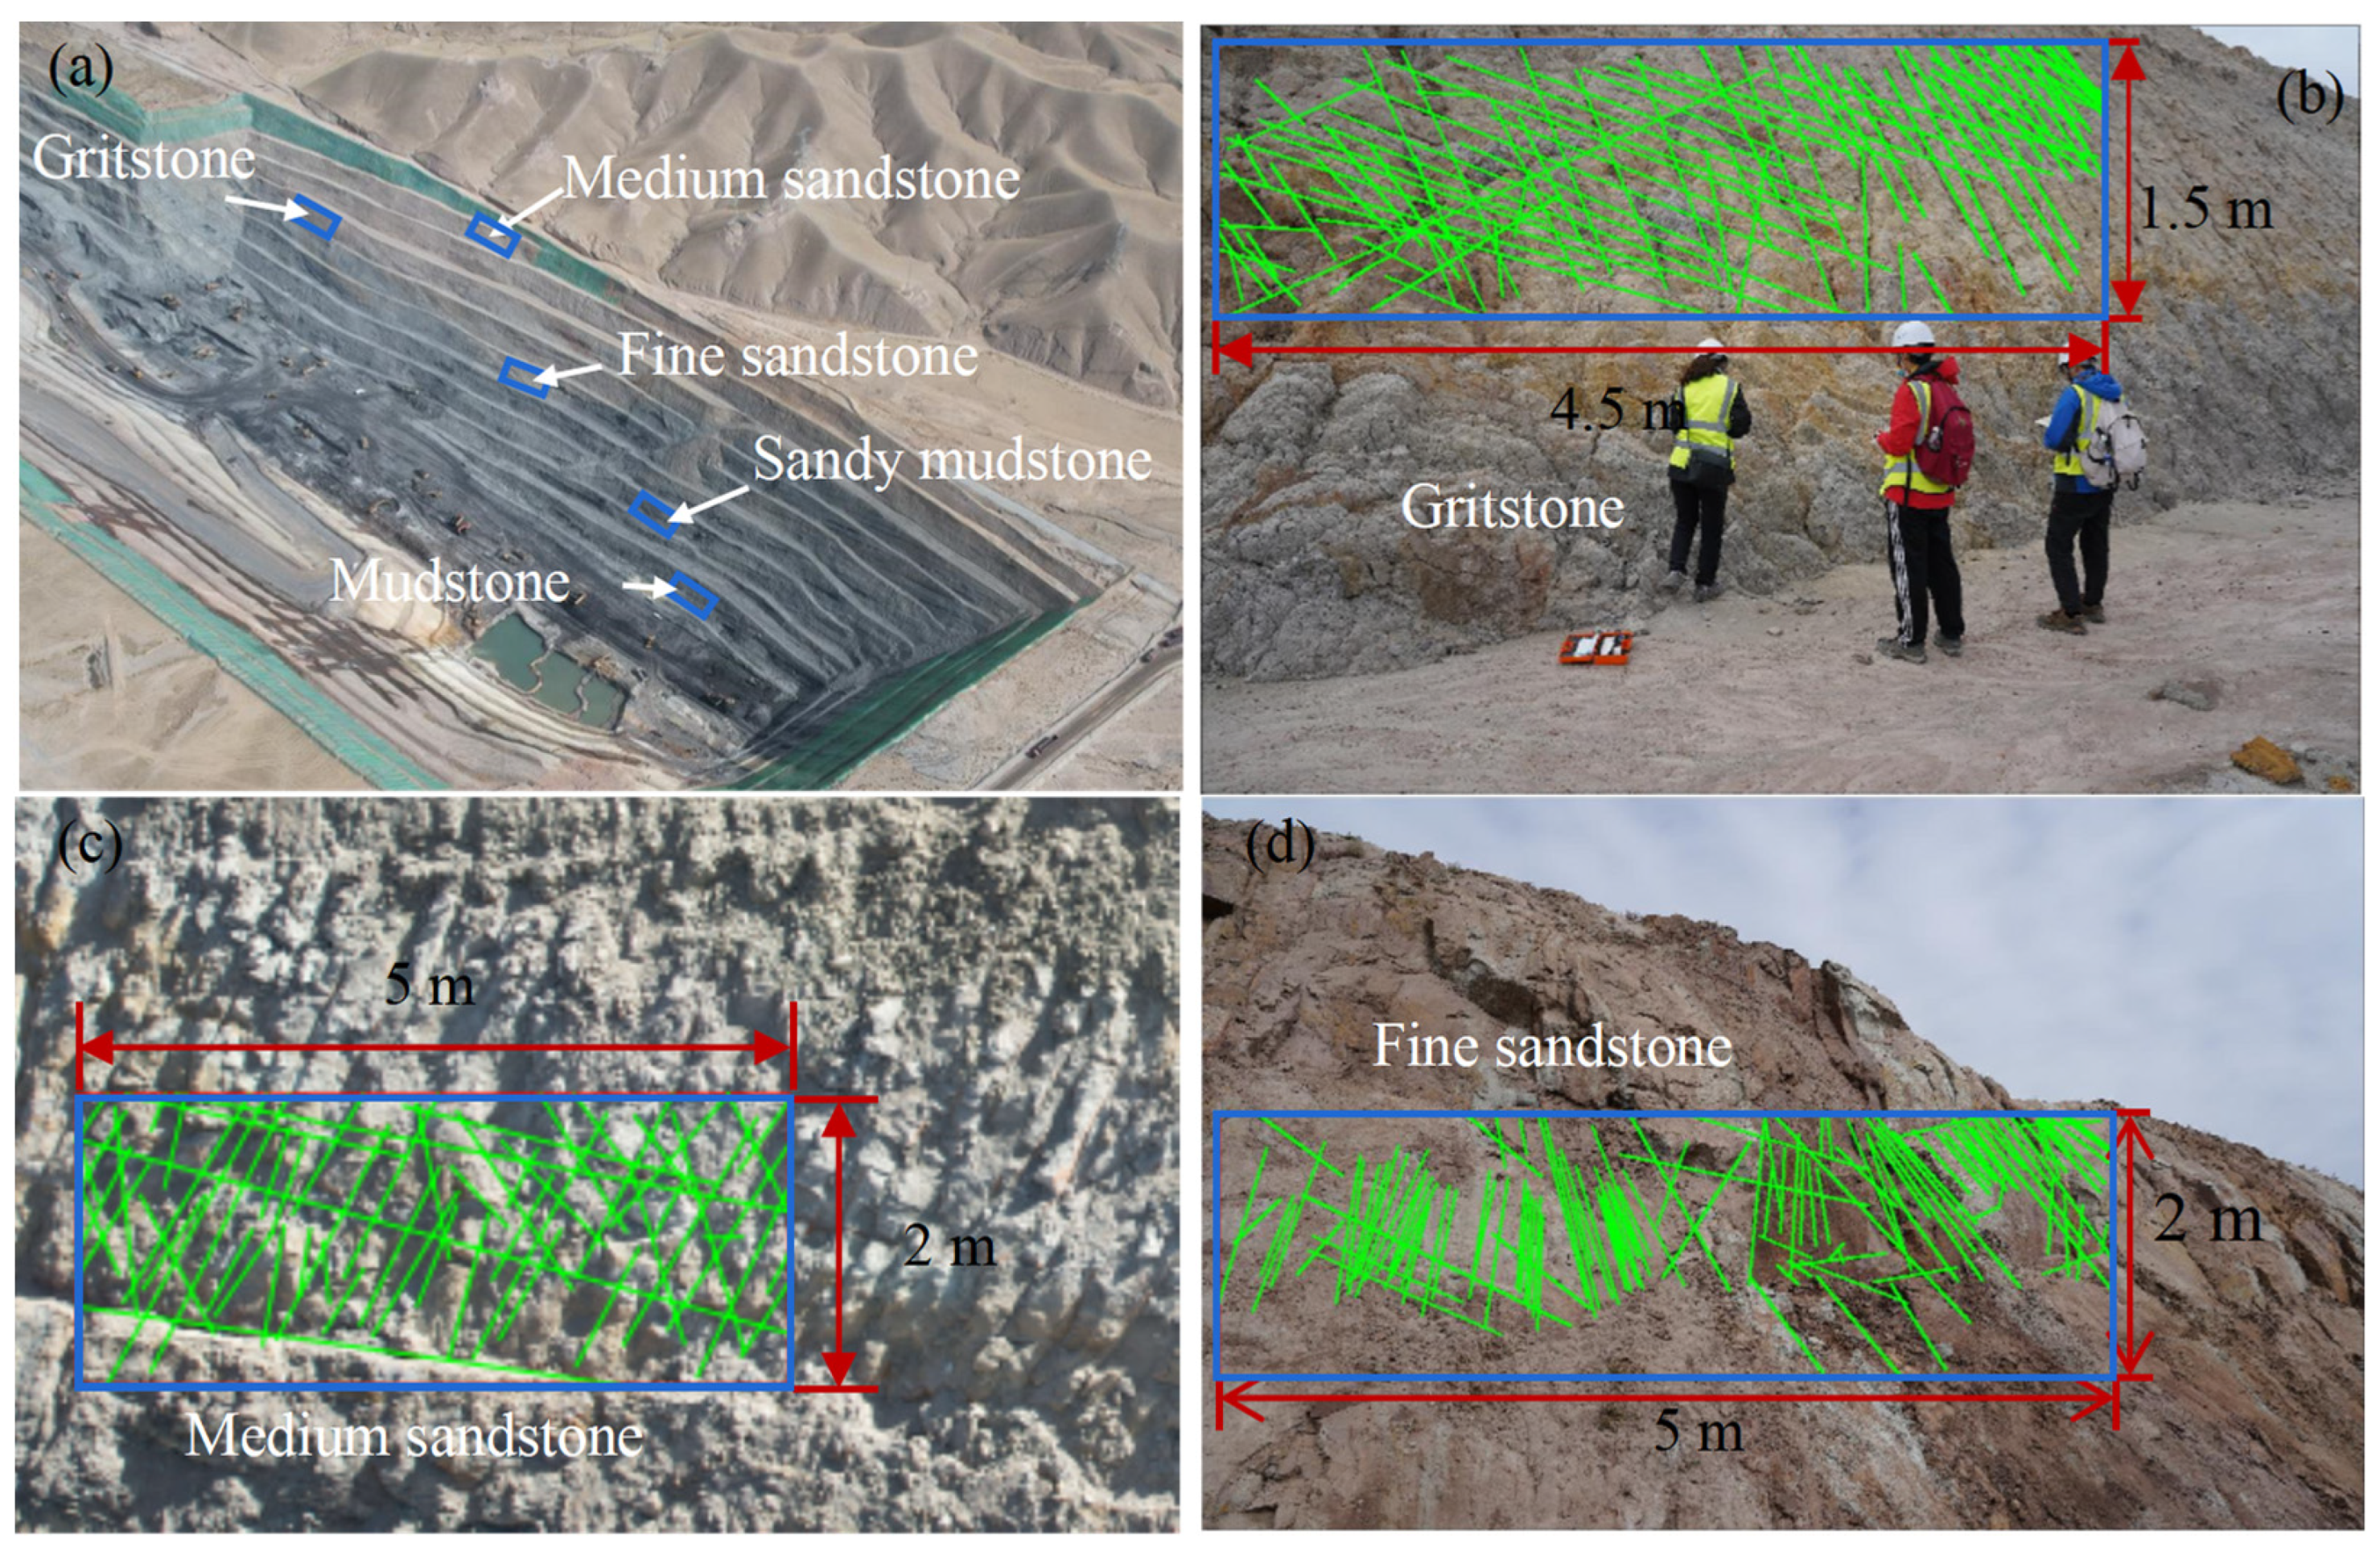
Figure 10.
(a) Distribution of fracture sampling windows; (b) Sampling window for gritstone; (c) Sampling window for medium sandstone; (d) Sampling window for fine sandstone; (e) Sampling window for mudstone; (f) Sampling window for sandy mudstone.
Figure 10.
(a) Distribution of fracture sampling windows; (b) Sampling window for gritstone; (c) Sampling window for medium sandstone; (d) Sampling window for fine sandstone; (e) Sampling window for mudstone; (f) Sampling window for sandy mudstone.
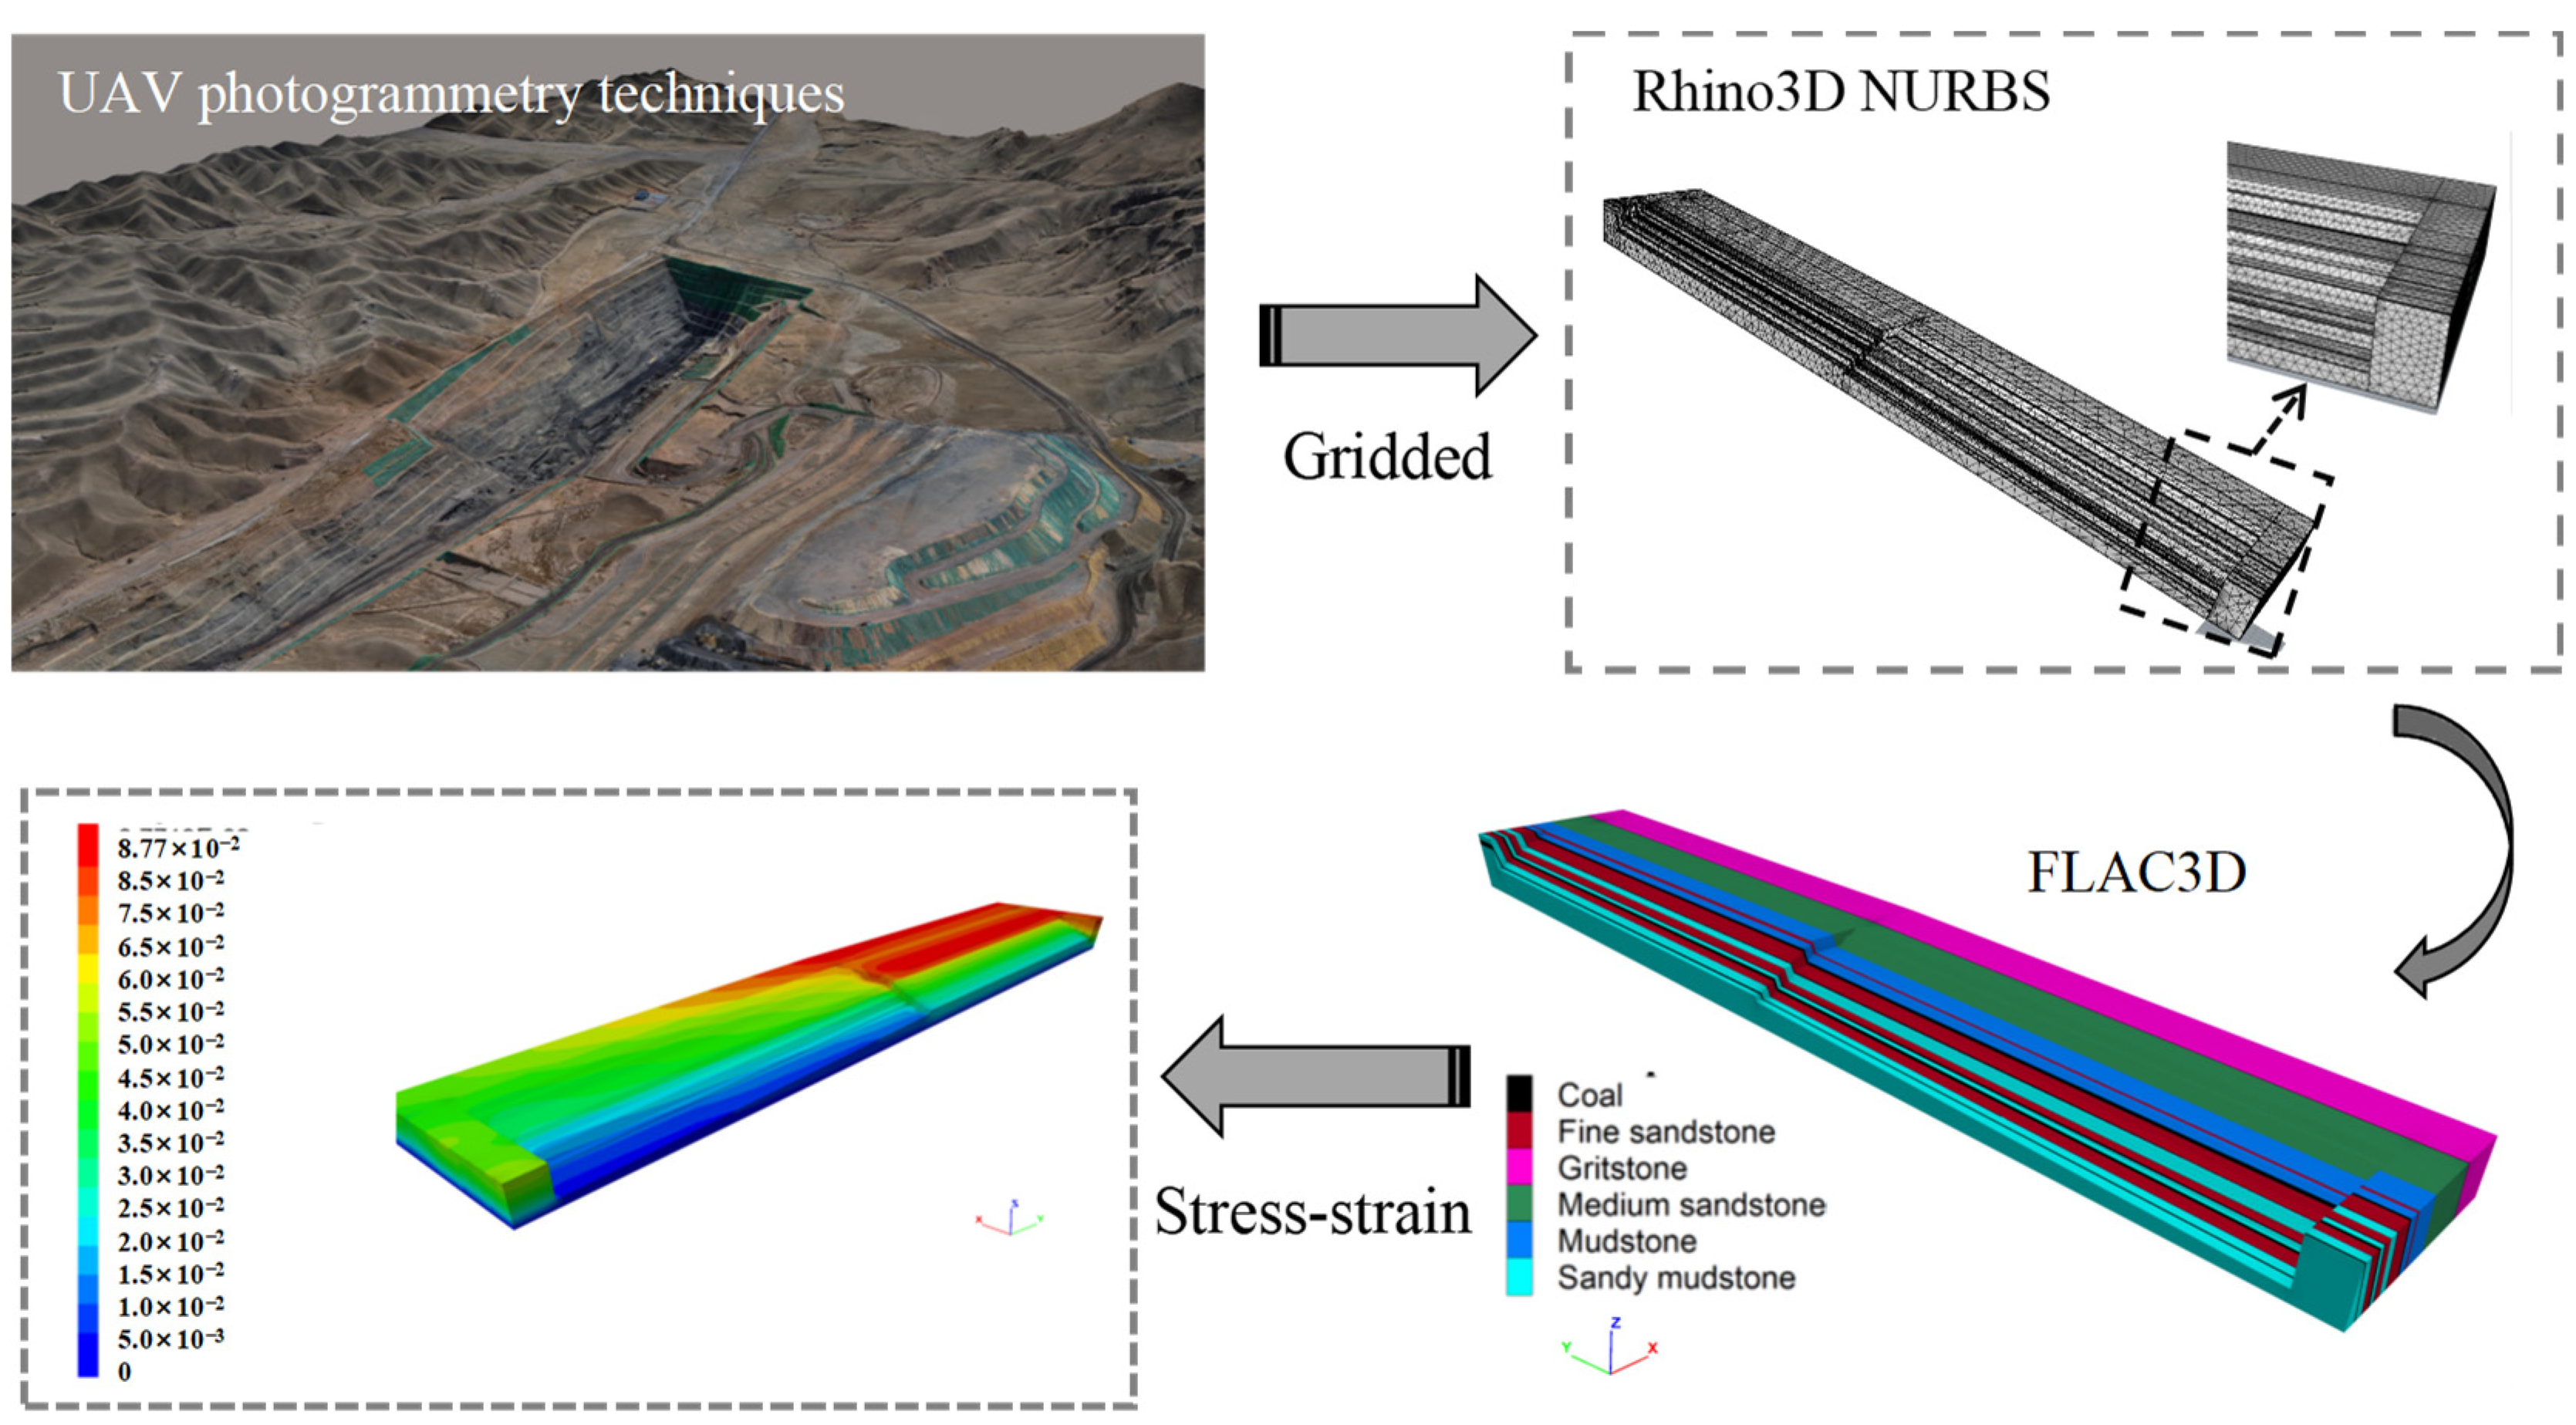
Figure 11.
Numerical simulation process based on Rhinoceros software and FLAC3D software.
Figure 11.
Numerical simulation process based on Rhinoceros software and FLAC3D software.
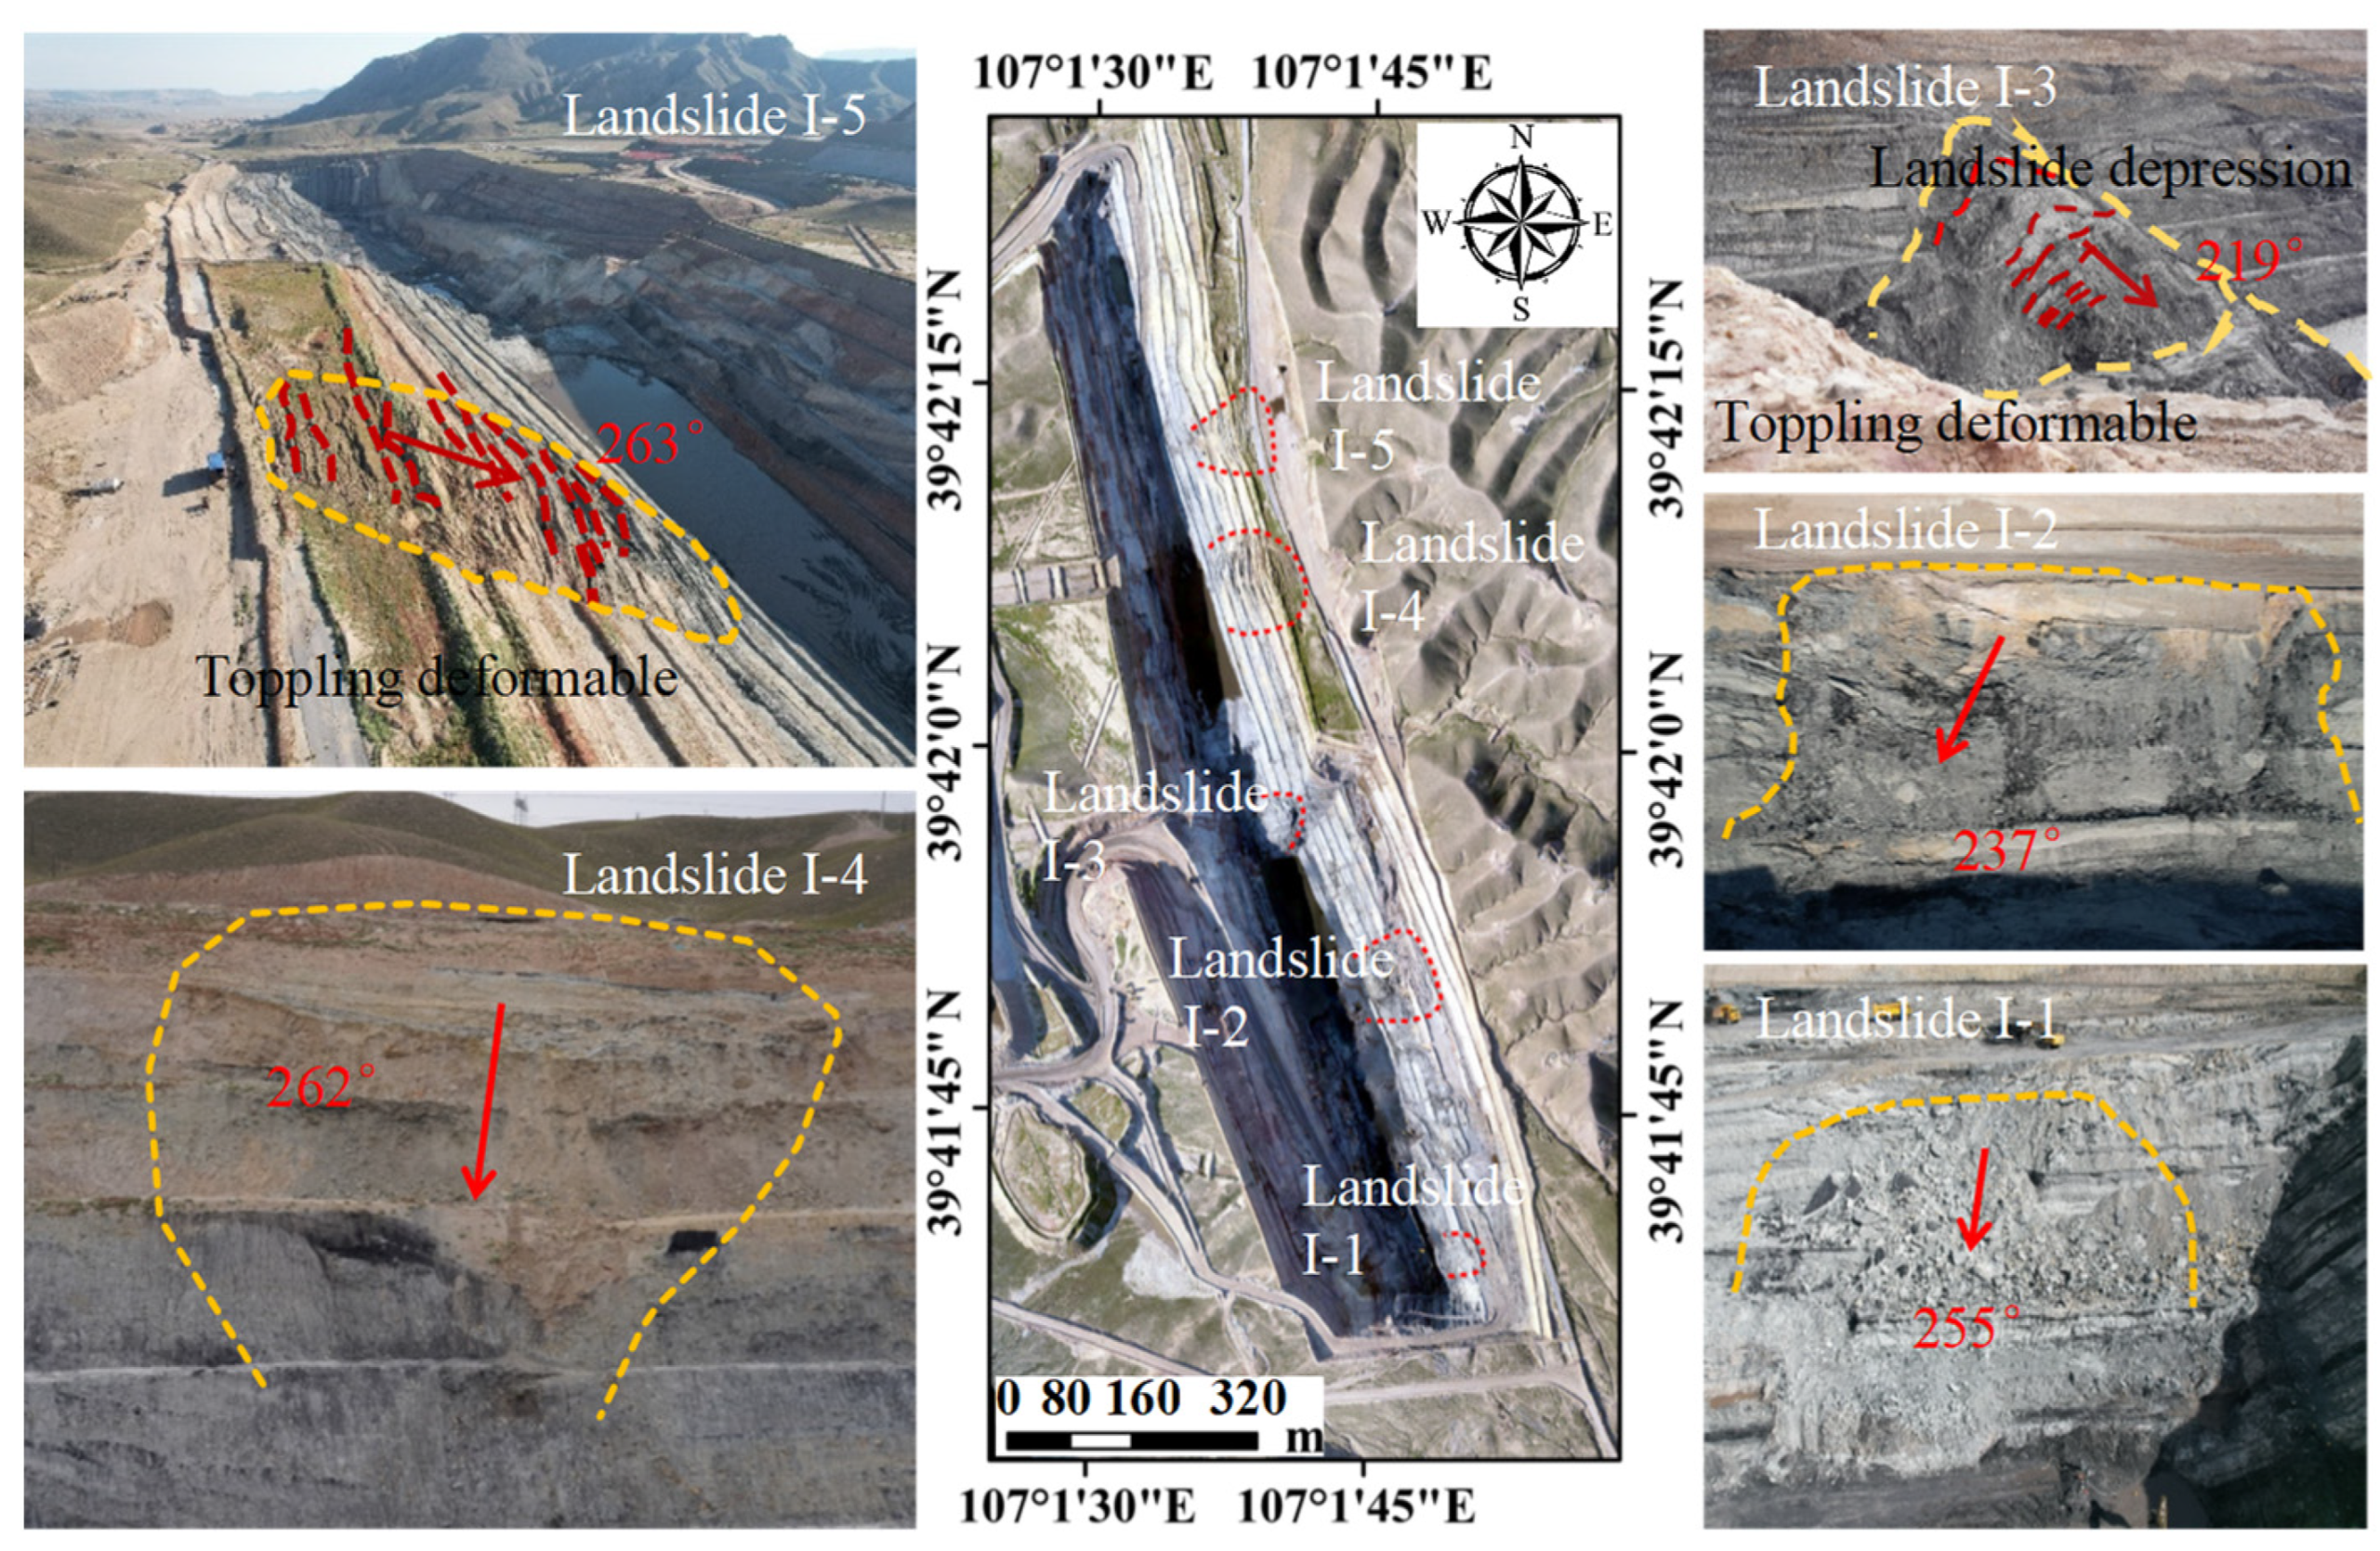
Figure 12.
Distribution map of landslide hazards (September 2022).
Figure 12.
Distribution map of landslide hazards (September 2022).
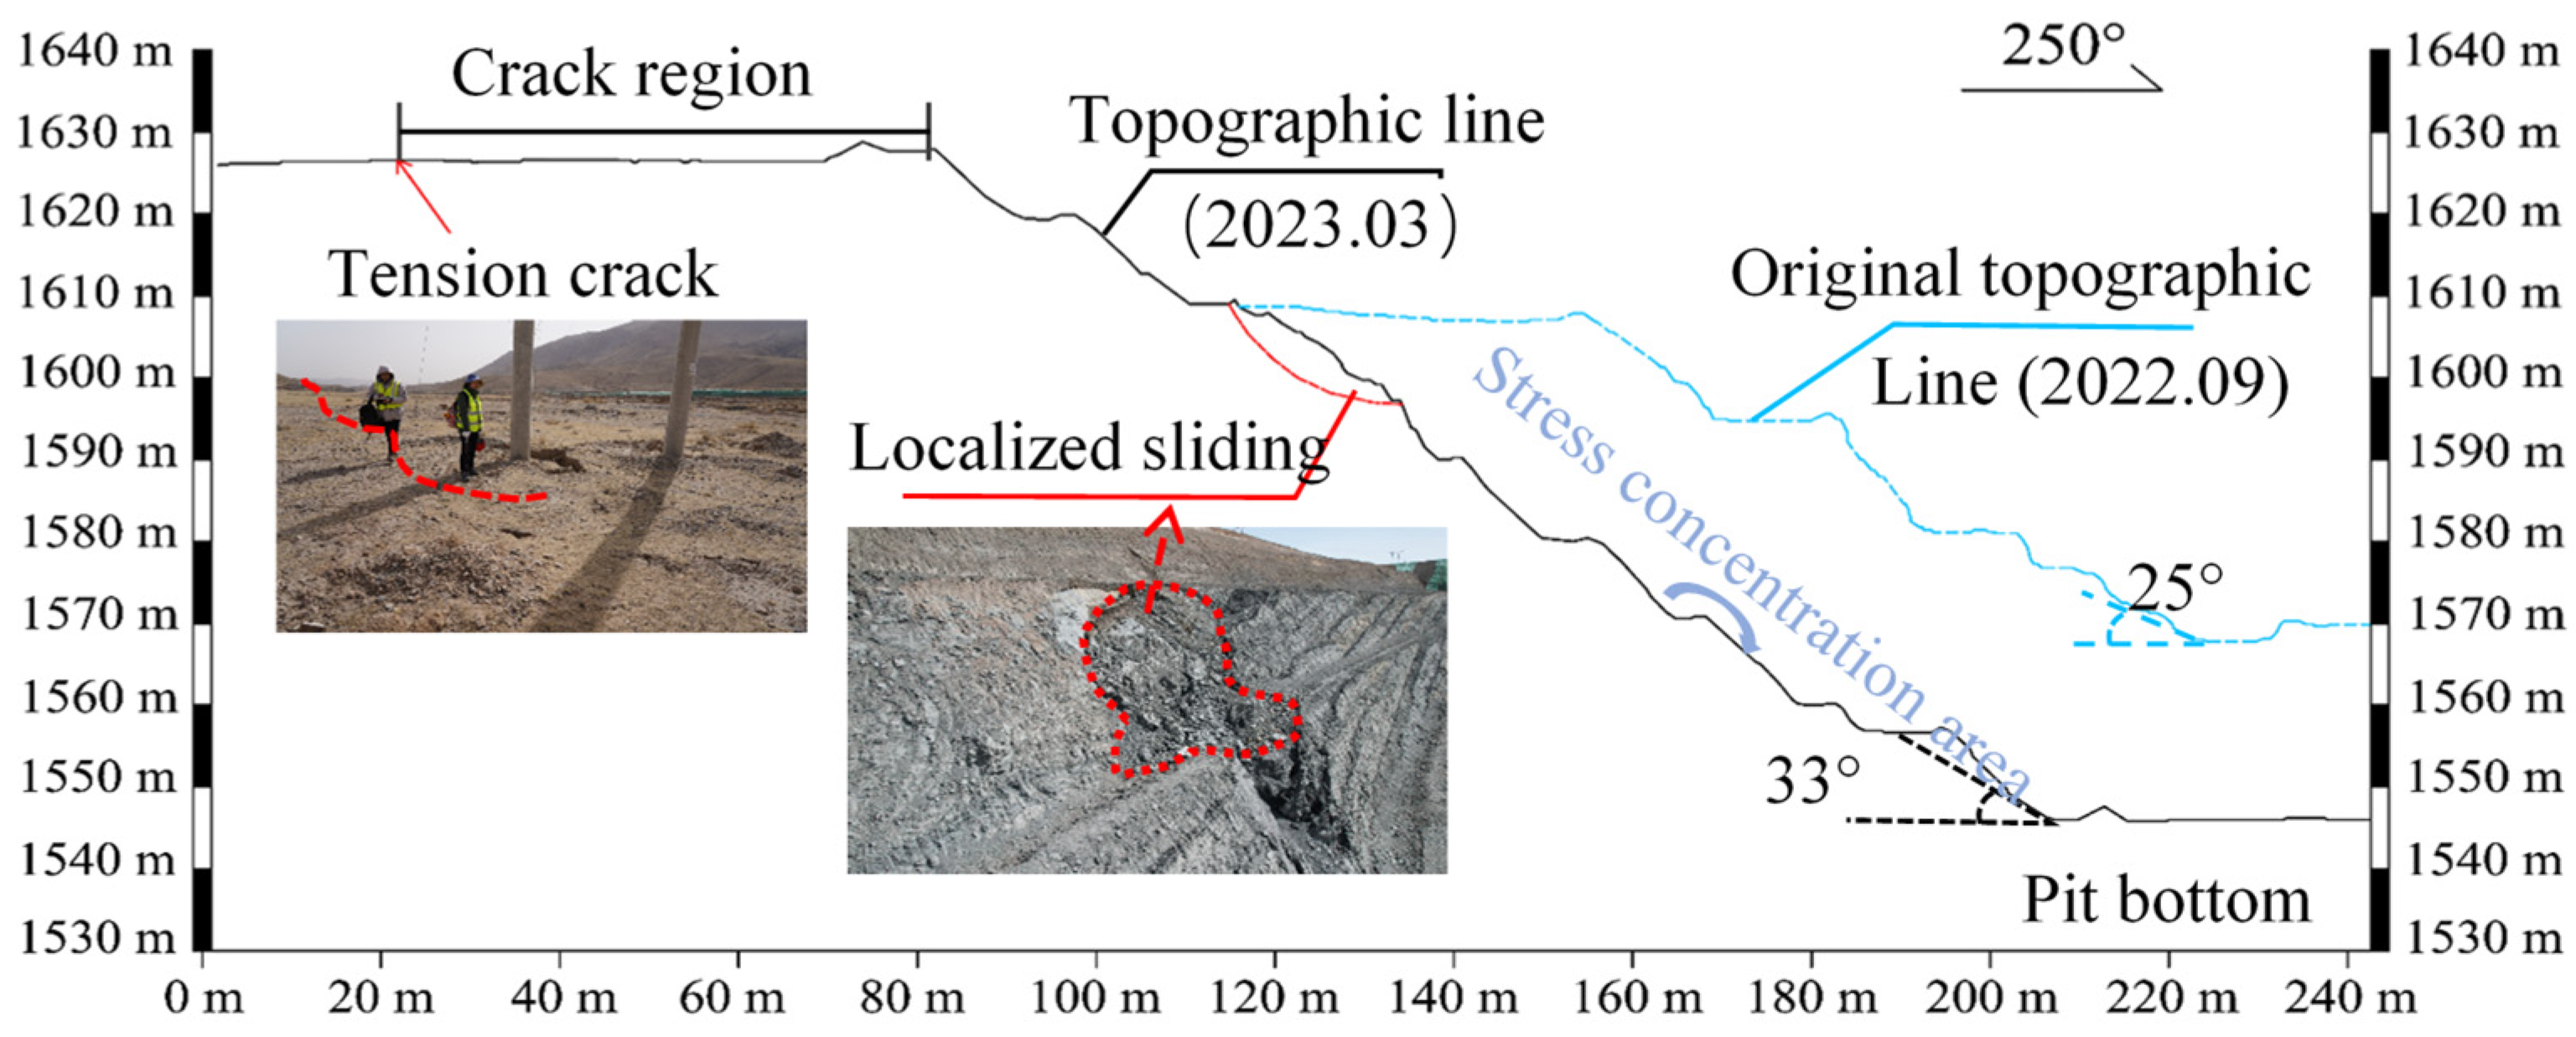
Figure 13.
Topographic line of the Wolong open-pit coal mine from September 2022 to March 2023.
Figure 13.
Topographic line of the Wolong open-pit coal mine from September 2022 to March 2023.
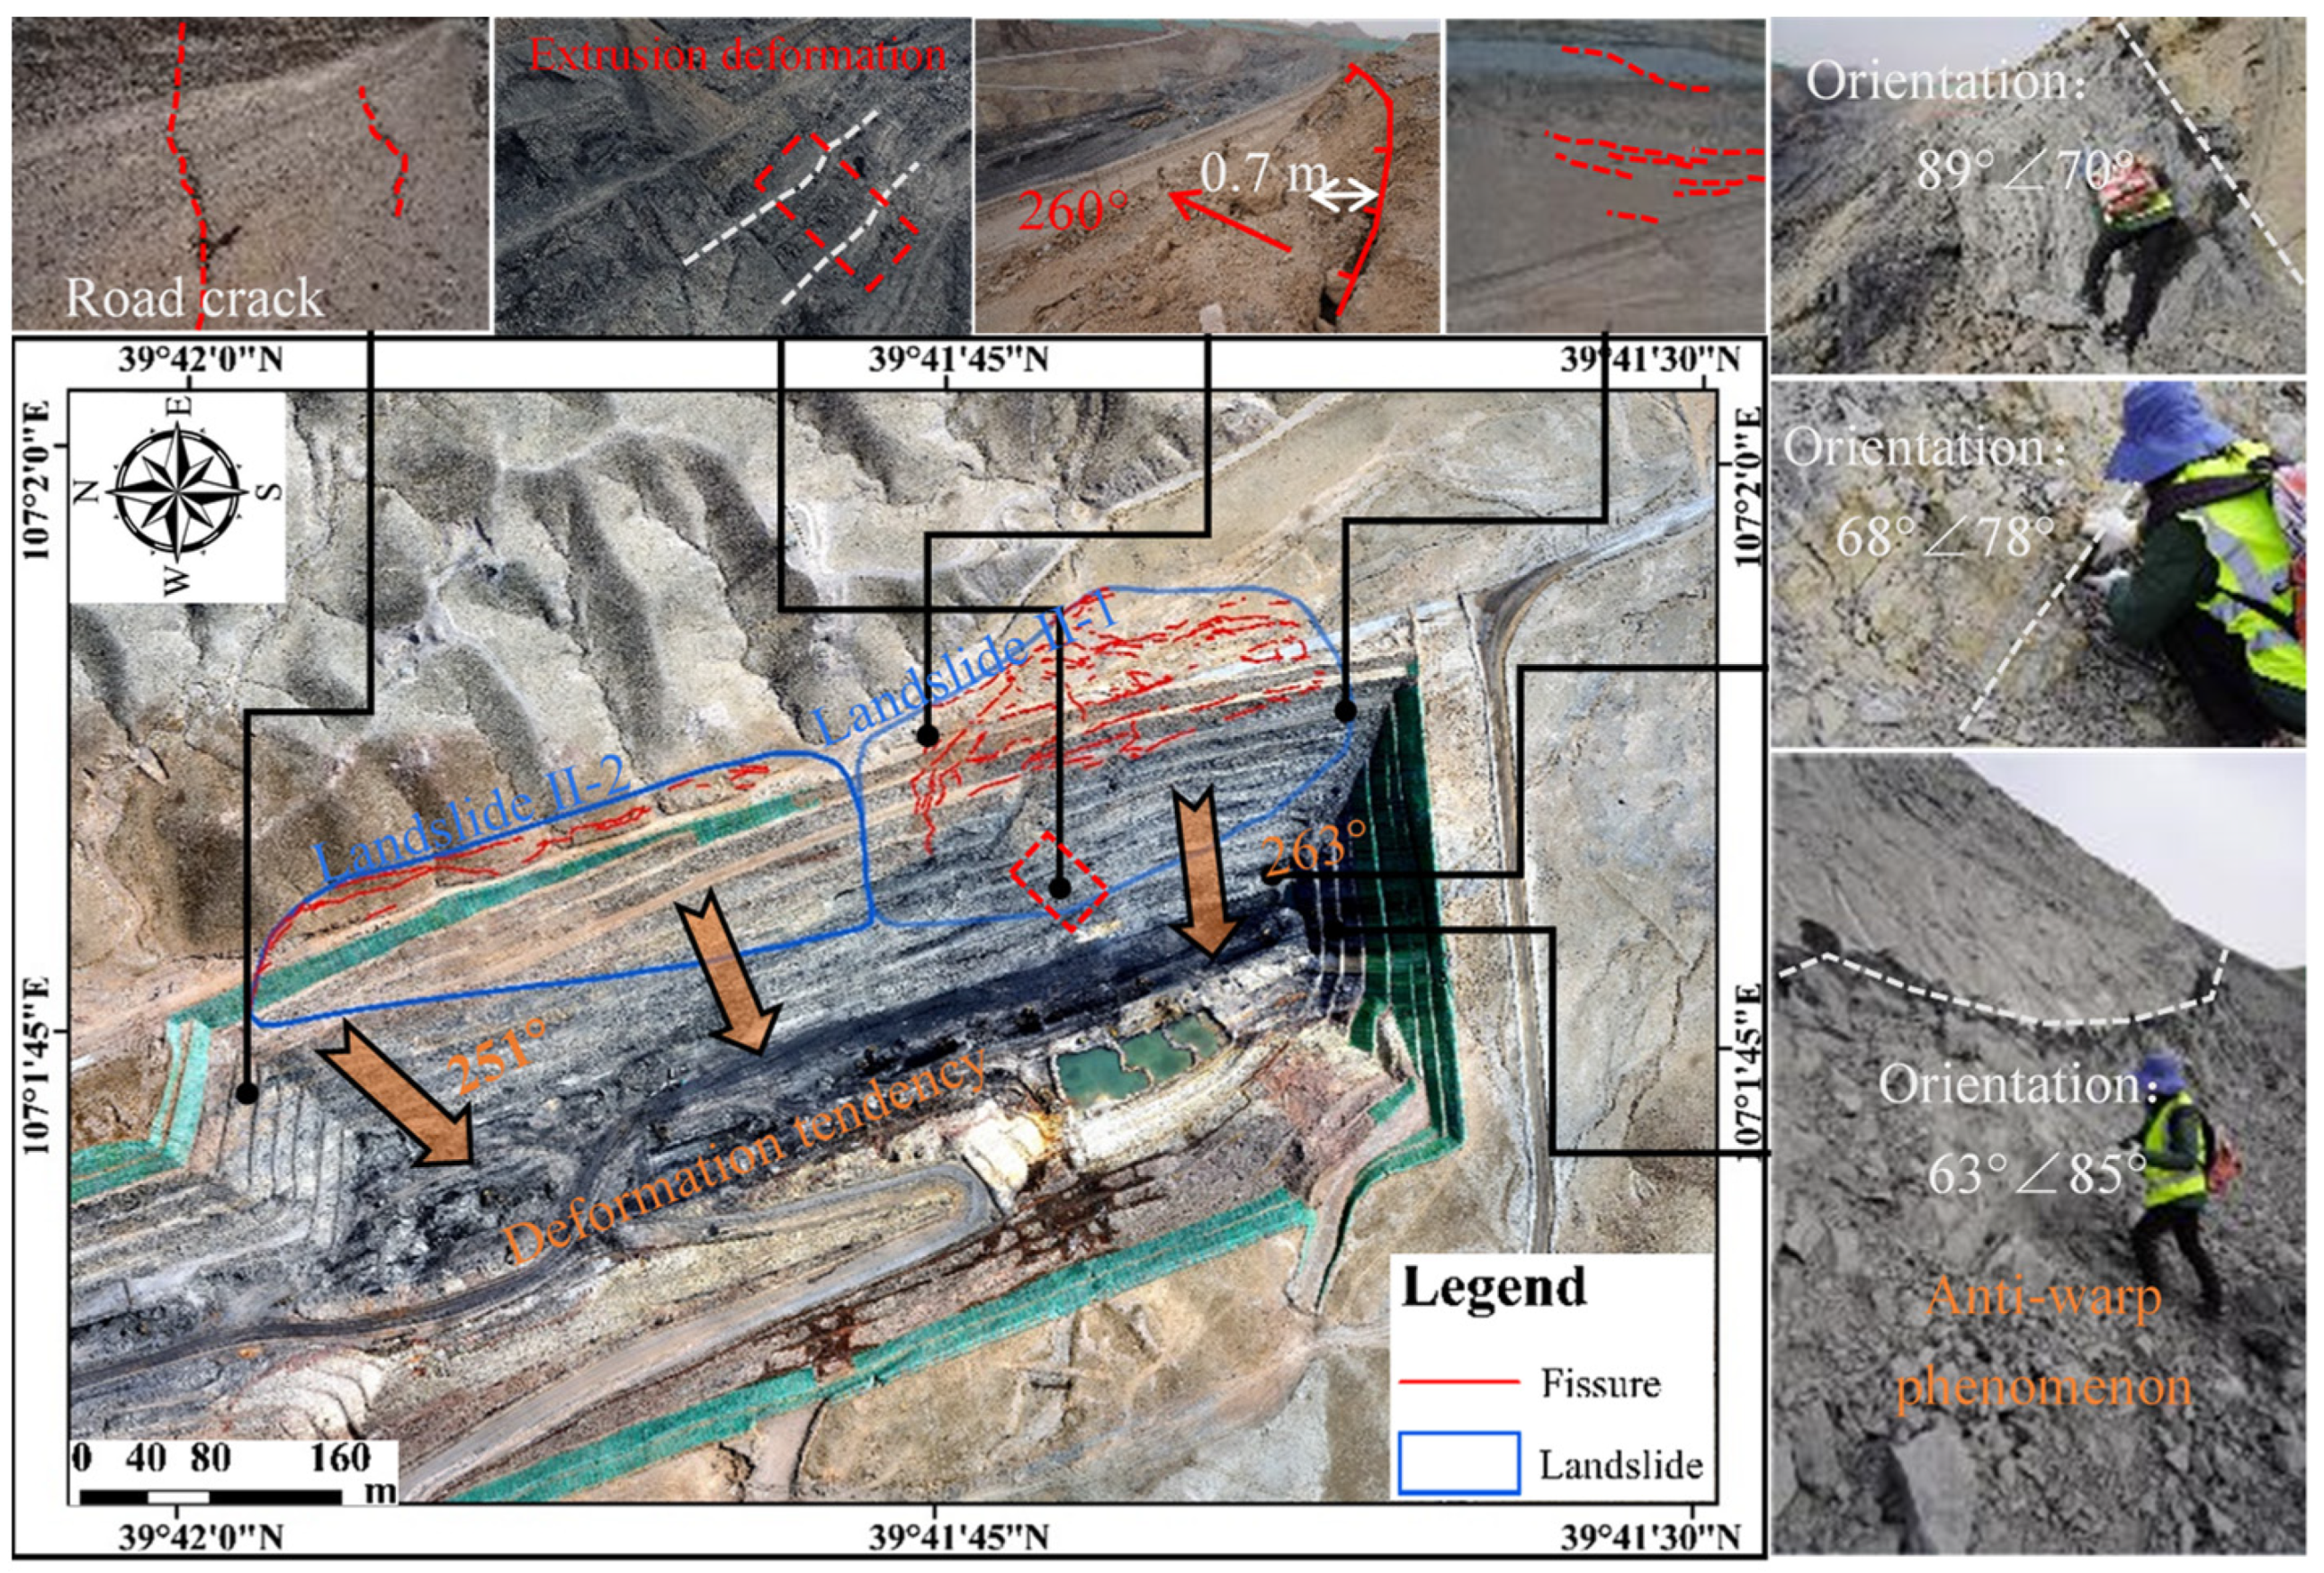
Figure 14.
Deformation development characteristics of the eastern pit slope (March 2023).
Figure 14.
Deformation development characteristics of the eastern pit slope (March 2023).
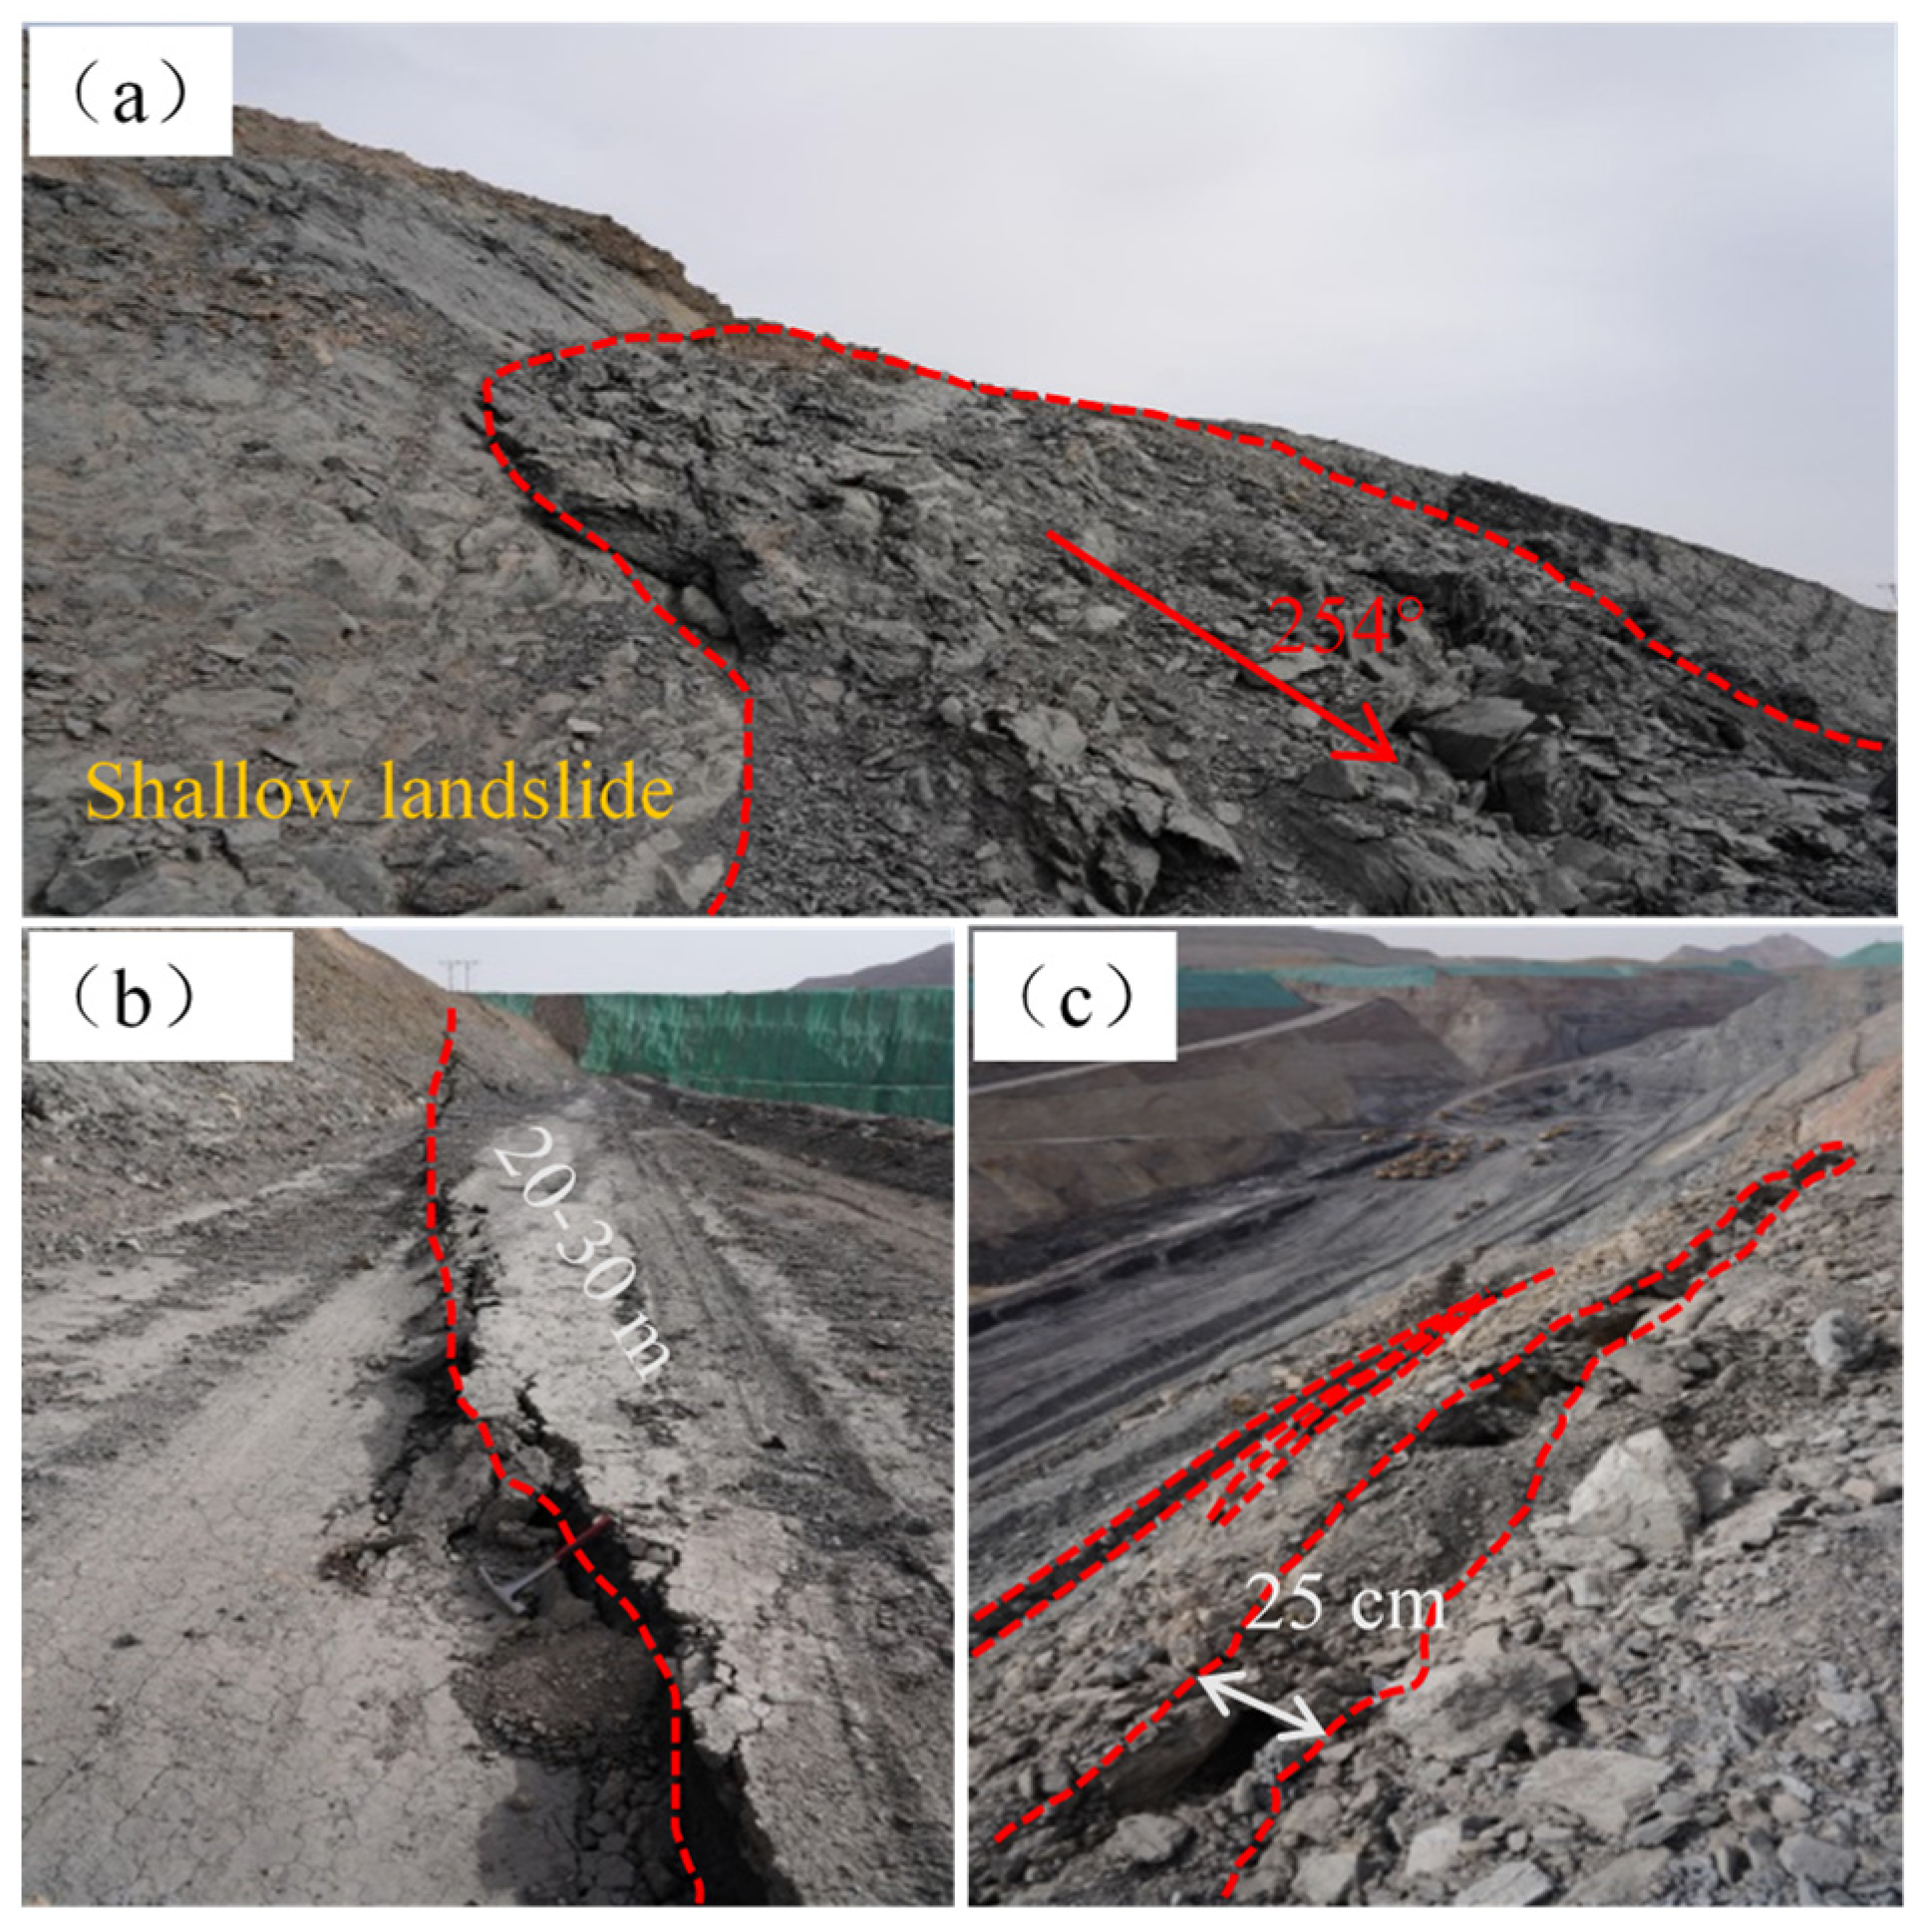
Figure 15.
Deformation characteristics of the pit slope: (a) Shallow landslide; (b,c) Tension fissure in the mining benches.
Figure 15.
Deformation characteristics of the pit slope: (a) Shallow landslide; (b,c) Tension fissure in the mining benches.
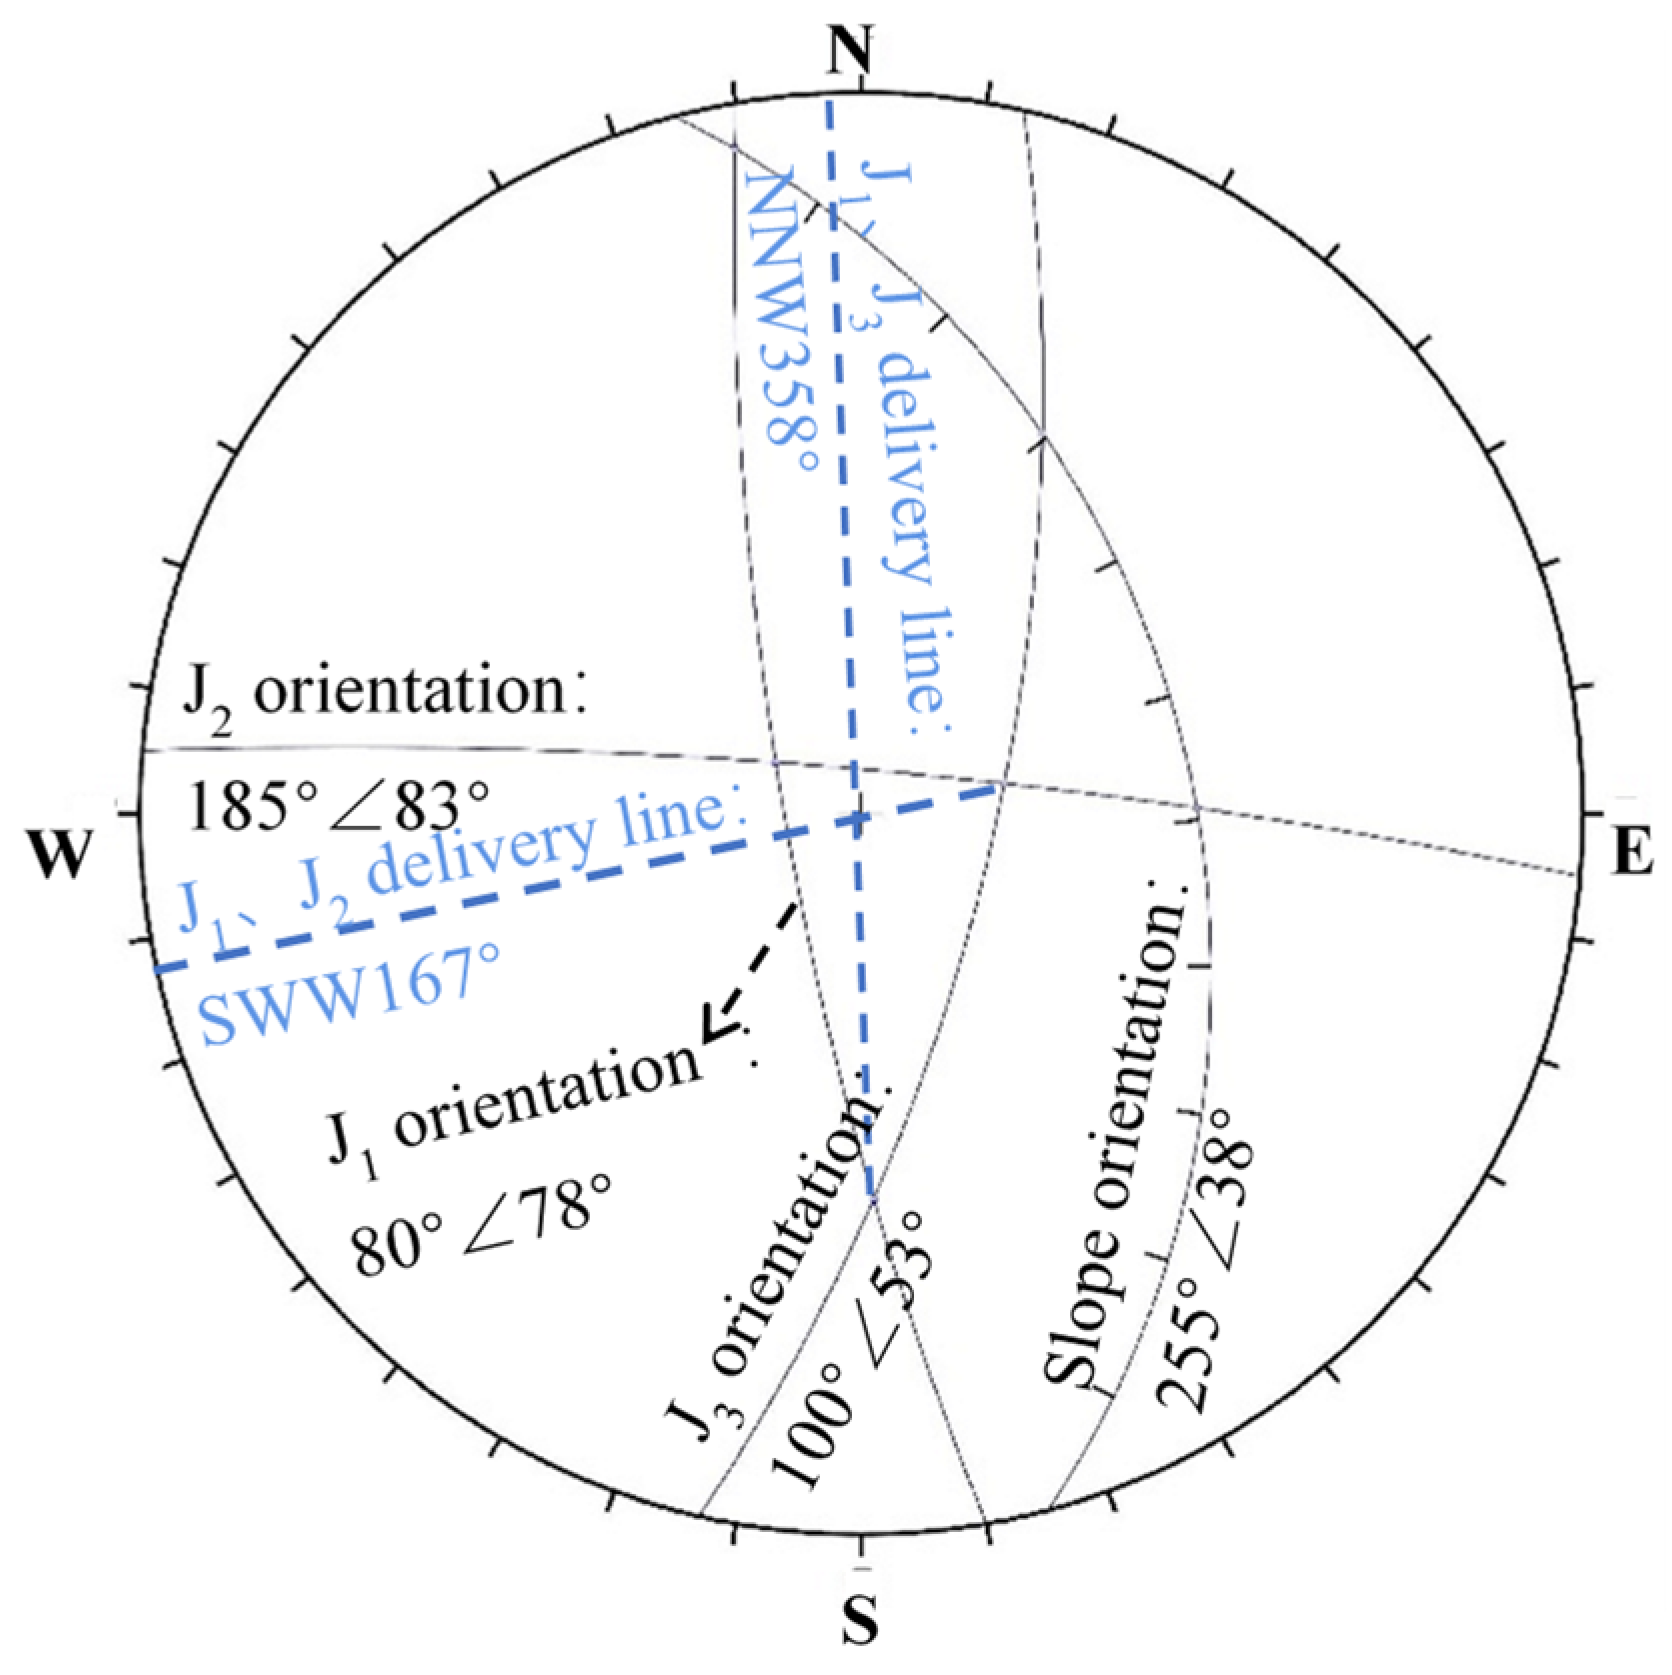
Figure 16.
Stereographic projection of the rock discontinuities in the Wolong open-pit coal mine.
Figure 16.
Stereographic projection of the rock discontinuities in the Wolong open-pit coal mine.
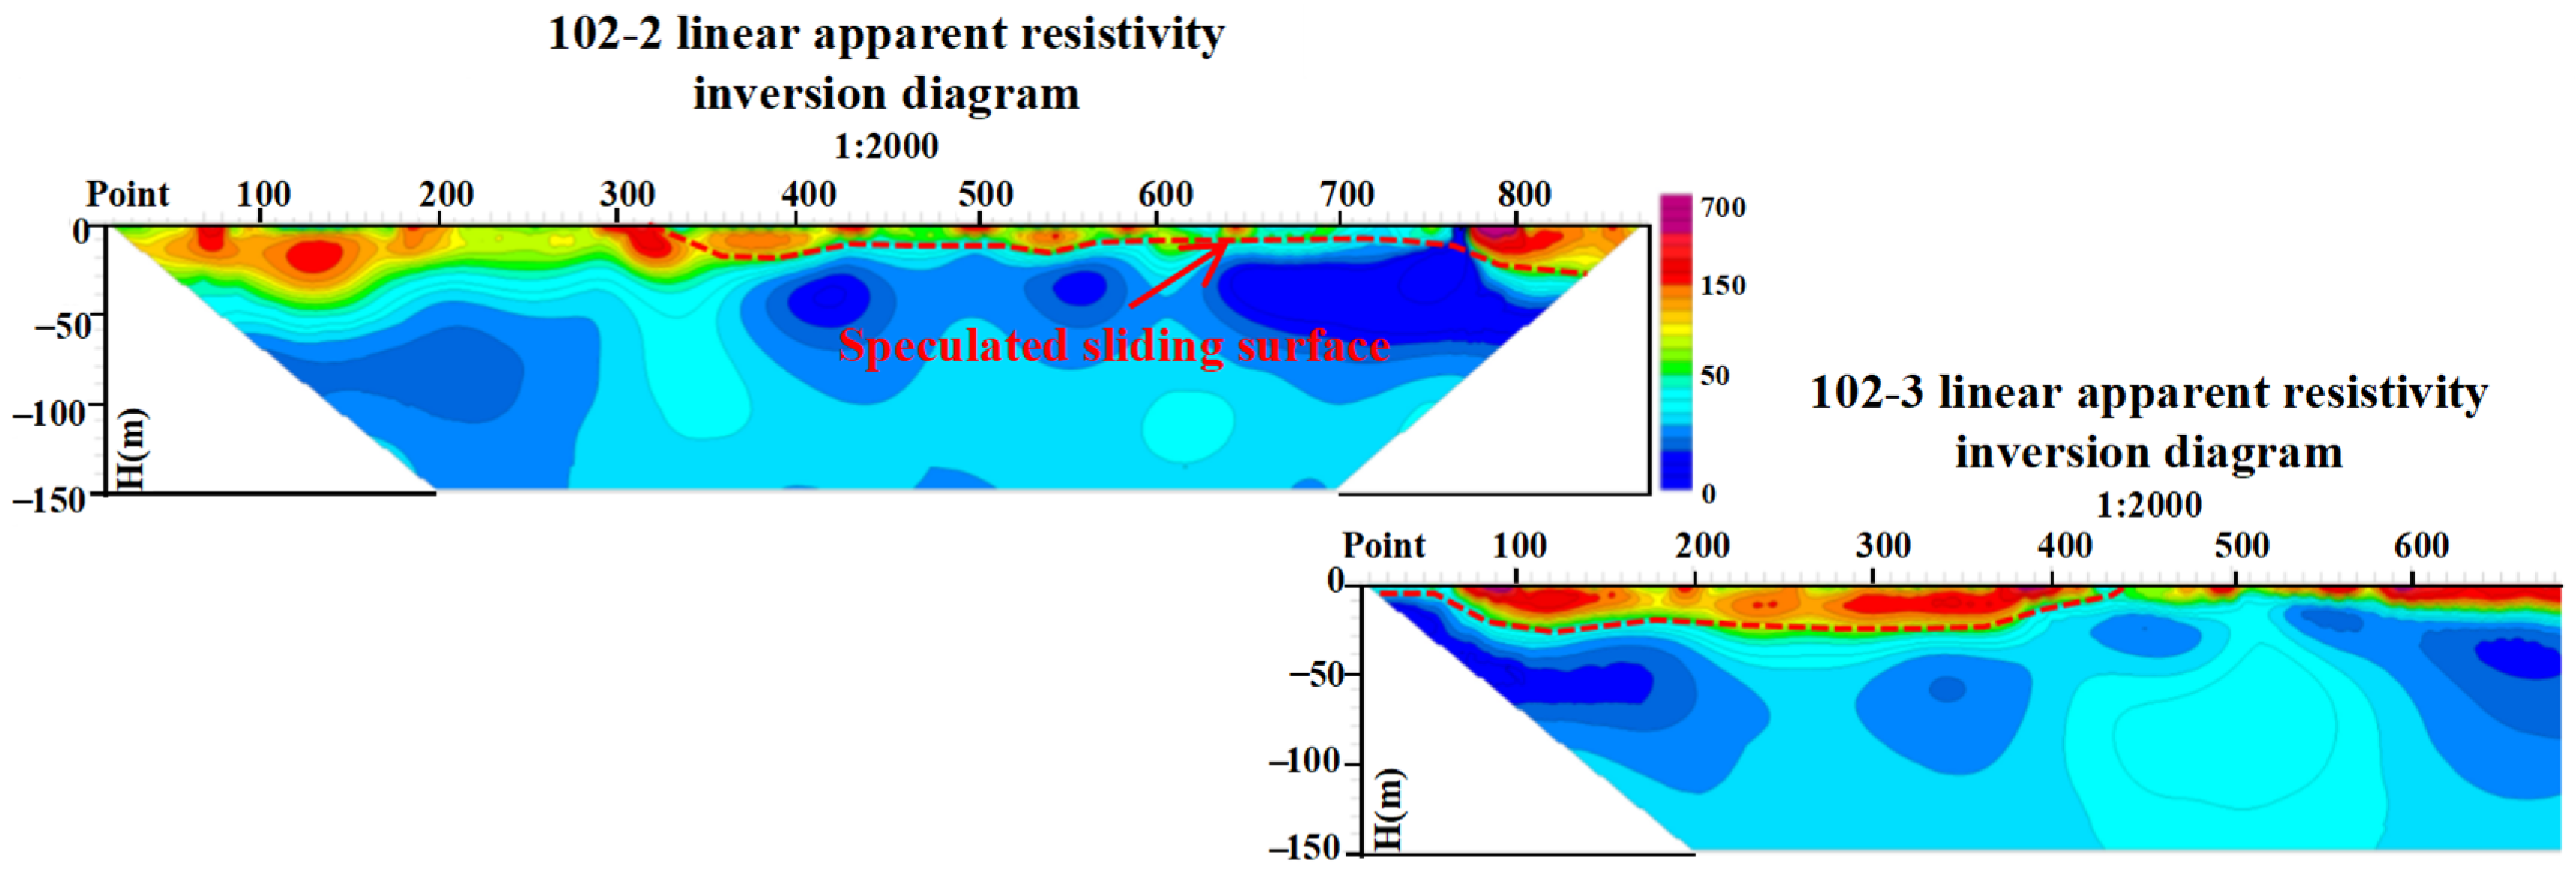
Figure 17.
Inversion diagram of the apparent resistivity of Line 102 by the ERT method (see
Figure 7 for profile locations).
Figure 17.
Inversion diagram of the apparent resistivity of Line 102 by the ERT method (see
Figure 7 for profile locations).
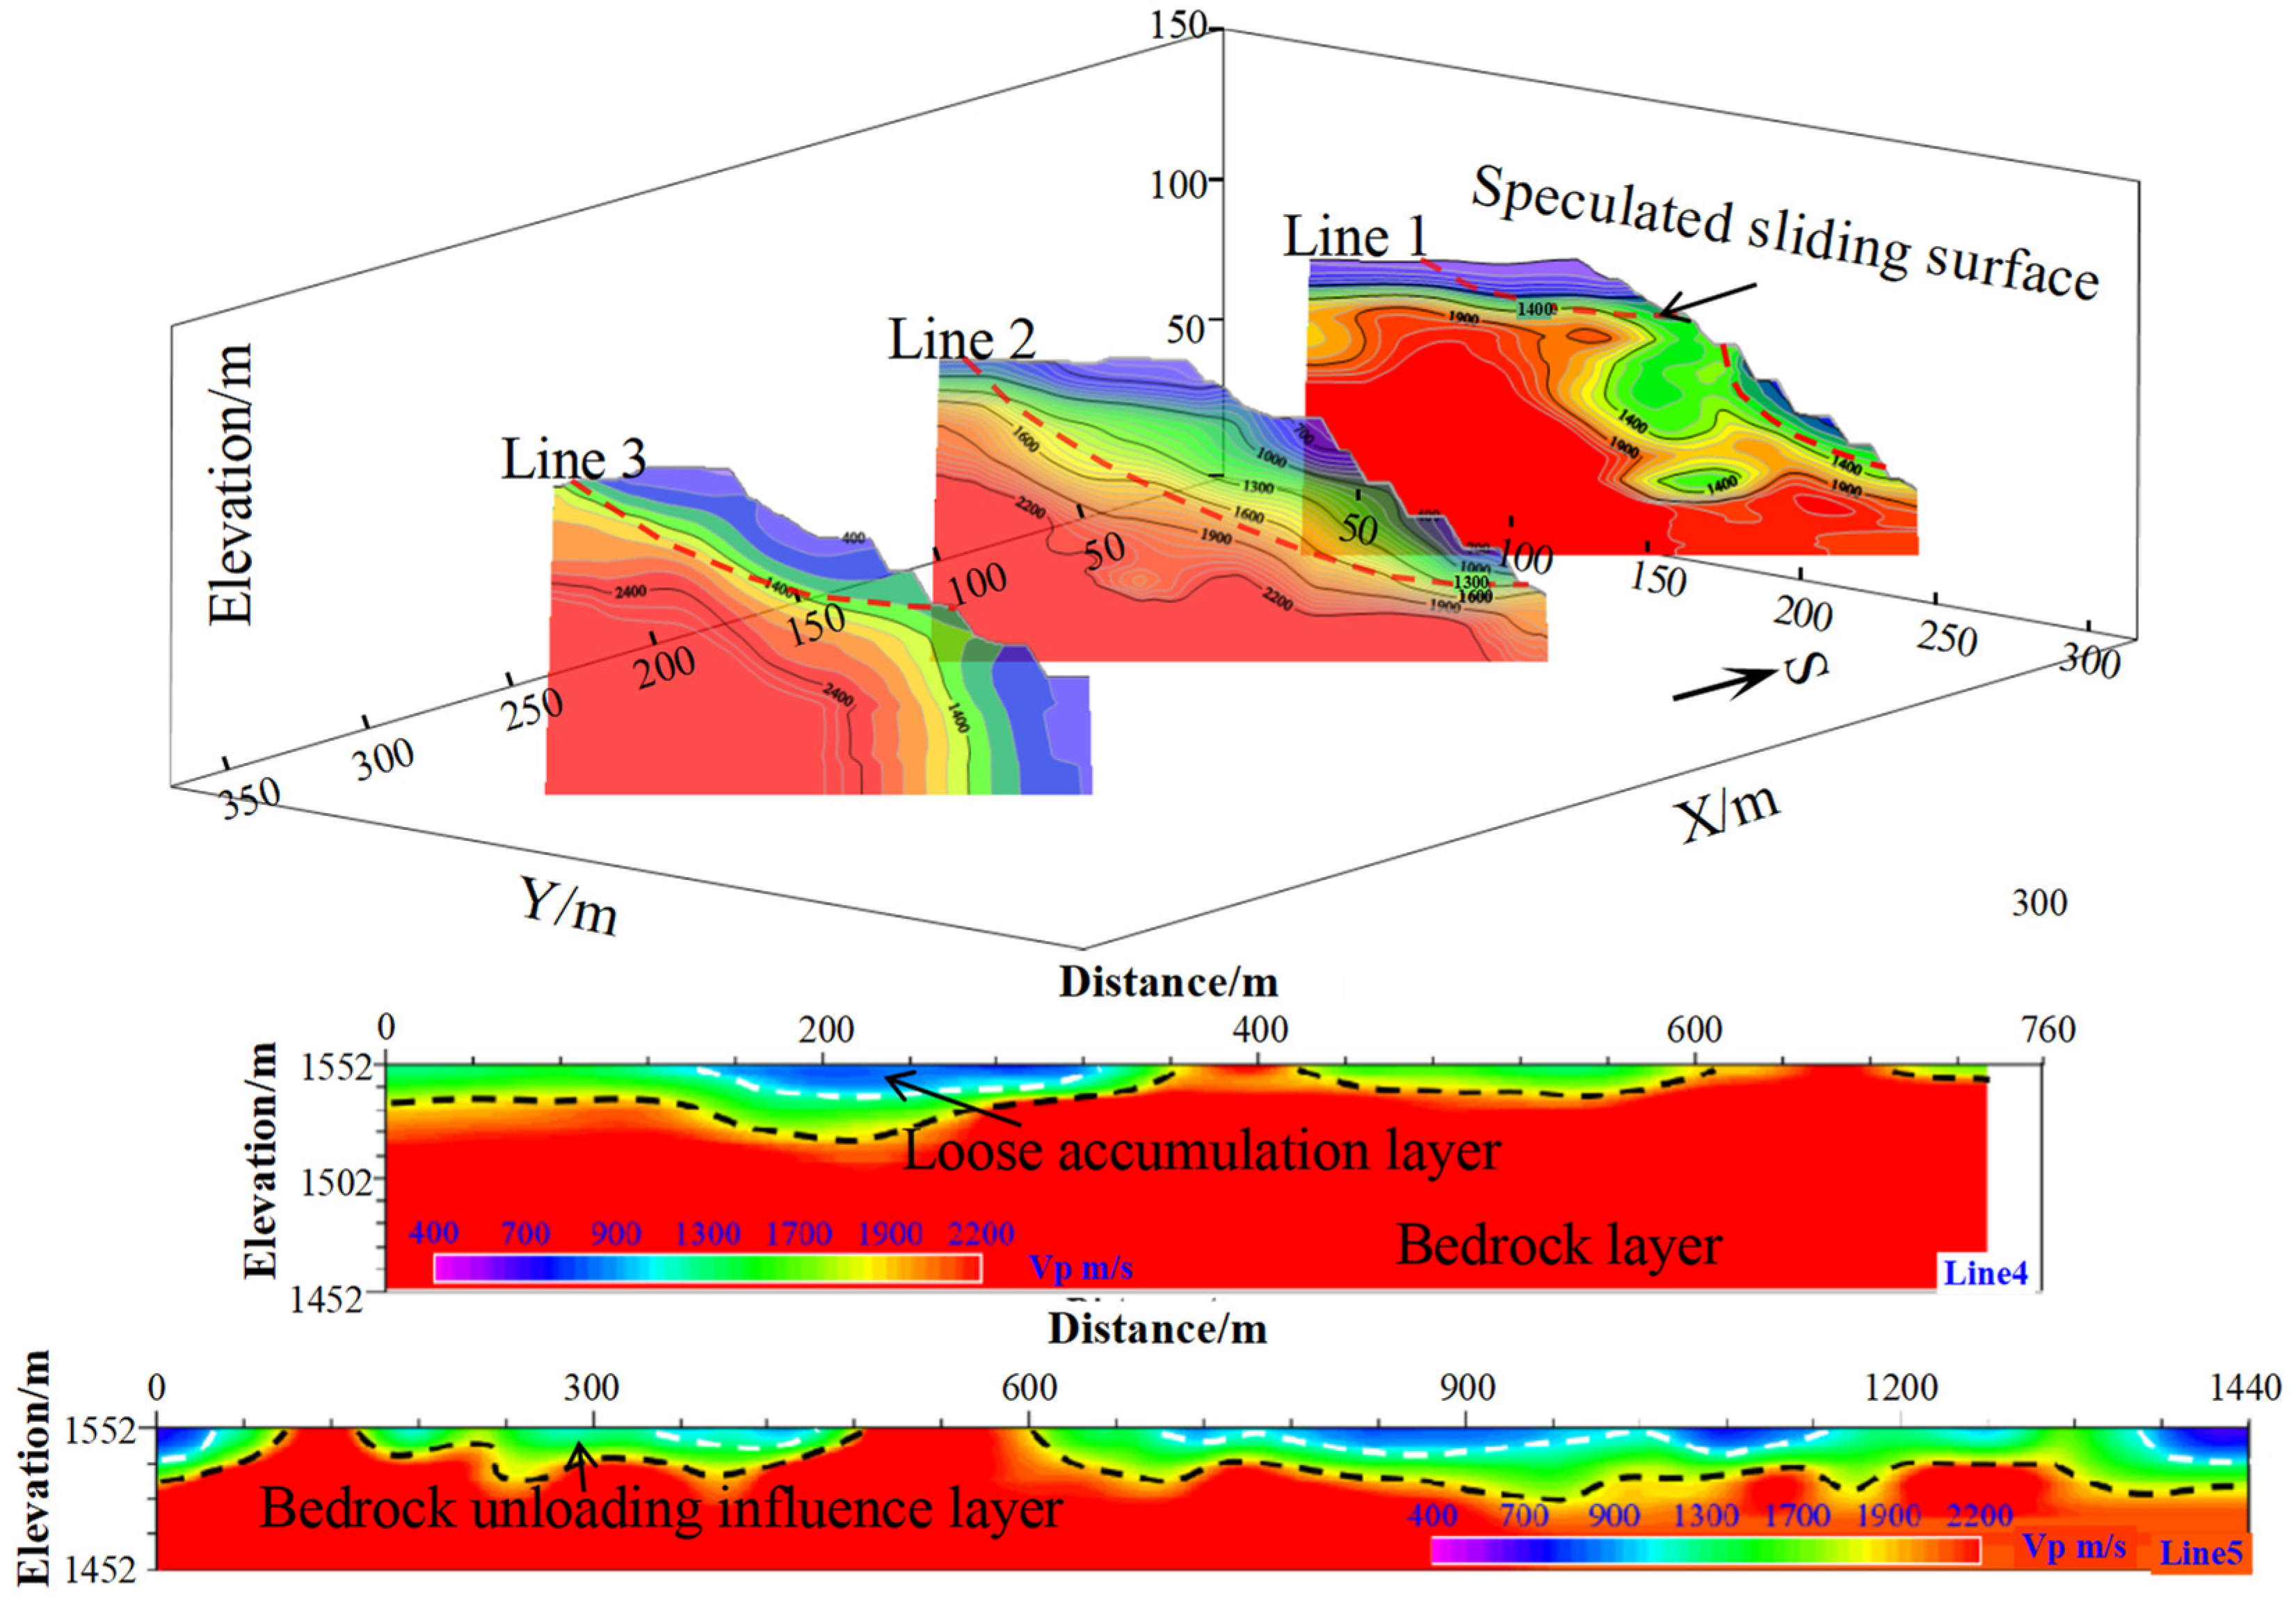
Figure 18.
Interpretation results by the SRT method (see
Figure 7 for profile locations).
Figure 18.
Interpretation results by the SRT method (see
Figure 7 for profile locations).
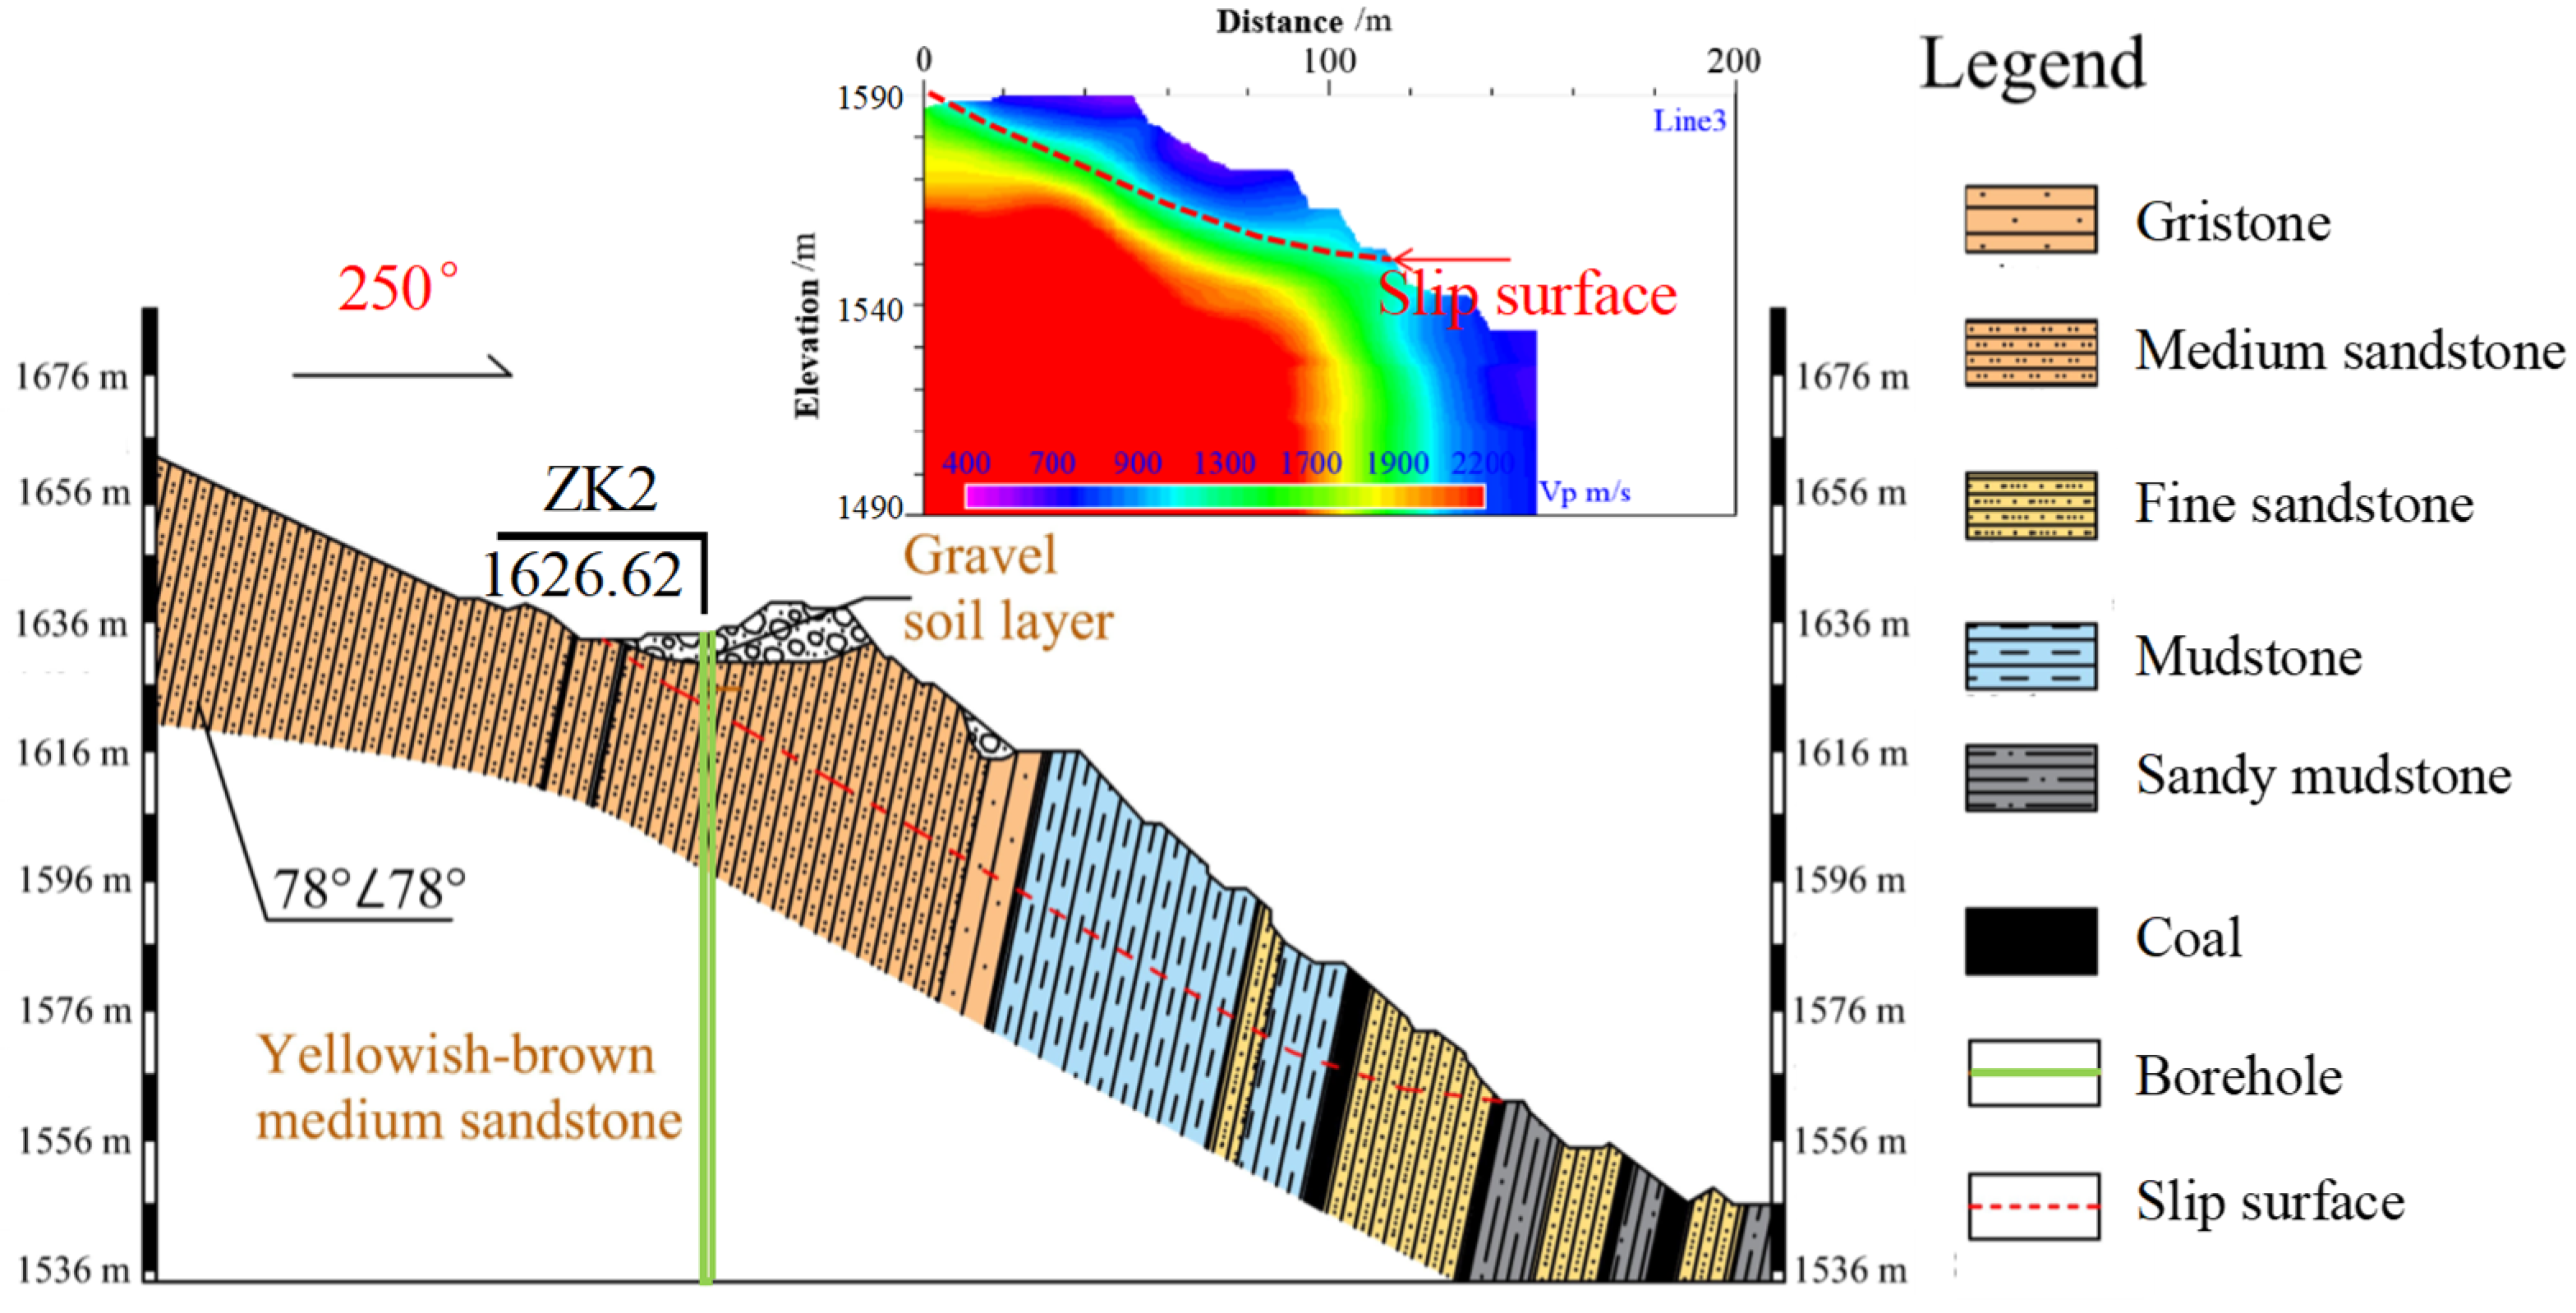
Figure 19.
Typical geological profile of the eastern pit slope in the Wolong Coal Mine.
Figure 19.
Typical geological profile of the eastern pit slope in the Wolong Coal Mine.
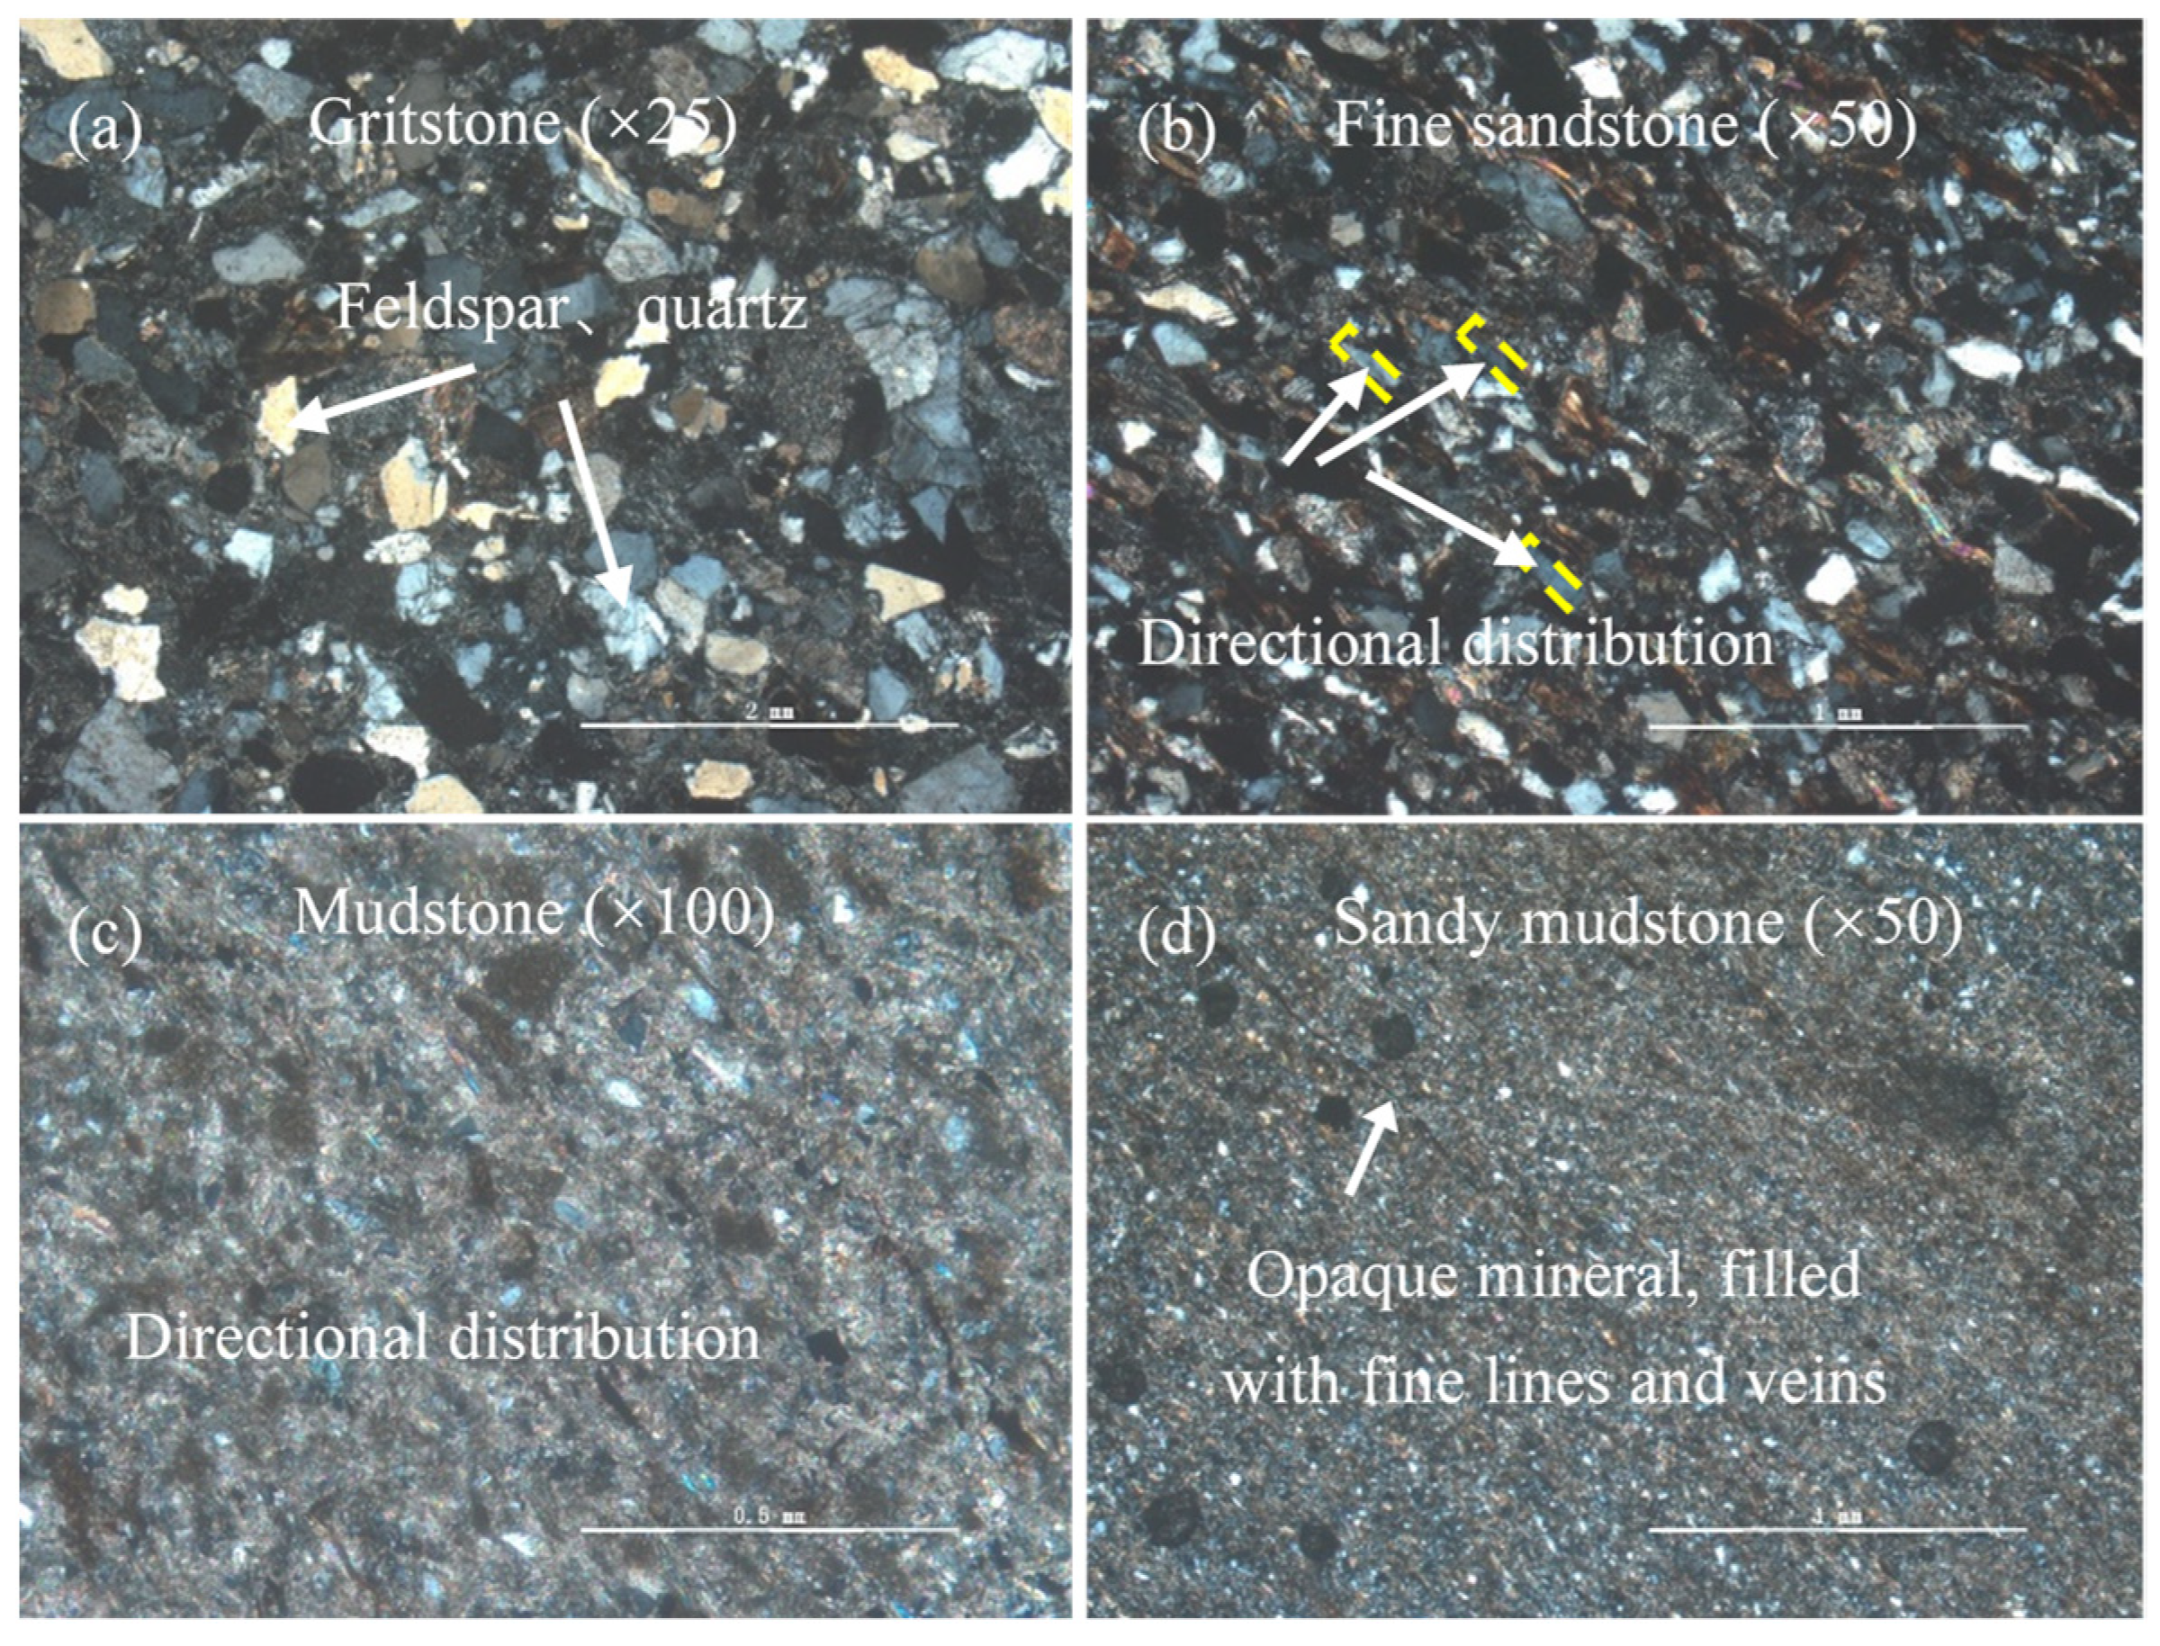
Figure 20.
Results of the rock thin section identification method for major lithologies: (a) Gritstone (×25); (b) Fine sandstone (×50); (c) Mudstone ×100; (d) Sandy mudstone (×50).
Figure 20.
Results of the rock thin section identification method for major lithologies: (a) Gritstone (×25); (b) Fine sandstone (×50); (c) Mudstone ×100; (d) Sandy mudstone (×50).
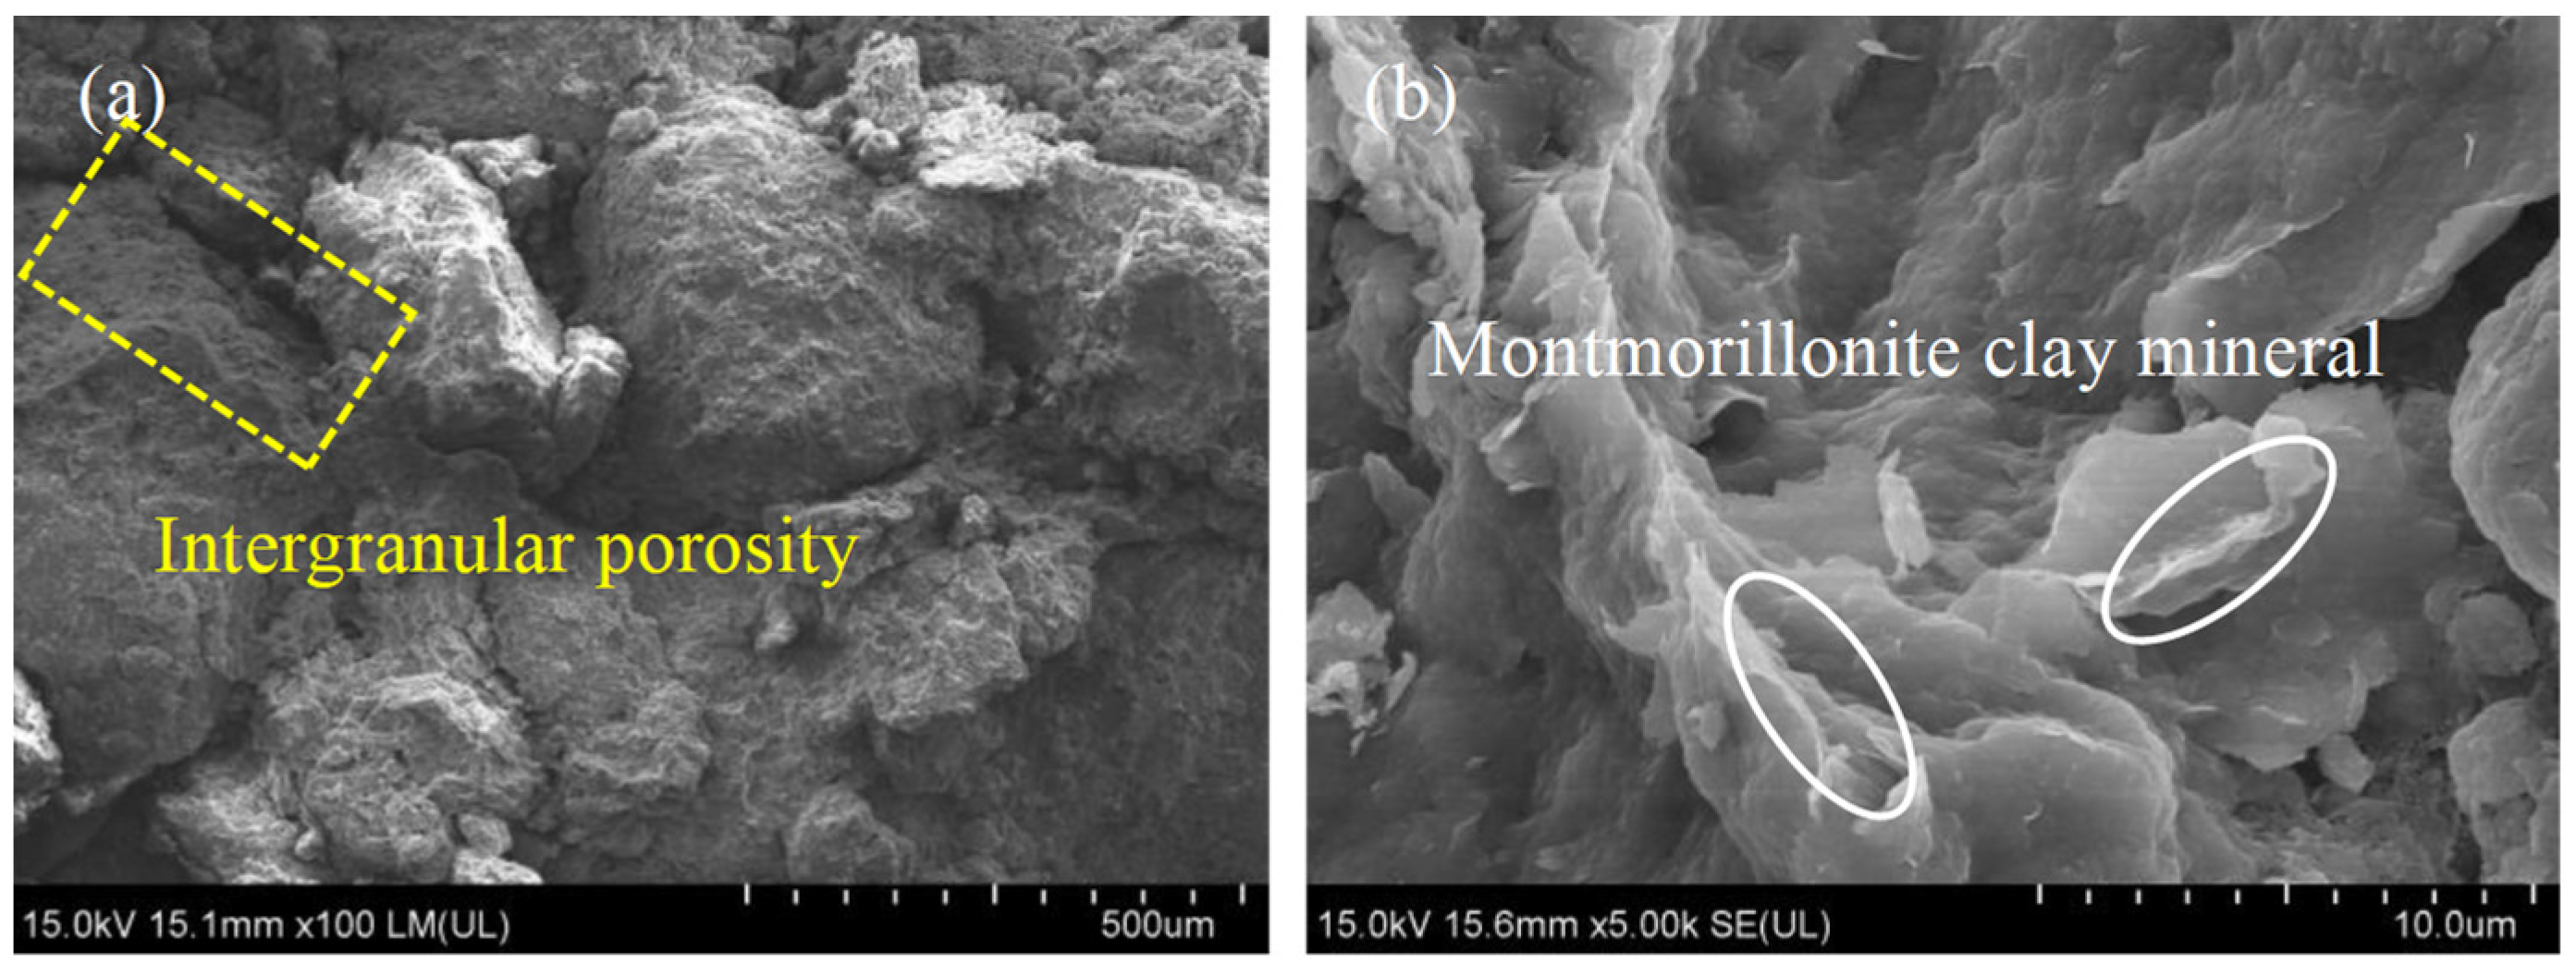
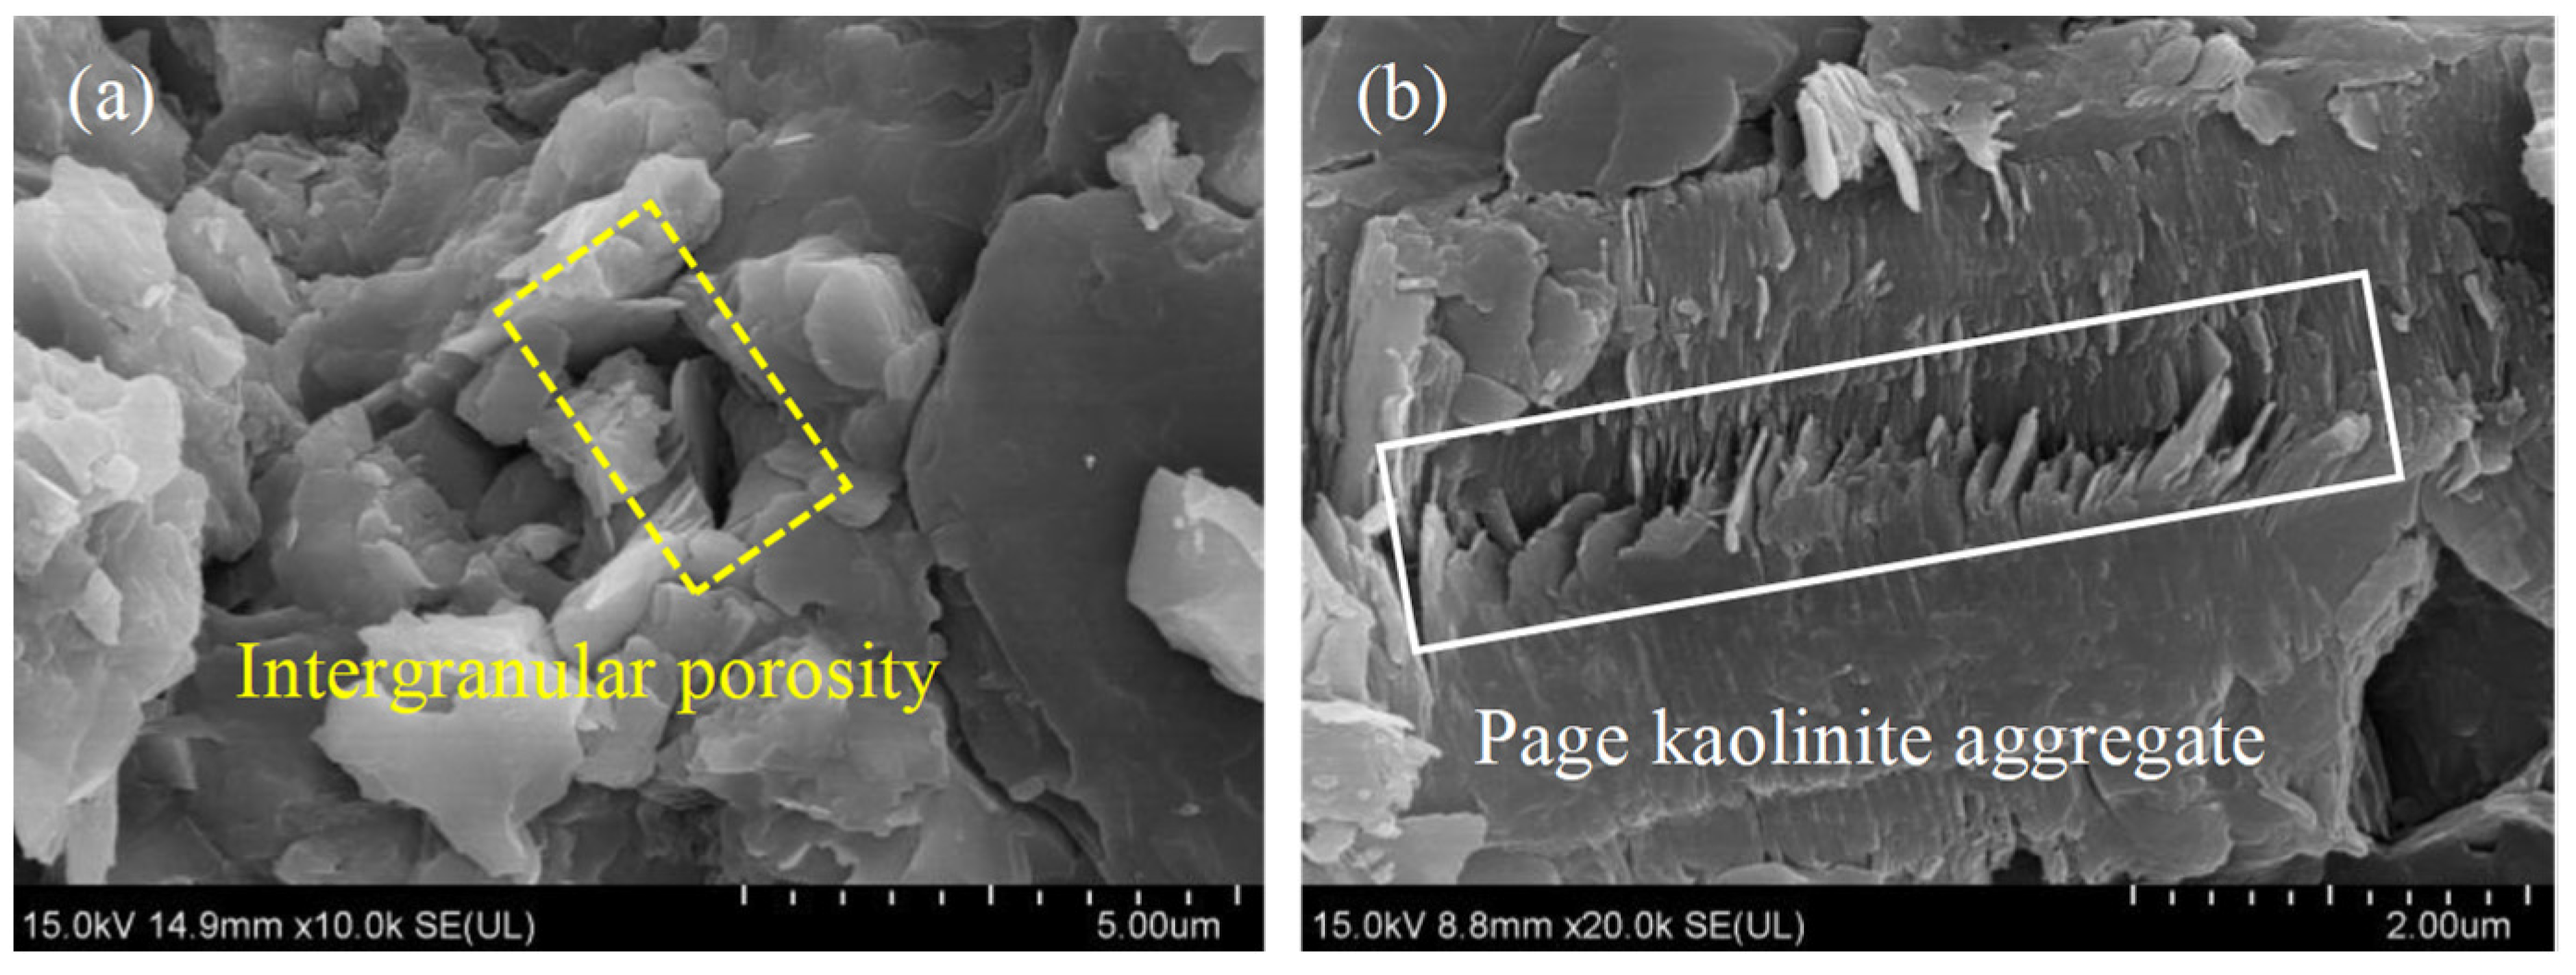
Figure 21.
Electron microscope image of gritstone: (a) ×100; (b) ×5000.
Figure 21.
Electron microscope image of gritstone: (a) ×100; (b) ×5000.
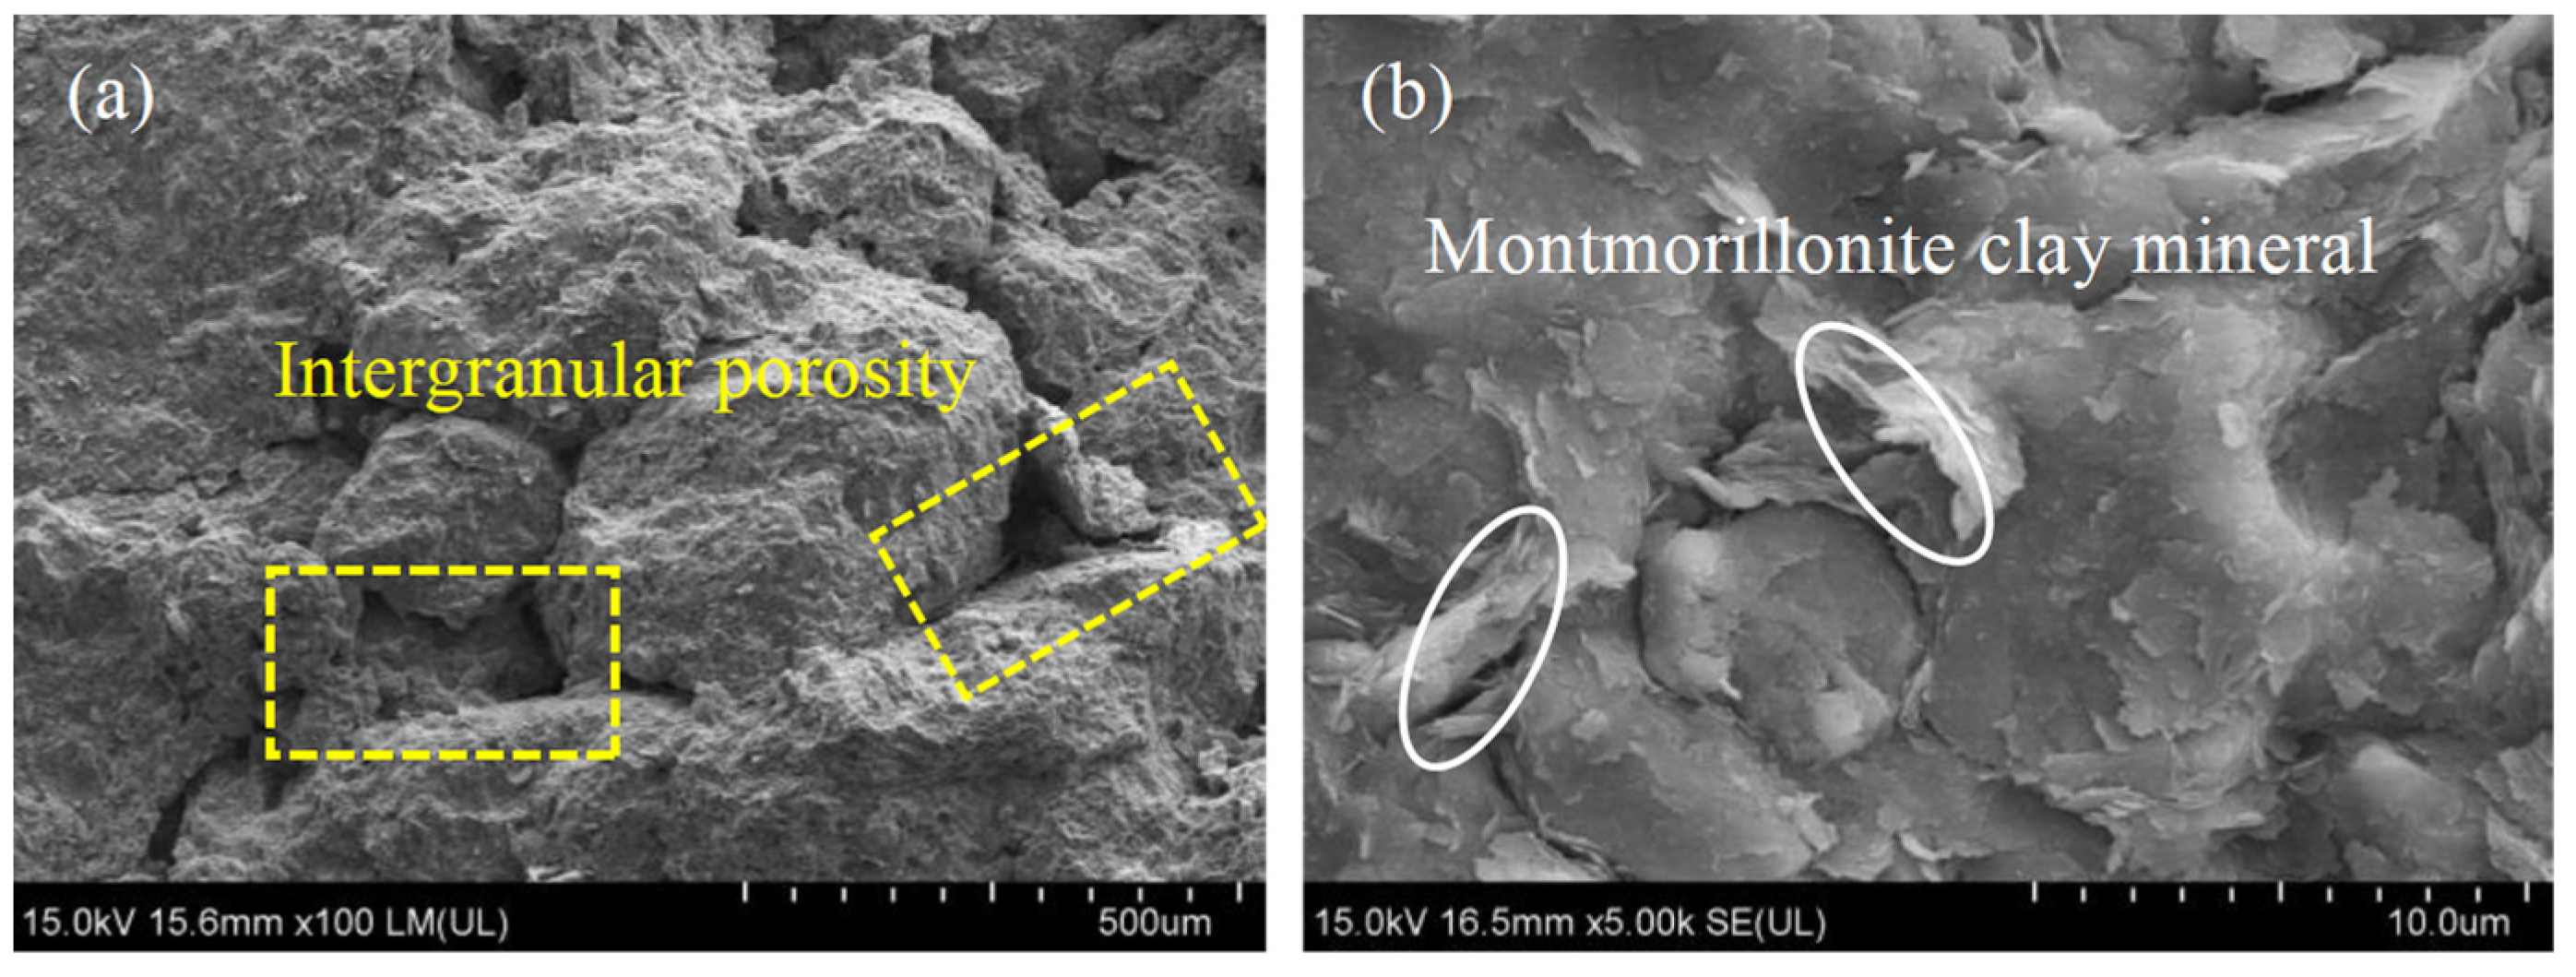
Figure 22.
Electron microscope image of fine sandstone: (a) ×100; (b) ×10,000.
Figure 22.
Electron microscope image of fine sandstone: (a) ×100; (b) ×10,000.
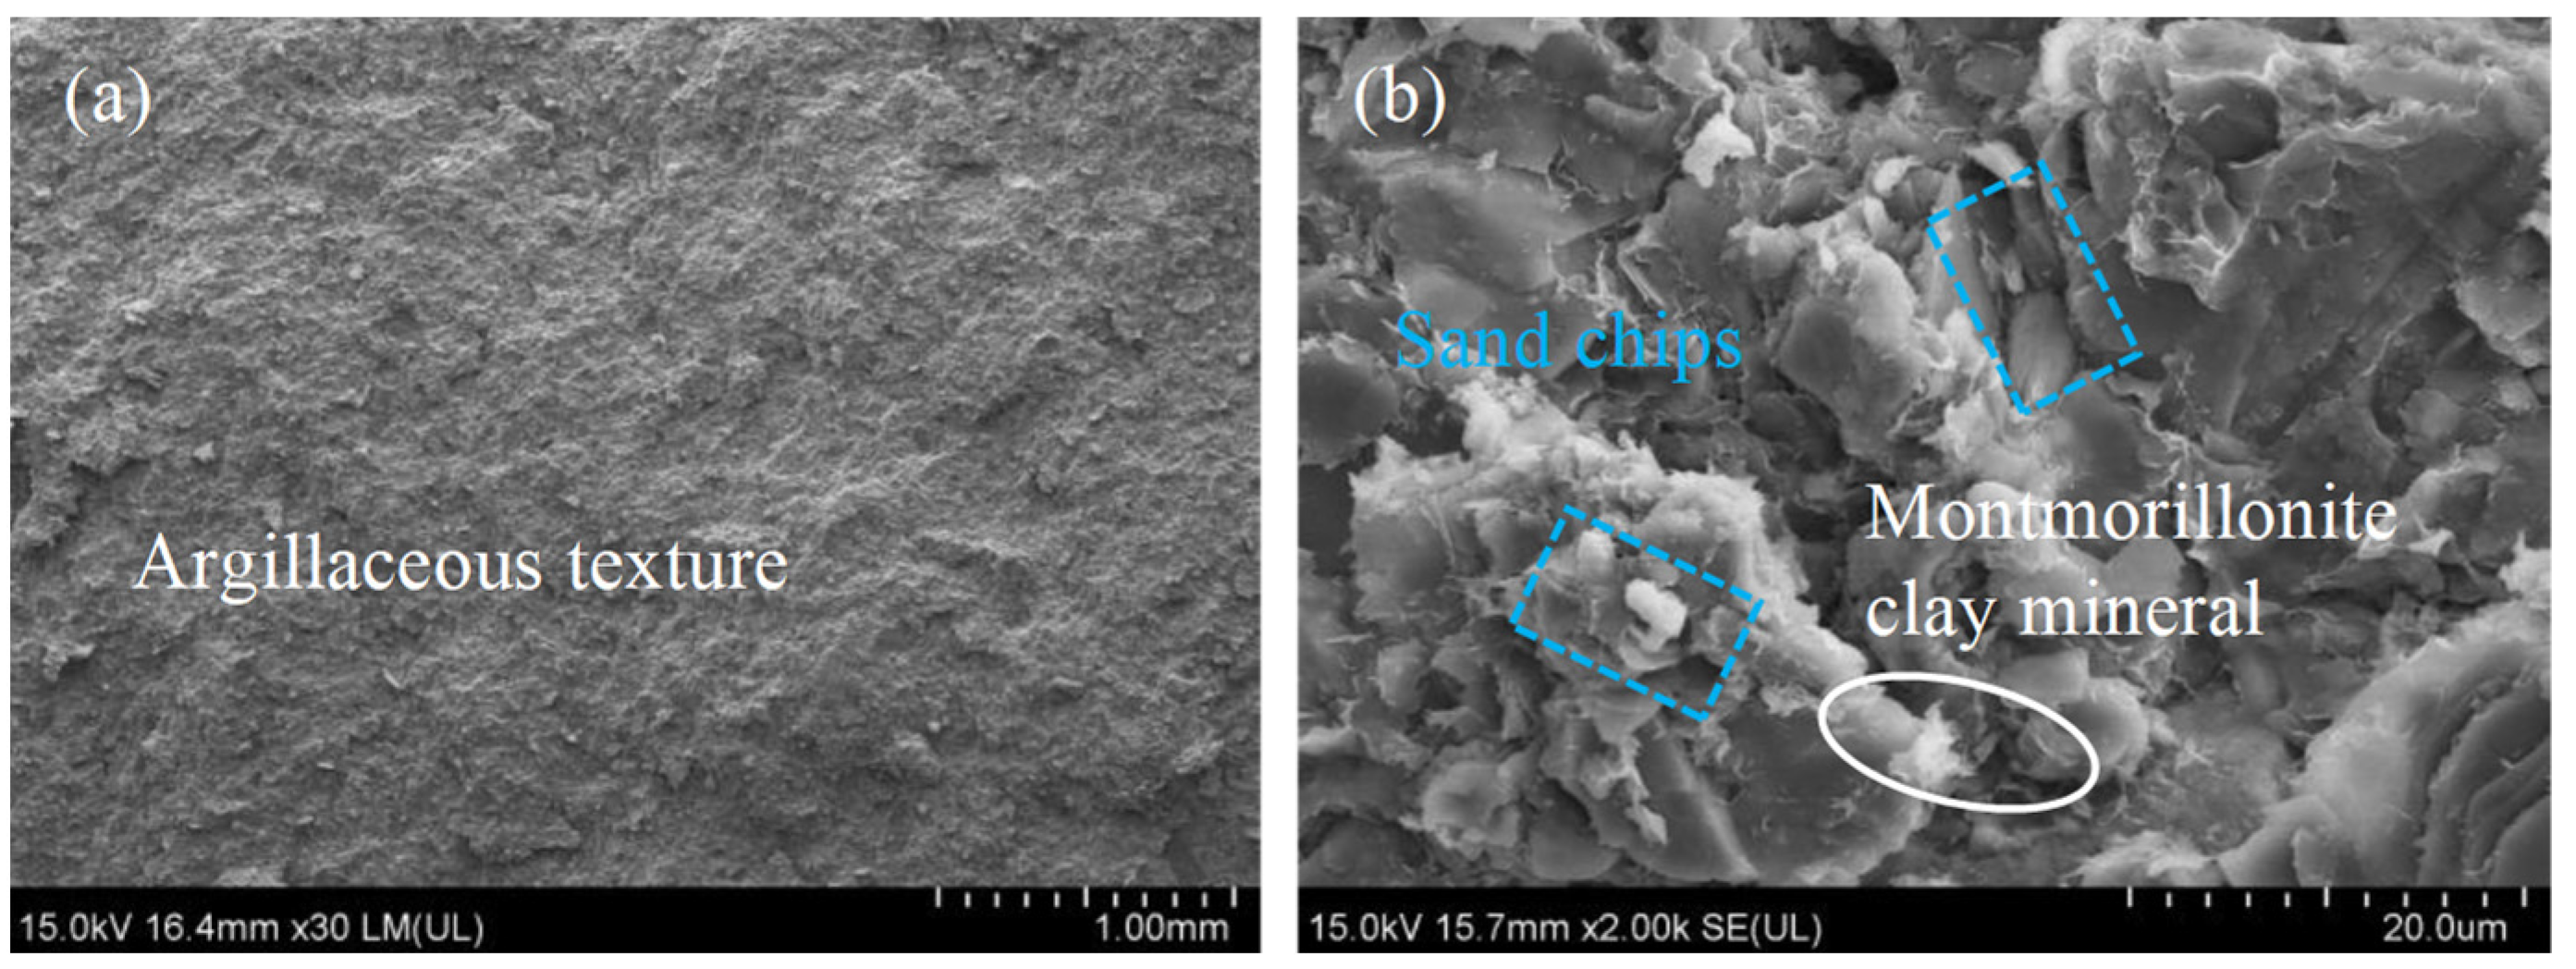
Figure 23.
Electron microscope image of mudstone: (a) ×30; (b) ×10,000.
Figure 23.
Electron microscope image of mudstone: (a) ×30; (b) ×10,000.
Figure 24.
Electron microscope image of sandy mudstone: (a) ×10,000; (b) ×20,000.
Figure 24.
Electron microscope image of sandy mudstone: (a) ×10,000; (b) ×20,000.
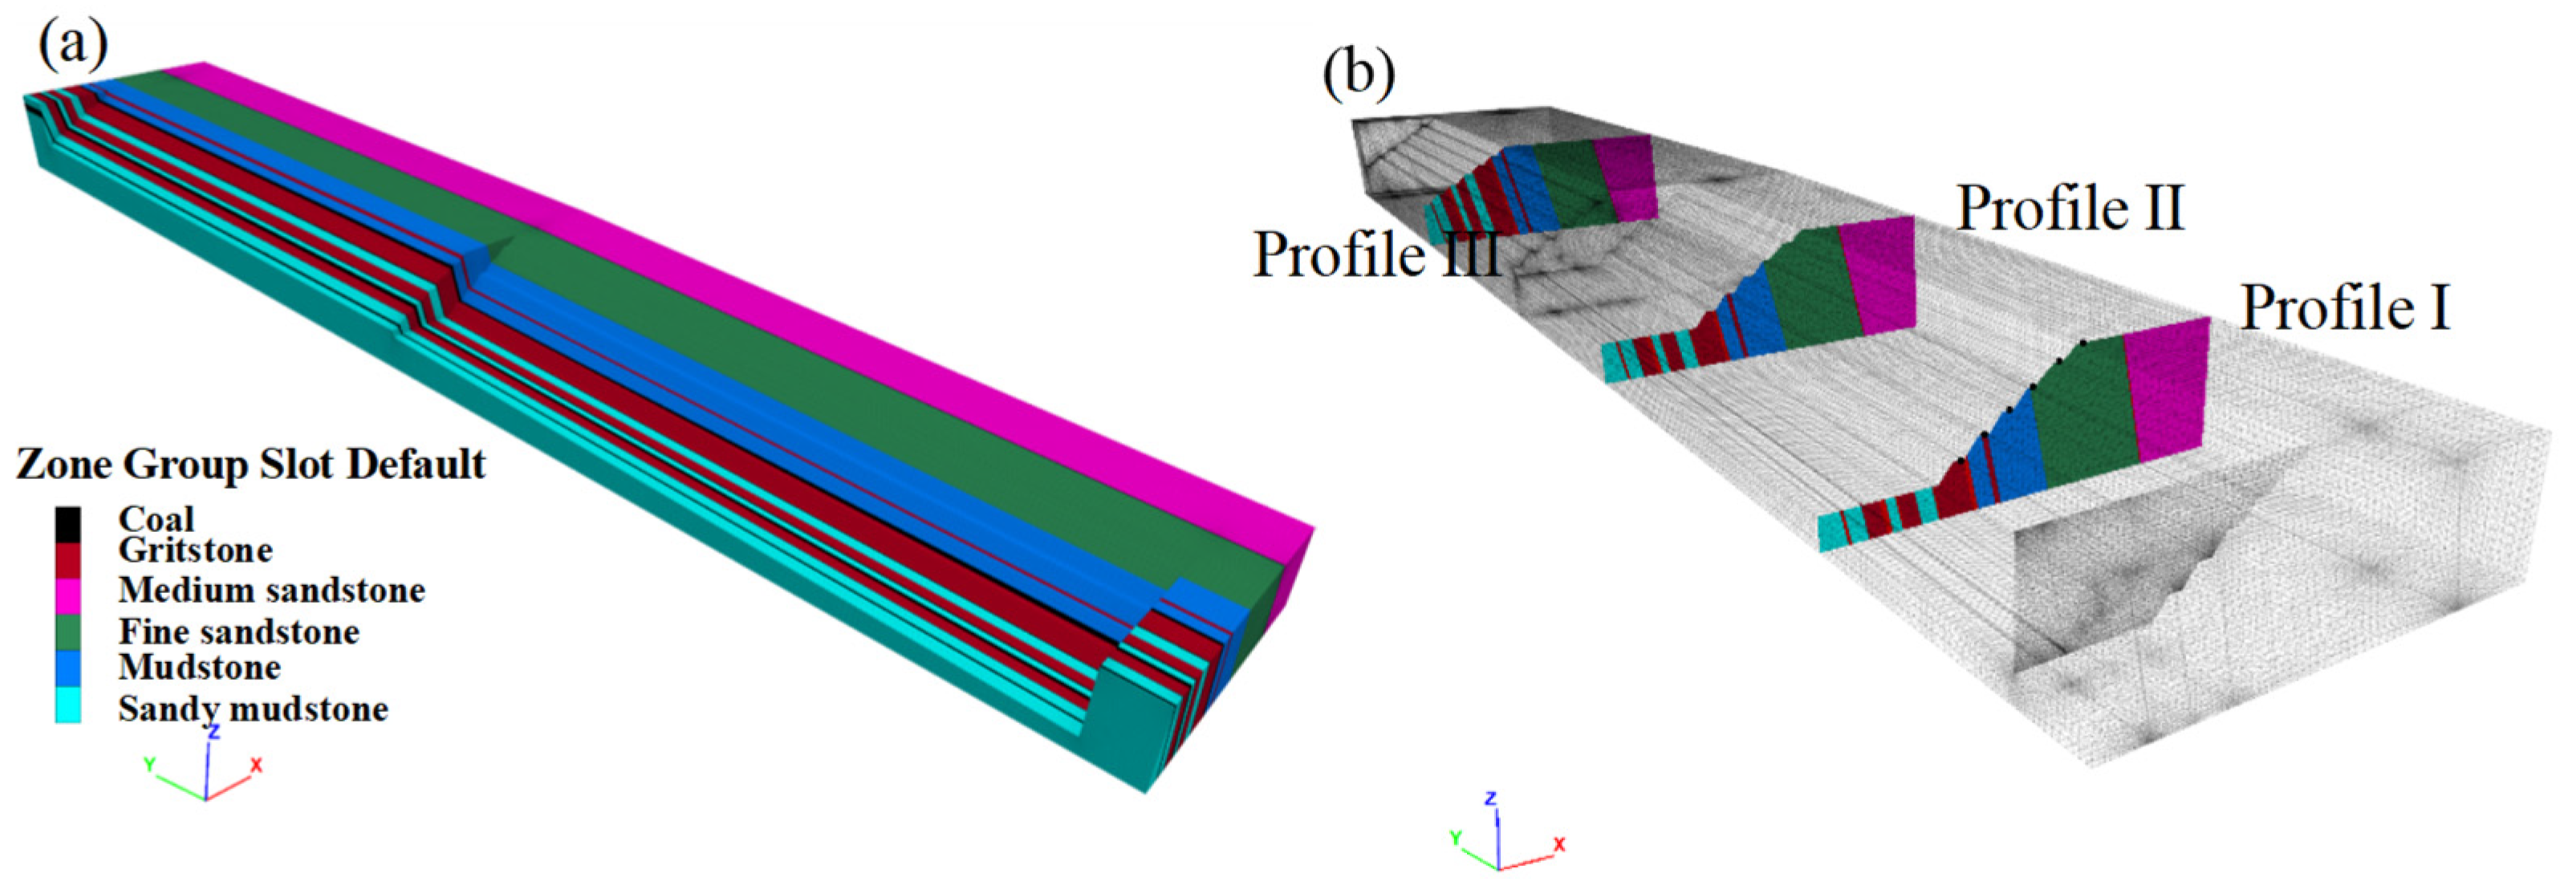
Figure 25.
(a) A simplified 3D geological model used in FLAC3D; (b) Profile distribution map.
Figure 25.
(a) A simplified 3D geological model used in FLAC3D; (b) Profile distribution map.
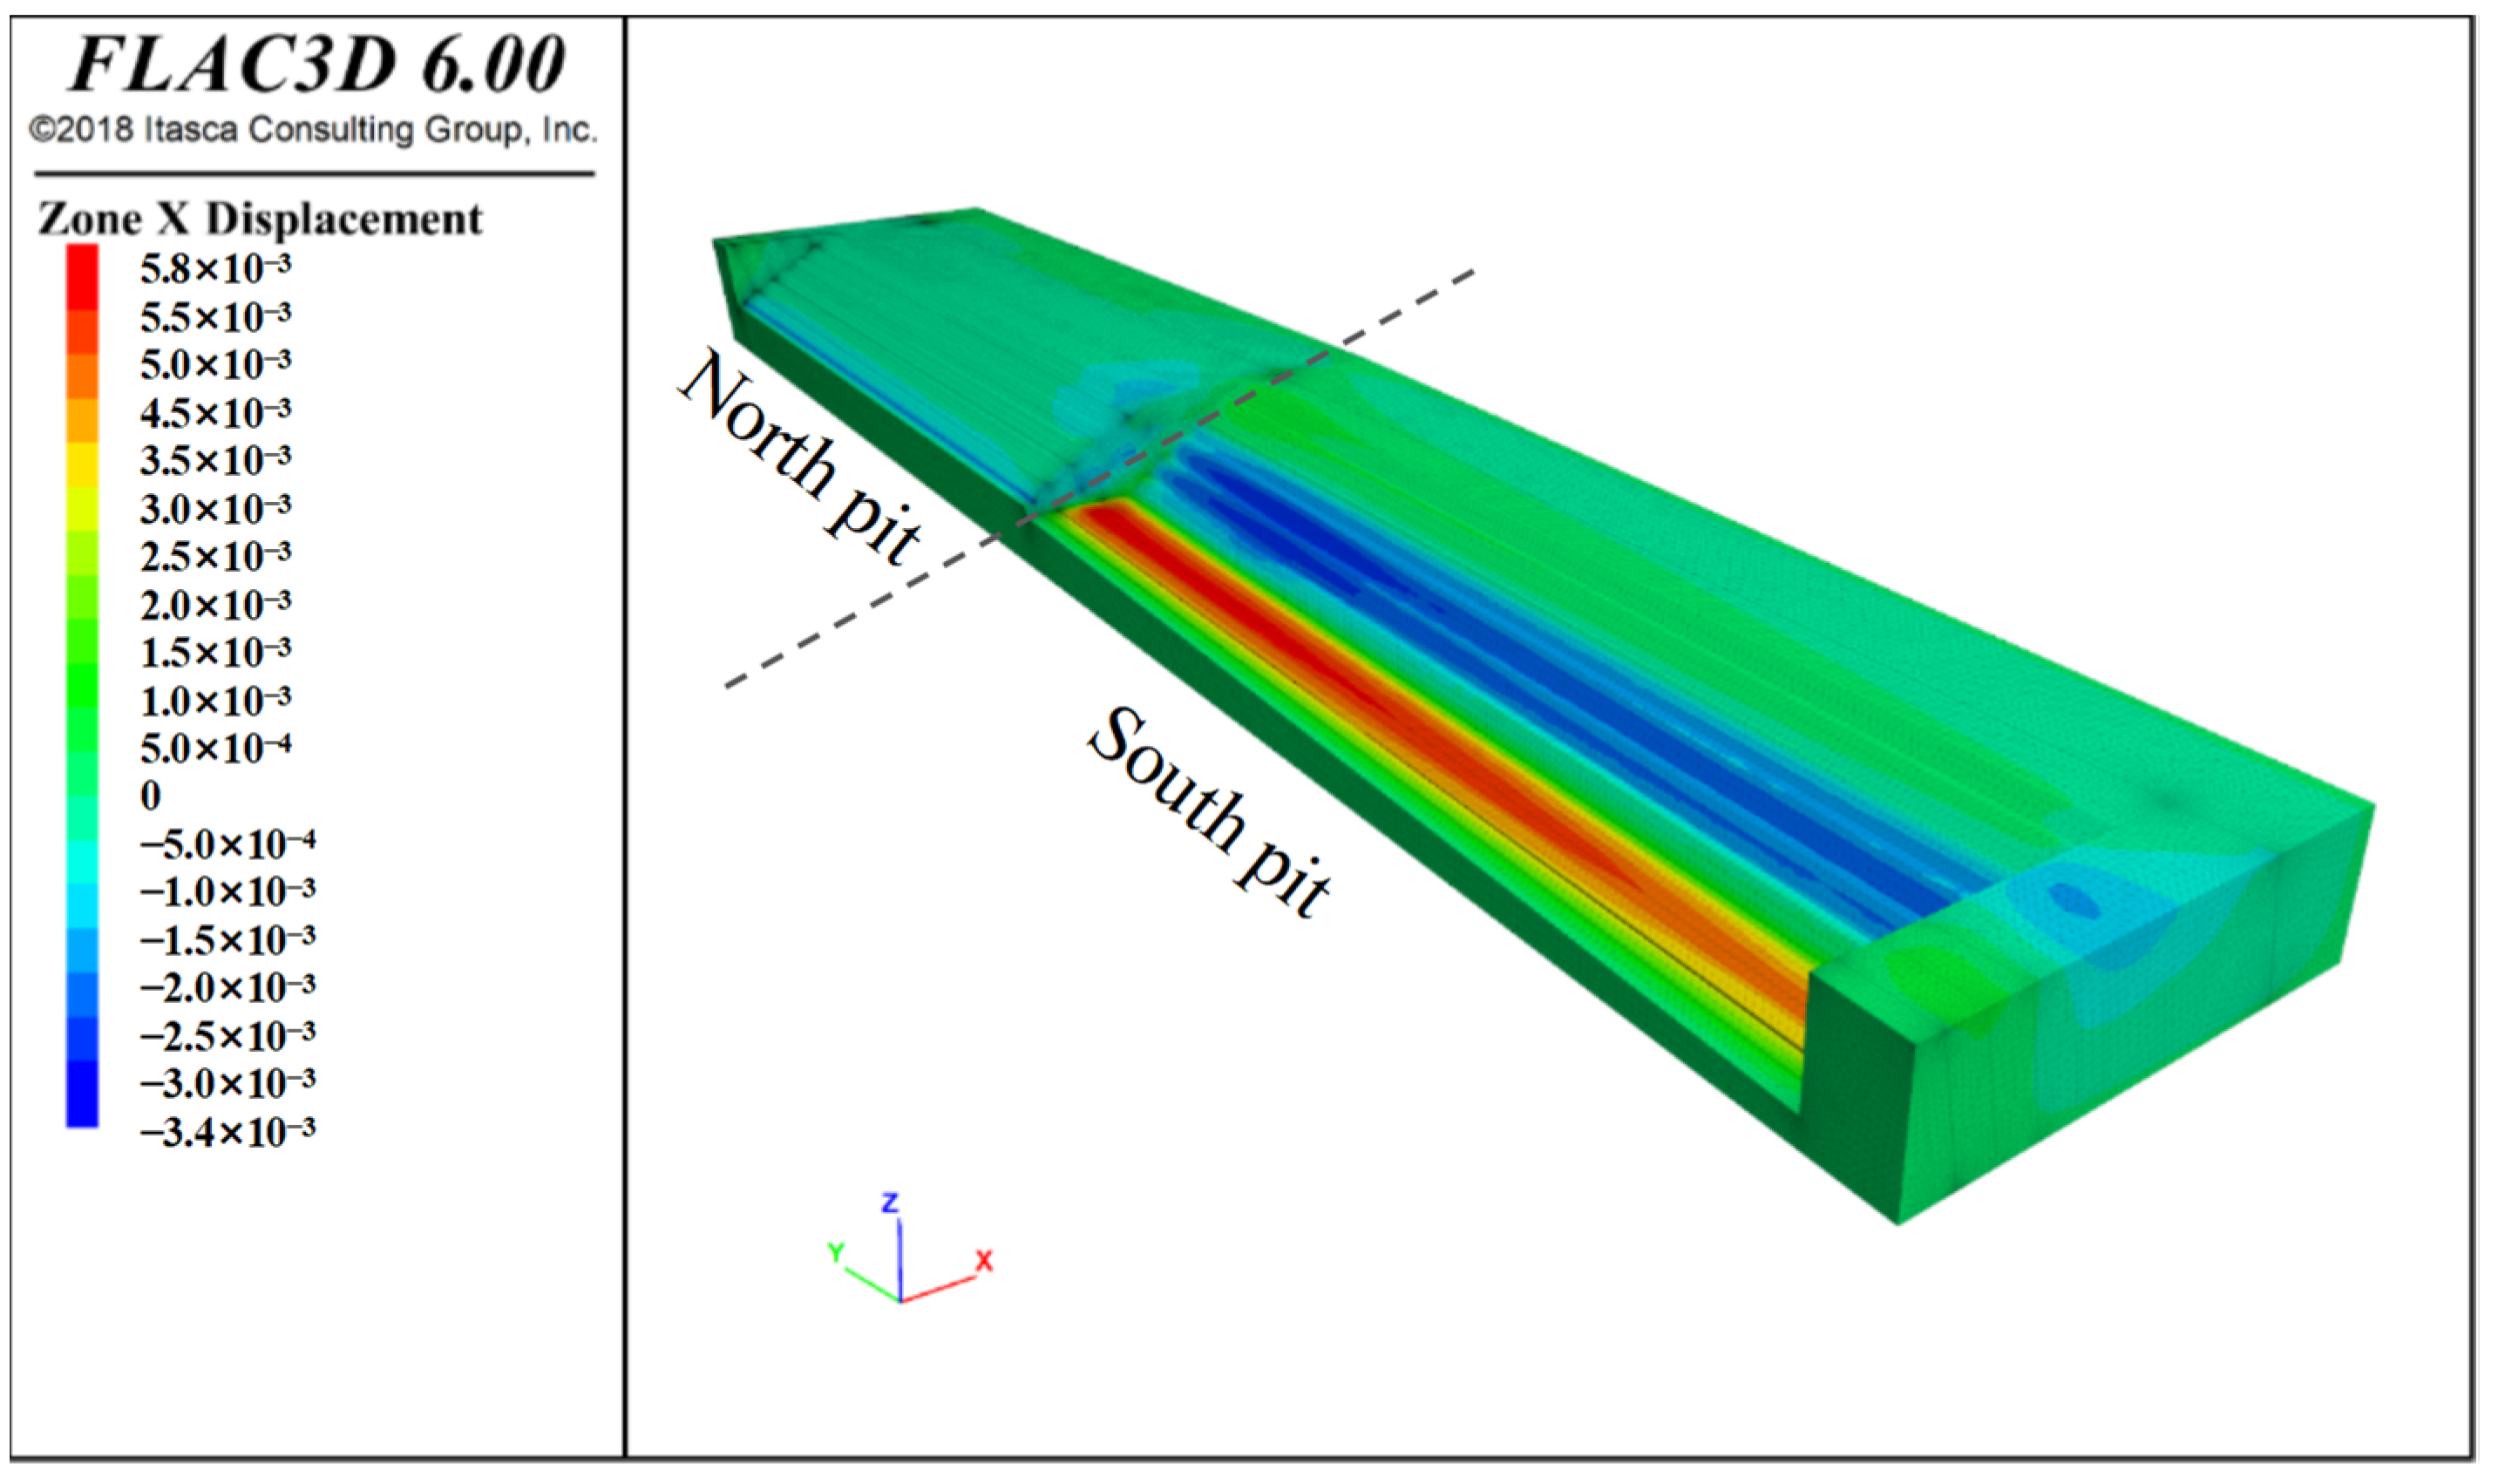
Figure 26.
A simplified 3D geological model used in FLAC3D.
Figure 26.
A simplified 3D geological model used in FLAC3D.
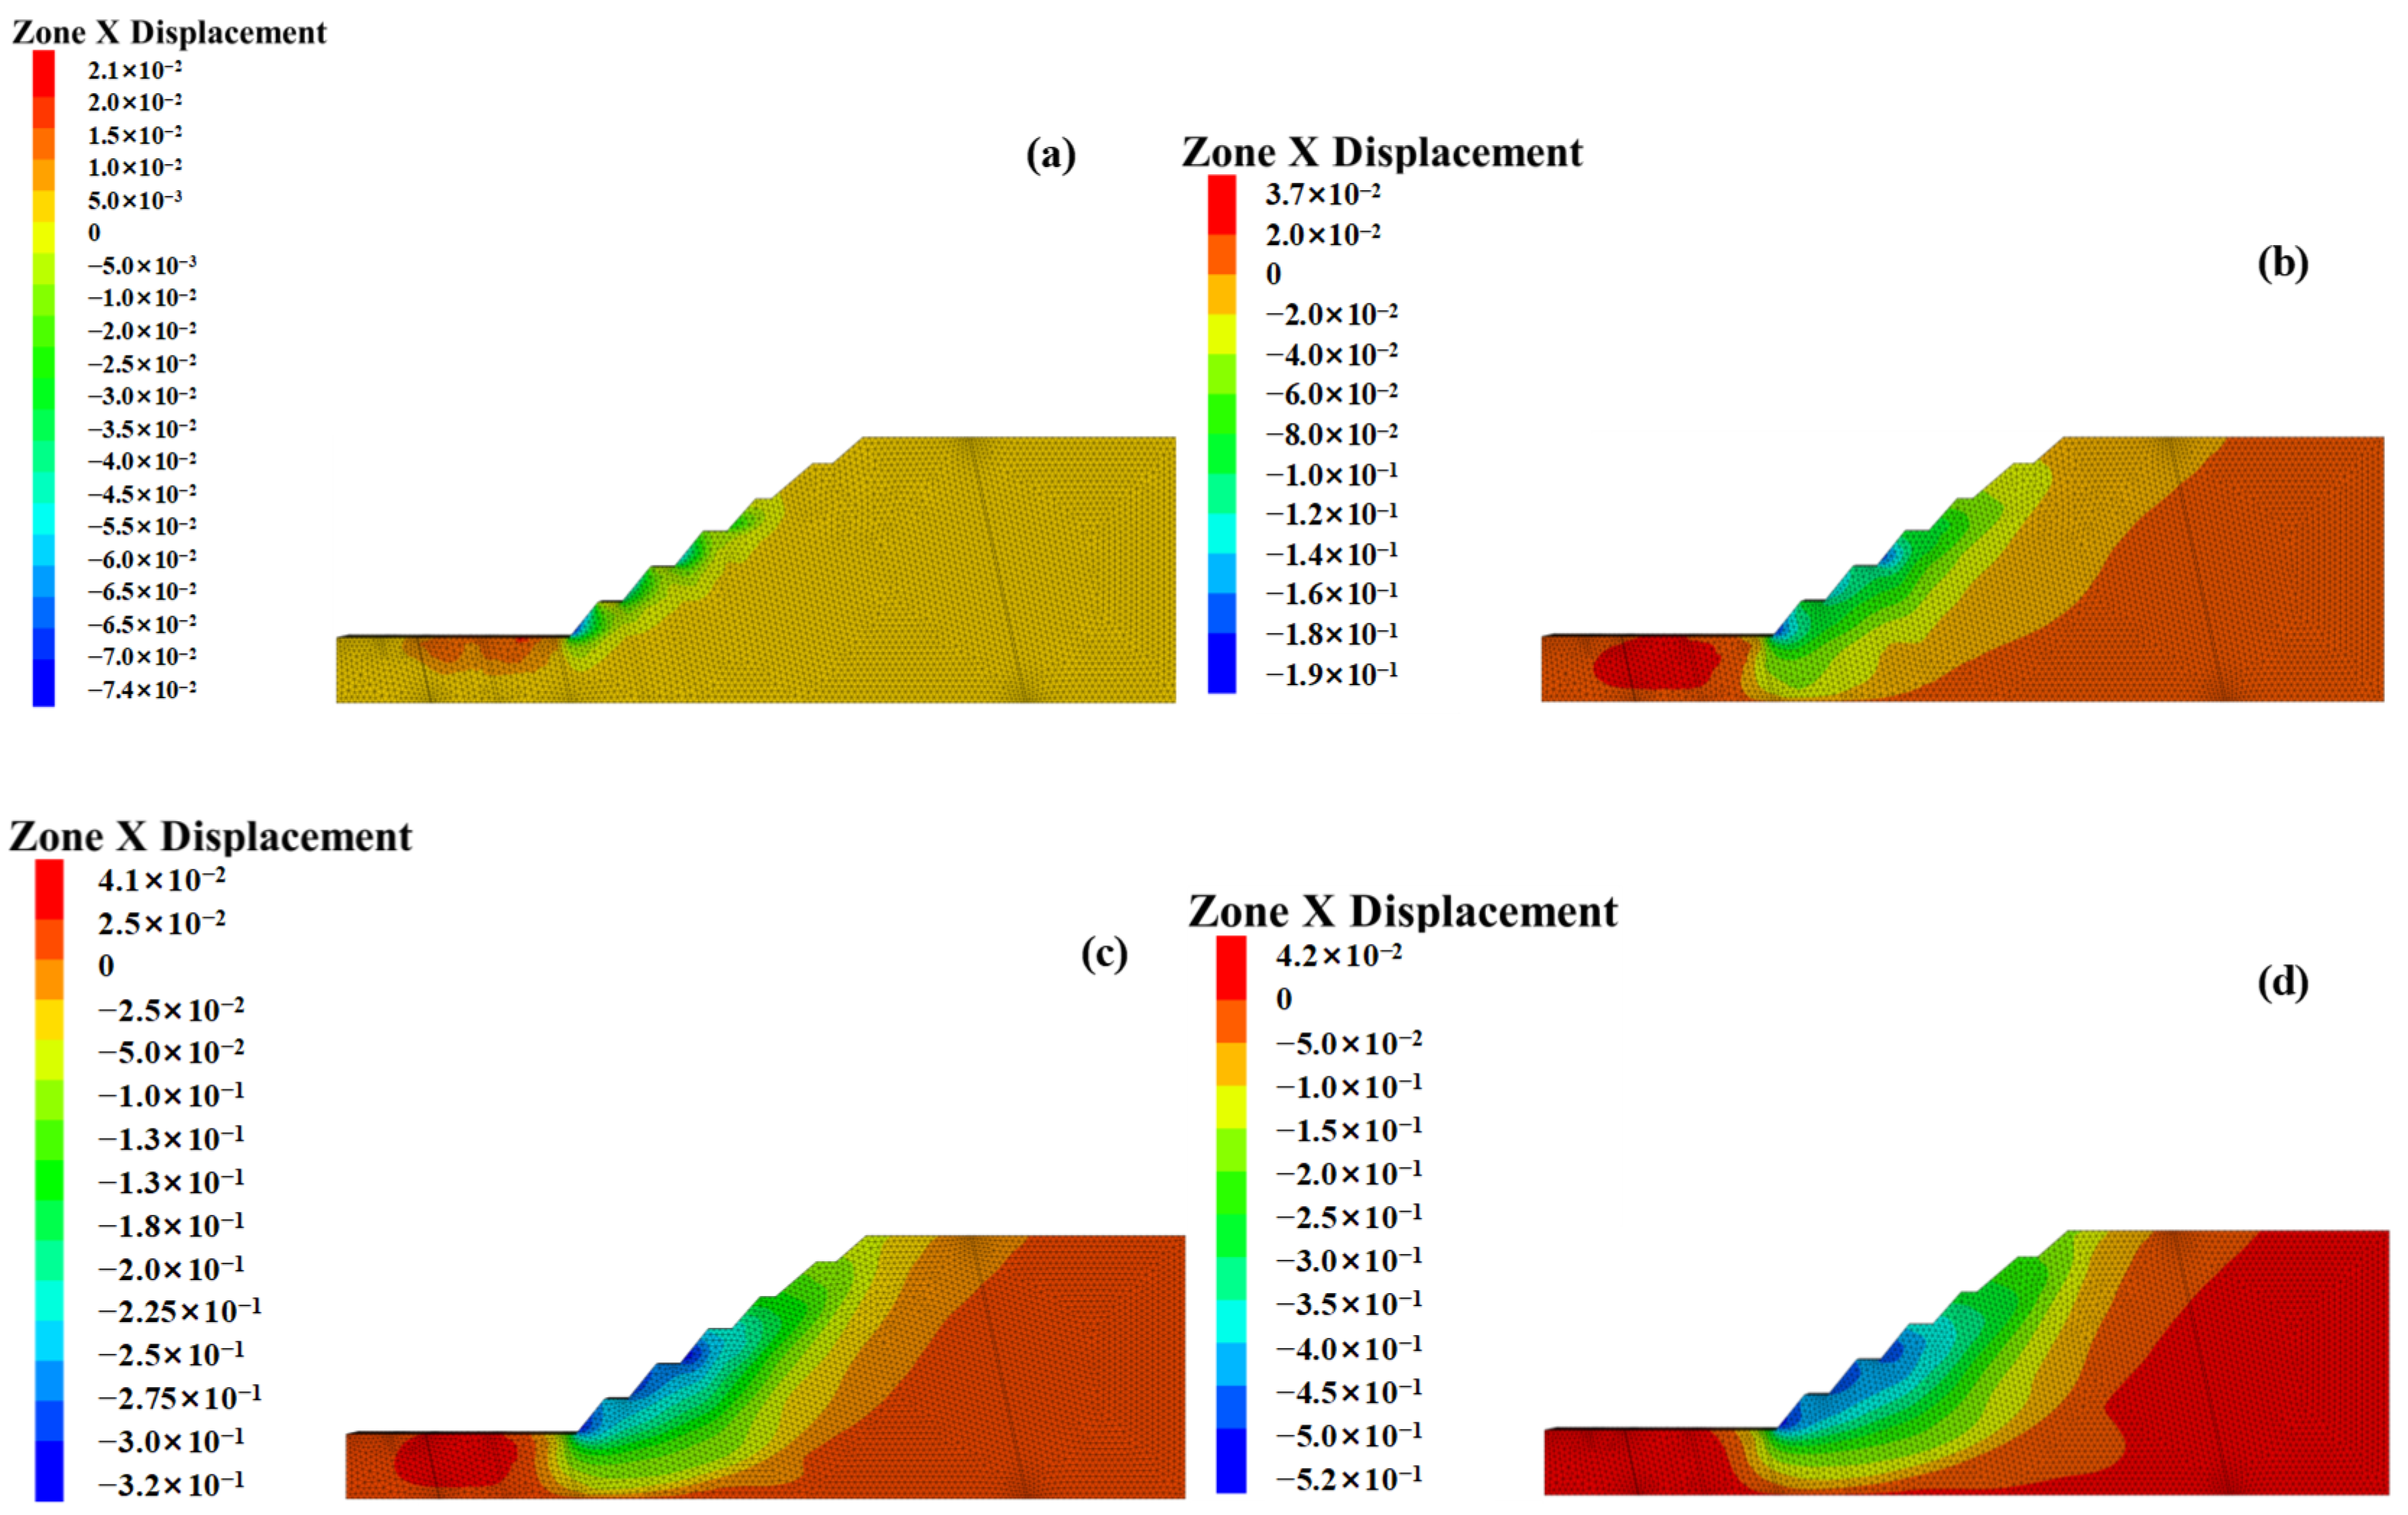
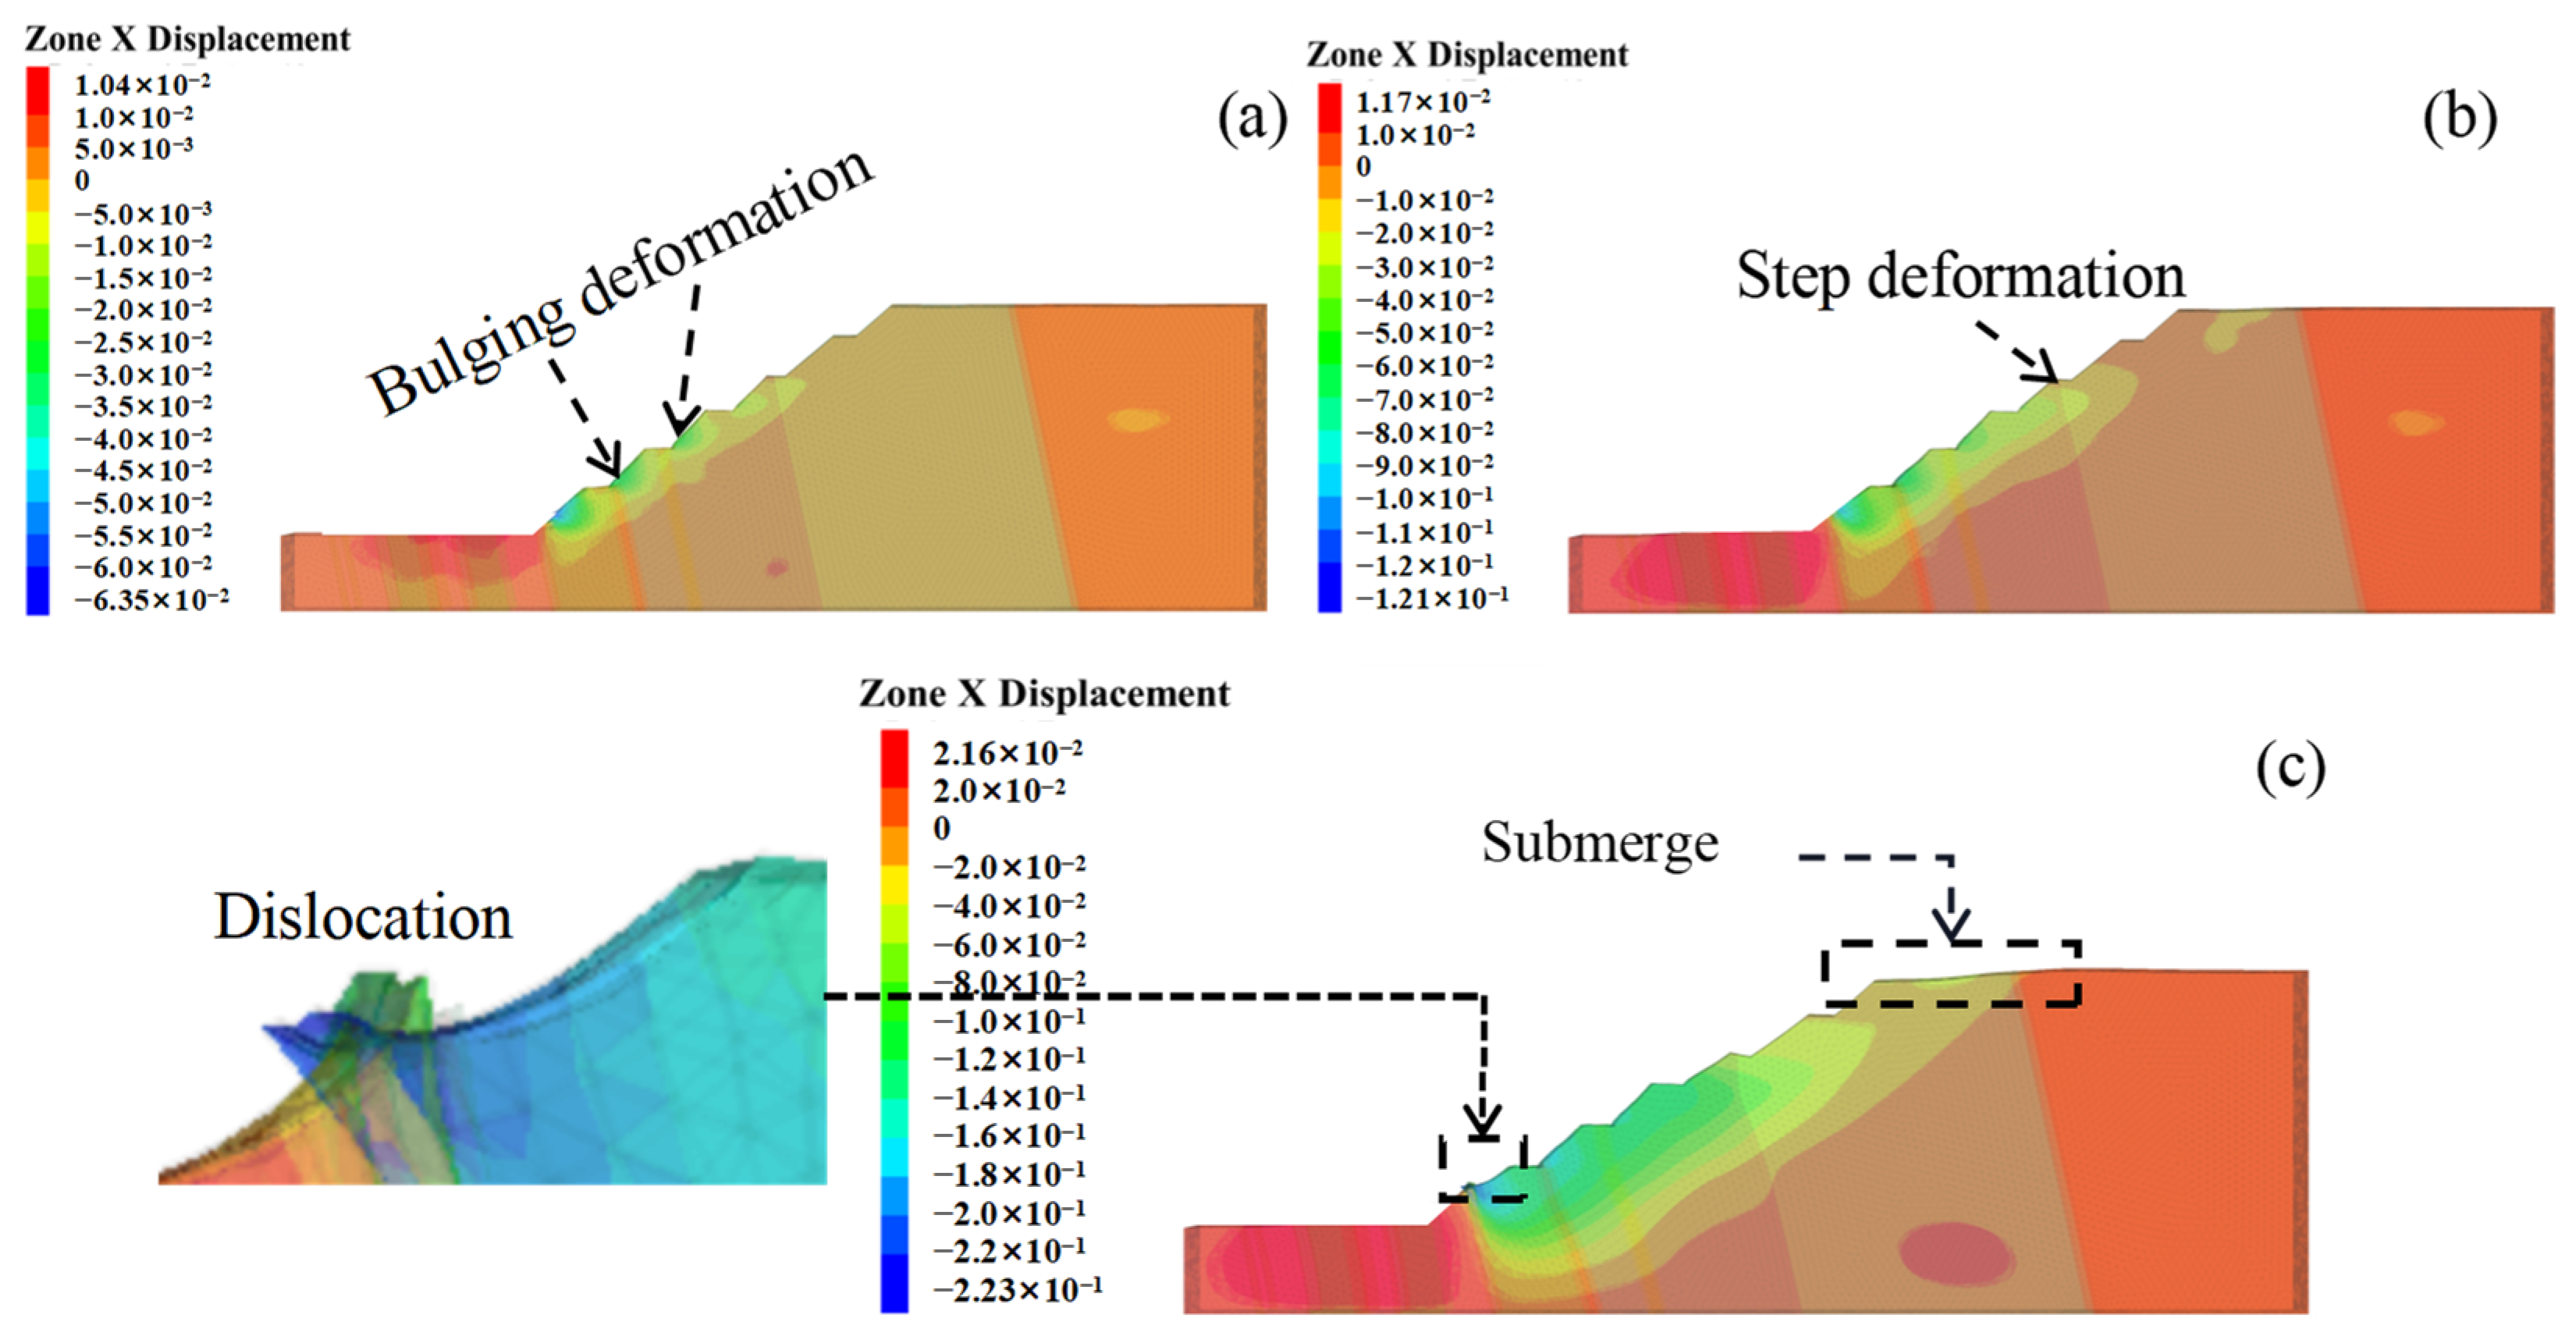
Figure 27.
Displacement cloud of profile I in the x-direction: (a) 100 steps; (b) 1000 steps; (c) 2000 steps; (d) 3000 steps.
Figure 27.
Displacement cloud of profile I in the x-direction: (a) 100 steps; (b) 1000 steps; (c) 2000 steps; (d) 3000 steps.
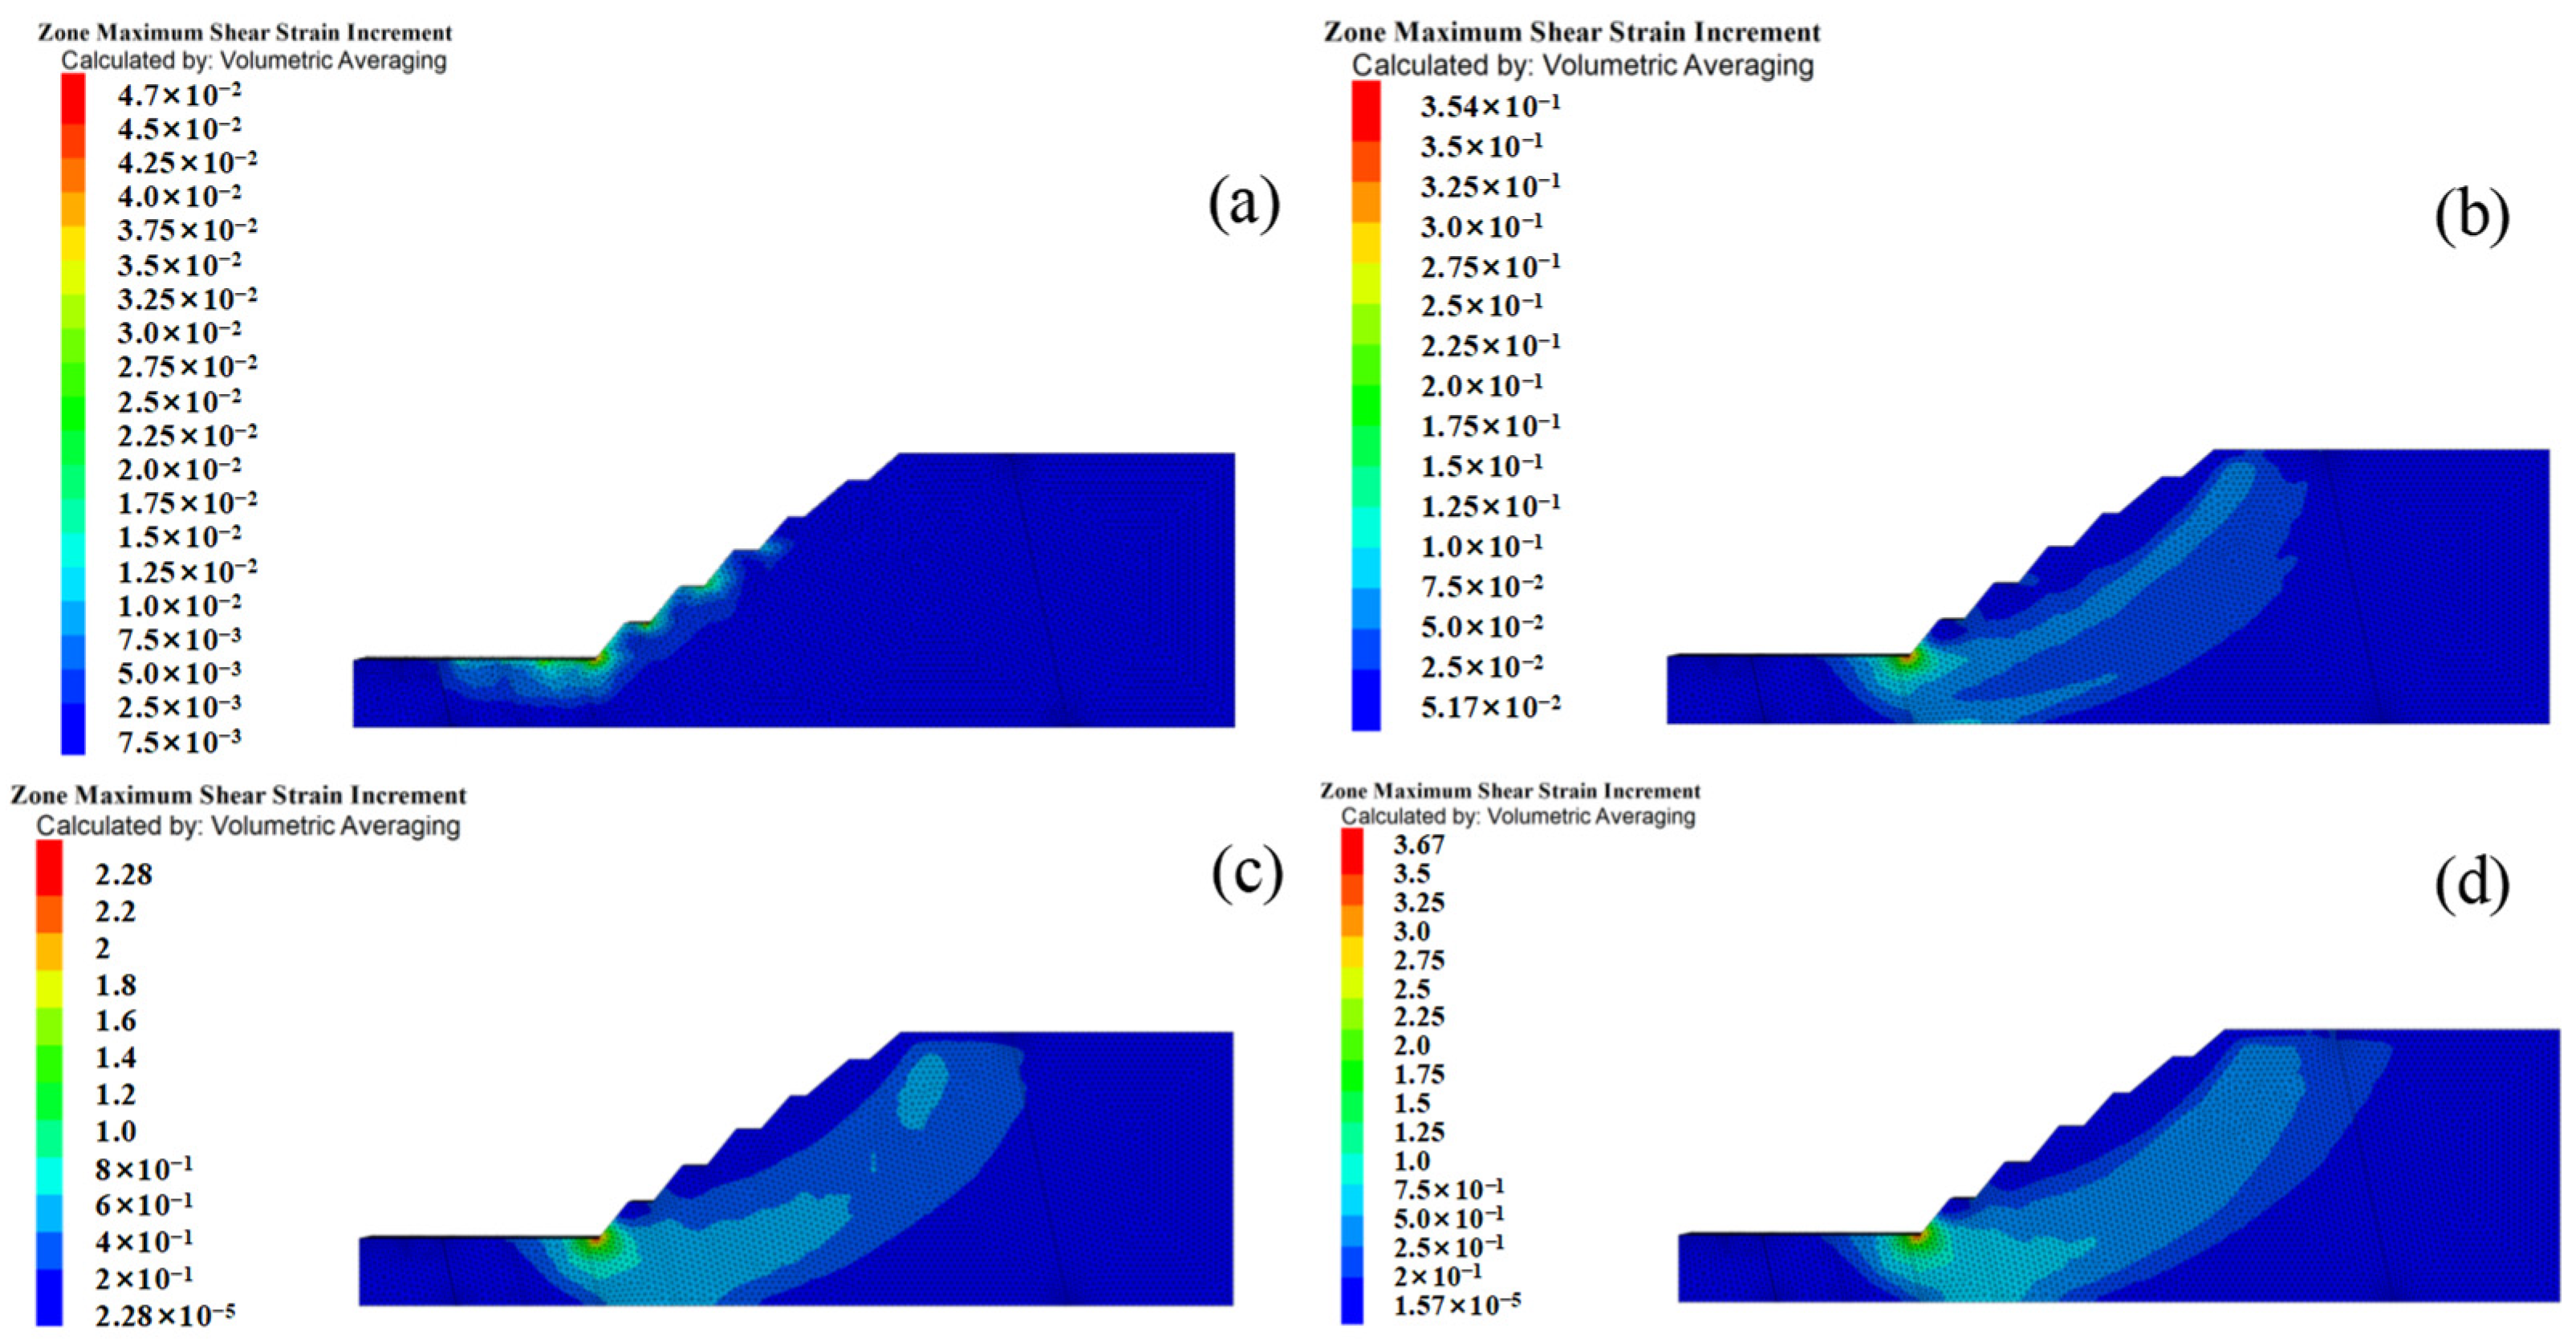
Figure 28.
Cloud map of the incremental shear strain in profile I: (a) 100 steps; (b) 1300 steps; (c) 2600 steps; (d) 3900 steps.
Figure 28.
Cloud map of the incremental shear strain in profile I: (a) 100 steps; (b) 1300 steps; (c) 2600 steps; (d) 3900 steps.
Figure 29.
Deformation and failure characteristics of the model: (a) 100 steps; (b) 200 steps; (c) 500 steps.
Figure 29.
Deformation and failure characteristics of the model: (a) 100 steps; (b) 200 steps; (c) 500 steps.
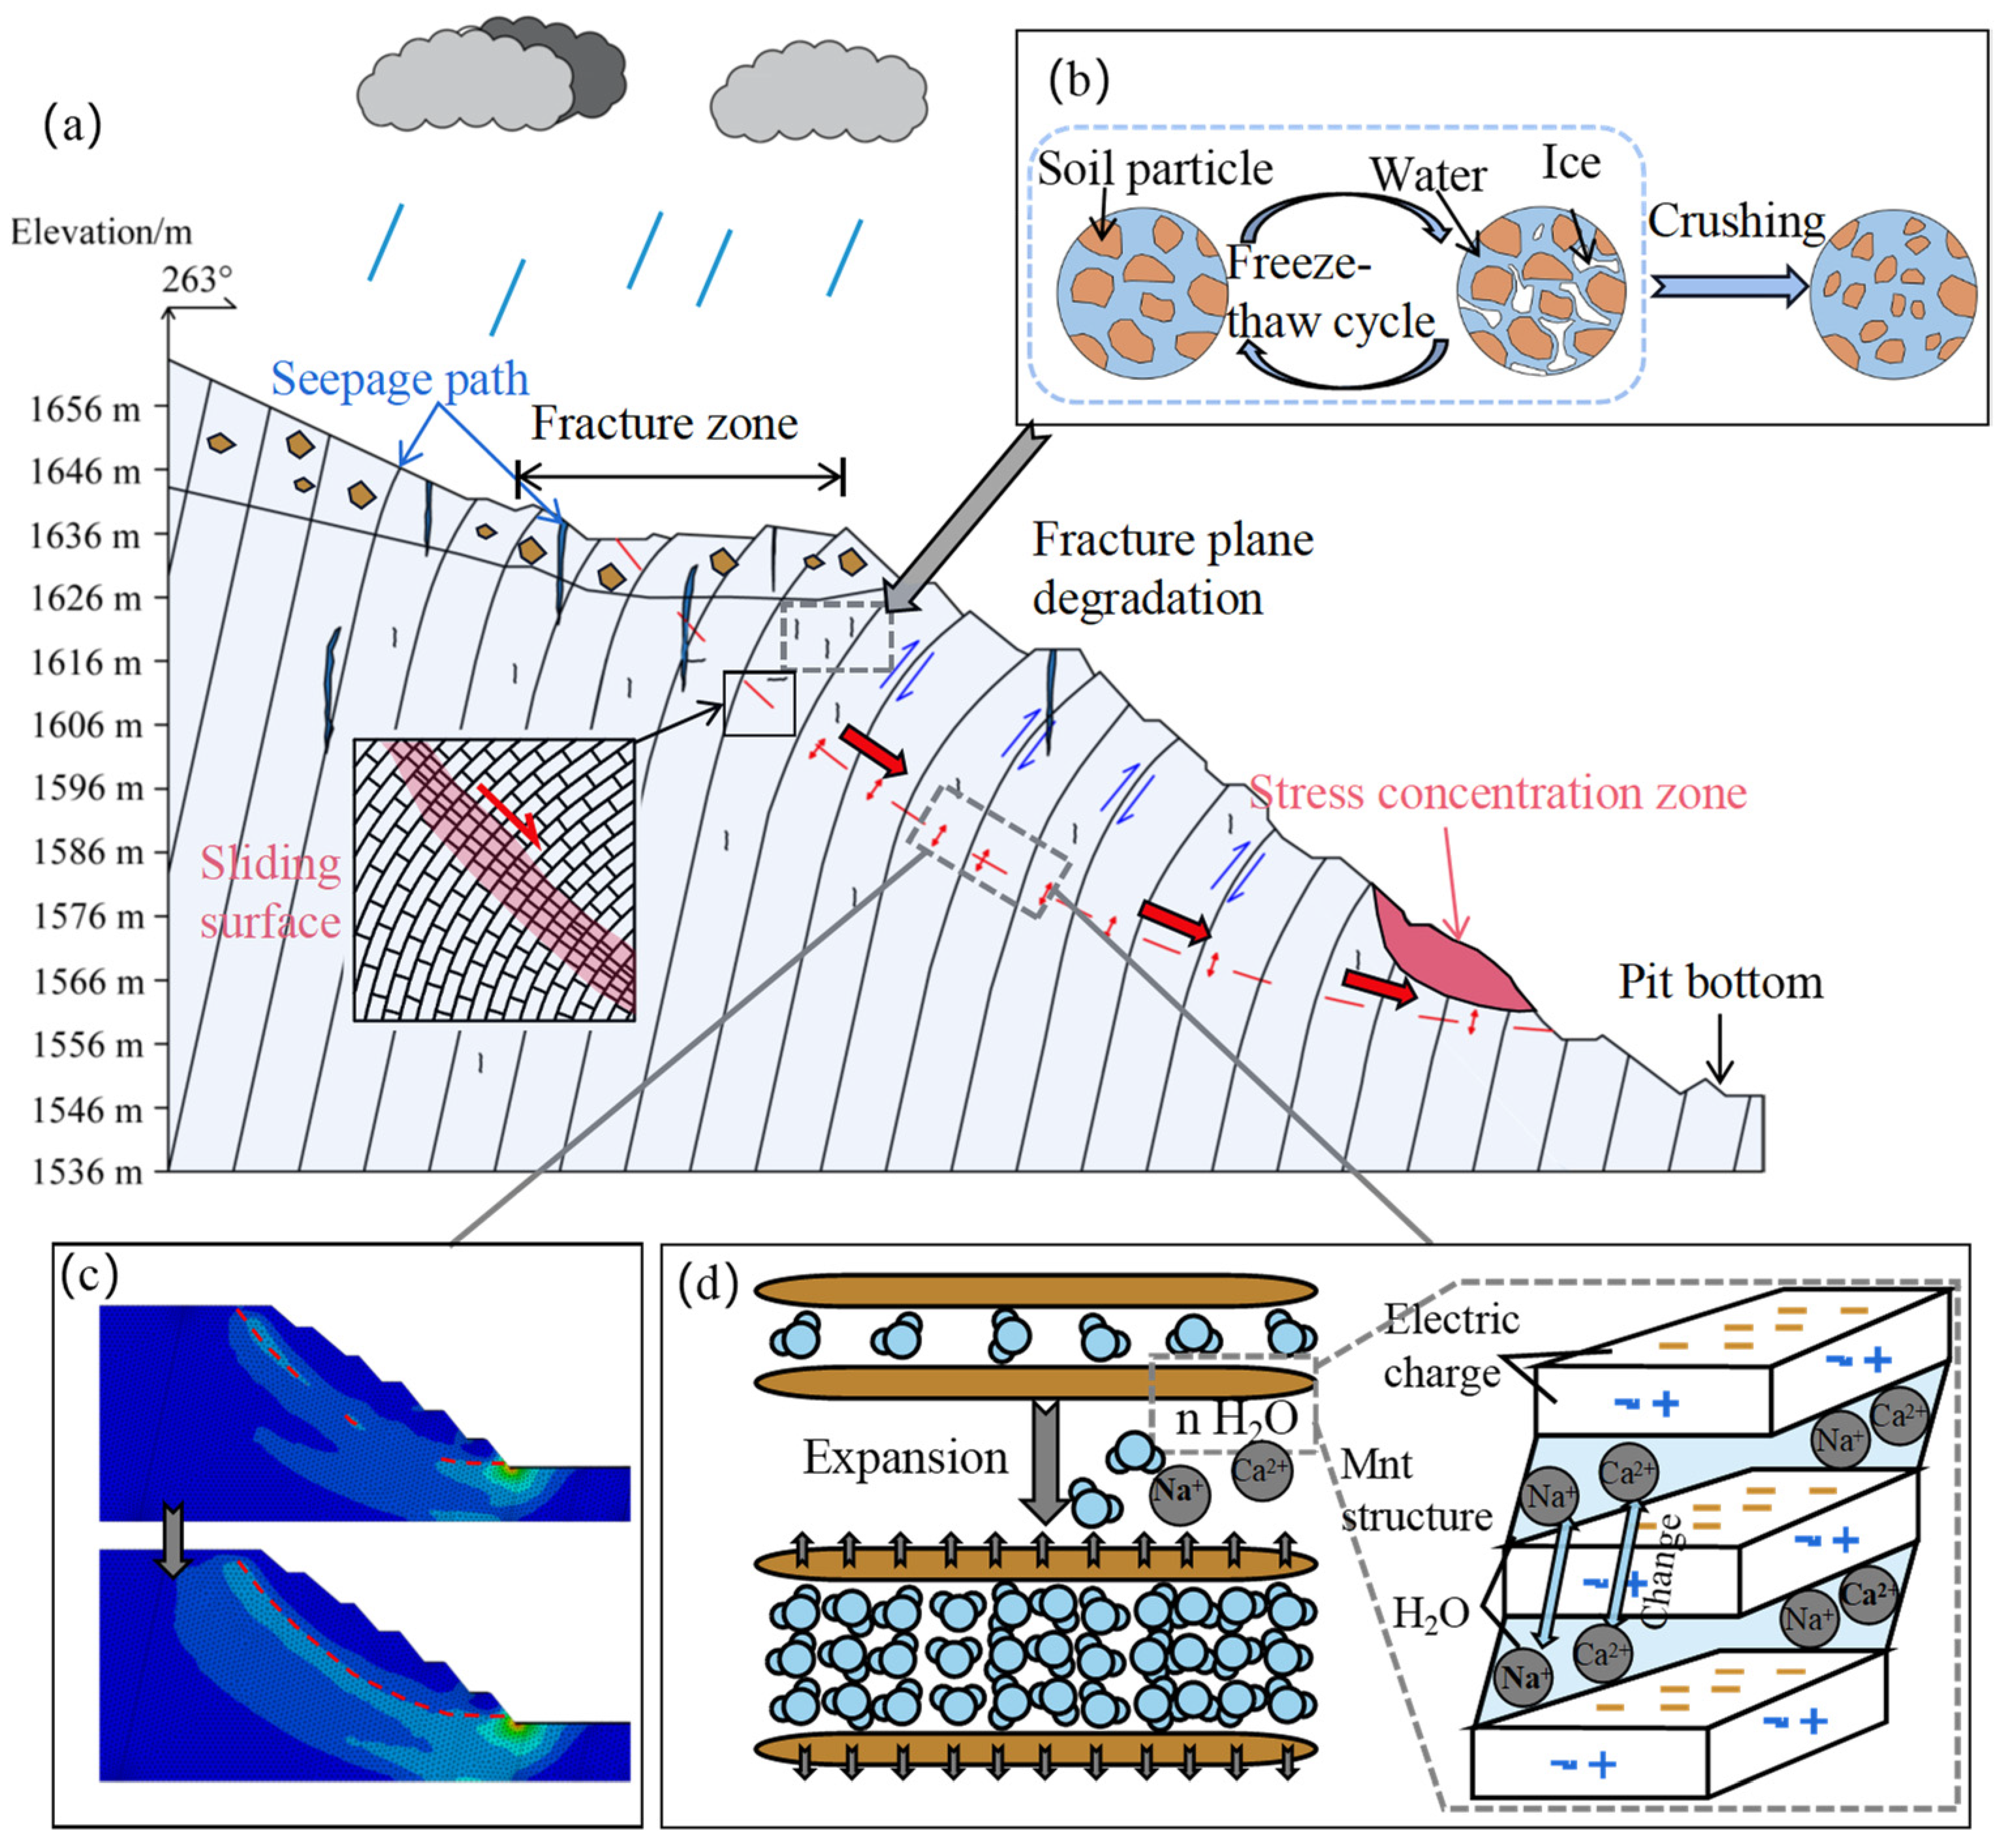
Figure 30.
Deformation and failure mechanism of the eastern pit slope in Wolong Coal Mine. (a) Factors influencing slope deformation and failure; (b) Freeze–thaw cycles; (c) Variation in the shear strain increment; (d) Clay minerals expand and soften when exposed to water.
Figure 30.
Deformation and failure mechanism of the eastern pit slope in Wolong Coal Mine. (a) Factors influencing slope deformation and failure; (b) Freeze–thaw cycles; (c) Variation in the shear strain increment; (d) Clay minerals expand and soften when exposed to water.
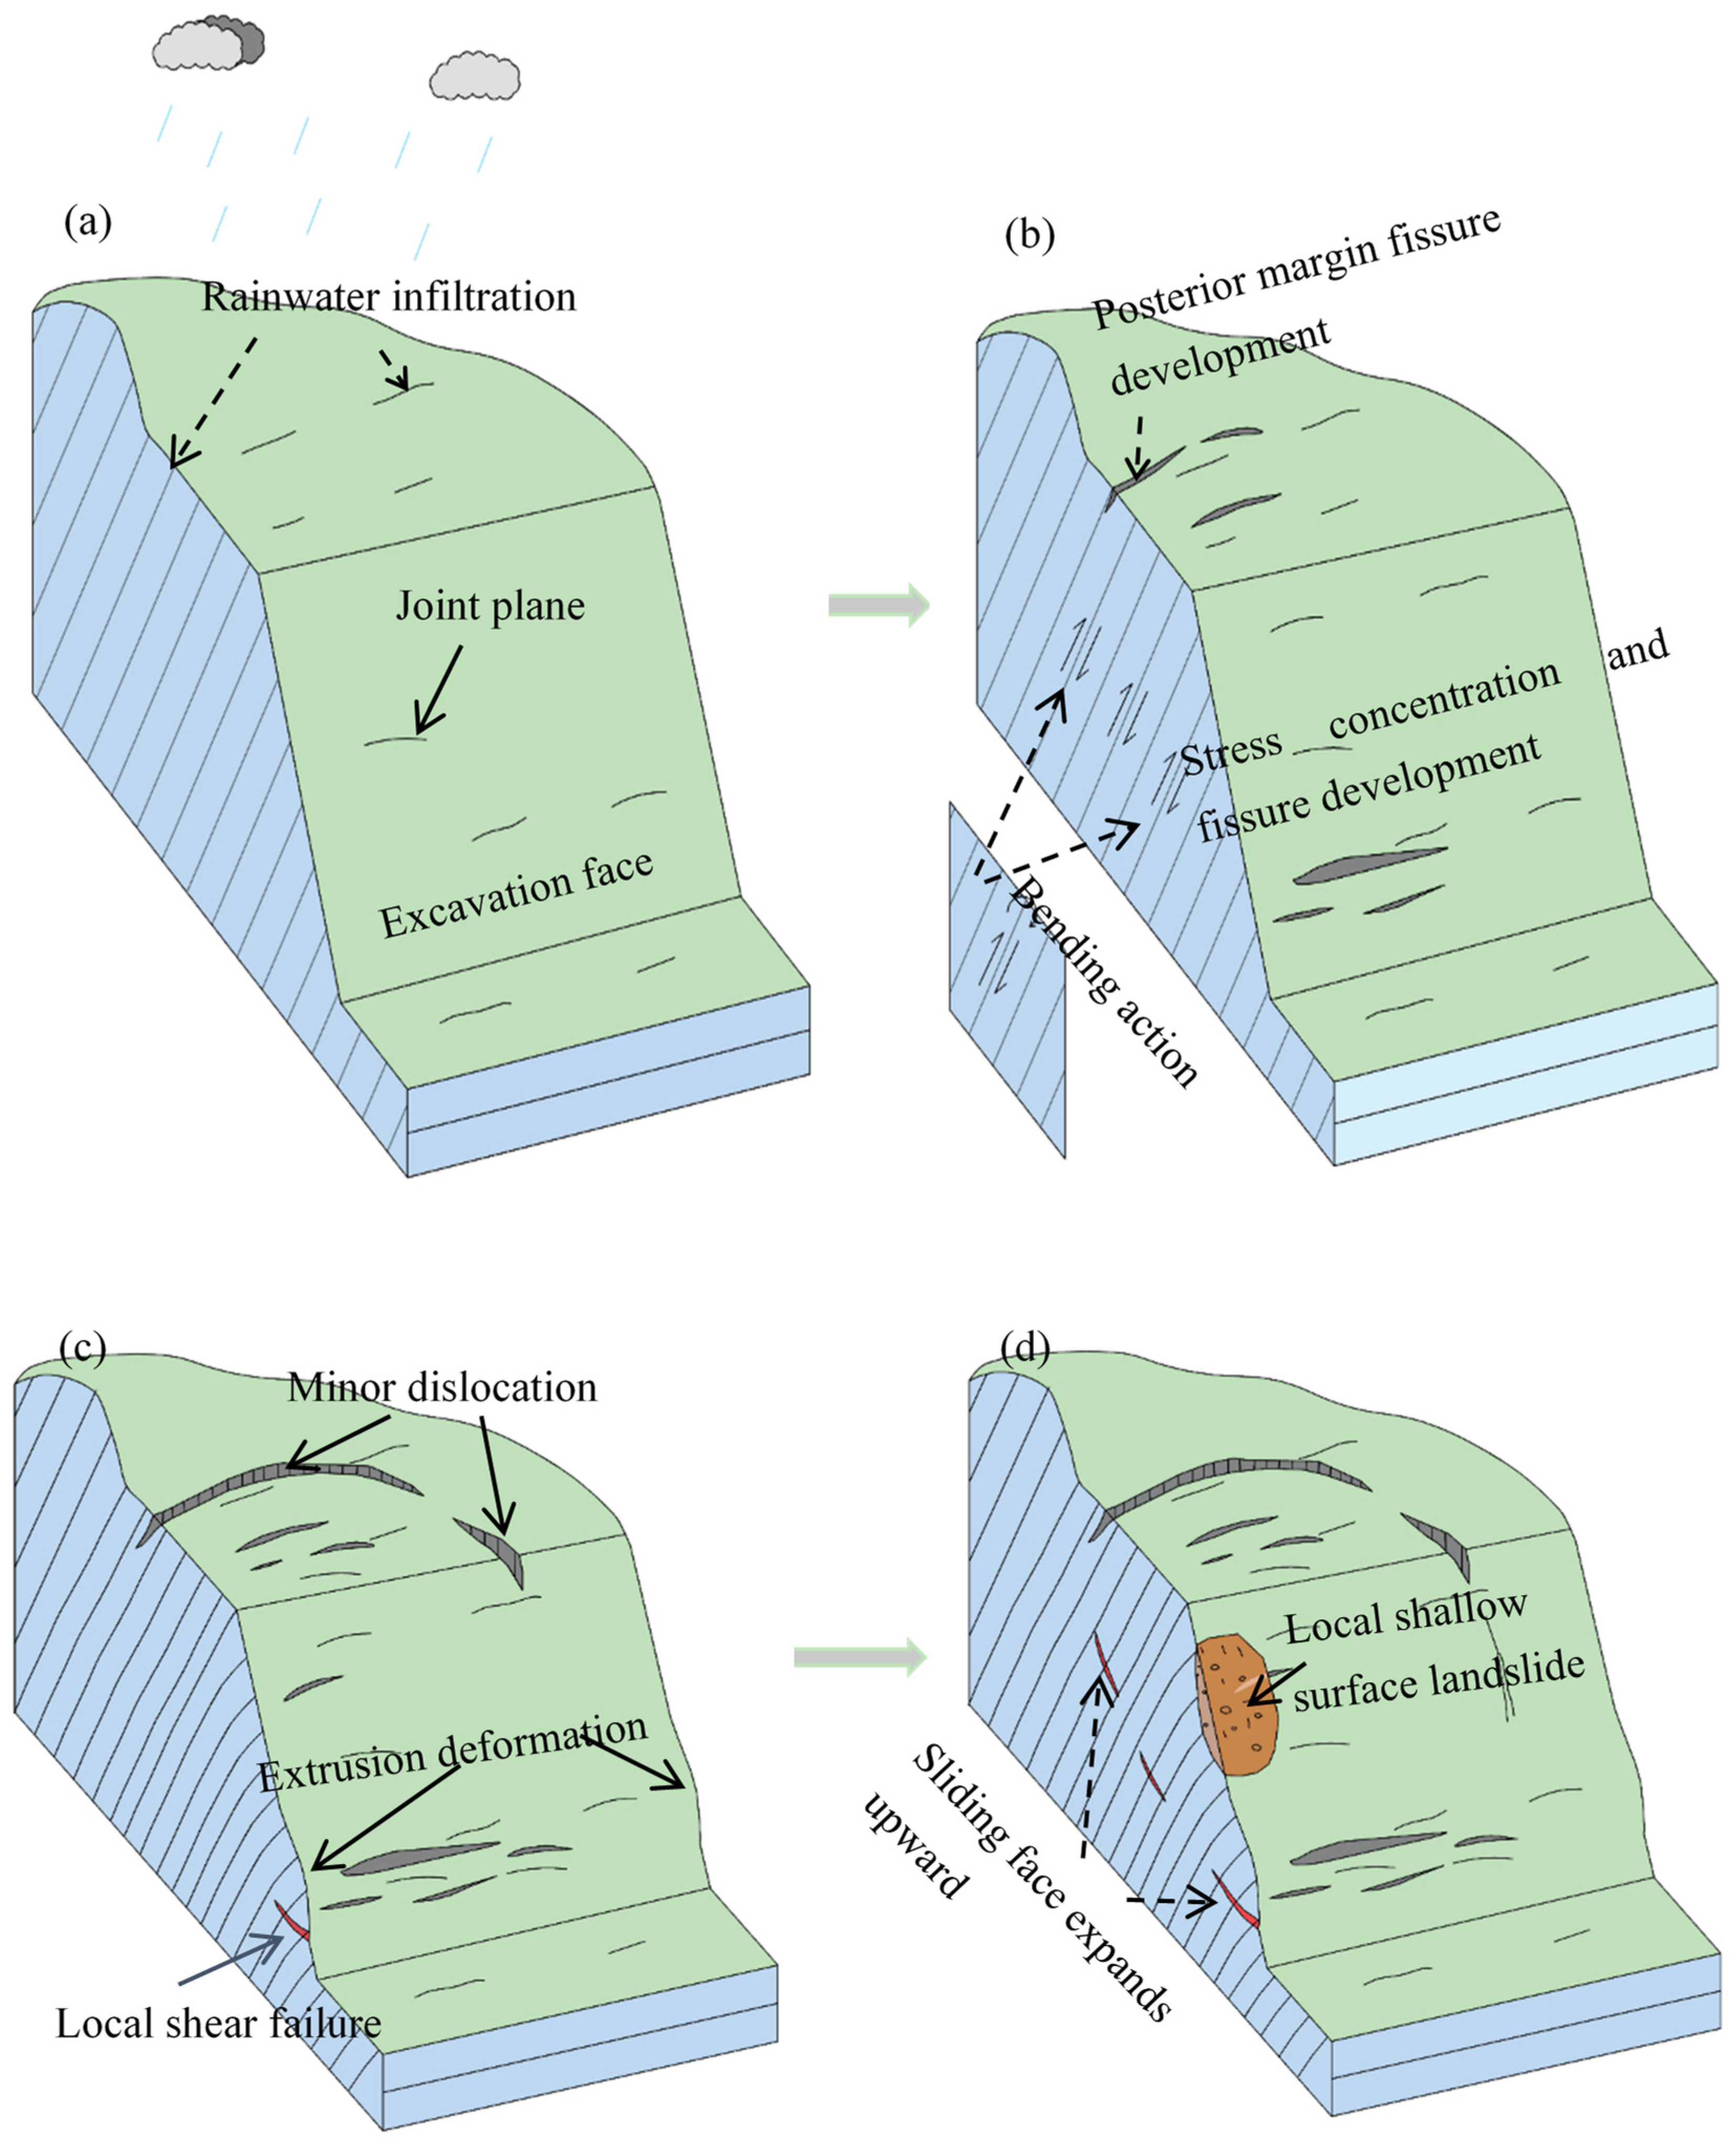
Figure 31.
Instability and failure process of the eastern pit slope in the Wolong Coal Mine: (a) The initial deformation stage; (b) The development stage of lateral shear misalignment; (c) The development stage of horizontal tensile-shear damage; (d) The slip surface development to preslip stage.
Figure 31.
Instability and failure process of the eastern pit slope in the Wolong Coal Mine: (a) The initial deformation stage; (b) The development stage of lateral shear misalignment; (c) The development stage of horizontal tensile-shear damage; (d) The slip surface development to preslip stage.
Table 1.
Status of mine excavation (2023.03).
Table 1.
Status of mine excavation (2023.03).
| Category | Number of Steps | Pit Floor Elevation/m | Pit Top Elevation/m | Relative Elevation/m | Terrain Slope/° |
|---|
| North pit | 6 | 1580 | 1637 | 57 | 32 |
| South pit | 8 | 1545 | 1628 | 83 | 33 |
Table 2.
Landslide parameters in the Wolong open-pit coal mine.
Table 2.
Landslide parameters in the Wolong open-pit coal mine.
| Landslide | Length/m | Width/m | Relative Height Difference/m | Terrain Slope/° | Sliding Direction/° | Area/m2 |
|---|
| I-1 | 45 | 48 | 26 | 30 | 255 | 0.20 × 10⁴ |
| I-2 | 107 | 117 | 43 | 28 | 237 | 1.12 × 10⁴ |
| I-3 | 35 | 58 | 17 | 31 | 219 | 0.16 × 10⁴ |
| I-4 | 129 | 143 | 59 | 28 | 262 | 1.71 × 10⁴ |
| I-5 | 116 | 135 | 49 | 26 | 263 | 1.47 × 10⁴ |
Table 3.
Analysis results of X-ray diffraction components.
Table 3.
Analysis results of X-ray diffraction components.
| Sample | Qtz | Kfs | Ab | Ank | Cal | Clay | Relative Content of Clay Mineral Species |
|---|
| Montmorillonite | Illite | Kaolinite | Chlorite |
|---|
| % | % | % | % | % | % | % | % | % | % |
|---|
| Gritstone 1 | 42.4 | 14.6 | 24.7 | 1.7 | 1.0 | 15.6 | 19.3 | 2.0 | 59.9 | 18.8 |
| Gritstone 2 | 49.1 | 14.1 | 12.0 | 2.1 | 0.0 | 22.7 | 92.4 | 1.2 | 4.1 | 2.3 |
| Gritstone 3 | 43.5 | 16.5 | 9.3 | 0.7 | 0.0 | 30.1 | 81.8 | 2.4 | 12.3 | 3.4 |
| Fine sandstone 1 | 23.8 | 23.3 | 15.6 | 1.3 | 29.0 | 6.9 | 6.4 | 1.6 | 44.3 | 47.6 |
| Fine sandstone 2 | 48.1 | 6.5 | 6.1 | 1.1 | 1.9 | 36.3 | 68.4 | 4.8 | 19.3 | 7.5 |
| Fine sandstone 3 | 39.0 | 6.8 | 5.6 | 1.2 | 10.7 | 33.8 | 68.9 | 8.7 | 13.1 | 9.3 |
| Sandy mudstone 1 | 38.2 | 5.2 | 7.5 | 0.0 | 0.0 | 49.1 | 66.6 | 6.0 | 18.3 | 9.1 |
| Sandy mudstone 2 | 11.5 | 1.8 | 2.9 | 0.0 | 44.1 | 29.7 | 9.3 | 22.7 | 48.8 | 19.2 |
| Sandy mudstone 3 | 35.7 | 5.5 | 7.1 | 0.0 | 0.0 | 50.9 | 10.3 | 12.6 | 56.4 | 20.6 |
| Mudstone 1 | 37.5 | 1.6 | 4.8 | 0.0 | 0.0 | 54.9 | 44.1 | 15.7 | 24.2 | 16.0 |
| Mudstone 2 | 34.1 | 3.4 | 2.9 | 0.0 | 0.0 | 59.6 | 43.5 | 13.2 | 25.7 | 17.6 |
| Mudstone 3 | 39.5 | 8.9 | 6.7 | 0.0 | 0.0 | 44.9 | 71.8 | 6.7 | 13.1 | 8.4 |
Table 4.
Results of laboratory physical and mechanical tests.
Table 4.
Results of laboratory physical and mechanical tests.
| Lithology | Particle Density | Unit Weight (g/cm3) | Uniaxial Compressive Strength (MPa) | Deformation Index | Shear Strength | Tensile Strength |
|---|
| Natural State | Dry State | Elastic Modulus | Poisson’s Ratio | Cohesion | Internal Friction Angle | Natural State |
|---|
| Single Value | Mean Value | E/GPa | v | C/MPa | φ/° | Single Value | Mean Value |
|---|
| Gritstone | 2.66 | 2.32 | 5.04 | 8.25 | 0.101–0.127 | 0.37 | 0.229 | 43.2 | 0.068 | 0.152 |
| 7.52 | 0.147 |
| 12.2 | 0.241 |
| 2.65 | 2.2 | 4.65 | 6.09 | 0.072–0.108 | 0.38 | 0.111 | 43.8 | 0.051 | 0.081 |
| 5.91 | 0.062 |
| 7.7 | 0.130 |
| Medium sandstone | 2.65 | 2.2 | 13.4 | 17.7 | 4.49–7.54 | 0.27 | 0.473 | 43.5 | 0.173 | 0.241 |
| 19.5 | 0.186 |
| 20.1 | 0.364 |
| 2.66 | 2.23 | 23.8 | 30 | 0.156–0.2 | 0.36 | 1.23 | 43.9 | 0.146 | 0.24 |
| 27.2 | 0.257 |
| 39.1 | 0.316 |
| Fine sandstone | 2.74 | 2.43 | 9.69 | 11 | 1.49–2.46 | 0.28 | 0.797 | 41.7 | 0.260 | 0.334 |
| 11.1 | 0.281 |
| 12.3 | 0.460 |
| 2.71 | 2.41 | 15 | 16.6 | 1.12–2.10 | 0.29 | 0.982 | 40.7 | 0.063 | 0.088 |
| 15.8 | 0.069 |
| 19.1 | 0.132 |
| Mudstone | 2.71 | 2.32 | 9.23 | 10.7 | 0.225–0.462 | 0.3 | 0.528 | 46.7 | 0.060 | 0.223 |
| 10.5 | 0.242 |
| 12.4 | 0.368 |
| 2.73 | 2.32 | 6.21 | 8.72 | 0.444–0.836 | 0.31 | 0.445 | 40.8 | 0.188 | 0.26 |
| 8.15 | 0.222 |
| 11.8 | 0.371 |
| Sandy mudstone | 2.72 | 2.36 | 16.7 | 20.1 | 0.126–0.156 | 0.35 | 2.65 | 43.8 | 0.243 | 1.58 |
| 18.9 | 2.14 |
| 24.8 | 2.36 |
| 2.73 | 2.4 | 15.1 | 19.8 | 0.030–0.069 | 0.38 | 0.879 | 41.2 | 0.096 | 0.28 |
| 18 | 0.282 |
| 26.4 | 0.461 |
Table 5.
Development characteristics of fractures of different lithologies in the study area.
Table 5.
Development characteristics of fractures of different lithologies in the study area.
| Lithology | Fracture Set | Orientation | Number of Fractures | Average Spacing/cm | Jv |
|---|
| Gritstone | 1 | 96° ∠ 73° | 57 | 8.65 | 17.70 |
| 2 | 76° ∠ 51° | 28 | 28.5 |
| 3 | 100° ∠ 53° | 9 | 38.05 |
| Medium sandstone | 1 | 65° ∠ 68° | 90 | 7.23 | 21.27 |
| 2 | 343° ∠ 38° | 37 | 13.43 |
| Fine sandstone | 1 | 74° ∠ 65° | 182 | 11.17 | 11.25 |
| 2 | 288° ∠ 37° | 11 | 43.55 |
| Mudstone | 1 | 80° ∠ 78° | 98 | 41.66 | 9.30 |
| 2 | 185° ∠ 83° | 62 | 23.44 |
| 3 | 283° ∠ 69° | 45 | 37.88 |
| Sandy mudstone | 1 | 68° ∠ 81° | 21 | 0.23 | 5.13 |
| 2 | 308° ∠ 23° | 12 | 22.51 |
| 3 | 227° ∠ 43° | 14 | 27.13 |
Table 6.
Parameters of generalized Hoek–Brown criterion for typical lithologies in the study area.
Table 6.
Parameters of generalized Hoek–Brown criterion for typical lithologies in the study area.
| Lithology | GSI | | D | | s | a |
|---|
| Gritstone | 32.1 | 15 | 0.33 | 0.822 | 0.0002 | 0.519 |
| Medium sandstone | 29.9 | 14 | 0.42 | 0.589 | 0.0001 | 0.522 |
| Fine sandstone | 30.2 | 12 | 0.18 | 0.834 | 0.0003 | 0.522 |
| Mudstone | 26.9 | 8 | 0.13 | 0.490 | 0.0002 | 0.528 |
| Sandy mudstone | 20.8 | 10 | 0.03 | 0.566 | 0.0001 | 0.541 |
Table 7.
Geomechanical properties of rock masses estimated by GSI system.
Table 7.
Geomechanical properties of rock masses estimated by GSI system.
| Lithology | Weight | Cohesion | Internal Friction Angle | Deformation Modulus |
|---|
| Cm/MPa | φm/° | Em/MPa |
|---|
| Gritstone | 24.4 | 0.270 | 24.65 | 822.01 |
| Medium sandstone | 23.6 | 0.598 | 22.01 | 1093.18 |
| Fine sandstone | 20.5 | 0.559 | 24.74 | 1188.89 |
| Mudstone | 21.8 | 0.367 | 20.56 | 891.83 |
| Sandy mudstone | 18 | 0.447 | 21.41 | 735.04 |


 ,
, 


