1. Introduction
The proposed model follows a polygonization approach for discretizing the cross section of a beam element, whose theoretical part has been extensively described in Part I [
1] of this paper. As a follow-up, the developed model has been validated by comparing its analytical results with those of a wide variety of experimental ones from the literature. Since it aims to be efficient for any cross-section shape and loading pattern, representative experimental studies have been chosen from the literature, which are used in this paper.
It must be pointed out that the experimental research on the inelastic response of reinforced concrete linear elements under bending due to lateral cyclic loading combined with constant or variable axial load is quite limited. This research mainly uses predefined uniaxial or biaxial loading paths of the lateral load while the majority of specimens are of classic cross-sectional shapes (orthogonal, circular, etc.). Moreover, a serious part of this research is focused on the study of specific inelastic parameters such as the plastic hinge length, the influence of the reinforcement ratio on the moment capacity of the members, the moment curvature relation, et al. Only a limited number of experimental results are provided in terms of lateral load P vs. horizontal displacement δ or in terms of bending moment M vs curvature φ for a specific cross section of a member.
Focusing on the experimental investigation carried out over the last three decades and setting the completeness of the provided experimental data and results (in terms of
P-
δ or
M-
φ) as criterion, representative examples for orthogonal cross sections, solid or tubed, can be found in references [
2,
3,
4,
5,
6,
7,
8]. For circular or ring cross sections in references [
9,
10,
11,
12,
13], for L-shaped column specimens in references [
14,
15], and for T-beams in references [
16,
17]. These references are reported in chronological order.
For the needs of the validation of the present mathematical model, representative experimental results were collected from the previous mentioned literature, using as criteria the completeness of the provided data, i.e., geometry and reinforcement details of the specimens, mechanical properties of concrete and reinforcing steel, detailed records of the imposed loading paths (in terms of imposed lateral displacements or forces), and analytical experimental results in terms of P-δ or M-φ. The records of the imposed loading paths as well as the resulting experimental hysteretic loops were digitally scanned in precision for purposes of comparisons with the analytical results of the present model.
Thus, in the present study, comparisons have been made for column specimens with cross section shapes as: rectangular (Bousias [
3], Low and Moehle [
2]), hollow rectangular (Yatsumoto et al. [
8]), circular (Lee et al. [
11]), hollow circular (Cassese [
13], Kim [
10]), and L-type (Pham and Li [
15], Wang et al. [
14]). A T-beam specimen (Ma et al. [
16]) has also been studied. These experiments fall within the present limitations of the model concerning slender elements without significant influence of the bond slip phenomenon.
Furthermore, various representative loading paths have been considered in these experimental studies, such as: (a) cyclic uniaxial or biaxial loading with varying displacement values, (b) butterfly-shaped nested displacement paths, and (c) square-shaped nested displacement paths with increasing or decreasing order. In these displacement paths, axial load is either constant or varying throughout the experiment.
The proposed model has been verified on a 2D one-bay one-story frame (Kakaletsis and Karayannis [
18]) subjected to in-plane cyclic loading. In the following sections, a description of each experiment along with the analytical results of the model is presented.
The complete computational characteristics of the proposed model, which uses the experimental data of the present paper as verification examples, are described in detail in Part I [
1]. More experimental results for the verification of the proposed model can be found in Sfondylis [
19].
2. Material and Model Parameters in Analyses
As mentioned in Part I of the present paper, the MINOS FEM code [
20] is used for the numerical reproduction of the nonlinear behavior of each experimental specimen. For these analyses, the material properties, regarding the ultimate compressive strain of the unconfined concrete,
εcu, or the corresponding ultimate strain of steel,
εsu, were taken from the corresponding papers or reports. Where this information was not available, realistic values for the above parameters were used based on code provisions such as such as the Part 3 of the Eurocode 8 [
21] or the Greek Code for Interventions and Repairs of RC Structures (KAN.EPE. 2017 [
22]). The strength
fcc and the corresponding strain
εcc of the confined concrete were computed from Equations (2) [
1] and (4) [
1], respectively. For all specimens, the ultimate strain of the confined concrete,
εcu, is computed according to the above-mentioned codes. For each control cross section along the element length, two different concrete constitutive
σ-
ε laws are applied (an unconfined concrete
σ-
ε law for the cross section cover and a confined one for its core). The latter is indicated with a light-yellow color in the figures in
Section 3,
Section 4,
Section 5,
Section 6,
Section 7,
Section 8,
Section 9,
Section 10,
Section 11 and
Section 12, below.
The values of Table 1 of Part I [
1] of the present paper were used for the parameters of the steel constitutive law, as they are more suitable for common steel types.
On the matter of control cross sections along the element length, a minimum of three sections were used in all analyses (see Figure 13 [
1]). Parametric investigation using more sections showed no significant difference in the results. The Delaunay triangulation of the control cross sections was made based on a medium grid of triangles, considering a 2 cm triangle side as a mean value.
In each of the following sections, the material parameters used in the analysis, regarding the unconfined concrete and the steel, are shown in the corresponding tables.
3. Experimental Tests—Bousias [3]
Bousias [
3] performed experimental tests on twelve RC column type cantilever specimens, identical in terms of their material properties, cross section geometry, reinforcement bar sizes, and their placement. Various loading path histories were applied as displacement control, such as cyclic uniaxial or biaxial. The cantilever specimens were designed to fail primarily in bending, with the only difference between them being the loading history. In three of these specimens, a varying axial load was applied.
In the context of evaluating the proposed model, five specimens of this series have been chosen for comparison of the experimental results with the analysis of the model. The results are presented in the following sections. These results are provided in the form of force-displacement plots, per orthogonal loading direction
x and
y, and in form of the evolution of axial displacement of the cross section (
z direction) vs the number of loading steps. Note that for those parameters for which data were not available, realistic assumptions were made. More specifically, for the values of concrete strains
εco,
εcu, at the maximum and the ultimate strength
fc and
fcu, respectively, for the steel strain
εsu at its ultimate strength, and for the hysteretic parameters of reinforcing steel.
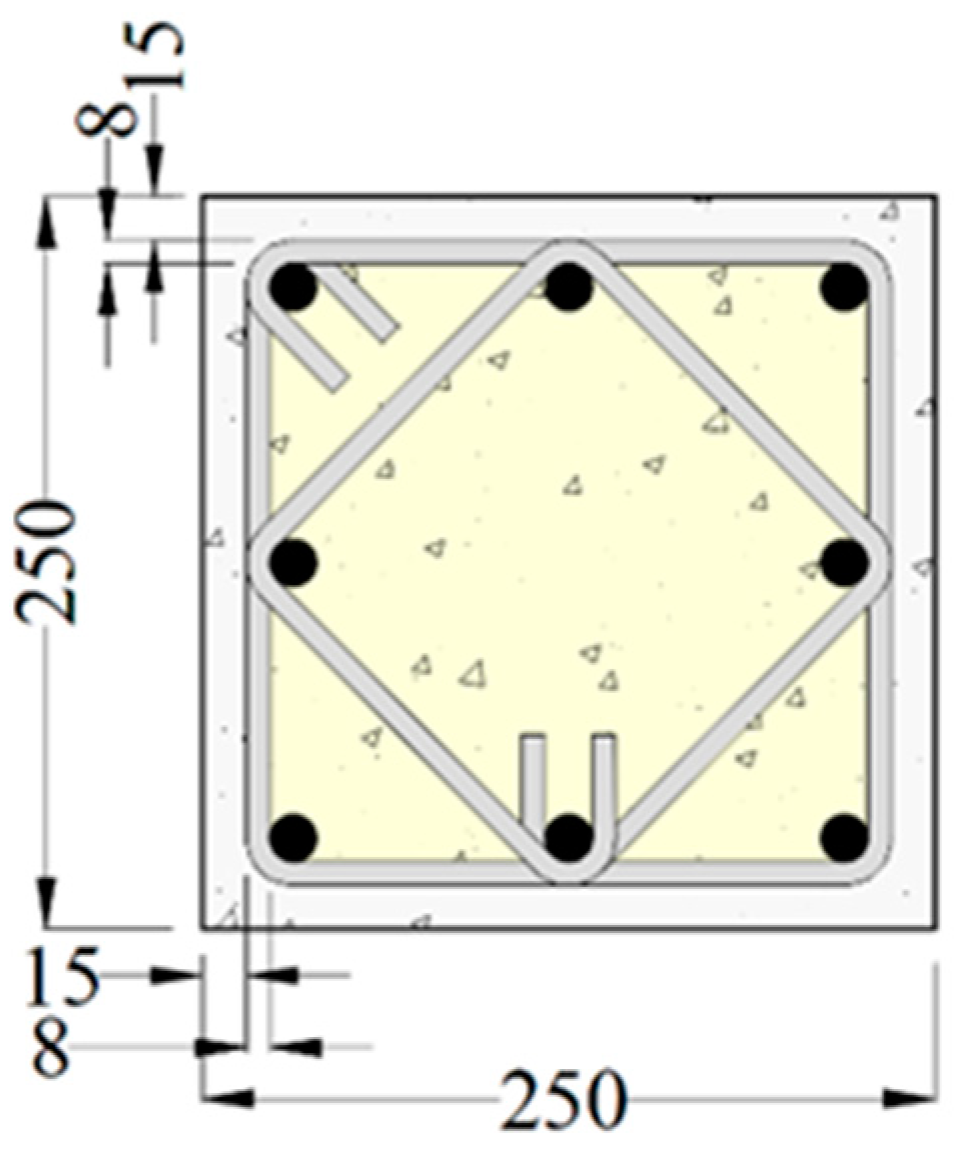
Figure 1 shows the geometry data of the five specimens, named S0, S1, S2, S5, and S8.
Table 1 summarizes the loading and material data for these specimens and the concrete and steel model properties used in the analyses.
3.1. Specimen S0
Specimen S0 was subjected to uniaxial cyclic loading in
x direction, applying the displacement path seen in
Figure 2. This path has three successive displacement patterns with their maximum values occurring in increasing order. Each one consists of cyclic displacements with initially increasing values that then decrease.
Figure 3 shows the analytical results of the proposed model vs the experimental ones. Plot
Px-
δx is the force-displacement response and shows an almost excellent agreement between the model prediction and the experiment. The second plot shows the evolution of the axial displacement
δz in direction normal to the cross-section plane vs. the loading step number. Herein, the model prediction curve is relatively shifted upwards by a very small quantity, which points to a corresponding relaxation of the axial strain
εo. On the other hand, it emphasizes the difficulty of experimentally measuring this axial displacement. As such, a question arises for the accuracy of this measurement. At least qualitatively, the model can predict this quantity quite well; it must be noticed that the mean upward shift is about 0.35 mm, i.e., a very small quantity. Other than the present specimen S0, these comments (about the very small deviation of the axial displacement
δz) are only relevant for specimens S1 and S2 (see
Section 3.2 and
Section 3.3 below). For specimens S5 and S8 (see
Section 3.4 and
Section 3.5 below), the agreement about the displacement
δz is very good.
It must be noted that the δz axial displacement is of less practical importance in comparison with the transverse displacement δx. It is presented in the present research work since it is available from experimental data, focusing on the ability of the model to predict even those detailed deformations.
3.2. Specimen S1
Specimen S1 was subjected to biaxial cyclic loading with the two transverse horizontal loading paths shown in
Figure 4, applied in directions
x and
y, respectively. The displacement cycles in directions
x and
y are applied alternately. During a step period of nonzero displacements of one cycle, the other’s cycle displacements are zero. Displacement values of each cycle are progressively increased.
The first two plots of
Figure 5 show the force-displacement response separately for each direction (
x and
y). An almost excellent agreement is noticed between the experimental and analytical results. The third plot shows the evolution of the axial displacement
δz in a direction normal to the cross-section plane vs the loading step number.
The comments for specimen S0 about the axial displacement δz also hold for specimen S1. Herein, the model’s prediction curve is shifted upward to a value range from about 0.50 to 1.75 mm.
3.3. Specimen S2
Specimen S2 was subjected to biaxial cyclic loading with the two transverse horizontal loading paths shown in
Figure 6, applied in directions
x and
y, respectively. The experiment consists of six successive loading patterns. In each one of them, a constant displacement value is applied in
y direction. If this
y displacement holds, the displacement in the transverse direction
x is cyclic, with a linearly increasing values, ranged up to the value of the constant displacement of direction
y.
Note that the constant displacement values in the y direction appear slightly wavy instead of perfectly straight. This is due to the ability of the experimental instrumentation to hold constant displacement values. This displacement record is used in the analysis with the proposed model.
Figure 7 shows the force-displacement responses
Px-
δx and
Py-
δy for directions
x and
y, respectively. A very good to excellent agreement is noticed between experimental and analytical results. The third plot shows the evolution of the axial displacement
δz in a direction normal to the cross-section plane vs the loading step number.
In comparison specimens S0 and S1, the model’s prediction curve of the evolution of the axial displacement δz is shifted upward to a value range from about 0.50 to 0.75 mm, at most.
3.4. Specimen S5
Specimen S5 was subjected to biaxial cyclic loading with the displacement path of
Figure 8. The biaxial displacement path starts at the origin (0, 0) and forms nested “butterfly”-shaped loops. In each loop, the triangular path of the right side follows a counterclockwise direction; after its completion, it continues on the left side with a corresponding triangular path that follows a clockwise direction. For a complete loop, the ratio of the imposed displacement values of the triangular paths of both sides is 1:1.
The force-displacement responses
Px-
δx and
Py-
δy are shown in the first two plots in
Figure 9. A very good to excellent agreement is noticed between experimental and analytical results. The third plot shows the evolution of the axial displacement
δz in a direction normal to the cross-section plane vs the loading step number.
In contrast to specimens S0, S2, and S2, the model’s prediction curve of the evolution of the axial displacement δz of specimen S5 is in good agreement with the experimental one.
3.5. Specimen S8
Specimen S8 was also subjected to biaxial cyclic loading. The imposed displacement path is shown in
Figure 10. The biaxial displacement path starts from origin (0, 0) and is in the form of nested concentric squares of increasing size, described in an anti-clockwise direction. The characteristic of this loading path is that the first–inner–load cycle causes extensive damage to the specimen and therefore intense inelasticity.
The first two plots in
Figure 11 show the force-displacement responses
Px-
δx and
Py-
δy, respectively. An excellent agreement is noticed between the experimental and analytical results. The third plot shows the evolution of the axial displacement
δz in a direction normal to the cross-section plane vs the loading step number.
As in specimen S5, the model’s prediction curve of the evolution of the axial displacement δz is in good agreement with the experimental one.
4. Experimental Tests—Low and Moehle [2]
Low and Moehle [
2] performed experimental tests on five RC column type cantilever specimens at a scale of 1:4. The cross-section geometry, the reinforcement bar sizes, and their placements were identical for all specimens. A different loading path has been applied to each specimen, more specifically cyclic uniaxial or biaxial loading with constant or varying axial load. The cantilever specimens were designed to fail primarily in bending.
Figure 12 shows the geometry and reinforcement data of specimens. All specimens have a clear length of 514 mm and cross-section dimensions of 127 × 165 mm. The longitudinal reinforcement consists of four corner bars with a diameter of 9.52 mm and six other bars with a diameter of 6.35 mm, placed on the four sides. The transverse reinforcement of the cross section consists of 3 mm diameter steel hoops placed at distances of 25.4 mm for the first 23 cm from the fixed node (critical length) and 38.1 mm for the remaining length of the specimen.
Table 2 summarizes the loading and material data for these specimens and the concrete and steel model properties used in the analyses. The results of the analyses are presented in the following sections.
4.1. Specimen #3
Specimen #3 was subjected to biaxial cyclic loading with the displacement path of
Figure 13. This path is in the form of concentric nested squares of increasing size from the inner to the outer. Each nested square displacement path is applied quarter-by-quarter.
Figure 14 shows the force-displacement responses
Px-
δx and
Py-
δy. A very good to excellent agreement is noticed between the experimental and analytical results. Some small overestimation of the force load is noticed in the backbone curve of the first three cycles of the response of
x direction; the agreement is almost excellent in the remaining cycles.
4.2. Specimen #5
For specimen #5, the loading path of specimen #3 is used but with a varying compressive axial load.
Figure 15a shows the displacement path with the concentric nested squares. The variation of the compressive axial load
N ranges from −2.22 to −88.96 kN, corresponding to normalized axial load
ν from −0.003 to −0.12, respectively.
The values of the axial load were related to the values of the imposed displacements along the weak axis of the cross-section (axis x, parallel to sides of 127 mm). To be specific, in each loading cycle, the values of the axial load varied linearly from −44.48 kN to −88.96 kN when the displacement values were from zero to the maximum positive value. For loading in the negative direction of axis x, the values of the axial load varied linearly from −44.48 kN to −2.22 kN for corresponding displacement values starting from zero to the maximum negative value.
The four colored dots of each square path of
Figure 15a denote the linear variation of the axial load, which holds for this path, and is presented graphically with the same color in
Figure 15b.
Figure 16 shows the force-displacement responses
Px-
δx and
Py-
δy. A very good to excellent agreement is noticed between the experimental and analytical results. Again, as in specimen #3, a small overestimation of the force load is noticed in the backbone curve of the first three cycles of the response of
x direction, while the remaining cycles are in almost excellent agreement for both directions
x and
y. The yellow color marks denote small regions of the response curves in which convergence was not achieved for the original value of load increment Δ
P, so the split process was automatically activated to overcome this local non-convergence (see Sections 6.1 [
1] and 6.2 [
1] of Part I of this paper). As mentioned in Part I, the influence of this split is extremely small.
5. Experimental Tests—Ma et al. [16]
Ma et al. [
16] performed experimental tests on nine RC beam type cantilever specimens. Six of the specimens were of rectangular cross-section and the other three of T-shaped cross section. The experimental research of Ma et al. aimed to study the critical regions of RC beams near the beam-column joints.
Two specimens, named T-1 and T-2, were chosen for the validation of the proposed model. The specimens are identical in terms of cross-section geometry, reinforcement bar sizes, and their placements, but with different loading histories. These T-beam specimens are subjected to different cyclic uniaxial loadings, imposing displacement paths without axial load. These paths consist of increasing intensity cycles until failure of the specimen.
Figure 17 shows the geometry and reinforcement data of the two specimens.
Table 3 summarizes the material data and the concrete and steel model properties used in the analyses. The results of the analyses are presented in the following sections.
5.1. Specimen T-1
Specimen T-1 was subjected to uniaxial cyclic loading with the displacement path in
Figure 18. This path has five successive displacement patterns, with their maximum values in increasing order. Each pattern consists of three cycles with equal positive and negative displacement values.
Figure 19 shows the moment-curvature response
Mx-
φx for the cross section near to the fixed end of the beam and the force-displacement response
Py-
δy of its free end. An acceptable agreement is noticed between experimental and analytical results. The analytical
Mx-
φx hysteretic curve shows some relatively acceptable overestimation of the positive moment
Mx and of the negative curvature
φx. On the contrary, the analytical
Py-
δy hysteretic curve has a much better agreement with the experimental, with only a small overestimation of the positive force
Py in the last four loading cycles. This relaxation behavior shows that the model is relatively sensitive to low discretization in Delaunay triangles (see Section 5 of Part I) for the case where a low computational cost is required.
5.2. Specimen T-2
Specimen T-2 has been subjected to a half uniaxial loading cycle, as shown in
Figure 20.
Figure 21 shows the moment-curvature response
Mx-
φx for the cross section near to the fixed end of the beam and the force-displacement response
Py-
δy of its free end. Small overestimates are noticed by comparison to specimen T-1.
6. Experimental Test—Cassese et al. [13]
Cassese et al. [
13] performed experimental tests on two RC column type cantilever specimens. These specimens simulate typical cross sections of bridge pillars in Italy before 1980. The scale of the specimens was 1:4 and their cross sections are circular rings. Other than the clear height of the specimens, the geometry of their cross-sections, the reinforcing bar sizes, and their placement were identical. The first specimen, named PC1, had a ratio of cross-section diameter to its height equal to 3, while for the second one, named PC2, the ratio equals to 2.
The experimental and analytical results of the more slender specimen PC1 are compared and presented below.
Figure 22 shows the geometry and reinforcement data of specimen PC1.
Table 4 summarizes the material data of this specimen and the concrete and steel model properties used in the analysis.
Cyclic uniaxial loading has been applied to specimen PC1 with the displacement path of
Figure 23 along with a normalized constant compressive axial load
ν = −0.05.
The path consists of six successive displacement patterns with their maximum values in increasing order. Each pattern consists of three cycles with equal positive and negative displacement values.
Figure 24 shows the force-displacement response
Px-
δx. The analytical response is in quite good agreement with the experimental, although the specimen is not perfectly slender.
7. Experimental Test—Lee et al. [11]
Lee et al. [
11] performed experimental tests on 21 RC column type cantilever specimens. These specimens simulate typical cross sections of bridge pillars. All specimens had a circular ring cross section, except one with solid circular. The parameters examined concerned geometric characteristics (cross section’s outer and inner diameter and specimen’s height), reinforcement ratios (longitudinal and transverse), and different values of the axial load.
Experimental and analytical results of one specimen with the circular solid cross section are presented below. This specimen is named P1 and served as a reference specimen for the rest 20. The circular cross section of the specimen has a diameter of 1000 mm and height to diameter ratio equal to 3.5.
Figure 25 shows geometry and reinforcement data of specimen P1.
Table 5 summarizes the material data of this specimen and the concrete and steel model properties used in the analysis.
The cyclic uniaxial loading path of
Figure 26 was applied to specimen P1 along with a normalized constant compressive axial load
ν = −0.065. The path consists of eight successive displacement patterns with their maximum values in increasing order. Each pattern consists of two cycles with equal positive and negative displacement values.
Figure 27 shows the force-displacement response
Px-
δx. The analytical response is in almost excellent agreement with the experimental.
8. Experimental Test—Kim [10]
Kim [
10] performed experimental tests on three RC column type cantilever specimens. All specimens represented bridge pillars with typical circular ring cross sections. The parameters examined in this experimental study mainly concerned various types and amounts of transverse reinforcement. Herein, the experimental and analytical results of specimen named HC-O-100 are compared. The experimental procedure is very similar to that of specimen PC1 from Cassese et al. [
13] (see
Section 6).
Figure 28 shows the geometry and reinforcement data of specimen HC-O-100.
Table 6 summarizes the material data of this specimen and the concrete and steel model properties used in the analysis.
Specimen HC-O-100 was subjected to uniaxial cyclic loading combined with constant axial compressive load
ν = −0.10. The loading displacement path is shown in
Figure 29. It consists of eight successive displacement patterns with their maximum values in increasing order. Each pattern consists of two cycles with equal positive and negative displacement values. This loading path is very similar to that of specimen P1 from Lee et al. [
4].
Figure 30 shows the force-displacement response
Px-
δx. As with specimen PC1 of the experiments of Cassese et al. [
13], the analytical response is in almost excellent agreement with the experimental.
9. Experimental Test—Pham and Li [15]
Pham and Li [
15] performed experimental tests on ten RC column type cantilever specimens. The specimens represented typical equilateral L-shaped cross sections of framed structures. The purpose of the experimental program was to investigate the suitability of the use of L-shaped cross-sections for buildings in areas with moderate to low seismicity. The parameters, whose influence was investigated, consisted of the aspect ratio, the loading direction, and the axial load. Experimental and analytical results of specimen with code S1 are compared and shown below.
Figure 31 shows the geometry and reinforcement data of specimen S1.
Table 7 summarizes the material data of this specimen and the concrete and steel model properties used in the analysis.
Specimen S1 was subjected to uniaxial cyclic loading combined with constant axial load
ν = −0.20. The loading displacement path is shown in
Figure 32. It consists of eleven successive displacement patterns with their maximum values in increasing order. Each pattern consists of two cycles with equal positive and negative displacement values.
Figure 33 shows the force-displacement response
Px-
δx. The agreement between the analytical and the experimental response could be considered excellent, with an exception to pinching effect of the hysteretic loops. This is mainly due to the bond slip phenomenon, which was critical for this specimen, while the proposed model ignores it in its present version.
10. Experimental Test—Wang et al. [14]
Wang et al. [
14] performed experimental tests on six RC column type cantilever specimens. These specimens represent typical cross sections of framed structures. All specimens had an equilateral L-shaped cross section. The purpose of the experimental program was to investigate the influence of the axial load and the spacing of transverse reinforcement on the failure mechanism.
To evaluate the developed mathematical model, experimental and analytical results of the specimen with code L60L are examined.
Figure 34 shows the geometry and reinforcement data of specimen L60L.
Table 8 summarizes the material data of this specimen and the concrete and steel model properties used in the analysis.
Specimen L60L was subjected to uniaxial cyclic loading combined with constant axial load
ν = −0.09 using the loading displacement path in
Figure 35. The path consists of six successive displacement patterns with their maximum values in increasing order. Each pattern consists of three cycles with equal positive and negative displacement values. The whole experimental procedure is similar to that of the experiment of Pham and Li [
15] for specimen S1.
Figure 36 shows the force-displacement response
Px-
δx. A very good agreement between the analytical and the experimental response is noticed regarding the envelope curves of the hysteretic loops. As occurs with the corresponding specimen S1 of Pham and Li [
15], the influence of the pinching effect is not captured quite efficiently by the present form of the proposed model.
11. Experimental Test—Yatsumoto et al. [8]
Yatsumoto et al. [
3] performed experimental tests on two RC column type cantilever specimens. The two specimens represented a bridge pillar with hollow rectangular cross-section and were constructed to a scale of 1:7. The purpose of the experimental program was to investigate the influence of the axial load on the failure mechanism. The comparison between analytical and experimental results for one specimen, named S2, are presented below.
Figure 37 shows the geometry and reinforcement data of specimen S2.
Table 9 summarizes the material data of this specimen and the concrete and steel model properties used in the analysis.
Specimen S2 has been subjected to uniaxial loading displacement path, as shown in
Figure 38, along with a constant compressive axial load
ν = −0.02. The path consists of three successive displacement patterns with their maximum values in increasing order. Each pattern consists of three cycles with equal positive and negative displacement values. The uniaxial loading direction
x is parallel to the side of 975 mm, i.e., bending occurs around the strong axis,
y.
Figure 39 shows the force-displacement response
Px-
δx. An excellent agreement is noticed between the analytical and the experimental response.
12. Experimental Test—Kakaletsis and Karayannis [18]
Kakaletsis and Karayannis [
18] performed experimental tests on eight 2D one-story one-bay RC frame specimens, which were identical in terms of geometry and reinforcement. The purpose of the experimental research was to study the influence of eccentric openings in masonry infills. The specimens were designed to a scale of 1:3 and subjected to cyclic loading of increasing intensity and constant axial load to the columns. To each column, an axial load of 50 kN was applied. To evaluate the developed mathematical model, experimental and analytical results for frames with code B are compared. This frame served as reference specimen for the other seven infilled ones.
The dimensions and reinforcing details of frame B are shown in
Figure 40. The cross-sectional dimensions of the columns were 150 × 150 mm, with longitudinal reinforcements 8Ø5.6 and ties Ø3/34 mm, and of the beam 100 × 200 mm with longitudinal reinforcement 7Ø5.6 and transverse reinforcement Ø3/40 mm in the critical regions and Ø3/66 mm outside of them. The clear height of the columns was 800 mm and of the beam 1200 mm. A strong beam with cross sectional dimensions equal to 150 × 500, adequately reinforced, has been used for fixing the columns at their base. In plane uniaxial cyclic loading has been applied in the direction of beam axis (
x or N-S direction).
Table 10 summarizes the cross-section geometry and reinforcement data of the frame’s beam and columns, the material data and the concrete and steel model properties used in the analysis.
Frame B was subjected to the uniaxial loading displacement path of
Figure 41. The path consists of seven successive displacement patterns with their maximum values in increasing order. Each pattern consists of two cycles with equal positive and negative displacement values. This displacement record applied to the beam axis level.
Figure 42 shows the base shear-top displacement response
Vx-
δx. A very good agreement is noticed between the analytical and the experimental response, with the exception of the small deviation on the pinching effect, which is not considered in the present form of the proposed mathematical model.
13. Conclusions
In this paper, the experimental and analytical results are comparatively presented to validate the proposed mathematical model for predicting the inelastic response of beam-type elements. Specimens are of cantilever type and represent column and beam cross sections of ordinary framed structures or bridge pillars. A 2D experimental plane frame was also included in the verification examples. Considering the limitations of the proposed mathematical model, specimens were selected by focusing on a range of parameters such as different types of cross section shapes, uniaxial or biaxial loading conditions, slender elements with small or zero influence of the bond slip effect.
More specifically, experiments of Bousias [
3] and Low and Moehle [
2] were mainly focused on the influence of loading types, applying the most common loading records found in the literature for uniaxial or biaxial bending with combined axial load.
The analytical results were found to be in very good to excellent agreement, in some cases, with the experimental ones in terms of force-displacement hysteretic loops. At the same time, it should be noted that there were some small weaknesses in the analytical results, but at an acceptable level, regarding the evolution of the axial strain of the cross sections, e.g., the specimen S1 of the series of experiments of Bousias [
3]. Furthermore, some small overestimations of the experimental backbone curve in one to three first loading cycles, e.g., in the experiments of Low and Moehle [
2]—specimens #3 and #5, Ma et al. [
16]—specimen T-1, show that a correction of stiffness after yielding point may be required. This is under futured investigation.
Two T-beam cross section specimens of Ma et al. [
16] subjected to uniaxial loading, monotonic or cyclic, were also examined. The analytical results in terms of force-displacement were in very good agreement with the corresponding experimental ones. However, some overestimation of the moment-curvature hysteretic loops has been observed, regarding the values of moment and/or curvature.
Furthermore, different types of column cross-section shapes have been examined, like L, circular ring or solid, rectangular, and hollow rectangular. For these cross sections the experimental results, in the form of force-displacement hysteretic loops, were in almost excellent agreement with the analytical ones, in all cases.
Finally, the application of the proposed mathematical model for the prediction of the base shear-top displacement response of the experimental frame of Kakaletsis and Karayannis [
18] confirms the model’s capabilities.
Based on the above, it is concluded that the developed finite element model can successfully simulate the inelastic response of RC slender elements under the combination of biaxial loading with axial force when the bond slip effect is not significant. For these elements, the model is able enough to predict their inelastic response with high accuracy, regardless of their cross-section shape and the applied loading history, at a low computational cost, as the latter is described extensively in Part I [
1] of the present paper.
Author Contributions
Conceptualization, D.K.S. and M.G.S.; methodology, D.K.S. and M.G.S.; software, D.K.S.; validation, D.K.S.; formal analysis, D.K.S.; investigation, D.K.S. and M.G.S.; resources, D.K.S. and M.G.S.; data curation, D.K.S.; writing—original draft, D.K.S.; writing—review and editing, D.K.S. and M.G.S.; visualization, D.K.S. and M.G.S.; supervision, M.G.S.; project administration, M.G.S. All authors have read and agreed to the published version of the manuscript.
Funding
The publication fees of this manuscript have been financed by the Research Council of the University of Patras.
Institutional Review Board Statement
Not applicable.
Informed Consent Statement
Not applicable.
Data Availability Statement
The raw data supporting the conclusions of this article will be made available by the authors on request.
Conflicts of Interest
The authors declare no conflicts of interest.
References
- Sfondylis, D.K.; Sfakianakis, M.G. A Generalized Nonlinear Beam Element for Slender RC Members Using a Polygonization Section Approach—Part I: Theoretical Formulation. Appl. Sci. J. 2024, 14, 2188. [Google Scholar] [CrossRef]
- Low, S.S.; Moehle, J.P. Experimental Study of Reinforced Concrete Columns Subjected to Multi-Axial Loading; Report UCB/EERC 87-14; Earthquake Engineering Research Center of University of California: Berkeley, CA, USA, 1987. [Google Scholar]
- Bousias, S.N. Experimental and Analytical Study of Reinforced Concrete Columns in Cyclic Biaxial Bending with Axial Force. Ph.D. Thesis, Department of Civil Engineering, University of Patras, Patras, Greece, 1993. [Google Scholar]
- Kwak, H.G.; Kim, S.P. Nonlinear analysis of RC beams based on moment–curvature relation. J. Comput. Struct. 2002, 80, 615–628. [Google Scholar] [CrossRef]
- Rodrigues, H.; Arêde, A.; Varum, H.; Costa, A.G. Experimental evaluation of rectangular reinforced concrete column behaviour under biaxial cyclic loading. J. Earthq. Eng. Struct. Dyn. 2012, 42, 239–259. [Google Scholar] [CrossRef]
- Crambuer, R.; Richard, B.; Ile, N.; Ragueneau, F. Experimental characterization and modeling of energy dissipation in reinforced concrete beams subjected to cyclic loading. J. Eng. Struct. 2013, 56, 919–934. [Google Scholar] [CrossRef]
- Tang, Z.; Ma, H.; Guo, J.; Xie, Y.; Li, Z. Experimental research on the propagation of plastic hinge length for multi-scale reinforced concrete columns under cyclic loading. J. Earthq. Struct. 2016, 11, 823–840. [Google Scholar] [CrossRef]
- Yatsumoto, H.; Sakai, J.; Hoshikuma, J. Cyclic loading test of reinforced concrete column with hollow section and high longitudinal steel ratio under high axial loading. In Proceedings of the 28th US-Japan Bridge Engineering Workshop, Portland, OR, USA, 8–10 October 2012. [Google Scholar]
- Hindi, R.; Turechek, W. Experimental behavior of circular concrete columns under reversed cyclic loading. J. Constr. Build. Mater. 2008, 22, 684–693. [Google Scholar] [CrossRef]
- Kim, T.H. Inelastic behavior of hollow reinforced concrete bridge columns. In Proceedings of the 15th World Conference on Earthquake Engineering (15WCEE), Lisbon, Portugal, 24–28 September 2012. [Google Scholar]
- Lee, J.H.; Choi, J.H.; Hwang, D.K.; Kwahk, I.J. Seismic performance of circular hollow RC bridge columns. J. Civ. Eng. 2015, 19, 1456–1467. [Google Scholar] [CrossRef]
- Yi, W.J.; Zhou, Y.; Liu, Y.; Liu, L. Experimental Investigation of Circular Reinforced Concrete Columns under Different Loading Histories. J. Earthq. Eng. 2015, 20, 654–675. [Google Scholar] [CrossRef]
- Cassese, P.; De Risi, M.T.; Verderame, G.M. Seismic assessment of existing hollow circular reinforced concrete bridge piers. J. Earthq. Eng. 2018, 24, 1566–1601. [Google Scholar] [CrossRef]
- Wang, T.; Liu, X.; Zhao, H. Experimental study of the seismic performance of L-shaped columns with 500MPa steel bars. Sci. World J. 2014, 2014, 105826. [Google Scholar]
- Pham, T.P.; Li, B. Seismic performance assessment of L-shaped reinforced concrete columns. ACI Struct. J. 2015, 112, 667–678. [Google Scholar] [CrossRef]
- Ma, S.M.; Bertero, V.V.; Popov, E.P. Experimental and Analytical Studies on the Hysteretic Behavior of Reinforced Concrete Rectangular and T-Beams; Report UCB/EERC 76-2; Earthquake Engineering Research Center of University of California: Berkeley, CA, USA, 1976. [Google Scholar]
- Hawileh, R.A.; Abdalla, J.A.; Tanarslan, M.H. Modeling of nonlinear response of R/C shear deficient T-beam subjected to cyclic loading. J. Comput. Concr. 2012, 10, 413–428. [Google Scholar] [CrossRef]
- Kakaletsis, D.; Karayannis, C.G. Experimental Investigation of Infilled RC Frames with Eccentric Openings. Struct. Eng. Mech. 2007, 23, 231–250. [Google Scholar] [CrossRef]
- Sfondylis, D.K. Development of Generalized Nonlinear Beam Element Models for Slender RC Members. Ph.D. Thesis, University of Patras, Patras, Greece, 2020. (In Greek). [Google Scholar]
- Sfakianakis, M.G. MINOS FEM Code, A Generalized FEM Program for Inelastic Analysis of 3D Solid and Framed Structures; University of Patras: Patras, Greece, 2023. [Google Scholar]
- 250/SC8; Eurocode 8: Design Provisions of Structures for Earthquake Resistance—Part 3: Assessment and Retrofitting of Buildings (EN1998-3). Comité Européen de Normalisation (CEN), Technical Communication: Brussels, Belgium, 2019.
- KAN.EPE.—2017; Greek Code for Interventions in RC Buildings. Earthquake Planning and Protection Organization (OASP): Athens, Greece, 2017.
| Disclaimer/Publisher’s Note: The statements, opinions and data contained in all publications are solely those of the individual author(s) and contributor(s) and not of MDPI and/or the editor(s). MDPI and/or the editor(s) disclaim responsibility for any injury to people or property resulting from any ideas, methods, instructions or products referred to in the content. |
© 2024 by the authors. Licensee MDPI, Basel, Switzerland. This article is an open access article distributed under the terms and conditions of the Creative Commons Attribution (CC BY) license (https://creativecommons.org/licenses/by/4.0/).


