Abstract
The precise classification of breast cancer subtypes is crucial for clinical diagnosis and treatment, yet early symptoms are often subtle. The use of multi-omics data from high-throughput sequencing can improve the classification accuracy. However, most research primarily focuses on the association between individual omics data and breast cancer, neglecting the interactions between different omics. This may fail to provide a comprehensive understanding of the biological processes of breast cancer. Here, we propose a novel framework called DiffRS-net for classifying breast cancer subtypes by identifying the association among different omics. DiffRS-net performs a differential analysis on each omics datum to identify differentially expressed genes (DE-genes) and adopts a robustness-aware Sparse Multi-View Canonical Correlation Analysis to detect multi-way association among DE-genes. These DE-genes with high levels of correlation are then used to train an attention learning network, thereby enhancing the prediction accuracy of breast cancer subtypes. The experimental results show that, by mining the associations between multi-omics data, DiffRS-net achieves a more accurate classification of breast cancer subtypes than the existing methods.
1. Introduction
Breast cancer, a malignant tumor originating from breast tissue, is one of the most common cancers among women [1,2,3]. It is a highly heterogeneous disease, composed of various biological subtypes. Each subtype of breast cancer exhibits distinct clinical presentations, pathological features, and molecular signatures, which determine their respective prognoses and therapeutic implications [4]. Therefore, the classification of breast cancer subtypes is of great importance for the precision treatment and prognosis prediction of breast cancer [5,6,7]. To analyze the heterogeneous genetic data related to breast cancer, multi-omics data can be leveraged [8,9,10].
Driven by the new high-throughput sequencing technologies, biological data in a variety of different formats, sizes, and structures are growing at an unprecedented rate [11,12,13]. For the same set of samples, whole-genome data of different molecular processes, such as mRNA expression, DNA methylation, and microRNA (miRNA) expression, can be obtained, thereby generating multi-omics data for the study of breast cancer. Leveraging these omics data can yield a better, more accurate prediction of clinical outcomes [14,15,16]. There have been a number of studies utilizing multi-omics to classify breast cancer subtypes [17]. In early research, classification methods for breast cancer subtypes mainly depended on traditional machine learning, focusing on concatenation-based and ensemble-based techniques. For example, Tao et al. [18] proposed a multi-kernel SVM model that uses multi-omics data to classify breast cancer subtypes. List et al. [19] constructed a random forest model using gene expression and DNA methylation data to classify breast cancer subtypes. However, both concatenation-based and ensemble-based approaches fail to elucidate the intrinsic relationships between different types of data, limiting our understanding of the interactions between various biological processes [20,21]. Subsequently, researchers began to integrate multi-omics data based on prior knowledge to enhance the accuracy of breast cancer subtype prediction. For instance, Singh et al. [22] developed a method called DIABLO to select a subset of features to find shared information across different data modalities, aiming to discriminate multiple breast cancer subtypes simultaneously. Yang et al. [23] presented SMSPL, a method that employs a novel soft weighting scheme to interactively recommend samples with high confidence to classify breast cancer subtypes. However, the prior knowledge might not be comprehensive or precise, which could lead to incorrect diagnoses [22].
Recently, deep learning-based methods for predicting breast cancer subtype based on multi-omics data have achieved great advance [24,25,26]. Lin et al. [27] introduced a deep learning model called DeepMo for classifying breast cancer subtypes using multi-omics data. DeepMo applies fully connected layers to each omics type and integrates these layers to form a comprehensive network to identify breast cancer subtypes. MOGONET [28] is a tumor grade classification model. It conducts joint training to learn the correlation information of different omics to perform tumor grade classification. Although these frameworks have gained notable success in breast subtype classification, there are still limitations. First, one major challenge that biological samples commonly encounter is the limit number of samples coupled with high-dimensional features, posing a significant difficulty for neural network models that rely on abundant sample data to optimize performance. From a biological perspective, typically, only a very small number of features are closely associated with a specific disease. From a machine learning perspective, an abundance of features can lead to overfitting, diminishing the effectiveness of classifiers and adversely affecting their accuracy [29]. Second, the training process of deep learning models is not sufficiently transparent, making interpretative analysis challenging. Identifying key predictive features within each omics dataset is also a daunting task [30]. Additionally, these methods generally focus on the relationship between each omics and the disease, rather than delving into the interactions between different omics.
Motivated by these problems, we propose a novel framework called DiffRS-net for classifying breast cancer subtypes. DiffRS-net first acknowledges the potential biomarkers in the samples by dividing them into healthy and disease groups. Through a gene differential analysis, DiffRS-net detects statistically significant features, effectively addressing the high-dimensionality issue in small sample datasets. Subsequently, DiffRS-net employs a robustness-aware adaptive Sparse Multi-View Canonical Correlation Analysis (SMCCA) algorithm to discover multi-way associations in multi-omics data. To our knowledge, this is the first application of this method in the context of breast cancer subtype classification. Ultimately, DiffRS-net incorporates a dot-product attention mechanism with the discovered multi-way associations in multi-omics data to develop the learning network for classifying breast cancer subtypes. This enables us to integrate multi-omics information, thereby enhancing the understanding and identification of features in each type of omics data.
By comparing DiffRS-net with the state-of-the-art methods, we demonstrated the capability of DiffRS-net in predicting breast cancer subtypes. In the comparative experiments, we assessed the performance of all competitive methods in the binary/multiclass classification of breast cancer subtypes. The results indicate that DiffRS-net’s performance is comparable to existing advanced methods. DiffRS-net, thus, is a promising method for the prediction of breast cancer subtypes. The source code and data are available at https://github.com/hyr0771/DiffRS-net, accessed on 22 January 2024.
2. Materials and Methods
In this section, we introduce the DiffRS-net method for breast cancer subtype classification. The overview of DiffRS-net is depicted in Figure 1. As illustrated in Figure 1, DiffRS-net mainly consists of three steps.
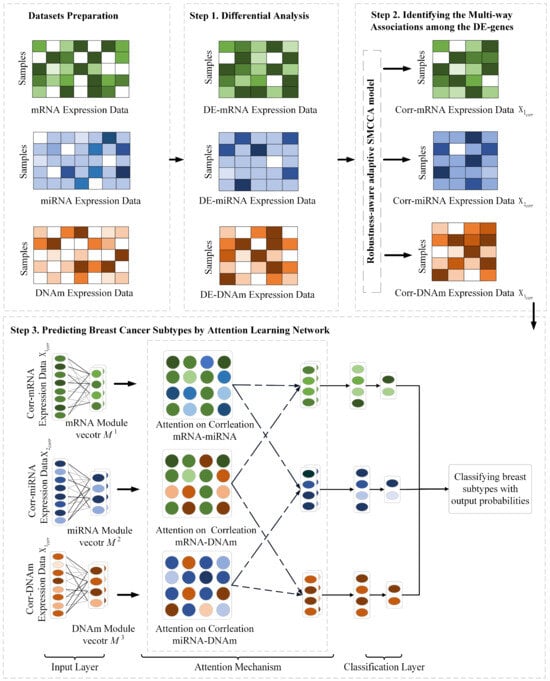
Figure 1.
Procedure of DiffRS-net. Step 1 performs differential analysis on mRNA, miRNA, and DNA methylation (DNAm) omics data to detect differentially expressed genes (DE-genes). Step 2 utilizes a robust-aware adaptive SMCCA model to identify multi-way associations among the DE-genes. Step 3 utilizes correlated DE-genes to train the attention learning network model to classify breast cancer subtypes.
Step 1: Differential analysis. Initially, multi-omics data mRNA, miRNA, and DNA methylation (DNAm) undergo preprocessing to normalize data formats and ranges. Subsequently, differential analysis is performed to detect differentially expressed genes (DE-genes), which may serve as biomarkers for distinguishing between different breast cancer subtypes.
Step 2: Multi-way association analysis. A robustness-aware adaptive SMCCA algorithm is employed to conduct a multi-way association analysis on the selected DE-genes. The aim here is to discover intrinsic connections among different omics data, detecting highly correlated genes among DE-genes.
Step 3: Attention model training and classification. Finally, an attention learning model is trained using the correlated genes (Corr-genes) from the multi-way association analysis. This model achieves accurate classification of cases by learning the relationships between different omics.
2.1. Differential Analysis
The multi-omics datasets encompassing mRNA, miRNA, and DNA methylation for breast cancer patients are sourced from The Cancer Genome Atlas (TCGA) [31]. In the field of the breast cancer research, four main subtypes stand out due to their extensive validation and high rate of replication: Basal-like (Basal), Her2-enriched (Her2), Luminal A (LumA), and Luminal B (LumB). The key characteristics of these breast cancer subtypes depend on the expression levels of estrogen receptor (ER), progesterone receptor (PR), human epidermal growth factor receptor 2 (HER2), and the cell proliferation marker Ki67 [32,33,34]. The distribution of sample counts across these breast cancer subtypes is detailed in Table 1.

Table 1.
The original data and differential analysis data for mRNA, miRNA, and DNA methylation.
For these three omics data, we conduct the fundamental preprocessing steps. This includes the removal of missing values and the consolidation of duplicate features. Following these preprocessing steps, we perform a differential analysis on each of the three omics datasets separately. Specifically, we collect initial samples from different omics platforms and categorize them into healthy and disease groups. Specifically, the mRNA dataset includes 194 samples from healthy individuals and 986 samples from breast cancer patients; the miRNA dataset contains 104 samples from healthy individuals and 1103 samples from breast cancer patients. The DNA methylation dataset consists of 97 samples from healthy individuals and 785 samples from breast cancer patients. Subsequently, we calculate the average expression levels of each feature within these omics datasets and perform t-tests on the data from the healthy and disease groups to identify features with significantly different expression levels. Through a rigorous differential expression analysis, we identify 3692 DE-mRNA features, 502 DE-miRNA features, and 4679 DE-DNA methylation features with differential expression. The criteria for selecting these significantly different features include the fold change in feature expression and the p-value of the t-test. The results of differential analysis are shown in Table 1 and Figure 2.
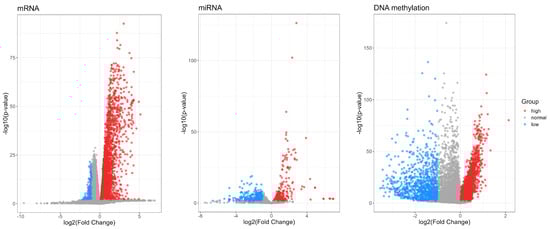
Figure 2.
Volcano plots of differentially expressed mRNA, miRNA, and DNAm between the healthy group and the disease group of breast cancer patients. Red dots represent genes with high expression, while blue dots indicate genes with low expression. Genes with normal expression are shown as gray dots. Both highly expressed and lowly expressed genes are considered to be differentially expressed genes (DE-genes).
2.2. Multi-Way Association Analysis
A comprehensive integrated analysis of mRNA, miRNA, and DNA methylation data is essential for uncovering the molecular basis of cancer development and progression. The complex interactions between these different omics play a key role in determining the phenotypic complexity of breast cancer subtypes. Although Sparse Canonical Correlation Analysis methods have been leading the way in regard to uncovering these complex biomolecular interactions and selecting significant features [35,36], traditional SCCA approaches typically only identify bivariate relationships between two variables [37]. It may not fully capture the subtle relationships present in a network of associations that link mRNA, miRNA, and DNA methylation. To delve into these complex interactions and classify breast cancer subtypes with higher precision, we employ a robustness-aware adaptive SMCCA model(rAdaSMCCA). This model is able to perform adaptive balancing among SCCA models, thus effectively solving the problem of gradient domination when integrating multiple SCCA models.
Suppose we have n samples with p DE-mRNAs, d DE-miRNAs, and q DE-DNAms. Then, let denote the DE-mRNA expression data, denote the DE-miRNA expression data, and denote the DE-DNAm expression data. The rAdaSMCCA model integrates three paired SCCA models related to three types of omics, aiming to maximize a comprehensive objective on a global scale. Specifically, the formal definition of rAdaSMCCA can be defined as follows [38]:
where is the canonical weight for each kind of omics, and is a regularization term used to introduce sparsity, thereby selecting the omics features of interest. Generally, mRNA does not directly influence the levels of miRNA and DNA methylation. However, the expression patterns of mRNA can be indicative of the regulatory effects imposed by miRNA and DNA methylation, as both have the capacity to affect the mRNA levels of specific genes [39,40]. To identify the isolated impact of a specific feature, the model employs the -norm to regulate the weights of DE-mRNA data. At the same time, to discern the combined influence of multiple features, we utilize a fused pairwise group lasso approach that penalizes them based on the genomic positions of each adjacent pair of features. Therefore, for DE-mRNA data takes the following form:
where and are non-negative hyperparameters. achieves a balance between joint feature selection and individual feature selection, while finds an equilibrium between overall penalties and the loss function. Therefore, this compound penalty method fosters a comprehensive and effective feature selection mechanism.
Furthermore, given that not every miRNA/DNA methylation expression feature is related to the formation of breast cancer, it is necessary to apply sparse constraints to select the miRNA and DNA methylation features that are relevant. To accommodate this, the -norm is employed to select both DE-miRNA and DE-DNAm features, i.e., and . To better identify the associations among differentially expressed genes, a more appropriate definition of the rAdaSMCCA model is as follows [38]:
The rAdaSMCCA model utilizes iterative adjustments instead of fixed weights, adaptively balancing multiple sub-objectives during the iteration process. Consequently, rAdaSMCCA exhibits a robust performance, effectively mitigating the issue of gradient domination that arises from the combination of multiple SCCA models.
Based on the DE-genes identified from the initial differential analysis, we solve Equation (3) using standard quadratic programming methods [41]. The solutions represent the canonical weight vectors for the DE-omics features. Subsequently, we can calculate the correlation coefficients based on Spearman’s rank correlation coefficient to assess the relatedness of the DE- genes. The larger the value of the correlation coefficient, the stronger the correlation between the DE features.
Finally, we calculate the absolute weight value of for each feature in each omics group. Based on the descending order of these weight values, we select a number of appropriate features from ,, and to conceive the corresponding matrices, , , and . These three correlation matrices serve as the inputs for the subsequent neural network analysis.
2.3. The Attention Learning Model
In this section, we construct an attention learning network model to classify breast cancer subtypes. As illustrated in Figure 1, the attention learning model simultaneously trains three tasks on three omics datasets, shares the representations through the attention mechanism, and finally integrates the output probabilities of each task to classify breast cancer subtypes. It consists of three main steps: (i) constructing modules for each omics via the module encoder, (ii) utilizing the attention mechanism to identify important modules across different omics data, and (iii) training on each omics in a fully connected layer.
The module encoder consists of a fully connected layer, which links omics features to corresponding modules, each depicted by a vector. The weights of the fully connected layer, , represent the association between features and modules of the j-th omics data, and the relationship between each feature and each module is represented by their corresponding weight vectors.
For a training sample (xj, y), xj denotes the sample from the j-th omics of omics datasets, and y is its corresponding label. The module encoder for the j-th omics data is represented by , and the corresponding module vectors are defined as follows [42]:
where denotes the weights of , indicates the number of modules of j-th omics data, and D is the dimension of the module vector.
Let denote the module vectors, with corresponding to Corr-mRNA, Corr-miRNA, and Corr-DNAm, respectively. A dot-product attention mechanism is then employed to extract important features from the set . Specifically, we utilize batch matrix multiplication to ascertain the attention scores between each pair of these three modules. Then, we use the Softmax function to normalize the attention scores to derive the final attention weights. Using the final attention weights, we perform a weighted summation of the corresponding feature representations, thereby obtaining feature representations that were adjusted by the attention mechanism. The attention mechanism matrix can be defined as follows [43]:
where is the query vector for the task , is the key vector for the task , and is the value vector for the task . In this way, the feature representation of each task not only contains its own unique information but also integrates information related to other tasks, thus helping to enhance the understanding and representation of model on each task’s features.
Subsequently, each is multiplied by the corresponding separately to produce new modified modules, which are then employed in the subsequent training in the hidden layer. Each hidden layer takes the previous layer as input and multiplies it with the trained weight matrix to obtain the input of the next layer. At the end of the network, the final classification layer flattens the resulting multidimensional data vectors and outputs the predicted classification probabilities for each breast cancer subtype. In our model, the loss function, , is set to the cross-entropy error between the true label and predicted label, and it can be defined as follows:
where represents the number of breast cancer subtypes, and () is the true (predicted) probability for each breast cancer subtype. Dropout and early stopping techniques are applied to prevent overfitting.
3. Results
3.1. Evaluation Metrics
This section details the key metrics for evaluating the classification performance on breast cancer subtypes. The number of positive samples correctly predicted is known as the true positive (TP) number, while the number of negative samples incorrectly predicted as positive is called the false positive (FP) number. Similarly, the number of negative samples correctly predicted is referred to as the true negative (TN) number, and the number of positive samples incorrectly judged as negative is termed the false negative (FN) number.
With these definitions, we can calculate several important performance metrics: Accuracy (ACC) = (TP + TN)/(TP + TN + FP + FN), which represents the proportion of correctly predicted samples; Precision = TP/(TP + FP), which indicates the proportion of actual positives among the predicted positives; Recall = TP/(TP + FN), which reflects the proportion of actual positives that were correctly identified; and the F1 score = 2 × Precision × Recall/(Precision + Recall), which is the harmonic mean of precision and recall. Additionally, the Receiver Operating Characteristic (ROC) curve is generated by plotting the True Positive Rate (TPR) = TP/(TP + FN) against the False Positive Rate (FPR) = FP/(TN + FP), and the Area Under the Curve (AUC), which is no greater than 1, serves as a measure of the overall performance of the classifier.
Traditional metrics such as Precision, Recall, and F1 score are originally defined for binary classification problems. In experiments with multiclass classification, we utilize a macro-average strategy to apply these metrics. This involves independently calculating the Precision, Recall, and F1 score for each class and then taking the arithmetic mean of these metrics without considering the variation in sample size across classes. Therefore, we use macro-averaged Precision (Precision-macro), macro-averaged Recall (Recall-macro), and macro-averaged F1 score (F1 score-macro) to comprehensively evaluate the performance of each method on multi-classification problems.
3.2. Comparison with Other Methods
To evaluate the performance of our proposed DiffRS-net, we compare it with the state-of-the-art techniques. Specifically, we apply the logistic regression or multinomial models with Elastic Net (EN) [44] regularization and Random Forest (RF) [45] algorithms within both concatenated and ensemble frameworks. This results in two concatenation-based methods (Concate_EN and Concate_RF) and two ensemble-based methods (Ensemble_EN and Ensemble_RF) for comparison. In addition to these four approaches, the performance of DiffRS-net is also compared with three other multimodal breast cancer classification methods, namely DIABLO [22], SMSPL [23], and DeepMO [27].
In the experiment, we utilize the rAdaSMCCA algorithm to detect highly correlated genes among DE-mRNA, DE-miRNA, and DE-DNAm. We randomly allocate 70% of the samples to the training set and the remaining 30% to the test set and perform a five-fold cross-validation. By optimizing hyperparameters through a grid search, we determine the optimal correlation coefficients. Specifically, on the test set, the correlation coefficients are 0.891 for mRNA and miRNA, 0.739 for DE-miRNA and DE-DNAm, and 0.759 for DE-mRNA and DE-DNAm. Then, we set = 500, = 100, and = 500 to conceive the corresponding correlation matrices, , , and , as the input of the later attention learning model on both binary and multiclass classification experiments. To ensure fairness in comparison results, we use the default parameter values recommended in the relevant literature for each comparison method.
In the following section, we first validate the performance of DiffRS-net in binary and multiclass classification of breast cancer subtypes. Then, we conduct ablation studies to understand the effectiveness of each step within DiffRS-net. Finally, we carry out a comprehensive analysis to explore DSCCN’s capability in regard to identifying the key features of breast cancer subtypes.
3.2.1. Performance of Binary Classification
To evaluate the performance of DiffRS-net in the binary classification of breast cancer subtypes, we divide the samples into six datasets for a pairwise comparison based on their subtypes, including (1) Basal versus Her2, (2) Basal versus LumA, (3) Basal versus LumB, (4) Her2 versus LumA, (5) Her2 versus LumB, and (6) LumA versus LumB. To maintain the stability of our results, we conduct a stratified 5-fold cross-validation for each dataset and repeat the experiments 30 times to report the average measurement outcomes. Table 2 presents the AUC values, Accuracy values, and F1 score for the classification of any two breast cancer subtypes, using various methods.
Table 2.
Comparison of the binary classification performance of breast cancer subtypes on multi-omics datasets.
It can be seen from Table 2 that DiffRS-net surpasses other methods in regard to the Accuracy and F1 score across all datasets. However, the AUC values for DiffRS-net are marginally lower than those of DeepMo on the Basal vs. LumB and Her2 vs. LumA datasets. These results show that the deep learning approaches, including both DeepMo and DiffRS-net, tend to outperform the machine learning methods that rely on ensemble and concatenate techniques, as well as methods driven by knowledge, in the binary classification tasks. The higher AUC values achieved by deep learning approaches indicate a potentially stronger discriminative ability for binary classification in breast cancer. In summary, these results indicate that DiffRS-net is an effective method for the binary classification of breast cancer subtypes.
3.2.2. Performance of Multi-Classification
This section compares the average performance of DiffRS-net with that of seven other methods in the multi-classification of various breast cancer subtypes. Table 3 lists the performance achieved by each method in the multi-classification of breast cancer subtypes, and test confusion matrices are displayed in Figure 3.
Table 3.
Comparison of the multi-classification performance of breast cancer subtypes on multi-omics datasets.
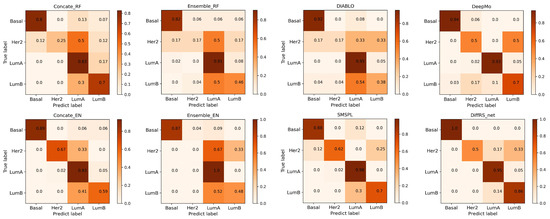
Figure 3.
Normalized confusion matrices of all competing methods on the breast cancer multi-omics dataset. Within each method’s matrix, row labels denote the actual subtypes of breast cancer, while column labels indicate the subtypes as predicted. The elements along the diagonal represent the rates of accurate predictions, whereas the elements off the diagonal show the rates of incorrect predictions. The confusion matrices are normalized within the range of 0 to 1 due to the imbalanced sample sizes of different breast cancer subtypes.
From Table 3, it is evident that DiffRS-net surpasses other methods in all metrics. As illustrated in Figure 3, DiffRS-net achieves perfect classifications for Basal (error rate = 0). For LumA, which has the largest sample size, DiffRS-net secures the second-best classification (error rate = 5%). DiffRS-net performs the best in classifying LumB (error rate = 14%). For Her2, which has the smallest sample size, DiffRS-net’s classification is less robust. This may be due to the insufficient sample size for Her2, resulting in the model not adequately learning the characteristics of this subtype. Nevertheless, DiffRS-net’s strong performance in classifying other subtypes ensures its overall classification efficacy.
3.3. Ablation Study
In this section, we evaluate the effectiveness of different parts of DiffRS-net by conducting an ablation study on both binary classification and multi-classification. In DiffRS-net, two optimization techniques are employed for the classification of breast cancer subtypes, with the utilization of the multitask learning model as the classifier. Specifically, the first technique involves a differential analysis of omics datasets to identify DE-genes. The second optimization technique employs the rAdaSMCCA algorithm to detect highly correlated genes within DE-genes.
AS can be seen from Table 4, we constructed five versions of DiffRS-net models. For DiffRS-net1, neither optimization technique is implemented. DiffRS-net2 only implements differential analysis, while DiffRS-net3 solely utilizes the rAdaSMCCA technique. The correlation coefficients of Diffrs-net3 on test data are as follows: 0.550 for DE-mRNA and DE-miRNA, 0.535 for DE-miRNA and DE-DNAm, and 0.530 for DE-mRNA and DE-DNAm.
Table 4.
Optimization techniques and classifier used in different DiffRS-net models.
To investigate the efficacy of attention learning networks in the classification of breast cancer subtypes, we constructed two models: DiffRS-net4 and DiffRS-net5. For DiffRS-net4, both optimization techniques are employed, and the XGBoost [46] is utilized as the classifier. To further understand the role of the attention mechanism within the neural network, we constructed the DiffRS-net5 model. This model is identical to the DiffRS-net, except for the removal of the attention mechanism. All parameters of DiffRS-net5 are the same as those in the DiffRS-net.
We then compare the performance of these five models to reveal the effectiveness of each component within the DiffRS-net.
3.3.1. Binary Classification
In this section, we discuss the performance of different modes of DiffRS-net on the binary classification of breast cancer subtypes. Table 5 shows the average value of Accuracy, AUC, and F1 score of classifying any two subtypes of breast cancer using different DSCCN modes. As depicted in Table 5, we can find that both DiffRS-net2 and DiffRS-net3 are superior to DiffRS-net1 overall. This clearly indicates that the application of the differential analysis and the robustness-aware adaptive SMCCA algorithm can effectively enhance the model’s accuracy and robustness. Additionally, as can be seen in Table 5, DiffRS-net shows a superior performance compared to DiffRS-net4 and DiffRS-net5. This result further validates that attention learning network models can achieve better outcomes in regard to the binary classification of breast cancer subtypes. Ultimately, the overall superiority of DiffRS-net over other models suggests that the combined use of differential analysis, Sparse Canonical Correlation Analysis, and attention learning networks is an effective approach for the binary classification of breast cancer subtypes.
Table 5.
Performance of different DiffRS-net models on each binary classification dataset.
3.3.2. Multi-Classification
This section discusses the average performance of different DiffRS-net models in the multiclass classification of breast cancer subtypes. As shown in Table 6, DiffRS-net outperforms other models across all metrics, particularly in regard to Accuracy and F1-score, achieving 0.913 and 0.878, respectively. The optimized DiffRS-net2 and DiffRS-net3 both demonstrate superior performance compared to DiffRS-net1, providing clear evidence of the effectiveness of both optimization techniques. Moreover, as can be found in Table 6, the superior performance of DiffRS-net over DiffRS-net4 and DiffRS-net5 further validates the enhanced capability of attention learning networks in the multi-classification of breast cancer subtypes. These results indicate that the combination of the differential analysis and multi-way association analysis can yield a more accurate multiclass classification of breast cancer subtypes.
Table 6.
Performance of different DiffRS-net models on multi-classification for all subtypes of breast cancer.
In Figure 4, we generate normalized confusion matrices to visualize the multi-classification performance of each DiffRS-net mode on each breast cancer subtype. As shown in Figure 4, DiffRS-net and DiffRS-net1 attained perfect accuracy in classifying the Basal subtype (error rate = 0). In the LumA subtype, which has the largest sample size, DiffRS-net’s performance is slightly behind that of the best classifier by 3% (error rate = 5%). However, DiffRS-net achieves the optimal classification effectiveness in the LumB subtype (error rate = 14%). Overall, DiffRS-net surpasses all other variant models, conclusively demonstrating the definite efficacy of these two optimization techniques in the multi-classification task of breast cancer subtypes.
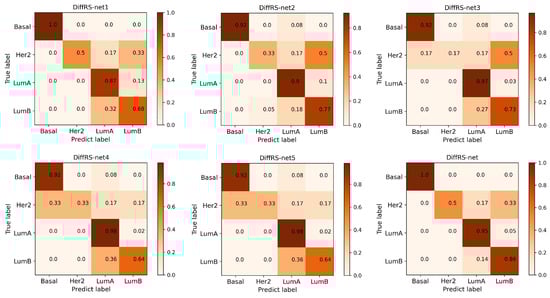
Figure 4.
Normalized confusion matrices of various DiffRS-net models on the breast cancer multi-classification dataset.
3.4. Analysis of the Selected Genes by DiffRS-net
To investigate whether the genes detected by DiffRS-net are highly correlated, we select the top 30 genes with the highest weights from each omics for the Pearson correlation analysis. Figure 5 depicts the correlation coefficient matrix between pairs of omics, where each cell represents the Pearson correlation coefficient for a specific pair of genes (i.e., Sox10 and ANKRD17). The depth of color within each cell indicates the strength of the correlation, with a deeper color (tending towards red) indicating a higher degree of association. Moreover, we calculate the p-values of the correlation coefficients and mark the cells with p-values less than 0.0001 with an “×” in the figure, indicating that these gene pairs have a statistically significant correlation that is not due to chance. The statistical analysis reveals that the proportions of p-values falling below the threshold for mRNA and miRNA, mRNA and DNA methylation, and miRNA and DNA methylation are 36.11%, 74.44%, and 42.56%, respectively.
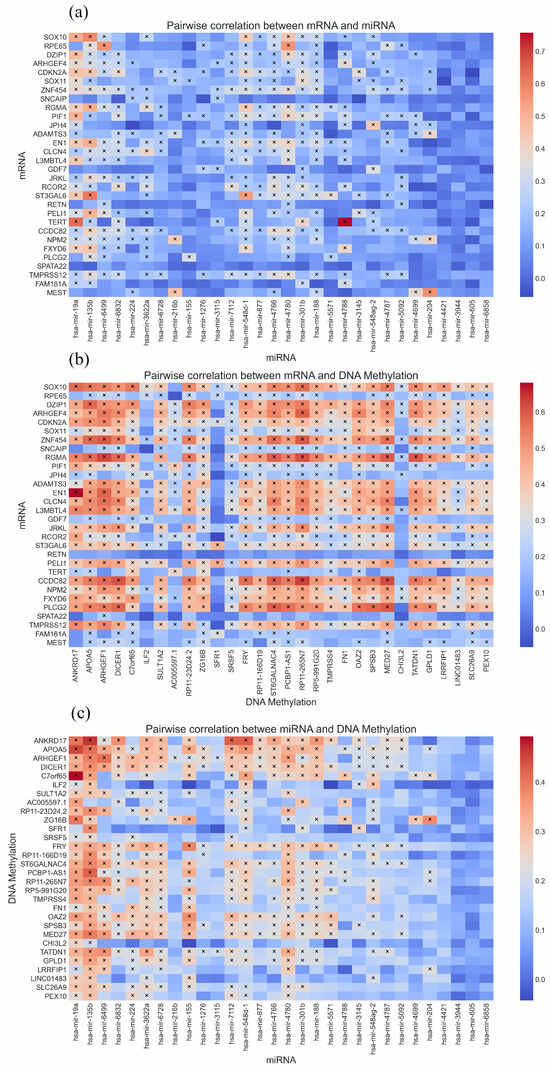
Figure 5.
Pairwise correlation between any two omics data. And “×” denotes that the gene pair reaches the significance level (p-value < 0.00001). (a) Correlation matrix of mRNA and miRNA. (b) Correlation matrix of mRNA and DNAm. (c) Correlation matrix of miRNA and DNAm.
As can be seen from Figure 5, the correlation between mRNA and DNA methylation is significantly higher than the relationship between mRNA and miRNA. This is likely because the synthesis of mRNA is derived directly from the transcription of DNA, and the state of DNA methylation has a direct impact on this process [47]. Changes in DNA methylation can significantly regulate the expression levels of mRNA. In contrast, miRNAs regulate the stability and translation of mRNA through interaction, rather than being directly involved in the generation of mRNA [48]. Considering that a single miRNA can target multiple mRNAs, and an mRNA may be regulated by multiple miRNAs, a relatively complex regulatory network is established [49]. Hence, the correlation between mRNA and miRNA is comparatively lower.
In summary, from the display in Figure 5, we can observe that the top 30 genes selected from each omics group show significant correlation with the 30 genes from other omics groups. Many of these gene correlations reach a level of statistical significance. This finding confirms that our algorithm has successfully identified features that are statistically significant in terms of their correlation.
To unravel the possible molecular mechanisms underlying the breast cancer, we select the top 500 weighted mRNA genes for a Gene Ontology (GO) analysis and Kyoto Encyclopedia of Genes and Genomes (KEGG) pathway analysis to facilitate the identification of breast cancer subtypes. As can be seen in Figure 6, the results of the GO analysis reveal key biological processes (BPs), molecular functions (MFs), and cellular components (CCs) associated with breast cancer. Significant biological processes include the regulation of transcription, the control of gene expression, the activation of signaling mechanisms, and processes related to aging. Notably, the regulation of transcription initiated by RNA polymerase II is prominent in the results, which may point to a critical role of transcriptional control in breast cancer. The molecular function analysis highlights functions such as Wnt-protein binding and receptor binding, which are likely closely related to signaling and cellular communication in cancer cells. In terms of cellular components, proteins in the extracellular region and cell surface are of particular interest due to their interactions within the tumor microenvironment.
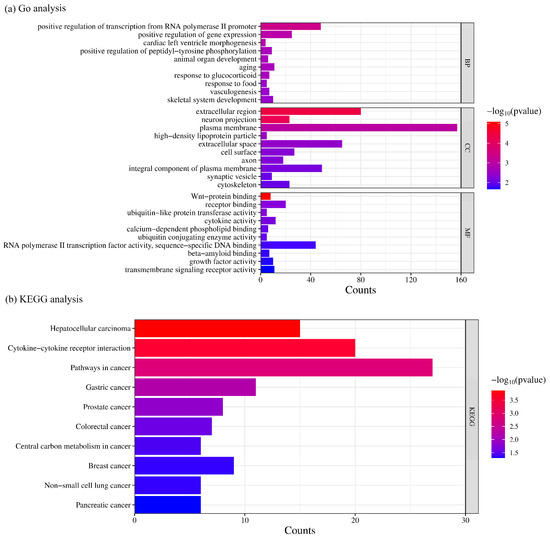
Figure 6.
Gene Ontology (GO) and Kyoto Encyclopedia of Genes and Genomes (KEGG) analyses of the top 500 mRNAs with the highest weights.
The KEGG pathway analysis underscores the significance of the breast cancer pathway itself and the potential roles of various cancer signaling pathways, including the interactions between cytokines and their receptors. These pathways may play a central role in the development of breast cancer, immune responses, and cellular proliferation. Overall, the analysis results provide valuable insights, indicating potential molecular biomarkers and therapeutic targets in breast cancer research.
4. Conclusions
In this work, we present an attention learning framework called DiffRS-net to classify breast cancer subtypes using multi-omics data. DiffRS-net first performs a differential analysis on the gene expression data of the healthy and disease groups to detect DE-genes among multi-omics data. This procedure can effectively reduce the dimensionality of omics data by filtering out features with low expression levels, and it extracts potential biomarkers, which could be crucial for understanding the biological mechanisms of breast cancer. Subsequently, DiffRS-net employs a robustness-aware adaptive SMCCA algorithm on DE-genes to identify the multi-way association among the different omics, thereby identifying DE-genes with high correlation. Finally, DiffRS-net uses an attention learning network model to train these highly correlated genes and builds a dot-product attention mechanism into the neural network model to allow each task to focus only on its own features and to integrate the relevant information of other tasks. We evaluate the performance of DiffRS-net by comparing it with the state-of-the-art techniques on the binary and multi-classification of breast cancer subtypes. The experimental results show the superiority of our approach. The ablation study further reveals that each step in DiffRS-net significantly contributes to the improvement of the classification performance. Consequently, DSCCN can be regarded as a valuable framework for the classification of breast cancer subtypes.
Despite the effectiveness of DiffRS-net in classifying breast cancer subtypes, limitations remain. Initially, due to a data imbalance in the breast cancer sample set, our model is unable to adequately learn the characteristics of samples, which lead to a decrease in accuracy. Considering that the data augmentation technique has proven effective in many fields, we intend to incorporate data augmentation into our future work to enable our model to fully recognize the features of each subtype. Second, we believe that including a wider variety of omics features could contribute to increasing the precision of our model. We aim to incorporate a richer array of omics data, such as variant copy numbers and phenotypes, to expand the model’s feature set. Last, incorporating external datasets for validation will further enhance the reliability of our model. In our future work, we intend to seek datasets beyond TCGA for independent verification.
Author Contributions
Conceptualization, P.Z.; Methodology, P.Z.; Software, P.Z.; Formal analysis, Y.H.; Writing—original draft, P.Z.; Writing—review & editing, C.H. and Y.H.; Visualization, C.H. and Y.H.; Supervision, C.H.; Funding acquisition, Y.H. All authors have read and agreed to the published version of the manuscript.
Funding
This work is supported by the Natural Science Foundation of Guangxi Province (No. 2020GXNSFAA159074) and the National Natural Science Foundation of China (No. 61862006 and No. 62261003).
Institutional Review Board Statement
Not applicable.
Informed Consent Statement
Not applicable.
Data Availability Statement
The original contributions presented in the study are included in the article, further inquiries can be directed to the corresponding authors.
Conflicts of Interest
The authors declare on conflicts of interest.
References
- Azamjah, N.; Soltan-Zadeh, Y.; Zayeri, F. Global Trend of Breast Cancer Mortality Rate: A 25-Year Study. Asian Pac. J. Cancer Prev. APJCP 2019, 20, 2015–2020. [Google Scholar] [CrossRef] [PubMed]
- Mathur, P.; Sathishkumar, K.; Chaturvedi, M.; Das, P.; Sudarshan, K.L.; Santhappan, S.; Nallasamy, V.; John, A.; Narasimhan, S.; Roselind, F.S. Cancer Statistics, 2020: Report From National Cancer Registry Programme, India. JCO Glob. Oncol. 2020, 6, 1063–1075. [Google Scholar] [CrossRef] [PubMed]
- Krell, J.; James, C.R.; Shah, D.; Gojis, O.; Lim, A.; Riddle, P.; Ahmad, R.; Makris, A.; Cowdray, A.; Chow, A.; et al. Human Epidermal Growth Factor Receptor 2–Positive Breast Cancer Relapsing Post-Adjuvant Trastuzumab: Pattern of Recurrence, Treatment and Outcome. Clin. Breast Cancer 2011, 11, 153–160. [Google Scholar] [CrossRef] [PubMed]
- Reis-Filho, J.S.; Pusztai, L. Gene expression profiling in breast cancer: Classification, prognostication, and prediction. Lancet 2011, 378, 1812–1823. [Google Scholar] [CrossRef] [PubMed]
- Waks, A.G.; Winer, E.P. Breast Cancer Treatment: A Review. JAMA 2019, 321, 288–300. [Google Scholar] [CrossRef] [PubMed]
- Dar, R.A.; Rasool, M.; Assad, A. Breast cancer detection using deep learning: Datasets, methods, and challenges ahead. Comput. Biol. Med. 2022, 149, 106073. [Google Scholar] [CrossRef]
- Clement, D.; Agu, E.; Suleiman, M.A.; Obayemi, J.; Adeshina, S.; Soboyejo, W. Multi-Class Breast Cancer Histopathological Image Classification Using Multi-Scale Pooled Image Feature Representation (MPIFR) and One-Versus-One Support Vector Machines. Appl. Sci. 2023, 13, 156. [Google Scholar] [CrossRef]
- Khan, D.; Shedole, S. Leveraging Deep Learning Techniques and Integrated Omics Data for Tailored Treatment of Breast Cancer. J. Pers. Med. 2022, 12, 674. [Google Scholar] [CrossRef]
- Huang, Y.; Chen, F.; Sun, H.; Zhong, C. Exploring gene-patient association to identify personalized cancer driver genes by linear neighborhood propagation. BMC Bioinform. 2024, 25, 34. [Google Scholar] [CrossRef]
- Huang, Y.; Bin, Y.; Zeng, P.; Lan, W.; Zhong, C. NetPro: Neighborhood Interaction-Based Drug Repositioning via Label Propagation. IEEE/ACM Trans. Comput. Biol. Bioinform. 2023, 20, 2159–2169. [Google Scholar] [CrossRef]
- Vandereyken, K.; Sifrim, A.; Thienpont, B.; Voet, T. Methods and applications for single-cell and spatial multi-omics. Nat. Rev. Genet. 2023, 24, 494–515. [Google Scholar] [CrossRef]
- Kang, M.; Ko, E.; Mersha, T.B. A roadmap for multi-omics data integration using deep learning. Brief Bioinform 2022, 23, bbab454. [Google Scholar] [CrossRef]
- Huang, Y.; Wu, Z.; Lan, W.; Zhong, C. Predicting disease-associated N7-methylguanosine(m7G) sites via random walk on heterogeneous network. IEEE/ACM Trans. Comput. Biol. Bioinform. 2023, 20, 3173–3181. [Google Scholar] [CrossRef]
- Huang, S.; Chaudhary, K.; Garmire, L.X. More Is Better: Recent Progress in Multi-Omics Data Integration Methods. Frontiers 2017, 8, 268903. [Google Scholar] [CrossRef] [PubMed]
- Argelaguet, R.; Velten, B.; Arnol, D.; Dietrich, S.; Zenz, T.; Marioni, J.C.; Buettner, F.; Huber, W.; Stegle, O. Multi-Omics Factor Analysis—A framework for unsupervised integration of multi-omics data sets. Mol. Syst. Biol. 2018, 14, e8124. [Google Scholar] [CrossRef] [PubMed]
- Huang, Y.; Xie, Y.; Zhong, C.; Zhou, F. Finding branched pathways in metabolic network via atom group tracking. PLOS Comput. Biol. 2021, 17, e1008676. [Google Scholar] [CrossRef] [PubMed]
- Neagu, A.-N.; Whitham, D.; Bruno, P.; Morrissiey, H.; Darie, C.A.; Darie, C.C. Omics-Based Investigations of Breast Cancer. Molecules 2023, 28, 4768. [Google Scholar] [CrossRef]
- Tao, M.; Song, T.; Du, W.; Han, S.; Zuo, C.; Li, Y.; Wang, Y.; Yang, Z. Classifying Breast Cancer Subtypes Using Multiple Kernel Learning Based on Omics Data. Genes 2019, 10, 200. [Google Scholar] [CrossRef] [PubMed]
- List, M.; Hauschild, A.-C.; Tan, Q.; Kruse, T.A.; Baumbach, J.; Batra, R. Classification of Breast Cancer Subtypes by combining Gene Expression and DNA Methylation Data. J. Integr. Bioinform. 2014, 11, 236. [Google Scholar] [CrossRef]
- Rappoport, N.; Shamir, R. Multi-omic and multi-view clustering algorithms: Review and cancer benchmark. Nucleic Acids Res. 2018, 46, 10546–10562. [Google Scholar] [CrossRef]
- Sharifi-Noghabi, H.; Zolotareva, O.; Collins, C.C.; Ester, M. MOLI: Multi-omics late integration with deep neural networks for drug response prediction. Bioinformatics 2019, 35, i501–i509. [Google Scholar] [CrossRef]
- Singh, A.; Shannon, C.P.; Gautier, B.; Rohart, F.; Vacher, M.; Tebbutt, S.J.; Lê Cao, K.-A. DIABLO: An integrative approach for identifying key molecular drivers from multi-omics assays. Bioinformatics 2019, 35, 3055–3062. [Google Scholar] [CrossRef] [PubMed]
- Yang, Z.; Wu, N.; Liang, Y.; Zhang, H.; Ren, Y. SMSPL: Robust Multimodal Approach to Integrative Analysis of Multiomics Data. IEEE Trans. Cybern. 2022, 52, 2082–2095. [Google Scholar] [CrossRef] [PubMed]
- Anand, R.; Lakshmi, S.V.; Pandey, D.; Pandey, B.K. An enhanced ResNet-50 deep learning model for arrhythmia detection using electrocardiogram biomedical indicators. Evol. Syst. 2024, 15, 83–97. [Google Scholar] [CrossRef]
- Zhou, L.; Rueda, M.; Alkhateeb, A. Classification of Breast Cancer Nottingham Prognostic Index Using High-Dimensional Embedding and Residual Neural Network. Cancers 2022, 14, 934. [Google Scholar] [CrossRef] [PubMed]
- Li, C.; Liu, M.; Xia, J.; Mei, L.; Yang, Q.; Shi, F.; Zhang, H.; Shen, D. Individualized Assessment of Brain Aβ Deposition With fMRI Using Deep Learning. IEEE J. Biomed. Health Inform. 2023, 27, 5430–5438. [Google Scholar] [CrossRef] [PubMed]
- Lin, Y.; Zhang, W.; Cao, H.; Li, G.; Du, W. Classifying Breast Cancer Subtypes Using Deep Neural Networks Based on Multi-Omics Data. Genes 2020, 11, 888. [Google Scholar] [CrossRef] [PubMed]
- Wang, T.; Shao, W.; Huang, Z.; Tang, H.; Zhang, J.; Ding, Z.; Huang, K. MOGONET integrates multi-omics data using graph convolutional networks allowing patient classification and biomarker identification. Nat. Commun. 2021, 12, 3445. [Google Scholar] [CrossRef] [PubMed]
- Wang, Y.; Miller, D.J.; Clarke, R. Approaches to working in high-dimensional data spaces: Gene expression microarrays. Br. J. Cancer 2008, 98, 1023–1028. [Google Scholar] [CrossRef]
- Choi, J.M.; Chae, H. moBRCA-net: A breast cancer subtype classification framework based on multi-omics attention neural networks. BMC Bioinform. 2023, 24, 169. [Google Scholar] [CrossRef]
- Tomczak, K.; Czerwińska, P.; Wiznerowicz, M. ReviewThe Cancer Genome Atlas (TCGA): An immeasurable source of knowledge. Contemp. Oncol./Współczesna Onkol. 2015, 19, 68–77. [Google Scholar] [CrossRef]
- Sørlie, T.; Tibshirani, R.; Parker, J.; Hastie, T.; Marron, J.S.; Nobel, A.; Deng, S.; Johnsen, H.; Pesich, R.; Geisler, S.; et al. Repeated observation of breast tumor subtypes in independent gene expression data sets. Proc. Natl. Acad. Sci. USA 2003, 100, 8418–8423. [Google Scholar] [CrossRef]
- Perou, C.M.; Sørlie, T.; Eisen, M.B.; van de Rijn, M.; Jeffrey, S.S.; Rees, C.A.; Pollack, J.R.; Ross, D.T.; Johnsen, H.; Akslen, L.A.; et al. Molecular portraits of human breast tumours. Nature 2000, 406, 747–752. [Google Scholar] [CrossRef]
- Sørlie, T.; Perou, C.M.; Tibshirani, R.; Aas, T.; Geisler, S.; Johnsen, H.; Hastie, T.; Eisen, M.B.; van de Rijn, M.; Jeffrey, S.S.; et al. Gene expression patterns of breast carcinomas distinguish tumor subclasses with clinical implications. Proc. Natl. Acad. Sci. USA 2001, 98, 10869–10874. [Google Scholar] [CrossRef]
- Chhabra, R. miRNA and Methylation: A Multifaceted Liaison. ChemBioChem 2015, 16, 195–203. [Google Scholar] [CrossRef] [PubMed]
- Xuan, J.; Jing, Z.; Yuanfang, Z.; Xiaoju, H.; Pei, L.; Guiyin, J.; Yu, Z. Comprehensive analysis of DNA methylation and gene expression of placental tissue in preeclampsia patients. Hypertens. Pregnancy 2016, 35, 129–138. [Google Scholar] [CrossRef] [PubMed]
- Lin, D.; Calhoun, V.D.; Wang, Y.-P. Correspondence between fMRI and SNP data by group sparse canonical correlation analysis. Med. Image Anal. 2014, 18, 891–902. [Google Scholar] [CrossRef] [PubMed]
- Du, L.; Zhang, J.; Liu, F.; Wang, H.; Guo, L.; Han, J.; Alzheimer’s Disease Neuroimaging Initiative. Identifying associations among genomic, proteomic and imaging biomarkers via adaptive sparse multi-view canonical correlation analysis. Med. Image Anal. 2021, 70, 102003. [Google Scholar] [CrossRef] [PubMed]
- He, L.; Hannon, G.J. MicroRNAs: Small RNAs with a big role in gene regulation. Nat. Rev. Genet. 2004, 5, 522–531. [Google Scholar] [CrossRef] [PubMed]
- Jones, P.A. Functions of DNA methylation: Islands, start sites, gene bodies and beyond. Nat. Rev. Genet. 2012, 13, 484–492. [Google Scholar] [CrossRef]
- Michalak, P. Coexpression, coregulation, and cofunctionality of neighboring genes in eukaryotic genomes. Genomics 2008, 91, 243–248. [Google Scholar] [CrossRef]
- Moon, S.; Lee, H. MOMA: A multi-task attention learning algorithm for multi-omics data interpretation and classification. Bioinformatics 2022, 38, 2287–2296. [Google Scholar] [CrossRef]
- Vaswani, A.; Shazeer, N.; Parmar, N.; Uszkoreit, J.; Jones, L.; Gomez, A.N.; Kaiser, Ł.; Polosukhin, I. Attention is all you need. In Proceedings of the Advances in Neural Information Processing Systems, Long Beach, CA, USA, 4–9 December 2017; Volume 30. Available online: https://papers.nips.cc/paper_files/paper/2017/hash/3f5ee243547dee91fbd053c1c4a845aa-Abstract.html (accessed on 20 March 2024).
- Zou, H.; Hastie, T. Regularization and Variable Selection via the Elastic Net. J. R. Stat. Soc. Ser. B Stat. Methodol. 2005, 67, 301–320. [Google Scholar] [CrossRef]
- Biau, G.; Scornet, E. A random forest guided tour. TEST 2016, 25, 197–227. [Google Scholar] [CrossRef]
- Chen, T.; Guestrin, C. XGBoost: A Scalable Tree Boosting System. In Proceedings of the 22nd ACM SIGKDD International Conference on Knowledge Discovery and Data Mining, San Francisco, CA, USA, 13–17 August 2016; pp. 785–794. [Google Scholar]
- Xie, F.-F.; Deng, F.-Y.; Wu, L.-F.; Mo, X.-B.; Zhu, H.; Wu, J.; Guo, Y.-F.; Zeng, K.-Q.; Wang, M.-J.; Zhu, X.-W.; et al. Multiple correlation analyses revealed complex relationship between DNA methylation and mRNA expression in human peripheral blood mononuclear cells. Funct. Integr. Genom. 2018, 18, 1–10. [Google Scholar] [CrossRef] [PubMed]
- Bartel, D.P. MicroRNAs: Target Recognition and Regulatory Functions. Cell 2009, 136, 215–233. [Google Scholar] [CrossRef] [PubMed]
- Enerly, E.; Steinfeld, I.; Kleivi, K.; Leivonen, S.-K.; Aure, M.R.; Russnes, H.G.; Rønneberg, J.A.; Johnsen, H.; Navon, R.; Rødland, E.; et al. miRNA-mRNA Integrated Analysis Reveals Roles for miRNAs in Primary Breast Tumors. PLoS ONE 2011, 6, e16915. [Google Scholar] [CrossRef] [PubMed]
Disclaimer/Publisher’s Note: The statements, opinions and data contained in all publications are solely those of the individual author(s) and contributor(s) and not of MDPI and/or the editor(s). MDPI and/or the editor(s) disclaim responsibility for any injury to people or property resulting from any ideas, methods, instructions or products referred to in the content. |
© 2024 by the authors. Licensee MDPI, Basel, Switzerland. This article is an open access article distributed under the terms and conditions of the Creative Commons Attribution (CC BY) license (https://creativecommons.org/licenses/by/4.0/).