
Activity and Dose Rate Calculations for Joint European Torus Outer Long-Term Irradiation Station during Tritium and Second Deuterium Tritium Experiment Campaigns


Abstract
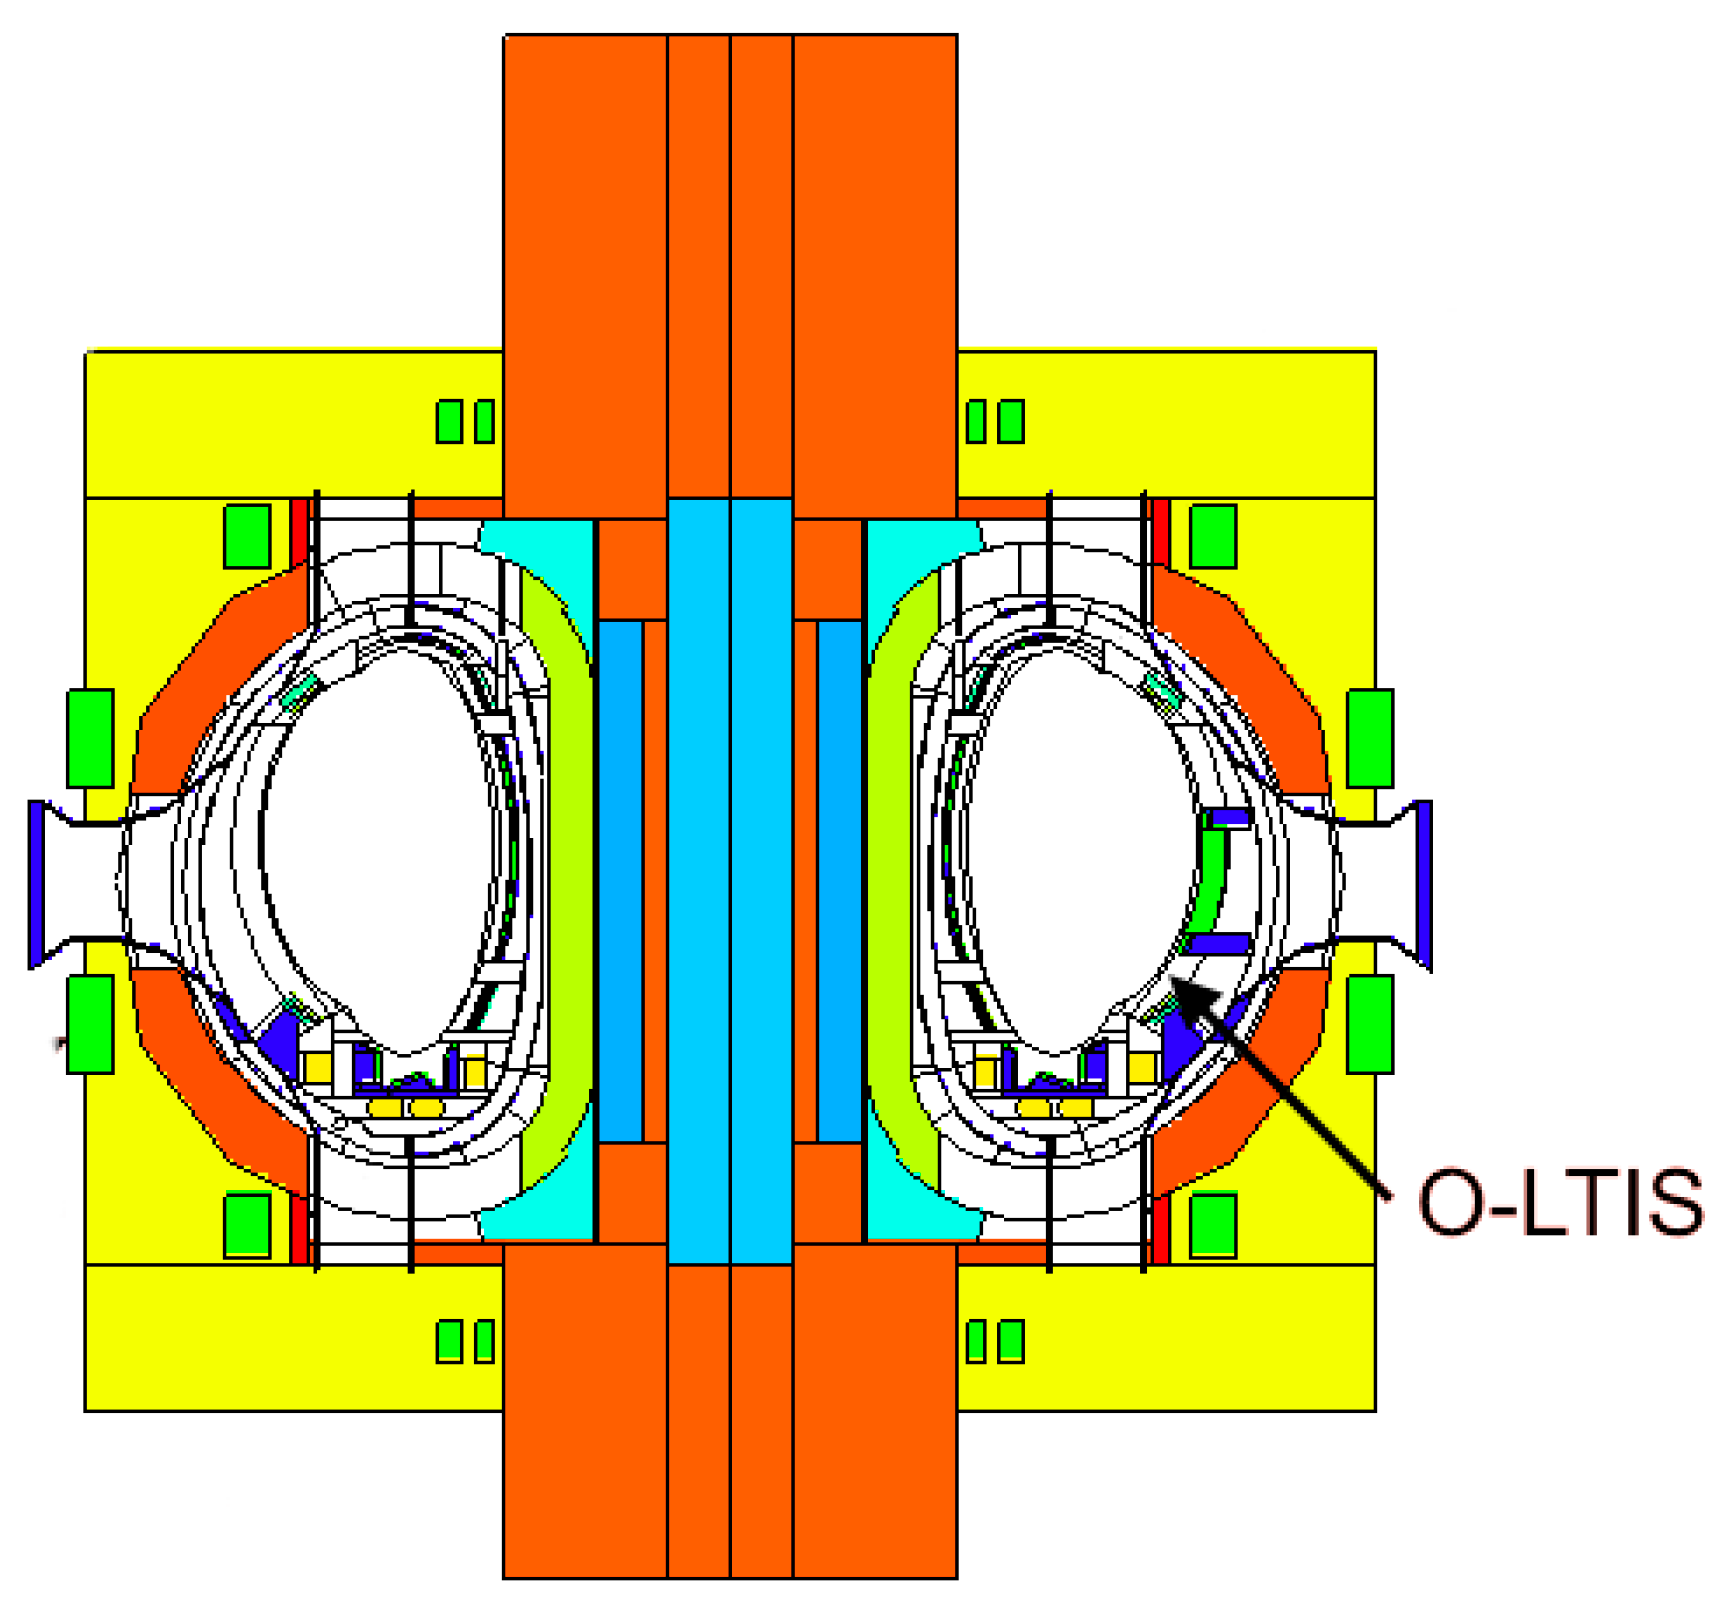
1. Introduction
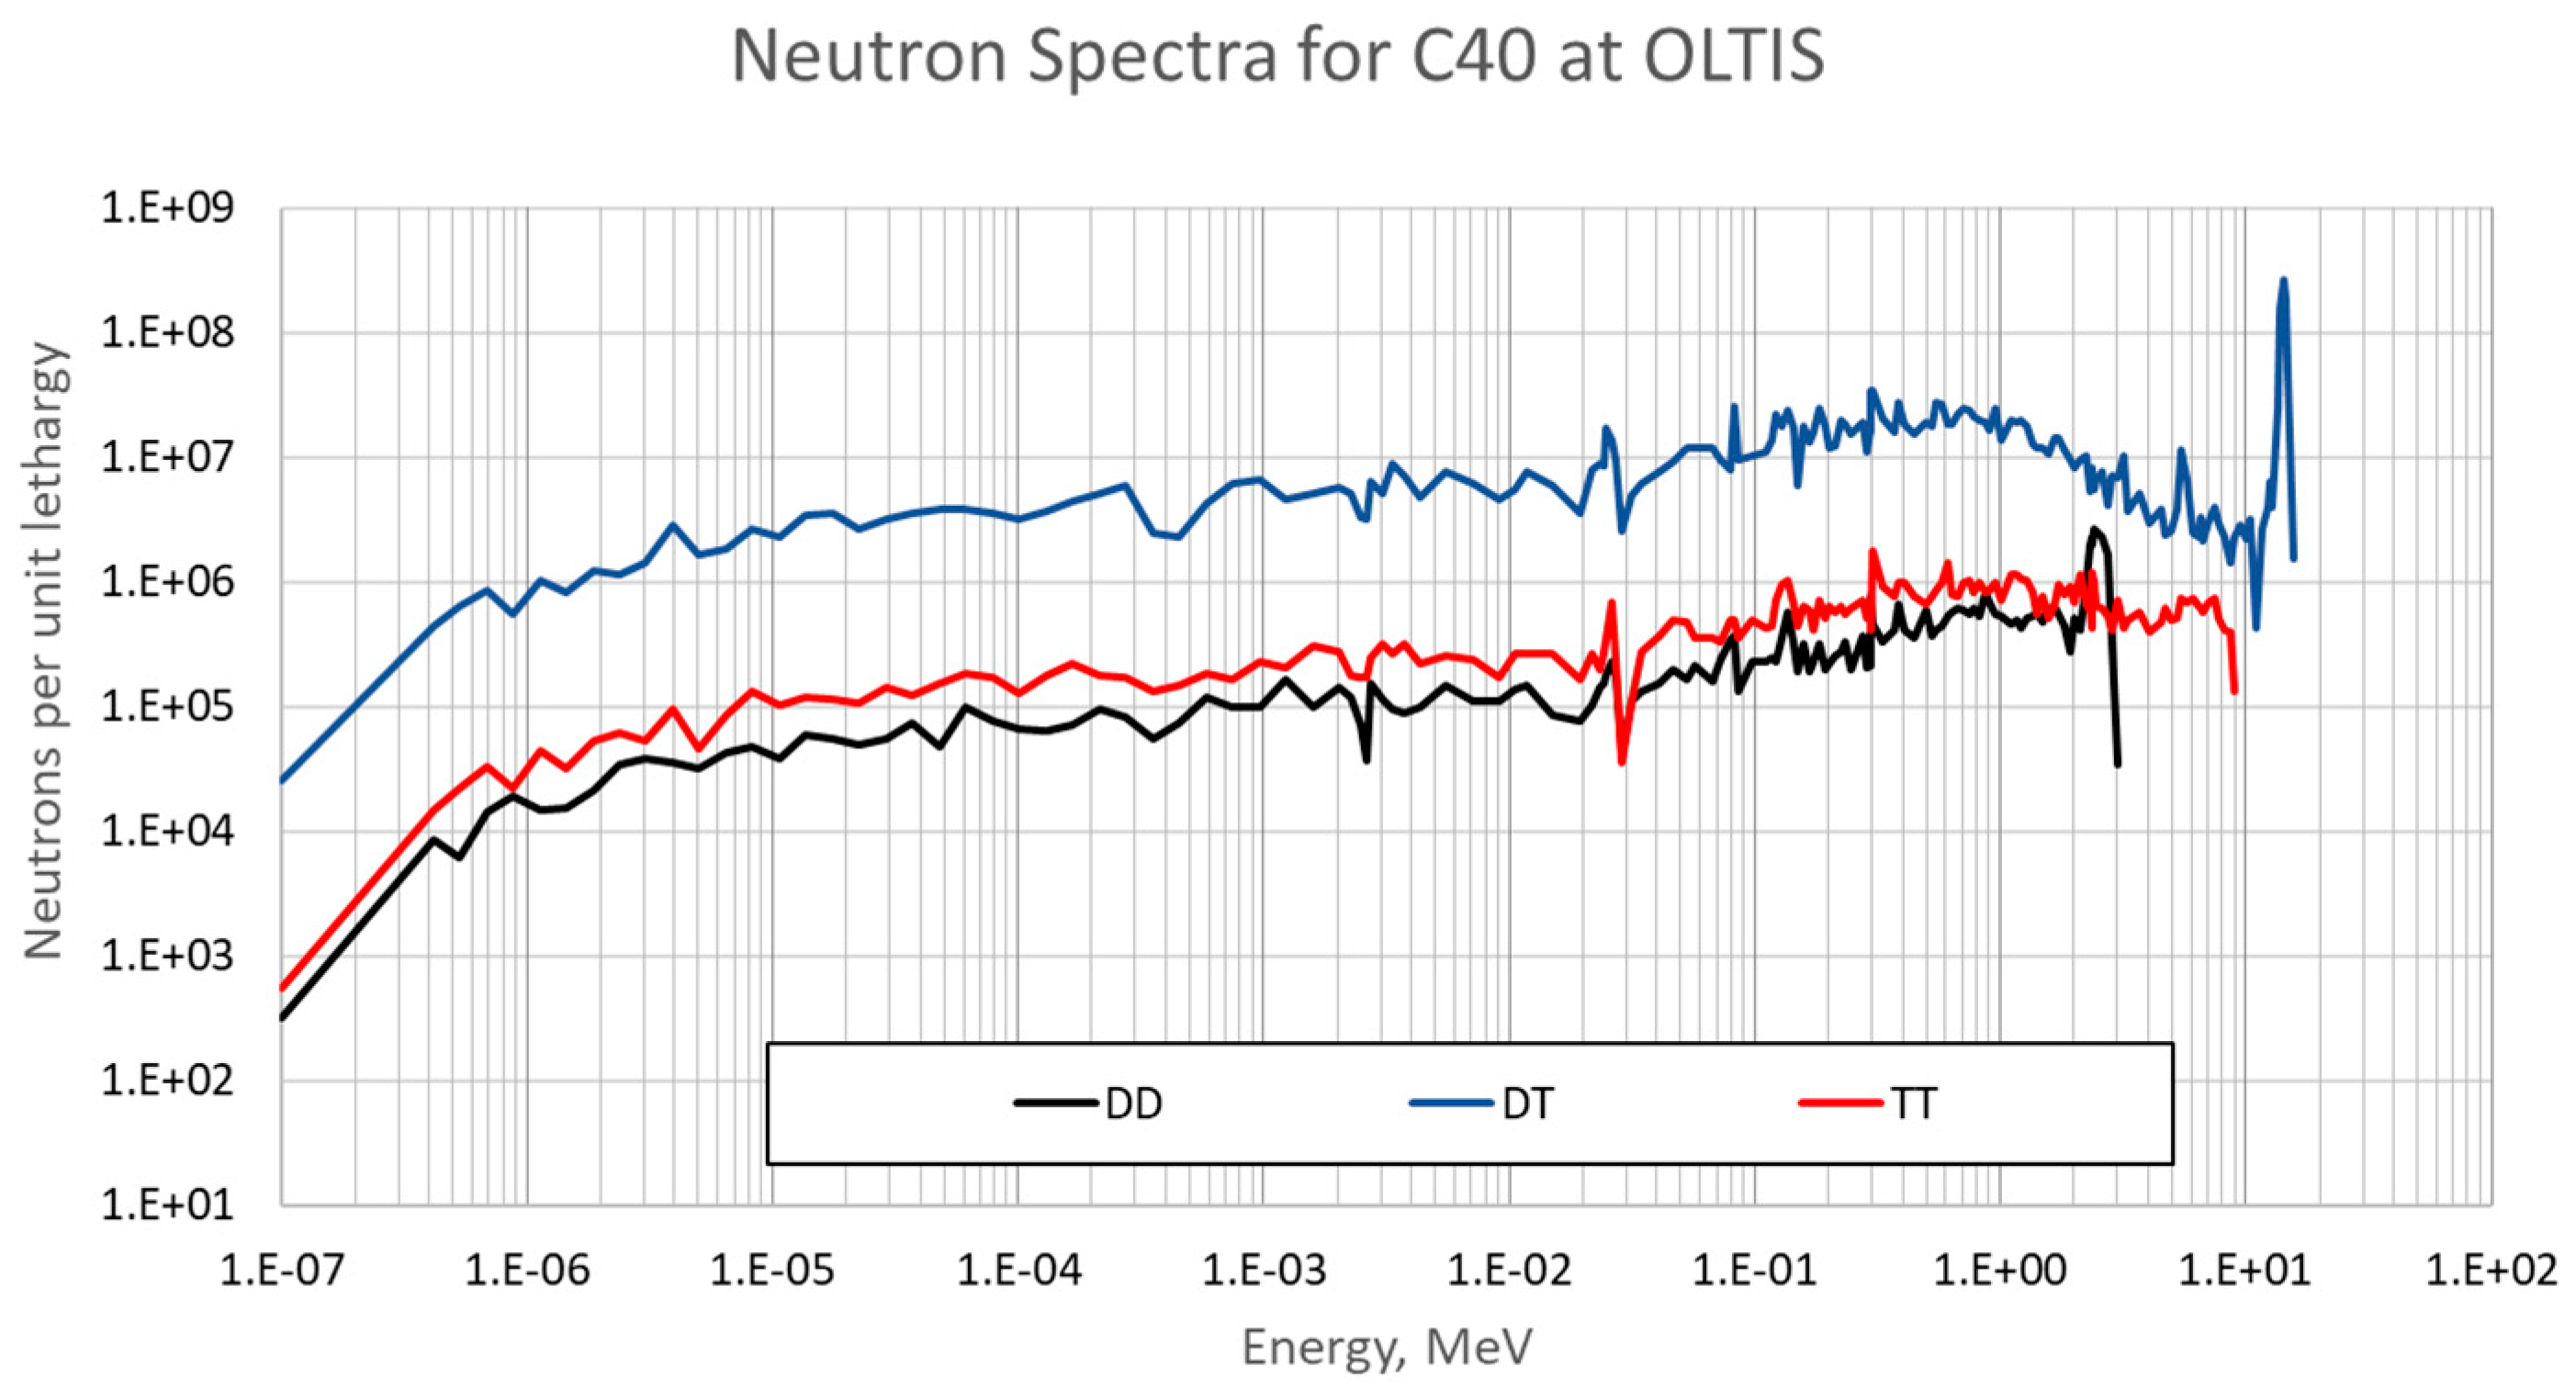
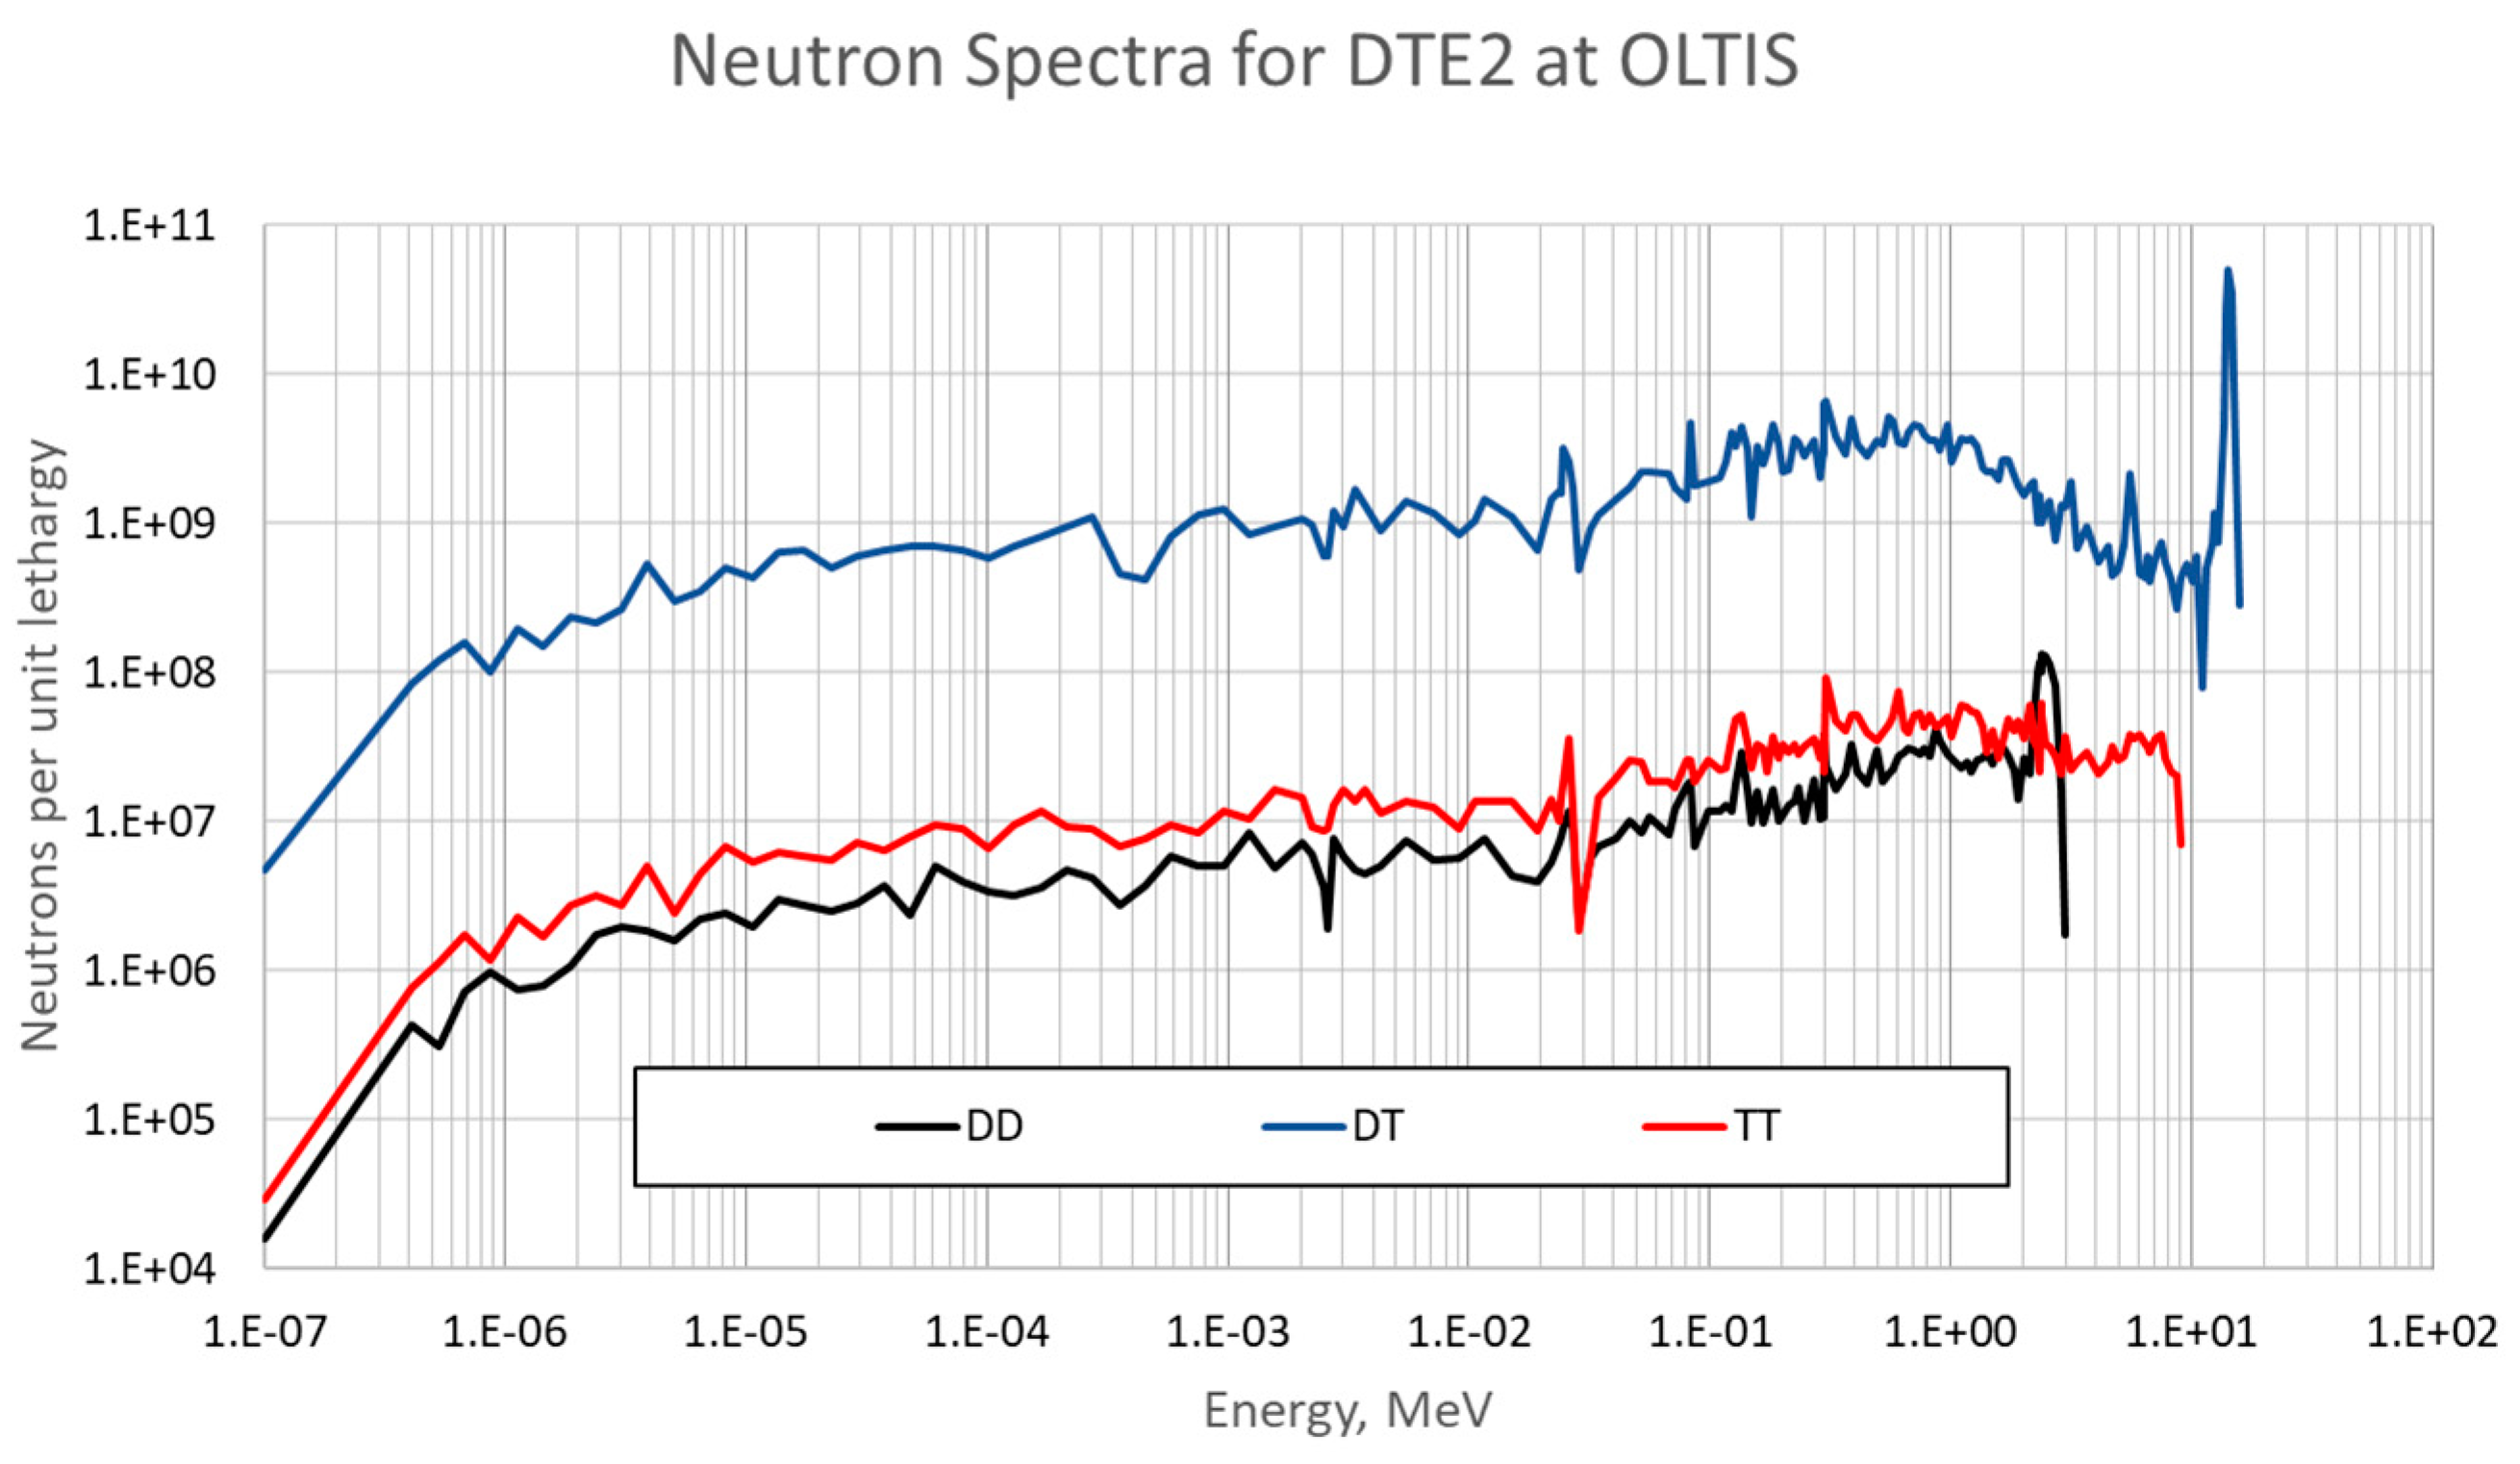
2. Methods and Materials
- -
- Silver;
- -
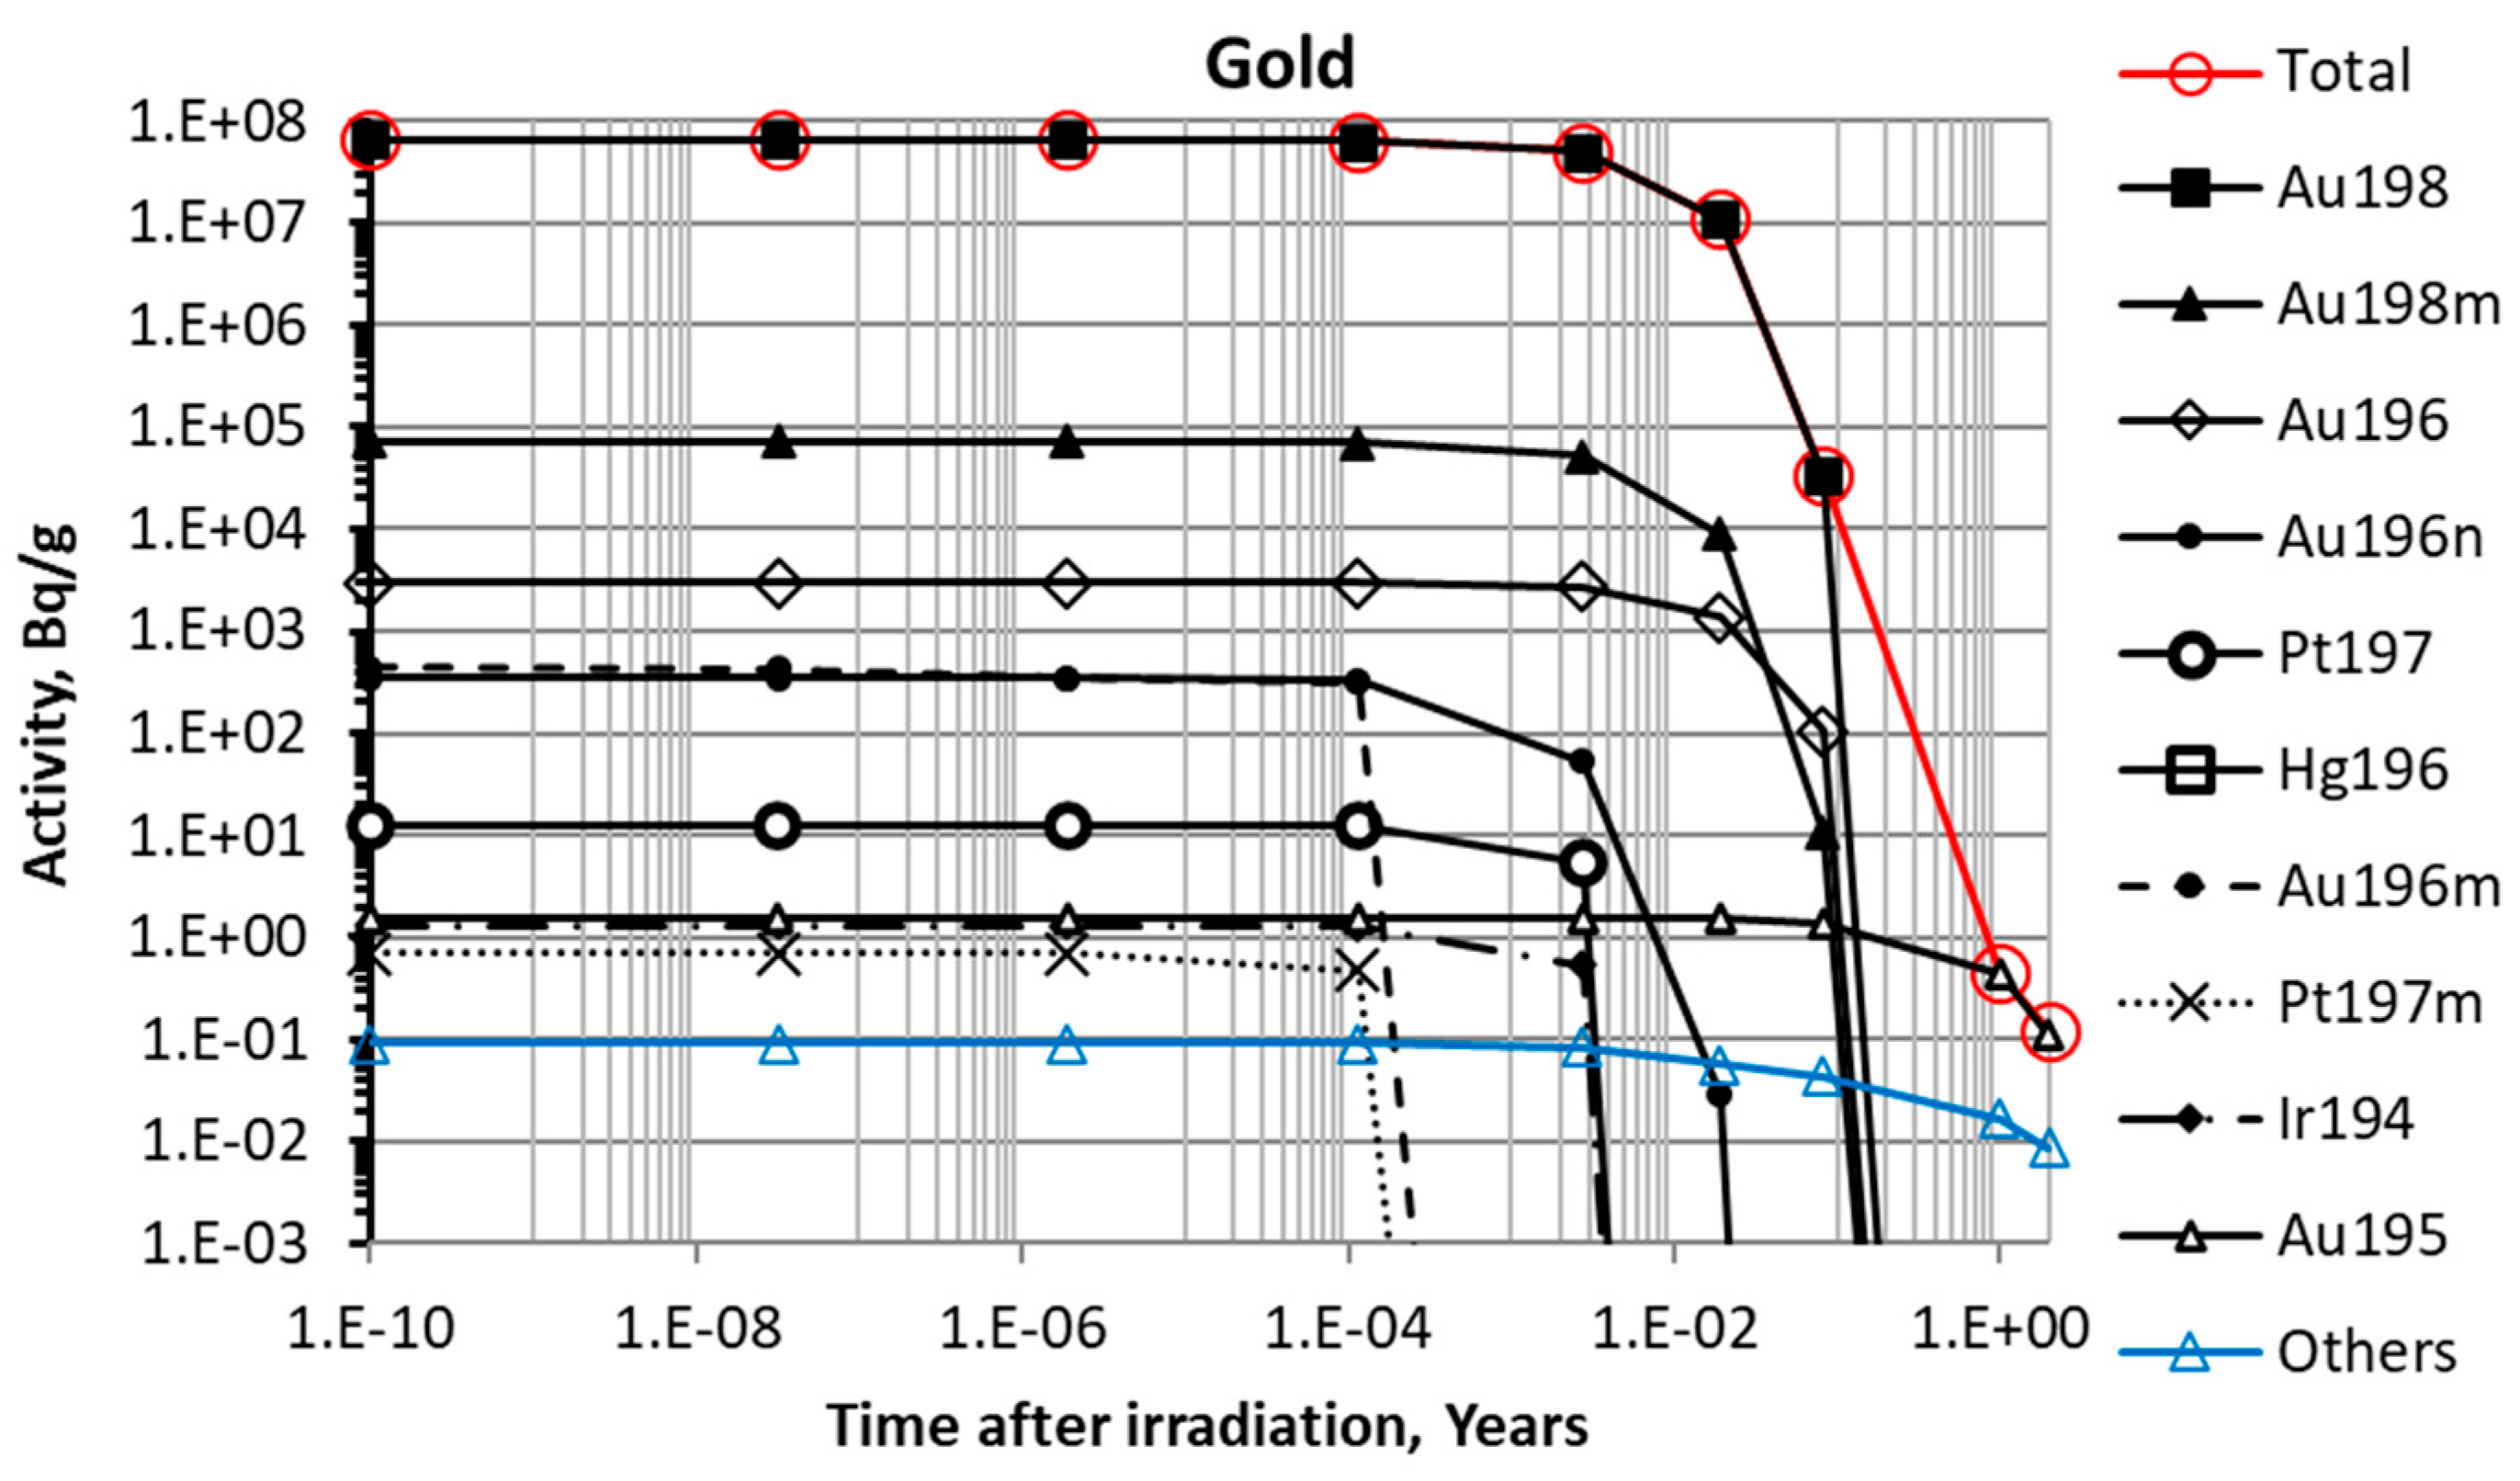
- Gold;
- -
- Manganese (88%) and nickel (12%);
- -
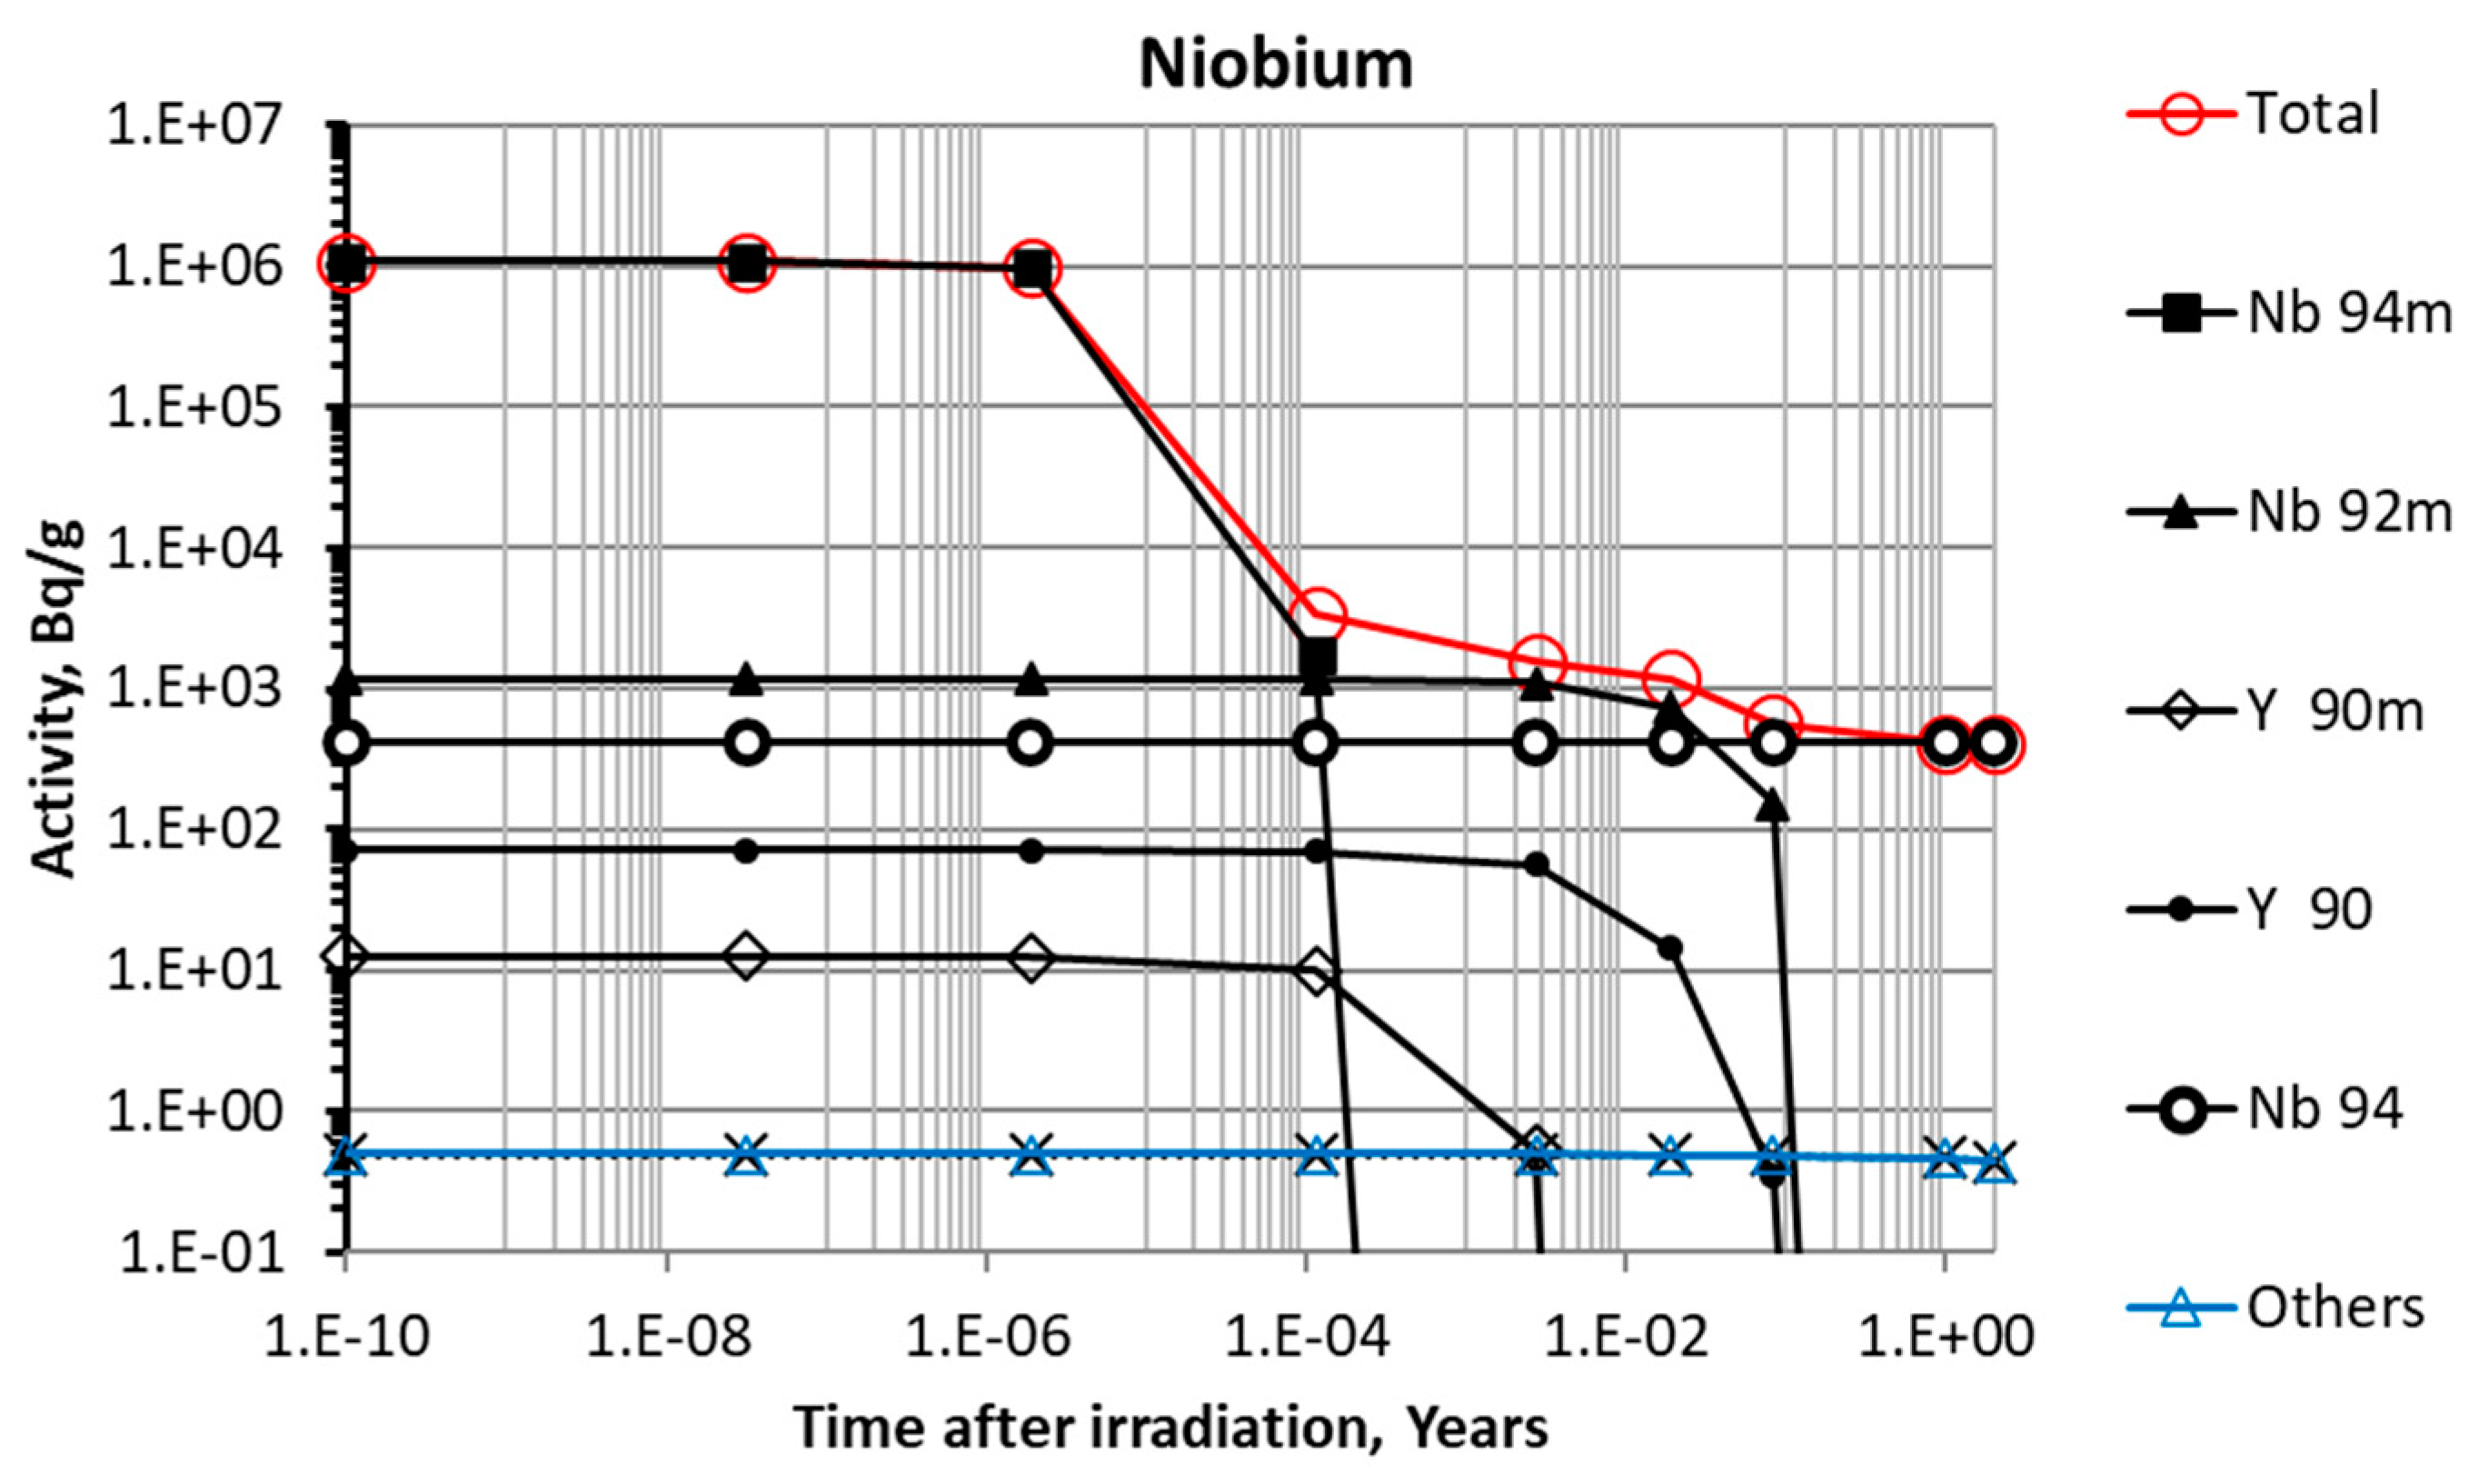
- Niobium;
- -
- Nickel;
- -
- Rhodium;
- -
- Titanium;
- -
- Yttrium.
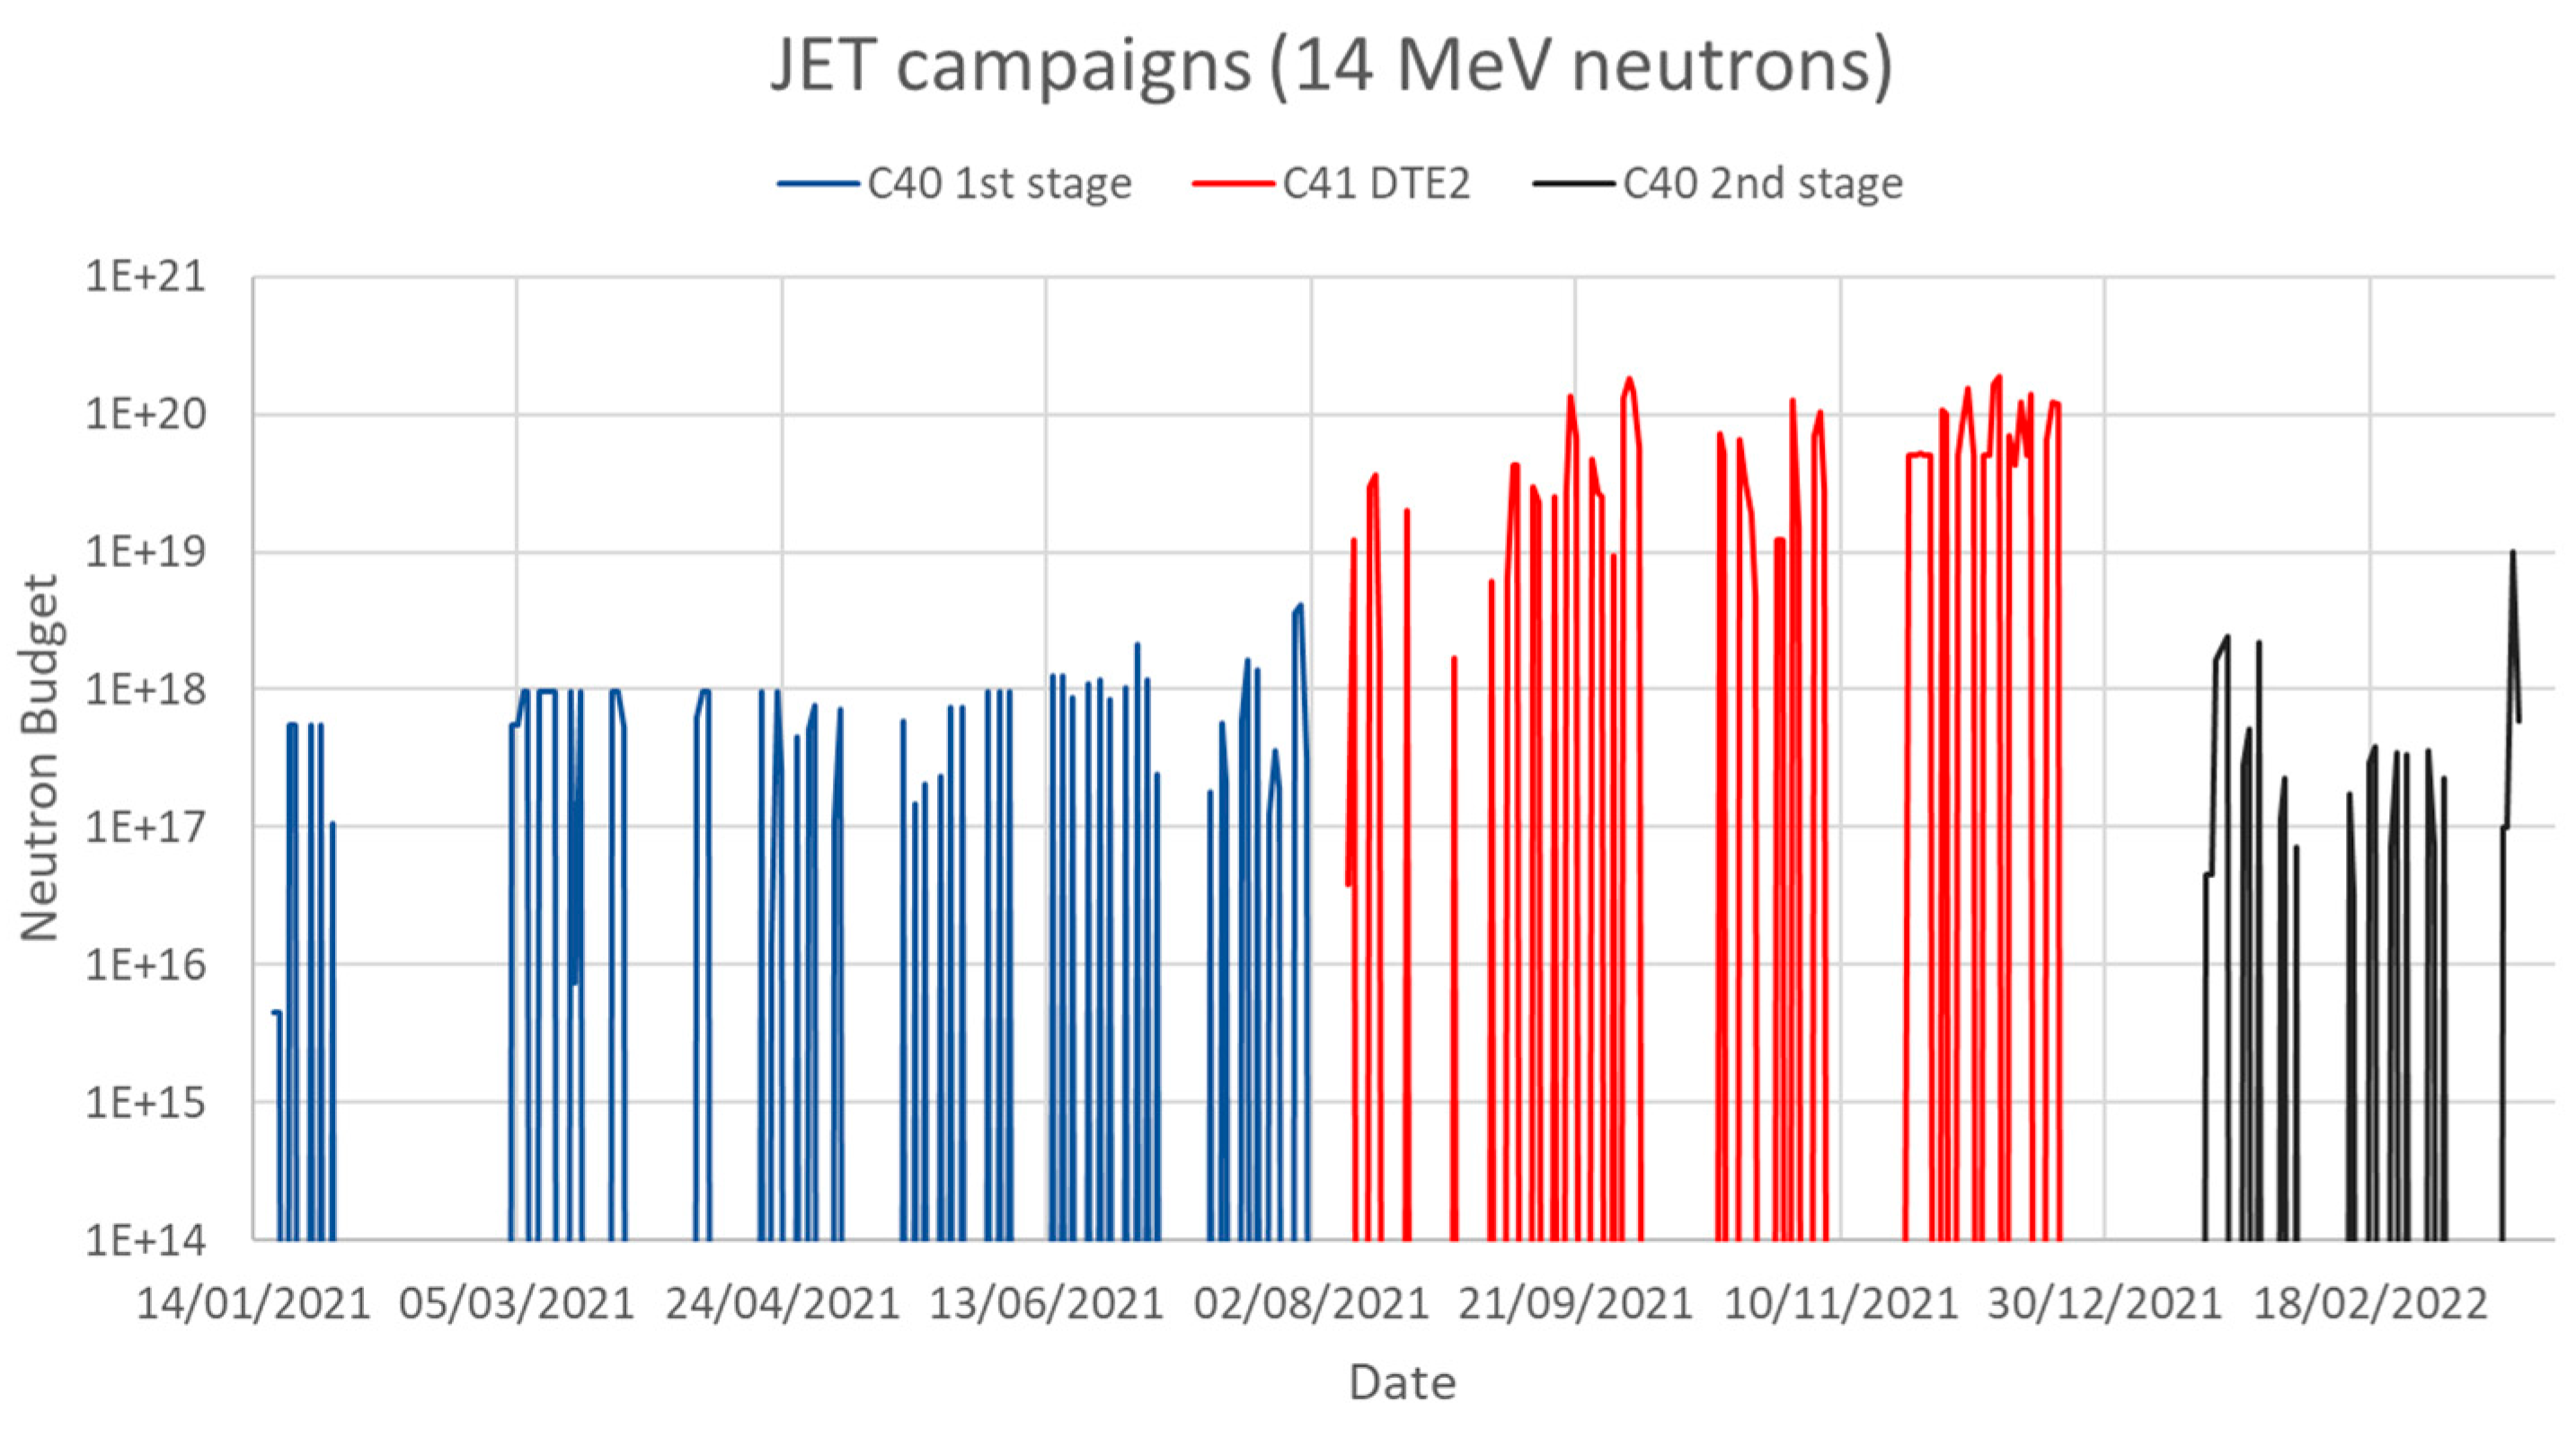
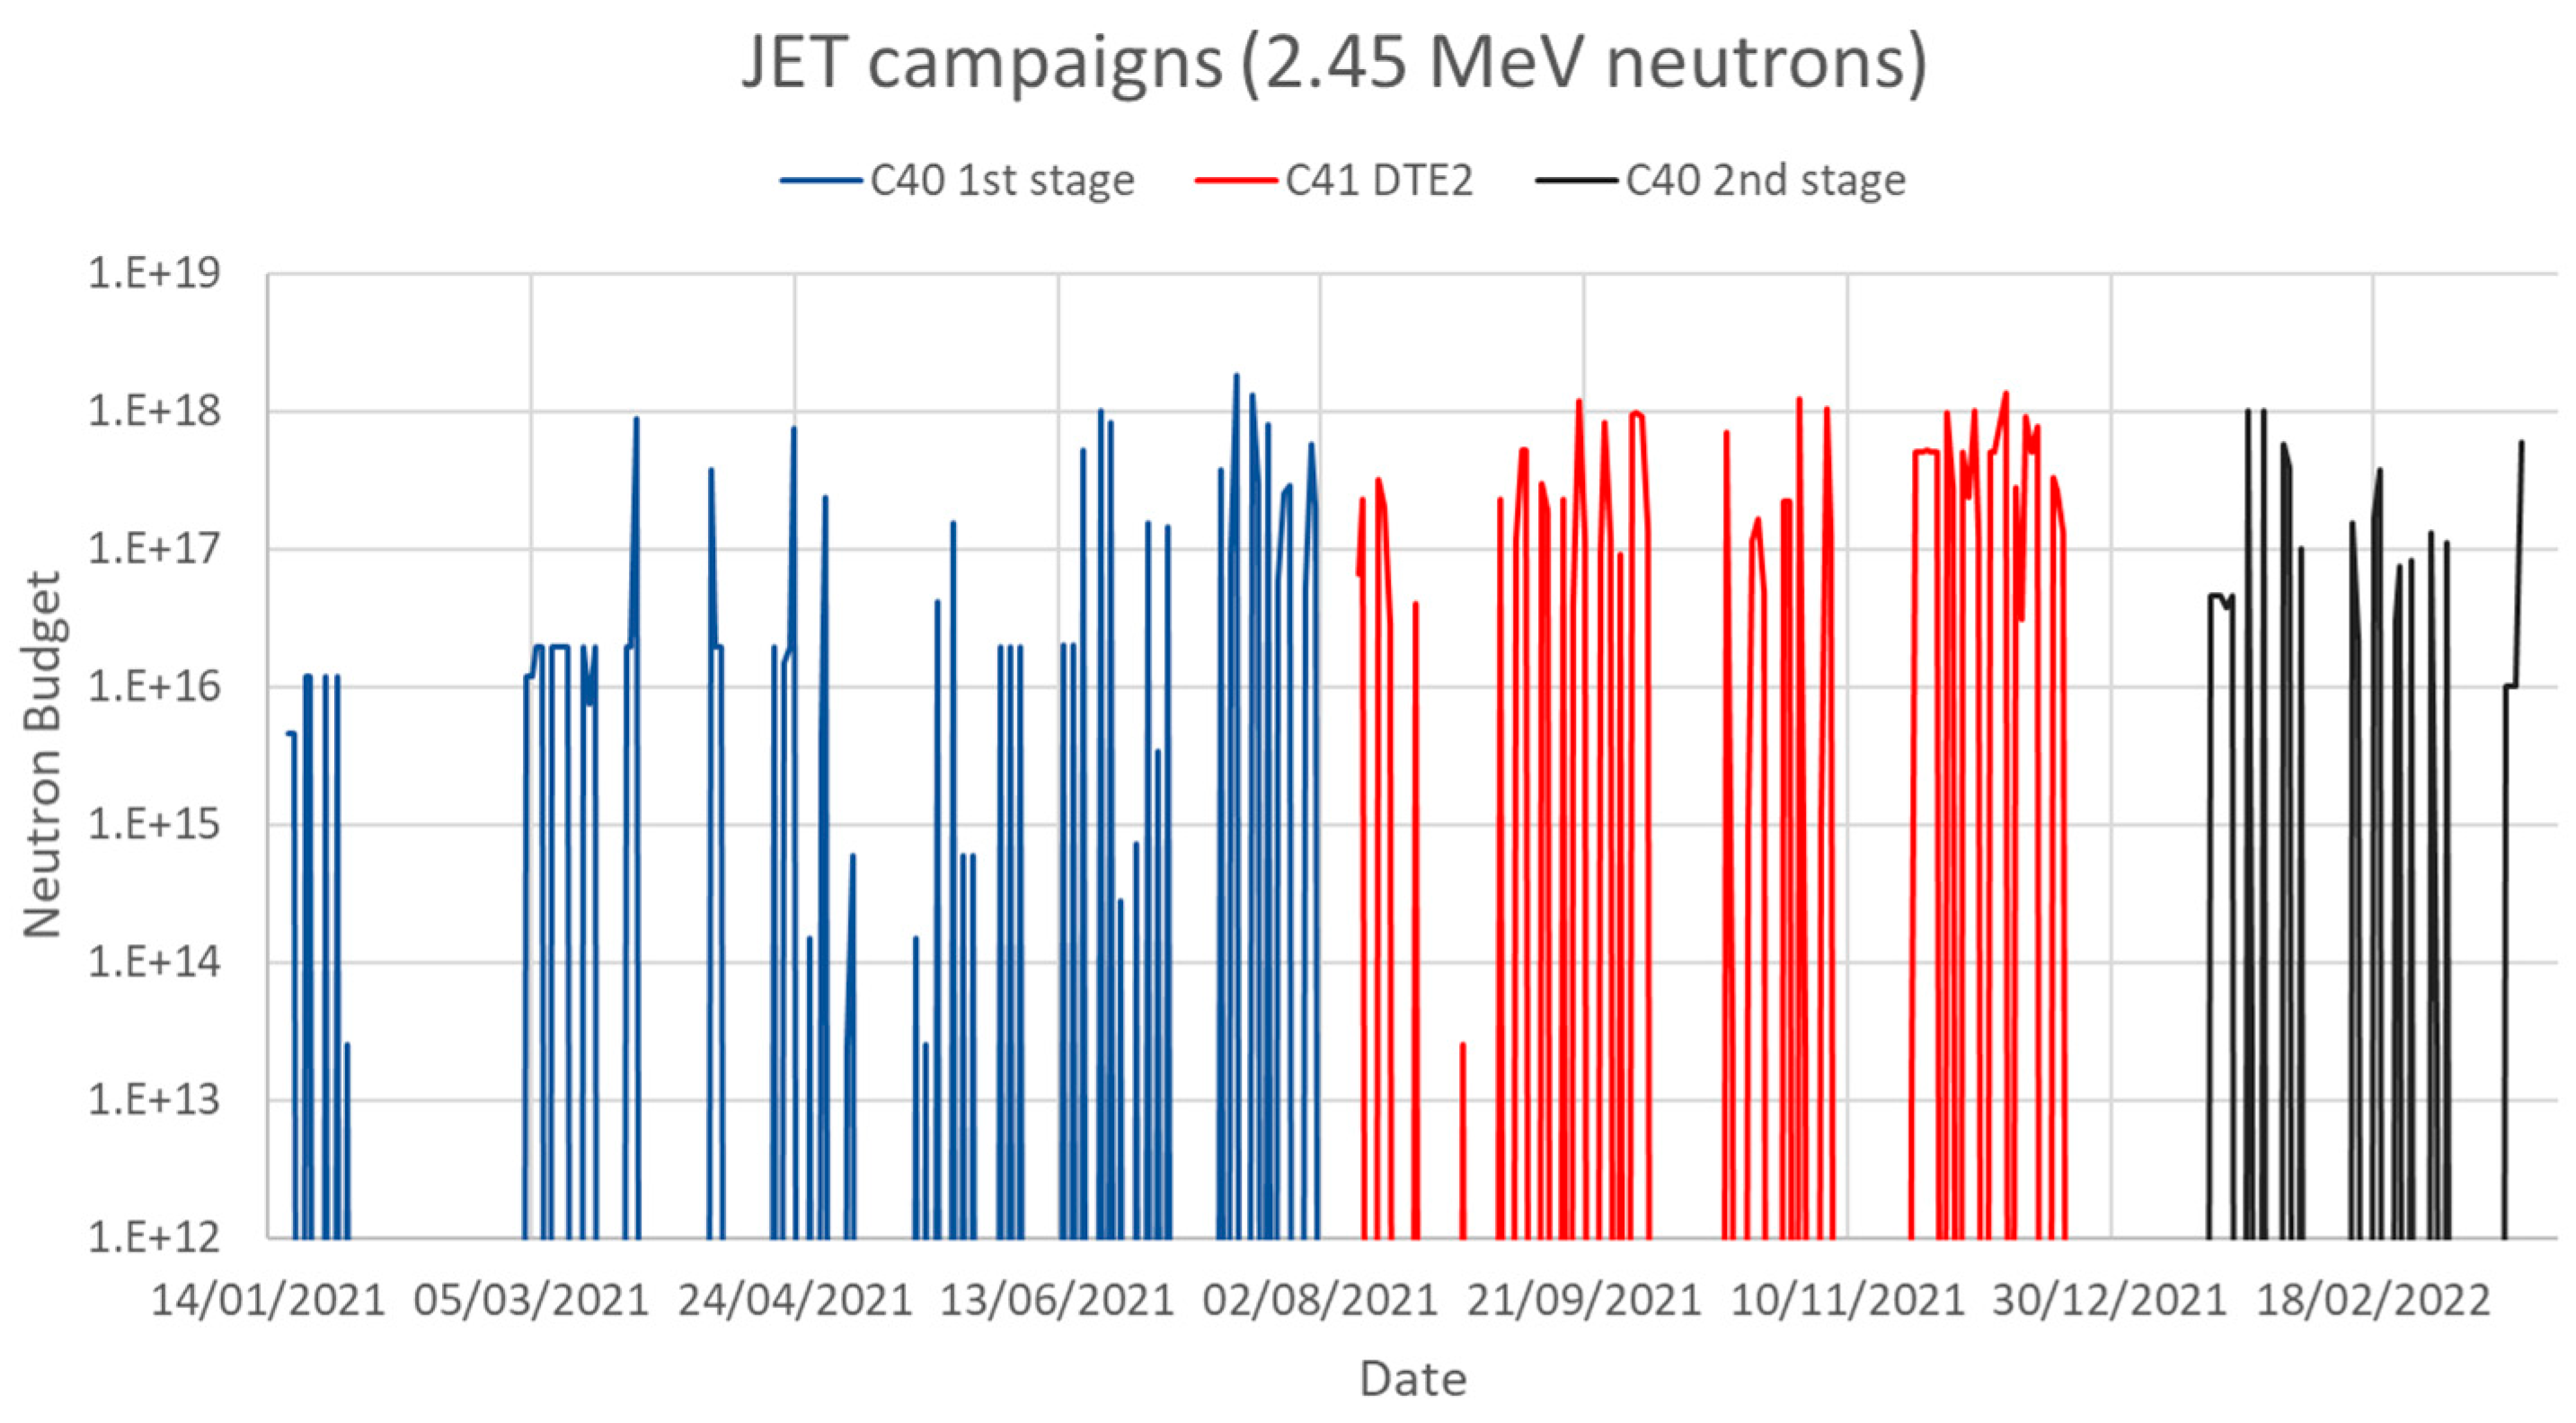
- (1)
- C40 Campaign, part 1:
- (2)
- DTE2 Campaign:
- (3)
- C40 Campaign, part 2:
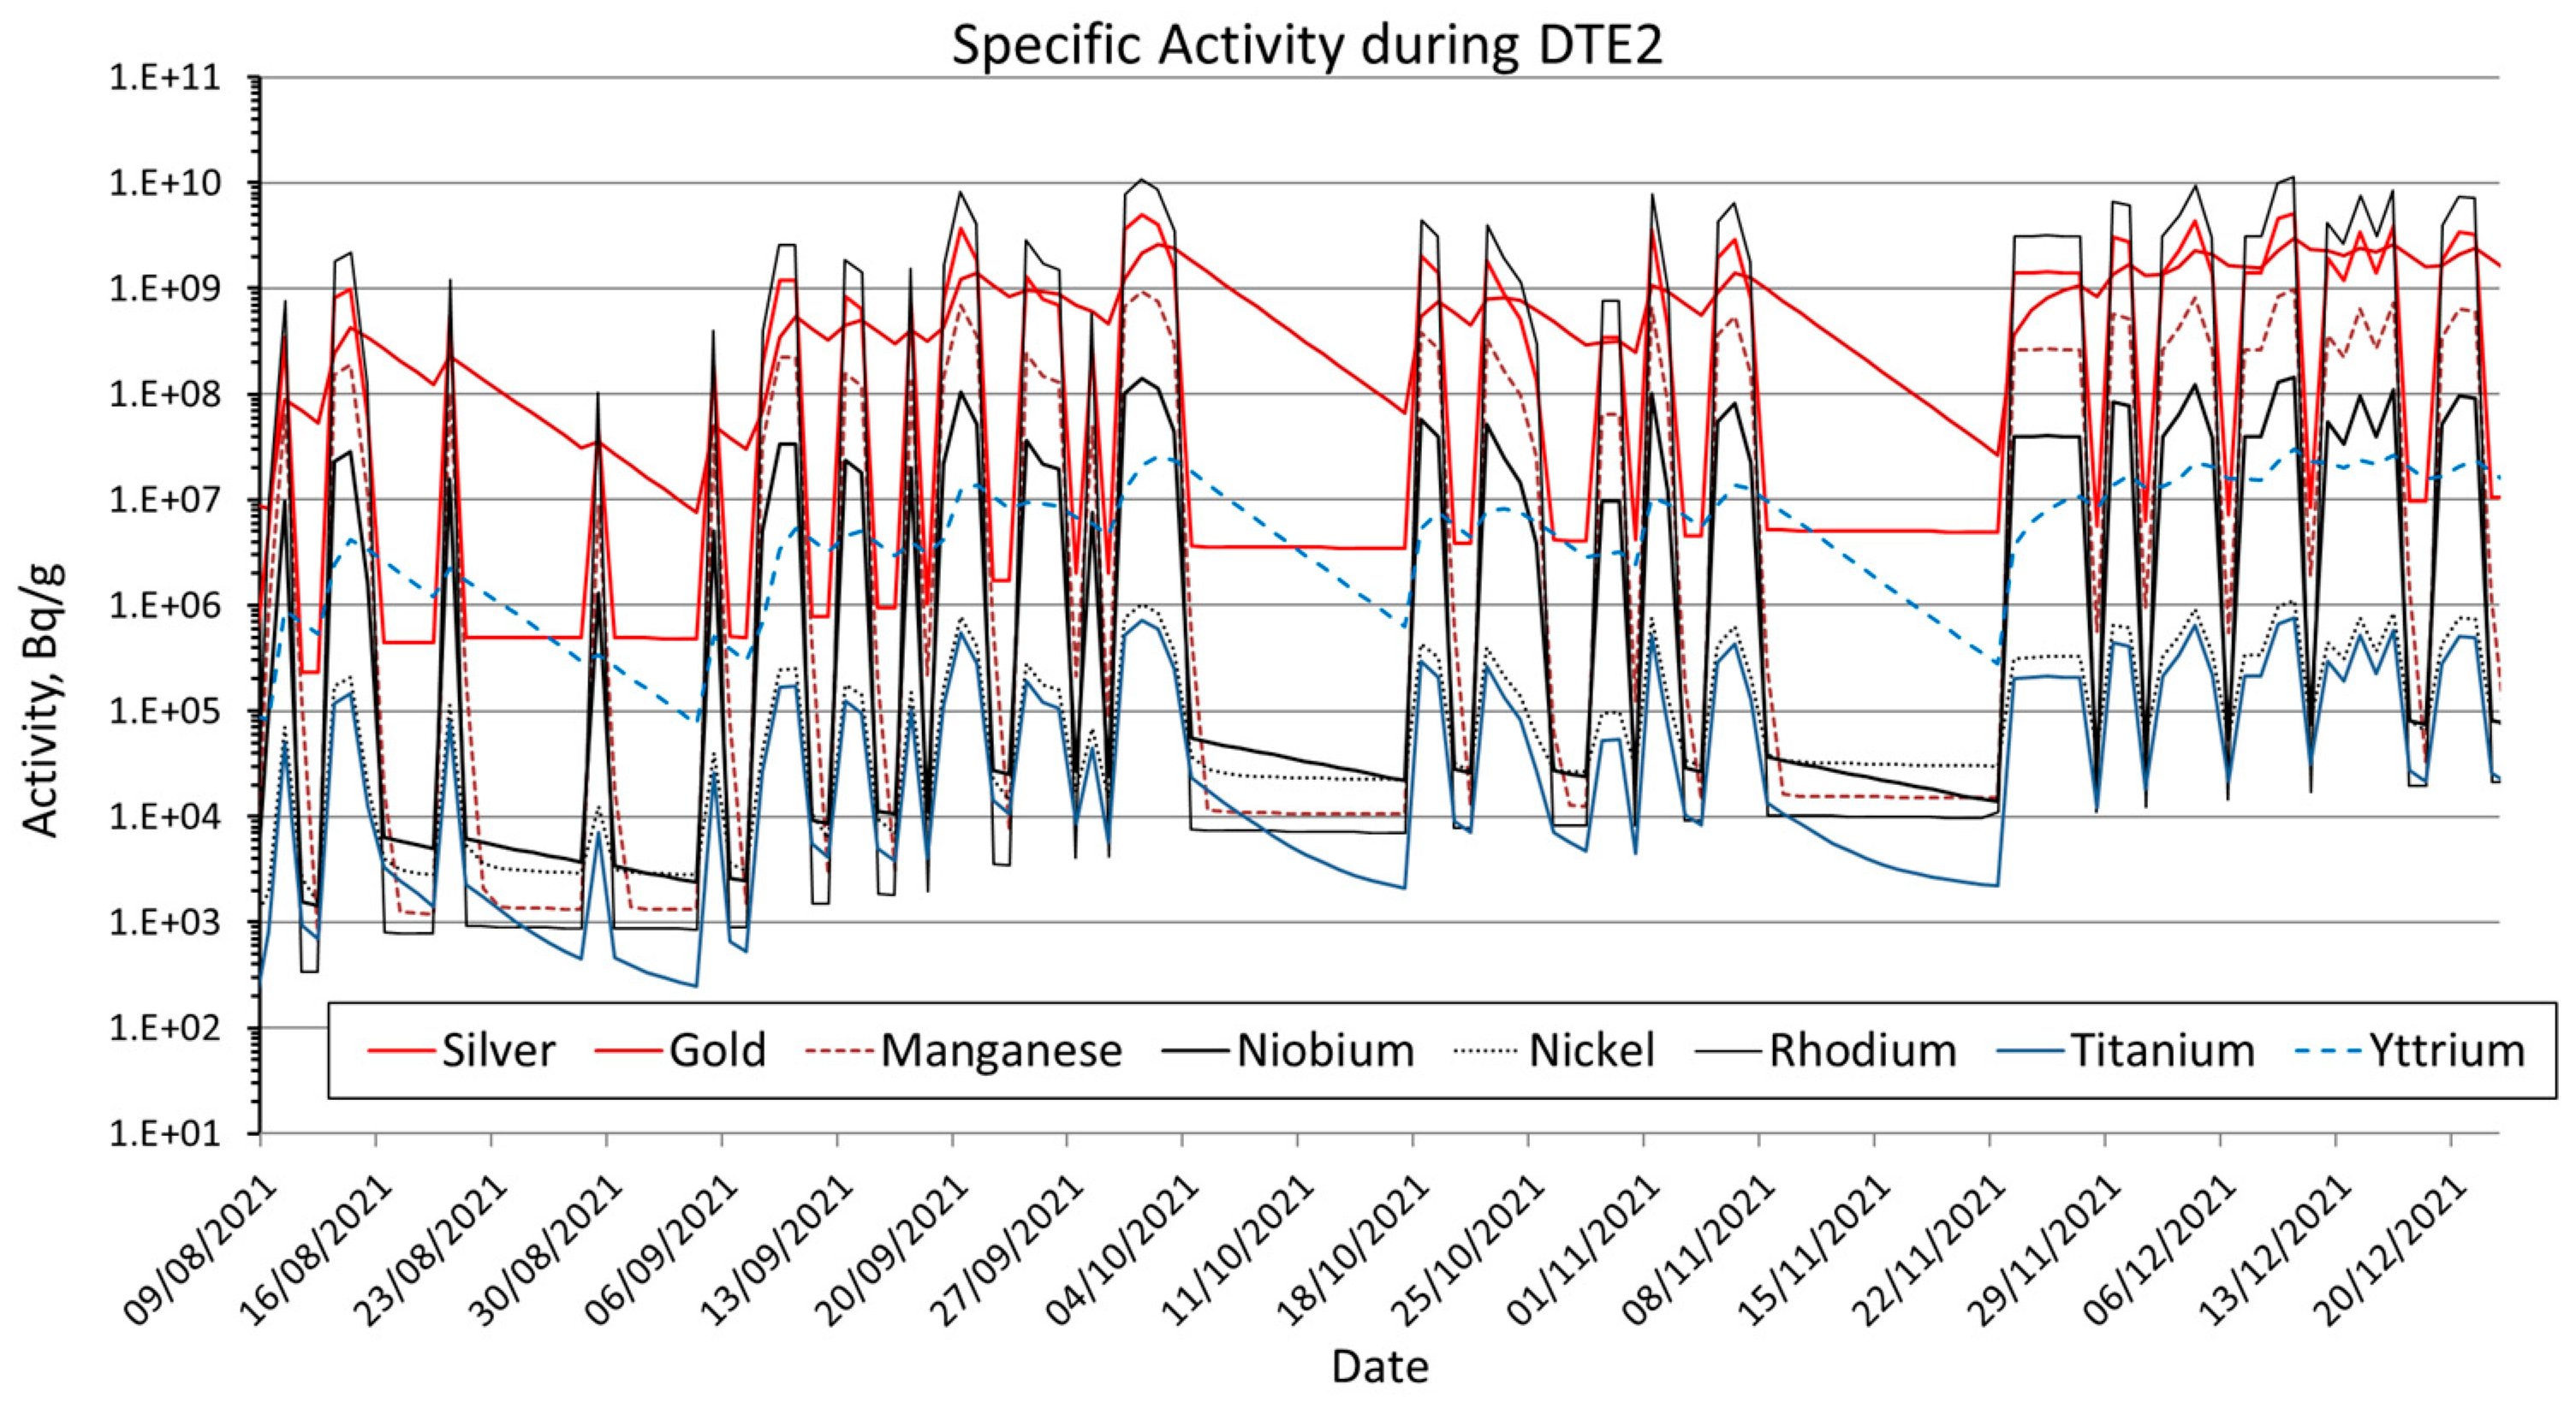
3. Results
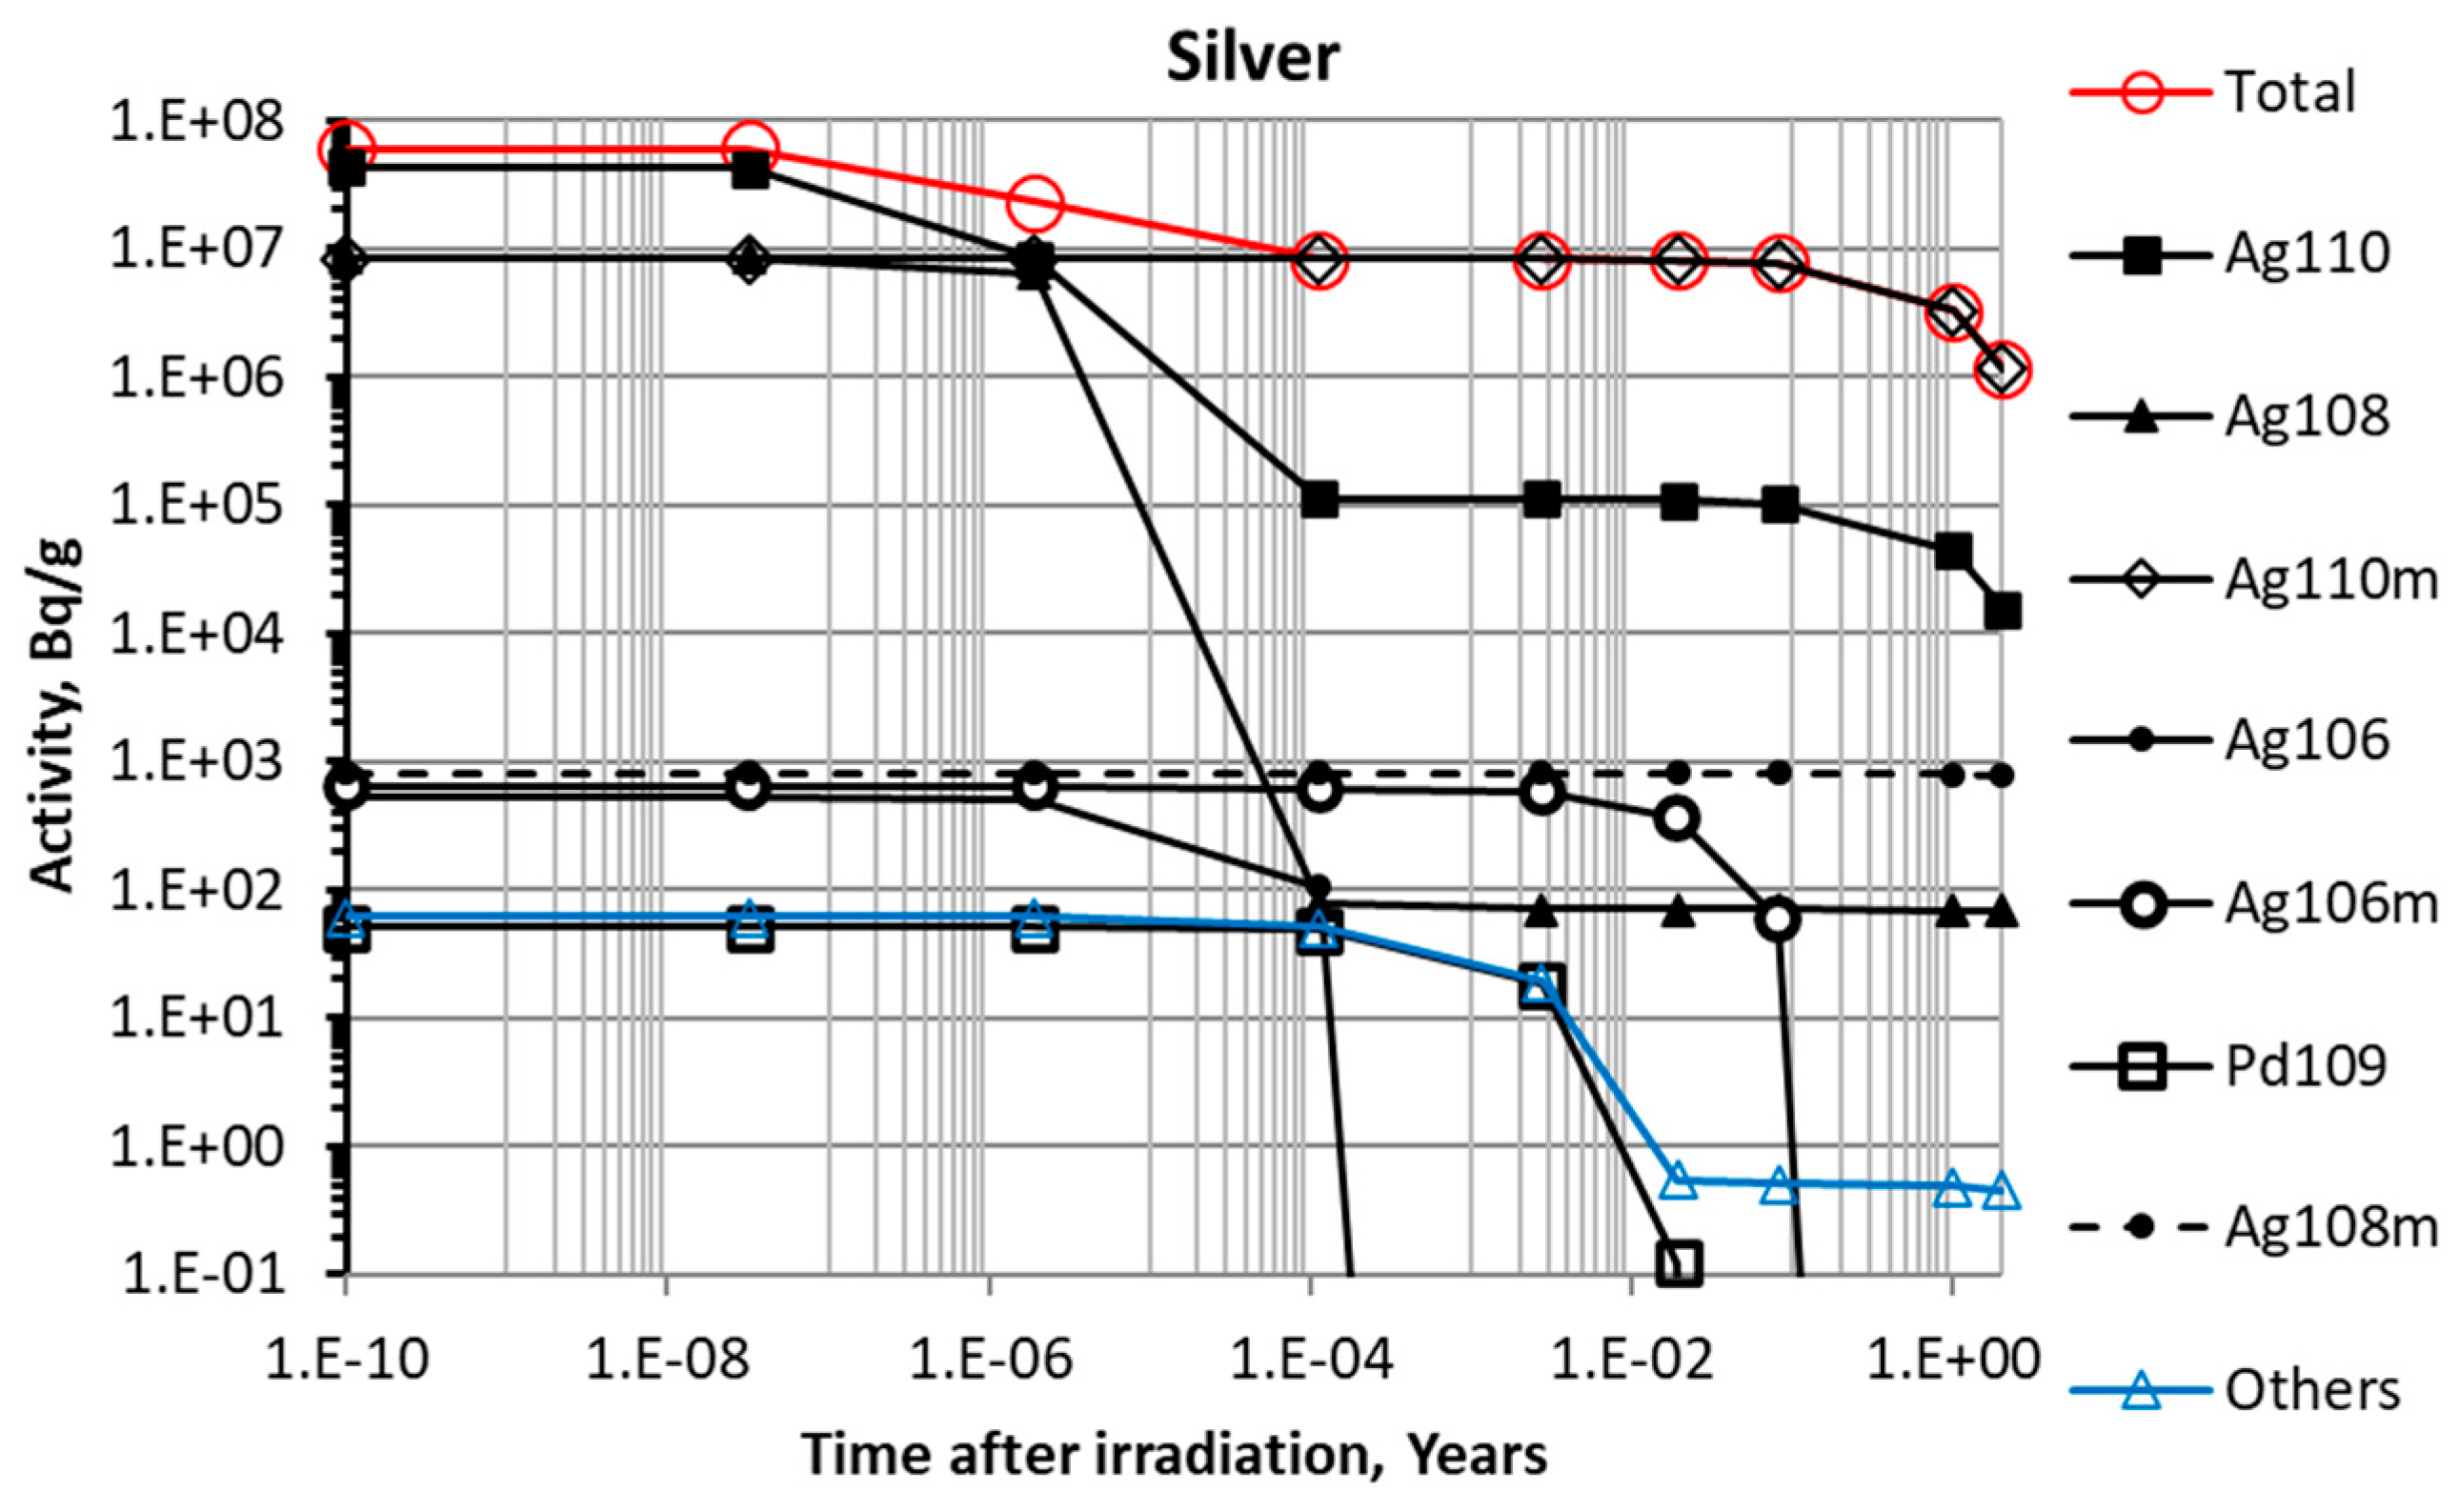
3.1. Silver
3.2. Gold
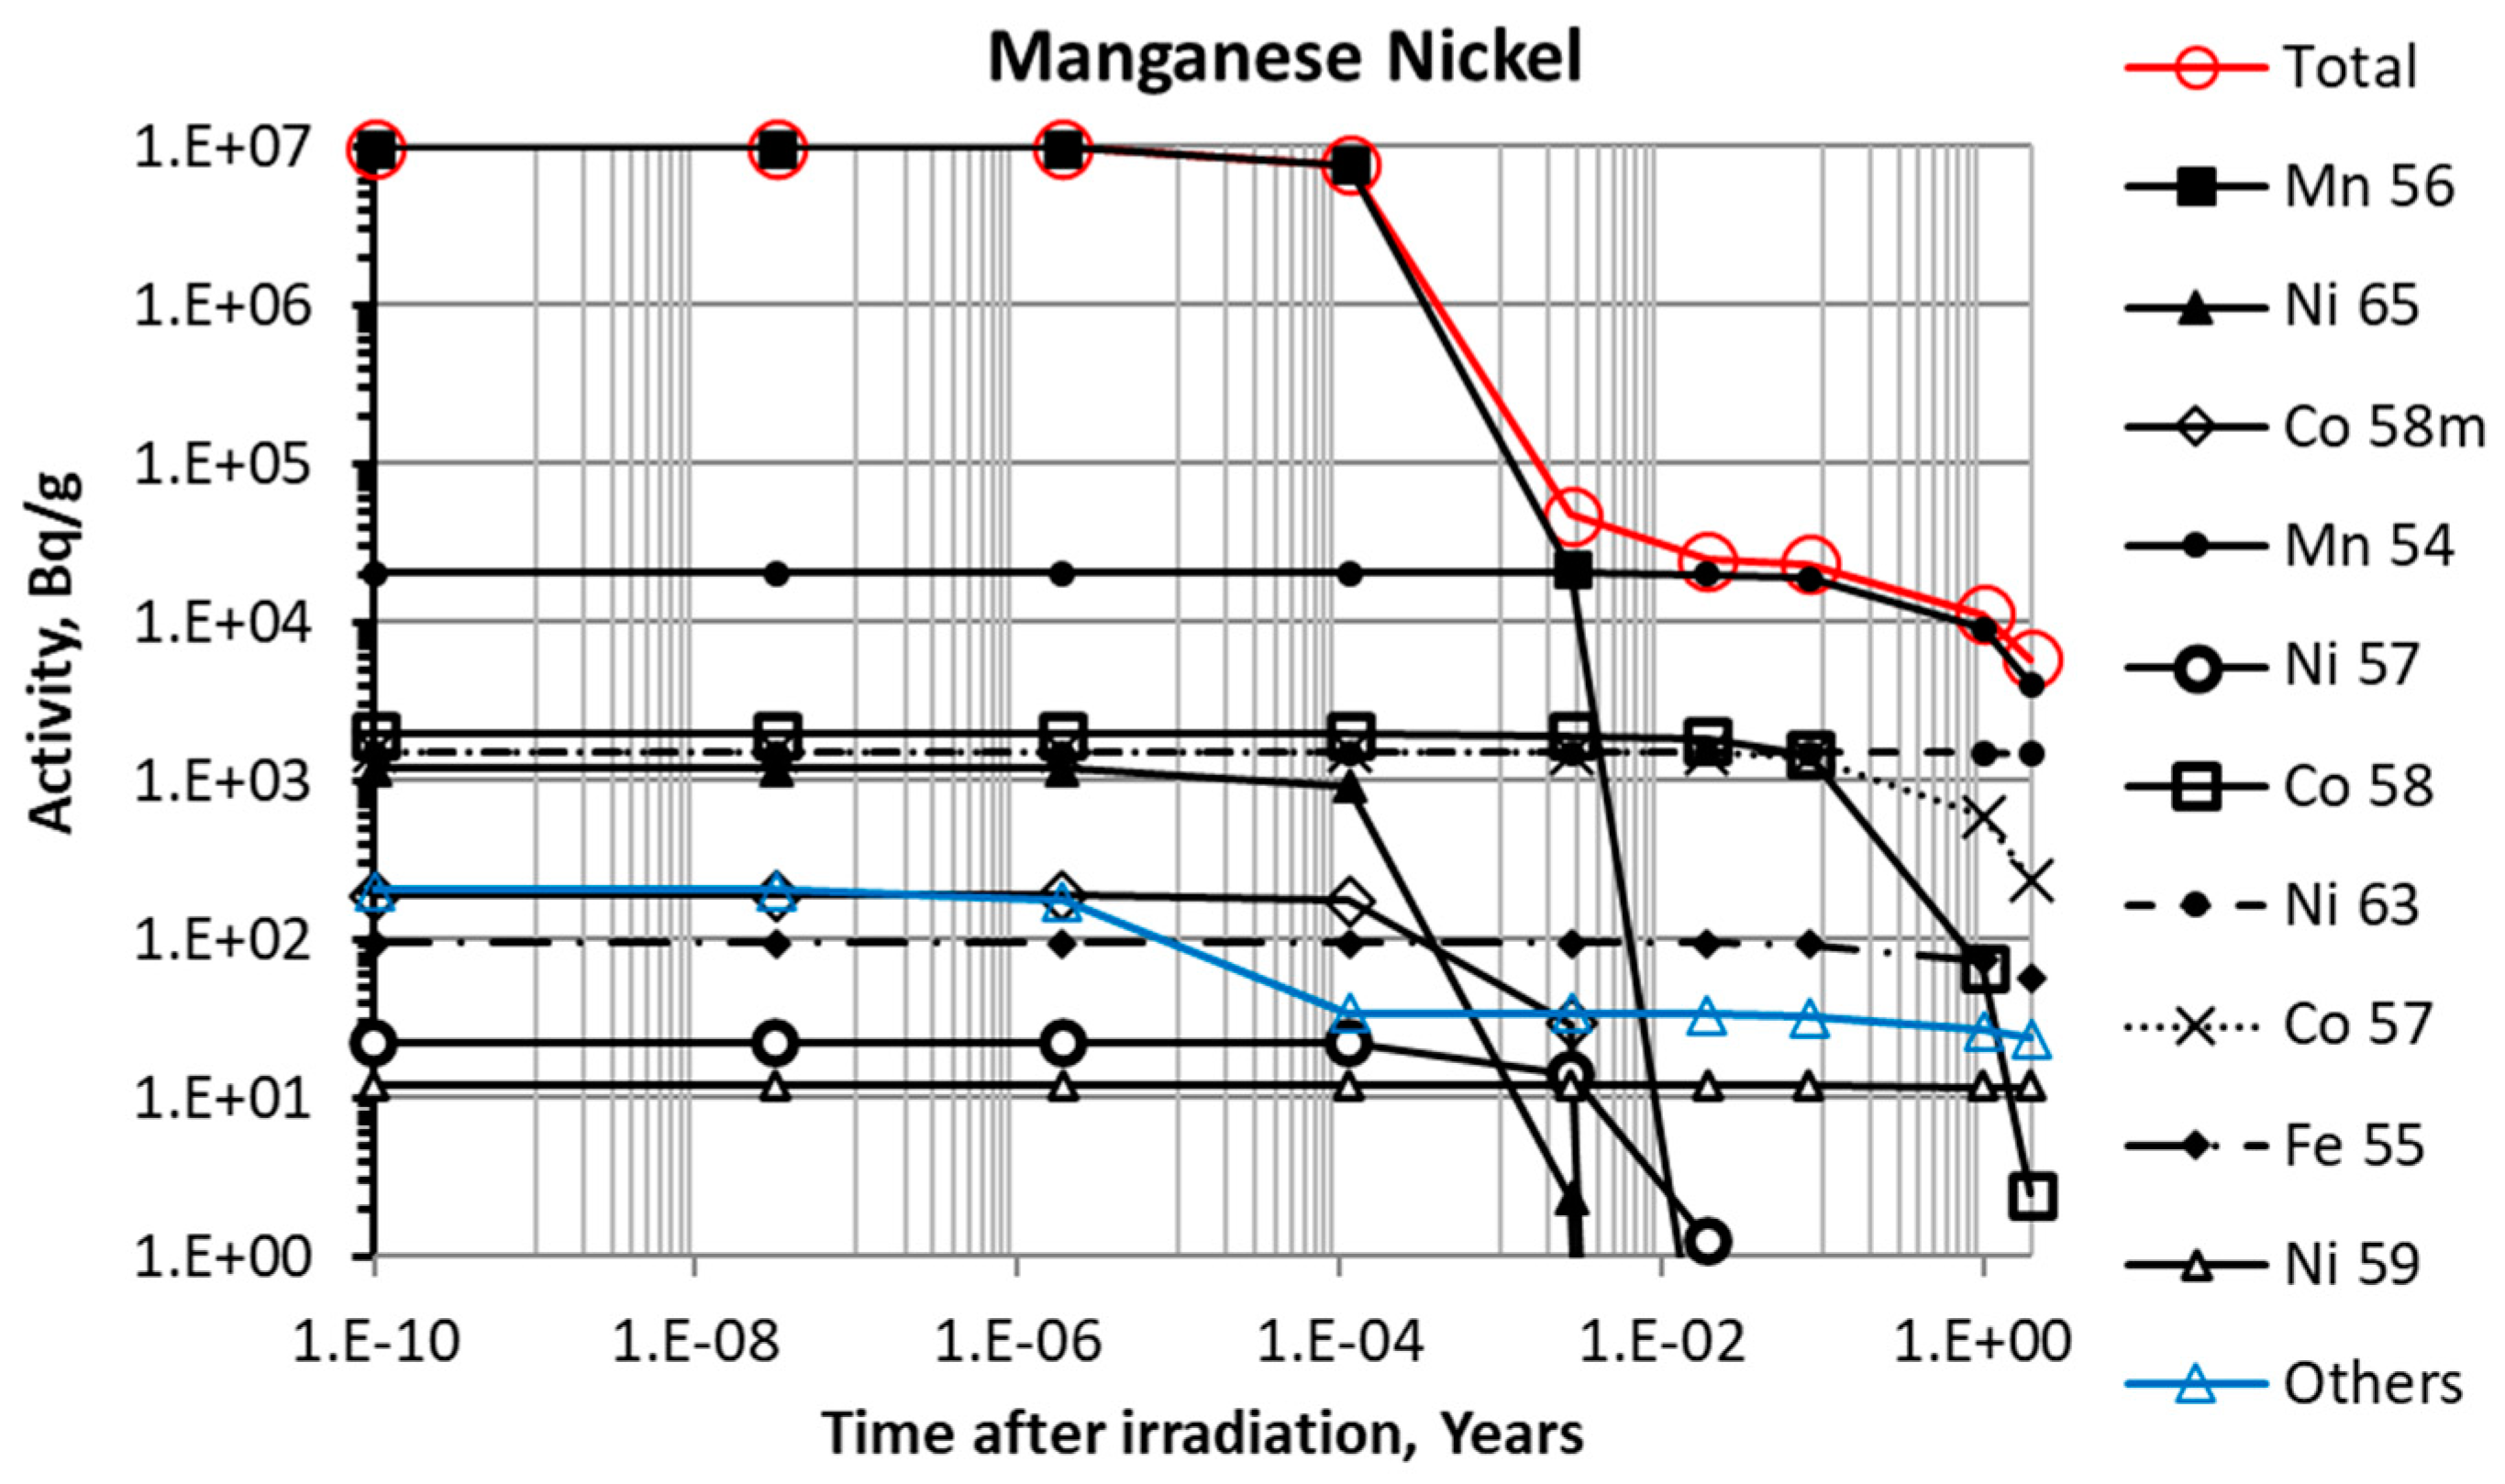
3.3. Manganese/Nickel
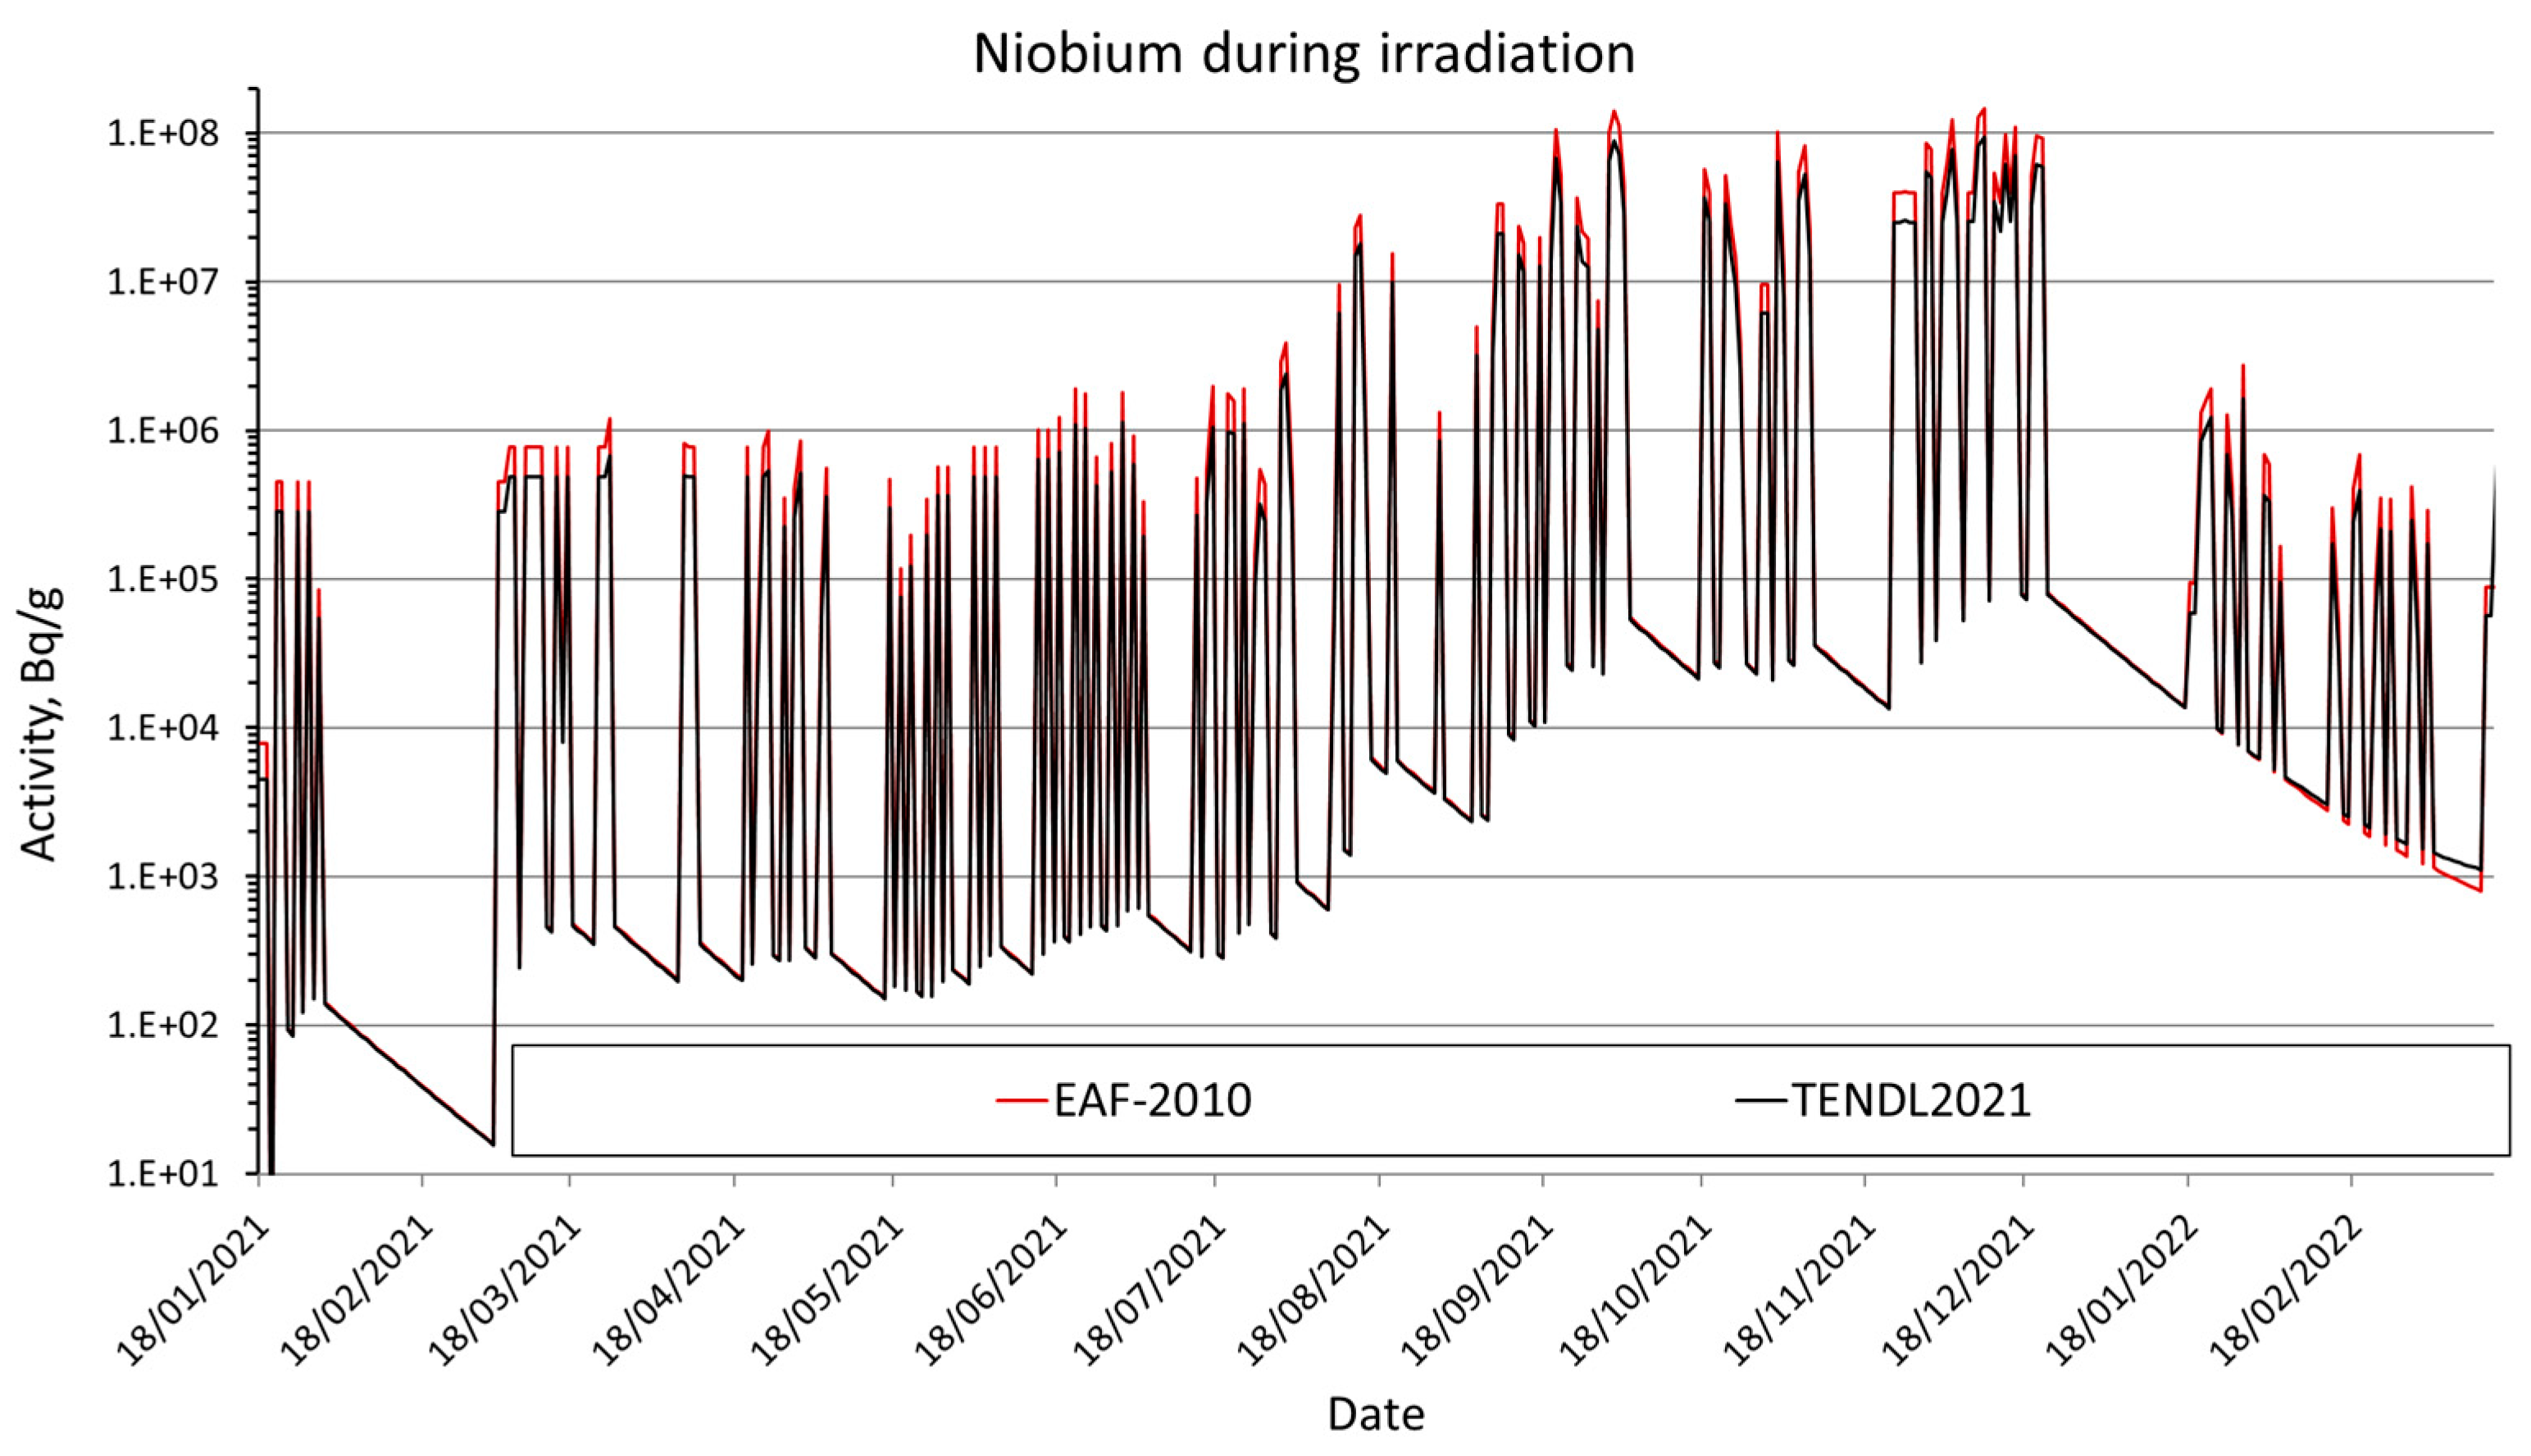
3.4. Niobium
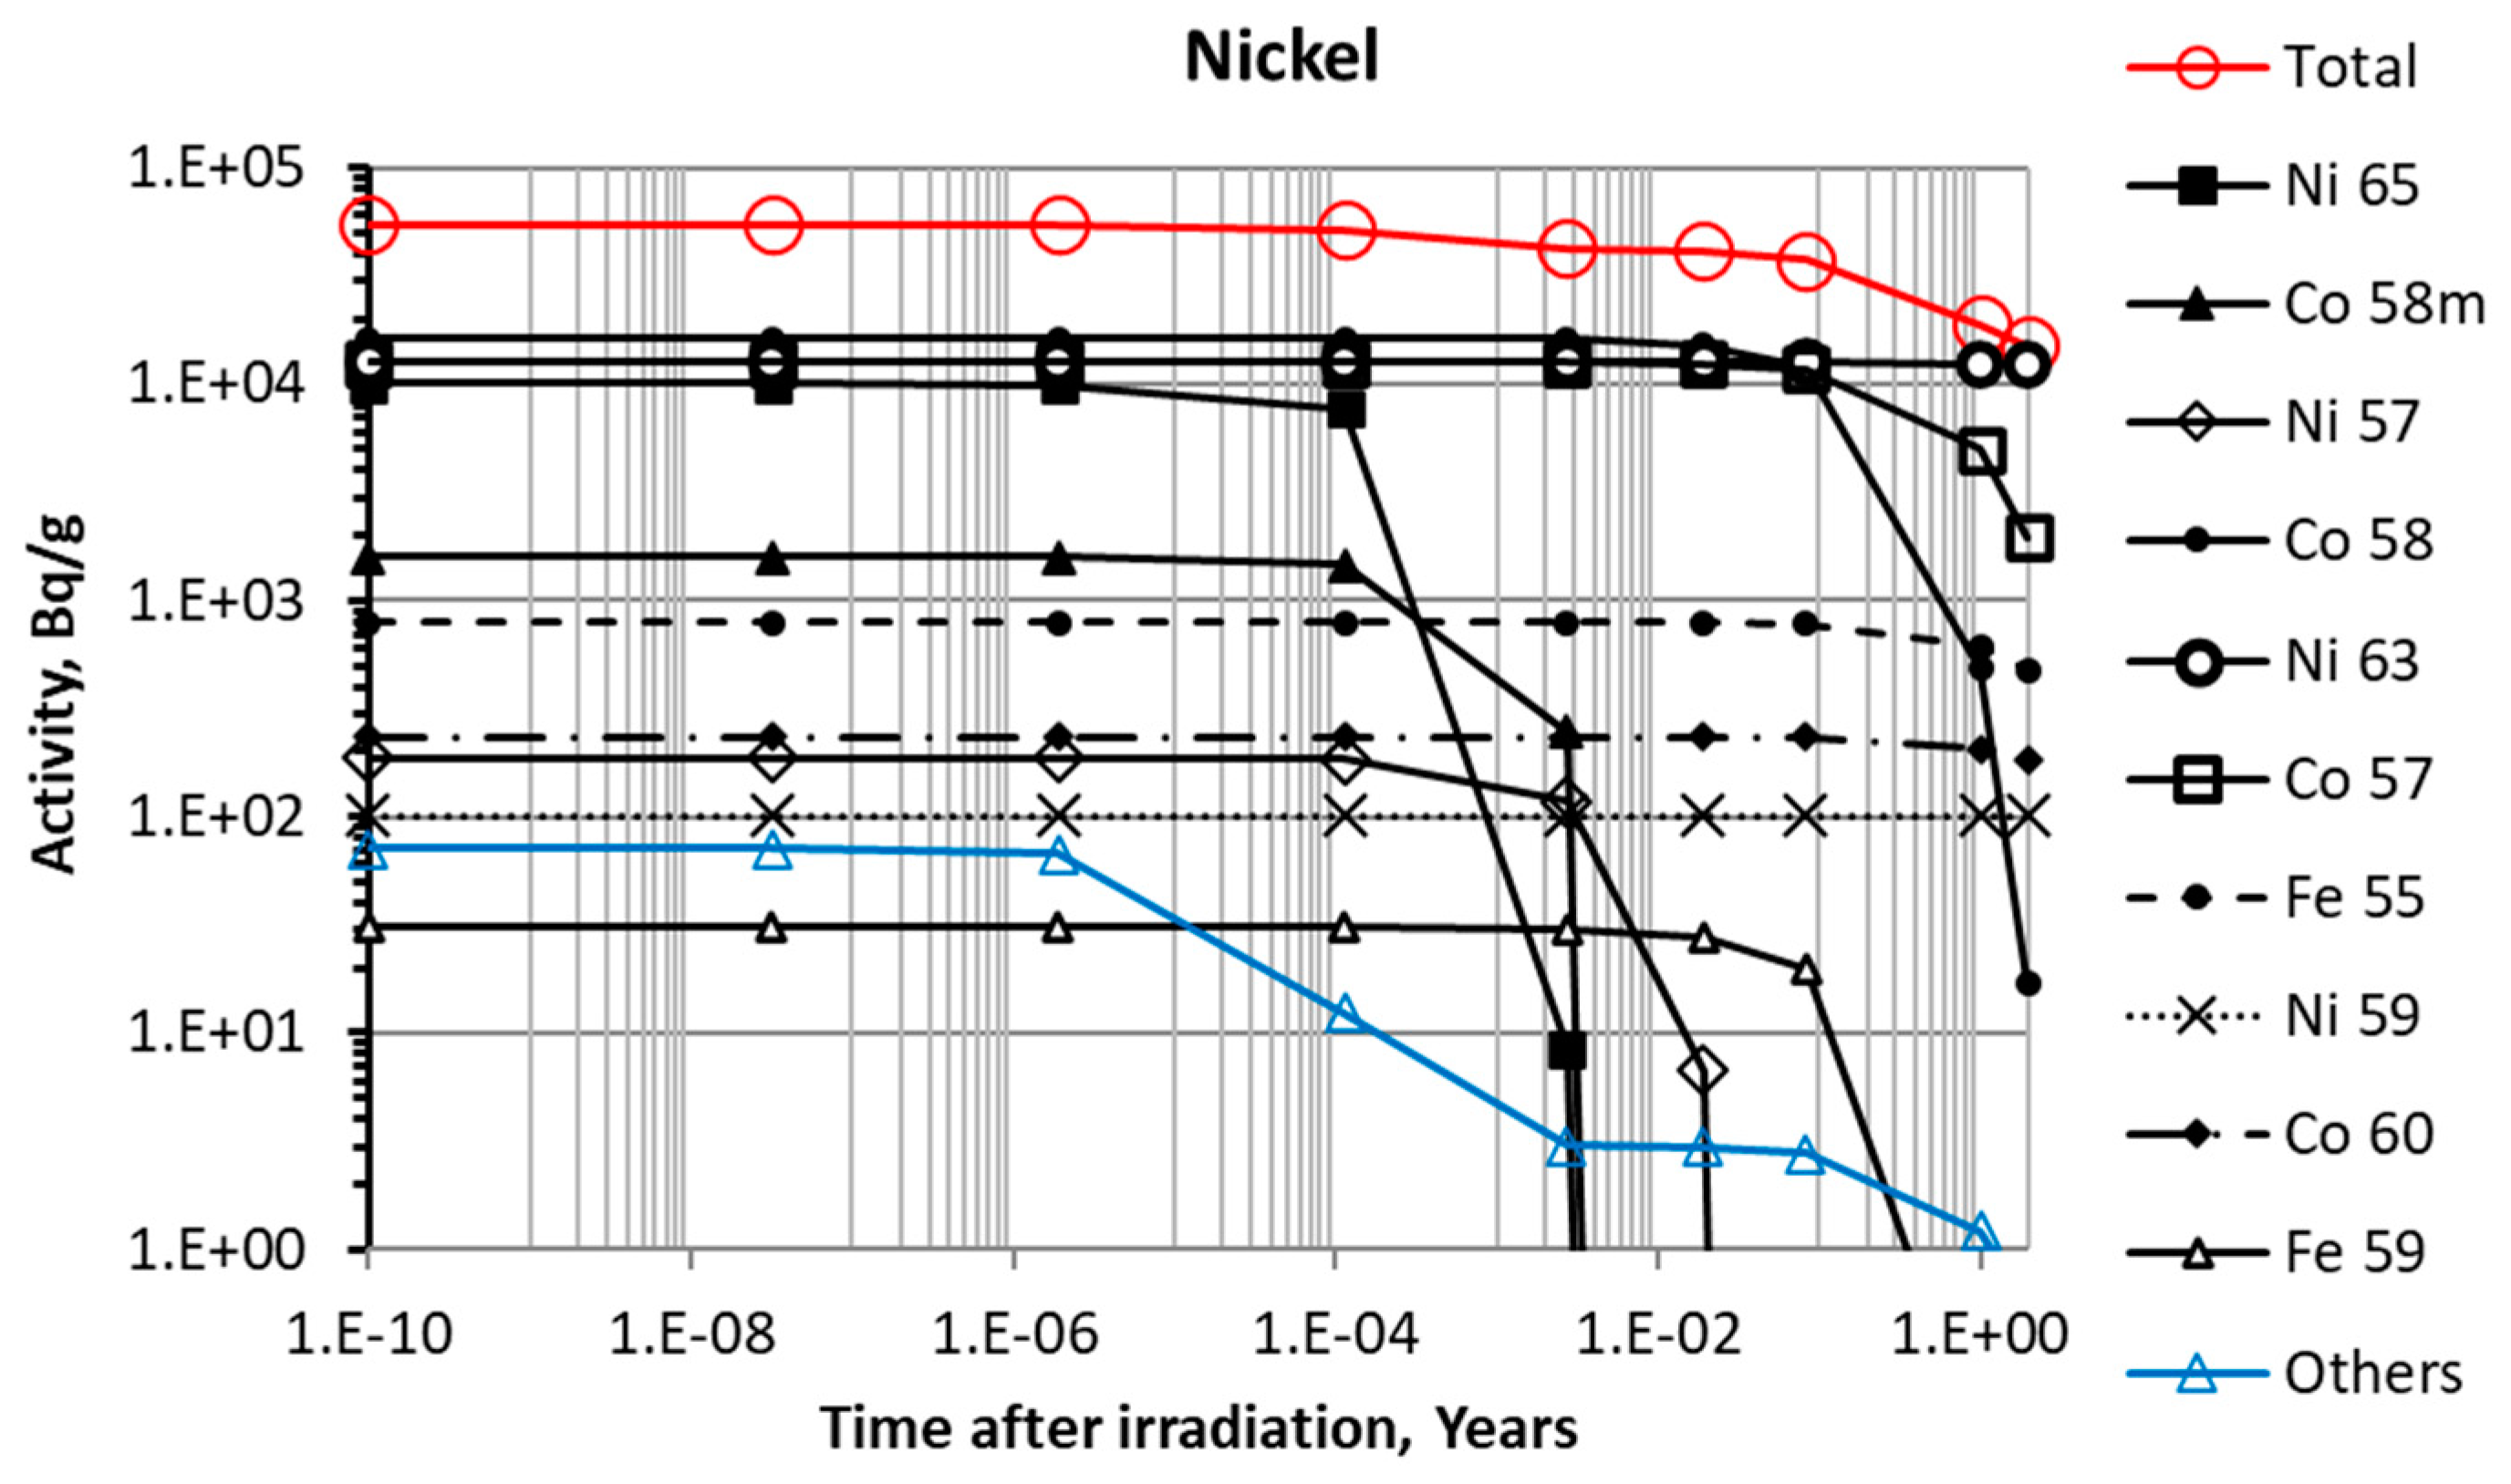
3.5. Nickel
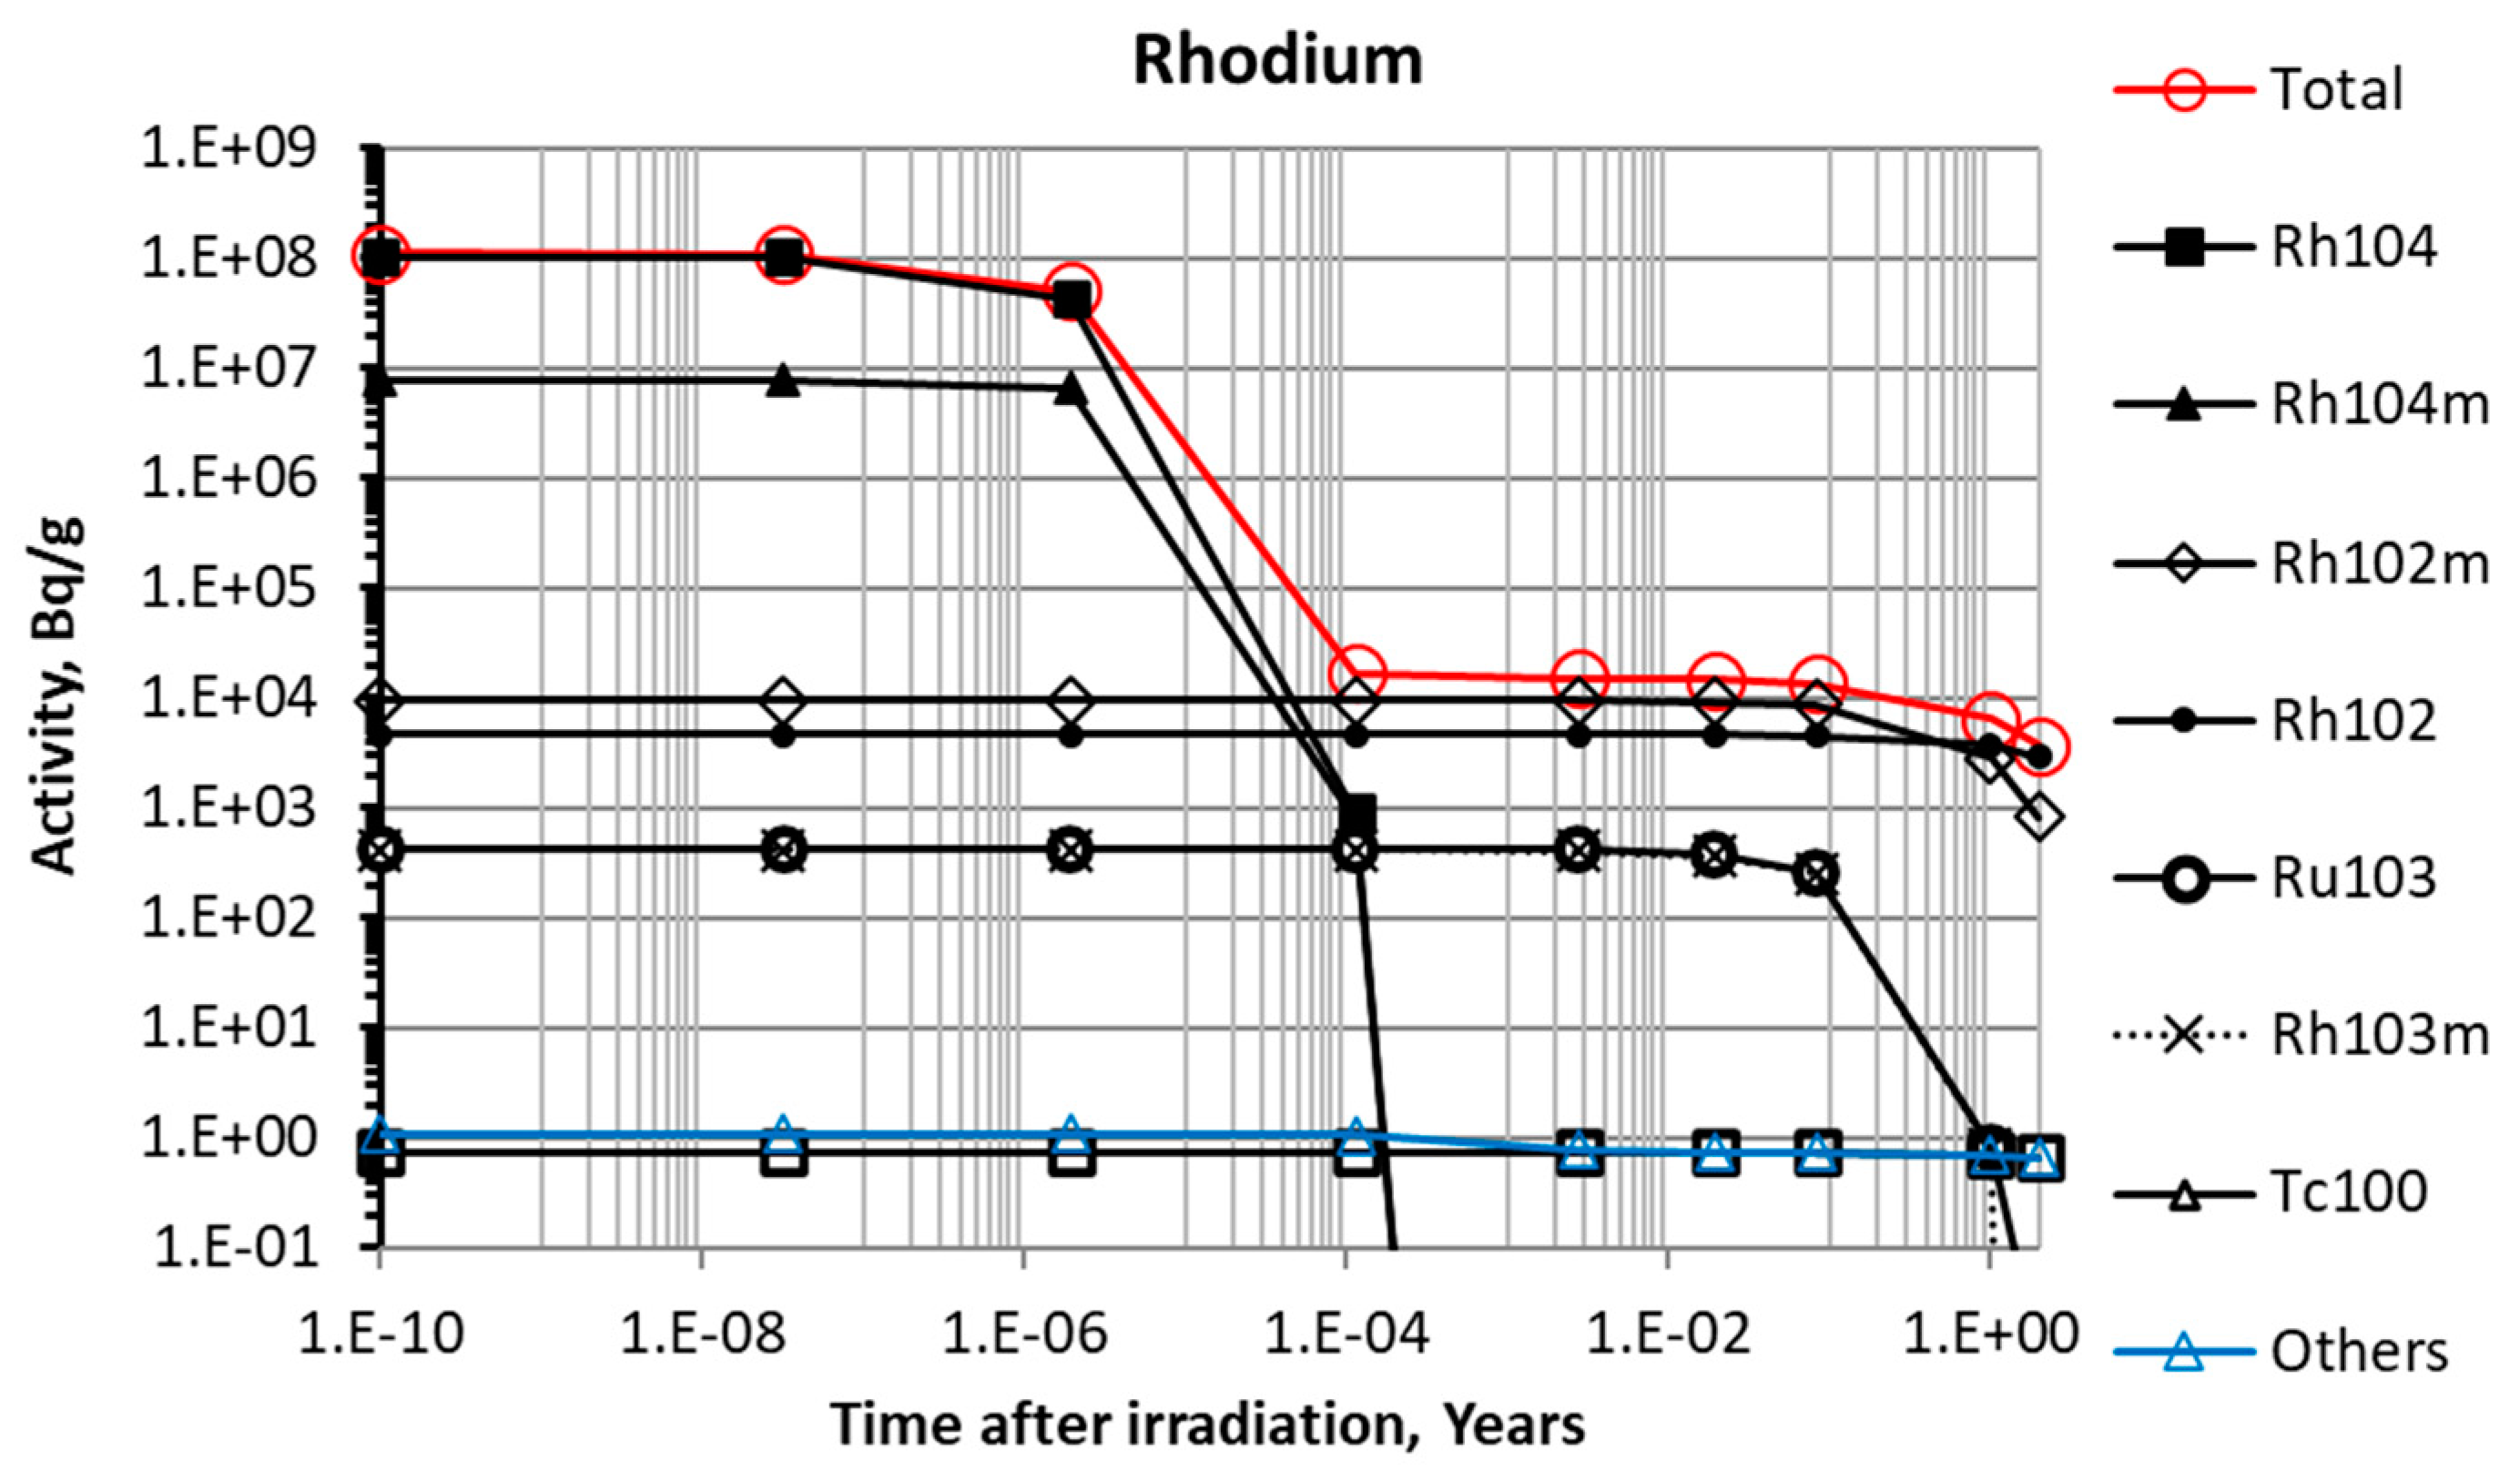
3.6. Rhodium
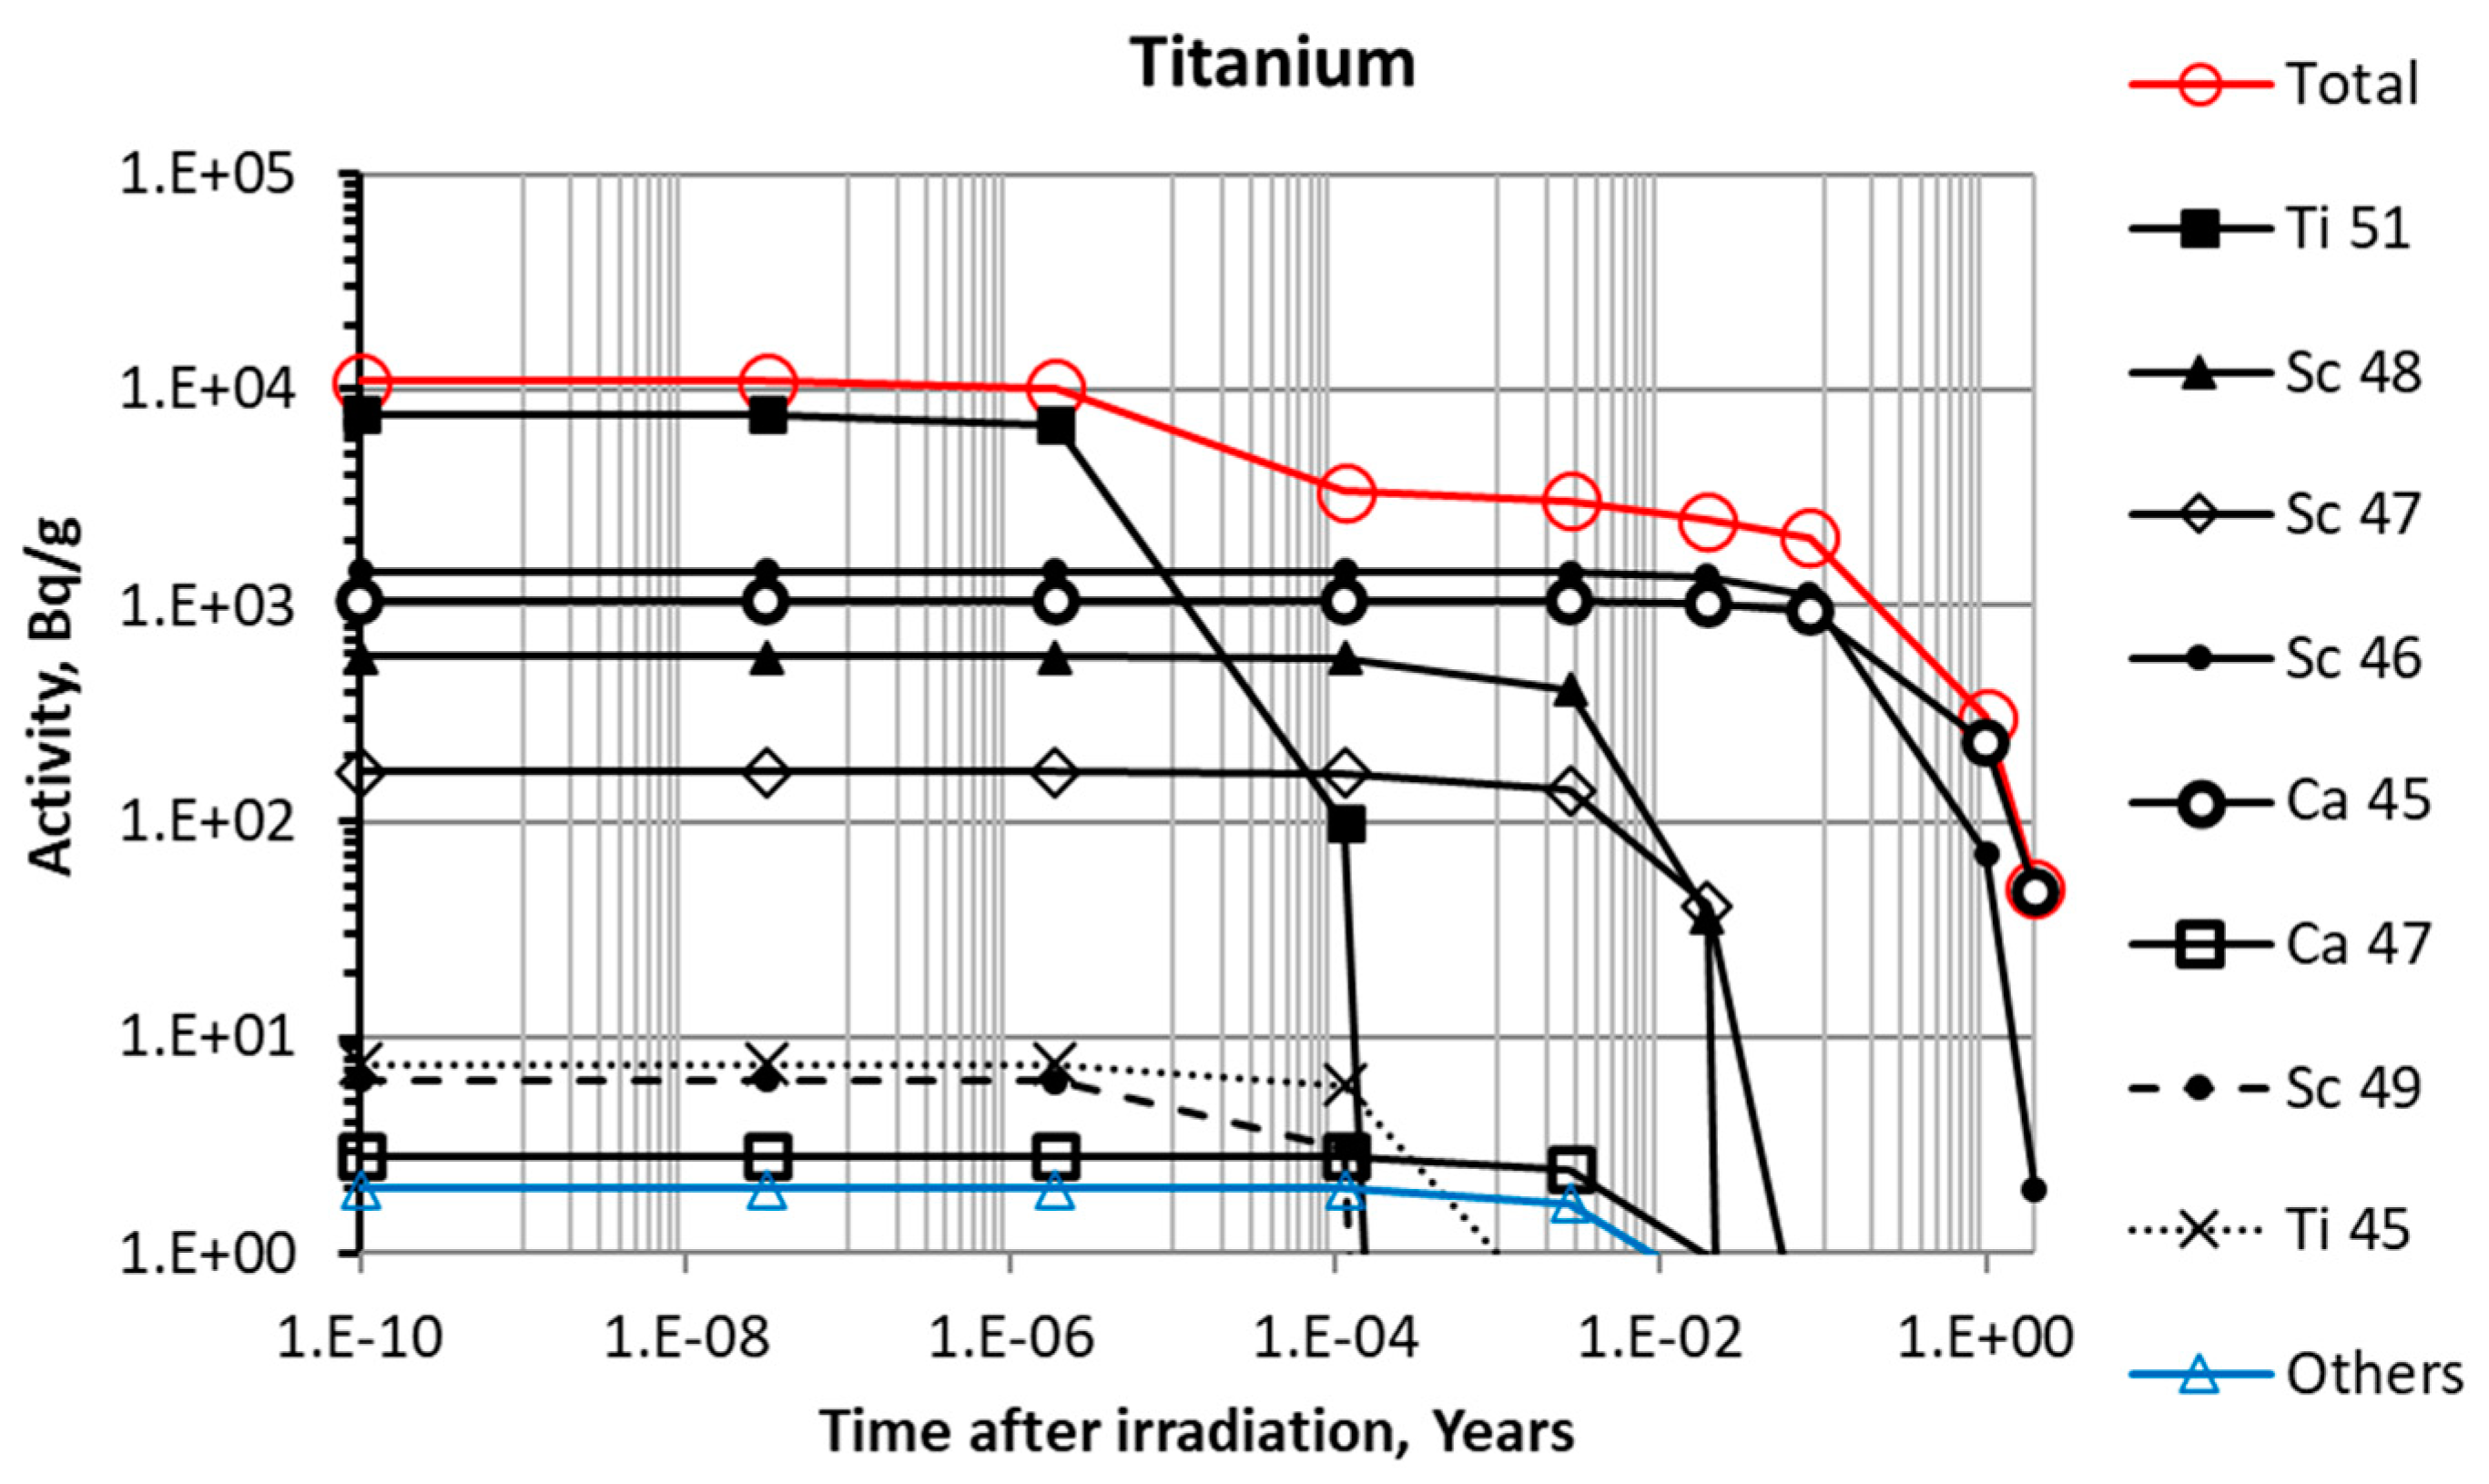
3.7. Titanium
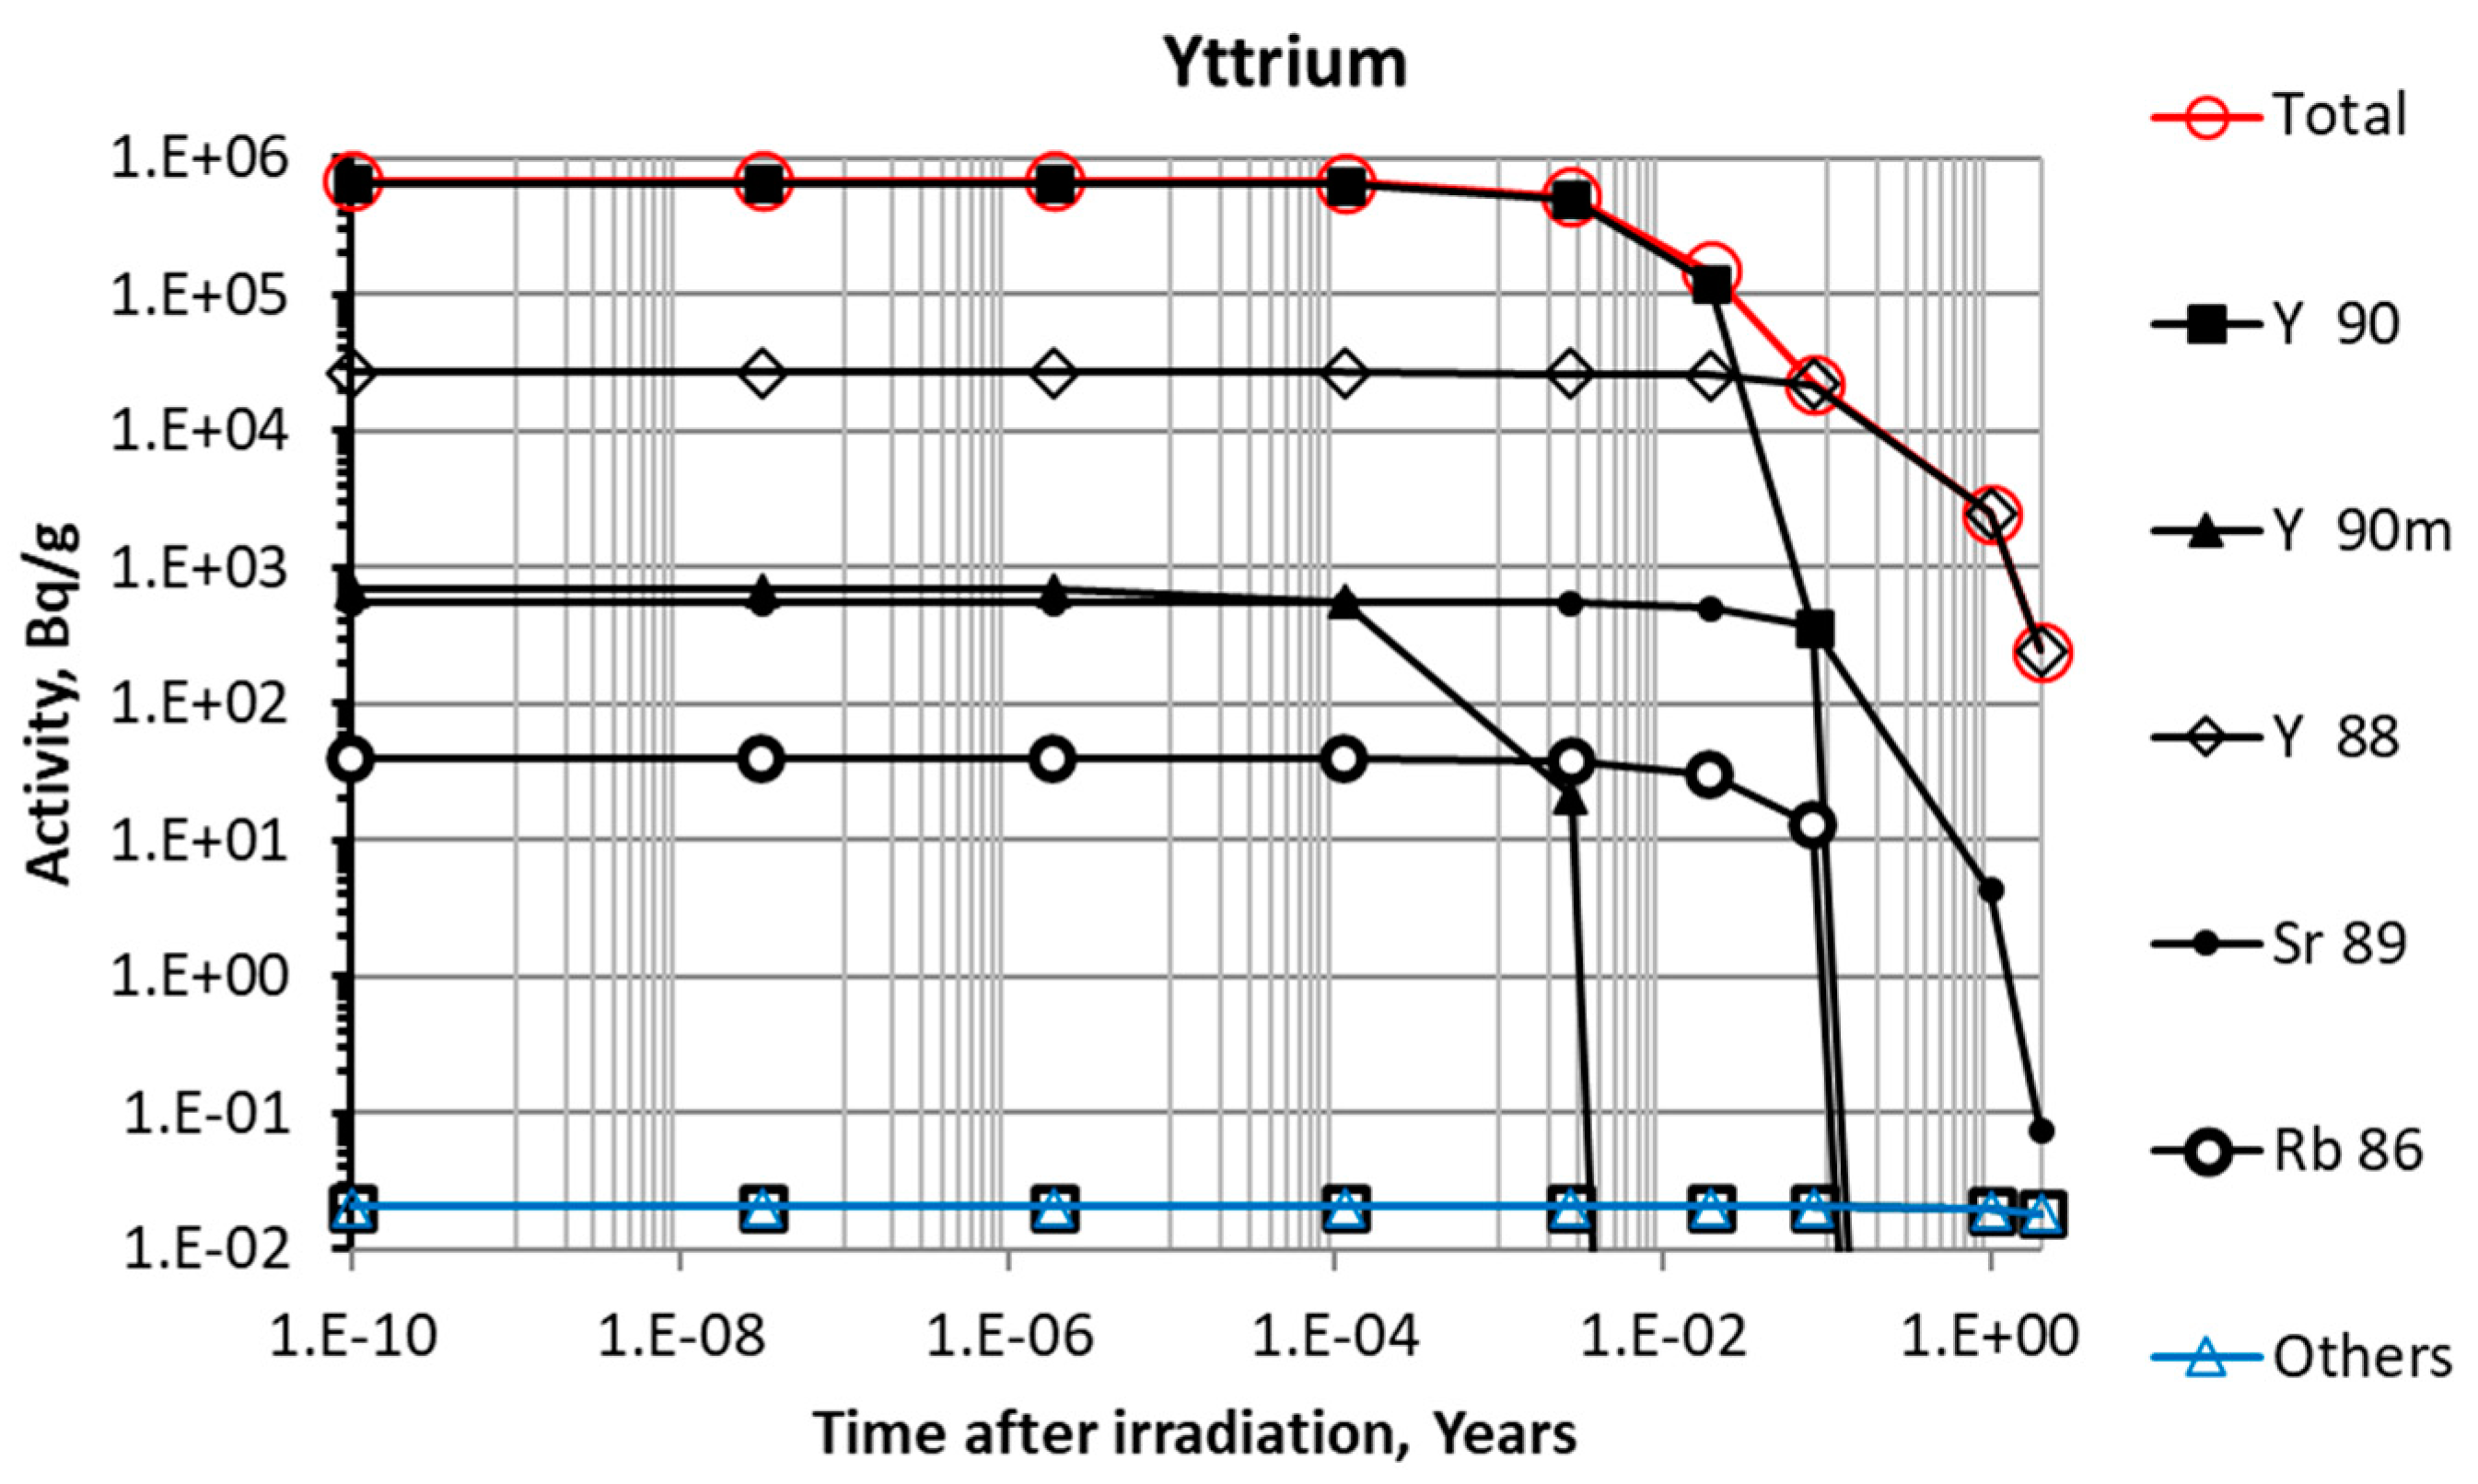
3.8. Yttrium
3.9. Irradiation Sequence Analysis and General Overview of Nuclear Data Comparison
4. Conclusions
- The highest levels of activity after the end of irradiation were observed in the rhodium foil, followed by the gold and silver foils.
- The highest levels of activity after two years of cooling were present in the silver foil, followed by the nickel and manganese and nickel alloy foils.
- The highest dose rates after the end of irradiation were observed in the gold foil, followed by the silver and nickel manganese foils.
- The highest dose rates after two years of cooling were observed in the silver foil, followed by the manganese nickel and rhodium foils.
Author Contributions
Funding
Data Availability Statement
Acknowledgments
Conflicts of Interest
References
- Loughlin, M.; Forrest, R.; Edwards, J. Neutron activation studies on JET. Fusion Eng. Des. 2001, 58–59, 967–971. [Google Scholar] [CrossRef]
- Joffrin, E.; Abduallev, S.; Abhangi, M.; Abreu, P.; Afanasev, V.; Afzal, M.; Aggarwal, K.M.; Ahlgren, T.; Aho-Mantila, L.; Aiba, N.; et al. Overview of the JET preparation for deuterium–tritium operation with the ITER like-wall. Nucl. Fusion 2019, 59, 112021. [Google Scholar] [CrossRef]
- Mailloux, J.; Abid, N.; Abraham, K.; Abreu, P.; Adabonyan, O.; Adrich, P.; Afanasev, V.; Afzal, M.; Ahlgren, T.; Aho-Mantila, L.; et al. Overview of JET results for optimising ITER operation. Nucl. Fusion 2022, 62, 042026. [Google Scholar] [CrossRef]
- Lengar, I.; Žohar, A.; Batistoni, P.; Popovichev, S.; Conroy, S.; JET Contributors. Characterization of JET neutron field in irradiation locations for DD, DT and TT plasmas. Fusion Eng. Des. 2019, 146, 1967–1970. [Google Scholar] [CrossRef]
- Žohar, A.; Lengar, I.; Batistoni, P.; Conroy, S.; Čufar, A.; Kierepko, R.; Kos, B.; Loreti, S.; Mietelski, J.W.; Nobs, C.R.; et al. Long Term Neutron Activation in JET DD Operation. EPJ Web Conf. 2021, 253, 03005. [Google Scholar] [CrossRef]
- Packer, L.W.; Batistoni, P.; Bradnam, S.C.; Colling, B.; Conroy, S.; Ghani, Z.; Gilbert, M.R.; Jednorog, S.; Łaszyńska, E.; Leichtle, D.; et al. Activation of ITER materials in JET: Nuclear characterisation experiments for the long-term irradiation station. Nucl. Fusion 2018, 58, 096013. [Google Scholar] [CrossRef]
- Fonnesu, N.; Loreti, S.; Villari, R.; Raj, P.; Klix, A.; Batistoni, P.; Contributors, J. Dose Rate Measurements during the Tritium Campaign at JET and Diagnostic Improvements for the Deuterium–Tritium Experiments. IEEE Trans. Plasma Sci. 2022, 50, 4131–4137. [Google Scholar] [CrossRef]
- Groth, M.; Solokha, V.; Aleiferis, S.; Brezinsek, S.; Brix, M.; Carvalho, I.S.; Carvalho, P.; Corrigan, G.; Harting, D.; Horsten, N.; et al. Characterisation of divertor detachment onset in JET-ILW hydrogen, deuterium, tritium and deuterium–tritium low-confinement mode plasmas. Nucl. Mater. Energy 2023, 34, 101345. [Google Scholar] [CrossRef]
- Fonnesu, N.; Villari, R.; Loreti, S.; Angelone, M.; Pilotti, R.; Klix, A.; Batistoni, P. The preparation of the Shutdown Dose Rate experiment for the next JET Deuterium-Tritium campaign. Fusion Eng. Des. 2017, 123, 1039–1043. [Google Scholar] [CrossRef]
- Batistoni, P.; Campling, D.; Conroy, S.; Croft, D.; Giegerich, T.; Huddleston, T.; Lefebvre, X.; Lengar, I.; Lilley, S.; Peacock, A.; et al. Technological exploitation of Deuterium–Tritium operations at JET in support of ITER design, operation and safety. Fusion Eng. Des. 2016, 109–111, 278–285. [Google Scholar] [CrossRef]
- Fonnesu, N.; Villari, R.; Flammini, D.; Batistoni, P.; Fischer, U.; Pereslavtsev, P. Shutdown dose rate studies for the DTE2 campaign at JET. Fusion Eng. Des. 2020, 161, 112009. [Google Scholar] [CrossRef]
- Sublet, J.-C.; Eastwood, J.W.; Morgan, J.G. The FISPACT-II User Manual; Technol. Rep.; CCFE: Abingdon, UK, 2013. [Google Scholar]
- Sublet, J.-C. The European Activation File: EAF-2010 Neutron-Induced Cross Section Library; Euratom/CCFE Fusion Association: Abingdon, UK, 2010. [Google Scholar]
- Koning, A.J.; Rochman, D.; Sublet, J.-C.; Dzysiuk, N.; Fleming, M.; van der Marck, S. TENDL: Complete Nuclear Data Library for Innovative Nuclear Science and Technology. Nucl. Data Sheets 2019, 155, 1–55. [Google Scholar] [CrossRef]
- NEA. JEF-1 Nuclear Data Library, Volume I, General Purpose File; JEF Report 1; OECD Publishing: Paris, France, 1985. [Google Scholar]
- NEA. The JEFF-3.1.1 Nuclear Data Library; OECD Publishing: Paris, France, 2009. [Google Scholar]
- Sartori, E. Standard Energy Group Structures of Cross Section Libraries for Reactor Shielding, Reactor Cell and Fusion Neutronics Applications: VITAMIN-J, ECCO-33, ECCO-2000 and XMAS, OECD/NEA Data Bank. 1990. Available online: https://www.oecd-nea.org/tools/abstract/detail/nea-1344/ (accessed on 17 March 2024).
- Thomas, F.; Fleming, M. Optimised energy group structures for fusion activation calculations. Fusion Eng. Des. 2018, 136, 1479–1483. [Google Scholar] [CrossRef]
- Sublet, J.-C.; Eastwood, J.W.; Morgan, J.G.; Gilbert, M.R.; Fleming, M.; Arte, W. FISPACT-II: An Advanced Simulation System for Activation, Transmutation and Material Modelling. Nucl. Data Sheets 2017, 139, 77–137. [Google Scholar] [CrossRef]
- Stamatelatos, I.E.; Savva, M.I.; Vasilopoulou, T.; Triantou, K.; Mergia, K.; Messoloras, S.; Packer, L.W.; Nobs, C.R.; Ghani, Z.; Batistoni, P.; et al. Novel Neutron Activation Detector for Fusion; Modern Neutron Detection, IAEA TECDOC Series; International Atomic Energy Agency: Vienna, Austria, 2020; pp. 301–312. ISSN 1011–4289. [Google Scholar]
- Werner, C.J.; Bull, J.S.; Solomon, C.J.; Brown, F.B.; McKinney, G.W.; Rising, M.E.; Dixon, D.A.; Martz, R.L.; Hughes, H.G.; Cox, L.J.; et al. MCNP6.2 Release Notes; LA-UR-18-20808; Los Alamos National Laboratory (LANL): Los Alamos, NM, USA, 2018.
- Snoj, L.; Syme, B.; Popovichev, S.; Lengar, I.; Conroy, S. Calculations to support JET neutron yield calibration: Contributions to the external neutron monitor responses. Nuc. Eng. Des. 2012, 246, 191–197. [Google Scholar] [CrossRef]
- Sawan, M.E. Summary Report from the Third RCM on Nuclear Data Libraries for Advanced Systems—Fusion Devices (FENDL 3); INDC(NDS)-602; IAEA Nuclear Data Section: Vienna, Austria, 2011. [Google Scholar]
- Rigaud, F.; Irigaray, J.L.; Petit, G.Y.; Longo, G.; Saporetti, F. Gamma-ray spectra following the capture of 14 MeV neutrons by 59Co, 93Nb and 103Rh. Nucl. Phys. A 1971, 173, 551–560. [Google Scholar] [CrossRef]
- Poenitz, W.P. Fast Neutron Capture and Activation Cross Sections of Niobium Isotopes; ANL/NDM-8; Argonne National Laboratory: Lemont, IL, USA, 1974.


| Material | 0 s, Bq/g | 0 s, Bq/g | 1 Month, Bq/g | 1 Month, Bq/g | 1 Year, Bq/g | 1 Year, Bq/g |
|---|---|---|---|---|---|---|
| Silver | 6.08 × 10⁷ | 6.18 × 10⁷ | 7.72 × 10⁶ | 7.86 × 10⁶ | 3.31 × 10⁶ | 3.36 × 10⁶ |
| Gold | 6.53 × 10⁷ | 6.11 × 10⁷ | 3.38 × 10⁴ | 3.17 × 10⁴ | 4.47 × 10⁻¹ | 3.09 × 10⁻¹ |
| Manganese/Nickel | 9.90 × 10⁶ | 1.06 × 10⁷ | 2.35 × 10⁴ | 2.23 × 10⁴ | 1.13 × 10⁴ | 1.08 × 10⁴ |
| Niobium | 1.10 × 10⁶ | 6.25 × 10⁵ | 5.66 × 10² | 8.82 × 10² | 4.10 × 10² | 7.16 × 10² |
| Nickel | 5.45 × 10⁴ | 5.47 × 10⁴ | 3.76 × 10⁴ | 3.82 × 10⁴ | 1.89 × 10⁴ | 1.98 × 10⁴ |
| Rhodium | 1.13 × 10⁸ | 1.08 × 10⁸ | 1.38 × 10⁴ | 1.48 × 10⁴ | 6.60 × 10³ | 6.50 × 10³ |
| Titanium | 1.10 × 10⁴ | 1.09 × 10⁴ | 2.06 × 10³ | 2.01 × 10³ | 3.04 × 10² | 2.90 × 10² |
| Yttrium | 6.77 × 10⁵ | 6.58 × 10⁵ | 2.26 × 10⁴ | 2.20 × 10⁴ | 2.51 × 10³ | 2.41 × 10³ |
| Data Library | EAF-2010 | TENDL-2021 | EAF-2010 | TENDL-2021 | EAF-2010 | TENDL-2021 |
| Material | 0 s, Sv/h | 0 s, Sv/h | 1 Month, Sv/h | 1 Month, Sv/h | 1 Year, Sv/h | 1 Year, Sv/h |
|---|---|---|---|---|---|---|
| Silver | 3.52 × 10⁻⁸ | 3.58 × 10⁻⁸ | 3.02 × 10⁻⁸ | 3.08 × 10⁻⁸ | 1.30 × 10⁻⁸ | 1.32 × 10⁻⁸ |
| Gold | 4.36 × 10⁻⁸ | 7.13 × 10⁻⁹ | 2.27 × 10⁻¹¹ | 3.70 × 10⁻¹² | 1.17 × 10⁻¹⁵ | 8.01 × 10⁻¹⁶ |
| Manganese/Nickel | 2.25 × 10⁻⁸ | 2.39 × 10⁻⁸ | 4.13 × 10⁻¹¹ | 3.89 × 10⁻¹¹ | 1.83 × 10⁻¹¹ | 1.72 × 10⁻¹¹ |
| Niobium | 6.23 × 10⁻¹ | 3.57 × 10⁻¹ | 1.27 × 10⁻¹² | 1.20 × 10⁻¹² | 9.44 × 10⁻¹³ | 8.81 × 10⁻¹³ |
| Nickel | 7.14 × 10⁻¹¹ | 7.05 × 10⁻¹¹ | 5.12 × 10⁻¹¹ | 5.10 × 10⁻¹¹ | 1.21 × 10⁻¹¹ | 1.26 × 10⁻¹¹ |
| Rhodium | 4.34 × 10⁻⁹ | 3.97 × 10⁻⁹ | 2.87 × 10⁻¹¹ | 2.76 × 10⁻¹¹ | 1.80 × 10⁻¹¹ | 1.61 × 10⁻¹¹ |
| Titanium | 1.09 × 10⁻¹¹ | 1.10 × 10⁻¹¹ | 3.21 × 10⁻¹² | 3.25 × 10⁻¹² | 2.03 × 10⁻¹³ | 2.09 × 10⁻¹³ |
| Yttrium | 1.09 × 10⁻¹ | 1.12 × 10⁻¹ | 8.95 × 10⁻¹¹ | 8.76 × 10⁻¹¹ | 1.02 × 10⁻¹¹ | 9.85 × 10⁻¹² |
| Data Library | EAF-2010 | TENDL-2021 | EAF-2010 | TENDL-2021 | EAF-2010 | TENDL-2021 |
Disclaimer/Publisher’s Note: The statements, opinions and data contained in all publications are solely those of the individual author(s) and contributor(s) and not of MDPI and/or the editor(s). MDPI and/or the editor(s) disclaim responsibility for any injury to people or property resulting from any ideas, methods, instructions or products referred to in the content. |
© 2024 by the authors. Licensee MDPI, Basel, Switzerland. This article is an open access article distributed under the terms and conditions of the Creative Commons Attribution (CC BY) license (https://creativecommons.org/licenses/by/4.0/).
Share and Cite
Tidikas, A.; Stankūnas, G.; Breidokaitė, S. Activity and Dose Rate Calculations for Joint European Torus Outer Long-Term Irradiation Station during Tritium and Second Deuterium Tritium Experiment Campaigns. Appl. Sci. 2024, 14, 2674. https://doi.org/10.3390/app14072674
Tidikas A, Stankūnas G, Breidokaitė S. Activity and Dose Rate Calculations for Joint European Torus Outer Long-Term Irradiation Station during Tritium and Second Deuterium Tritium Experiment Campaigns. Applied Sciences. 2024; 14(7):2674. https://doi.org/10.3390/app14072674
Chicago/Turabian StyleTidikas, Andrius, Gediminas Stankūnas, and Simona Breidokaitė. 2024. "Activity and Dose Rate Calculations for Joint European Torus Outer Long-Term Irradiation Station during Tritium and Second Deuterium Tritium Experiment Campaigns" Applied Sciences 14, no. 7: 2674. https://doi.org/10.3390/app14072674
APA StyleTidikas, A., Stankūnas, G., & Breidokaitė, S. (2024). Activity and Dose Rate Calculations for Joint European Torus Outer Long-Term Irradiation Station during Tritium and Second Deuterium Tritium Experiment Campaigns. Applied Sciences, 14(7), 2674. https://doi.org/10.3390/app14072674