Article

Investigation of Hydrogen-Blended Natural Gas Pipelines in Utility Tunnel Leakage and Development of an Accident Ventilation Strategy for the Worst Leakage Conditions

1
School of Petroleum Engineering, Northeast Petroleum University, Daqing 163318, China
2
Gas Technology Institute of Petrochina Kunlun Gas Co., Ltd., Harbin 150001, China
3
Postdoctoral Programme of Daqing Oilfield, Daqing 163318, China
4
Key Laboratory of Continental Shale Hydrocarbon Accumulation and Efficient Development, Northeast Petroleum University, Daqing 163318, China
*
Authors to whom correspondence should be addressed.
Appl. Sci. 2024, 14(6), 2667; https://doi.org/10.3390/app14062667
Submission received: 13 February 2024 / Revised: 4 March 2024 / Accepted: 6 March 2024 / Published: 21 March 2024
(This article belongs to the Section Energy Science and Technology)

Abstract

:
The development of hydrogen-blended natural gas (HBNG) increases the risk of gas transportation and presents challenges for pipeline security in utility tunnels. The objective of this study is to investigate the diffusion properties of HBNG in utility tunnels and evaluate the effectiveness of various ventilation mechanisms. The numerical simulation software Fluent 2023 R1 is applied to simulate and analyze the leakage of small holes in a HBNG pipeline in the natural gas compartment. By examining the leaking behavior of HBNG through small holes in different circumstances, we aimed to identify the most unfavorable operational situation for leakage. Subsequently, we analyzed the ventilation strategy for sub-high-pressure pipes at various pressure levels in this unfavorable condition. This study’s findings demonstrate that blending hydrogen improves the gas diffusion capacity and increases the likelihood of explosion. The primary factors that influence the pattern of leakage are the size of the leaking holes and the pressure of the pipeline. The gas compartment experiences the most unfavorable working conditions for natural gas pipeline leaks when there are higher pressures, wider leak openings, higher hydrogen blending ratios (HBRs), and leaks in close proximity to an air inlet. When the HBR is 20%, the minimum accident ventilation rates for pressures of 0.4 MPa and 0.8 MPa are 15 air changes per hour and 21 air changes per hour, respectively. The maximum allowable wind speed for accident ventilation is 5 m/s, as regulated by China’s national standard, GB 50838-2015. This regulation makes it difficult to minimize the risk of leakage in a 1.6 MPa gas pipeline. It is recommended to install a safety interlock device to quickly shut off the pipeline in the event of a leak in order to facilitate the dispersion of the substance.

1. Introduction

Global energy diversification, sustainability, and carbon reduction have been trending in recent years [1,2]. As it is carbon-neutral, hydrogen energy is widespread [3,4]. However, hydrogen use widely poses many risks, including combustion, explosion, and corrosion of pipelines. To enhance transport efficiency and minimize leakage in the utilization of hydrogen energy, it is customary to transmit a blend of hydrogen and natural gas [5,6].
Research on hydrogen-blended natural gas (HBNG) transport has been conducted to varying extents in different nations [7]. As early as 2004, the EU launched a demonstration project called NaturalHy, which aimed to identify and address the problem of hydrogen blending into the natural gas network [8]. In 2008, the Sustainable Ameland project was initiated by the Netherlands in Ameland, Netherlands, to investigate the effects of hydrogen-enriched natural gas on pipelines [9]. In 2013, NREL published “Blending Hydrogen into Natural Gas Pipeline Networks: A Review of Key Issues.” This comprehensive synthesis study covers US natural gas hydrogen doping technology research. Other significant international scientific findings are also considered [10]. In 2016, the H21 project launched in the UK aimed to assess the technological and economic feasibility of transitioning from natural gas to a 100% hydrogen supply [11]. In 2019, China established its first hydrogen doping pilot project in Chaoyang, Liaoning Province, to validate the core technologies of the HBNG “production, storage, and transportation–doping–comprehensive utilization” industrial chain [12]. In 2024, a comprehensive scientific and technological experimental platform was developed in Shenzhen for the hydrogen doping of town gas. This development represents a significant milestone in China’s deployment of HBNG [13].
China’s national standard [14,15] allows gas pipelines to be included in utility tunnels. Nevertheless, if accidents occur in gas pipelines within natural gas compartments, there may be a high risk of explosion due to the flammability and explosiveness of natural gas, which can affect other compartments. Numerical modeling techniques are commonly used to study natural gas leakage patterns and explosion hazards in utility tunnels. Wang analyzed the dispersion pattern of leaked natural gas under various ventilation conditions and its correlation with the effectiveness of ventilation dilution [16]. Bu used numerical simulation to analyze the different factors affecting methane leakage in utility tunnels and established a prediction equation for the methane intrusion distance under natural ventilation conditions, which provides a reference for the installation distance of methane leakage alarm devices [17]. Bai optimized the layout of sensors in the utility tunnels based on their ability to recover from human casualties and economic losses [18]. Zhao created an experimental setup to model natural gas explosions in utility tunnels, studied the effects of gas chamber length and pressure relief conditions on flame behavior, and examined several parameters related to natural gas explosion severity [19].
The addition of hydrogen to natural gas decreases the density of natural gas, resulting in a decreased minimum ignition energy and a significantly expanded explosion limit in comparison to utilizing it alone. These modifications impact the flow and dispersion of gas within the pipeline, affecting the ability to detect flammable gases after a leak and assess the consequences of an incident. Furthermore, upon entering the utility tunnel, the failure modes of natural gas pipelines primarily consist of small hole failures resulting from manufacturing defects, assembly defects, and corrosion. Therefore, it is of great significance to study the leakage law of natural gas small holes under hydrogen doping conditions to ensure the safe operation of pipelines. Li conducted a study on the leakage of HBNG from small holes in a domestic house, simulated the distribution of gas leakage under different ventilation scenarios with doors and windows open and closed, and analyzed the reasons for the change in the volume of the harmful gas cloud [20]. Zhang developed a mathematical model of HBNG delivery, examined the hydraulic and thermal effects of hydrogen blending on natural gas pipelines and pipeline networks, and discussed how hydrogen blending ratios (HBR) affects centrifugal compressor performance and combined pipeline and compressor operating points [21].
While there has been some research on HBNG leakage by academics in various nations, few studies focus specifically on the leakage of hydrogen-doped gas from tiny holes in the gas compartments of urban pipeline utility tunnels under the most unfavorable working conditions. This work utilizes the numerical simulation software Fluent 2023 R1 to investigate the leaking characteristics of sub-high-pressure HBNG pipelines in natural gas compartments of utility tunnels. The leakage pattern of HBNG in a natural gas compartment under different working conditions was examined in great detail. This helps us identify the worst leakage conditions in pipelines, with a greater risk of explosion in gas compartments. We also looked into how to keep the natural gas compartment as safe as possible while transporting HBNG in a sub high-pressure pipeline while the worst conditions were in place.

2. Physical and Mathematical Model

2.1. Physical Model

In accordance with the regulations specified in [14], natural gas compartments are required to be equipped with non-combustible walls at intervals of 200 m in order to establish fire protection zones. Moreover, it is crucial to integrate fire-blocking techniques, such as employing fire-stopping packs, at points where pipes intersect with the fire protection zones to ensure a reliable seal.
This study focuses on the changing law of HBNG concentration in the longitudinal dimension, so a fire protection zone was selected as the object of study, and a two-dimensional physical model was constructed in the longitudinal direction for a 200 m × 2 m × 2 m fire protection zone of a natural gas compartment. The HBNG pipe of the model has a diameter of DN300 and is located 2 m from the top of the cabin. The air supply and exhaust openings, each measuring 1 m × 1 m, are positioned 1 m apart from the left and right edges of the firewall. Due to the lower density of HBNG in comparison to air and its natural tendency to rise following a leak, only the portion above the pipe wall is retained. The physical model of the natural gas compartment developed in this study is shown in Figure 1.
In this study, we substituted flammable gas alarms in natural gas compartments with monitoring points for research purposes. In accordance with China’s national standard [22] is stipulated that closed or semi-closed gas transmission and distribution facilities should be equipped with detectors at intervals of 15 m, and these detectors should not be positioned more than 4 m away from gas release sources. Gases such as natural gas, as well as other gases with a relative density of less than 1, are recommended to be detected on the roof or at a distance of 0.3 m from it. To account for the low density of methane and hydrogen, a monitoring line with monitoring points has been positioned 0.1 m (y = 1.9 m) below the ceiling. Simultaneously, considering the worst-case scenario of leakage occurring at X = 0 m, a monitoring point was placed at the point of the leakage at X = ±7.5 m. The remaining monitoring sites were distributed evenly with a 15 m spacing. Table 1 displays the x-axis monitoring points.

2.2. Mathematical Model

The list of symbols in the mathematical model is given in Table 2.

2.2.1. Model Simplification

To optimize the calculation process, the following assumptions are made, taking into account the existing circumstances of the project while also guaranteeing calculation precision:
  • The gas leakage process at the leakage hole is isentropic, which means that the mass flow rate of HBNG at the leakage hole remains constant.
  • The influence of air viscosity is disregarded.
  • It is assumed that the HBNG is composed exclusively of methane and hydrogen. Following a leakage, these components become mixed with the surrounding air. These components are also believed to leak, behave as ideal gases, and not undergo any chemical reactions with each other.
  • The walls of the natural gas compartment are adiabatic, which signifies the absence of heat transfer between the system and its surroundings.

2.2.2. Leakage Diffusion Modelling

The dispersion of HBNG leakage in utility tunnels is determined by three fundamental equations: the continuity equation, the energy equation, and the momentum equation. It is important to follow both the component transport equation and the turbulence equation when studying the diffusion process of HBNG, which has many parts and behaves erratically as it leaks from high-pressure jets.
1.
Continuity equations:
ρ t + ( ρ u ) x + ( ρ v ) y = 0
2.
Energy equation:
( ρ h ) t + ( ρ u x h ) x + ( ρ u y h ) y = p d i v U + d i v ( λ g r a d T ) + ϕ + E k
3.
Momentum equation:
{ ( ρ u x ) t + ( ρ u x u x ) x + ( ρ u x u y ) y = p x + μ ( 2 u x x 2 + 2 u x y 2 ) + F x ( ρ u y ) t + ( ρ u x u y ) x + ( ρ u y u y ) y = p y + μ ( 2 u y x 2 + 2 u y y 2 ) + F y
4.
Component transport equation:
( ρ Y i ) t + ( ρ V i Y i ) = · J i + R i + S i i
J i = ρ 1 X i j , j i ( X j / D i j ) · Y i
5.
Turbulence equation:
This study utilizes the standard k-ε turbulence model. This model was initially introduced by Launder and Spalding in 1991 [23]. It is founded on the transport equations for turbulent kinetic energy k and its dissipation rate. The conventional k-ε model is widely employed in industrial fluid dynamics including gas diffusion because of its robustness and cost-effectiveness. Below are the formulae for turbulent kinetic energy k and its dissipation rate ε.
( ρ k ) t + ( ρ μ i k ) x i = [ ( μ i + μ t σ k ) k x j ] x j + G k + G b ρ ε Y M + S K
( ρ ε ) t + ( ρ μ i ε ) x i = [ ( μ i + μ t σ ε ) ε x j ] x j + C ε 1 ε k ( G k + C ε 3 G b ) C ε 2 ρ ε 2 k + S ε
The model constants C ε 1 is 1.44, C ε 2 is 1.92, σ k is 1.0, and σ ε is 1.3.
To close the equations, the transport equation and the mixed gas density equation need to be augmented as follows [24]:
( ρ ς ) t + x j ( ρ u j ς ) = x j ( μ i ς x j )
ρ = P R T M m M a [ ς M a + ( 1 ς ) M m ]

2.3. Physical Properties of Components

Table 3 presents data on the physical properties of components in HBNG, including density, lower explosive limit (LEL), and upper explosive limit (UEL) for hydrogen and methane.
The explosive limit of HBNG fluctuates in accordance with alterations in the HBR. The Le Chatelier formula, represented by Equation (10), can be utilized to ascertain the explosive limit of a gas mixture comprising two or more gases [26].
L m = 100 V H 2 L H 2 + V C H 4 L C H 4 %
Several developed countries have conducted studies on HBNG with HBR reaching up to 20%. For the purpose of this study, 5%, 10%, 15%, and 20% HBR are selected for examination. In this study, the gas content is expressed as a mass fraction. Therefore, the units of explosion limits are converted from volume fraction to mass fraction for the purpose of comparison. The explosion limits of HBNG with varying HBR are presented in Table 4.

2.4. Boundary Conditions

2.4.1. Boundary Condition Type Setting

In order to accelerate the convergence of the simulation process, suitable boundary conditions are set for the leakage holes, air inlets, air outlets, and wall surfaces, as outlined in Table 5.

2.4.2. Inlet Condition Setting

Turbulence typically occurs in the airflow along the length of the natural gas compartment. The formula used to calculate the air velocity at the air supply outlet in the gas compartment is as follows [27]:
v = n V 3600 A
Table 6 displays the air velocity at the air supply outlet for various ventilation strategies.

2.4.3. Leak Hole Condition Setting

The primary factor influencing the flow rate of leakage through a small hole is the flow pattern of the gas as it escapes from the leak point. This flow pattern can be evaluated by utilizing the critical pressure ratio (CPR) [28].
C P R = ( 2 k + 1 ) k k 1 = 0.528
where k is the gas adiabatic index, taken as 1.29.
China’s national standard [15] stipulates that the towns and cities of the sub-high-pressure gas pipeline operating pressure levels were 0.4 MPa, 0.8 MPa, and 1.6 MPa. The calculated CPR values of the gas at the leakage holes in this study are all less than the ratio of the absolute pressure of the pipeline to the outlet pressure (the outlet pressure was set to 0.1 MPa because the HBNG leaks into the atmosphere), so the flow pattern of the gas at the leakage holes is acoustic flow. Therefore, the small hole leakage flow rate in this study is calculated as in Equation (13):
Q = A D C D P T M k Z R T ( 2 k + 1 ) k + 1 k 1
Table 7 presents the mass flow rate of leakage from a sub-high-pressure HBNG pipeline with a DN300 pipe diameter at various sizes of leakage orifices.
The initial gauge pressure of the leakage hole should be set when the gas velocity reaches the speed of sound. This study sets the initial gauge pressure according to [16], and for details see Table 8.

2.5. Working Conditions

The main parameters influencing this study were the hydrogen doping ratio, leakage hole size, pipe pressure, and leakage location. Case 4 was selected as the benchmark for comparative analysis. The numerical simulation plan for this study was designed based on these factors, as illustrated in Table 9.

2.6. Verification of Grid-Independence

The model grid is efficiently divided using ICEM. The model divides the flow field into seven regions based on the characteristics of the core jet, diffusion, inlet, and outlet regions of the leakage. The mesh of the leakage holes, inlet, and outlet is locally encrypted to improve calculation accuracy. Figure 2 displays the meshing and local encryption used in this investigation.
To assess grid independence, three different grid schemes with 125,610, 309,350, and 409,350 grid counts are used in case 1 for comparative analysis. Figure 3 illustrates the methane distribution of the three grid schemes at test points 1 (7.5, 1.9) and 2 (10, 1.8).
The results indicate that when the grid reaches 3 × 10⁵, the concentration generally agrees with the calculated solution for a grid of 4 × 10⁵ magnitude, with a relative error of less than 2.3%. Considering the precision requirements of engineering and computational efficiency, a grid size of 3 × 10⁵ is chosen for division.
The selected grids’ overall numerical domain grid size is 0.1 mm, and the maximum size is 50 mm. Five hundred meshes were divided in the area above the 4 mm leakage hole for local encryption, with a grid size growth rate of 1.05.

2.7. Initial Conditions and Solution Methods

  • Initial conditions:
At t = 0 s, the gas compartment is initially filled with air, with a temperature of 300 K and a pressure equal to the atmospheric pressure. The methane and hydrogen have a starting concentration and velocity of zero.
2.
Solution methods:
The scheme chooses SIMPLE, which uses the first-order windward differential mode for the parts and the second-order windward format for the energy, momentum, and turbulence. The volume fraction of each component at the monitoring point was examined to determine convergence. The time step is set as 1 × 10⁻², taking into account the mesh size and courant number requirements and the maximum iterations per time step is set as 50. Each situation is simulated for 40,000 time steps with a 400 s length of simulation. The residual criteria are set to 1 × 10⁻³ for continuity, 1 × 10⁻⁴ for x-velocity and y-velocity, and 1 × 10⁻³ for turbulence parameters and species.

2.8. Model Validation

The physical model of the similar platform experiments for accidental ventilation of gas compartments in [29] was simulated using the numerical simulation parameter settings of this study to obtain the simulated values of methane volume fractions at sampling points 6 and 9 in the physical experiments.
Figure 4 compares the simulated values obtained using the mathematical model developed in this study with the experimental values at test points 6 and 9.Compared with the experimental values, the two obtained methane volume change trends are consistent, and the average error is 4.3% and 5.6%, respectively. The deviation is within the acceptable range, which verifies the reliability of the mathematical model and parameter settings in this study.

3. Results and Discussion

In accordance with [14], the upper limit for the concentration of natural gas in an alarm should not exceed 20% LEL. This study defines the “infringement distance” as the distance at which the HBR reaches 20% LEL. The concentration at the point that catches 20% LEL is referred to as the “alarm concentration,” and the time at which it reaches this concentration is called the “alarm time.”
The specification also mandates that the number of ventilation changes in natural gas compartments should be a minimum of six per hour under normal conditions and twelve per hour under accident conditions. Hence, the ventilation conditions within the pipeline corridor can be classified into two distinct categories: natural ventilation and mechanical ventilation. Natural ventilation is the absence of fan activation, while mechanical ventilation encompasses both normal and accident ventilation.

3.1. HBNG Leakage Pattern under Natural Ventilation

The probability of a concurrent failure of both the gas pipeline and ventilation system within natural gas compartments is considerably lower than the likelihood of an isolated gas pipeline leak within the same corridor. Consequently, the analysis and study are exclusively centered on the distribution pattern of gas leakage under natural ventilation conditions and the alterations in the leakage pattern following hydrogen doping.
Figure 5 shows the dispersion pattern of natural gas (HBR = 0%) under natural airflow conditions at different time intervals based on simulations conducted for case 1. At the 6 s mark, natural gas rapidly ascends to the uppermost part of the gas chamber in a concentrated stream. At the 30 s mark, the infringement distance over which natural gas spreads in the compartment by diffusion is roughly 10 m. By the time 100 s have passed, its range has expanded to 30 m. It is clear that in a naturally ventilated environment, the diffusion rate of natural gas in a gas compartment decreases significantly with increasing diffusion distance. The reason is that the utility tunnel is an underground confined area with limited natural airflow, causing natural gas to spread primarily based on the initial velocity of the leaking jet. The kinetic energy of natural gas diffusion near a leak diminishes symmetrically from the center of the leak to the longitudinal direction of the gas compartments due to gas viscous force and air resistance until it is completely exhausted. Furthermore, the top of the compartments has a higher gas diffusion capacity than the middle and lower parts, and part of the wall-restricted methane diffuses from the top to the middle, resulting in a clear stratification of methane concentrations. By the time of 360 s, natural gas has progressively dispersed throughout the gas compartment. Under conditions of natural ventilation, it can be deduced that methane in the natural gas compartment demonstrates a symmetrical distribution at the center of the leakage hole. Furthermore, the distance of natural gas leakage exhibits a positive correlation with the duration of the leakage, while the diffusion rate shows a negative correlation with the leakage duration.
HBR may impact natural ventilation gas leakage. At varied monitoring line times, matching cases 2–5 yielded HBNG concentration graphs (Figure 6). Hydrogen doping steadily reduces methane leakage, as shown in the image. HBNG concentrations at each monitoring point at the same point in time showed a decreasing trend. As the concentration of hydrogen increases, the gas gains significant momentum, leading to an acceleration of the diffusion process and an expansion of the diffusion distance within the same timeframe. This indicates that the dangerousness of gas leakage increases after hydrogen blending.

3.2. Analysis of Factors Affecting the Spread of HBNG Leakage under Normal Ventilation Conditions

3.2.1. HBNG Leakage Pattern under Normal Ventilation

Figure 7 depicts the diffusion distribution condition of case 4 situations at various time periods under normal ventilation circumstances. As demonstrated in Figure 7, owing to ventilation, the presence of HBNG in the space above the compartment to the left of the leakage point is almost negligible. With the exception of monitoring point 8 near the air inlet, the concentration of HBNG increases quickly to 0.01 vol before gradually stabilizing in the area to the right of the point of leakage. At 150 s, the gas doped with hydrogen had dispersed toward the vent. The release of the HBNG was hindered by the limited vent size, resulting in the attainment of the alert concentration throughout the entire downwind area at 380 s. This shows mechanical ventilation increases HBNG diffusion in the gas compartment, and the typical ventilation wind speed is not enough to eliminate the jet column, so raising it is important for gas compartment safety and stability.
Figure 8 illustrates the dispersion pattern of the flow lines that arise from a gas compartment leakage under typical ventilation conditions in Case 4. The graphic demonstrates that ventilation gas flow is the primary factor influencing the leakage process. Over time, the gas flow line becomes increasingly level and linear. Mechanical ventilation increases HBNG diffusion in the gas compartment, and the typical ventilation wind speed is not enough to eliminate the jet column. Raising it is thus important for natural gas compartment safety and stability.

3.2.2. Different Leakage Hole Sizes

Comparative analyses were carried out for cases 4, 6, and 7. The research produced graphs showing how the gas concentration changed when HBNG leaked through different leakage holes while the ventilation mode was normal (see Figure 9). As the size of the hole rises, the total momentum of the gas leakage jet containing hydrogen increases, resulting in an improved spread of the HBNG. Over the same amount of time, there were mostly no changes in the longitudinal distribution pattern of HBNG on the monitoring line when the leakage aperture conditions were different. The HBNG concentration on the monitoring line at t = 150 s exhibited a progressive and smooth distribution. The mass fractions for the leakage aperture diameters of 4 mm, 5 mm, and 6 mm were 0.00672, 0.01047, and 0.0150, respectively.

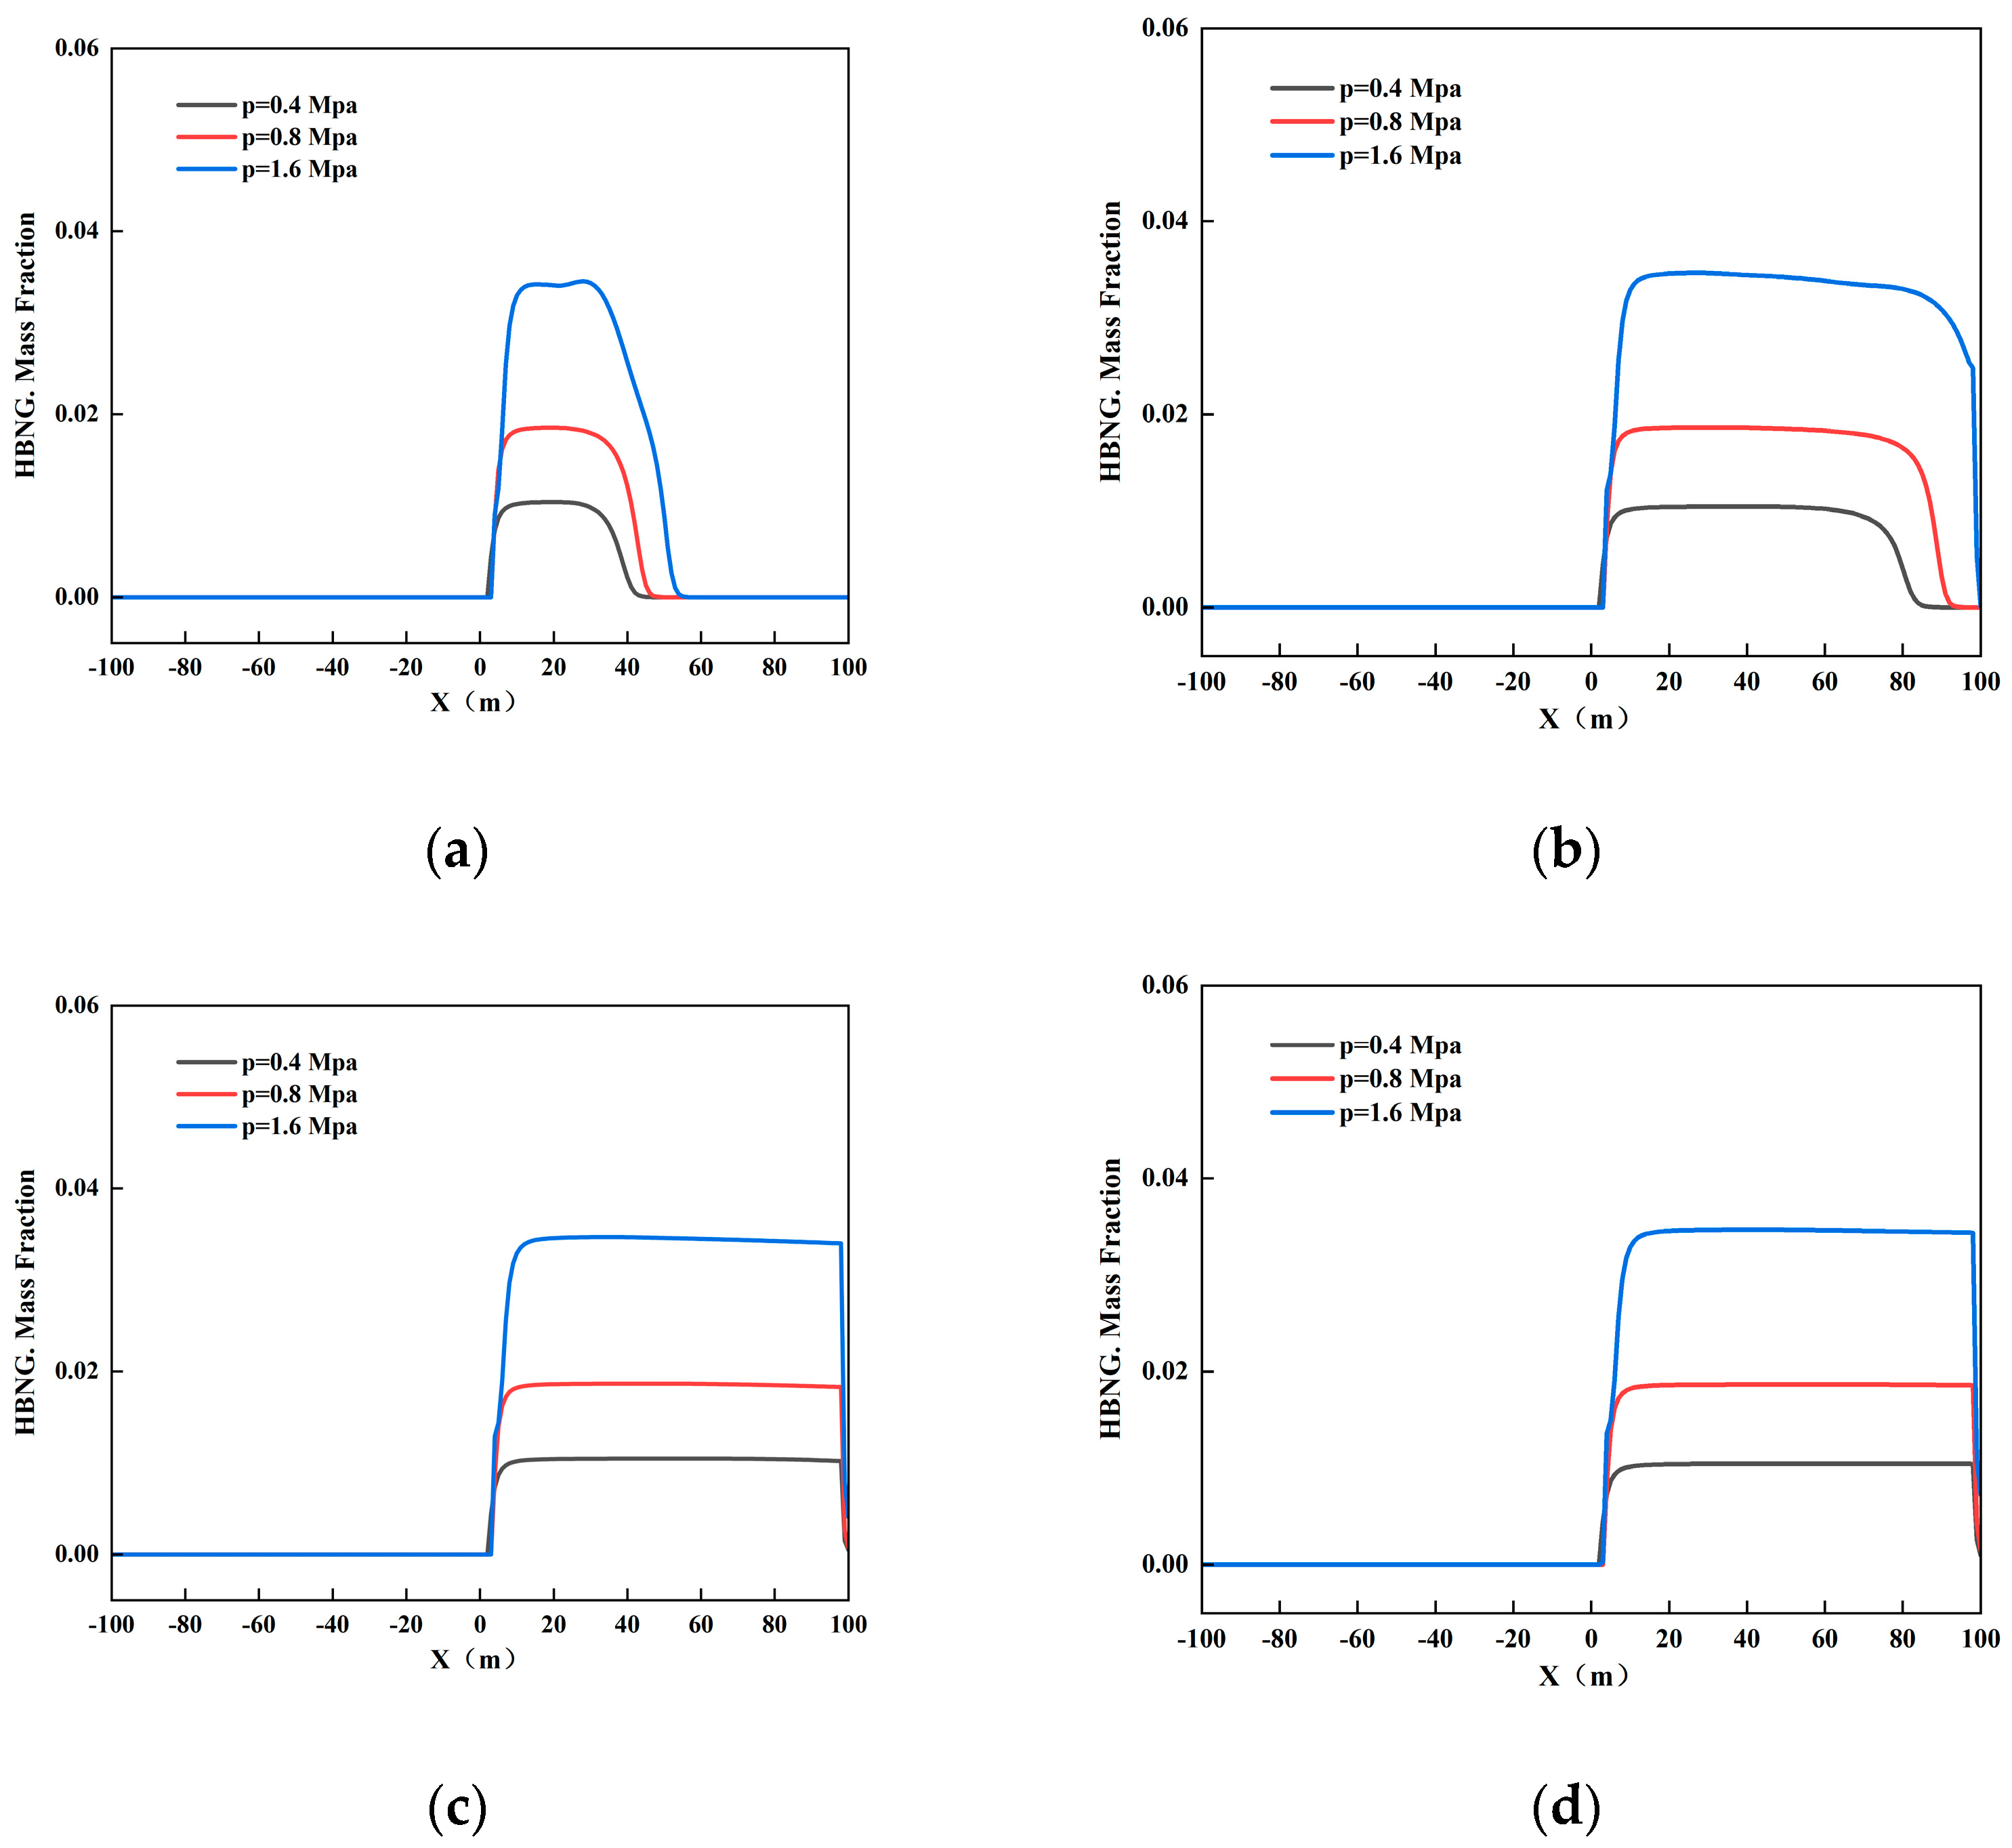
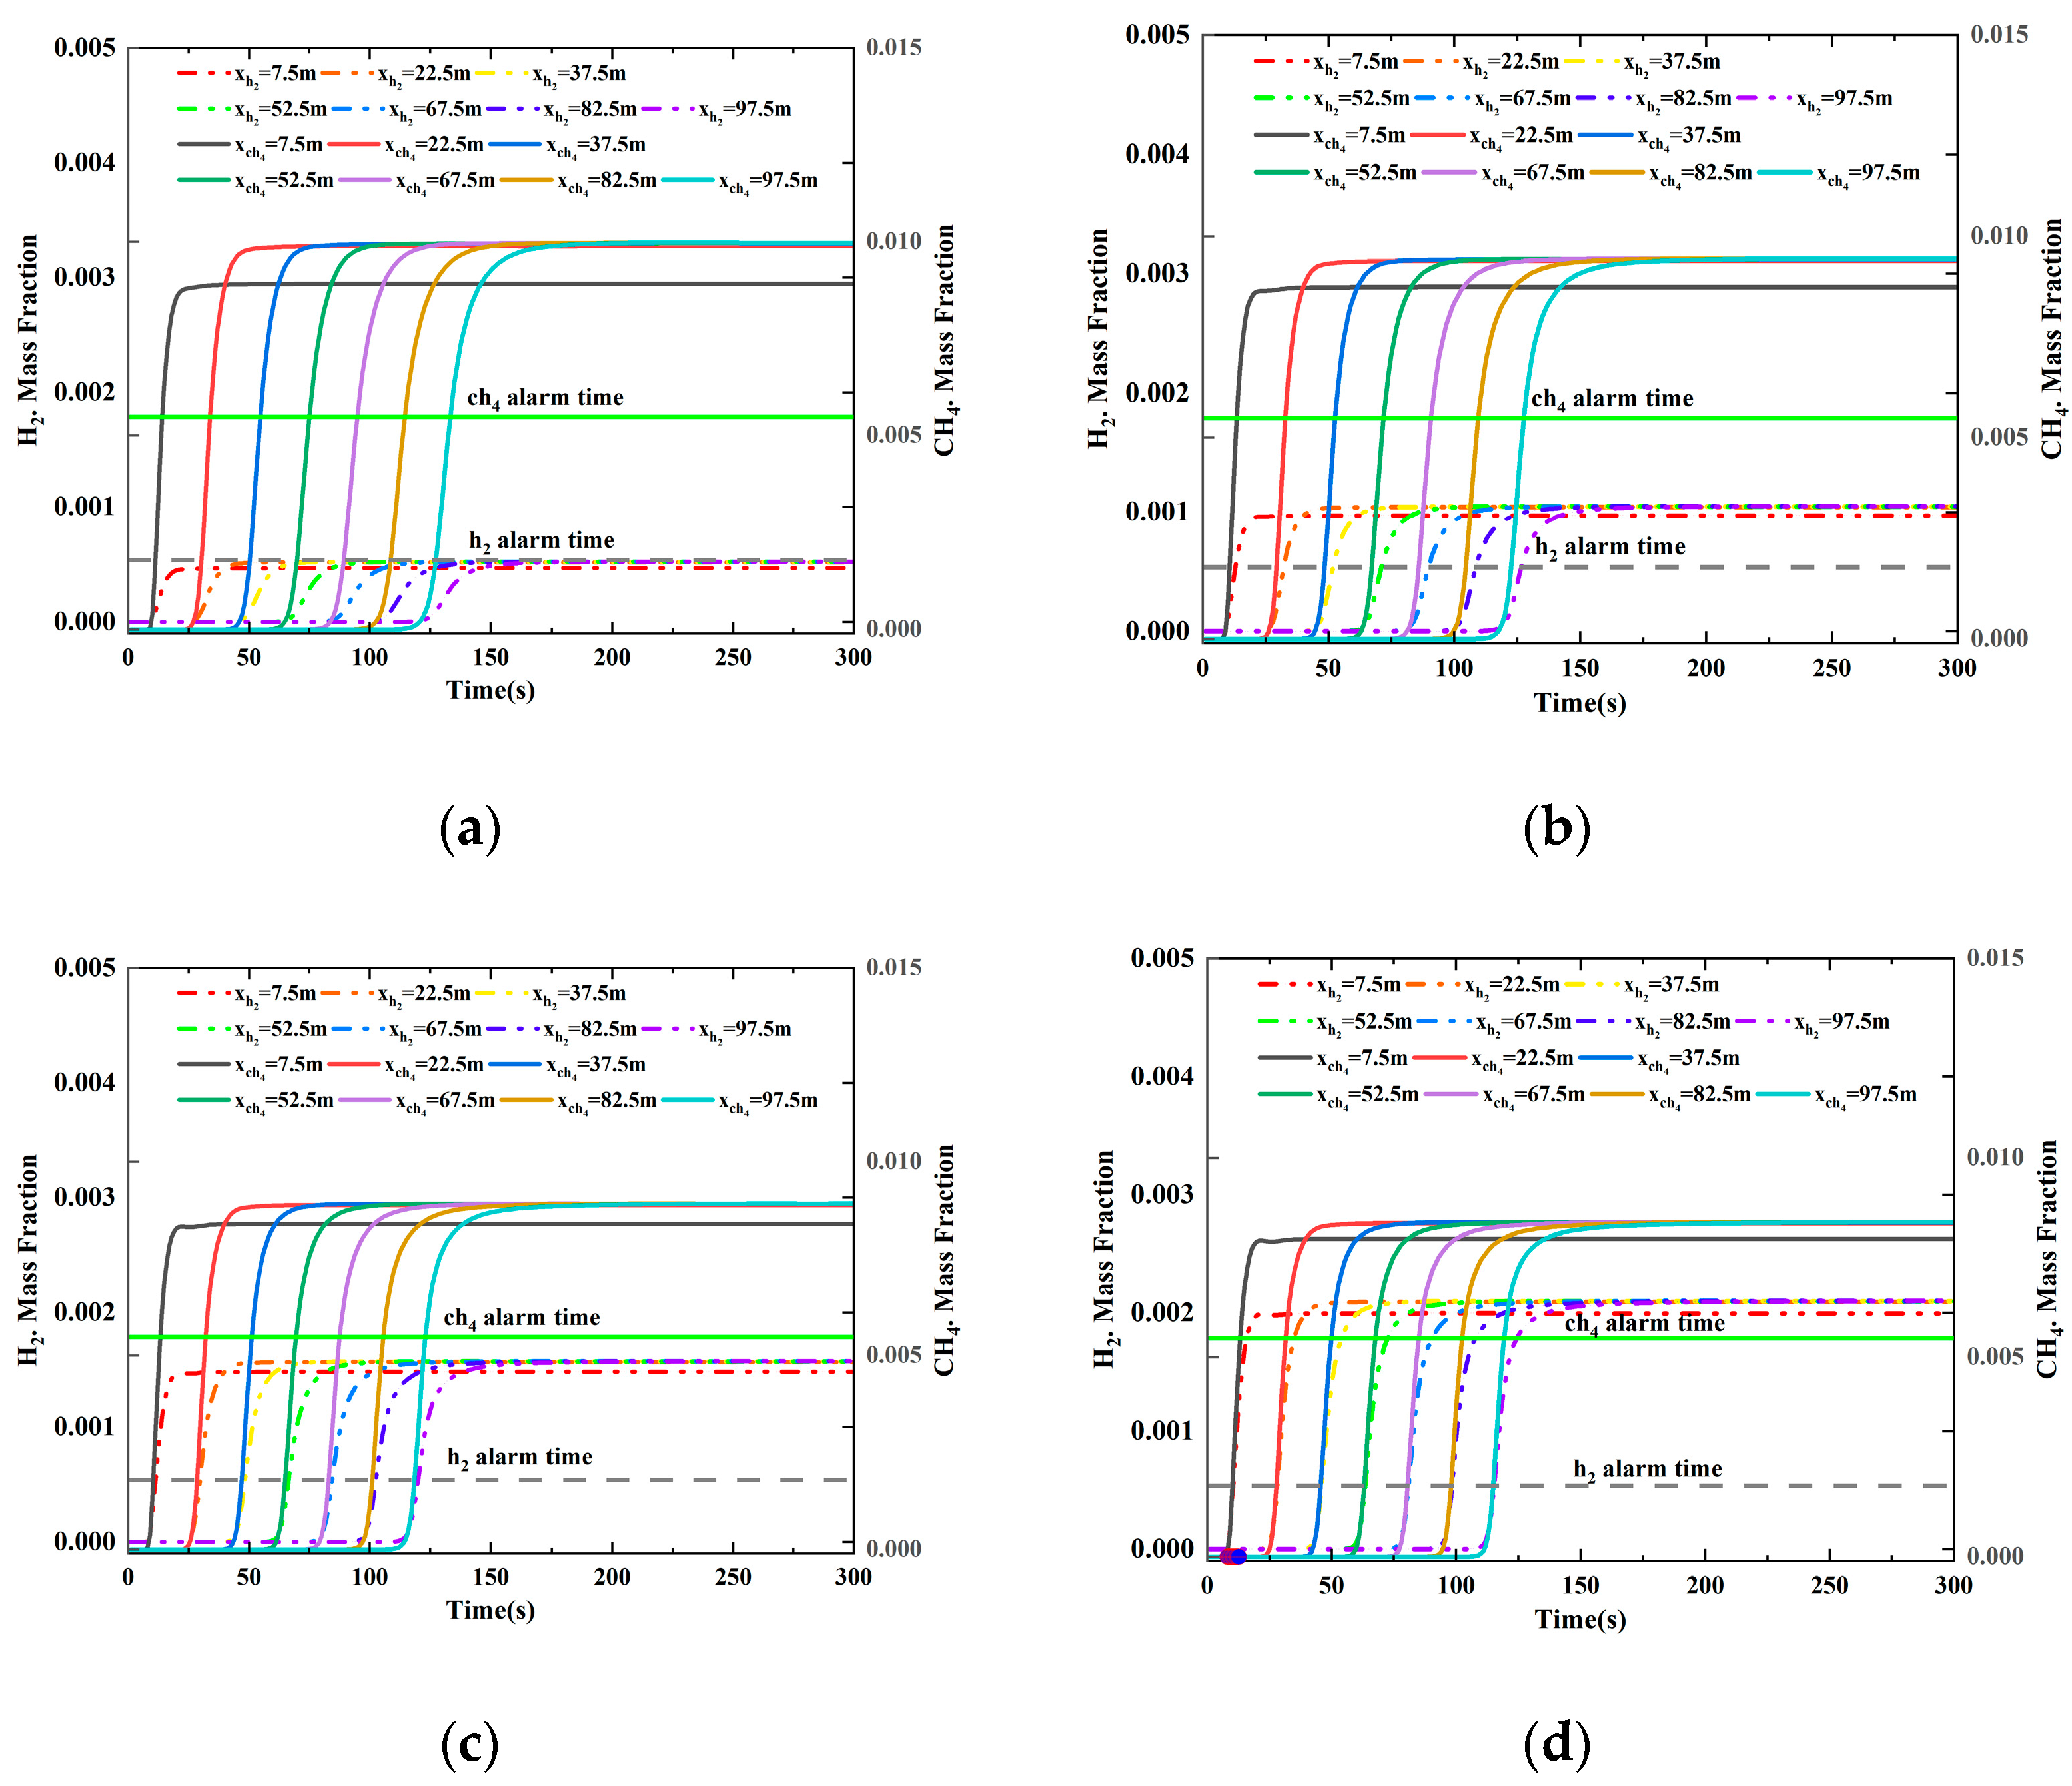
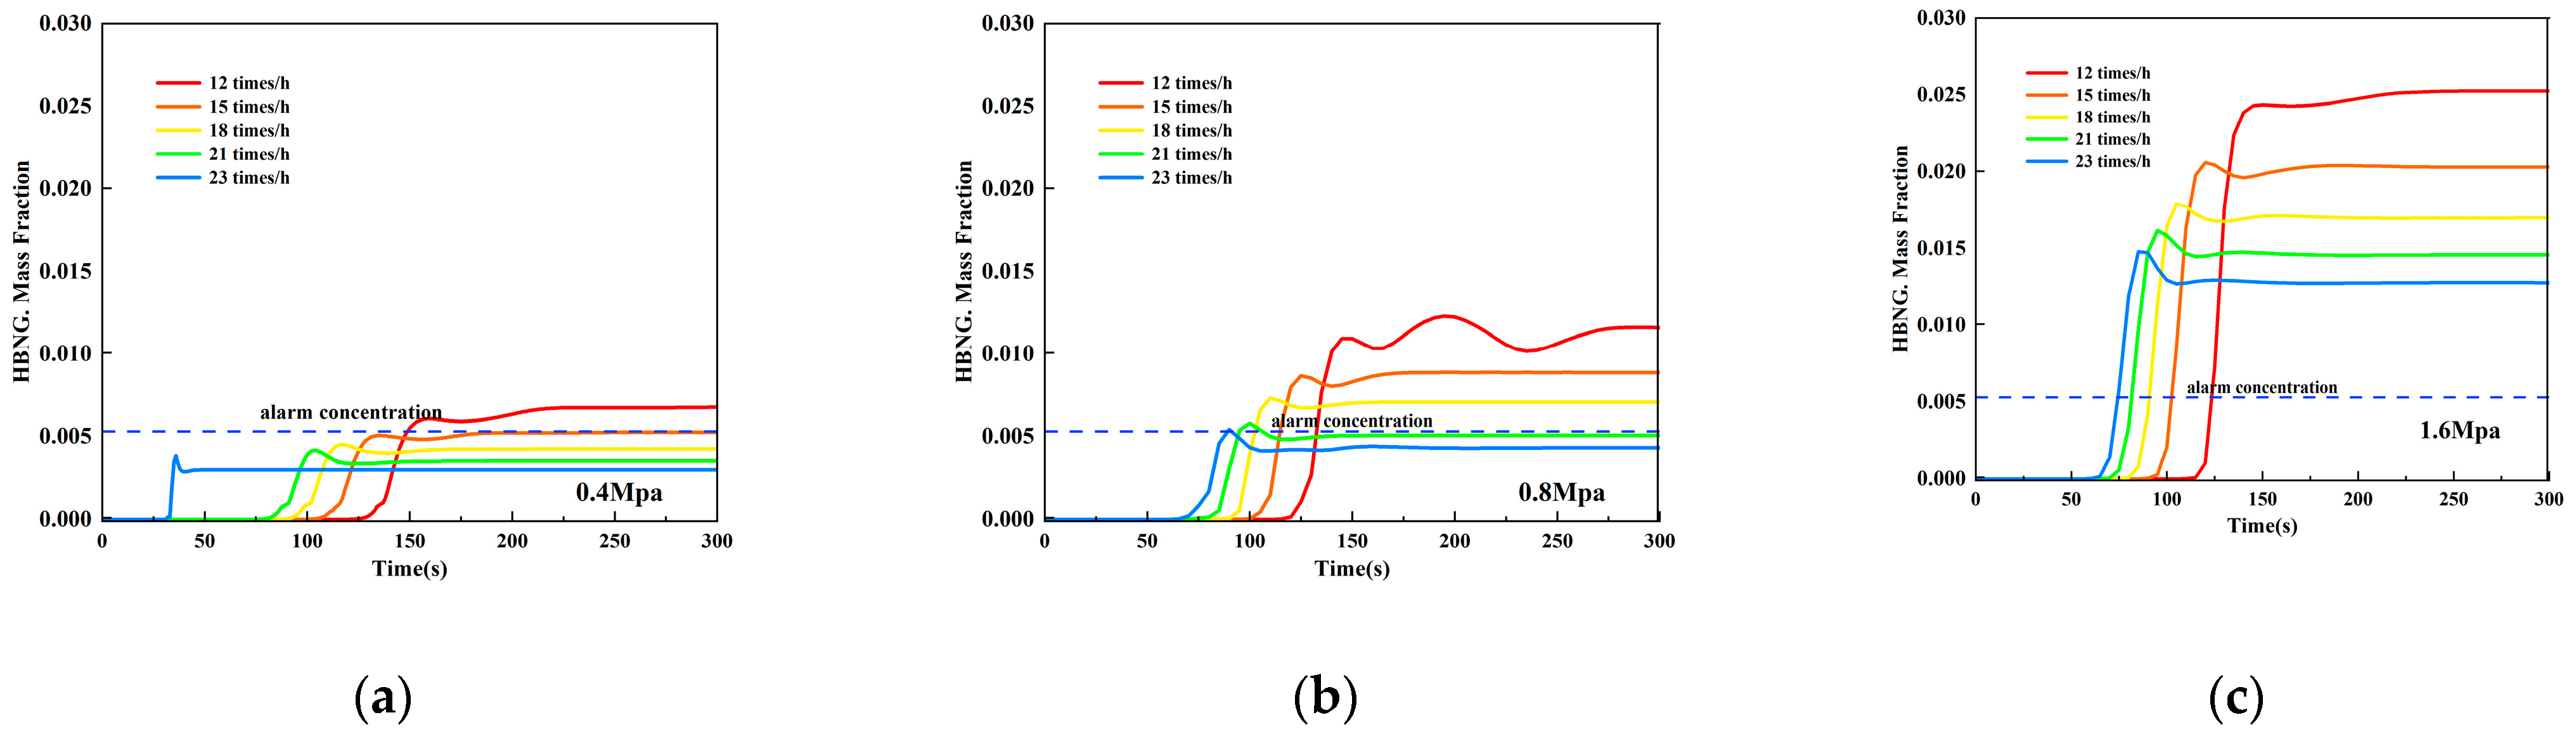
3.2.3. Different Pipeline Pressures

A comparative study of cases 4, 8, and 9 was carried out to obtain the graphs of gas concentration changes for HBNG leakage under normal ventilation conditions with different pipeline pressures (Figure 10). The spatial distribution of HBNG in a pipeline at various pressures closely resembles the spatial diffusion pattern of HBNG under different conditions of leakage port aperture. An increase in leakage pressure will result in a corresponding increase in the flow and velocity at the leaking opening. This outcome leads to the HBNG jet possessing a higher momentum, enabling it to disperse more vigorously in all directions. Furthermore, the dispersion of jets is proportionally decreased due to the dissipation of turbulence on a small scale. At a particular time, as the pipeline pressure increases, the HBNG diffusion range is expanded accordingly, and the concentration of HBNG in the corresponding area is more likely to reach the LEL. The risk of accidents increases significantly if higher-pressure pipelines leak within a natural gas compartment. Therefore, it is essential to enforce more rigorous security measures for HBNG pipelines working under higher pressure.

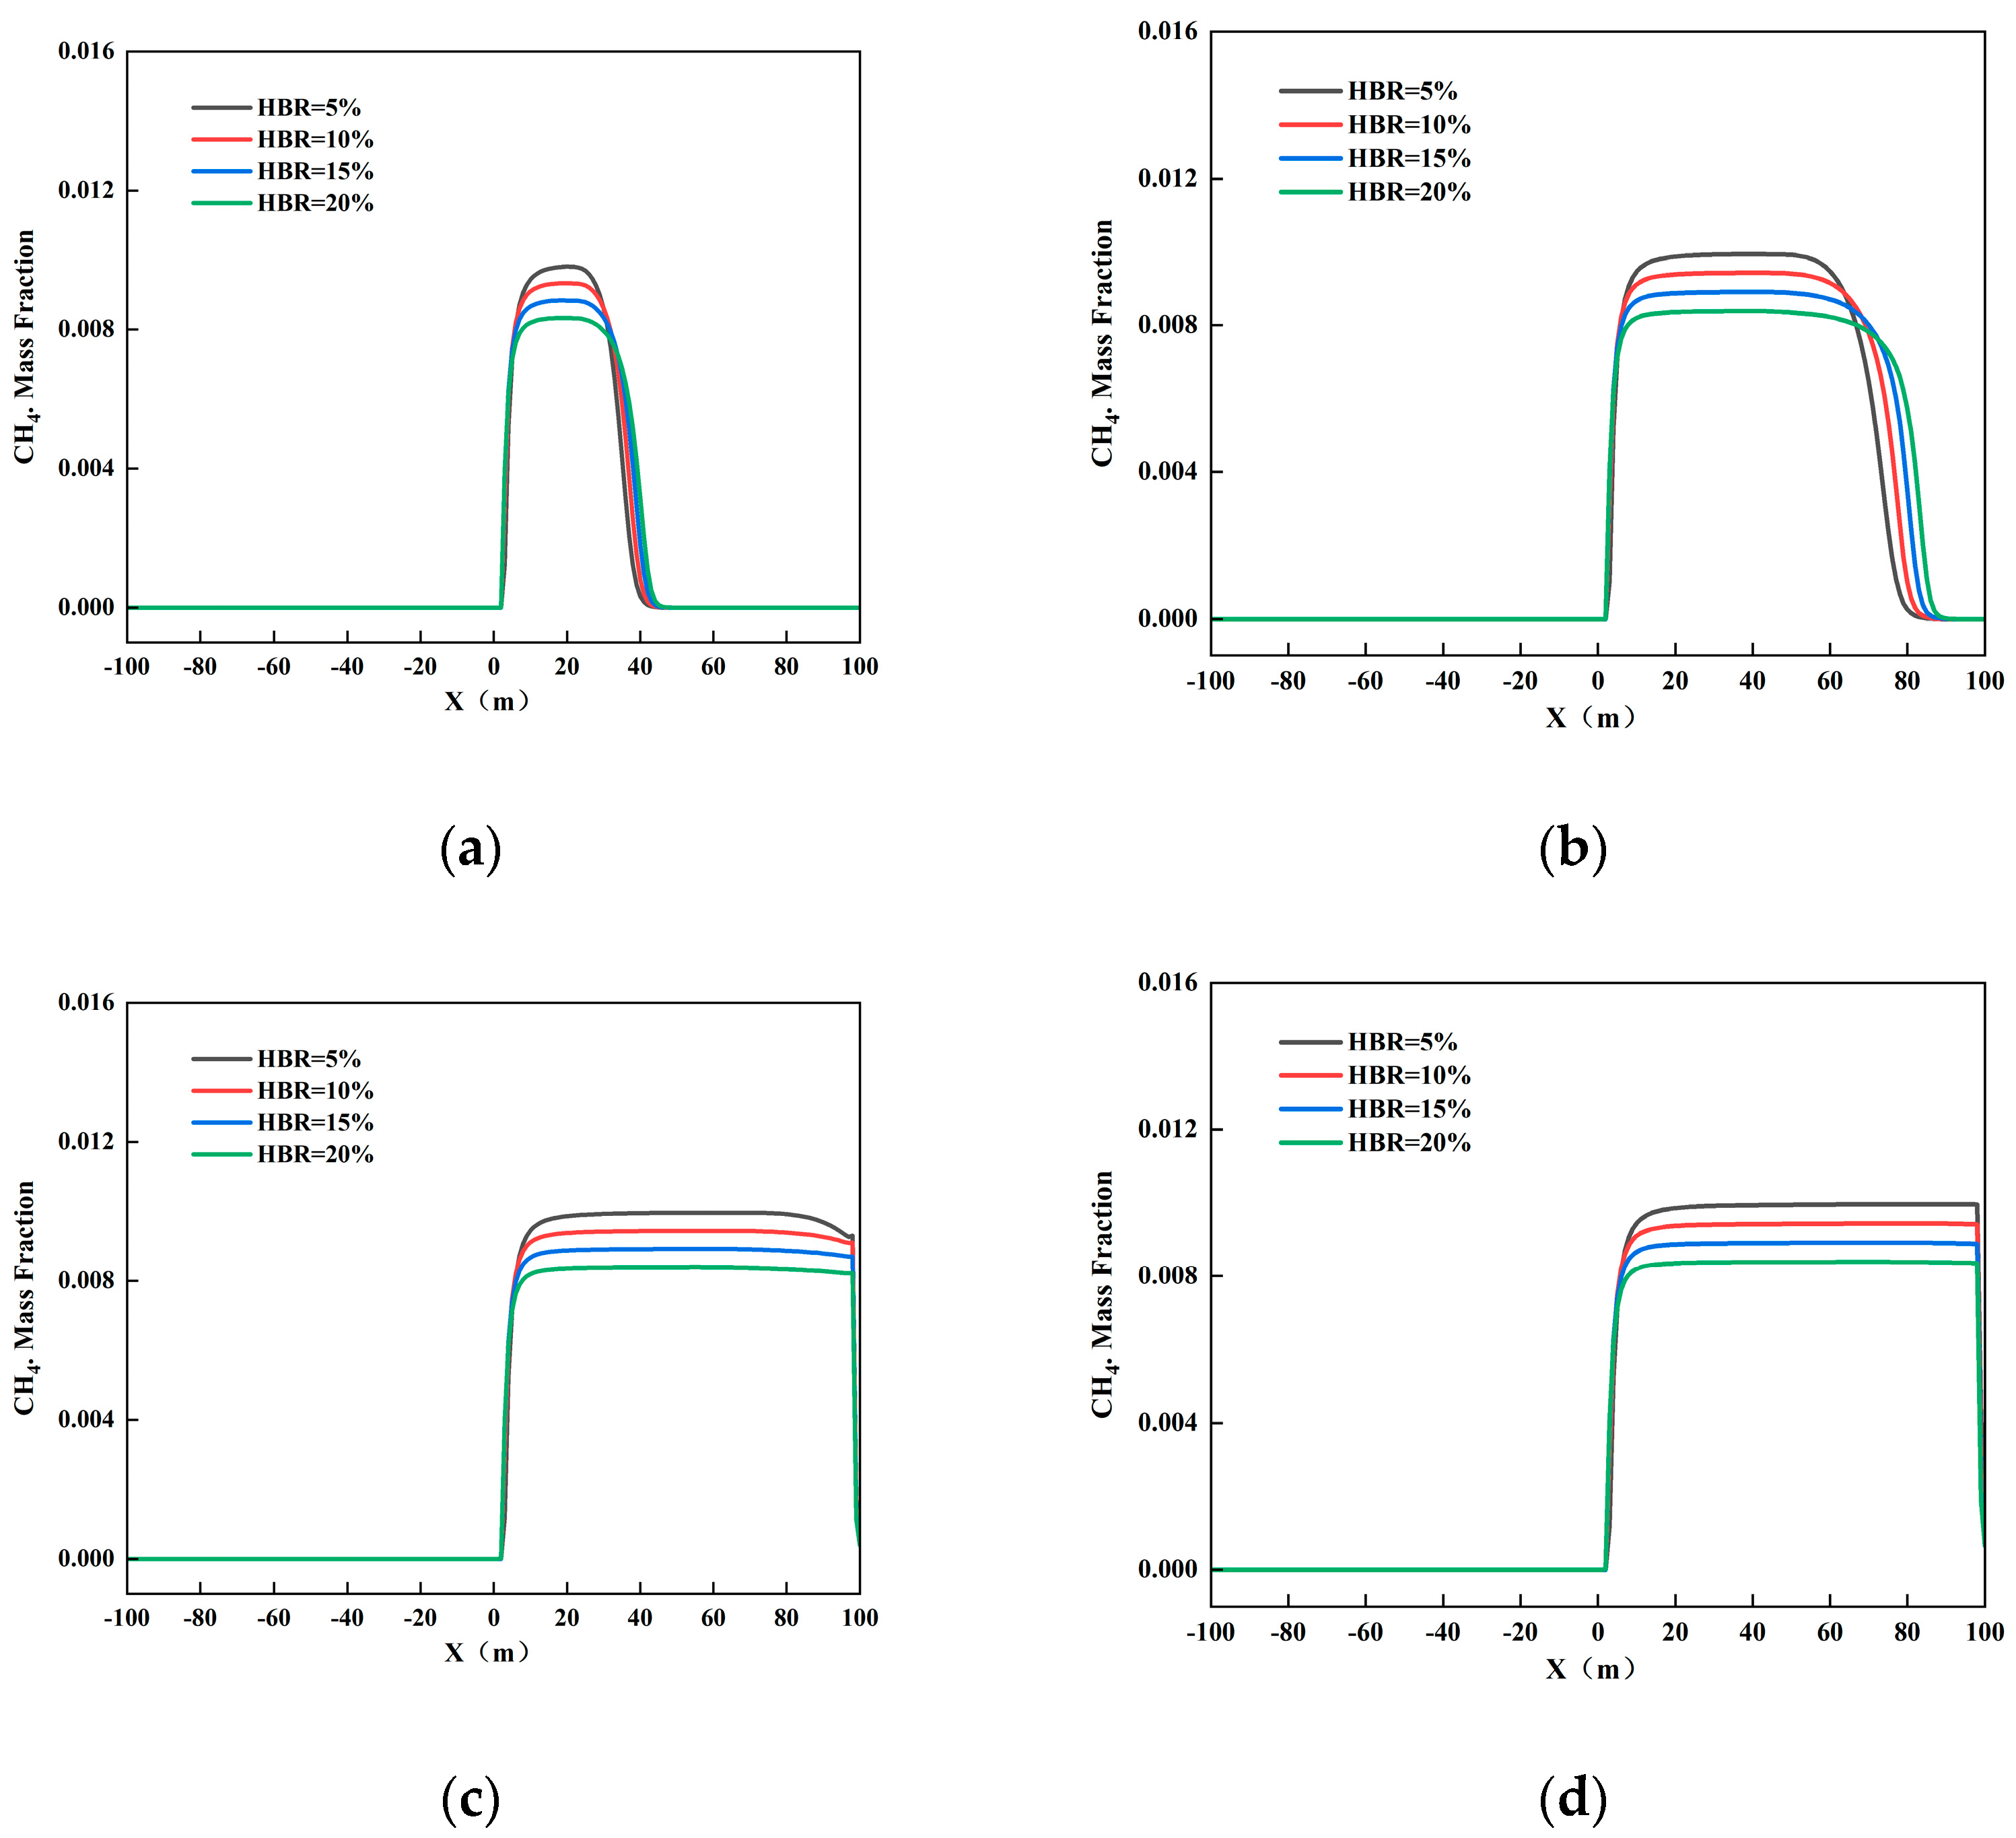
3.2.4. Different HBR

By comparing and analyzing the simulation results of case 1 to case 5 under normal ventilation settings, we can generate concentration variation graphs of gas leakage with varied HBR (Figure 11). When gas leaks with varying HBR, the patterns remain consistent. It may be deduced that hydrogen and methane were uniformly blended prior to the occurrence of the leak. Hydrogen and methane exhibit distinct mass transfer capacities, but this disparity does not impact their leakage. The spatial distribution of methane decreases with the addition of hydrogen blending. Over time, the gas concentration on the monitoring line eventually became stable. The gas leakage concentration at HBR = 20% reached 40 vol of the LEL of the gas mixture, which is a two-percentage point increase compared to the value before hydrogen doping. This result indicates that hydrogen blending increases the danger of explosion.
The distribution curves of the hydrogen and methane components in gas leaks with varying HBR at different monitoring locations over time are shown in Figure 12. At an HBR of 5%, the concentration of hydrogen leakage in the natural gas compartment remains below the warning threshold even after the leakage has stabilized, possibly attributable to the relatively low quantity of hydrogen being introduced. The warning times for the methane sensor and the hydrogen sensor exhibit close similarity when the HBR is 10%, 15%, and 20%.
Furthermore, the inclusion of hydrogen in the gas mixture results in a reduction of its calorific value. The calorific value of hydrogen is 13 MJ/m3, whereas that of methane is 38 MJ/m3. The heat of combustion of hydrogen is merely 1/26th of the heat of combustion of methane at a hydrogen integration level of 10%. Therefore, for catalytic combustion-type combustible gas alarms based on the principle of thermal effect when HBNG is in the natural gas compartment, it is recommended that the methane concentration be used as the monitoring standard.

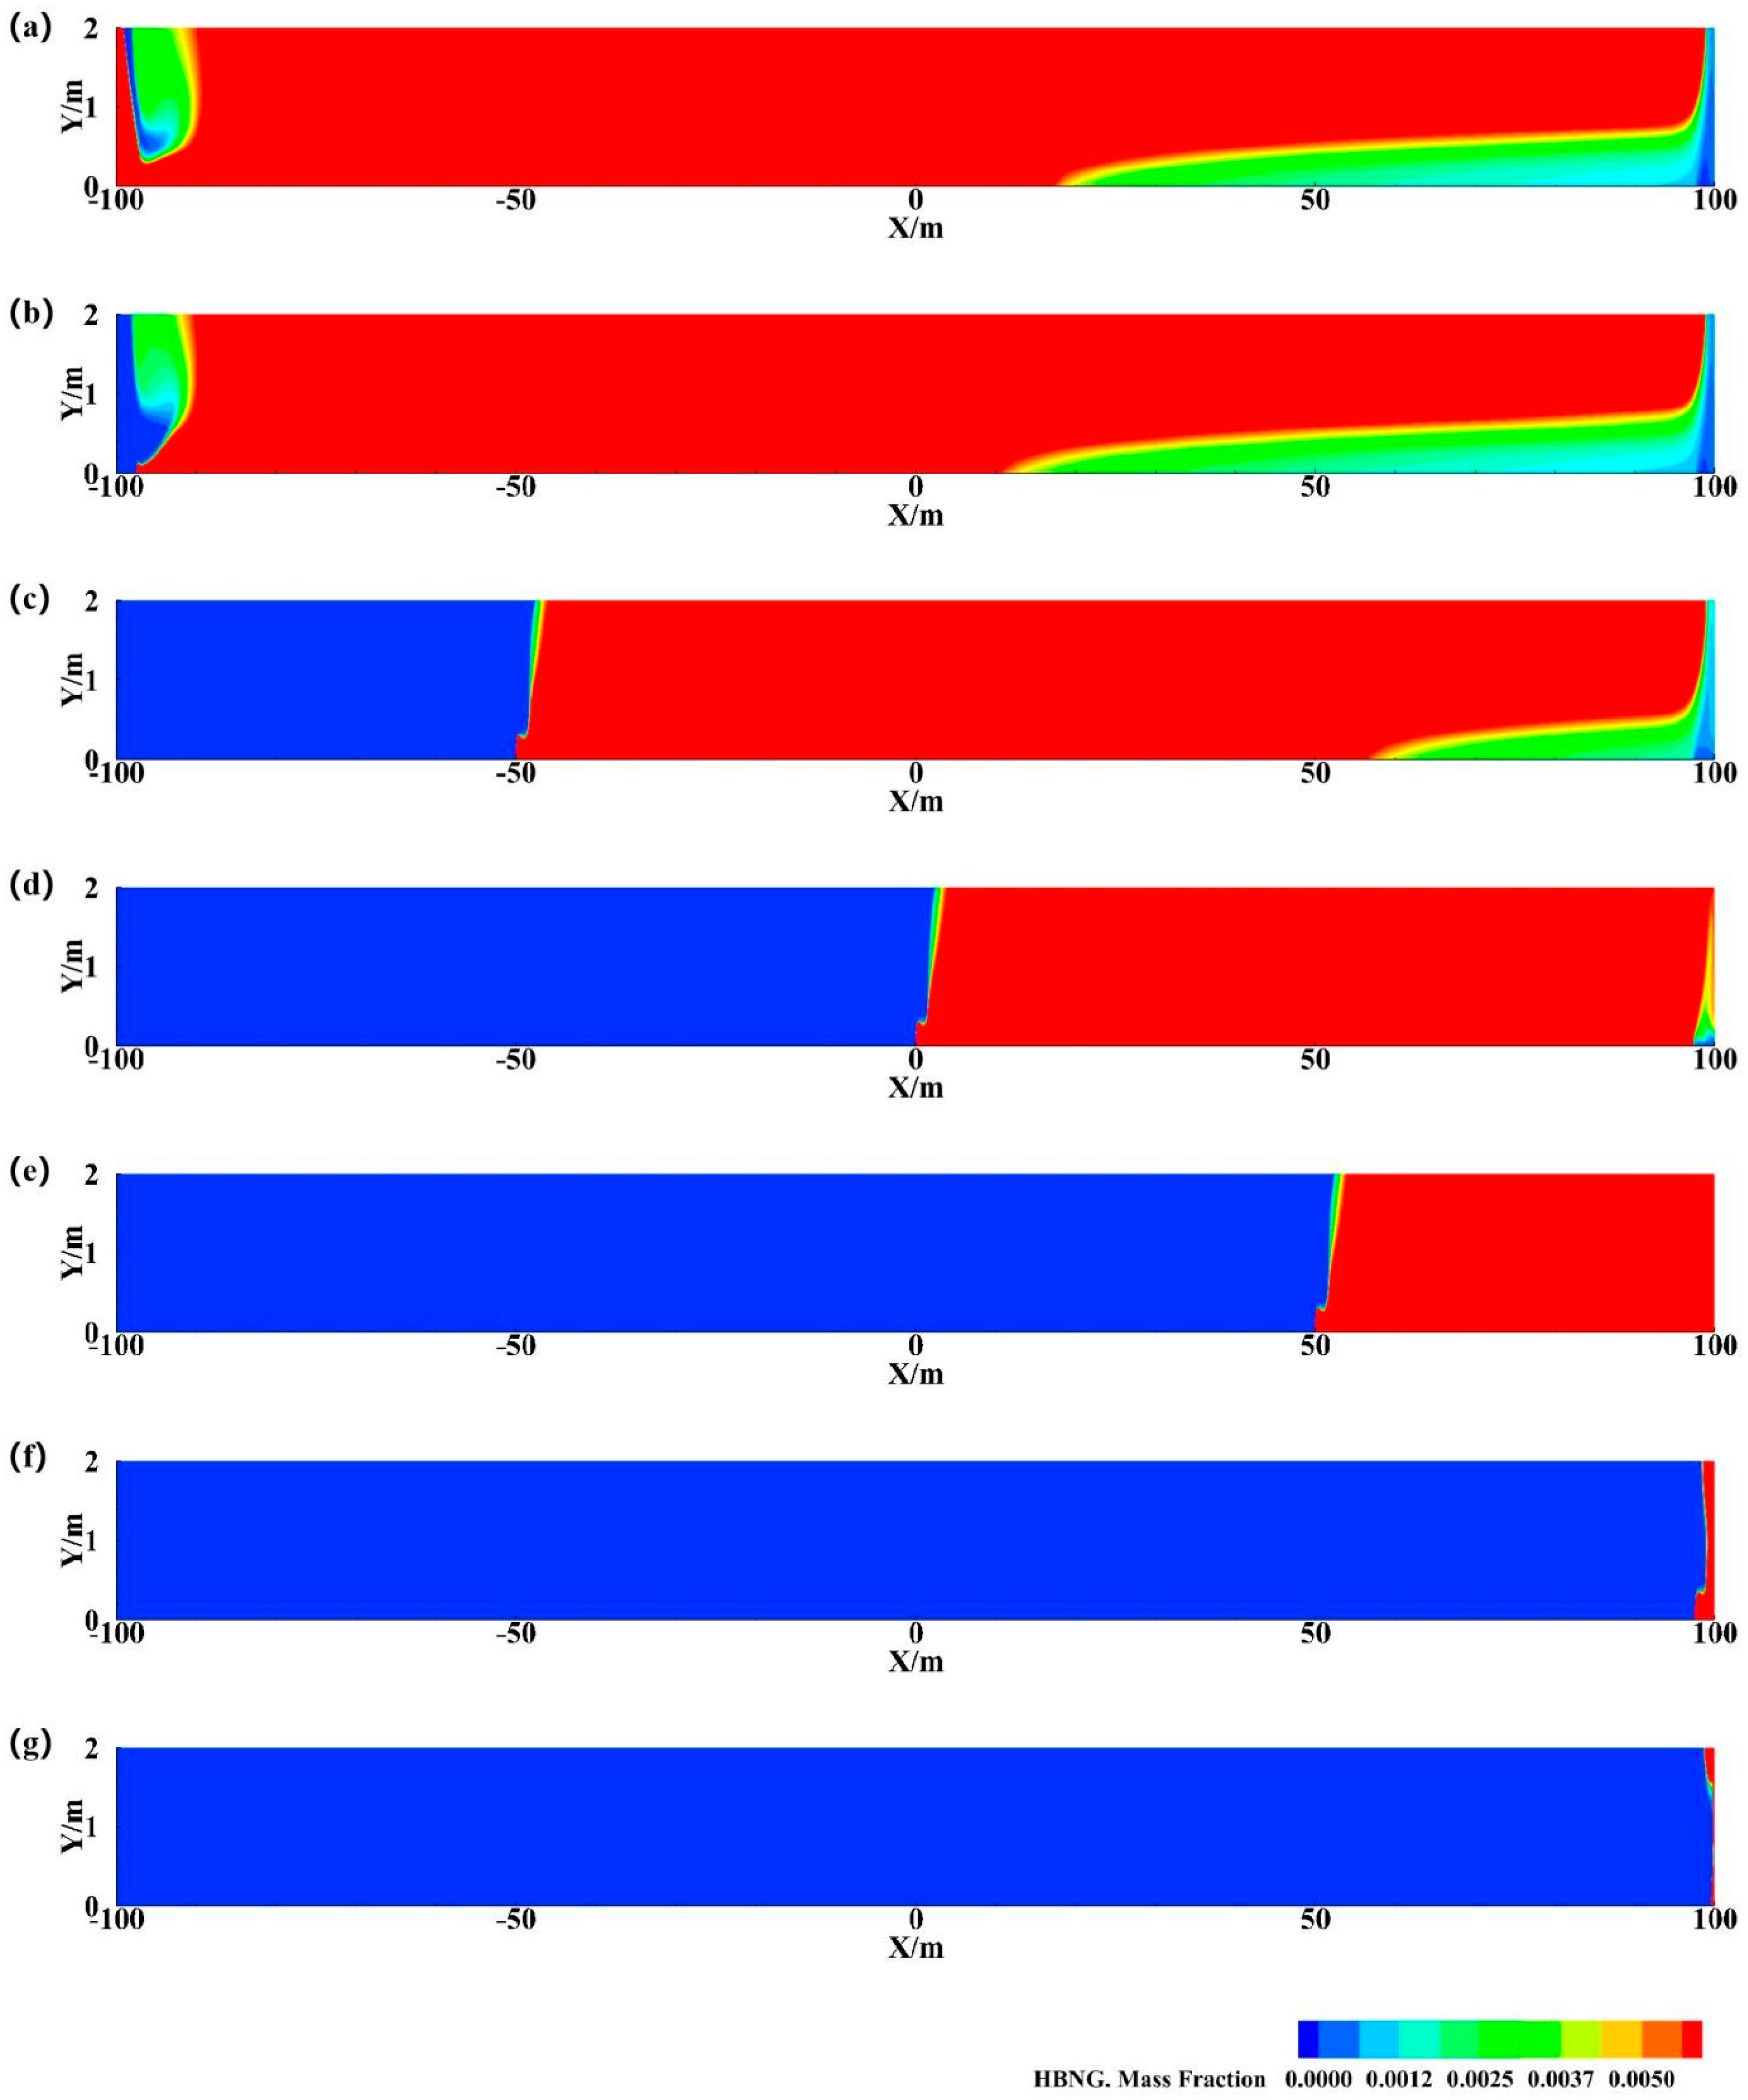
3.2.5. Different Leak Locations

An analysis was conducted to compare the leakage pattern of HBNG at various leakage locations under normal ventilation settings in cases 4 and 10~15. A graph illustrating the changes in gas concentration of HBNG leakage at various positions of the leakage holes was obtained (Figure 13). When the leakage occurs at x = −97.5 m or x = −99.5 m, the sluggish air movement in the upwind region of the leak makes it challenging for the HBNG to be propelled toward the exhaust vent. The gas that has been released gathers in this region and nears the threshold at which it can explode. The downwind area of the leaking hole was filled with HBNG, and the air-driven HBNG posed a combustion and explosion hazard in much of the natural gas compartment. The distribution pattern of the leaking holes remains consistent when they are positioned at x = −50 m and x = 50 m, as it is at x = 0 m. As a result of ventilation, the upwind area of the leakage holes is nearly allowed for gas components, while the downstream area experiences rapid accumulation of HBNG. When the leakage location is x = 97.5 m and x = 99.5 m, the leakage location is close to the air vent, so the HBNG can be rapidly discharged out of the integrated pipe corridor under the effect of ventilation. However, due to the limitations of the vent size, it was challenging to vent the HBNG, resulting in the area from the edge of the vent to the firewall being filled with leaking gas. We therefore suggest installing diversion devices and combustible gas alarms in the blind spots of the air inlet and outlet for ventilation.

3.3. Ventilation Strategy for HBNG Leakage Accidents Based on the Most Unfavorable Leakage Conditions

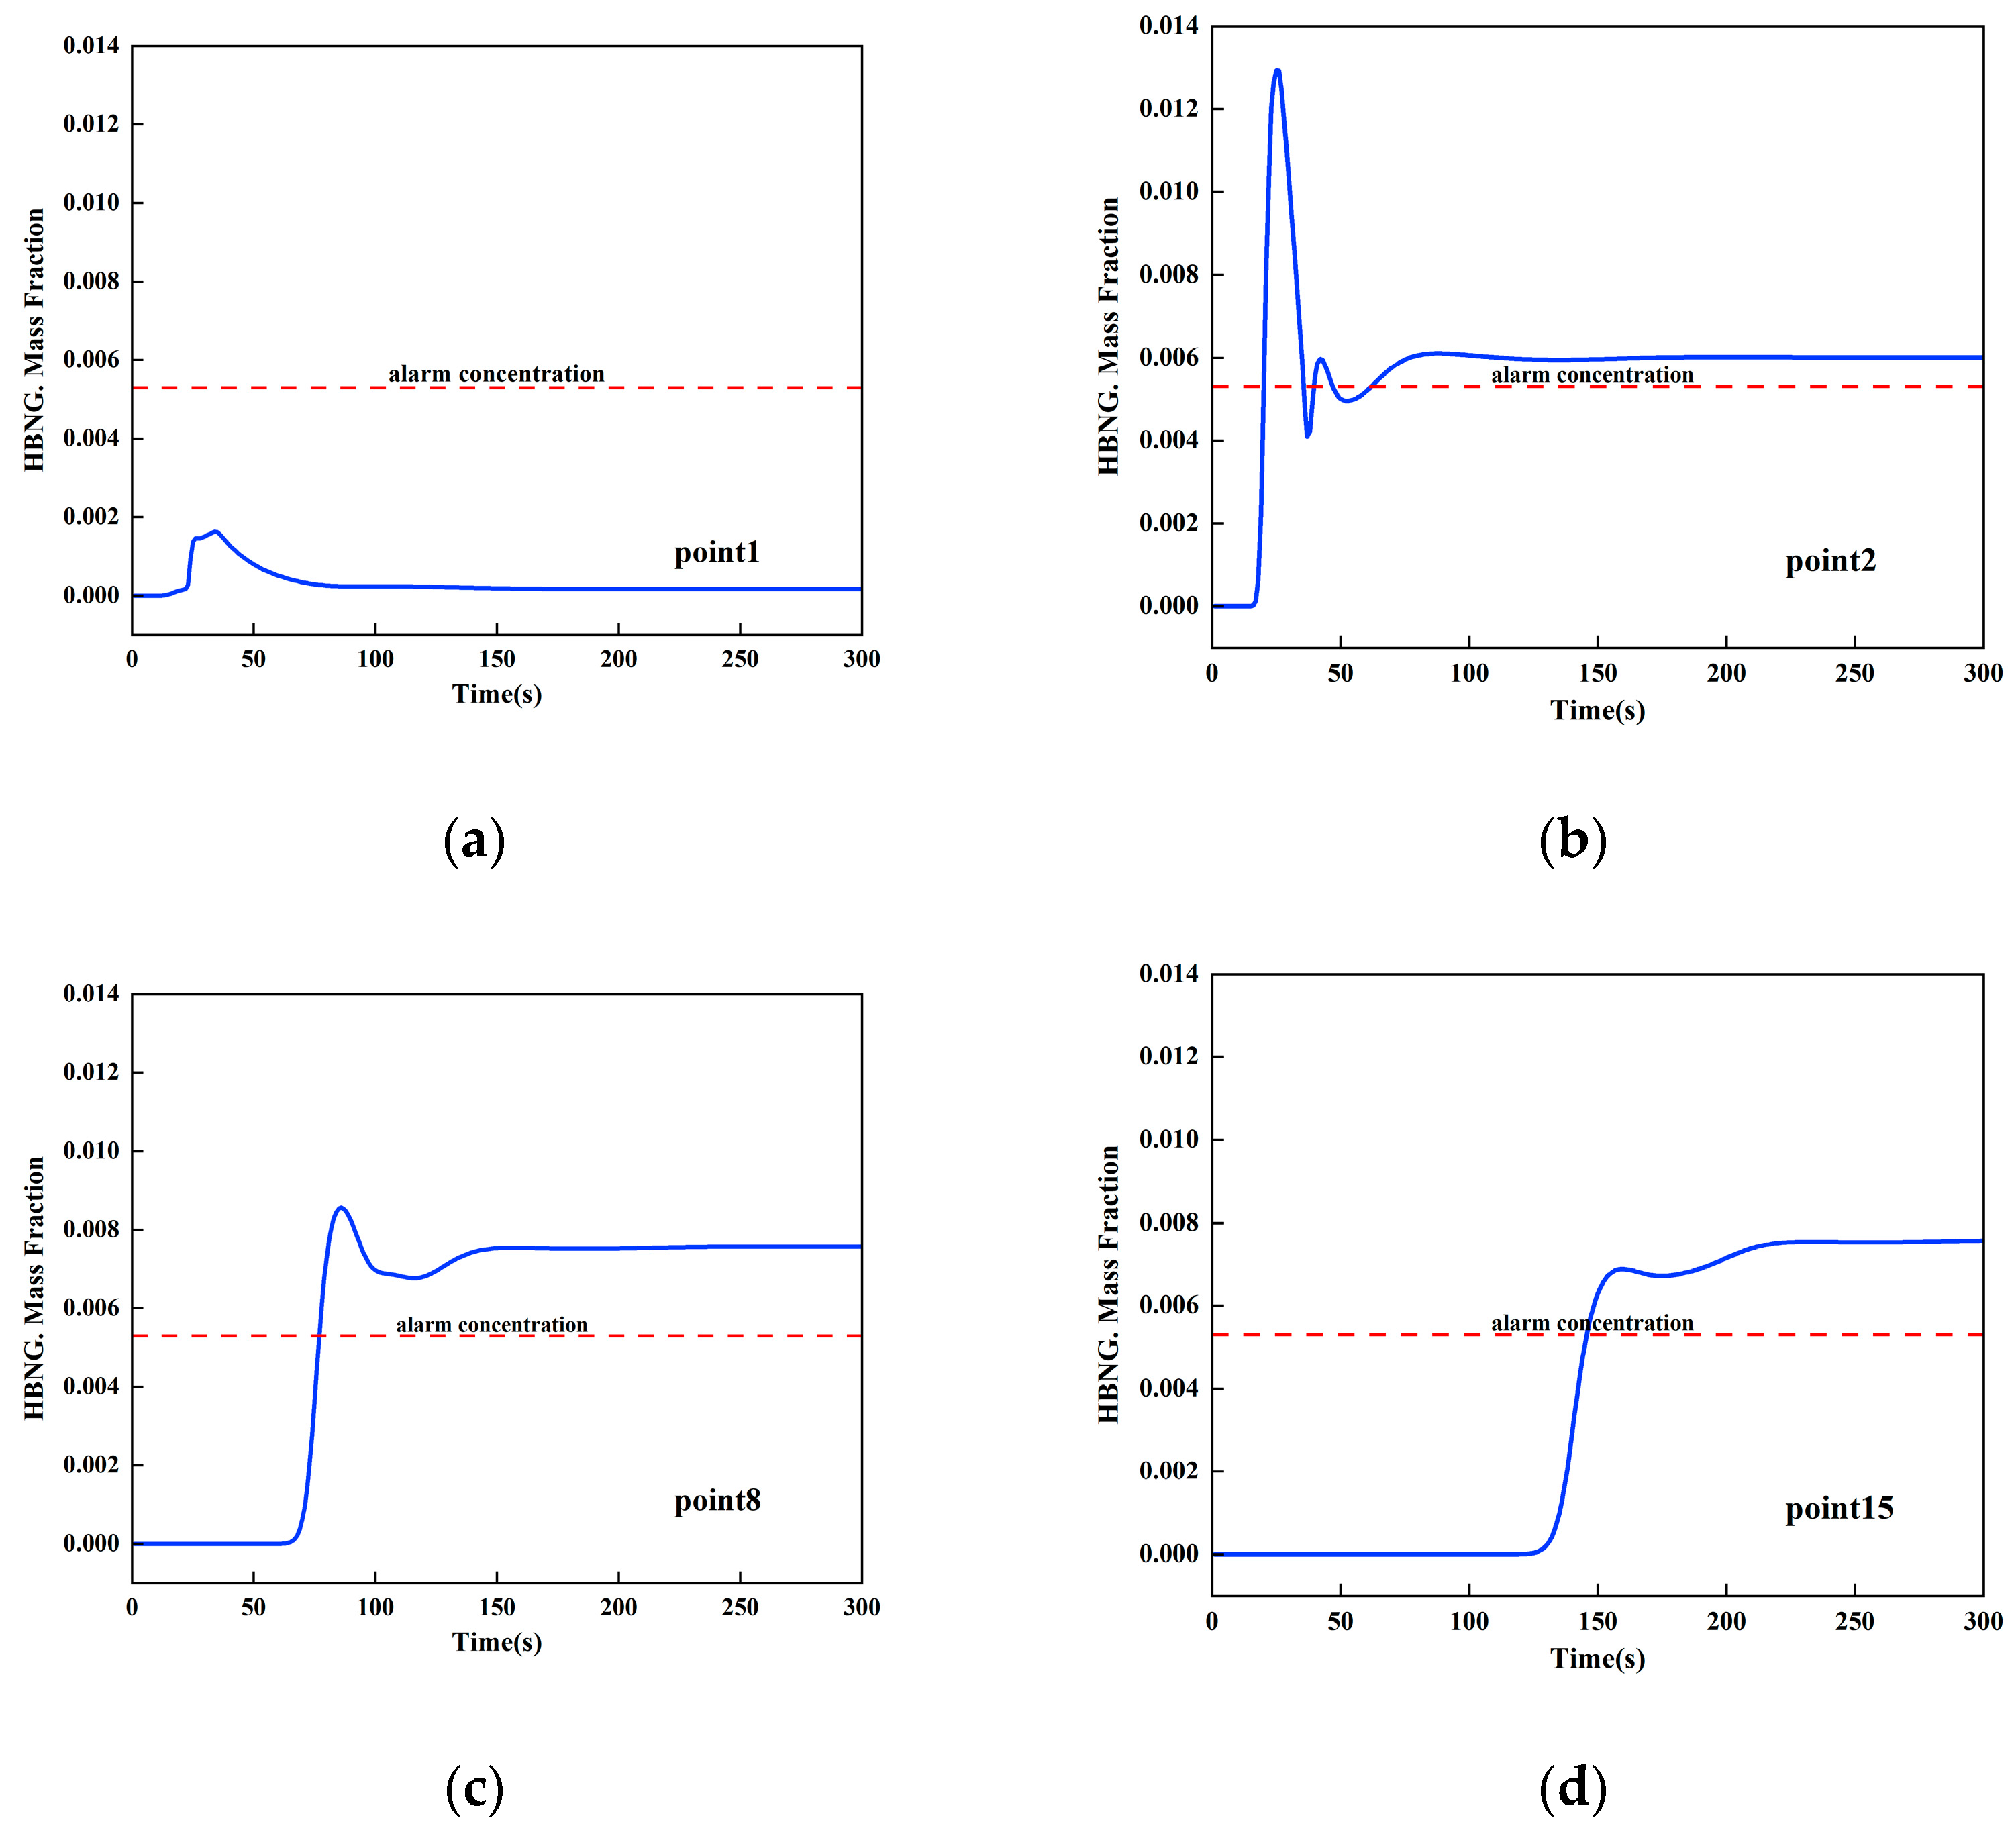
3.3.1. Determination of the Most Unfavorable Leakage Conditions

The results of this study of the leakage characteristics of HBNG pipelines in natural gas compartments under usually ventilated conditions show that the risk of explosion in gas leakage accidents increases accordingly as the hydrogen content increases. In addition, the increase in delivery pressure and the enlargement of the leak aperture will also increase the diffusion rate over the aggression distance. It is noteworthy that the leakage holes close to the air supply opening may cause the natural gas concentration to exceed the alarm value in most areas of the natural gas compartment. Therefore, it is of great significance to explore the ventilation strategy for small-hole leakage accidents of gas with an HBR of 20% in the 1.6 MPa gas pipeline with larger leak hole diameters. The most unfavorable leakage condition set in this study is a gas with an HBR of 20%, a pipeline pressure of p = 1.6 MPa, a leakage hole diameter of d = 6 mm, and a leakage hole location of X = 99.5.

3.3.2. Minimal Accident Ventilation Strategy for Sub-High Pressure HBNG Pipelines under Most Unfavorable Working Conditions

In the most unfavorable leakage conditions, when the pipe pressure is 0.4 MPa, monitoring point 2 reaches the alarm concentration of CH4 at 21 s before monitoring point 1 due to the turbulence effect of the air supply outlet. At this time, pause the calculation and reset the boundary conditions, switch the boundary conditions of the air supply outlet from normal ventilation (6 times/h) to the minimum accidental ventilation (12 times/h) stipulated in [14], and set the air velocity of the air supply outlet to 2.66 m/s. Thus, the concentration profiles of HBNG at measurement points 1, 2, 8, and 15 are obtained, as shown in Figure 14. According to this figure, the concentration at the monitoring point downstream of the gas compartment ended up being approximately 0.00757 Kg/s, which is higher than the alarm concentration for 20% LEL. It is evident that the minimal number of accident ventilations mandated by the regulation (12 times/h) decreases the gas concentration in the cabin. However, this reduction is not significant enough to release the alert.
Following [14] that the accidental ventilation air velocity should not exceed 5 m/s, a variety of ventilation strategies (see Table 6 for details) were simulated and analyzed for the inlet ducts of different pressure level systems. According to Section 3.2.1, gas accumulates in the downstream area of the gas compartment as a result of the ventilating airflow, so the stabilized gas concentration at measurement point 15 is representative of the overall change in gas concentration in the gas compartment. Figure 15 depicts the variations in concentration at measurement point 15 under varied pressure levels and accident ventilation procedures. Under pressures of 0.4 MPa and 0.8 MPa, with HBR of 20%, the accident ventilation would be reconciled to 15 times/h and 21 times/h, respectively. Once the alarm risk has been eliminated and evaluated, repair methods, such as implementing patching under pressure, can be carried out. For gas pipelines with a pressure of 1.6 MPa, an accident ventilation air velocity of 5 m/s makes it challenging to detect and respond to alarm risks. When the concentration of gas reaches 25% of the LEL, it is recommended to initiate cut-off and venting procedures.

4. Conclusions

This study aims to examine the behavior of HBNG leakage in a pipeline compartment within utility tunnels and to analyze its leakage patterns under various ventilation conditions through simulation analysis. This study’s findings reveal the most unfavorable working conditions associated with gas pipeline leakage from small holes and further investigate the accidental ventilation of sub-high-pressure gas pipelines under these conditions.
This study demonstrated an increase in gas diffusion capacity with higher levels of HBR. In a mechanically ventilated setting, the ventilation airflow has a significant impact on gas diffusion. Insufficient wind speed could result in the buildup of gas downstream of the gas compartment, thereby posing a risk to pipeline safety. Furthermore, the calibration method for catalytic combustion-type combustible gas detectors in the pipeline corridor can continue to be used for methane even after the incorporation of hydrogen blending. It is advisable to install additional diversion facilities in the ventilation dead space of the gas compartment to improve safety measures.
This study also indicated that the conditions least conducive to gas leaks from small holes in pipelines included elevated pipeline pressures, larger diameters of the leak holes, increased hydrogen blending ratios, and the proximity of the leaks to air supply outlets. At pressure levels of 0.4 MPa and 0.8 MPa, it is recommended that the gas compartment be ventilated accidentally at a frequency of 15 times per hour and 21 times per hour, respectively. However, the maximum unintentional ventilation wind velocity of 5 m per second, as specified in [14], needs to be revised to ensure the safety of the 1.6 MPa gas pipeline. Therefore, it is recommended to install an accidental interlocking device to promptly shut off and release a high-pressure pipeline in the event of a leakage accident.

Author Contributions

Conceptualization, Z.X., B.G., L.W. and S.C.; Methodology, Z.X. and B.G.; Software, M.L.; Validation, X.J.; Investigation, X.J.; Data curation, B.G.; Writing—original draft, Z.X. and L.W. All authors have read and agreed to the published version of the manuscript.

Funding

This study was funded by the National Natural Science Foundation of China (No. 52104065), China Postdoctoral Science Foundation (No. 2022T150089), Natural Science Foundation of Heilongjiang Province of China (No. LH2021E019), China Postdoctoral Science Foundation (No. 2020M681064), Hei Long Jiang Postdoctoral Foundation (No. LBH-Z20101), National Natural Science Foundation of China (52074090), Scientific Research Personnel Training Foundation of Northeast Petroleum University (No. XNYXLY202103), and Northeast Petroleum University Scientific Research Foundation (No. 2019KQ54).

Institutional Review Board Statement

Not applicable.

Informed Consent Statement

Not applicable.

Data Availability Statement

The data that support the findings of this study are available upon reasonable request from the corresponding authors. The data are not publicly available due to privacy.

Conflicts of Interest

Author Zhe Xu was employed by the company Gas Technology Institute of Petrochina Kunlun Gas Co., Ltd. The remaining authors declare that the research was conducted in the absence of any commercial or financial relationships that could be construed as a potential conflict of interest.

References

  1. Fu, J.X.; Tang, G.H.; Zhao, R.J.; Hwang, W.S. Carbon Reduction Programs and Key Technologies in Global Steel Industry. J. Iron Steel Res. Int. 2014, 21, 275–281. [Google Scholar] [CrossRef]
  2. Shen, Y.J.; Su, Z.W.; Huang, G.H.; Khalid, F.; Farooq, M.B.; Akram, R. Firm market value relevance of carbon reduction targets, external carbon assurance and carbon communication. Carbon Manag. 2020, 11, 549–563. [Google Scholar] [CrossRef]
  3. Grigoriev, S.A.; Porembsky, V.I.; Fateev, V.N. Pure hydrogen production by PEM electrolysis for hydrogen energy. Int. J. Hydrogen Energy 2006, 31, 171–175. [Google Scholar] [CrossRef]
  4. Winter, C.J. Into the hydrogen energy economy–milestones. Int. J. Hydrogen Energy 2005, 30, 681–685. [Google Scholar] [CrossRef]
  5. Noh, H.; Kang, K.; Seo, Y. Environmental and energy efficiency assessments of offshore hydrogen supply chains utilizing compressed gaseous hydrogen, liquefied hydrogen, liquid organic hydrogen carriers and ammonia. Int. J. Hydrogen Energy 2023, 48, 7515–7532. [Google Scholar] [CrossRef]
  6. Yu, Y.W.; Chen, Y.; Jiang, J.H.; Li, Y.Z. Low-carbon scheduling of integrated hydrogen transport and energy system. Int. J. Hydrogen Energy 2024, 52, 655–666. [Google Scholar] [CrossRef]
  7. Mahajan, D.; Tan, K.; Venkatesh, T.; Kileti, P.; Clayton, C.R. Hydrogen Blending in Gas Pipeline Networks—A Review. Energies 2022, 15, 3582. [Google Scholar] [CrossRef]
  8. Nederlandse Gasunie, N.V. Using the Existing Natural Gas System for Hydrogen; 2009. Available online: https://www.fwg-gross-bieberau.de/fileadmin/user_upload/Erneuerbare_Energie/Naturalhy_Brochure.pdf (accessed on 12 February 2024).
  9. Kippers, M.J.; De Laat, J.C.; Hermkens, R.J.; Overdiep, J.J.; Van Der Molen, A.; Van Erp, W.C.; Van Der Meer, A. Pilot project on hydrogen injection in natural gas on island of Ameland in the Netherlands. Int. Gas Res. Conf. 2011, 2, 1163–1177. Available online: http://members.igu.org/old/IGU%20Events/igrc/igrc2011/igrc-2011-proceedings-and-presentations/poster%20paper-session%201/P1-34_Mathijs%20Kippers.pdf (accessed on 15 February 2024).
  10. Melaina, M.W.; Antonia, O.; Penev, M. Blending Hydrogen into Natural Gas Pipeline Networks: A Review of Key Issues; National Renewable Energy Laboratory: Golden, CO, USA, 2013.
  11. Networks, N.G. H21 Leeds City Gate. Available online: https://www.h2knowledgecentre.com/content/project1017 (accessed on 15 February 2024).
  12. Zhou, H.G. The First Case in China! The First Phase of the HCNG Demonstration Project by the State Power Investment Corporation Limited Was Successfully Completed. Available online: http://news.bjx.com.cn/html/20191015/1013148.shtml (accessed on 15 February 2024).
  13. Shenzhen State-Owned Assets Supervision and Administration Commission. Shenzhen Built the Country’s First Town Gas Hydrogen Doping Integrated Science and Technology Experimental Platform. Available online: https://www.sz.gov.cn/cn/xxgk/zfxxgj/bmdt/content/post_11103389.html (accessed on 15 February 2024).
  14. GB 50838-2015; Technical Code for Urban Utility Tunnel Engineering. Ministry of Housing and Urabn-Rural Development of the People’s Republic of China: Beijing, China, 2015.
  15. GB 50028-2006; Code for Design of City Gas Engineering. North China Municipal Engineering Design & Research Institute: Beijing, China, 2006.
  16. Wang, X.M.; Tan, Y.F.; Zhang, T.T.; Zhang, J.D.; Yu, K.C. Diffusion process simulation and ventilation strategy for small-hole natural gas leakage in utility tunnels. Tunn. Undergr. Space Technol. 2020, 97, 17. [Google Scholar] [CrossRef]
  17. Bu, F.X.; Liu, Y.; Wang, Z.X.; Xu, Z.; Chen, S.Q.; Hao, G.W.; Guan, B. Analysis of natural gas leakage diffusion characteristics and prediction of invasion distance in utility tunnels. J. Nat. Gas Sci. Eng. 2021, 96, 19. [Google Scholar] [CrossRef]
  18. Bai, Y.P.; Wu, J.S.; Yuan, S.Q.; Reniers, G.; Yang, M.; Cai, J.T. Dynamic resilience assessment and emergency strategy optimization of natural gas compartments in utility tunnels. Process Saf. Environ. Protect. 2022, 165, 114–125. [Google Scholar] [CrossRef]
  19. Zhao, Y.M.; Wu, J.S.; Zhou, R.; Cai, J.T.; Bai, Y.P.; Pang, L. Effects of the length and pressure relief conditions on propagation characteristics of natural gas explosion in utility tunnels. J. Loss Prev. Process Ind. 2022, 75, 10. [Google Scholar] [CrossRef]
  20. Li, M.H.; Chen, S.Q.; Jiang, W.D.; Li, Y.C.; Xu, Z.; Guan, B.; Wang, X.W.; Lin, X.Q.; Liu, T.Q. Numerical Simulation Analysis of the Hydrogen-Blended Natural Gas Leakage and Ventilation Processes in a Domestic House. ACS Omega 2023, 8, 34610–34628. [Google Scholar] [CrossRef] [PubMed]
  21. Zhang, H.; Li, J.F.; Su, Y.; Wang, P.; Yu, B. Effects of hydrogen blending on hydraulic and thermal characteristics of natural gas pipeline and pipe network. Oil Gas Sci. Technol. 2021, 76, 15. [Google Scholar] [CrossRef]
  22. CJJ/T 146-2011; Technical Specification for Urban Gas Alarm Control System. China City Gas Association: Beijing, China, 2011.
  23. Launder, B.E. Current Capabilities for Modeling Turbulence in Industrial Flows. Appl. Sci. Res. 1991, 48, 247–269. [Google Scholar] [CrossRef]
  24. Lu, H.F.; Huang, K.; Fu, L.D.; Zhang, Z.H.; Wu, S.J.; Lyu, Y.; Zhang, X.L. Study on leakage and ventilation scheme of gas pipeline in tunnel. J. Nat. Gas Sci. Eng. 2018, 53, 347–358. [Google Scholar] [CrossRef]
  25. GB/T 50493-2019; Standard for Design of Combustible Gas and Toxic Gas Detection and Alarm for Petrochemical Industry. National Standard of the People’s Republic of China: Beijing, China, 2009.
  26. Kondo, S.; Takizawa, K.; Takahashi, A.; Tokuhashi, K.; Sekiya, A. A study on flammability limits of fuel mixtures. J. Hazard. Mater. 2008, 155, 440–448. [Google Scholar] [CrossRef] [PubMed]
  27. Liu, X.X. Experimental and Numerical Research on Gas Leak and Diffusion in the Utility Tunnel. Master’s Thesis, Beijing Architecture University, Beijing, China, 2018. [Google Scholar]
  28. Hasheminasab, F.; Bagherpour, R.; Aminossadati, S.M. Numerical simulation of methane distribution in development zones of underground coal mines equipped with auxiliary ventilation. Tunn. Undergr. Space Technol. 2019, 89, 68–77. [Google Scholar] [CrossRef]
  29. Zhang, P. Study on Gas Leakage and Diffusion Law in Underground Utility Tunnel and Risk Assessment Method of Its Ventilation System; Beijing Jiaotong University: Beijing, China, 2021. [Google Scholar]
Figure 1. Physical model of the natural gas compartment.
Applsci 14 02667 g001
Figure 2. The meshing and local encryption.
Applsci 14 02667 g002
Figure 3. Independence test of mesh number (a) test point (7.5, 1.9), (b) test point (10, 1.8).
Applsci 14 02667 g003
Figure 4. Comparison of simulated and experimental values: experimental sampling point (a) No. 6 and (b) No. 9.
Applsci 14 02667 g004
Figure 5. Natural ventilation natural gas compartments leakage concentration distribution of pure methane natural gas (HBR = 0%), (a) t = 6 s, (b) t = 30 s, (c) t = 150 s, (d) t = 360 s.
Applsci 14 02667 g005
Figure 6. Changes in monitoring line HBNG concentration over time. (a) t = 50 s, (b) t = 100 s, (c) t = 150 s, (d) t = 200 s, (e) t = 250 s, (f) t = 300 s.
Applsci 14 02667 g006
Figure 7. Normal ventilation natural gas compartments leakage concentration distribution of pure methane natural gas (HBR = 15%), (a) t = 10 s, (b) t = 50 s, (c) t = 150 s, (d) t = 380 s. Natural ventilation natural gas compartments leakage concentration distribution of pure methane natural gas (HBR = 0%), (a) t = 6 s, (b) t = 30 s, (c) t = 150 s, (d) t = 360 s.
Applsci 14 02667 g007
Figure 8. Distribution of leakage flow lines in the pipeline corridor under normal ventilation conditions for HBNG (HBR = 15%), (a) t = 10 s, (b) t = 50 s, (c) t = 150 s, (d) t = 380 s.
Applsci 14 02667 g008
Figure 9. Variation of gas concentration in HBNG (HBR = 15%) leakage with different leakage apertures, (a) t = 50 s, (b) t = 100 s, (c) t = 150 s, (d) t = 200 s.
Applsci 14 02667 g009
Figure 10. Variation of gas concentration in HBNG (HBR = 15%) leakage with different pipeline pressures, (a) t = 50 s, (b) t = 100 s, (c) t = 150 s, (d) t = 200 s.
Applsci 14 02667 g010
Figure 11. Variation of gas concentration in HBNG leakage with different HBR, (a) t = 50 s, (b) t = 100 s, (c) t = 150 s, (d) t = 200 s.
Applsci 14 02667 g011
Figure 12. The components hydrogen and methane in gas leaks with varying HBR at different monitoring points, (a) HBR = 5%, (b) HBR = 10%, (c) HBR = 15%, (d) HBR = 20%.
Applsci 14 02667 g012
Figure 13. Variation of gas concentration in HBNG leakage with different leakage location (a) x = −99.5, (b) x = −97.5, (c) x = −50, (d) x = 0, (e) x = 50, (f) x = 97.5, (g) x = 99.5.
Applsci 14 02667 g013
Figure 14. Change in gas concentration profiles at monitoring points for leakage from a 0.4 MPa HBNG pipeline under accident ventilation conditions, (a) point 1, (b) point 2, (c) point 8, (d) point 15.
Applsci 14 02667 g014
Figure 15. Changes in the amount of gas present at monitoring point 15 of a sub-pressure HBNG pipeline leakage for various accidental venting strategies and pressure classes, (a) p = 0.4 MPa, (b) p = 0.8 MPa, (c) p = 1.6 MPa.
Applsci 14 02667 g015
Table 1. The x-axis monitoring point distribution.
Serial Number123456789101112131415
X
Coordinate
−97.5−82.5−67.5−52.5−37.5−22.5−7.507.522.537.552.567.582.597.5
Table 2. The list of symbols.
SymbolTerminologyUnit
ρ Gas density kg / m 3
h Natural gas enthalpy value J / mol
p d i v U Surface forces perform work on a micro-unit J
λ Thermal conductivity W m 1 K 1
T Thermodynamic temperatures of micro-unit K
ϕ Energy dissipation function
E k Endothermic terms for micro-unit
μ Dynamic viscosity N s / m 2
F x , F y The force acting on the x y coordinate axes of the micro-unit N
Y i Pulsating expansion term for component i in compressible turbulence
J i Diffusive flux of component i
R i Chemical net source term for a substance i
X i Mole fraction of component i
D i j Diffusion coefficient m 2 / s
k Turbulent kinetic energy
ε Turbulent dissipation rate
μ t Turbulent viscosity
G k Turbulent kinetic energy from mean velocity gradient
Y M Dissipation rate from compressed turbulent dynamic expansion
S K , S ε Custom source items
C ε 1 , C ε 2 , C ε 3 , σ k , σ ε Model coefficients for turbulence equations
t Gas flow time s
P Absolute pressurePa
ς Mass fraction of component%
M a The relative molecular mass of air
M m The relative molecular mass of methane
L m Explosive limits of gas mixtures%
V H 2 Volume fraction of hydrogen in the gas mixture%
V C H 4 Volume fraction of methane in the gas mixture%
L H 2 Explosive limit of hydrogen%
L C H 4 Explosive limit of methane%
v Air velocitym/s
V Gas compartment volumem3
A Ventilation opening aream2
Table 3. Physical parameters of HBNG components [25].
Gas Type Densities   ( kg / m 3 )LEL (vol%)UEL (vol%)
CH40.66794.915
H20.08194.075.9
Table 4. Explosive Limits of HBNG components (mass fraction).
HBR (%)LELUEL
00.02790.0878
50.02750.0917
100.02720.0960
150.02680.1001
200.02650.1060
Table 5. Model boundary condition set.
Model BoundaryBoundary TypeSetting Parameters
air inletvelocity inletvelocity magnitude, species
leakage holemass-flow-inletmass flow rate, species
air outletpressure-outlet
wall, firewall, ceilingwall
fluid domaininterior
Table 6. The air velocity at the air supply outlet for various ventilation strategies.
Ventilation
Strategies
6 Times/h12 Times/h15 Times/h18 Times/h21 Times/h22 Times/h
air velocity1.33 m/s2.66 m/s3.325 m/s3.99 m/s4.655 m/s4.87 m/s
The unit time/h indicates air changes per hour.
Table 7. Leakage hole HBNG mass flow rate.
Pipeline Pressure (MPa)Leakage Hole
Diameter (mm)
Mass Flow Rate (kg/s)
0.440.0106
50.0166
60.0239
0.850.0298
1.650.0563
Table 8. The initial gauge pressure.
Pipeline Pressure (MPa)Initial Gauge Pressure (MPa)
0.40.274
0.80.493
1.60.932
Table 9. Working conditions of numerical simulation.
CasePipeline
Pressure (MPa)
Leakage Hole
Diameter (mm)
Leak Hole
Location
HBR (%)
Case10.45X = 00
Case20.45X = 05
Case30.45X = 010
Case40.45X = 015
Case50.45X = 020
Case60.44X = 015
Case70.46X = 015
Case80.85X = 015
Case91.65X = 015
Case100.45X = −5015
Case110.45X = −97.515
Case120.45X = −99.515
Case130.45X = 5015
Case140.45X = 97.515
Case150.45X = 99.515
Disclaimer/Publisher’s Note: The statements, opinions and data contained in all publications are solely those of the individual author(s) and contributor(s) and not of MDPI and/or the editor(s). MDPI and/or the editor(s) disclaim responsibility for any injury to people or property resulting from any ideas, methods, instructions or products referred to in the content.

