Article

Detection of Safety Signs Using Computer Vision Based on Deep Learning

College of Safety Science and Technology, Xi’an University of Science and Technology, Xi’an 710054, China
*
Author to whom correspondence should be addressed.
Appl. Sci. 2024, 14(6), 2556; https://doi.org/10.3390/app14062556
Submission received: 17 February 2024 / Revised: 6 March 2024 / Accepted: 10 March 2024 / Published: 19 March 2024

Abstract

:
Safety signs serve as an important information carrier for safety standards and rule constraints. Detecting safety signs in mines is essential for automatically early warning of unsafe behaviors and the wearing of protective equipment while using computer vision techniques to realize advanced safety in the AI and IoT era. This work aims to propose an improved YOLOV4-tiny safety signs detection model applying deep learning to detect safety signs in mines. The dataset employed in this study was derived from coal mines and analogous environments, comprising a total of ten types of safety signs. It was partitioned into training, validation, and test sets following a distribution ratio of (training set + validation set) to test set = 9:1, with the training set to validation set ratio also set at 9:1. Then the attention mechanism ECANet was introduced into the model, which strengthened the network’s learning of places that need attention. Moreover, the Soft-NMS algorithm was used to retain more correct prediction frames and optimize the detection model to further improve the detection accuracy. The Focal Loss function was introduced to alleviate the problem of category imbalance in one-stage safety signs detection. Experimental results indicate that the proposed model achieved a detection precision of 97.76%, which is 7.55% and 9.23% higher than the YOLOV4-tiny and Faster RCNN algorithms, respectively. Besides, the model performed better in the generalization because it avoided the over-fitting phenomenon that occurred in the YOLOV4-tiny and the Faster RCNN. Moreover, the advantages of the improved model were more prominent when detecting small target areas and targets under dim conditions in coal mines. This work is beneficial for the intelligent early warning system with surveillance cameras in coal mines.

1. Introduction

With the progress of artificial intelligence (AI) technology, computer vision (CV) has made great achievements and tends to be widely used in the coal mine safety field. Recent advances in CV could help effectively solve coal mine safety problems, such as fire detection [1], safety protection equipment detection [2], and early warning systems [3]. However, research on the development of CV technologies for coal mine safety issues is still very rare [4,5,6,7,8,9]. Object detection is an important topic in the CV field, which can serve as an effective tool for, e.g., AI-based safety supervision and early warning systems; for example, the detection of safety signs and hazardous materials could help to automatically supervise unsafe behaviors and hazardous materials in coal mines.
A variety of image detection approaches have been proposed based on image color, shape, and machine learning. Machine learning algorithms aim to mine hidden rules from large amounts of data and use them for prediction or classification [10]. Deep learning is an important branch of machine learning. It is a new intelligent algorithm of supervised learning that has been proposed in recent years [11,12,13]. Its deep network has strong learning ability and can learn deeper features. Among many deep neural networks, convolutional neural network (CNN) is the first deep learning technology applied in the field of image recognition, which replaces the traditional artificial feature extraction and greatly improves the accuracy of recognition. Therefore, CNN facilitates deep learning for the recognition and detection of images.
Most of the current research in object detection focuses on traffic sign recognition [14,15], medical image detection [16], and intelligent agriculture [17]. Zuo et al. [18] used the Faster-RCNN method to detect traffic signs. The experimental results show that Faster-RCNN can indeed be applied to this field. Gaur et al. [19] used CNN to distinguish normal people from people affected by viral pneumonia, which showed CV can achieve effective detection in medicine. Li et al. [20] proposed an algorithm based on Faster-RCNN to detect small pests on images with different pest densities and light reflections, providing technical references for pest monitoring and population estimation. The literature review reveals that while target detection can identify and locate objects, its application within computer vision remains constrained. A significant shortfall exists in the domain of safety sign detection, with a notable absence of algorithmic models tailored to this specific need in current research. The development of models capable of classifying and accurately locating various types of safety signs would establish a critical foundation. Such advancements could facilitate future endeavors to detect the use of helmets, protective masks, and gloves among workers, prompting adherence to relevant rules and regulations. Implementing these measures would enhance safety protocols and more effectively mitigate the incidence of workplace accidents. This paper aims to demonstrate the applicability and improve the performance (detection speed and accuracy) of object detection in the coal mines’ safety science field, focusing on the detection of safety signs due to carrying out safety restraints, regulations, and rules. The main contributions of this paper are summarized as follows:
(I).
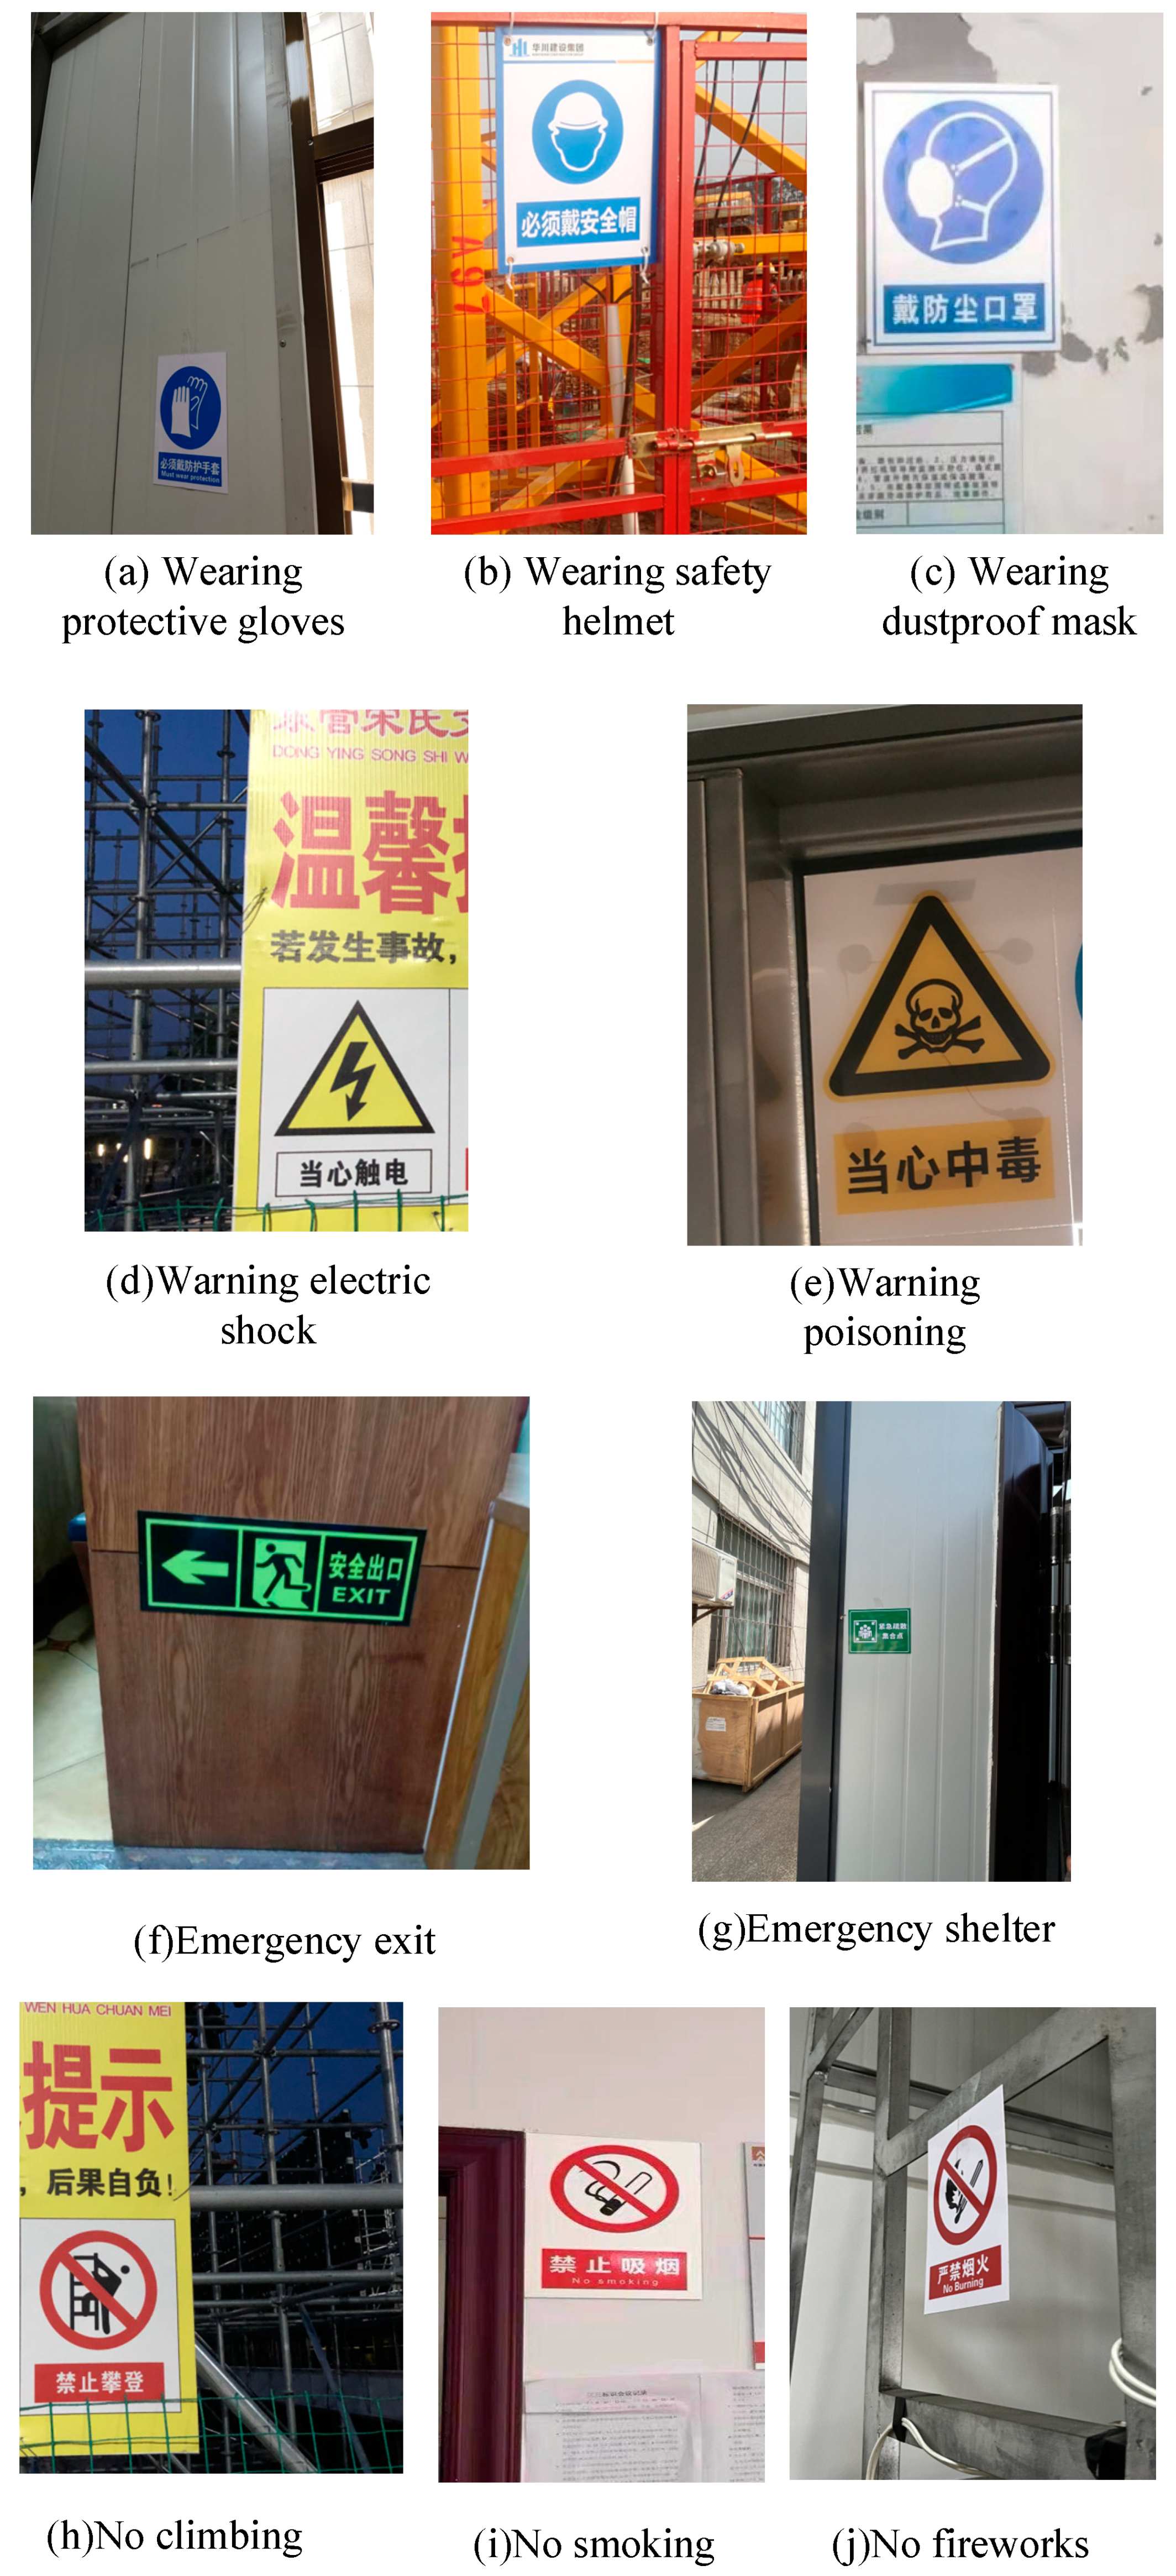
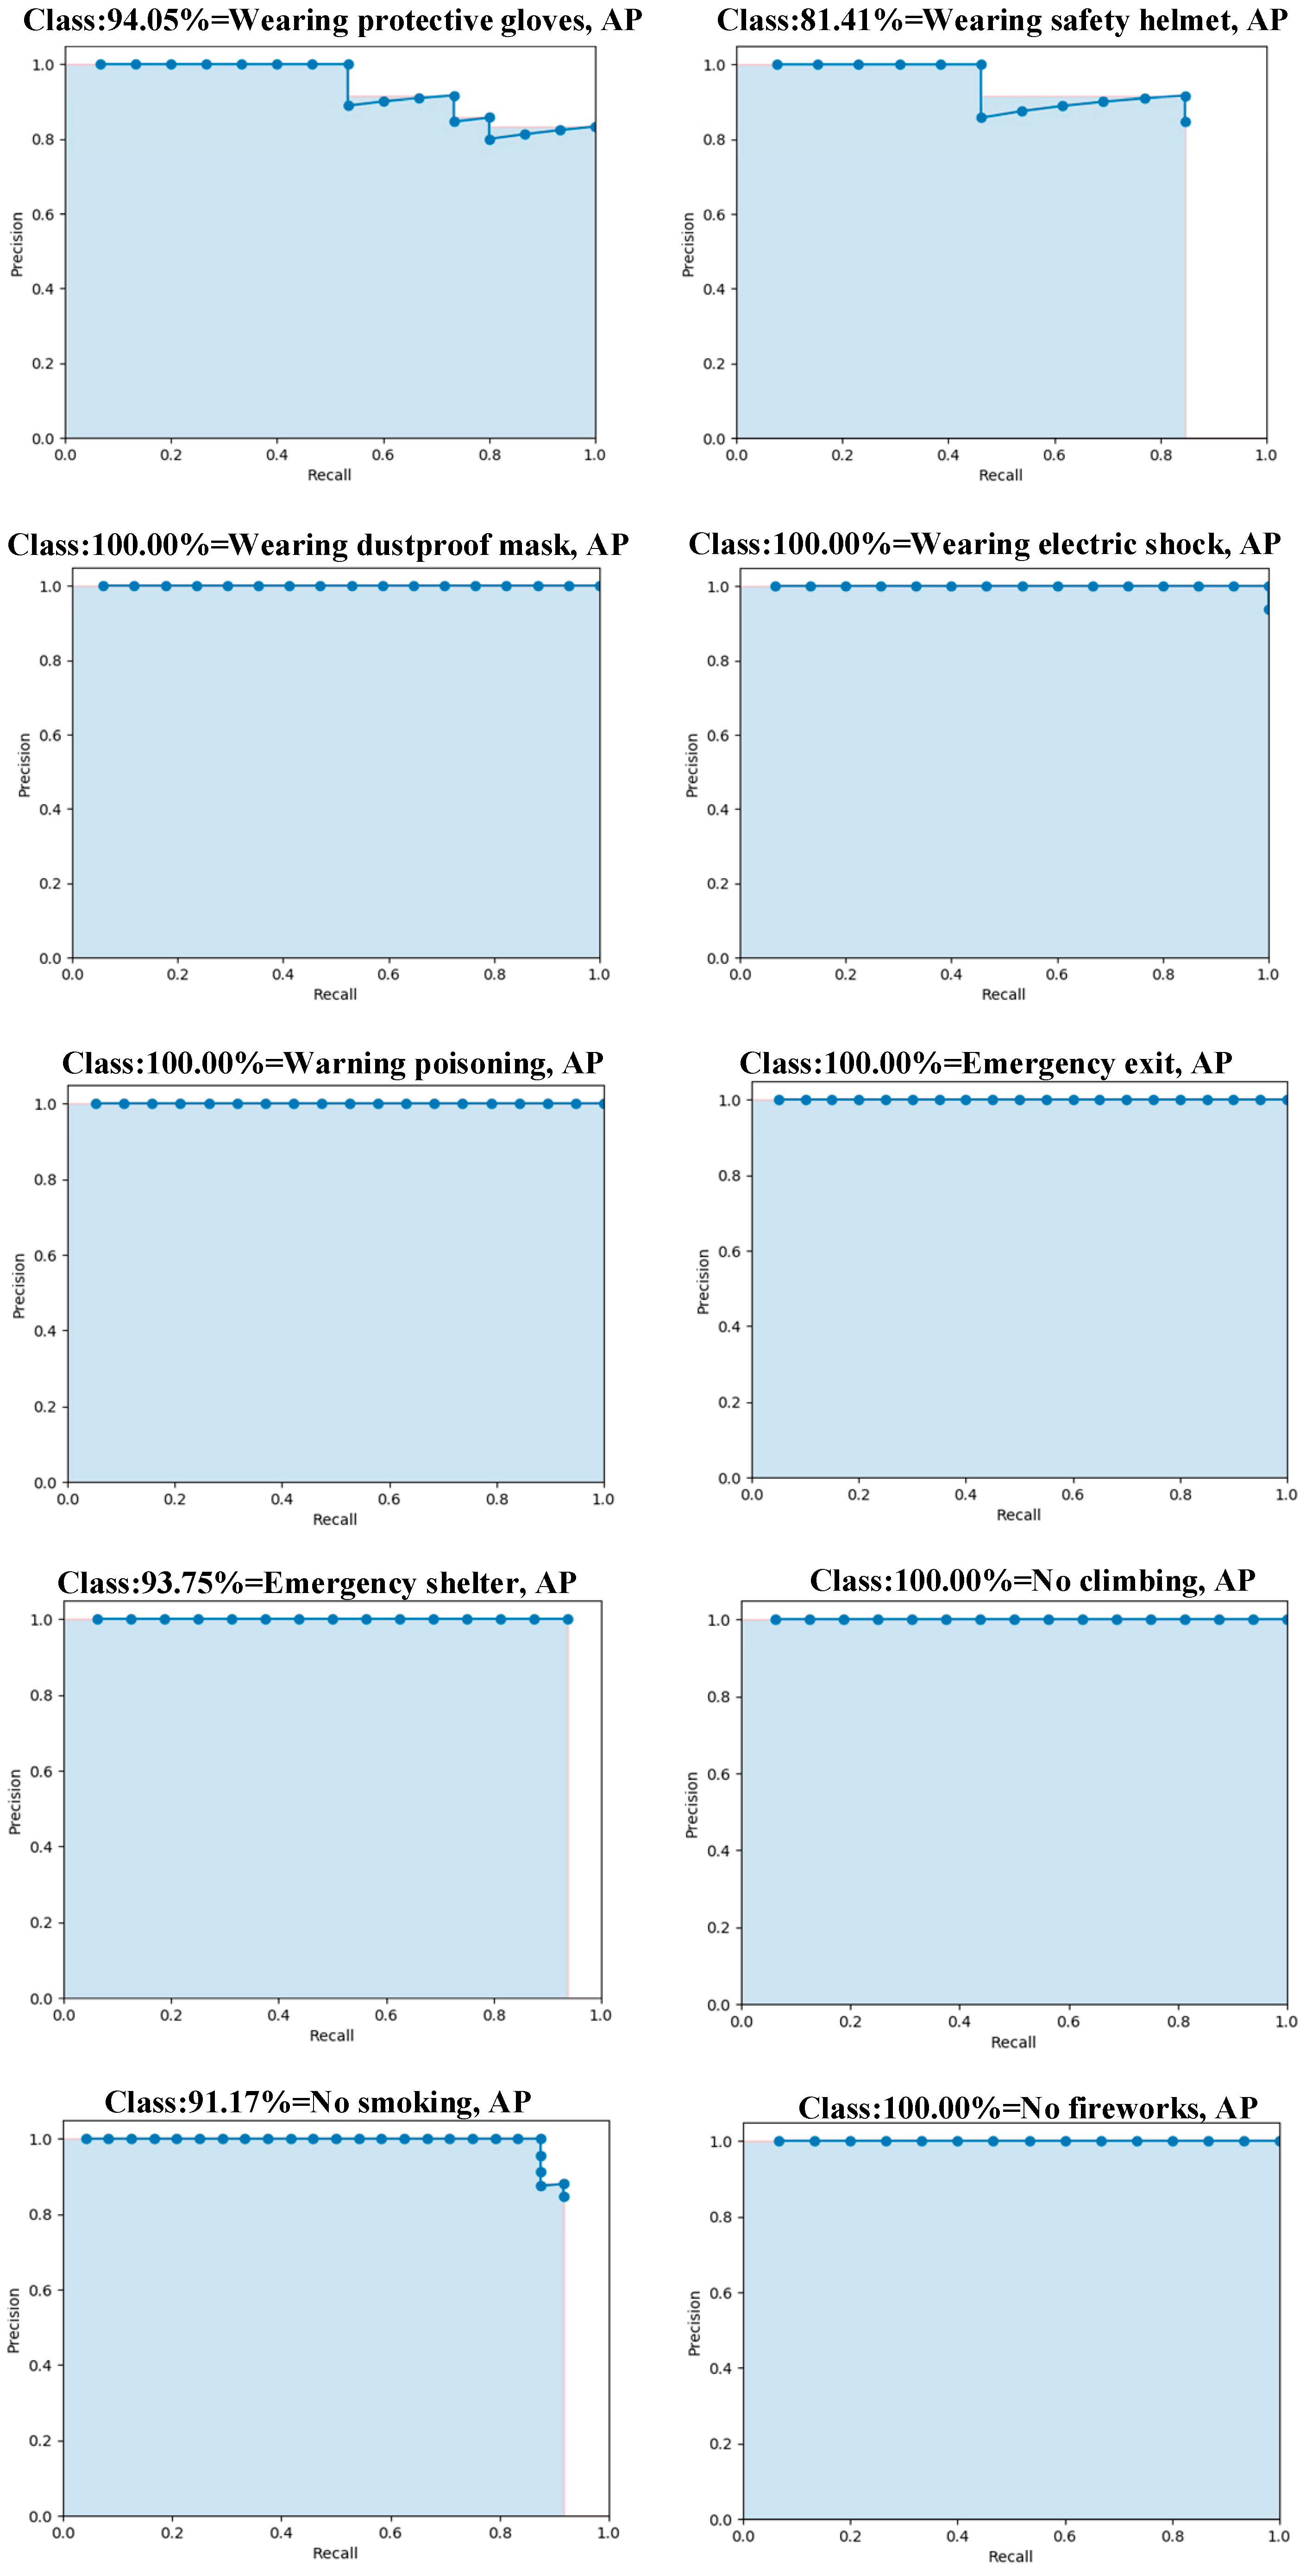
The safety sign image dataset contained 2000 images with 10 categories: wearing protective gloves, wearing a safety helmet, wearing electric shock, warning electric shock, waring poisoning, emergency exit, emergency shelter, no climbing, no smoking, and no fireworks.
(II).
Attention mechanisms were introduced to make the network focus on important information and reduce the influence of useless information.
(III).
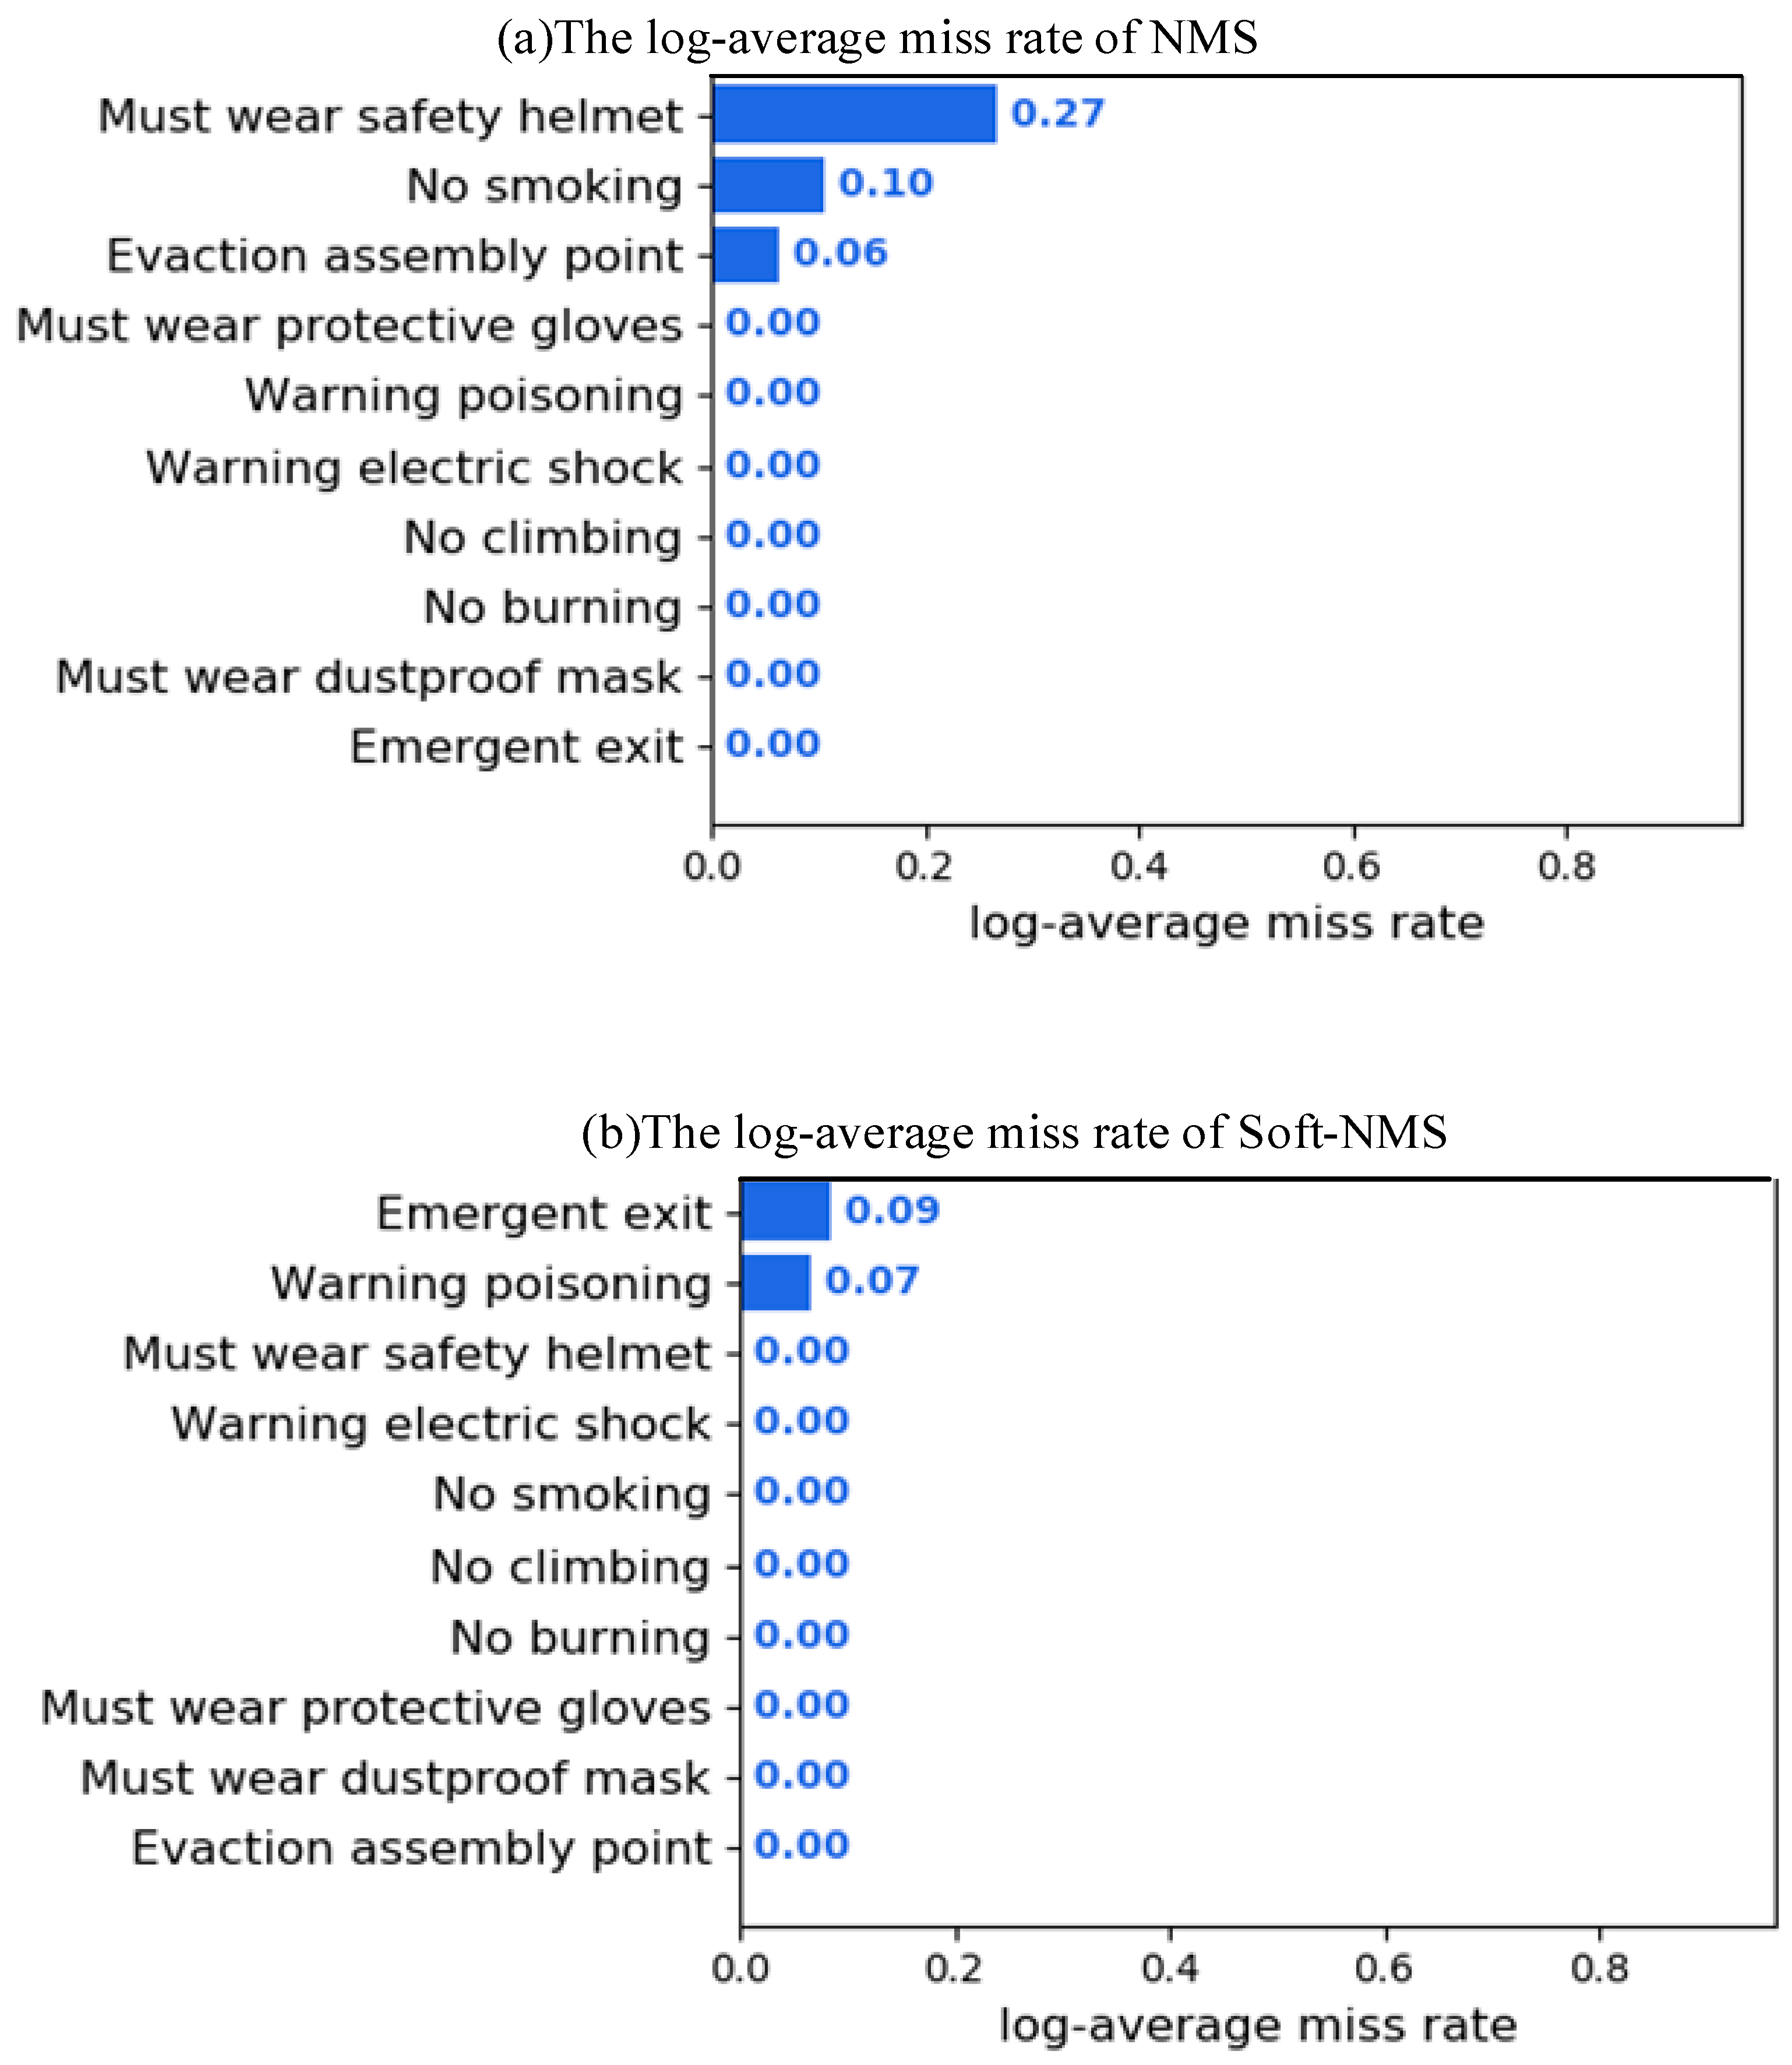
The Soft-Non Maximum Suppression (Soft-NMS) algorithm was used to replace the traditional NMS algorithm so that more correct prediction boxes can be retained and thus further optimize the detection model.
(IV).
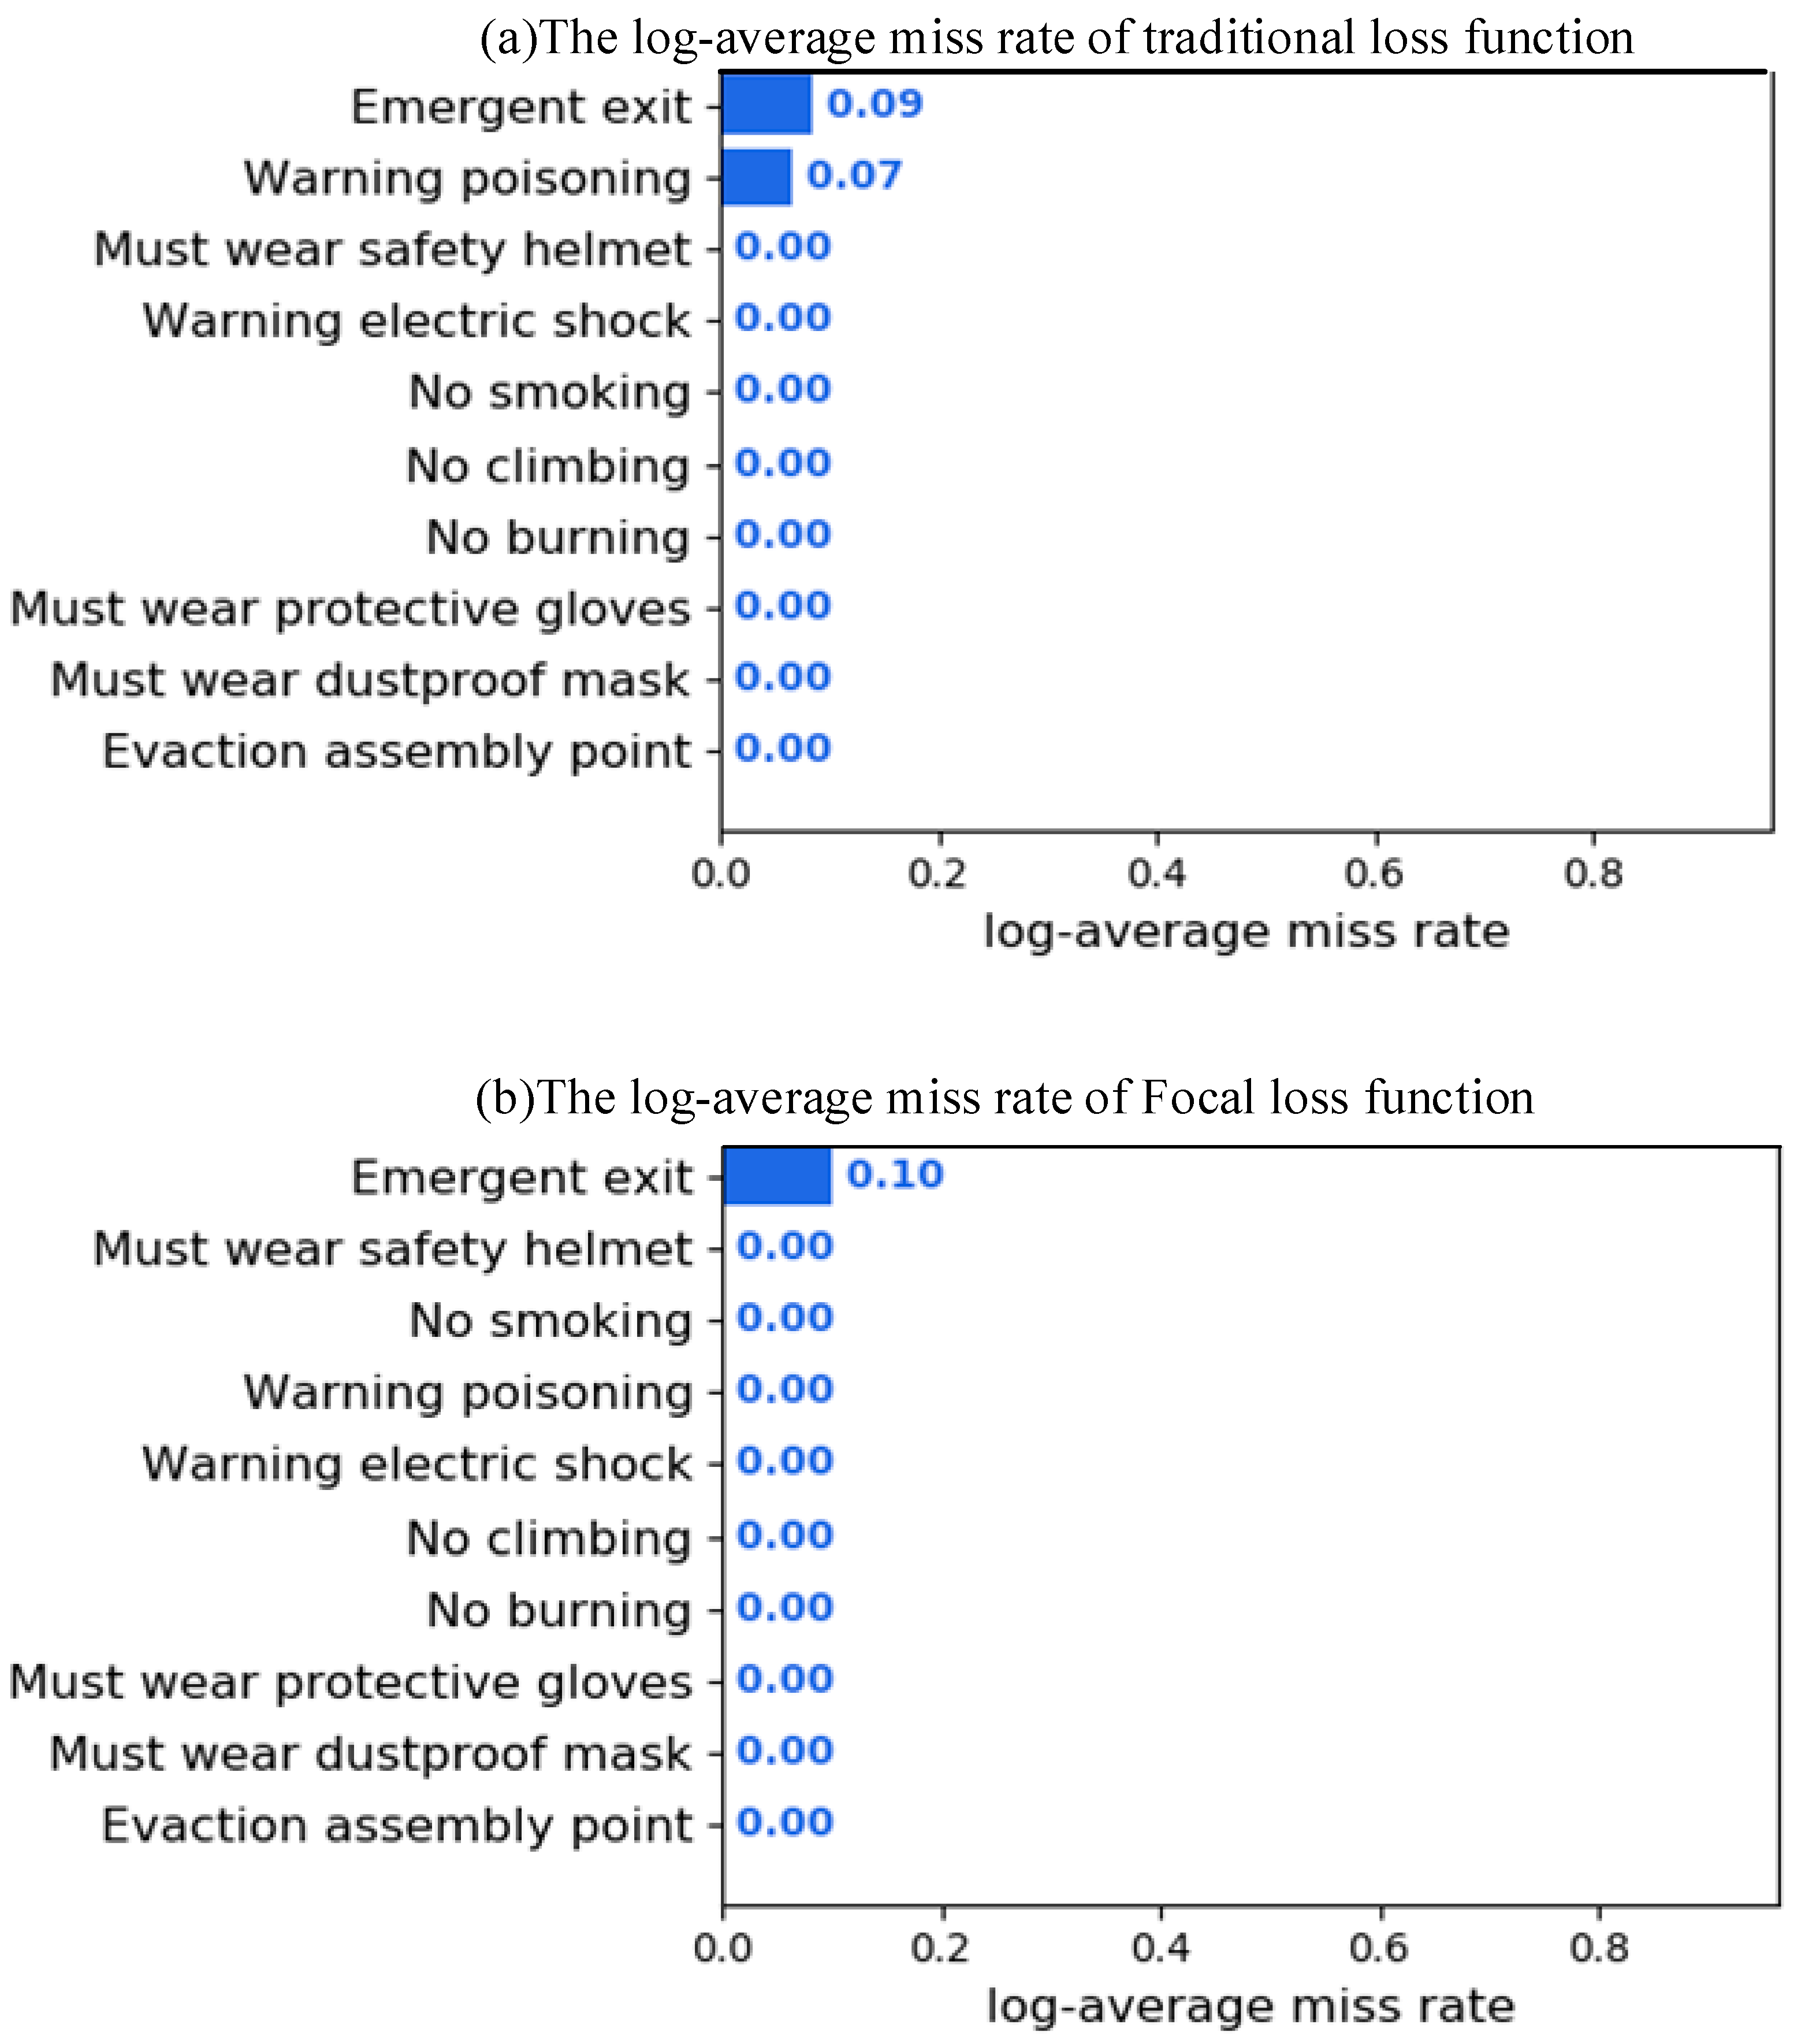
Since YOLOV4-tiny is a one-stage detection model, it lacks the first-step selection of prediction box samples in multi-stage detection. Focal Loss was proposed to suppress the loss function value of the well-classified sample box. At the same time, the sample box with poor classification was not suppressed, thereby alleviating the problem of category imbalance in one-stage object detection.

2. Related Works

2.1. Related Research of Computer Vision

Nowadays, the supervision of mines and some coal mines still relies on manual inspection and assessment, although electronic technology such as camera monitoring equipment has been added to the traditional model to achieve the goal of replacing manual safety inspections. In general, the safety control at coal mines is not automated and visualized enough, so some scholars have turned their attention to information, digital, and intelligent safety management. The progress in the field of machine learning and computer vision-based technology means that there is a new research interest in automatic detection methods and early warning systems in the safety field [21]. Computer vision is the science of how to use machines to “see” by processing captured images or videos to obtain three-dimensional information of the corresponding scene. With the development of sensor technology and the introduction of intelligent coal mines, the application areas of computer vision are gradually becoming more widespread. In recent years, many researchers and scholars have introduced computer vision technology in the field of safety to achieve intelligent management of personnel, machinery, and materials in the workplace in order to reduce the occurrence of safety accidents and maximize safety intelligence. For the detection of workers in coal mines, a method is proposed to detect and track the position of modeled, moving objects in real time based on data obtained from video cameras [22]. Cheng et al. [23] collected and processed the location data of workers and mine equipment in real-time through visual detection technology and displayed the relevant safety and activity performance information to decision-makers in real-time and visually so as to realize the safety management of workers. Barro-Torres et al. [24] developed a new model of cyber-physical. The model enables real-time monitoring of the wearing of personal protective equipment by installing sensors on workers’ clothing, using RFID to detect the use of protective equipment by workers, and using Zigbee for network communication. However, these methods require specific and expensive hardware to obtain the original image. At the same time, it also requires a high level of cooperation among workers and takes into account factors such as physical health, personal privacy, and mine convenience. Therefore, with the development of computer hardware and the increase in computer processing speed, deep learning models have been developed, with CNN being the most widely used of the deep learning methods, which has been widely applied in a series of tasks such as image classification and object detection.
Image classification is a very important task in computer vision, which can recognize the objects in the image. AlexNet [25] is the first image classification model to be achieved commercially. It is designed with a dual-GPU design model in order to improve the running speed. It also adopts techniques such as local response normalization, dropout, and pooling with overlap to prevent network overfitting. The VGG network [26] was proposed in 2014 by the Department of Science Engineering of Oxford University and uses small-sized convolutions to reduce the number of parameters. Based on the AlexNet framework, the depth of the network layers has been broken. GoogLeNet [27] is a breakthrough deep network model proposed by Google, which uses convolution windows of different sizes to form the Inception module. In order to prevent the excessive training gradient loss after the deep network deepening and situations such as difficult network optimization and slower training, ResNet [28] allows the network to be made very deep by connecting a high-speed channel between the output and input so that shallow features can be passed on.
Object detection is fundamental to computer vision because it aims to recognize the semantic features of objects and the positions contained in images. The object detection algorithms based on deep convolutional neural networks can be divided into two categories according to detection steps: one is the two-stage object detection algorithm based on candidate regions, and the other is the one-stage object detection algorithm based on regression. The two-stage object detection algorithm first selects the candidate regions of the image, then regression localization and classification of the possible targets in the candidate area, so that the overall detection process is divided into two stages, representative algorithms such as the RCNN series. One-stage object detection algorithms do not select candidate regions separately, omit the candidate region generation step, and integrate feature extraction, object classification, and position regression into one stage, representing algorithms such as YOLO series, SSD series, etc. In 2014, Girshick et al. [29] proposed the RCNN model, which firstly extracts approximately 2000 candidate regions using the selective search method [30], secondly obtains the feature map corresponding to each candidate region by convolutional neural networks, and finally classifies the features using support vector machine to distinguish the targets. In 2014, He et al. [31] proposed the Spatial Pyramid Pooling Network (SPPNet), which performs feature extraction only once for object detection and uses the SPP layer to adjust the size of the feature map for subsequent detection, avoiding multiple calculations of convolutional features. In 2015, Girshick [32] proposed the Fast RCNN model, which improved accuracy by about 12% over the RCNN model on the dataset PASCAL VOC2007 while improving detection speed by about 200 times. Soon after the Fast RCNN model was proposed, Ren et al. [33] proposed the first end-to-end object detection model, Faster RCNN. Faster RCNN uses the regional candidate network to greatly reduce the calculation of extracting candidate regions. In 2016, Joseph et al. [34] proposed the first one-stage object detection algorithm, YOLO (You Only Look Once). The YOLO algorithm only needs to extract the feature of the input image once, so the calculation speed of this algorithm is very fast and achieves an average accuracy of over 60% on the dataset PASCAL VOC2007. Later, Joseph improved YOLO and proposed the YOLOV2 [35] algorithm, which improved detection speed and accuracy. In order to improve the detection accuracy of small targets, Liu et al. [36] proposed SSD (single-shot multi-box Detector) in 2016. Although the SSD is simple and fast, it still does not achieve the accuracy of the two-stage detection algorithm. To solve this problem, Lin et al. [37] proposed RetinaNet in 2017, improved the cross-entropy loss, and proposed the loss function, Focal Loss, to ensure a balanced distribution of positive and negative samples during the training process, making the algorithm reach the accuracy of two-stage detectors while maintaining a very fast detection speed.
With the development of computer vision technology, more and more fields are turning their attention to intelligence and information technology. Although some studies have attempted to use computer vision technology in the field of monitoring, very little studies have focused on public safety. In terms of safety, recent studies have used vision-based image classification and object detection to achieve various safety signs.

2.2. Computer Vision in Safety Applications

In recent years, many models for testing the wearing of safety helmets and other protective equipment have been proposed. However, very little research on safety signs detection. This section briefly introduces the application of two kinds of target detection algorithms in the safety field.
Yang et al. [38] proposed a CNN coal and rock identification method based on hyperspectral data. Because of the dangerous behavior of many workers without safety helmets, Chen et al. [39] proposed an improved Faster RCNN algorithm to detect the wearing of safety helmets, Retinex image enhancement technology was used to improve image quality, and the K-means++ algorithm was used to better adapt to small safety helmets, the average accuracy of the improved algorithm was increased by 8.1%, effectively overcoming the interference of light, distance, and other factors. Wang et al. [40] proposed a method for automatic helmet detection based on the YOLOV3 deep neural network, CSPNet was used to replace the Darknet53 backbone network, SPP structure was added, and a top-down feature fusion strategy was implemented to improve the multi-scale prediction network to achieve feature enhancement. The detection speed was improved by 28% over the original YOLOV3, and the speed was increased by 6 fps. In 2020, Bochkovskiy et al. [41] proposed a YOLOV4 object detection network. Liu et al. [42] effectively distinguished between helmet wearers and non-wearers and achieved real-time detection of helmet-wearing. Although the application of the unimproved YOLOV4 model has a good detection effect, it is not improved for specific cases. One of the critical issues was poor performance and weak robustness for object detection tasks. Deng et al. [43] proposed a helmet detection method based on the improved YOLOV4; the K-means algorithm was used to cluster the dataset to obtain more targeted edge information, and the multi-scale training strategy was also used to improve the adaptability of the model to different scale detection. After the model was improved, the detection accuracy and detection speed were improved compared with YOLOV4. Yan et al. [44] proposed a fusion attention network based on the YOLOV4-tiny detection algorithm, and an atrous spatial pyramid pooling network (ASPPNet) was introduced after the feature extraction was completed by the lightweight backbone network CSPDarkNet-tiny of YOLOv4-tiny, the problem of detection speed and high-altitude seat belt feature extraction was solved. Since the SSD model is also a one-stage object detection model with the advantages of easy deployment and fast detection results, some researchers have applied it to fire detection tasks; Wu et al. [45] focused on real-time detection, early fire detection, and false detection in fire detection and compared and analyzed the classic monitoring methods to detect forest fires: Faster R-CNN, YOLO, and SSD, among them SSD have better real-time performance, higher detection accuracy, and early fire detection capability. Lin et al. [37] proposed RetinaNet in 2017, improved cross-entropy Loss, and proposed a Focal Loss function to ensure a balanced distribution of positive and negative samples in the training process. The detection accuracy of the algorithm can reach the accuracy of the two-stage detector while maintaining a fast detection speed. Although object detection algorithms have been rapidly developed, well-researched, and applied in many fields [14,15,16], they have only just started in the field of safety. Therefore, this paper proposes a model based on YOLOV4-tiny to detect safety signs in various places, laying a solid foundation for AI-based predictions and warnings to reduce the loss and prevent accidents.

3. Deep Neural Network

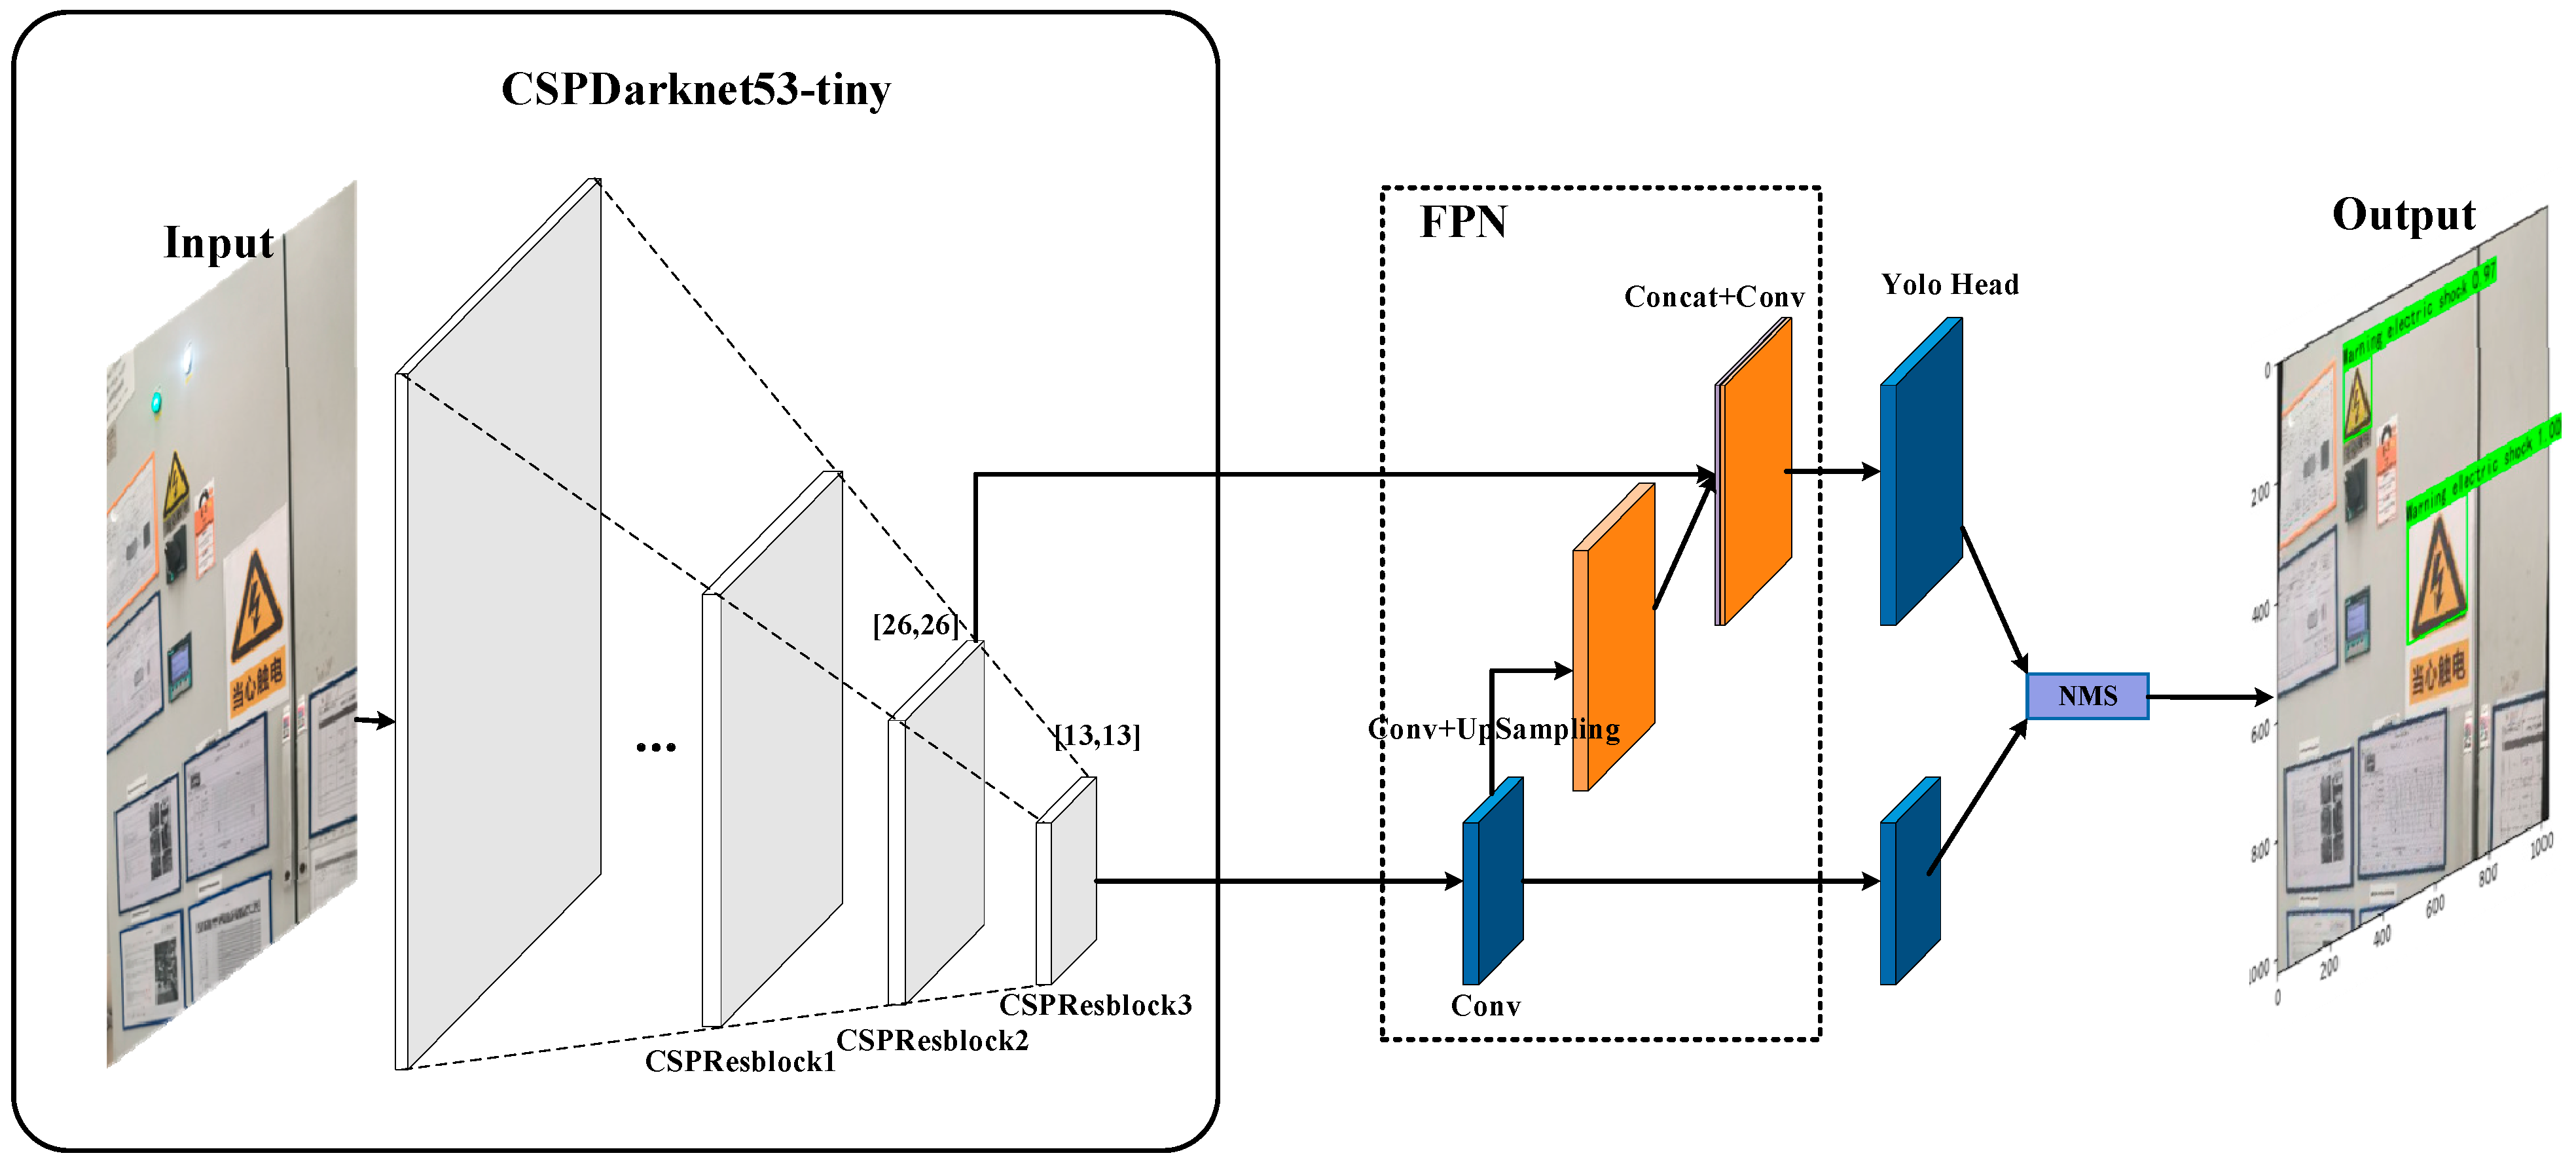
3.1. YOLOV4-Tiny Network

The deep neural network in this work was based on the YOLOV4-tiny model [46], designed based on the YOLOV4 network [41]. The overall structure of the network is shown in Figure 1. It employs the CSPDarknet53-tiny network as the backbone feature extraction network with fewer network parameters and faster detection speed than the CSPDarknet53 network in the YOLOV4 model. To make the calculation process faster, YOLOV4-tiny uses the Leaky ReLU function as the activation function instead of the Mish activation function in YOLOV4. The purpose of the Leaky ReLU activation function is to calculate the gradient and thus avoid neural deactivation. As can be seen in Figure 1, YOLOV4-tiny also extracts multi-scale features for detection, with two effective feature layers of different sizes. For the input of 416 × 416 pixels, the scales of these two feature layers are 26 × 26 and 13 × 13. Subsequently, the shallow effective feature layer is stacked with the deep effective feature layer after convolution and upsampling operations (see Figure 1). Finally, the fused features are sent to the YOLO Head for classification and position regression, and then the final prediction result of the model is obtained by non-maximum suppression. Its accuracy on the COCO dataset is also higher (mAP = 40.2%) than other versions (Light-Head R-CNN’s mAP is 37.7%, YOLOV3-tiny’s mAP is 16.6%.) of the lightweight model. In terms of speed and accuracy, YOLOV4-tiny is more appropriate for safety signs detection.

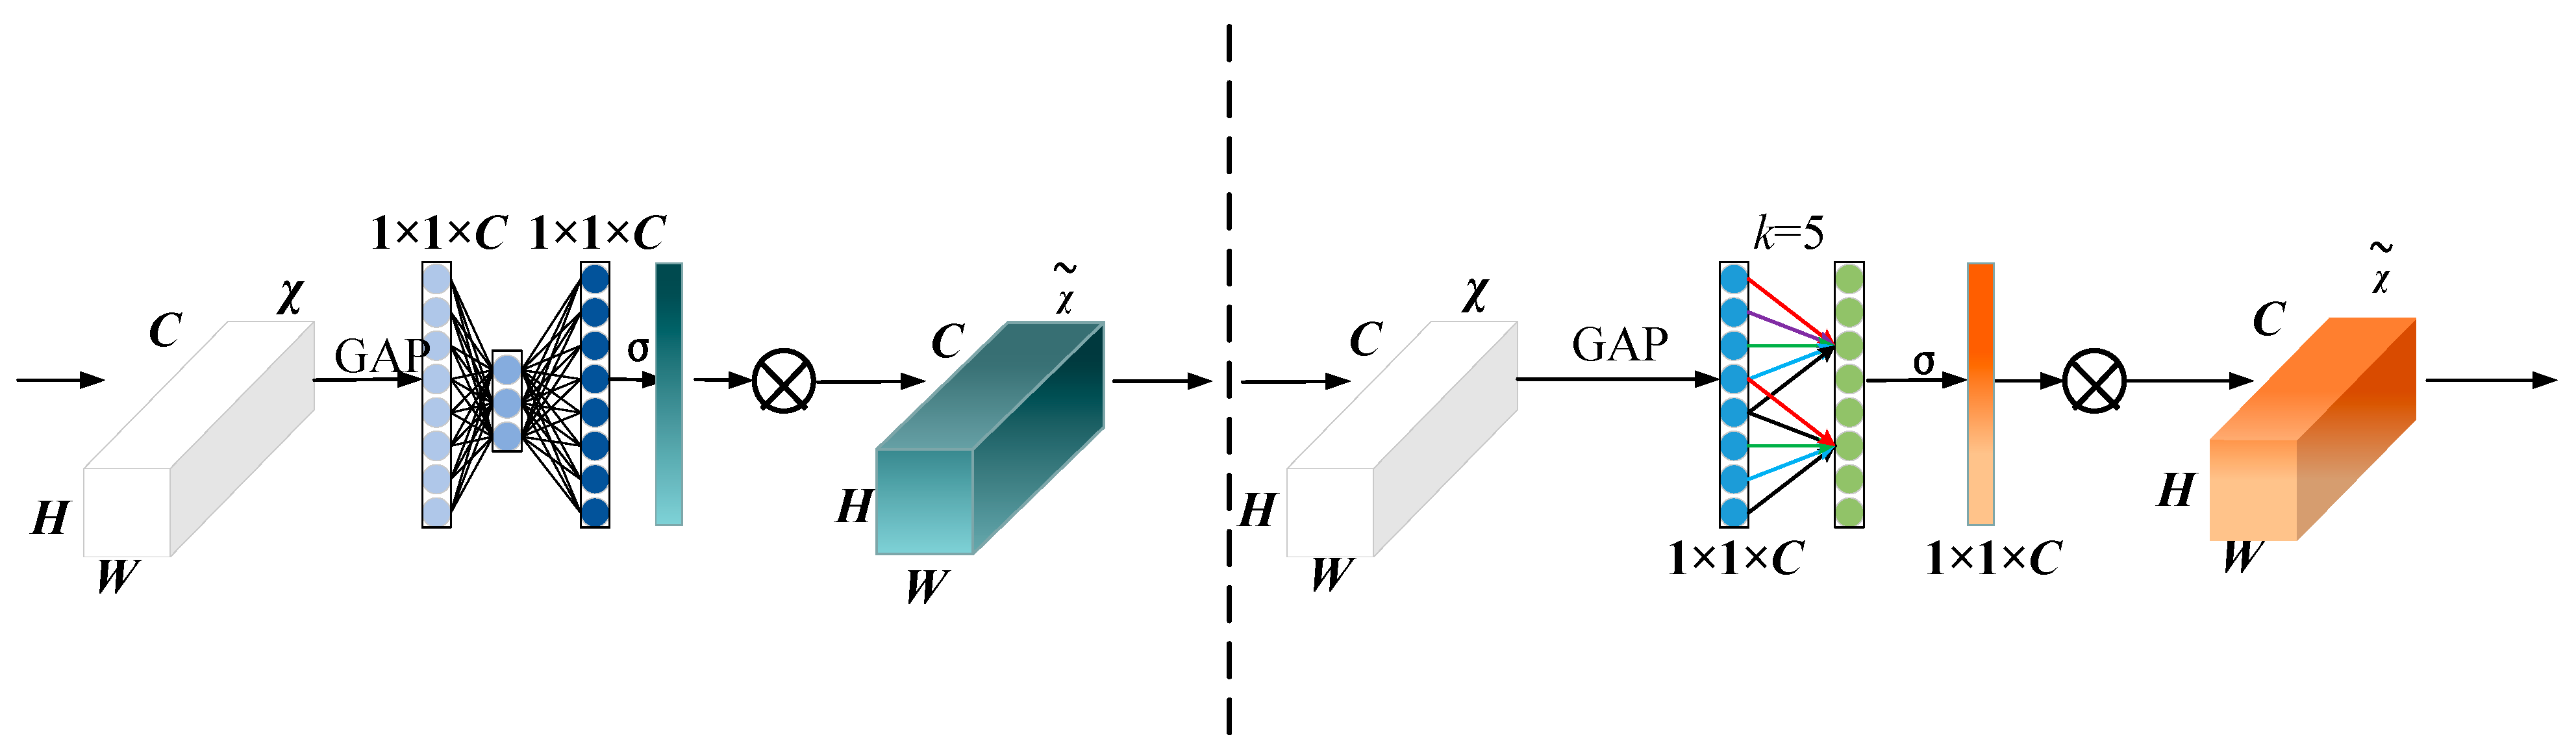
3.2. Attention Mechanisms

The one-stage detection algorithm has been widely used in various fields because of its fast detection speed. Ullah [47] ran a variety of real-time object detection models on non-GPU computers, such as YOLO, Faster RCNN, R-FCN, RetinaNet, etc., and found that YOLO was faster and more accurate than most other algorithms. Wang et al. [48] proposed a new detection algorithm, AP-SSD, based on the one-stage algorithm SSD, which reduced the computing cost. Nevertheless, it has a poor ability to extract target features containing small-scale pixel information, so it is expected that the one-stage detection algorithm could not perform well in detecting safety signs since safety signs are small-scale targets in coal mines. Adding attention mechanisms can greatly improve performance because the attention mechanism can highlight the characteristic information of the target and weaken the interference of background information. The central focus of the attention mechanism is to let the network focus on what needs more attention to reduce the arithmetic demand for network training. This paper adds the attention mechanism module after two feature outputs and upsampling, as shown in Figure 2. The implementation of the attention mechanism enhances the network’s capability for information extraction, enabling the filtration and amplification of critical information within features while suppressing irrelevant data. Consequently, this allows the model to distinguish the target from the background more effectively with only minimal computational effort.
Most attention mechanisms introduce extra variables and computations to improve the performance of the module. ECANet [49] is a new super strong channel attention mechanism based on SENet [50], which greatly reduces computation and optimizes speed and performance. ECANet’s module structure is shown in Figure 3. After inputting the feature map χ for the global averaging pooling across all channels without dimensionality reduction, ECANet achieves local interactions across channels using a one-dimensional convolution of size (K). The size of the convolution kernel (K) represents the range of interactions across channels, which can be calculated by the adaptive function based on the size of the input channel (C), as shown in Equation (1).
K = log 2 C + 1 2

3.3. Loss Function

The loss function of YOLOV4-tiny is composed of the regression loss (Lloc) of the anchor frame, the loss of the prediction category (Lcls), and the confidence loss (Lconf). The overall loss function expression is shown in Equation (2)
L = L l o c + L c l s + L c o n f
The loss function is used to calculate the gap between the model’s prediction and the actual data. Classic one-stage detection methods, such as YOLO and SSD, have serious category imbalance problems during training. A large number of simple samples and backgrounds generated by the one-stage detection algorithm during training affect the classification accuracy of the model. To enhance the prediction ability of the model for complex samples, a Focal Loss [37] function is used in this paper to regress the confidence of the target. The Focal Loss function can solve the problem of uneven positive and negative samples in the classification process. By reducing the weight of background samples, the model focuses on foreground objects.
L f l = α 1 y γ log y , 1 α y log 1 y , y = 1 y = 0
where α is the balance factor, γ is the attenuation parameter, and y is the predicted label probability.
The Focal Loss function adds a balance factor α to balance the imbalance between the positive and negative samples themselves and uses an attenuation parameter γ to control the imbalance between the simple and complex samples.
When y is very small (samples are difficult to divide, regardless of whether the division is correct), α approaches 1, and the weight of the sample in the loss function is not affected. When y is large (samples are easy to classify, no matter whether the grading is correct), α approaches 0, and the weight of samples in the Loss function drops a lot. γ can adjust the reduction degree of the weight of samples that are easy to classify. By appropriately selecting the values of α and γ, Focal Loss effectively enhances the model’s predictive accuracy for minority classes. Particularly in object detection tasks, it aids the model in better recognizing small or difficult-to-distinguish targets against complex backgrounds, significantly improving the model’s performance when dealing with class-imbalanced data.

3.4. Improved NMS Algorithm

In the object detection task, the original output results have a large number of duplicate detection prediction boxes. As a method of model post-processing, a Non-Maximum Suppression (NMS) algorithm can effectively suppress the duplicate prediction boxes. The traditional NMS first retains one prediction box with the highest confidence score, moves it into the result set in each loop, and then iterates through the other prediction boxes. If the overlap degree between prediction boxes with the highest confidence score exceeds a threshold, the prediction box is considered to be detected repeatedly. In this case, the candidate box should be deleted to retain the prediction box with an overlap degree less than the threshold and the prediction box without overlap.
The NMS algorithm has obvious disadvantages. Firstly, a threshold, which is determined by subjective experience, needs to be set manually. Secondly, when similar targets are dense, and the detected objects are highly overlapped, the NMS algorithm is easy to delete the prediction box belonging to another target, resulting in missed detection.
By using a smoother suppression method, the Soft-NMS algorithm solves the problem of traditional NMS. When the overlap between the current prediction box and the prediction box with the highest confidence level exceeds a threshold, the prediction box is not immediately removed from the result set, but the confidence score of the current prediction box is reduced using a Gaussian weighted function (see Equation (4)).
s i = s i e i o u M , b i 2 σ , b i D
where, si is the classification confidence, M is the current highest scoring detection box, bi is the box to be processed, iou represents the ratio of the intersection area of the two candidate boxes to the union area, its fomula is shown in Equation (5).
I O U = a r e a ( B g t B P ) a r e a ( B g t B p )
The Gaussian weighting method avoids the issue that when there is no overlap, the penalty function has no penalty for prediction boxes, while when the prediction boxes are highly overlapped, a higher penalty function will be generated. Subsequently, bounding boxes with scores below a certain threshold are removed, and the process is repeated by selecting the bounding box with the highest score and adding it to the final list of detection results. The scores of the remaining bounding boxes are updated based on the IOU with the highest-scoring bounding box. Repeat these steps until all bounding boxes are processed, then return the final detection results list.
Through this method, Soft NMS can more delicately handle situations with overlapping bounding boxes, reducing the incorrect elimination of correct detection results, especially in scenes with dense targets, effectively improving the accuracy and recall rate of detection.

4. Experiments

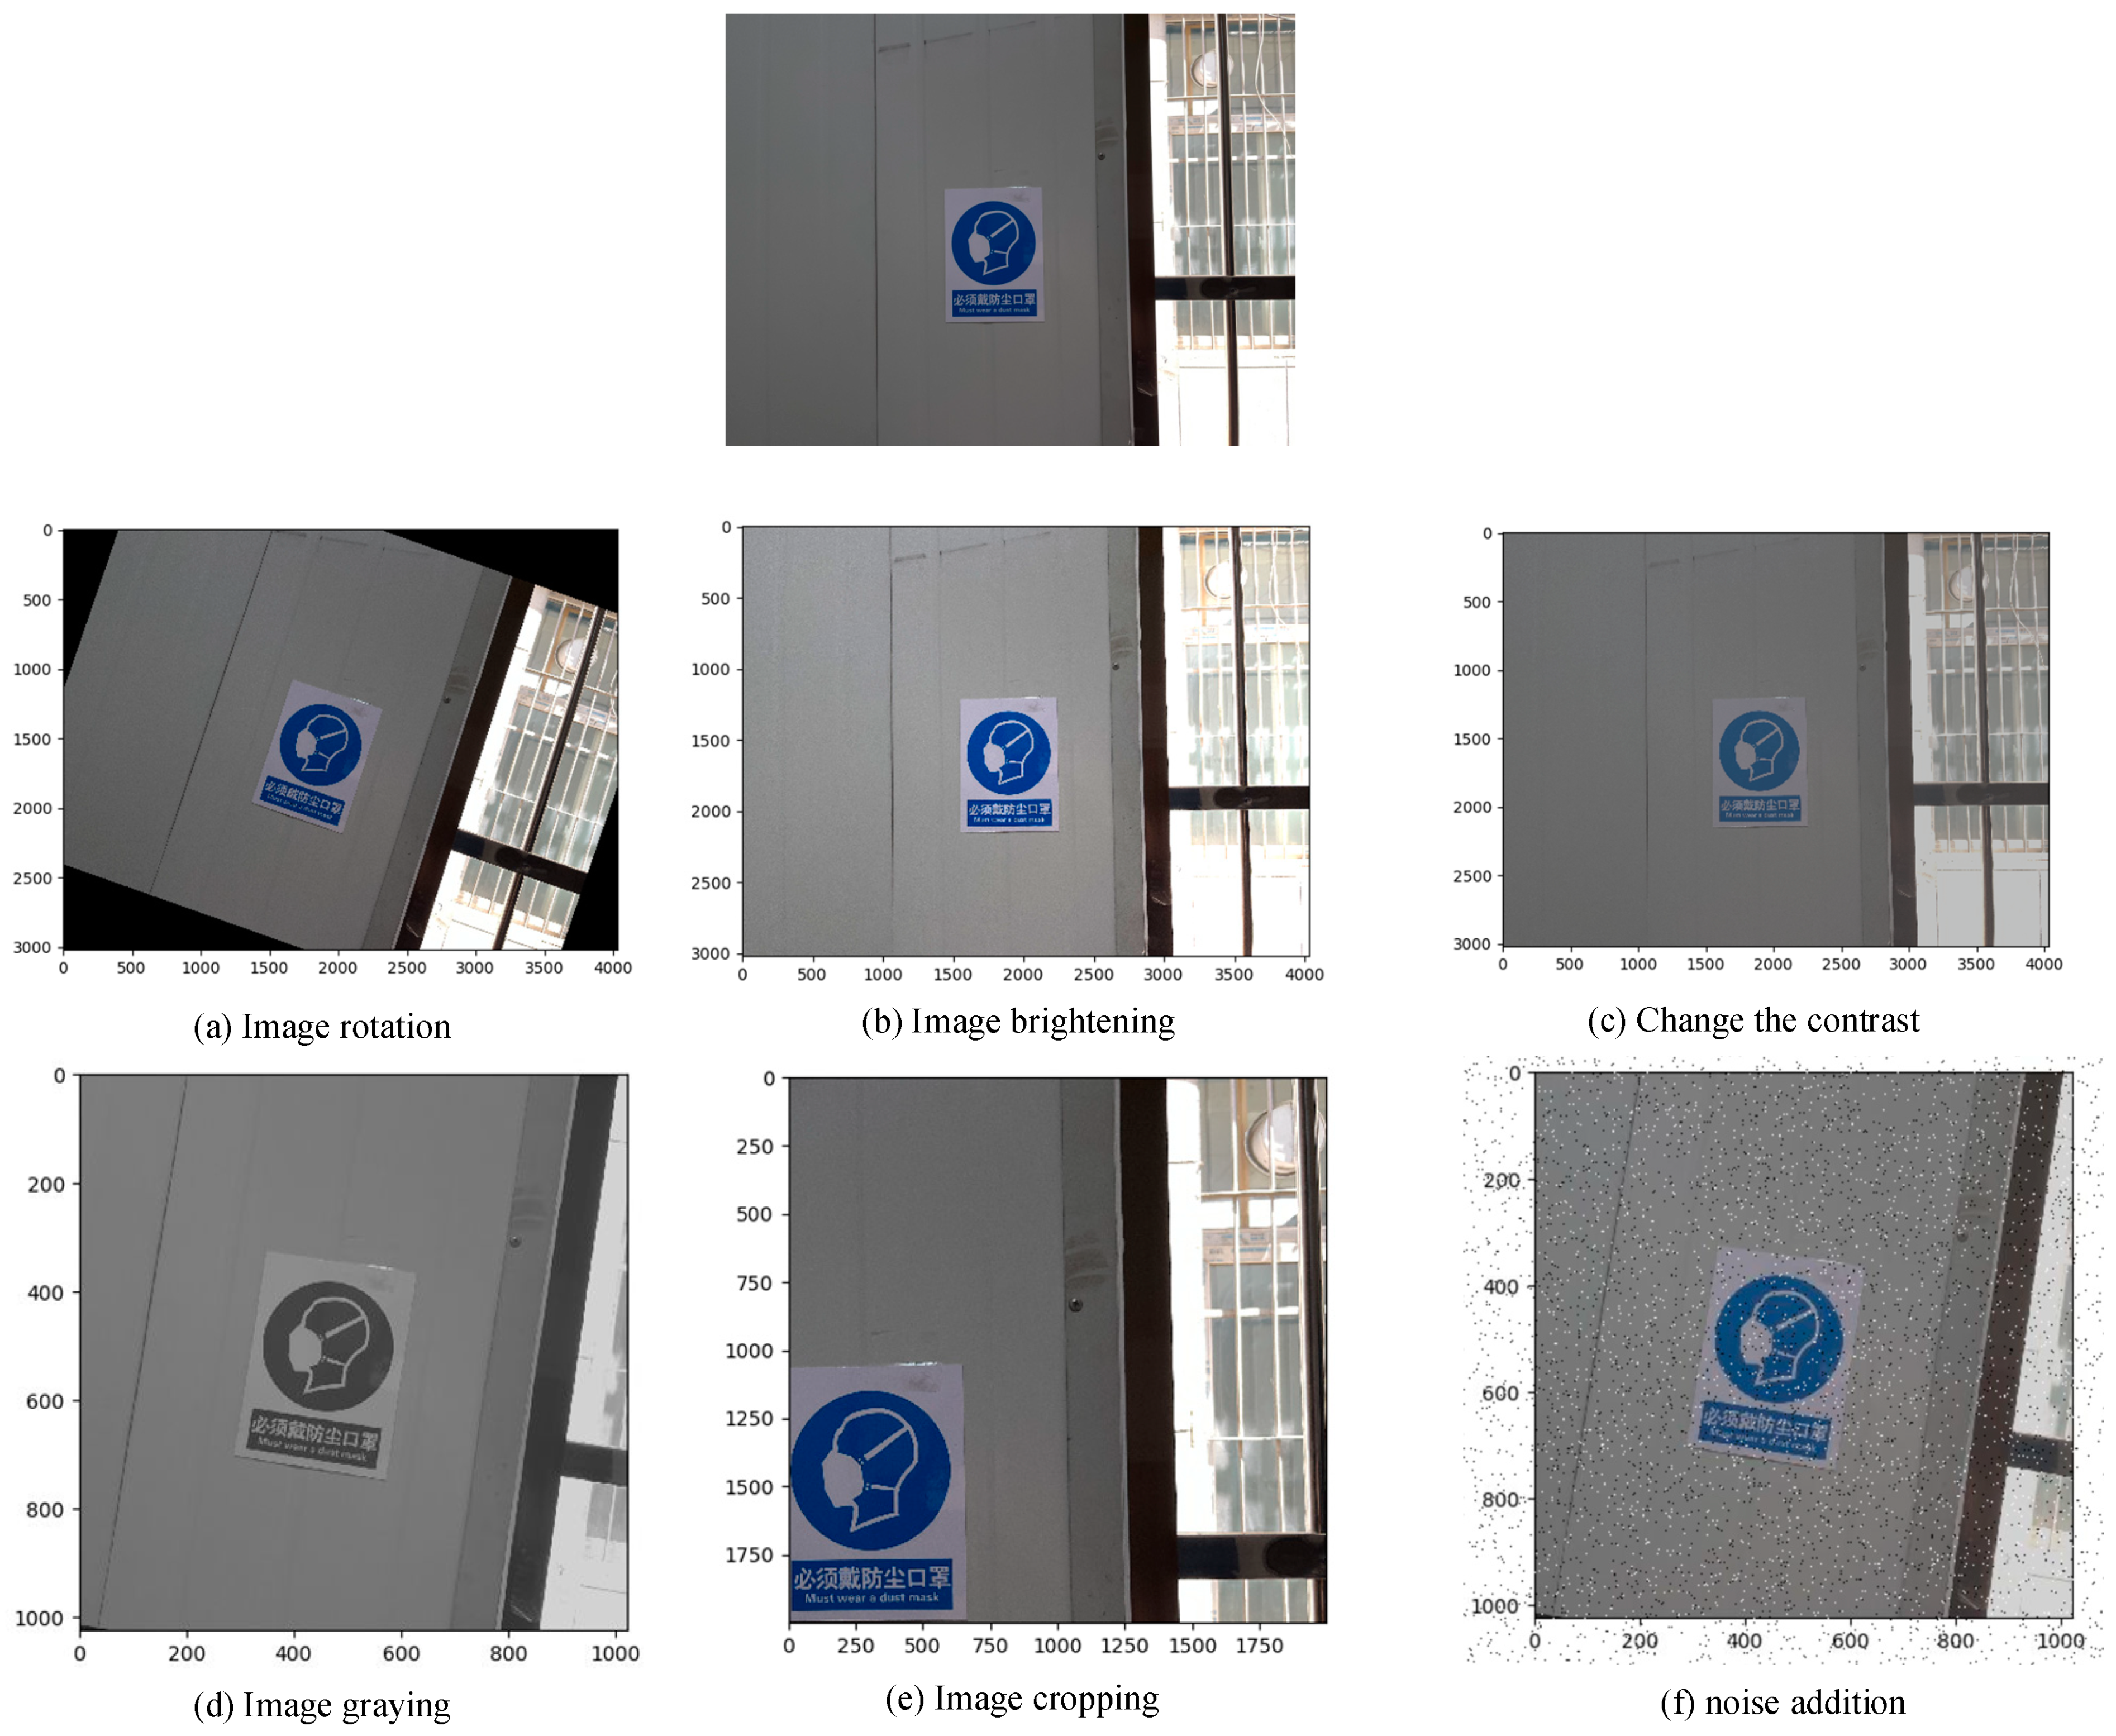
4.1. Dataset Collection and Pre-Processing

In this paper, based on the Chinese standard GB2894-2008 [51], “Safety signs and guideline for the use”, 10 types of safety signs (see Figure 4 and Table 1) were collected from the complex environment under the mine and close to the mine environment. The reasons for considering these 10 types of signs were attributed to their wide usage in coal mines. Data augmentation was performed, including cropping, random rotation, and changing brightness and contrast (see Figure 5 and Table 1), which aims to improve the generalization ability of the model. The whole dataset was divided into training set, validation set, and test set according to the ratio of (training set + validation set):test set = 9:1 and training set: validation set = 9:1. The selected images were labeled with safety signs targets using LabelImg software 1.8.6 (cmd>conda activate pytorch>LabelImg) and annotated with XML files in PASCAL VOC [52] format.

4.2. Experimental Environment and Evaluation Index

We implemented this experiment using a PC-equipped Intel UHD Graphics 620 CPU with 32 G memory, the used software is Python 3.7, the deep learning framework we used is Pytorch. The system runs under Windows 10 64-bit. The Adam optimizer was used to optimize the weight parameters of the model during the training process. The initial learning rate of the training model was 0.0001, and the momentum was 0.937.
The accuracy evaluation indicators mainly included Precision, Recall, AP, and mAP (see Equations (5)–(8)). In addition, the speed evaluation indicator was FPS, representing how many images are recognized per second.
Pr e c i s i o n = T P T P + F P
Re c a l l = T P T P + F N
A P = 0 1 P ( R ) d R
m A P = i = 1 C A P i C
where TP is the number of samples where positive samples are correctly identified as positive samples; FP is the number of samples where negative samples are incorrectly identified as positive samples; FN is the number of samples where positive samples are incorrectly identified as negative samples; Precision is used to measure the accuracy of the positive samples found by the algorithm; Recall is used to measure the ability of the algorithm to find samples in the data set; P(R) is the variation curve of precision with recall. C represents the total number of categories, and APi represents the AP value of class i.
In this paper, the following experiments were considered (see Table 2) based on the YOLOV4-tiny model:
(i)
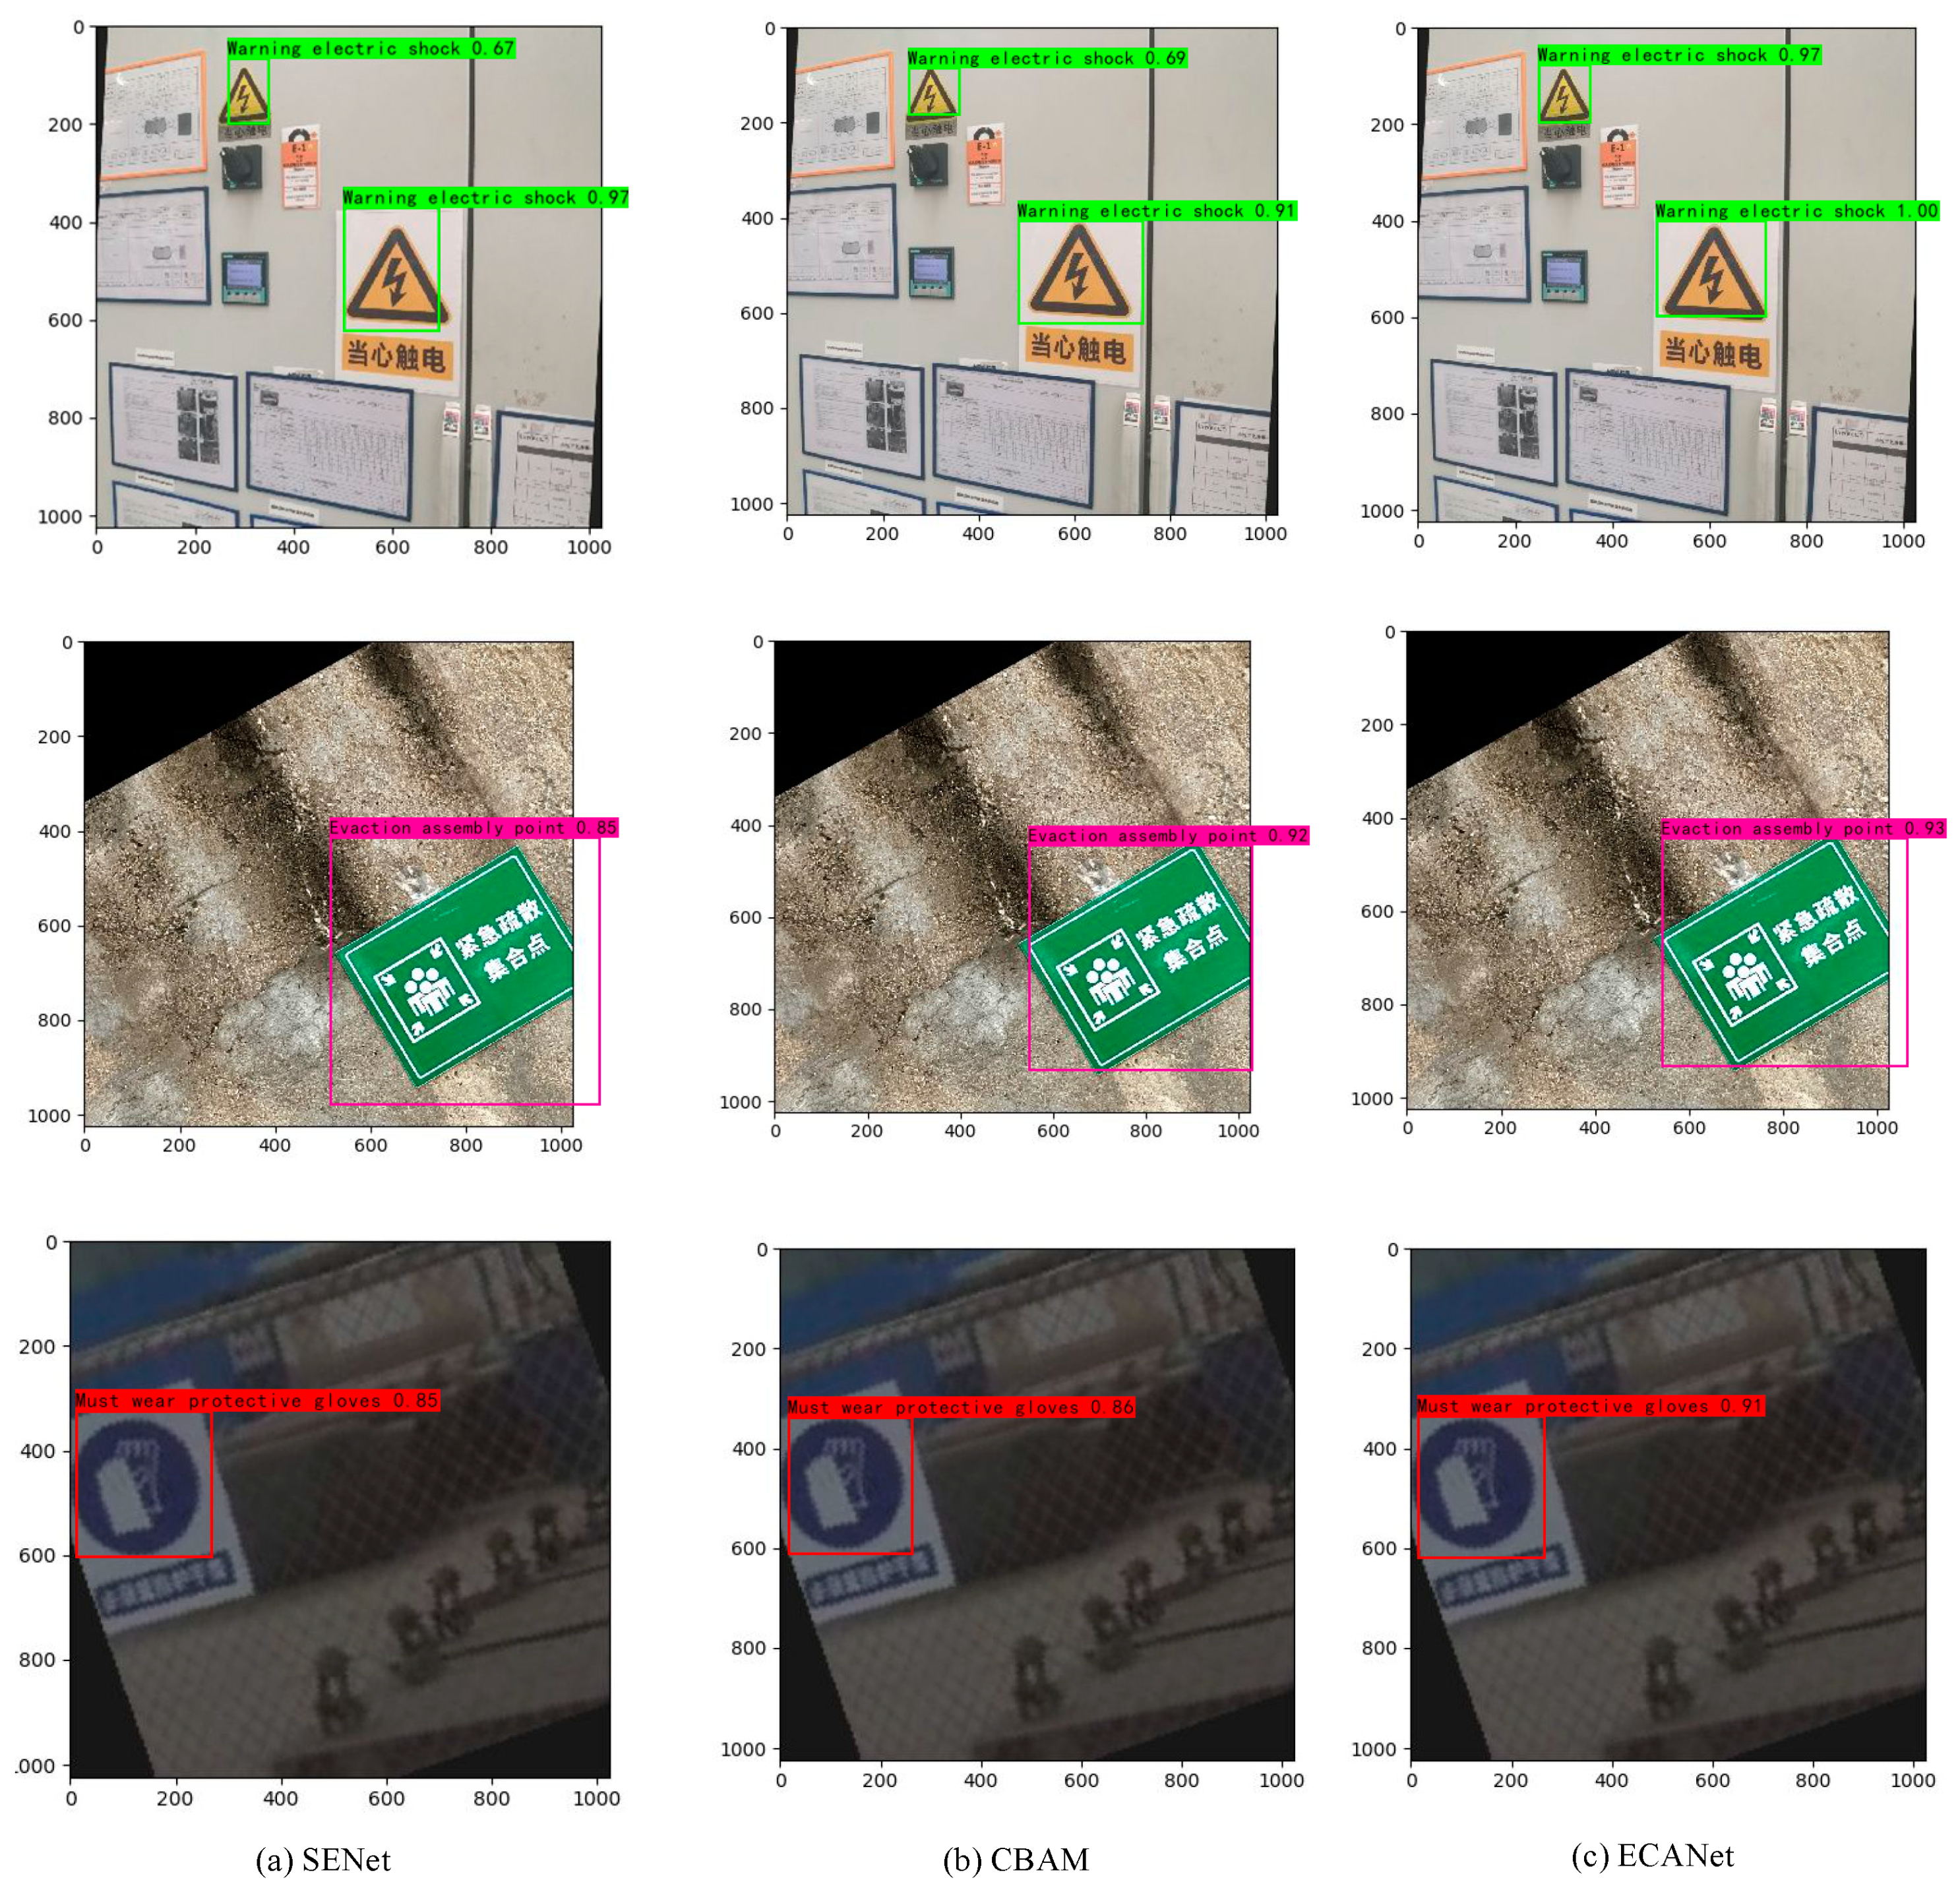
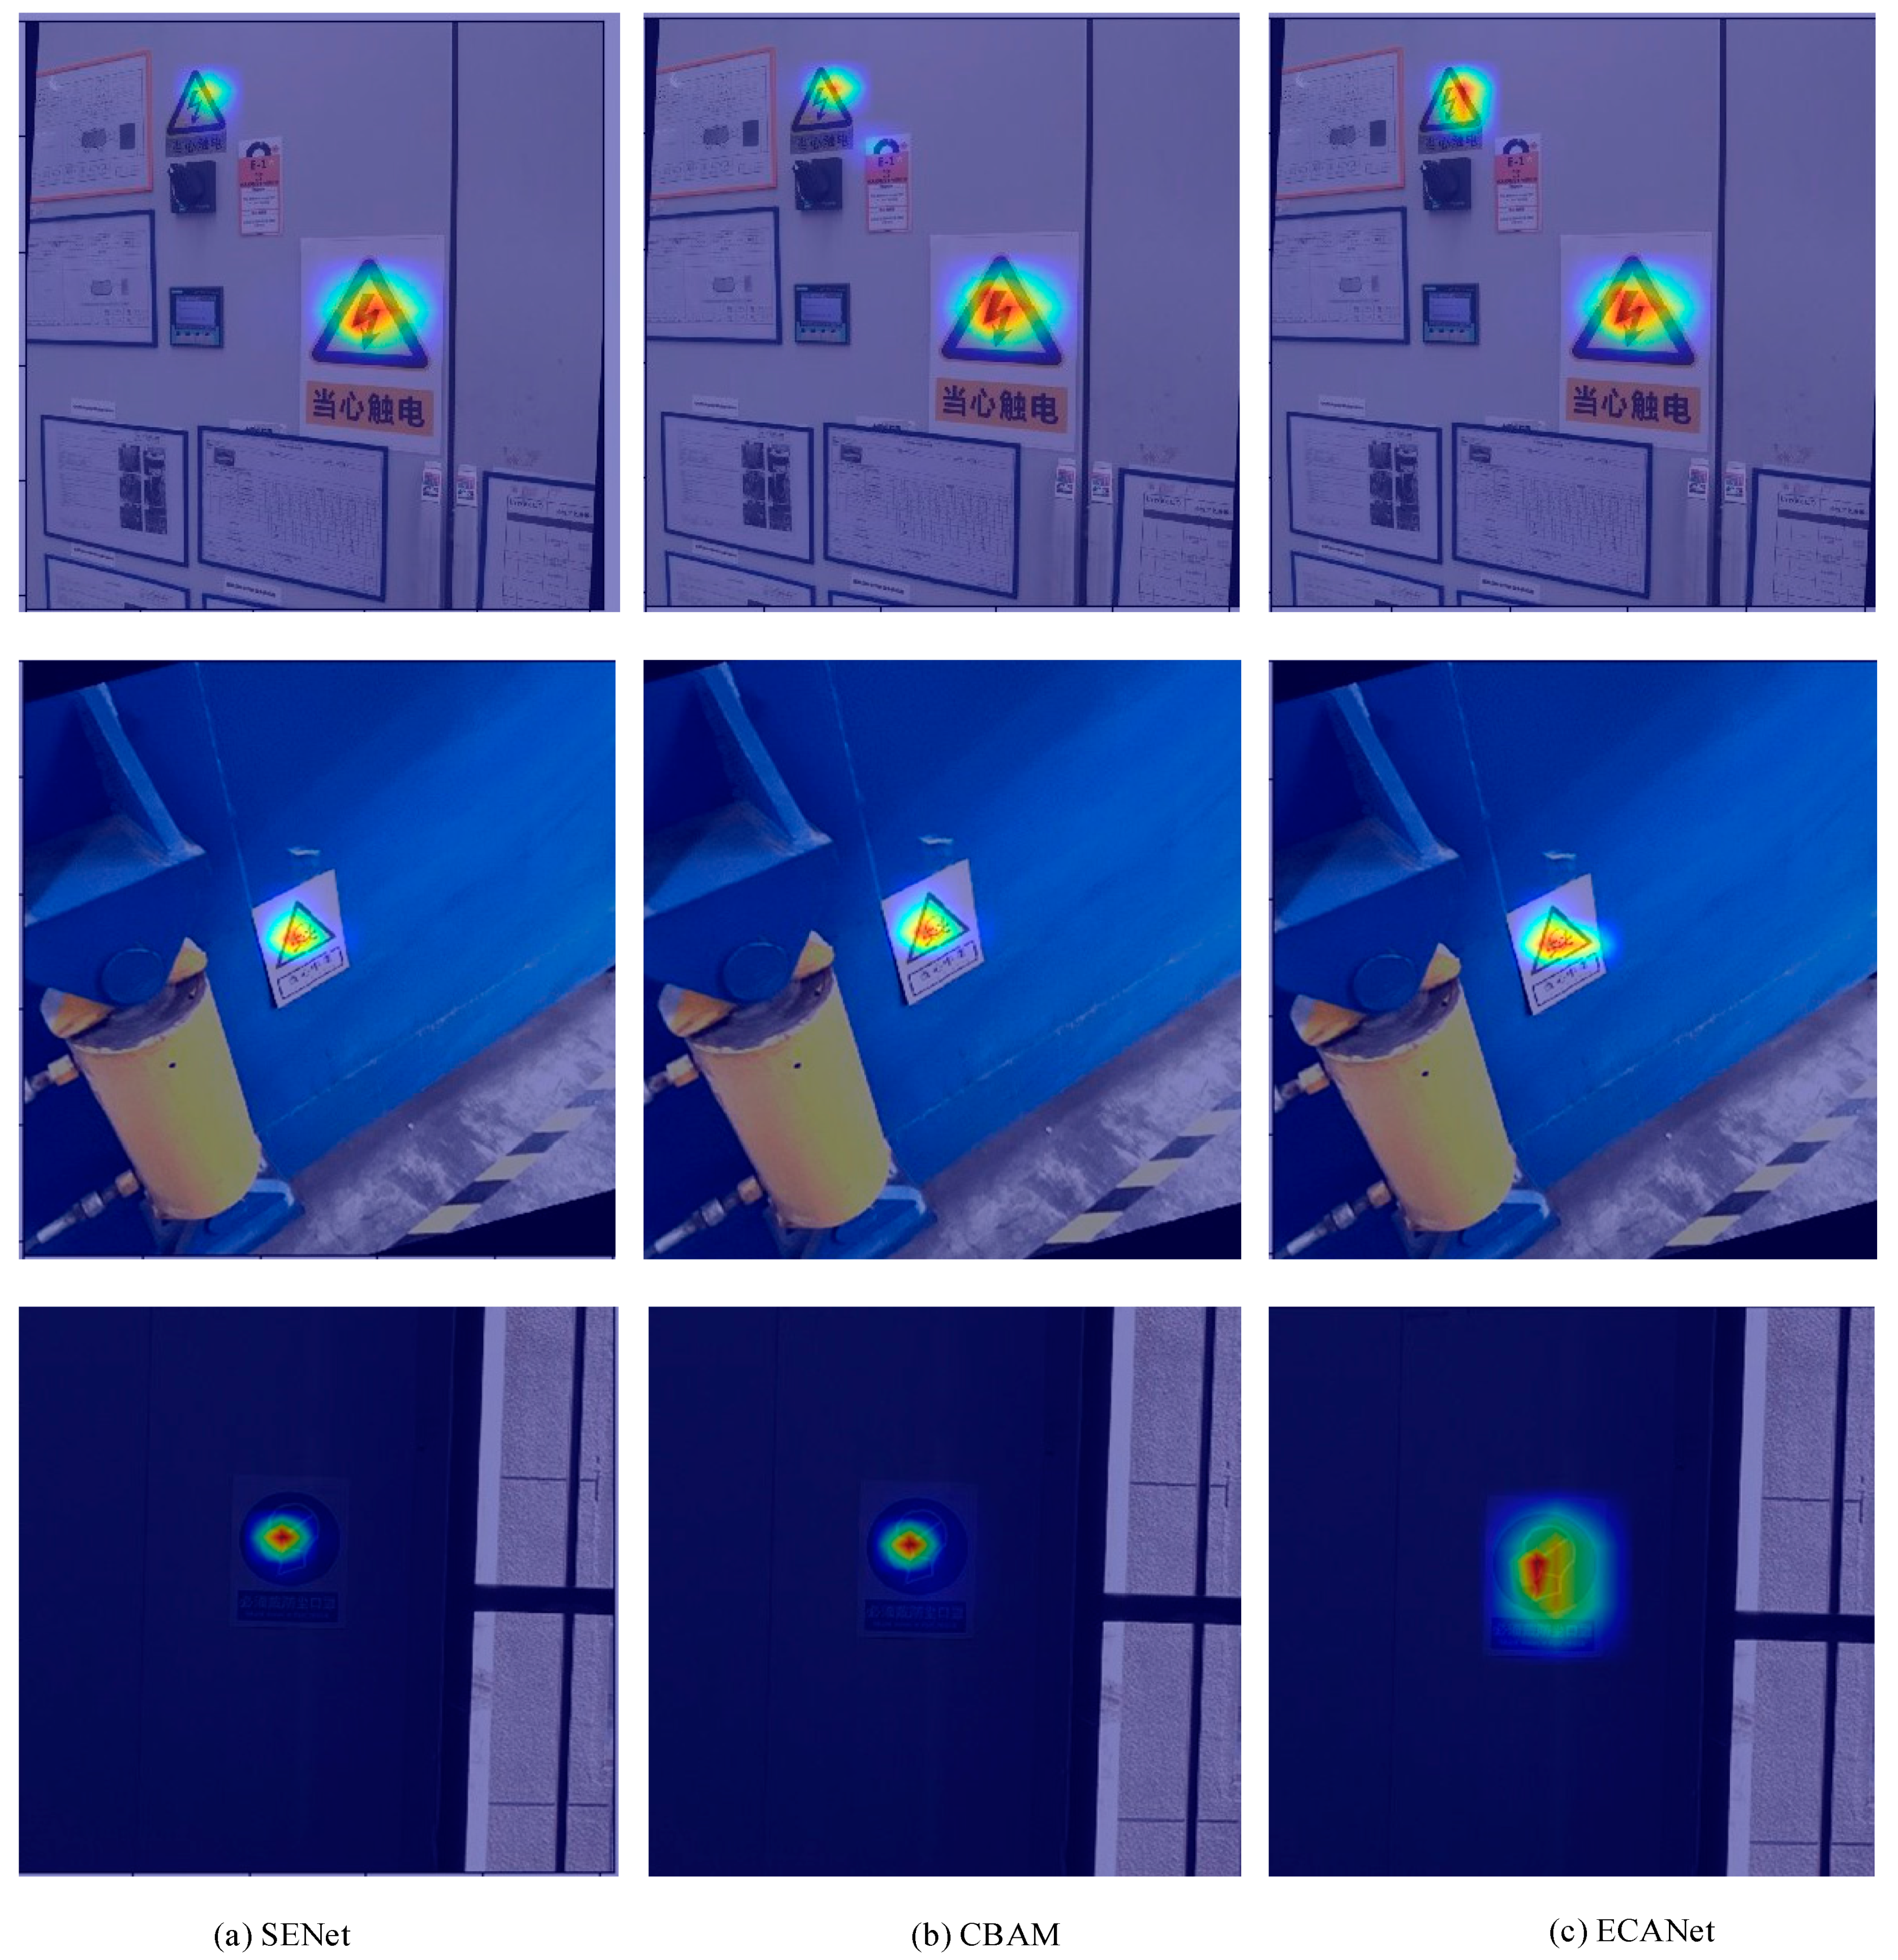
Three attention mechanisms, SENet, CBAM, and ECANet, were compared to investigate the influence of different attention mechanisms on detection accuracy and speed.
(ii)
The Soft-NMS algorithm was introduced to replace the previous traditional NMS algorithm;
(iii)
The Focal Loss algorithm was introduced.
(iv)
The traditional YOLOV4-tiny model and the Faster-RCNN algorithm were compared to validate the improved models.

5. Results and Discussion

5.1. Influence of Different Attention Mechanisms

Three attention mechanisms, SENet, CBAM, and ECANet, were separately added to the YOLOv4-tiny model. Table 2 shows that the mAP value of the YOLOV4-tiny network model with the ECA attention mechanism is higher than the other two attention mechanisms. Meanwhile, the model with the ECANet attention mechanism obtains the highest detection speed among the three models, reaching 1.63 FPS. Figure 6 shows the detection results of safety signs in three situations (a lot of targets and small targets, normal size and environment, and dim environment) by introducing three attention mechanisms. As can be seen from Figure 6, when there are a lot of targets and small targets in the image, the detection effect of the YOLOV4-tiny algorithm with ECANet is the best, especially when detecting small targets, the precision of the YOLOV4-tiny algorithm with SENet and CBAM is only 67% and 69%. When ECANet is introduced, the precision reaches 97%; when detecting normal-sized safety signs, the YOLOV4-tiny algorithm with the ECANet performs better than the SENet and CBAM; when detecting blurred safety signs in dim light, the YOLOV4-tiny algorithm based on ECANet has the best detection effect. Figure 7 shows the comparisons of heat maps for adding different attention mechanisms. It can be clearly seen from Figure 7 that the ECANet activates more object areas and focuses more on the safety signs areas, especially small object areas. This indicates that the model with the ECANet attention mechanism has stronger robustness and faster convergence for safety signs detection. The better performance of the ECANet is associated with the non-dimensional local cross-channel interaction strategy proposed by ECANet. Appropriate cross-channel interaction can significantly reduce the complexity of the model while maintaining performance. Simultaneously, it also indicates that compared to the introduction of SENet and CBAM, the incorporation of ECANet can place greater emphasis on analyzing the color and shape information of safety signs. It suppresses unimportant features, highlights useful characteristics, and effectively captures cross-channel interactions, thereby achieving performance improvement.
Figure 8 shows the P-R curve of the YOLOV4-tiny safety signs detection model after the introduction of the ECANet attention mechanism. The mAP value for the model to identify each type of safety sign is 96.03%, and the AP value of six types of safety signs reaches 100%. It can be seen from the detection results of the other four safety signs (Wearing protective gloves, wearing a safety helmet, emergency shelter, and no smoking) that there are also some false detections in the model using the ECANet network. The reason for the false detection is that when deep learning extracts features, some categories of safety signs are incorrectly identified because of their similar colors, shapes, and patterns. In this experiment, the AP value of No smoking is relatively low because the color and shape of such signs are similar to that of No fireworks, and the two types of signs also contain similar cigarette butts, so there will be false detection. If the image is taken over a long distance or there are many kinds of signs in the same image, the detection window may not be all identified correctly.

5.2. Influence of Soft-NMS

As shown in Table 2, due to the existence of multiple targets in the image and the small size of some targets, the combination of the ECANet attention mechanism and Soft-NMS algorithm has achieved good detection results. The mAP value reaches 97.1%, which is 1.07% higher than the YOLOV4-tiny + ECANet. The FPS after the introduction of the Soft-NMS algorithm is 1.59, which is lower than that of the YOLOV4-tiny + ECANet model. The decrease in FPS is due to the addition of an attention mechanism, but the decrease is not significant. This shows that after the introduction of this optimization strategy, the learning and training of small targets are more in-depth. The Soft-NMS is used to correct candidate boxes that are retained by using the non-zero feature of lower confidence candidate boxes, thus improving the detection effect of the model. As shown in Figure 9, the log-average miss rate of the traditional NMS algorithm is higher than that of the Soft-NMS algorithm, and there are more categories with false detection than that of the Soft-NMS algorithm, which proves the effectiveness of the improved model.

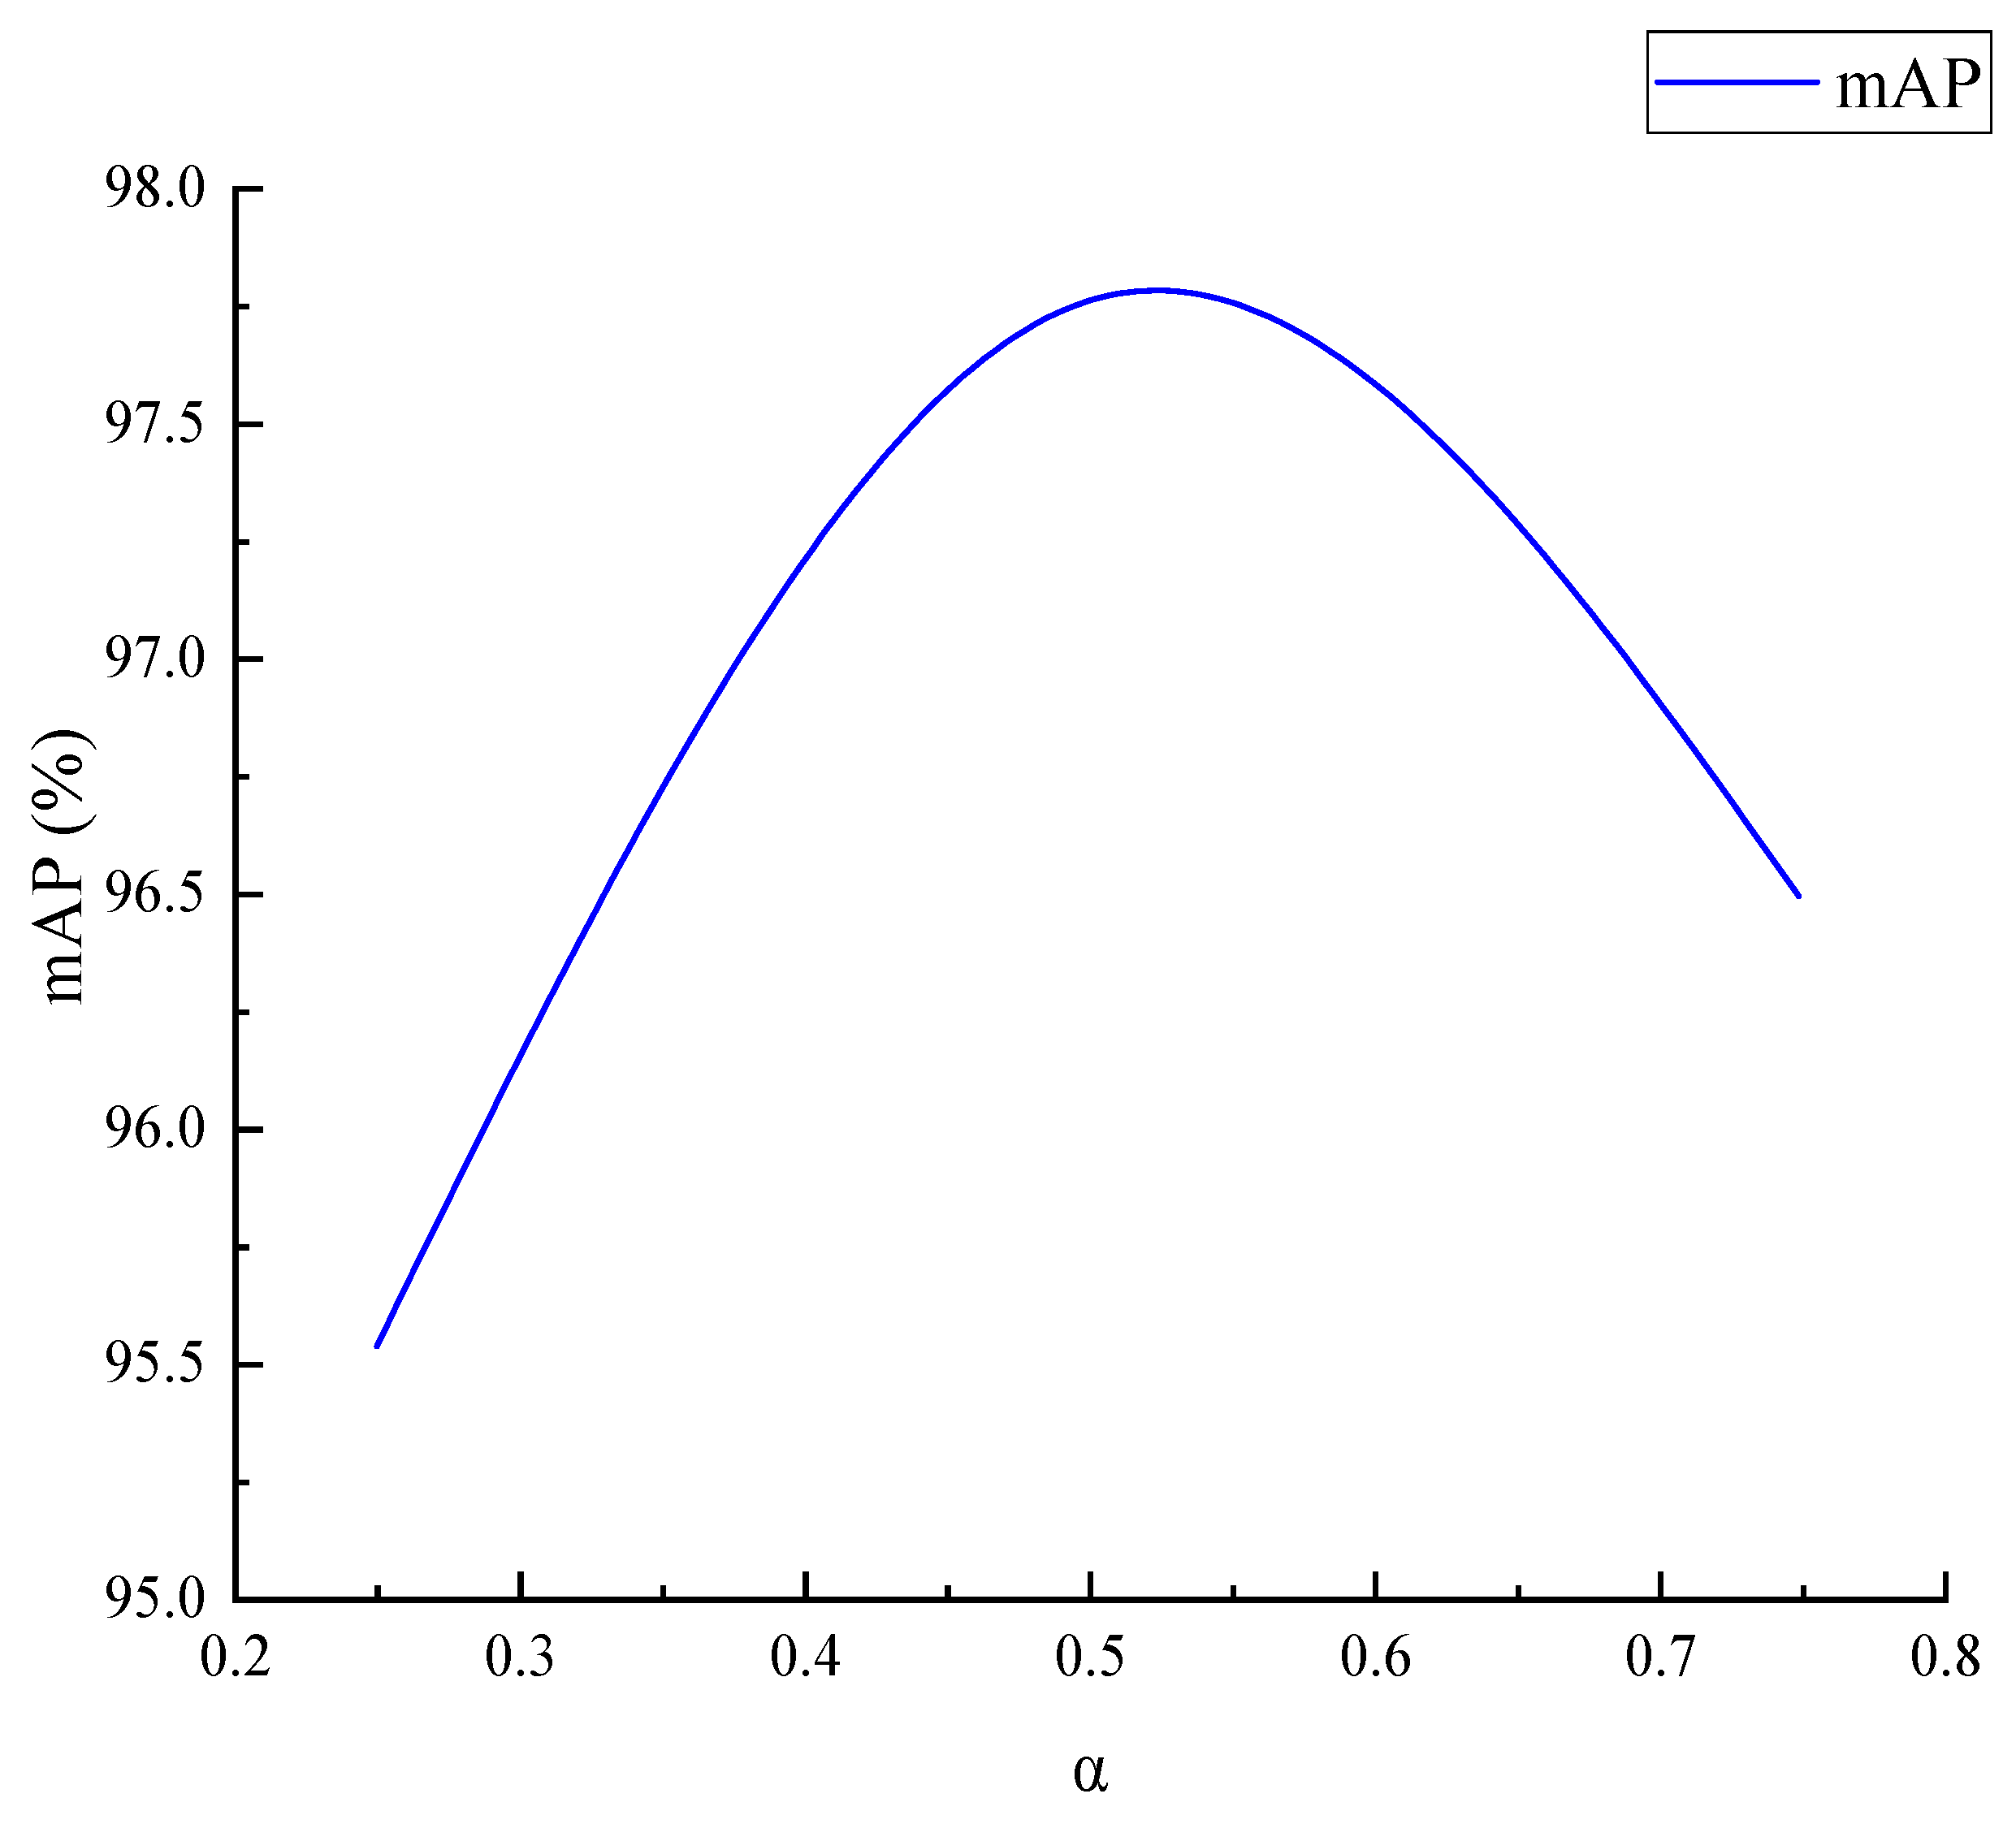
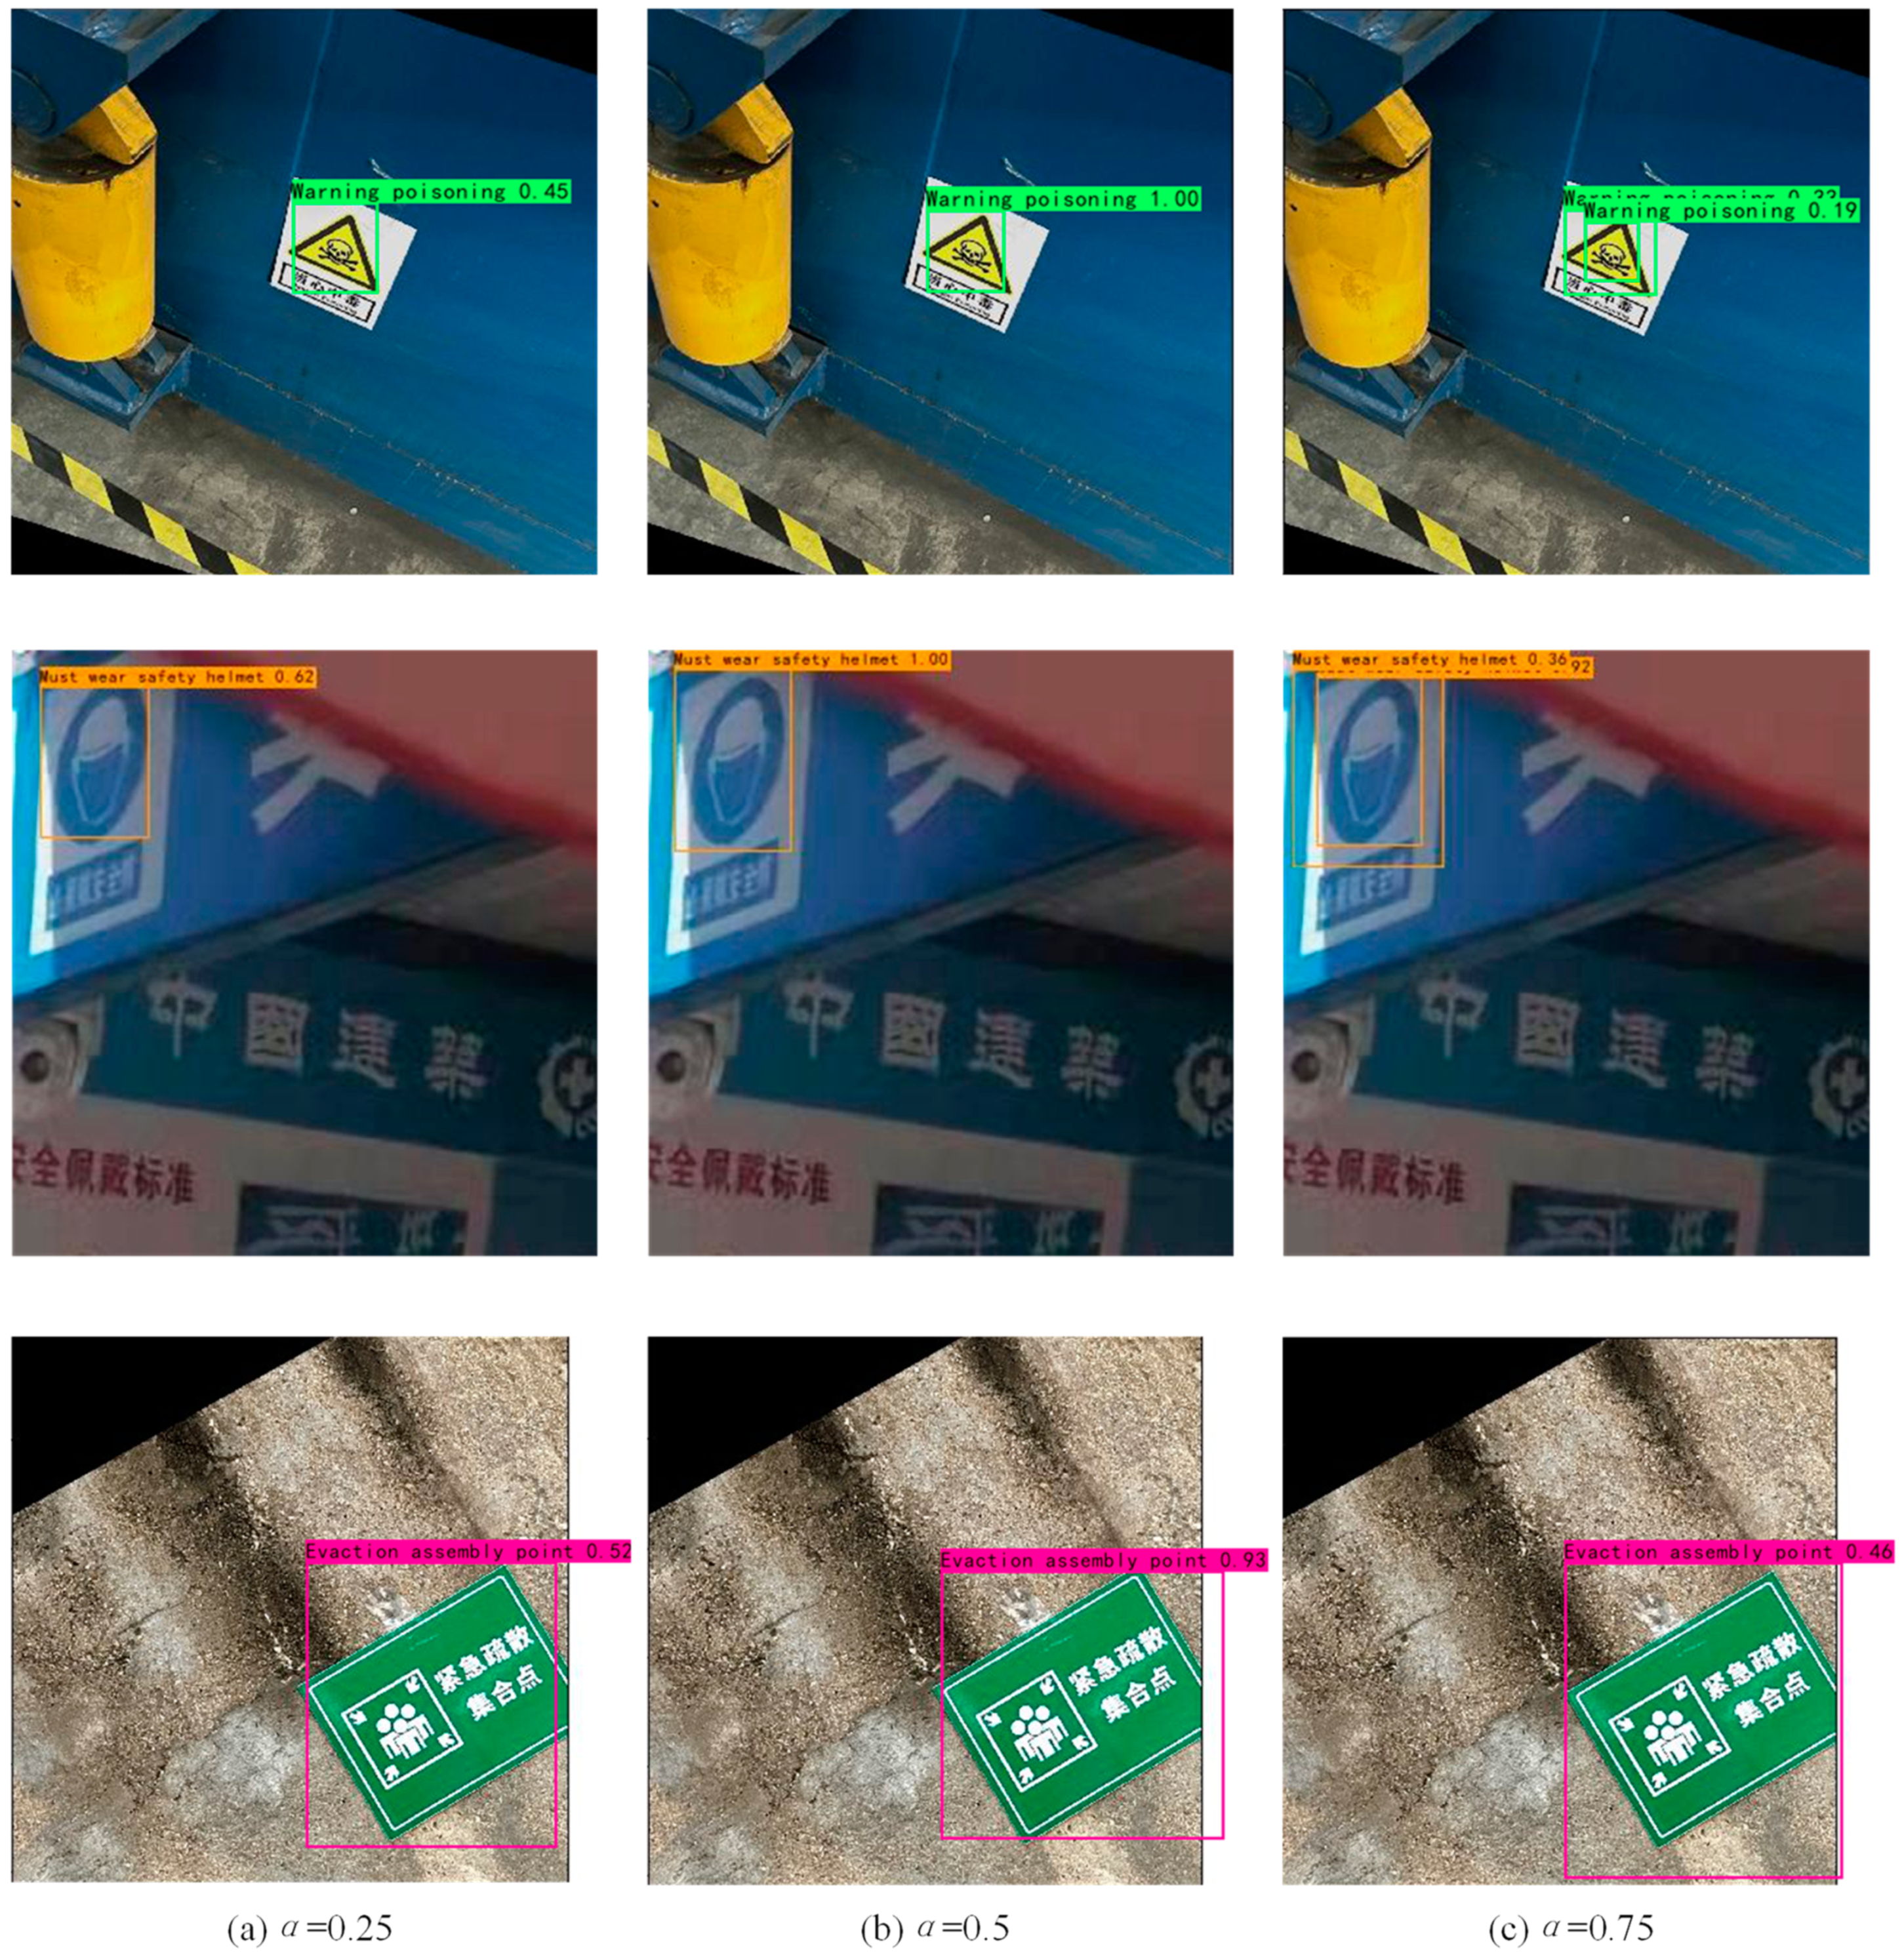
5.3. Influence of Focal Loss

The Focal Loss function is used to replace the original confidence loss function, and its mAP value reaches 97.76%, which is 0.66% higher than the YOLOV4-tiny + ECANet + Soft-NMS and 7.55% higher than the traditional YOLOV4-tiny. It can be seen from Figure 10 that the categories with false detection after the introduction of Focal Loss are reduced. The principle of Focal Loss to improve the precision of the model is to add α to the positive and negative samples to reduce the proportion of negative samples. The setting of α depends on the characteristics of the data set and the detection task. The actual situation of the data set and feedback are needed for experiment and verification. The effect of the model is evaluated by the performance index on the validation set, and then the most suitable α is determined. Lin et al. [53] proved through experiments that on the COCO data set, α is set to 0.25, and the model accuracy is the highest. The literature also explained that when the target has more annotations and more classification categories, a larger α can be set. Therefore, this paper examines the suitable α within the range between 0.25–0.75.
As shown in Figure 11, it is more appropriate in this work to set α to 0.5. It can be seen from Figure 12 that when α is 0.5, the positioning of the target detection task is more accurate, and the classification accuracy is higher. Figure 12 is the location map of object detection when α is 0.25, 0.5, and 0.75. It can be seen that when α is 0.5, the precision is higher than that when α is 0.25, which can reach 100%. When α is 0.75, there will be repeated positioning, and the precision is also lower than that when α is 0.5. Therefore, when the Focal Loss function is introduced, and the α is set to 0.5, the influence of the category imbalance problem on the model training can be reduced so that the overall performance of the model is better.

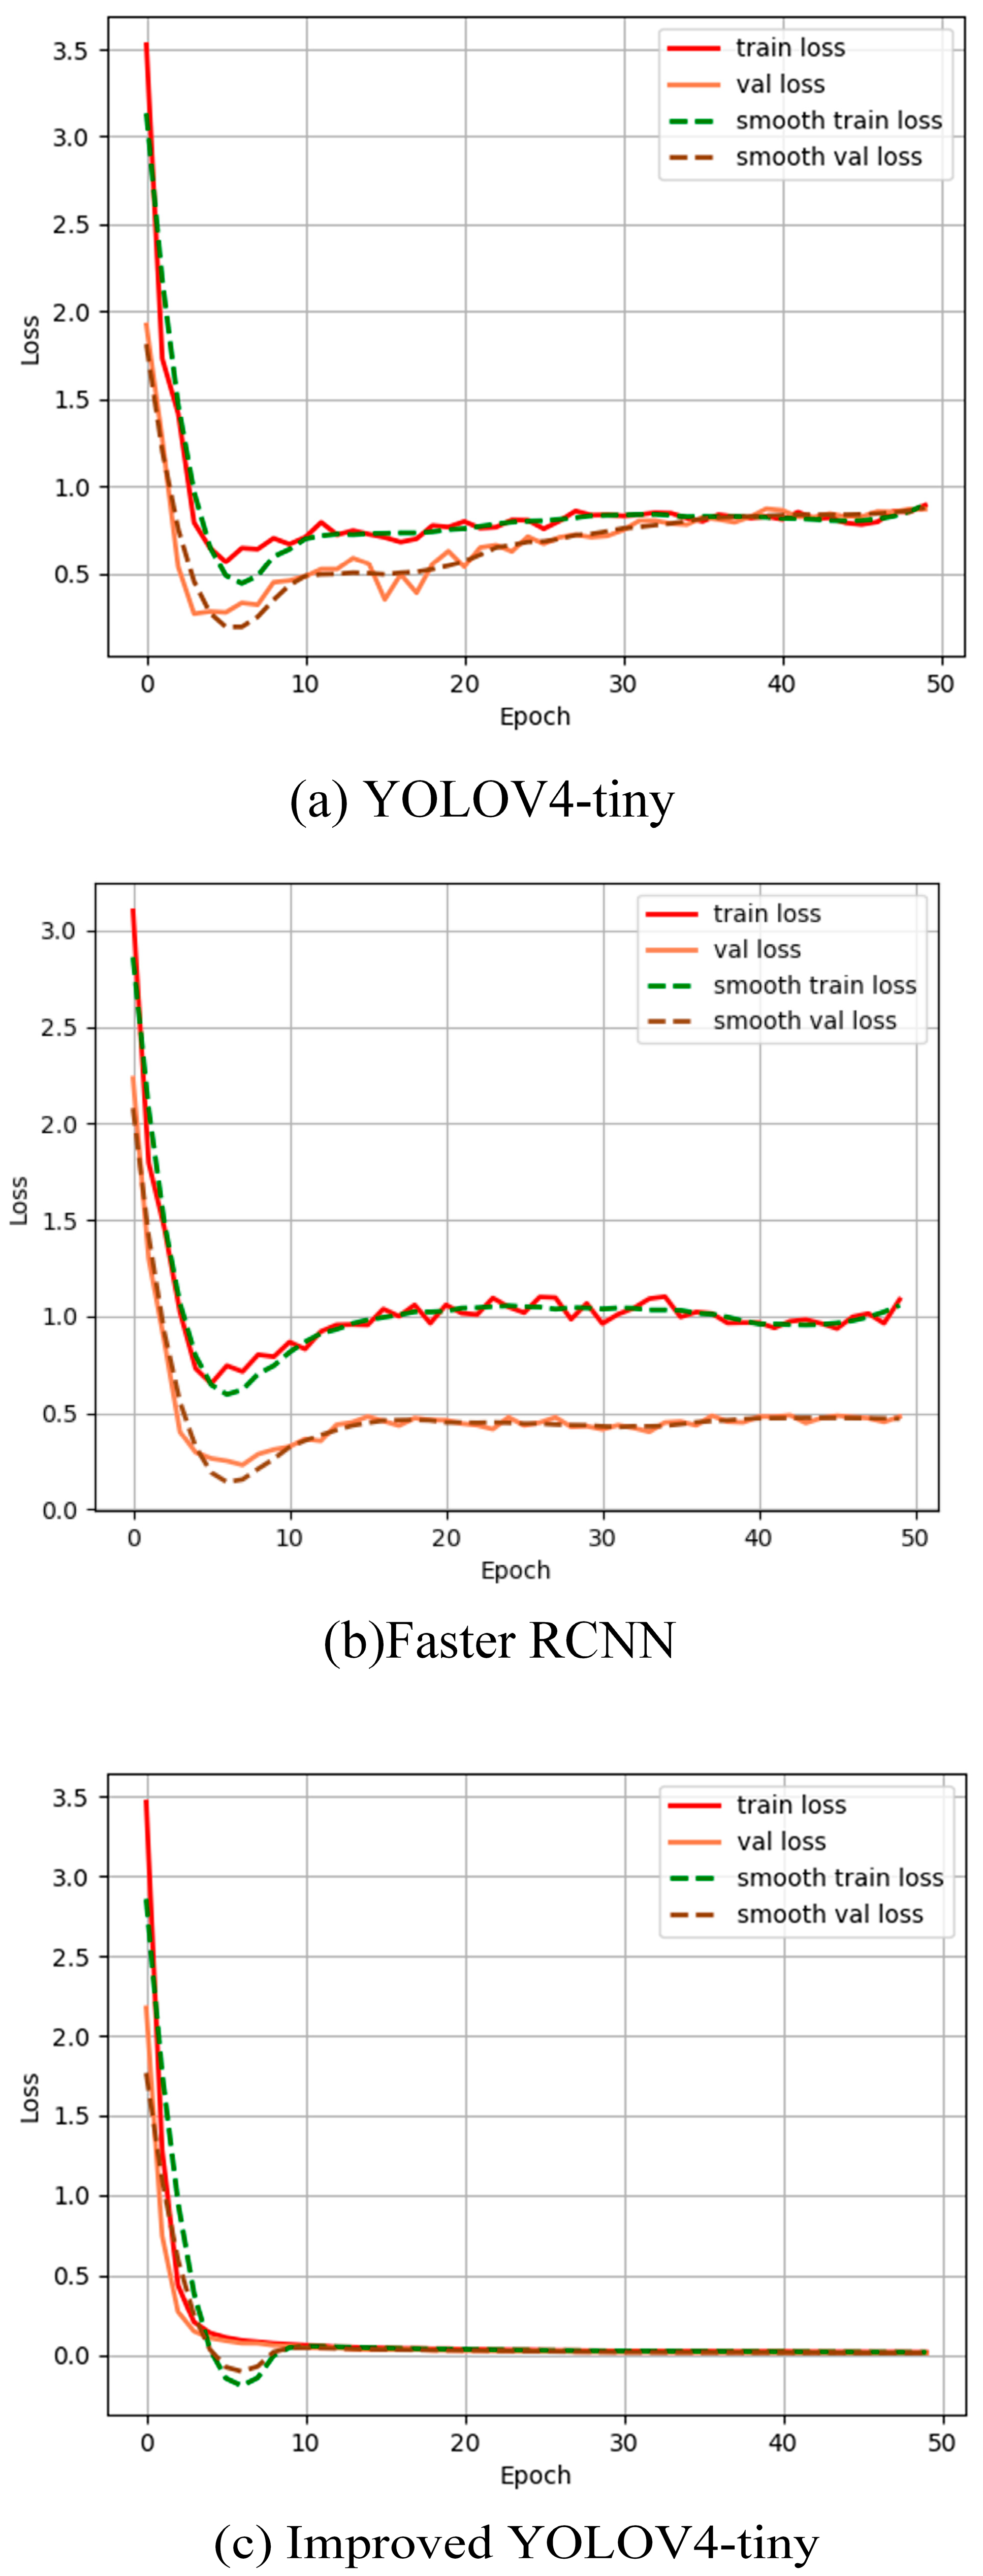
5.4. Validation of the Proposed Model

It can be seen from Figure 13 that the changing trend of Loss of YOLOV4-tiny and Faster RCNN algorithm first declines rapidly, then rises, and finally tends to be gentle. This indicates that both YOLOV4 and Faster RCNN are over-fitting after epoch > 20. The loss of the proposed model decreases rapidly and then levels off. The train loss and validation loss almost coincide. It indicates that the curve is very smooth without over-fitting at the end of the iteration. Comparing the three algorithms, the loss value of the improved YOLOV4-tiny algorithm in this paper is almost completely lower than that of the Faster RCNN and the YOLOV4 algorithm. Table 2 shows that the mAP value of the improved algorithm is 7.55% higher than that of the YOLOV4-tiny model and 9.23% higher than that of the Faster RCNN model. This demonstrates that the improved YOLOV4-tiny algorithm in this paper can achieve better detection of safety signs than the Faster RCNN and the YOLOV4 algorithm. However, the improved YOLOV4-tiny algorithm in this paper is higher than the Faster RCNN model due to the addition of the attention mechanism.

6. Conclusions and Future Work

Three feasible improvement strategies, including the attention mechanism, the soft-NMS, and the Focal Loss, were proposed for the YOLOV4-tiny algorithm to address the issues of long training time and inaccurate localization of small targets.
This paper proposed a method applied in the field of safety signs target detection based on the YOLOV4-tiny algorithm and improved it. First, the attention mechanism is introduced, and then the Soft-NMS algorithm and Focal Loss function are introduced. The experimental results indicate that various attention mechanism modules exhibit distinct precision and speed in safety sign detection, with the ECANet module demonstrating the most favorable performance. Furthermore, substituting the traditional NMS algorithm with the Soft NMS algorithm and incorporating the Focal LOSS function contribute to enhanced detection performance. This leads to a reduction in the model’s false detection rate, accompanied by a decrease in the variety of false detections. On this basis, the improved model in this paper is compared with the traditional YOLOV4-tiny model before the improvement and the two-stage representative algorithm Faster RCNN. It is concluded that the model detection performance in this paper is the best, with mAP reaching 97.76%, which was 7.55% and 9.23% higher compared to the YOLOV4-tiny and the Faster RCNN algorithms, respectively. At the same time, the detection speed FPS was 1.59, which was significantly improved by 0.38 compared with the two-stage detection algorithm Faster RCNN. At the same time, the over-fitting phenomenon in YOLOV4-tiny and Faster RCNN does not exist in the improved model training process. The improved model has good capability to detect both normal-sized and smaller-sized targets, as well as blurred safety signs in dim light. Overall, the proposed model significantly improved the performance of safety signs detection.
The algorithm in this paper has limitations for detecting safety sign images with overlapping occlusion objects and datasets. Further work will expand more datasets, collecting other categories of safety signs and covering more detection tasks in the safety field, such as unsafe behavior and dangerous goods, in order to improve the applicability and generalization of the model. Object detection is extensively employed in various fields, such as safety production and surveillance. Therefore, the next step is to consider improving the speed of the model further.

Author Contributions

Formal analysis, Investigation, Writing—original draft, Y.W.; Investigation, Writing—revision, L.Z.; Writing—revision, Supervision, Funding acquisition, Z.S. All authors have read and agreed to the published version of the manuscript.

Funding

This research was funded by the Youth Talent Program of Shaan’xi Province, Natural Science Foundation of Shaan’xi Province [No. 2023-JC-YB-432], and Key Research and Development Plan of Xinjiang Uygur Autonomous Region [No. 2022B03025-2 and No. 2022B03031-1]. And the APC was funded by no funder.

Institutional Review Board Statement

Not applicable.

Informed Consent Statement

Not applicable.

Data Availability Statement

The raw data supporting the conclusions of this article will be made available by the authors on request.

Conflicts of Interest

The authors declare no conflict of interest.

References

  1. Li, P.; Zhao, W. Image fire detection algorithms based on convolutional neural networks. Case Stud. Therm. Eng. 2020, 19, 100625. [Google Scholar] [CrossRef]
  2. Zhou, F.; Zhao, H.; Nie, Z. Safety helmet detection based on YOLOv5. In Proceedings of the 2021 IEEE International Conference on Power Electronics, Computer Applications (ICPECA), Shenyang, China, 22–24 January 2021; pp. 6–11. [Google Scholar]
  3. Xiao, Y.; Chang, A.; Wang, Y.; Huang, Y.; Yu, J.; Huo, L. Real-time Object Detection for Substation Security Early-warning with Deep Neural Network based on YOLO-V5. In Proceedings of the 2022 IEEE IAS Global Conference on Emerging Technologies (GlobConET), Arad, Romania, 20–22 May 2022; pp. 45–50. [Google Scholar]
  4. Fang, W.; Ding, L.; Luo, H.; Love, P.E.D. Falls from heights: A computer vision-based approach for safety harness detection. Autom. Constr. 2018, 91, 53–61. [Google Scholar] [CrossRef]
  5. Mneymneh, B.E.; Abbas, M.; Khoury, H. Evaluation of computer vision techniques for automated hardhat detection in indoor construction safety applications. Front. Eng. Manag. 2018, 5, 227–239. [Google Scholar] [CrossRef]
  6. Fang, Q.; Li, H.; Luo, X.; Ding, L.; Luo, H.; Li, C. Computer vision aided inspection on falling prevention measures for stee-plejacks in an aerial environment. Autom. Constr. 2018, 93, 148–164. [Google Scholar] [CrossRef]
  7. Liu, W.; Meng, Q.; Li, Z.; Hu, X. Applications of Computer Vision in Monitoring the Unsafe Behavior of Construction Workers: Current Status and Challenges. Buildings 2021, 11, 409. [Google Scholar] [CrossRef]
  8. Wang, G.; Ren, H.; Zhao, G.; Zhang, D.; Wen, Z.; Meng, L.; Gong, S. Research and practice of intelligent coal mine technology systems in China. Int. J. Coal Sci. Technol. 2022, 9, 24. [Google Scholar] [CrossRef]
  9. Chen, Y.; Silvestri, L.; Lei, X.; Ladouceur, F. Optically Powered Gas Monitoring System Using Single-Mode Fibre for Under-ground Coal Mines. Int. J. Coal Sci. Technol. 2022, 9, 26. [Google Scholar] [CrossRef]
  10. Zhou, L.; Pan, S.; Wang, J.; Vasilakos, A.V. Machine learning on big data: Opportunities and challenges. Neurocomputing 2017, 237, 350–361. [Google Scholar] [CrossRef]
  11. LeCun, Y.; Bengio, Y.; Hinton, G. Deep learning. Nature 2015, 521, 436–444. [Google Scholar] [CrossRef]
  12. Deng, L.; Yu, D. Deep learning: Methods and applications. Found. Trends® Signal Process. 2014, 7, 197–387. [Google Scholar] [CrossRef]
  13. Le, Q.V.; Ngiam, J.; Coates, A.; Lahiri, A.; Prochnow, B.; Ng, A.Y. On optimization methods for deep learning. In Proceedings of the 28th International Conference on International Conference on Machine Learning, Bellevue, WA, USA, 28 June–2 July 2011; pp. 265–272. [Google Scholar]
  14. Houben, S.; Stallkamp, J.; Salmen, J.; Schlipsing, M.; Igel, C. Detection of traffic signs in real-world images: The German Traffic Sign Detection Benchmark. In Proceedings of the 2013 International Joint Conference on Neural Networks (IJCNN), Dallas, TX, USA, 4–9 August 2013; pp. 1–8. [Google Scholar] [CrossRef]
  15. Greenhalgh, J.; Mirmehdi, M. Real-Time Detection and Recognition of Road Traffic Signs. IEEE Trans. Intell. Transp. Syst. 2012, 13, 1498–1506. [Google Scholar] [CrossRef]
  16. Ko, J.; Lim, J.H.; Chen, Y.; Musvaloiu-E, R.; Terzis, A.; Masson, G.M.; Gao, T.; Destler, W.; Selavo, L.; Dutton, R.P. MEDiSN: Medical emergency detection in sensor networks. ACM Trans. Embed. Comput. Syst. 2010, 10, 1–29. [Google Scholar] [CrossRef]
  17. Andreyanov, N.; Sytnik, A.; Shleymovich, M. Object Detection in Images Using Deep Neural Networks for Agricultural Ma-chinery. In IOP Conference Series: Earth and Environmental Science; IOP Publishing: Bristol, England, 2022; p. 032002. [Google Scholar]
  18. Zuo, Z.; Yu, K.; Zhou, Q.; Wang, X.; Li, T. Traffic signs detection based on faster r-cnn. In Proceedings of the 2017 IEEE 37th International Conference on Distributed Computing Systems Workshops (ICDCSW), Atlanta, GA, USA, 5–8 June 2017; pp. 286–288. [Google Scholar]
  19. Gaur, L.; Bhatia, U.; Jhanjhi, N.; Muhammad, G.; Masud, M. Medical image-based detection of COVID-19 using deep convo-lution neural networks. Multimed. Syst. 2023, 29, 1729–1738. [Google Scholar] [CrossRef]
  20. Li, W.; Wang, D.; Li, M.; Gao, Y.; Wu, J.; Yang, X. Field detection of tiny pests from sticky trap images using deep learning in agricultural greenhouse. Comput. Electron. Agric. 2021, 183, 106048. [Google Scholar] [CrossRef]
  21. Delhi, V.S.K.; Sankarlal, R.; Thomas, A. Detection of Personal Protective Equipment (PPE) Compliance on Construction Site Using Computer Vision Based Deep Learning Techniques. Front. Built Environ. 2020, 6, 136. [Google Scholar] [CrossRef]
  22. Teizer, J.; Caldas, C.H.; Haas, C.T. Real-Time Three-Dimensional Occupancy Grid Modeling for the Detection and Tracking of Construction Resources. J. Constr. Eng. Manag. 2007, 133, 880–888. [Google Scholar] [CrossRef]
  23. Cheng, T.; Teizer, J. Real-time resource location data collection and visualization technology for construction safety and activity monitoring applications. Autom. Constr. 2012, 34, 3–15. [Google Scholar] [CrossRef]
  24. Barro-Torres, S.; Fernández-Caramés, T.M.; Pérez-Iglesias, H.J.; Escudero, C.J. Real-time personal protective equipment mon-itoring system. Comput. Commun. 2012, 36, 42–50. [Google Scholar] [CrossRef]
  25. Krizhevsky, A.; Sutskever, I.; Hinton, G.E. Imagenet classification with deep convolutional neural networks. Commun. ACM 2017, 60, 84–90. [Google Scholar] [CrossRef]
  26. Simonyan, K.; Zisserman, A. Very deep convolutional networks for large-scale image recognition. arXiv 2014, arXiv:1409.1556. [Google Scholar]
  27. Szegedy, C.; Wei, L.; Jia, Y.; Sermanet, P.; Rabinovich, A. Going deeper with convolutions. In Proceedings of the 2015 IEEE Conference on Computer Vision and Pattern Recognition (CVPR), Boston, MA, USA, 7–12 June 2015. [Google Scholar]
  28. He, K.; Zhang, X.; Ren, S.; Sun, J. Deep residual learning for image recognition. In Proceedings of the IEEE Conference on Computer Vision and Pattern Recognition, Las Vegas, NV, USA, 27–30 June 2016; pp. 770–778. [Google Scholar]
  29. Girshick, R.; Donahue, J.; Darrell, T.; Malik, J. Rich feature hierarchies for accurate object detection and semantic segmentation. In Proceedings of the IEEE Conference on Computer Vision and Pattern Recognition, Columbus, OH, USA, 23–28 June 2014; pp. 580–587. [Google Scholar]
  30. Uijlings, J.R.; Van De Sande, K.E.; Gevers, T.; Smeulders, A.W. Selective search for object recognition. Int. J. Comput. Vis. 2013, 104, 154–171. [Google Scholar] [CrossRef]
  31. He, K.; Zhang, X.; Ren, S.; Sun, J. Spatial Pyramid Pooling in Deep Convolutional Networks for Visual Recognition. IEEE Trans. Pattern Anal. Mach. Intell. 2015, 37, 1904–1916. [Google Scholar] [CrossRef] [PubMed]
  32. Girshick, R. Fast r-cnn. In Proceedings of the IEEE International Conference on Computer Vision, Santiago, Chile, 7–13 December 2015; pp. 1440–1448. [Google Scholar]
  33. Ren, S.; He, K.; Girshick, R.; Sun, J. Faster R-CNN: Towards real-time object detection with region proposal networks. In Proceedings of the Advances in Neural Information Processing Systems 28 (NIPS 2015), Montreal, QC, Canada, 7–12 December 2015; Volume 28, pp. 91–99. [Google Scholar]
  34. Redmon, J.; Divvala, S.; Girshick, R.; Farhadi, A. You only look once: Unified, real-time object detection. In Proceedings of the IEEE Conference on Computer Vision and Pattern Recognition, Las Vegas, NV, USA, 27–30 June 2016; pp. 779–788. [Google Scholar]
  35. Redmon, J.; Farhadi, A. YOLO9000: Better, faster, stronger. In Proceedings of the IEEE Conference on Computer Vision and Pattern Recognition, Honolulu, HI, USA, 21–26 June 2017; pp. 7263–7271. [Google Scholar]
  36. Liu, W.; Anguelov, D.; Erhan, D.; Szegedy, C.; Reed, S.; Fu, C.-Y.; Berg, A.C. Ssd: Single shot multibox detector. In Proceedings of the European Conference on Computer Vision, Amsterdam, The Netherlands, 11–14 October 2016; pp. 21–37. [Google Scholar]
  37. Lin, T.-Y.; Goyal, P.; Girshick, R.; He, K.; Dollár, P. Focal loss for dense object detection. In Proceedings of the IEEE International Conference on Computer Vision, Venice, Italy, 22–29 October 2017; pp. 2980–2988. [Google Scholar]
  38. Yang, J.; Chang, B.; Zhang, Y.; Wu, M. Research on CNN Coal and Rock Recognition Method Based on Hyperspectral Data. Int. J. Coal Sci. Technol. 2022. preprints. [Google Scholar] [CrossRef]
  39. Chen, S.; Tang, W.; Ji, T.; Zhu, H.; Ouyang, Y.; Wang, W. Detection of safety helmet wearing based on improved faster R-CNN. In Proceedings of the 2020 International Joint Conference on Neural Networks (IJCNN), Glasgow, UK, 19–24 July 2020; pp. 1–7. [Google Scholar]
  40. Wang, H.; Hu, Z.; Guo, Y.; Yang, Z.; Zhou, F.; Xu, P. A Real-Time Safety Helmet Wearing Detection Approach Based on CSYOLOv3. Appl. Sci. 2020, 10, 6732. [Google Scholar] [CrossRef]
  41. Bochkovskiy, A.; Wang, C.-Y.; Liao, H.-Y.M. Yolov4: Optimal speed and accuracy of object detection. arXiv 2020, arXiv:2004.10934. [Google Scholar]
  42. Yunyun, L.; JIANG, W. Detection of wearing safety helmet for workers based on YOLOv4. In Proceedings of the 2021 Inter-national Conference on Computer Engineering and Artificial Intelligence (ICCEAI), Shanghai, China, 27–29 August 2021; pp. 83–87. [Google Scholar]
  43. Benyang, D.; Xiaochun, L.; Miao, Y. Safety helmet detection method based on YOLO v4. In Proceedings of the 2020 16th In-ternational Conference on Computational Intelligence and Security (CIS), Guangxi, China, 27–30 November 2020; pp. 155–158. [Google Scholar]
  44. Yan, W.; Wang, X.; Tan, S. YOLO-DFAN: Effective High-Altitude Safety Belt Detection Network. Future Internet 2022, 14, 349. [Google Scholar] [CrossRef]
  45. Wu, S.; Zhang, L. Using popular object detection methods for real time forest fire detection. In Proceedings of the 2018 11th International Symposium on Computational Intelligence and Design (ISCID), Hangzhou, China, 8–9 December 2018; pp. 280–284. [Google Scholar]
  46. Haibin, L.; Yuan, S.; Wenming, Z.; Yaqian, L. The detection method for coal dust caused by chute discharge based on YOLOv4-tiny. Opto-Electron. Eng. 2021, 48, 210049. [Google Scholar]
  47. Ullah, M.B. CPU based YOLO: A real time object detection algorithm. In Proceedings of the 2020 IEEE Region 10 Symposium (TENSYMP), Dhaka, Bangladesh, 5–7 June 2020; pp. 552–555. [Google Scholar]
  48. Wang, X.; Hua, X.; Xiao, F.; Li, Y.; Hu, X.; Sun, P. Multi-Object Detection in Traffic Scenes Based on Improved SSD. Electronics 2018, 7, 302. [Google Scholar] [CrossRef]
  49. Wang, Q.; Wu, B.; Zhu, P.; Li, P.; Zuo, W.; Hu, Q. ECA-Net: Efficient channel attention for deep convolutional neural networks. In Proceedings of the IEEE/CVF Conference on Computer Vision and Pattern Recognition, Seattle, WA, USA, 13–19 June 2020; pp. 11534–11542. [Google Scholar]
  50. Hu, J.; Shen, L.; Sun, G. Squeeze-and-excitation networks. In Proceedings of the IEEE Conference on Computer Vision and Pattern Recognition, Salt Lake City, UT, USA, 18–23 June 2018; pp. 7132–7141. [Google Scholar]
  51. GB2894-2008; Safety Signs Guideline for the Use. China National Standardization Administrative Committee: Beijing, China, 2008.
  52. Everingham, M.R.; Eslami, S.; Gool, L.J.; Williams, C.; Winn, J.M.; Zisserman, A. The Pascal Visual Object Classes Challenge. Int. J. Comput. Vis. 2015, 111, 98–136. [Google Scholar] [CrossRef]
  53. Lin, T.Y.; Goyal, P.; Girshick, R.; He, K.; Dollar, P. Focal loss for dense object detection. IEEE Trans. Pattern Anal. Mach. Intell. 2020, 42, 318–327. [Google Scholar] [CrossRef]
Figure 1. The structure of YOLOV4-tiny deep neural network.
Applsci 14 02556 g001
Figure 2. YOLOV4-tiny structure with the attention mechanism.
Applsci 14 02556 g002
Figure 3. ECA attention module structure [49].
Applsci 14 02556 g003
Figure 4. Image comparison before and after data augmentation.
Applsci 14 02556 g004
Figure 5. Data augmentation for safety sign images.
Applsci 14 02556 g005
Figure 6. Comparison of partial detection results with the introduction of SENet, CBAM, and ECANet.
Applsci 14 02556 g006
Figure 7. Comparison of heat map results with the introduction of SENet, CBAM, and ECANet.
Applsci 14 02556 g007
Figure 8. P-R curves of safety signs detection using the ECANet attention mechanism.
Applsci 14 02556 g008
Figure 9. The log-average miss rate of (a) NMS and (b) Soft-NMS.
Applsci 14 02556 g009
Figure 10. The log-average miss rate of the traditional loss function and Focal loss function.
Applsci 14 02556 g010
Figure 11. The different values of α and the test results.
Applsci 14 02556 g011
Figure 12. Comparison of partial detection results of Focal loss when α is 0.25, 0.5, and 0.75.
Applsci 14 02556 g012
Figure 13. Evolution of the loss function with epoch for (a) the YOLOV4-tiny, (b) the Faster RCNN, and (c) the Improved YOLOV4-tiny models.
Applsci 14 02556 g013
Table 1. Dataset for object detection of safety signs.
Safety SignsOriginal NumberAugmented Number
Wearing protective gloves48239
Wearing safety helmet47187
Wearing dustproof mask49195
Warning electric shock57227
Warning poisoning44176
Emergency exit54215
No climbing52207
No smoking47188
No fireworks53213
Emergency shelter38153
Total4892000
Table 2. The different algorithm models and the test results.
AlgorithmmAP/%FPS/s
YOLOV4-tiny90.212.34
YOLOV4-tiny + Attention mechanismECANet96.031.63
SENet90.321.46
CBAM94.131.62
YOLOV4-tiny + ECANet + Soft-NMS97.101.59
YOLOV4-tiny + ECANet + Soft-NMS + Lfl97.761.62
Faster RCNN88.531.21
Disclaimer/Publisher’s Note: The statements, opinions and data contained in all publications are solely those of the individual author(s) and contributor(s) and not of MDPI and/or the editor(s). MDPI and/or the editor(s) disclaim responsibility for any injury to people or property resulting from any ideas, methods, instructions or products referred to in the content.

