Article

Experiment Study of Deformable Honeycomb Triboelectric Nanogenerator for Energy Collection and Vibration Measurement in Downhole

1
China Coal Technology & Engineering Group, Coal Mining Research Institute, Beijing 100013, China
2
Tiandi Science & Technology Co., Ltd., Beijing 100013, China
3
Faculty of Mechanical and Electronic Information, China University of Geosciences (Wuhan), Wuhan 430074, China
*
Author to whom correspondence should be addressed.
Appl. Sci. 2024, 14(6), 2539; https://doi.org/10.3390/app14062539
Submission received: 6 February 2024 / Revised: 13 March 2024 / Accepted: 13 March 2024 / Published: 18 March 2024
(This article belongs to the Section Electrical, Electronics and Communications Engineering)

Abstract

:
Downhole drilling tool vibration measurement is crucial for drilling exploration safety, so real-time monitoring of vibration data is required. In this research, a honeycomb triboelectric nanogenerator (H-TENG) capable of adapting to various downhole environments is proposed. It can measure the frequency of downhole drilling equipment’s vibrations and transfer mechanical energy to electrical energy for use in powering other low power downhole meters. In order to preliminarily verify the possibility of sensors used for vibration measurement of downhole drilling tools, we built a simulated vibration platform to test the sensing performance and vibration energy collection performance of H-TENG. According to the testing results, the measurement range of vibration frequency and amplitude are 0 to 11 Hz and 5 to 25 mm, respectively, and the corresponding measurement errors are less than 5% and 6%, respectively. For vibrational energy harvesting, when four sensors are wired in series with a 107 resistance, the maximum power is approximately 1.57 μW. Compared to typical methods for measuring downhole vibration, the honeycomb triboelectric nanogenerator does not need an external power source, it has greater reliability and output power, and it can vary its shape to adapt to the complicated downhole environment. In addition, the H-TENG can be combined freely according to the diameter of the drill string, and even if one sensor unit is damaged, the other units can still be used normally.

1. Introduction

Drilling is the process of drilling a hole into the ground with a drill tool in order to discover underground mineral deposits [1]. Vibration occurs during drilling due to the collision of drilling tools with rock. Measuring vibration information is helpful for real-time monitoring and management of the drilling process, improving operation efficiency, reducing loss, and ensuring drilling safety [2]. As a result, it is necessary to monitor the vibrational condition of downhole drilling instruments in real-time. Due to complex and changeable downhole conditions, most scholars concentrate on the theoretical level of downhole vibration [3] such as mathematical models [4,5], which cannot provide feedback to the actual downhole state. For the measurement method of downhole vibration, most scholars install sensors at the bottom of the hole to measure downhole vibration, such as acceleration sensors [6,7], acoustic sensors [8], optical sensing technology [9], and so on. Furthermore, some researchers monitor vibration by affixing sensors to the hole’s surface [10,11].
However, the aforementioned methods all have defects. If the sensor is installed on the surface of the hole, its measurement accuracy is not high, and it cannot correctly reflect the vibration signal at the bottom of the hole [12]. If the sensor is installed at the bottom of the hole, it is difficult to adapt to the complex and changeable underground environment, and more battery or cable power supply not only reduces construction efficiency but also increases drilling costs [13,14]. Therefore, it is critical to create a self-powered sensor capable of adapting to the downhole environment and measuring the real-time condition of downhole drilling instruments.
Wang and colleagues proposed the Triboelectric Nanogenerator (TENG) based on triboelectrification and electrostatic induction in 2012 [15], and it has been utilized extensively in the fields of sensors [16,17,18] and energy collection [19,20], such as marine energy harvesting [21,22], wind energy harvesting [23,24], body kinetic energy [25], water wave energy [26,27], and so on. The energy harvested by triboelectric nanogenerators has been widely used in pressure sensors [28,29], angle sensors [30,31], health monitoring [32], motion detection [33,34], vibration sensors [35,36,37], etc. In addition, some scholars have also extended TENG to the field of downhole sensors and realized the monitoring of drilling tools’ rotational speed [38], vibration [39,40], and some other parameters. However, most of the existing downhole self-powered sensors focus on the measurement of downhole parameters and lack the same type of products that can flexibly change their sizes according to the downhole working condition. As a result, this research proposes a honeycomb sensor with free combination based on a triboelectric nanogenerator (H-TENG), which can be freely combined with the changing downhole environment to collect the energy from the vibrations downhole and measure the frequency of drill string vibration in self-powered mode.

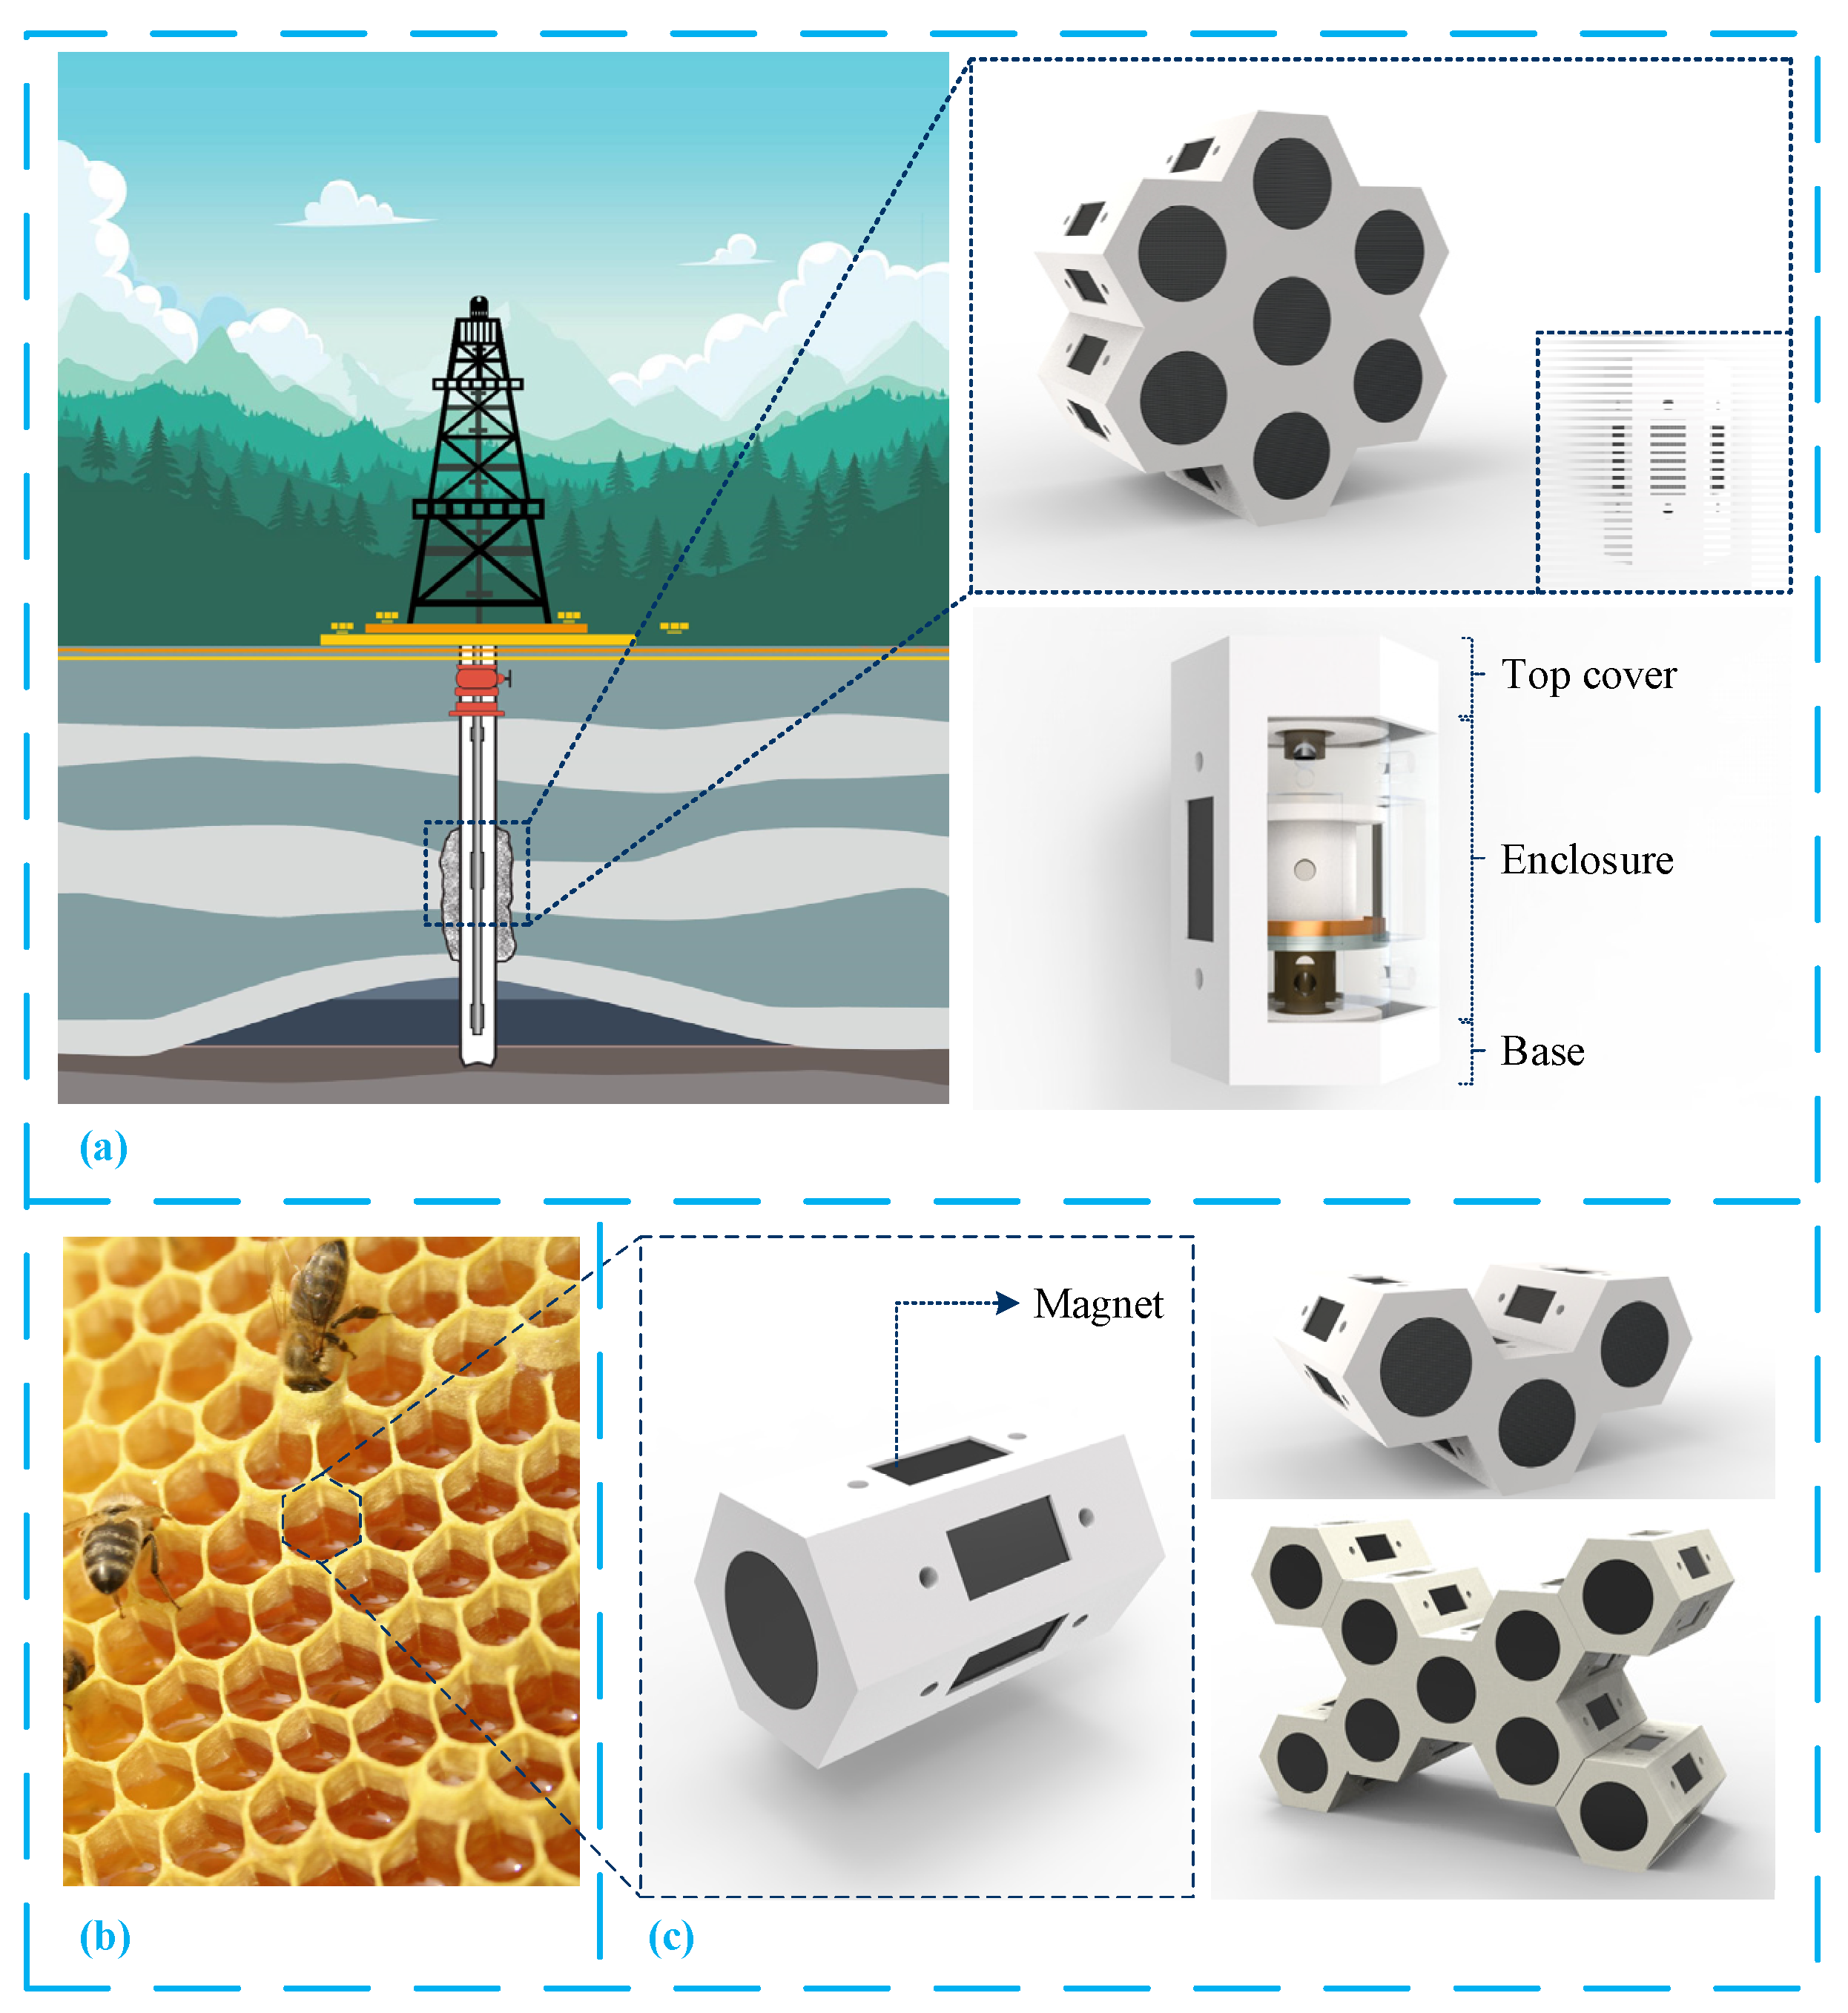
2. Structural Design and Working Principle of H-TENG

2.1. Design Requirements

Diverse geological features result in different downhole environments for drilling, hence, the sensor installation environment at the downhole is quite different. The size and shape of conventional sensors are currently fixed and incompatible with the variable downhole environment (Figure 1a). As a result, sensors must be designed in such a way that they can freely mix to adapt to various downhole situations. On the other hand, If the downhole drilling equipment is not sufficiently powered during the drilling process, replacing the battery will necessitate lifting the entire drilling equipment from the hole to the surface, which will incur a substantial economic cost. Therefore, the sensor should be designed to meet the requirements of self-power supply while maintaining high reliability and being able to provide power to other drilling equipment. The honeycomb is a porous structure in which bees reside and reproduce offspring, as depicted in Figure 1b. The honeycomb friction nanogenerator (H-TENG) designed in this paper is inspired by honeycombs. The honeycomb structure is widely used in various combined structures because of its good geometric characteristics and mechanical properties [41]. As shown in Figure 1c, a regular hexagon is extracted from the appearance of the honeycomb, stretched to form a hexagon, and can be combined into different shapes of sensors using magnets on the side of the prism, suitable for various downhole environments. At the same time, since each prism can achieve the measurement of vibrations, it has a high degree of reliability. More prisms can effectively increase the total friction area, thereby increasing the output power.

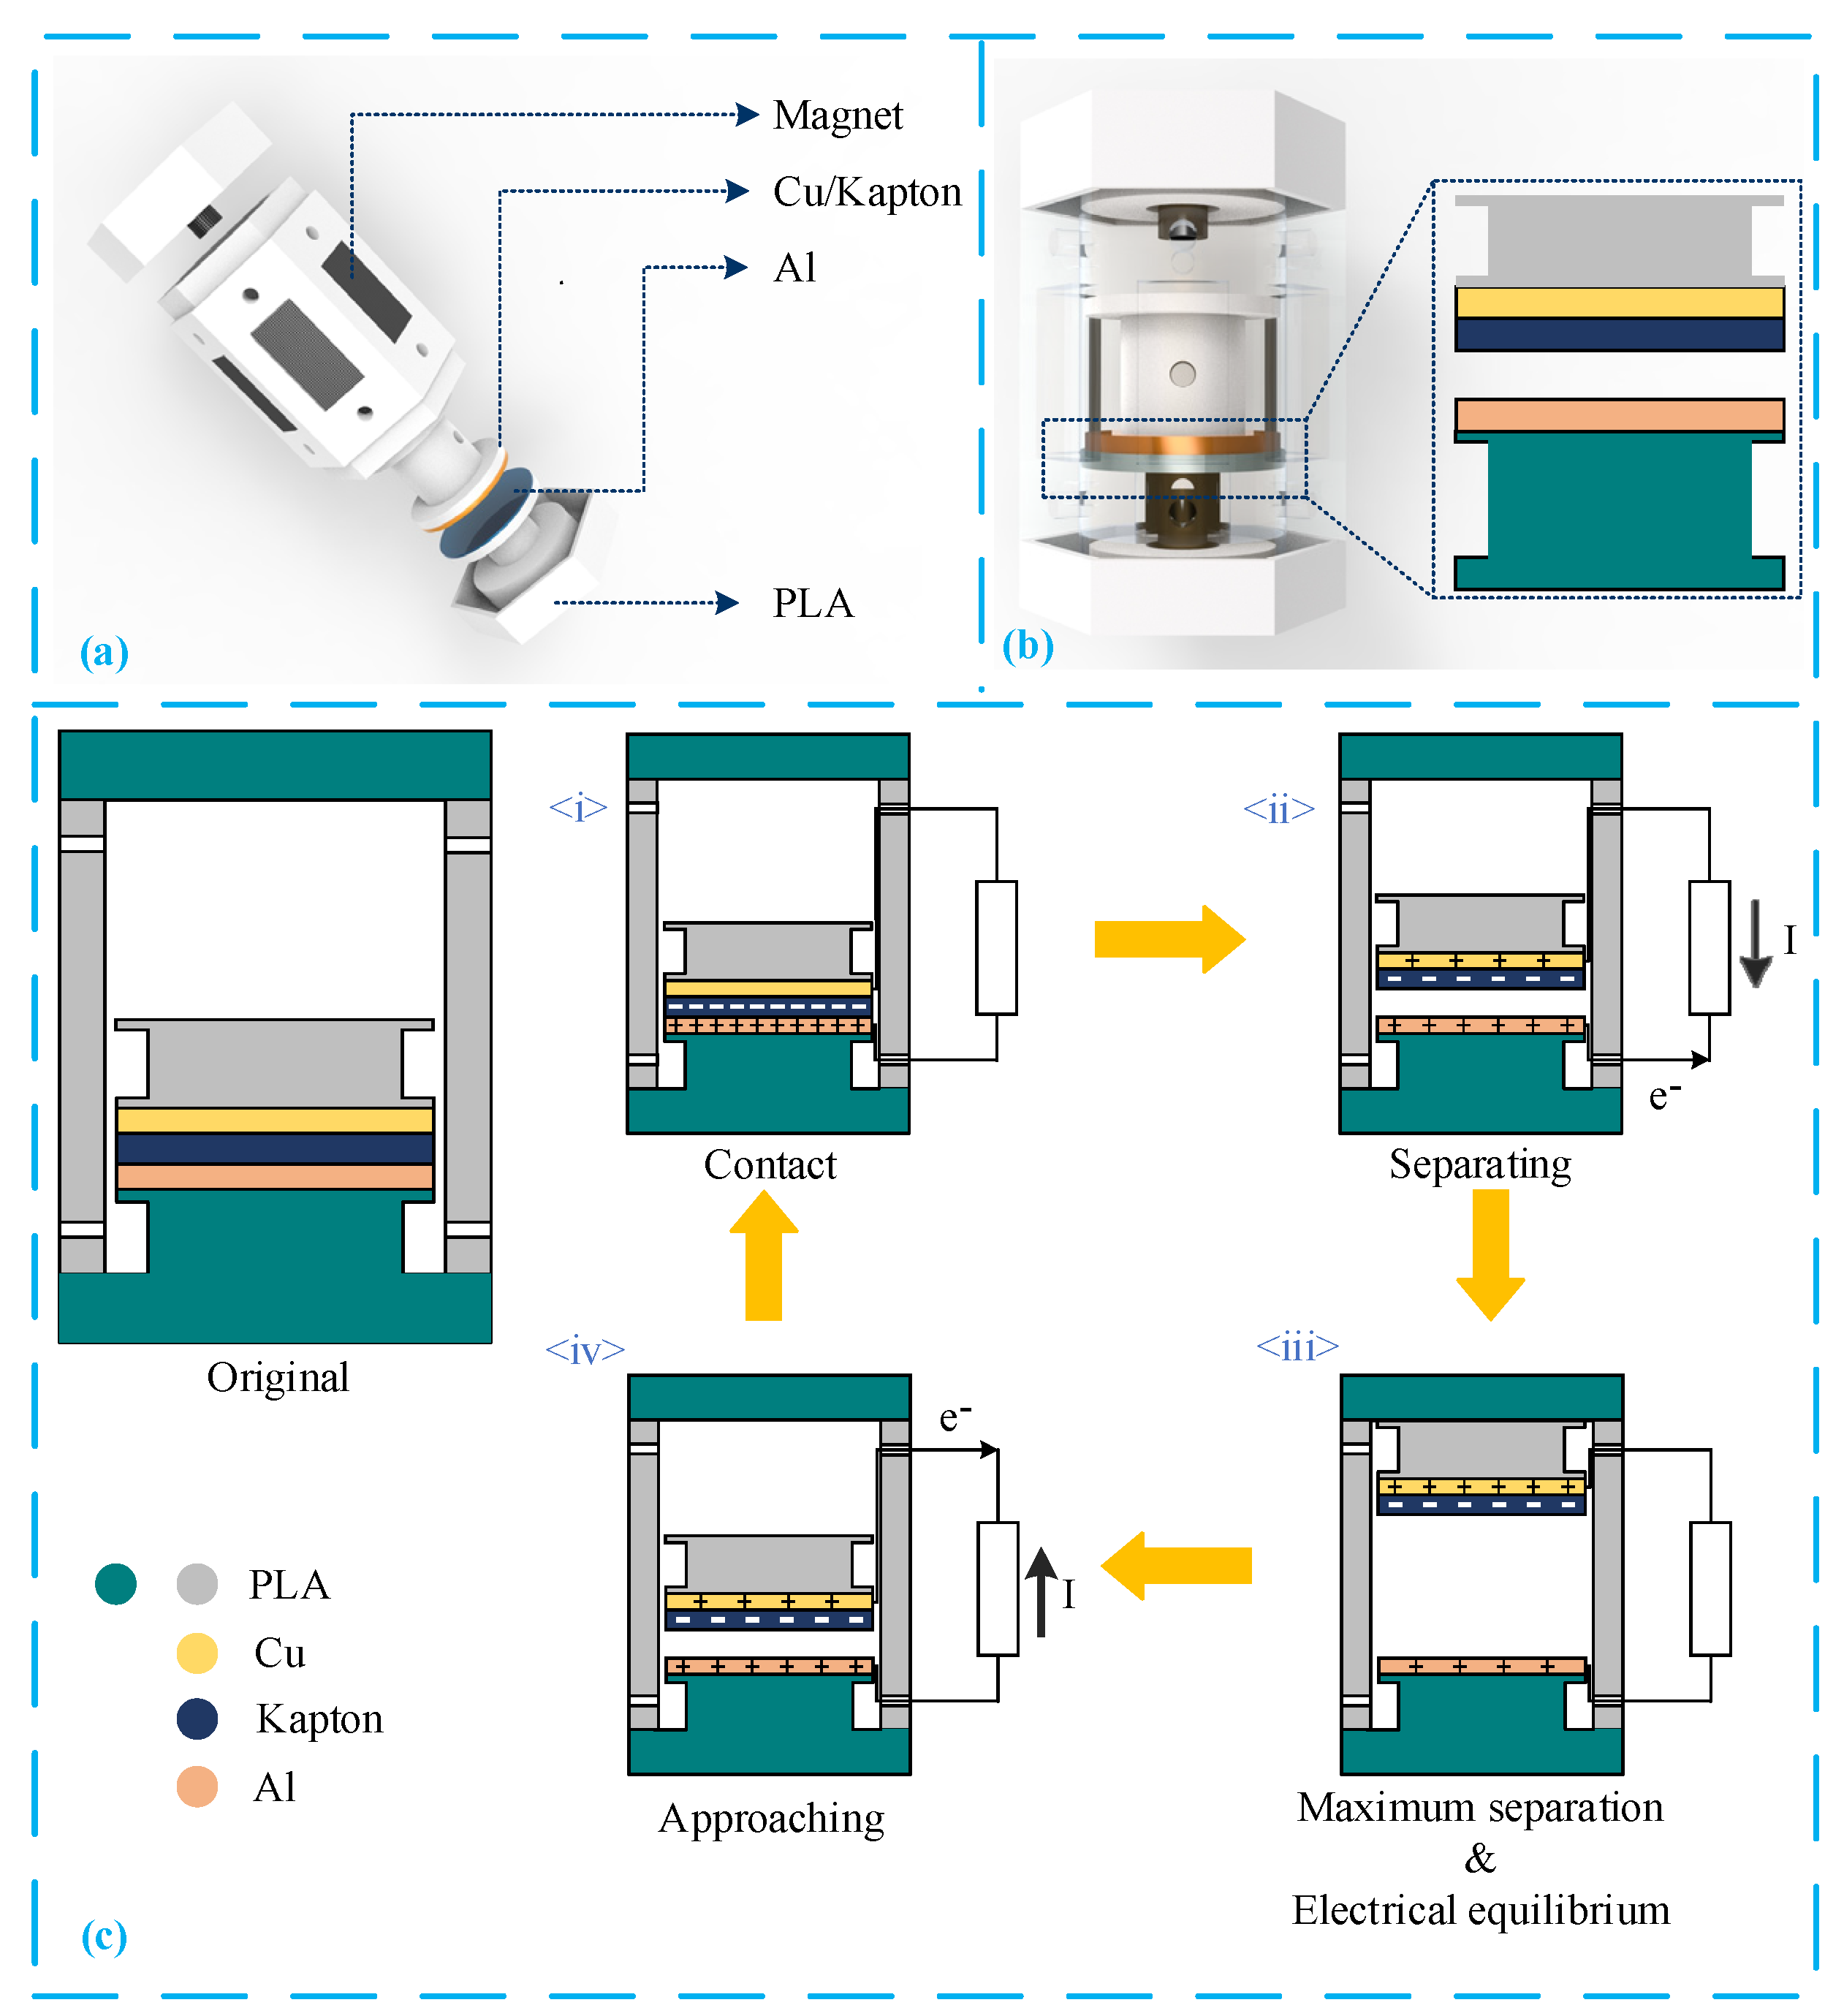
2.2. Structure and Working Principle

Figure 2a is an explosion diagram of H-TENG, and Figure 2b is a structural diagram of H-TENG. The exterior of the H-TENG consists of a base, a top cover, and housing, and inside is a vibrating body that can move freely and come into direct contact with the base. Rectangular magnets are embedded in all six sides of the housing to allow free assembly, and perforations are made on the sides of the housing to connect wires. According to the triboelectric sequence table [42], Al and Kapton are selected as friction materials, which can achieve a good output effect. Therefore, we chose these two materials as the friction layer of H-TENG. The drill string is fixed to the outside of the base, and the inside is attached to the aluminum (Al) and polyimide (Kapton). Al is attached to the underside of the vibrating body; Kapton (PY11YG, Lingmei Co., Ltd., Dongguan, China) serves as a friction layer to produce friction charge and Al serves as the electrode output to produce friction charge, while Al also serves as a friction layer and an electrode layer at the same time, and is connected with the copper (Cu) electrode through wires. When axial vibration occurs, the vibrator moves up and down under the action of inertial forces, causing Kapton to contact the Al to generate an electric charge; thus, the measurement of the vibration frequency and further processing of the vibration energy are made possible. The whole H-TENG is 3D printed with polylactic acid (PLA) material, the printing temperature is 210 degrees Celsius, and the printing layer thickness is 0.3 mm. The hexagonal base and top cover edge are 20 mm long, the housing length is 50 mm, the magnet size is 20 × 10 mm2, and the cylinder size in the vibrator is 19 mm.
Figure 2c is a cross-sectional view of H-TENG showing how the sensor works and the charge distribution. In the initial state (Figure 2c(i)), Kapton is exposed to Al because of gravity. Because Al and Kapton have different abilities to gain and lose electrons, at this point, the Al surface is positively charged, whereas the Kapton surface is negatively charged. Since the polymer has strong insulation, it can maintain the charge on the surface of the material for a long time. Then, when axial vibration occurs, the two friction layers are separated under the action of inertial forces. Due to electrostatic induction, the open circuit voltage between the two electrodes gradually increases at this time (Figure 2c(ii)). When the vibrator is running to the top (Figure 2c(iii)), the distance between the two friction layers is maximized and the open circuit voltage reaches its peak value. Subsequently, the separation distance between the two friction layers is gradually reduced (Figure 2c(iv)), and to balance the potential, the charge is transferred in reverse to produce a reverse current. Finally, the distance between the two friction layers is gradually reduced back to its initial value. It can be seen that each vibration of H-TENG produces a voltage pulse, and by counting the number of pulse signals per unit of time, the vibration frequency can be determined.

3. Experiments and Results

The experiment consists of two parts: testing the sensing performance of H-TENG and evaluating the performance of collecting vibration energy. Figure 3 shows the experimental device, Figure 3b is the physical diagram of H-TENG, and Figure 3c is the voltage waveform diagram of multiple H-TENGs in parallel. It can be seen in Figure 3a that H-TENG is fixed on the vibration table, and by adjusting the vibration table’s controller, different vibration frequencies can be obtained. When measuring the performance of H-TENG, the data acquisition card (USB5632, ART Technology Co., Ltd., Beijing, China) and electrometer (6514, Keithley Co., Ltd., Solon, OH, USA) process the H-TENG output voltage and waveform, which are then connected to the computer and displayed by the LabView programming software.

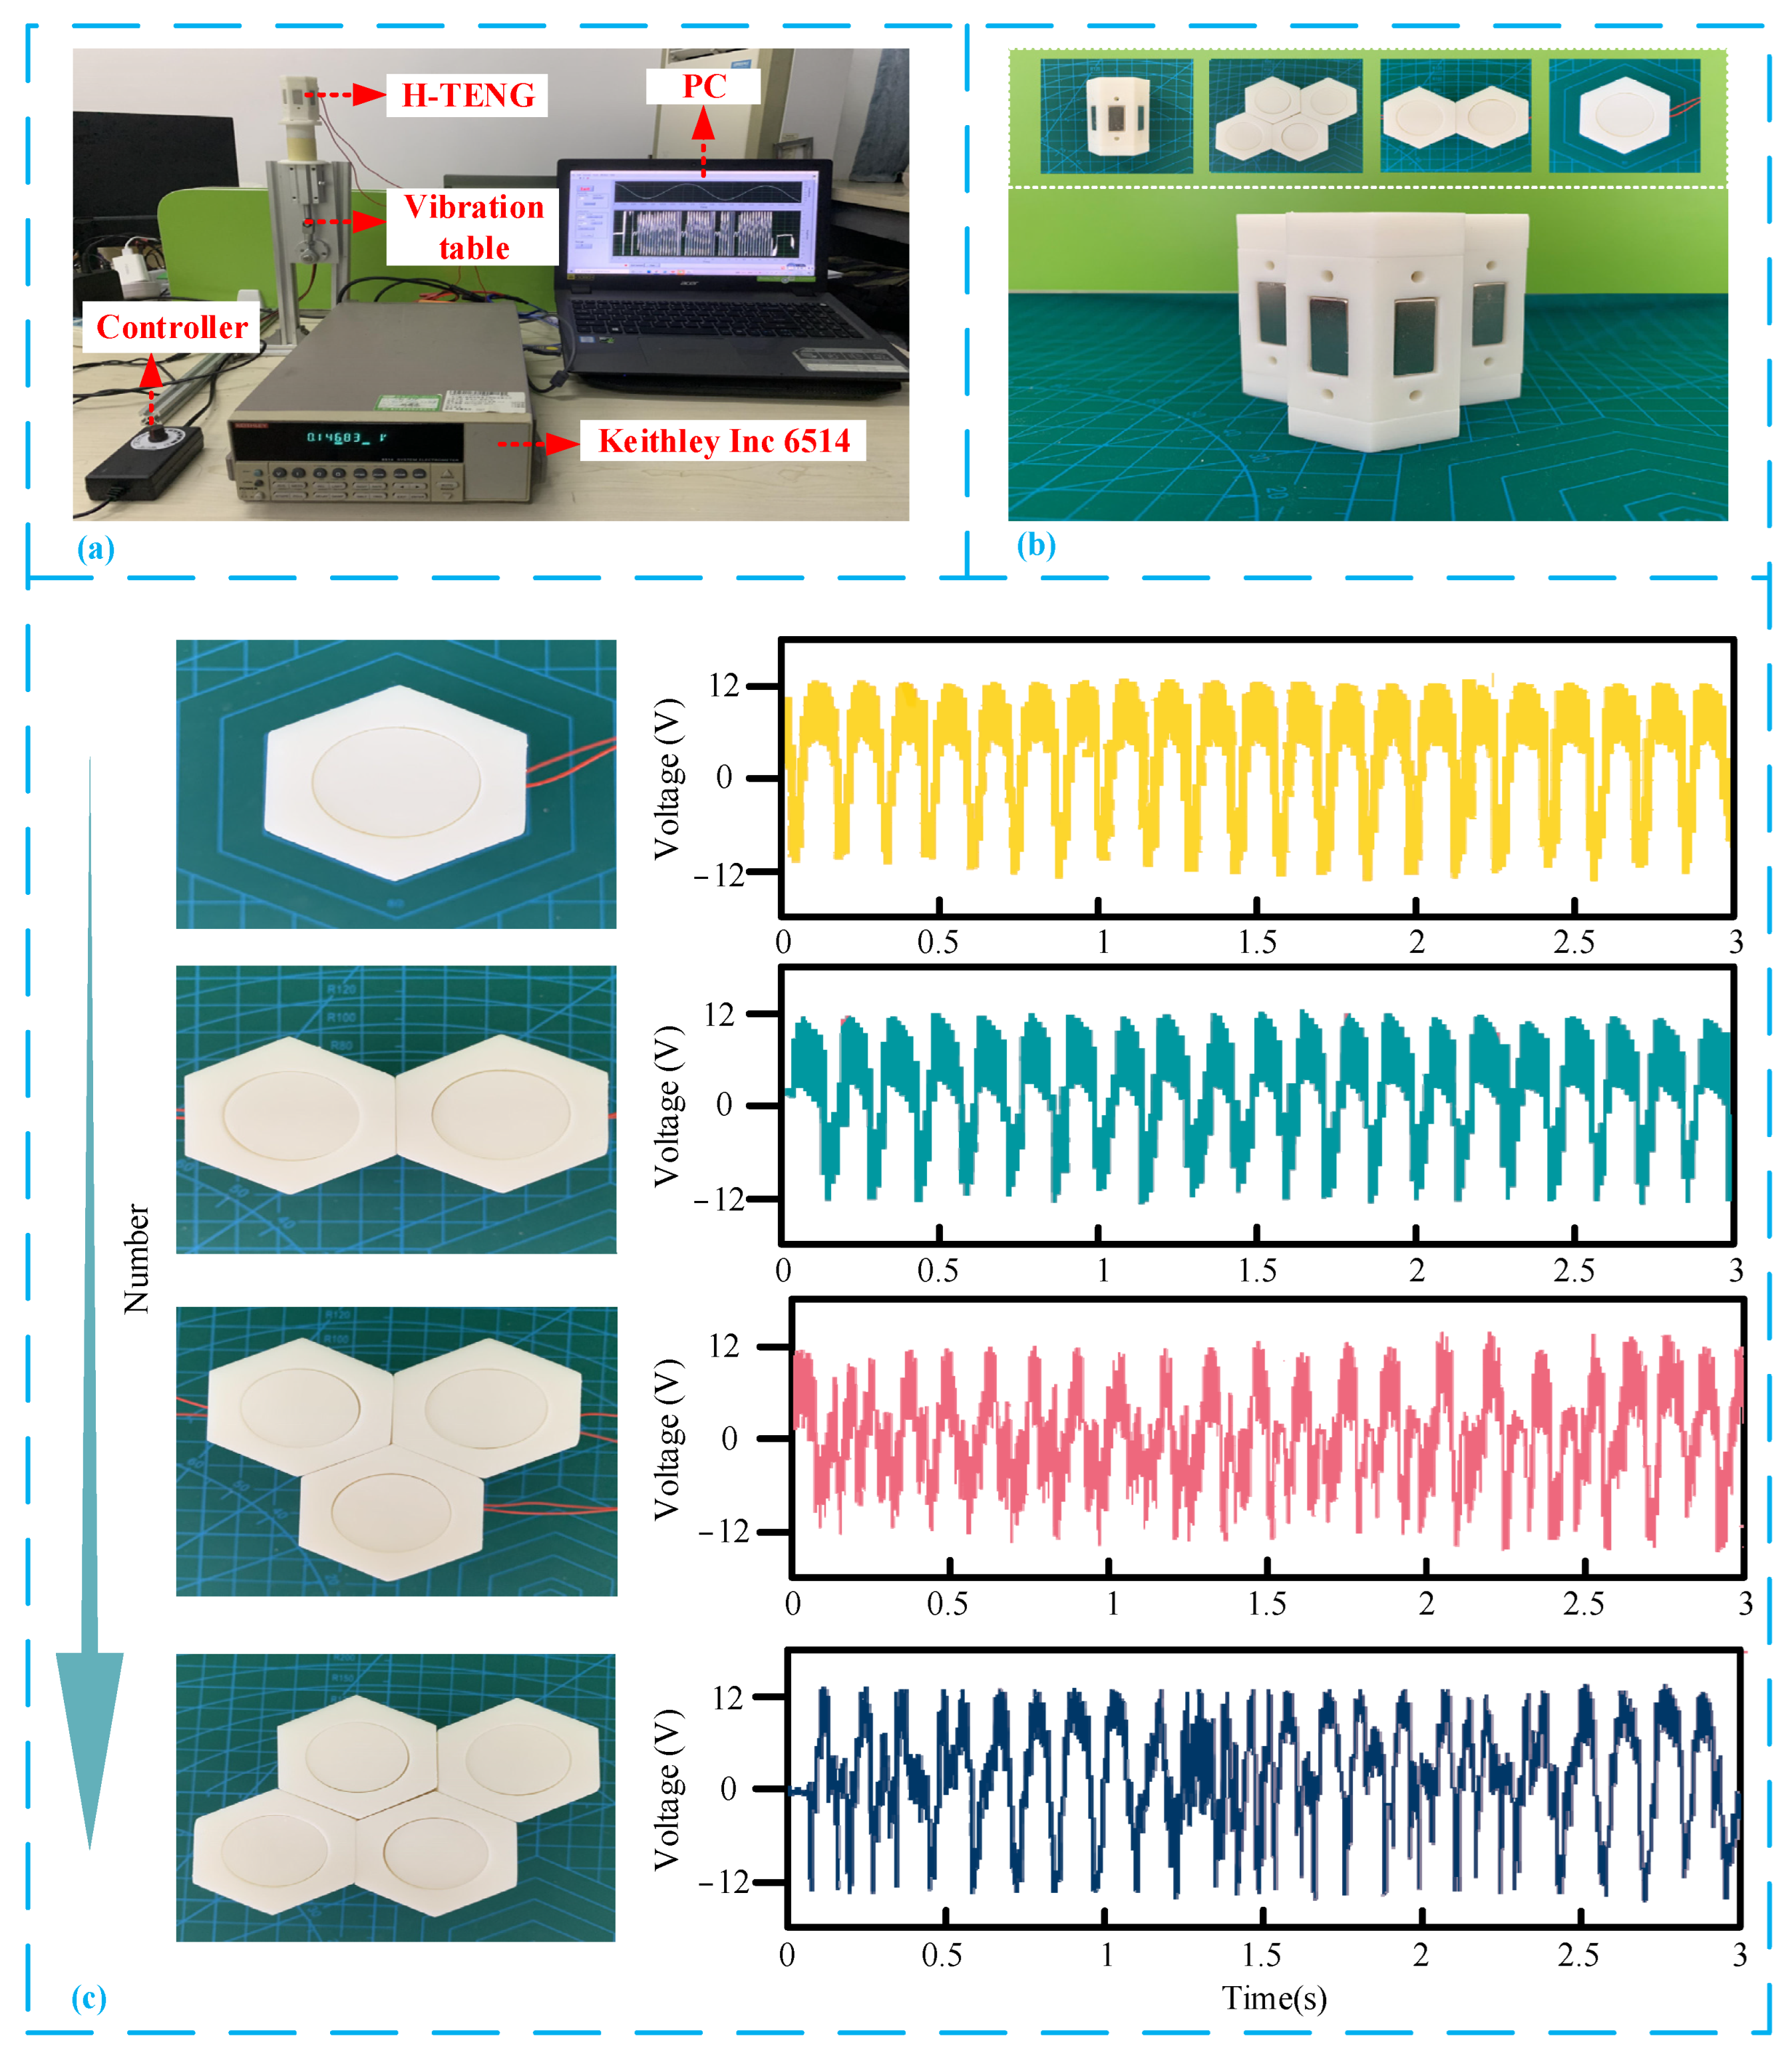
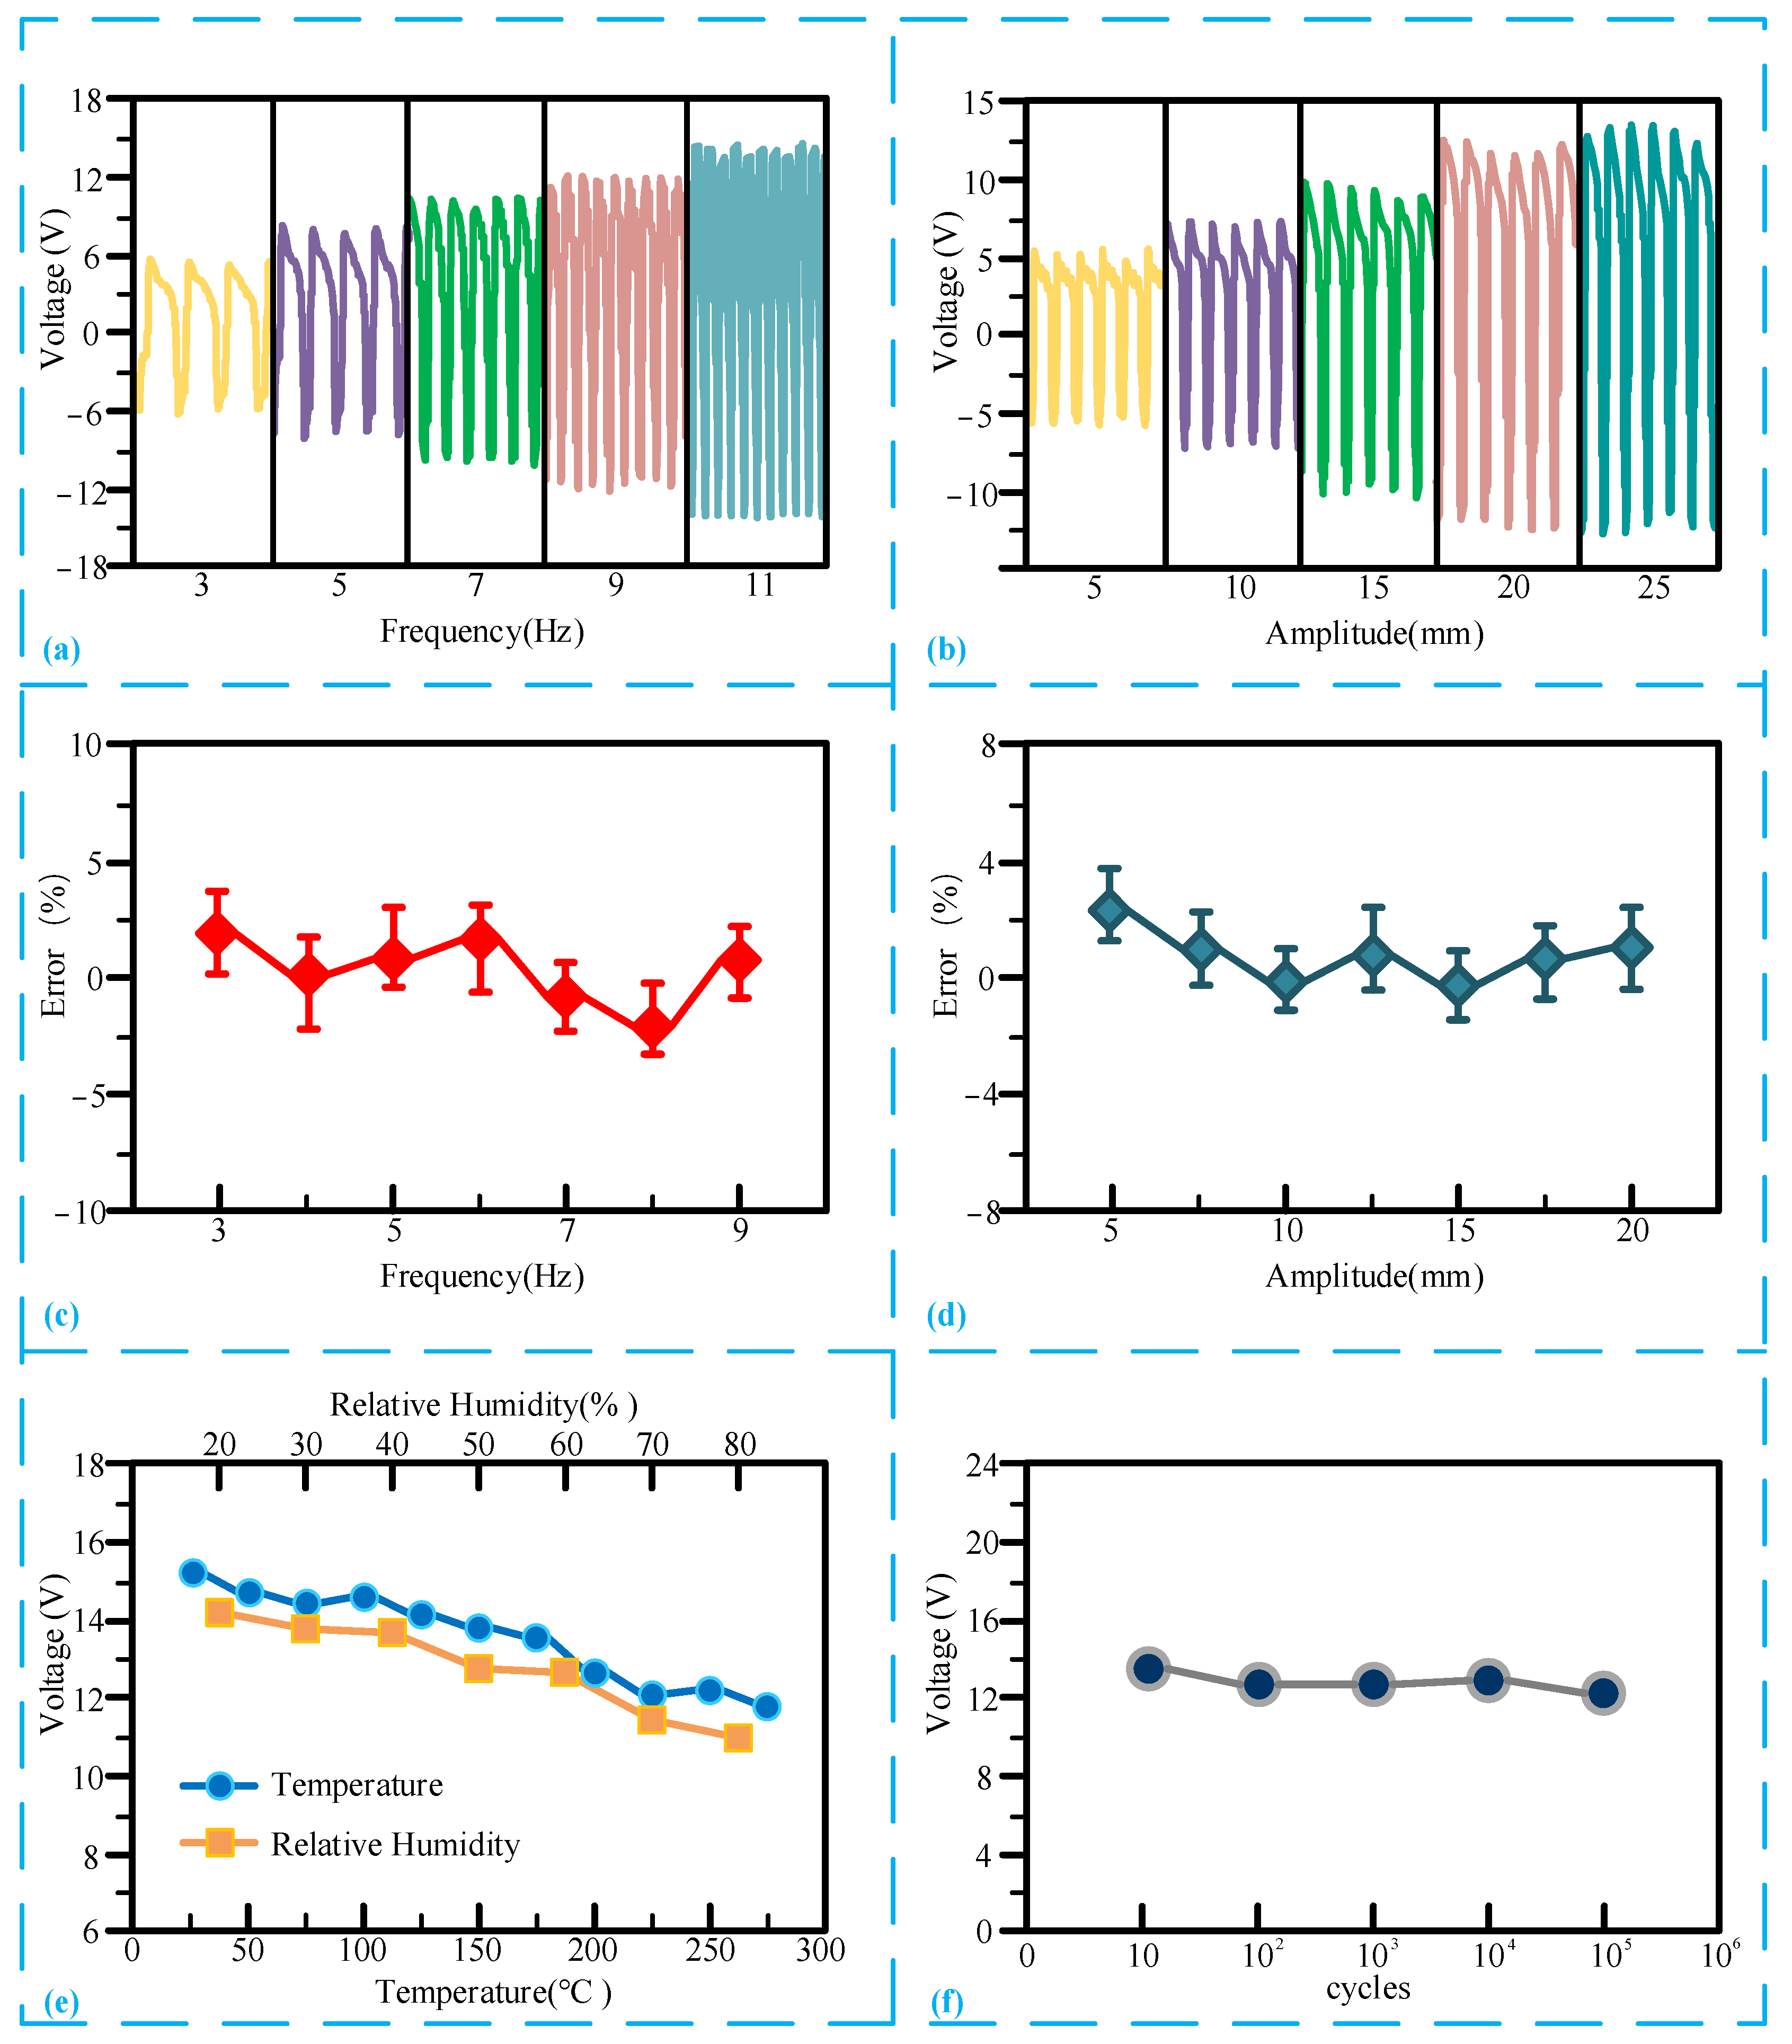
3.1. The Sensing Performance of H-TENG

After setting up the test bench, the output signal of H-TENG was tested. Figure 3c shows several voltage waveforms in parallel with H-TENG. It can be seen that when the vibration frequency is the same, the change of the number of parallel H-TENG connections will also lead to the change of the voltage waveform output by the sensor. When the sensor consists of one or two H-TENGs, its output voltage waveform is stable and regular. However, when the number of H-TENG units in the sensor increases, the peak value of its output voltage remains basically unchanged, but the waveform of the signal is gradually disturbed. Due to this, the number of H-TENG units should be selected according to the use requirements in actual working conditions to avoid the measurement function of the sensor being greatly affected. After many tests, when the number of H-TENG units in the sensor exceeds eight, its output voltage waveform will become chaotic, so the number of H-TENG units should not exceed eight in actual working conditions. Moreover, experiments have revealed that vibration frequency and amplitude affect H-TENG. As shown in Figure 4a, H-TENG’s output voltage is proportional to the vibration frequency, with a maximum voltage of 15 V, and as the vibration frequency increases, so does the number of voltage pulse signals per unit time. Next, the effect of vibration amplitude on H-TENG was tested. As illustrated in Figure 4b, the maximum output voltage of H-TENG can reach 12 V. However, when the amplitude exceeds 20 mm, the output signal remains stable. The reason for this may be that when the amplitude exceeds 20 mm, the output voltage of H-TENG will not increase because of the limited size and area of the friction layer. As the frequency and amplitude increase, the vibrator accelerates and the extrusion force increases, thereby increasing the contact area between the two friction layers and resulting in an increase in the output voltage.
The measurement error of vibration frequency and amplitude is obtained through statistical analysis. As illustrated in Figure 4c,d, the vibration frequency error is less than 5%, and the amplitude error is less than 6%, which can meet the actual work requirements of downhole drilling. On the other hand, the downhole temperature increases with the increase of the drilling depth, so the impact of the downhole temperature on the output performance of the sensor is also tested. As illustrated in Figure 4e, when the relative humidity increases from 20% to 80%, the output voltage of H-TENG gradually decreases, but the output voltage after the decrease is still very obvious. The output voltage of H-TENG decreases as temperature rises, and the drop range is within 12% (0 to 300 degrees Celsius). Nonetheless, the decreased range is still inside the noise signal, indicating that the sensor can operate correctly within the range of 300 degrees Celsius. Figure 4f demonstrates that the output voltage of the H-TENG sensor fluctuates minimally after 105 cycles, indicating that the sensor can still maintain a stable output after a long period of continuous operation, and that it has high reliability.

3.2. The Performance of Collecting Vibration Energy

H-TENG can convert vibration energy into electrical energy, so the functioning process of the sensor is also the device’s power generation process. If multiple H-TENGs are combined, other downhole drilling instruments can be powered. The sensor’s power generation performance was tested, and the results are shown in Figure 5. As illustrated in Figure 5a,b, the output voltages of a single H-TENG or four H-TENGs are proportional to the frequency and external load. When the frequency of vibration is 11 Hz and the series resistance value is 1010 Ω, a single H-TENG can provide a maximum output voltage of 12 V. When four H-TENGs are connected in parallel, the output voltage of multiple H-TENGs is up to 13 V. The output current of H-TENG is proportional to frequency and inversely proportional to resistance, as shown in Figure 5c,d. When the frequency of vibration is 11 Hz and the series resistance value is 1010 Ω, the maximum output current of a single H-TENG is 0.13 μA, and the maximum output current of multiple H-TENG is 0.33 μA. As shown in Figure 5e,f, when the frequency of vibration is 7 Hz, a single H-TENG can provide a maximum output power of 0.007 μW while the series resistance value is 106 Ω; when four H-TENGs are connected in parallel, the output power of multiple H-TENGs is up to 0.27 μW while the series resistance value is 107 Ω. The maximum output power is 0.037 μW for a single H-TENG at a frequency of 11 Hz and a resistor of 106 Ω. As shown in Figure 5f, for multiple H-TENGs, the maximum output power is 1.57 μW at a frequency of 11 Hz and a resistor of 107 Ω.
A rectifier bridge is used to convert the output AC signal to a DC signal and charge the 4.7 μF capacitor in order to display the output power in real-time. As depicted in Figure 6a, when the charging time is 50 s, a single H-TENG can charge the voltage to 0.8 V, while multiple H-TENGs can charge the voltage to 2 V, demonstrating the linear charging characteristics. The real-time output power of the sensor, which can light twelve LEDs, is shown in Figure 6b.

4. Conclusions and Future Perspectives

Inspired by honeycomb, a self-powered sensor for downhole applications is proposed in this research. The designed H-TENG can measure the vibration frequency in the drill string from 0 to 11 Hz and the amplitude from 5 to 25 mm. Errors in measuring vibration frequency and amplitude are fewer than 5% and 6%, respectively. When the vibration frequency is 11 Hz, a single H-TENG’s output voltage is 12 V. Furthermore, any H-TENG can be utilized as an independent vibration sensor, which means that even if one of the H-TENGs are damaged, the other H-TENGs can continue to function, resulting in high reliability. In terms of self-powered performance, the maximum output power is 1.57 μW at a frequency of 11 Hz and a resistor of 107 Ω when multiple H-TENGs are used in combination. H-TENG can light up to twelve LEDs in real-time, proving that the sensor can power other downhole instruments.
The H-TENG has the following advantages. Firstly, the H-TENG can realize self-powered sensing, it has a wide measurement range, high measurement accuracy, good high-temperature resistance, and its output voltage fluctuation is still very small after repeated work. Secondly, the H-TENG is composed of multiple sensing units, and the internal structure of each unit is consistent, so when one of the sensing units fails, the other units can still be used normally without affecting the measurement function of H-TENG. Thirdly, the combination of multiple sensing units can effectively improve the overall output power of H-TENG, which also makes it possible for H-TENG to supply power to other micro-power devices in the downhole environment.
However, although H-TENG satisfies the fundamental requirements, there are still two things that need to be enhanced. One is that the amplitude measurement error is currently slightly larger, which will cause the small gap between the output voltage produced by different amplitudes to introduce errors. The other is that H-TENG has limited power generation, but in the future, it is possible to increase power generation by changing nanomaterials and perfecting the structure of H-TENG.

Author Contributions

Validation, Y.F.; Writing—original draft, G.P.; Writing—review & editing, Y.F. and C.W.; Project administration, C.W. All authors have read and agreed to the published version of the manuscript.

Funding

This work was supported by the CNPC Innovation Found (2022DQ02-0309); the Scientific research project of Shaanxi Coal Industry and Chemical Industry Group Co., Ltd. (KCYJY-2023-ZD-02 and 2023-TD-ZD003-003); and the National Key R&D Program of China (2023YFC2907502).

Institutional Review Board Statement

Not applicable.

Informed Consent Statement

Not applicable.

Data Availability Statement

The data presented in this study are available on request from the corresponding author. The data are not publicly available due to privacy.

Conflicts of Interest

Author Yanjun Feng was employed by the company Tiandi Science & Technology Co., Ltd. The remaining authors declare that the research was conducted in the absence of any commercial or financial relationships that could be construed as a potential conflict of interest. The authors declare that this study received funding from Shaanxi Coal Industry and Chemical Industry Group Co., Ltd. The funder was not involved in the study design, collection, analysis, interpretation of data, the writing of this article or the decision to submit it for publication.

References

  1. Aadnoy, B.; Cooper, I.; Miska, S.; Mitchell, R.F.; Payne, M.L. Advanced Drilling and Well Technology; SPE: Houston, TX, USA, 2009. [Google Scholar]
  2. Ghasemloonia, A.; Rideout, D.G.; Butt, S.D. A review of drillstring vibration modeling and suppression methods. J. Pet. Sci. Eng. 2015, 131, 150–164. [Google Scholar] [CrossRef]
  3. Sugiura, J.; Samuel, R.; Oppelt, J.; Ostermeyer, G.P.; Hedengren, J.; Pastusek, P. Drilling modeling and simulation: Current state and future goals. In SPE/IADC Drilling Conference and Exhibition; OnePetro: London, UK, 2015. [Google Scholar]
  4. Tian, J.; Wu, C.; Yang, L.; Yang, Z.; Liu, G.; Yuan, C. Mathematical modeling and analysis of drill string longitudinal vibration with lateral inertia effect. Shock. Vib. 2016, 2016, 6281264. [Google Scholar] [CrossRef]
  5. Tian, J.; Zhou, Y.; Yang, L.; Hu, S. Analysis of stick-slip reduction for a new torsional vibration tool based on PID control. Proc. Inst. Mech. Eng. Part K J. Multi-Body Dyn. 2020, 234, 82–94. [Google Scholar] [CrossRef]
  6. Samuel, R. Kick Detection Using Downhole Accelerometer Data. J. Energy Resour. Technol. 2020, 142, 082901. [Google Scholar] [CrossRef]
  7. Xue, Q.; Leung, H.; Wang, R.; Liu, B.; Wu, Y. Continuous real-time measurement of drilling trajectory with new state-space models of Kalman filter. IEEE Trans. Instrum. Meas. 2015, 65, 144–154. [Google Scholar] [CrossRef]
  8. Wu, C.; Wen, G.J.; Wu, X.M.; Wang, W.Q.; Han, L.; Zhang, F. Using an acoustic sensor and accelerometer to measure the downhole impact frequency of a hydraulic impactor. J. Nat. Gas Sci. Eng. 2015, 27, 1296–1303. [Google Scholar] [CrossRef]
  9. Skinner, N.G.; Maida, J.L., Jr. Downhole fiber optic sensing: The oilfield service provider’s perspective: From the cradle to the grave. In Proceedings of the Fiber Optic Sensors and Applications XI. International Society for Optics and Photonics, Baltimore, MD, USA, 18 June 2014; Volume 9098, p. 909804. [Google Scholar]
  10. Millan, E.; Ringer, M.; Boualleg, R.; Li, D. Real-Time drillstring vibration characterization using machine learning. In SPE/IADC International Drilling Conference and Exhibition; SPE: The Hague, The Netherlands, 2019. [Google Scholar]
  11. Soares, C.; Gray, K. Real-time predictive capabilities of analytical and machine learning rate of penetration (ROP) models. J. Pet. Sci. Eng. 2019, 172, 934–959. [Google Scholar] [CrossRef]
  12. Ren, F.; Fang, T.; Cheng, X. Theoretical modeling and experimental study of rock-breaking depth in particle jet impact drilling process. J. Pet. Sci. Eng. 2019, 183, 106419. [Google Scholar] [CrossRef]
  13. Avant, C.; Daungkaew, S.; Behera, B.K.; Danpanich, S.; Laprabang, W.; Santo, I.; Heath, G.; Osman, K.; Khan, Z.A.; Russell, J.; et al. Testing the limits in extreme well conditions. Oilfield Rev. 2012, 24, 4–19. [Google Scholar]
  14. He, L.I.; Zheng, L.; Jiaqing, Y.U.; Eryang, M.I.; Qinghai, Y.A.; Deli, J.I.; Gang, C.A. Development and prospect of downhole monitoring and data transmission technology for separated zone water injection. Pet. Explor. Dev. 2023, 50, 191–201. [Google Scholar]
  15. Fan, F.R.; Tian, Z.Q.; Wang, Z.L. Flexible triboelectric generator. Nano Energy 2012, 1, 328–334. [Google Scholar] [CrossRef]
  16. Ha, M.; Park, J.; Lee, Y.; Ko, H. Triboelectric generators and sensors for self-powered wearable electronics. ACS Nano 2015, 9, 3421–3427. [Google Scholar] [CrossRef]
  17. Yu, J.; Hou, X.; Cui, M.; Zhang, S.; He, J.; Geng, W.; Mu, J.; Chou, X. Highly skin-conformal wearable tactile sensor based on piezoelectric-enhanced triboelectric nanogenerator. Nano Energy 2019, 64, 103923. [Google Scholar] [CrossRef]
  18. Liu, Z.; Zhao, Z.; Zeng, X.; Fu, X.; Hu, Y. Expandable microsphere-based triboelectric nanogenerators as ultrasensitive pressure sensors for respiratory and pulse monitoring. Nano Energy 2019, 59, 295–301. [Google Scholar] [CrossRef]
  19. Wang, Y.; Yang, Y.; Wang, Z.L. Triboelectric nanogenerators as flexible power sources. NPJ Flex. Electron. 2017, 1, 10. [Google Scholar] [CrossRef]
  20. Cheng, X.; Miao, L.; Song, Y.; Su, Z.; Chen, H.; Chen, X.; Zhang, J.; Zhang, H. High efficiency power management and charge boosting strategy for a triboelectric nanogenerator. Nano Energy 2017, 38, 438–446. [Google Scholar] [CrossRef]
  21. Seol, M.L.; Jeon, S.B.; Han, J.W.; Choi, Y.K. Ferrofluid-based triboelectric-electromagnetic hybrid generator for sensitive and sustainable vibration energy harvesting. Nano Energy 2017, 31, 233–238. [Google Scholar] [CrossRef]
  22. Wang, W.; Xu, J.; Zheng, H.; Chen, F.; Jenkins, K.; Wu, Y.; Wang, H.; Zhang, W.; Yang, R. A spring-assisted hybrid triboelectric–electromagnetic nanogenerator for harvesting low-frequency vibration energy and creating a self-powered security system. Nanoscale 2018, 10, 14747–14754. [Google Scholar] [CrossRef]
  23. Feng, Y.; Zhang, L.; Zheng, Y.; Wang, D.; Zhou, F.; Liu, W. Leaves based triboelectric nanogenerator (TENG) and TENG tree for wind energy harvesting. Nano Energy 2019, 55, 260–268. [Google Scholar] [CrossRef]
  24. Shi, B.; Wang, Q.; Su, H.; Li, J.; Xie, B.; Wang, P.; Qiu, J.; Wu, C.; Zhang, Y.; Zhou, X.; et al. Progress in recent research on the design and use of triboelectric nanogenerators for harvesting wind energy. Nano Energy 2023, 116, 108789. [Google Scholar] [CrossRef]
  25. Xing, F.; Jie, Y.; Cao, X.; Li, T.; Wang, N. Natural triboelectric nanogenerator based on soles for harvesting low-frequency walking energy. Nano Energy 2017, 42, 138–142. [Google Scholar] [CrossRef]
  26. Liang, X.; Jiang, T.; Liu, G.; Xiao, T.; Xu, L.; Li, W.; Xi, F.; Zhang, C.; Wang, Z.L. Triboelectric nanogenerator networks integrated with power management module for water wave energy harvesting. Adv. Funct. Mater. 2019, 29, 1807241. [Google Scholar] [CrossRef]
  27. Zhang, L.M.; Han, C.B.; Jiang, T.; Zhou, T.; Li, X.H.; Zhang, C.; Wang, Z.L. Multilayer wavy-structured robust triboelectric nanogenerator for harvesting water wave energy. Nano Energy 2016, 22, 87–94. [Google Scholar] [CrossRef]
  28. Shi, Q.; Wang, H.; Wang, T.; Lee, C. Self-powered liquid triboelectric microfluidic sensor for pressure sensing and finger motion monitoring applications. Nano Energy 2016, 30, 450–459. [Google Scholar] [CrossRef]
  29. Zou, J.; Zhang, M.; Huang, J.; Bian, J.; Jie, Y.; Willander, M.; Cao, X.; Wang, N.; Wang, Z.L. Coupled supercapacitor and triboelectric nanogenerator boost biomimetic pressure sensor. Adv. Energy Mater. 2018, 8, 1702671. [Google Scholar] [CrossRef]
  30. Zhang, X.; Gao, Q.; Gao, Q.; Yu, X.; Cheng, T.; Wang, Z.L. Triboelectric Rotary Motion Sensor for Industrial-Grade Speed and Angle Monitoring. Sensors 2021, 21, 1713. [Google Scholar] [CrossRef]
  31. Li, Y.; Cheng, G.; Lin, Z.H.; Yang, J.; Lin, L.; Wang, Z.L. Single-electrode-based rotationary triboelectric nanogenerator and its applications as self-powered contact area and eccentric angle sensors. Nano Energy 2015, 11, 323–332. [Google Scholar] [CrossRef]
  32. Mathew, A.A.; Chandrasekhar, A.; Vivekanandan, S. A review on real-time implantable and wearable health monitoring sensors based on triboelectric nanogenerator approach. Nano Energy 2021, 80, 105566. [Google Scholar] [CrossRef]
  33. Lim, G.H.; Kwak, S.S.; Kwon, N.; Kim, T.; Kim, H.; Kim, S.M.; Kim, S.W.; Lim, B. Fully stretchable and highly durable triboelectric nanogenerators based on gold-nanosheet electrodes for self-powered human-motion detection. Nano Energy 2017, 42, 300–306. [Google Scholar] [CrossRef]
  34. Fuh, Y.K.; Li, S.C.; Chen, C.Y. Piezoelectrically and triboelectrically hybridized self-powered sensor with applications to smart window and human motion detection. APL Mater. 2017, 5, 074202. [Google Scholar] [CrossRef]
  35. Haroun, A.; Tarek, M.; Mosleh, M.; Ismail, F. Recent progress on triboelectric nanogenerators for vibration energy harvesting and vibration sensing. Nanomaterials 2022, 12, 2960. [Google Scholar] [CrossRef] [PubMed]
  36. Mehamud, I.; Marklund, P.; Björling, M.; Shi, Y. Machine condition monitoring enabled by broad range vibration frequency detecting triboelectric nano-generator (TENG)-based vibration sensors. Nano Energy 2022, 98, 107292. [Google Scholar] [CrossRef]
  37. Prutvi, S.H.; Korrapati, M.; Gupta, D. Self-powering vibration sensor based on a cantilever system with a single-electrode mode triboelectric nanogenerator. Meas. Sci. Technol. 2022, 33, 75115. [Google Scholar] [CrossRef]
  38. Xu, J.; Wang, Y.; Li, H.; Xia, B.; Cheng, T. A triangular electrode triboelectric nanogenerator for monitoring the speed and direction of downhole motors. Nano Energy 2023, 113, 108579. [Google Scholar] [CrossRef]
  39. Li, R.; Huang, H.; Wu, C. A method of vibration measurement with the triboelectric sensor during geo-energy drilling. Energies 2023, 16, 770. [Google Scholar] [CrossRef]
  40. Shi, Q.; Zhao, Z.; Yang, J.; Gui, H.; Cai, M.; Yao, C. A flexible-contact electromagnetic-triboelectric hybrid nanogenerator for rotational energy harvesting and speed monitoring of the downhole motor. Chem. Eng. J. 2023, 477, 146886. [Google Scholar] [CrossRef]
  41. Qi, C.; Jiang, F.; Yang, S. Advanced honeycomb designs for improving mechanical properties: A review. Compos. Part B Eng. 2021, 227, 109393. [Google Scholar] [CrossRef]
  42. Zou, H.; Zhang, Y.; Guo, L.; Wang, P.; He, X.; Dai, G.; Zheng, H.; Chen, C.; Wang, A.C.; Xu, C.; et al. Quantifying the triboelectric series. Nat. Commun. 2019, 10, 1427. [Google Scholar] [CrossRef]
Figure 1. Application environment and basic composition of the H-TENG. (a) The sensor’s actual installation position; (b) honeycomb; (c) H-TENG’s schematic diagram.
Applsci 14 02539 g001
Figure 2. The sensor’s composition and working principle. (a) Explosive diagram of H-TENG; (b) H-TENG’s internal structure schematic diagram; (c) H-TENG’s working principal diagram.
Applsci 14 02539 g002
Figure 3. Test devices. (a) Experimental apparatus diagram; (b) physical diagram of H-TENG; (c) voltage waveform diagram of multiple H-TENGs’ parallel connections.
Applsci 14 02539 g003
Figure 4. Result of the H-TENG sensing performance. (a) Voltage output at various frequencies; (b) voltage output at various amplitudes; (c) measurement error of vibration frequency; (d) measurement error of vibration amplitude; (e) voltage output at various temperatures and relative humidity; (f) voltage output at various cycles.
Applsci 14 02539 g004
Figure 5. The sensor’s power generation performance. (a) The output voltage of a single H-TENG under various external loads and frequencies with a 15 mm amplitude; (b) the output voltage of four H-TENGs under various external loads and frequencies with a 15 mm amplitude; (c) the output current of a single H-TENG under various external loads and frequencies with a 15 mm amplitude; (d) the output current of four H-TENGs under various external loads and frequencies with a 15 mm amplitude; (e) the output power of a single H-TENG under various external loads and frequencies with a 15 mm amplitude; (f) the output power of four H-TENGs under various external loads and frequencies with a 15 mm amplitude.
Applsci 14 02539 g005
Figure 6. H-TENG power generation tests. (a) Capacitor charging curve; (b) a picture depicting the LEDs being lit in real-time by output power.
Applsci 14 02539 g006
Disclaimer/Publisher’s Note: The statements, opinions and data contained in all publications are solely those of the individual author(s) and contributor(s) and not of MDPI and/or the editor(s). MDPI and/or the editor(s) disclaim responsibility for any injury to people or property resulting from any ideas, methods, instructions or products referred to in the content.

