
Evaluation of Bruising Susceptibility and Response of Pears under Impact Loading through Finite Element Analysis


Abstract
1. Introduction
- To investigate the drop impact of pear fruit on different platform materials, including poplar wood, cardboard, rubber, and ABS plastic;
- To investigate the bruise susceptibility at different impact heights: 0.25 m, 0.5 m, and 1.0 m;
- To investigate different packaging structures: rigid, corrugated (single, double, and triple layer), and honeycomb;
- To test two different packaging sizes (standard packaging size 0.22″ and sandwich lattice size 2.1″);
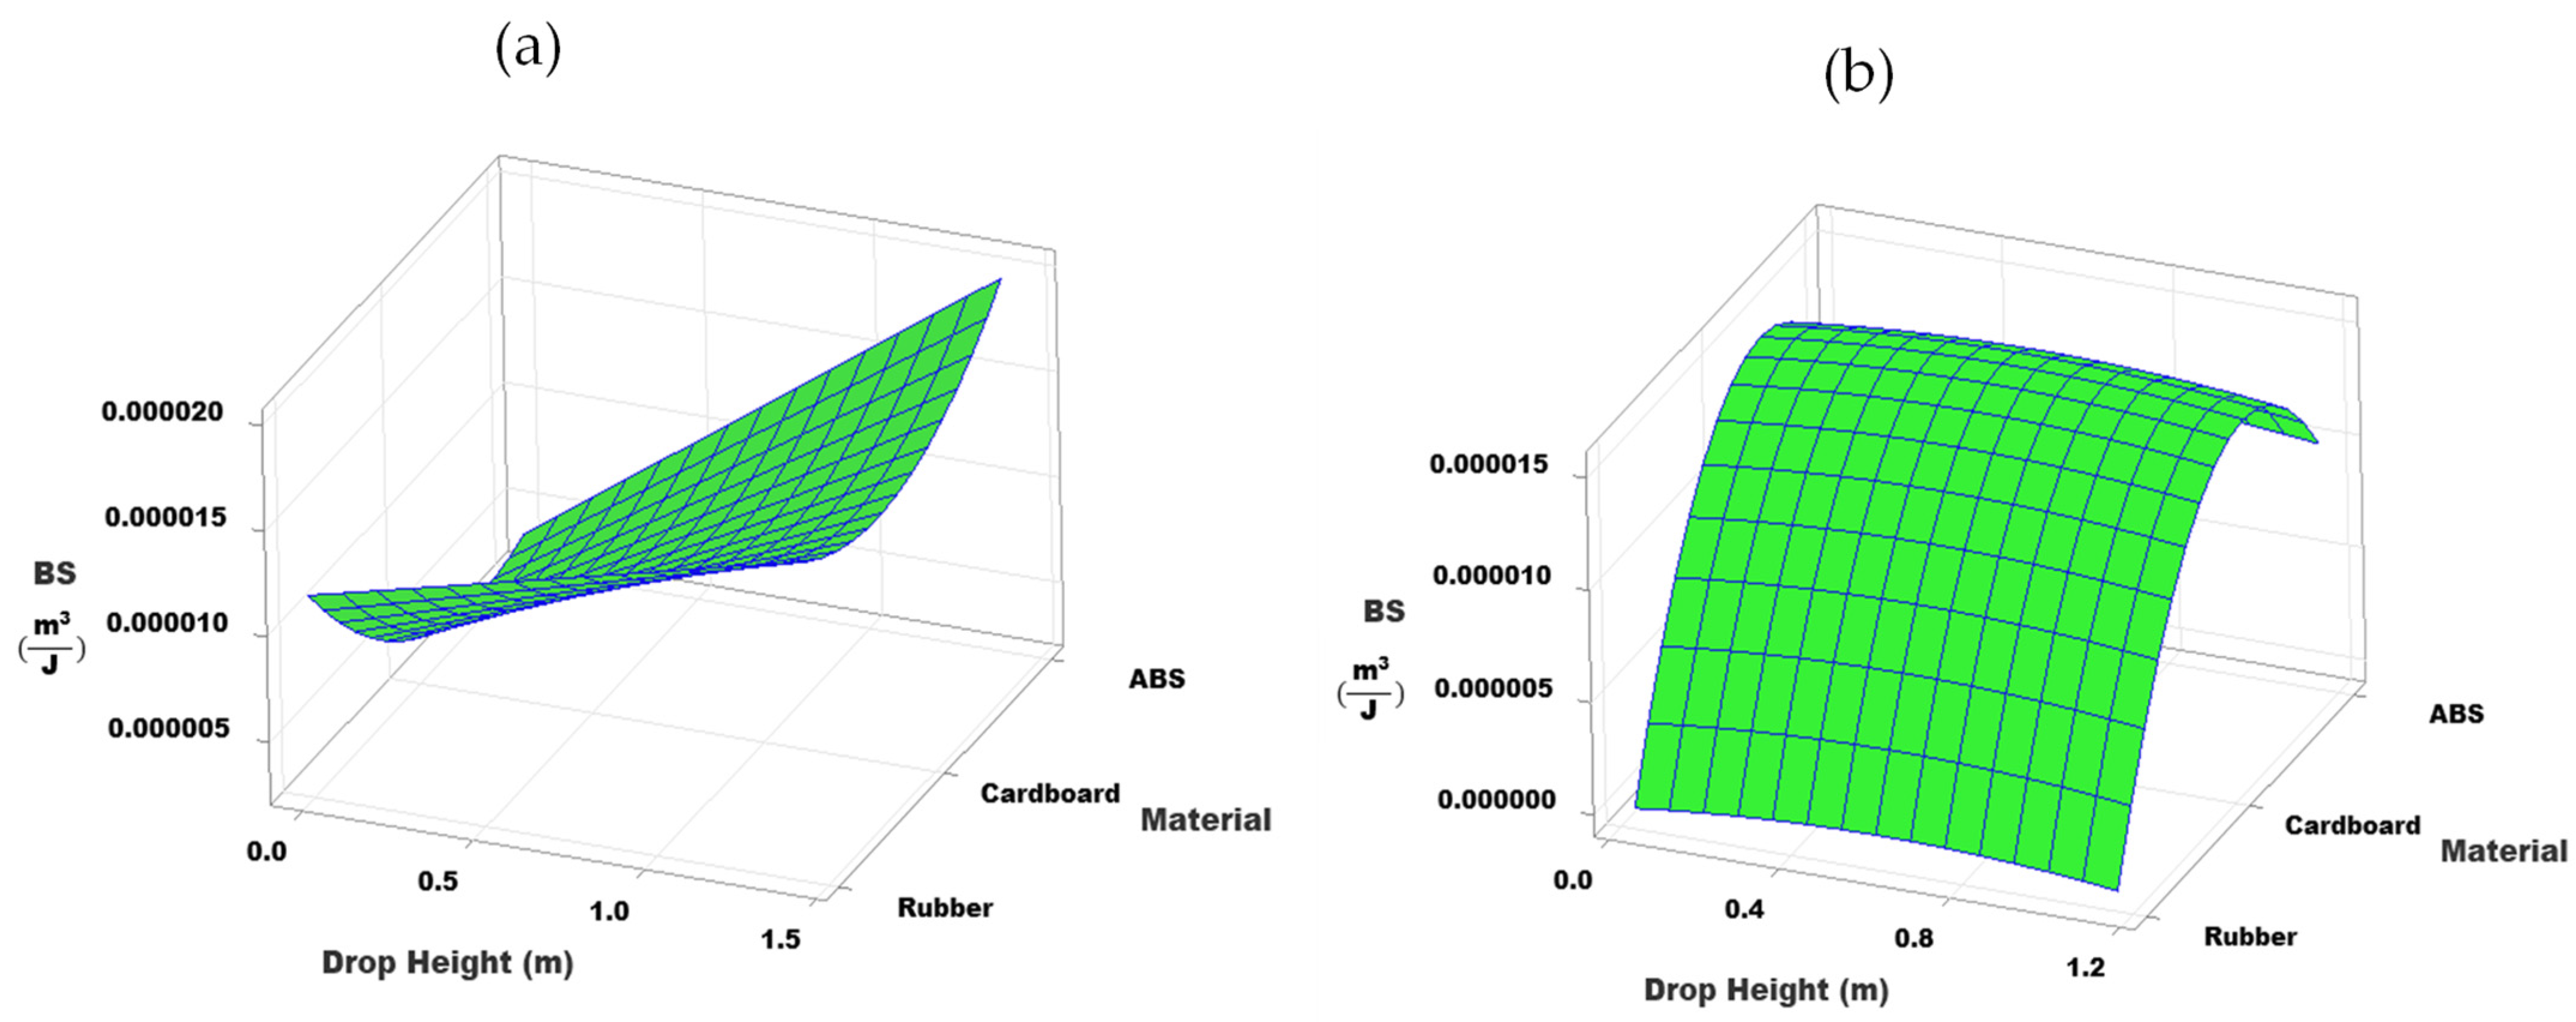
- To develop empirical models for fruit bruise susceptibility through a response surface analysis approach.
2. Materials and Methods
2.1. Fine Element Analysis Setup
2.2. Mesh Sensitivity and FE Model Validation
3. Results and Discussion
3.1. Mesh Sensitivity Analysis
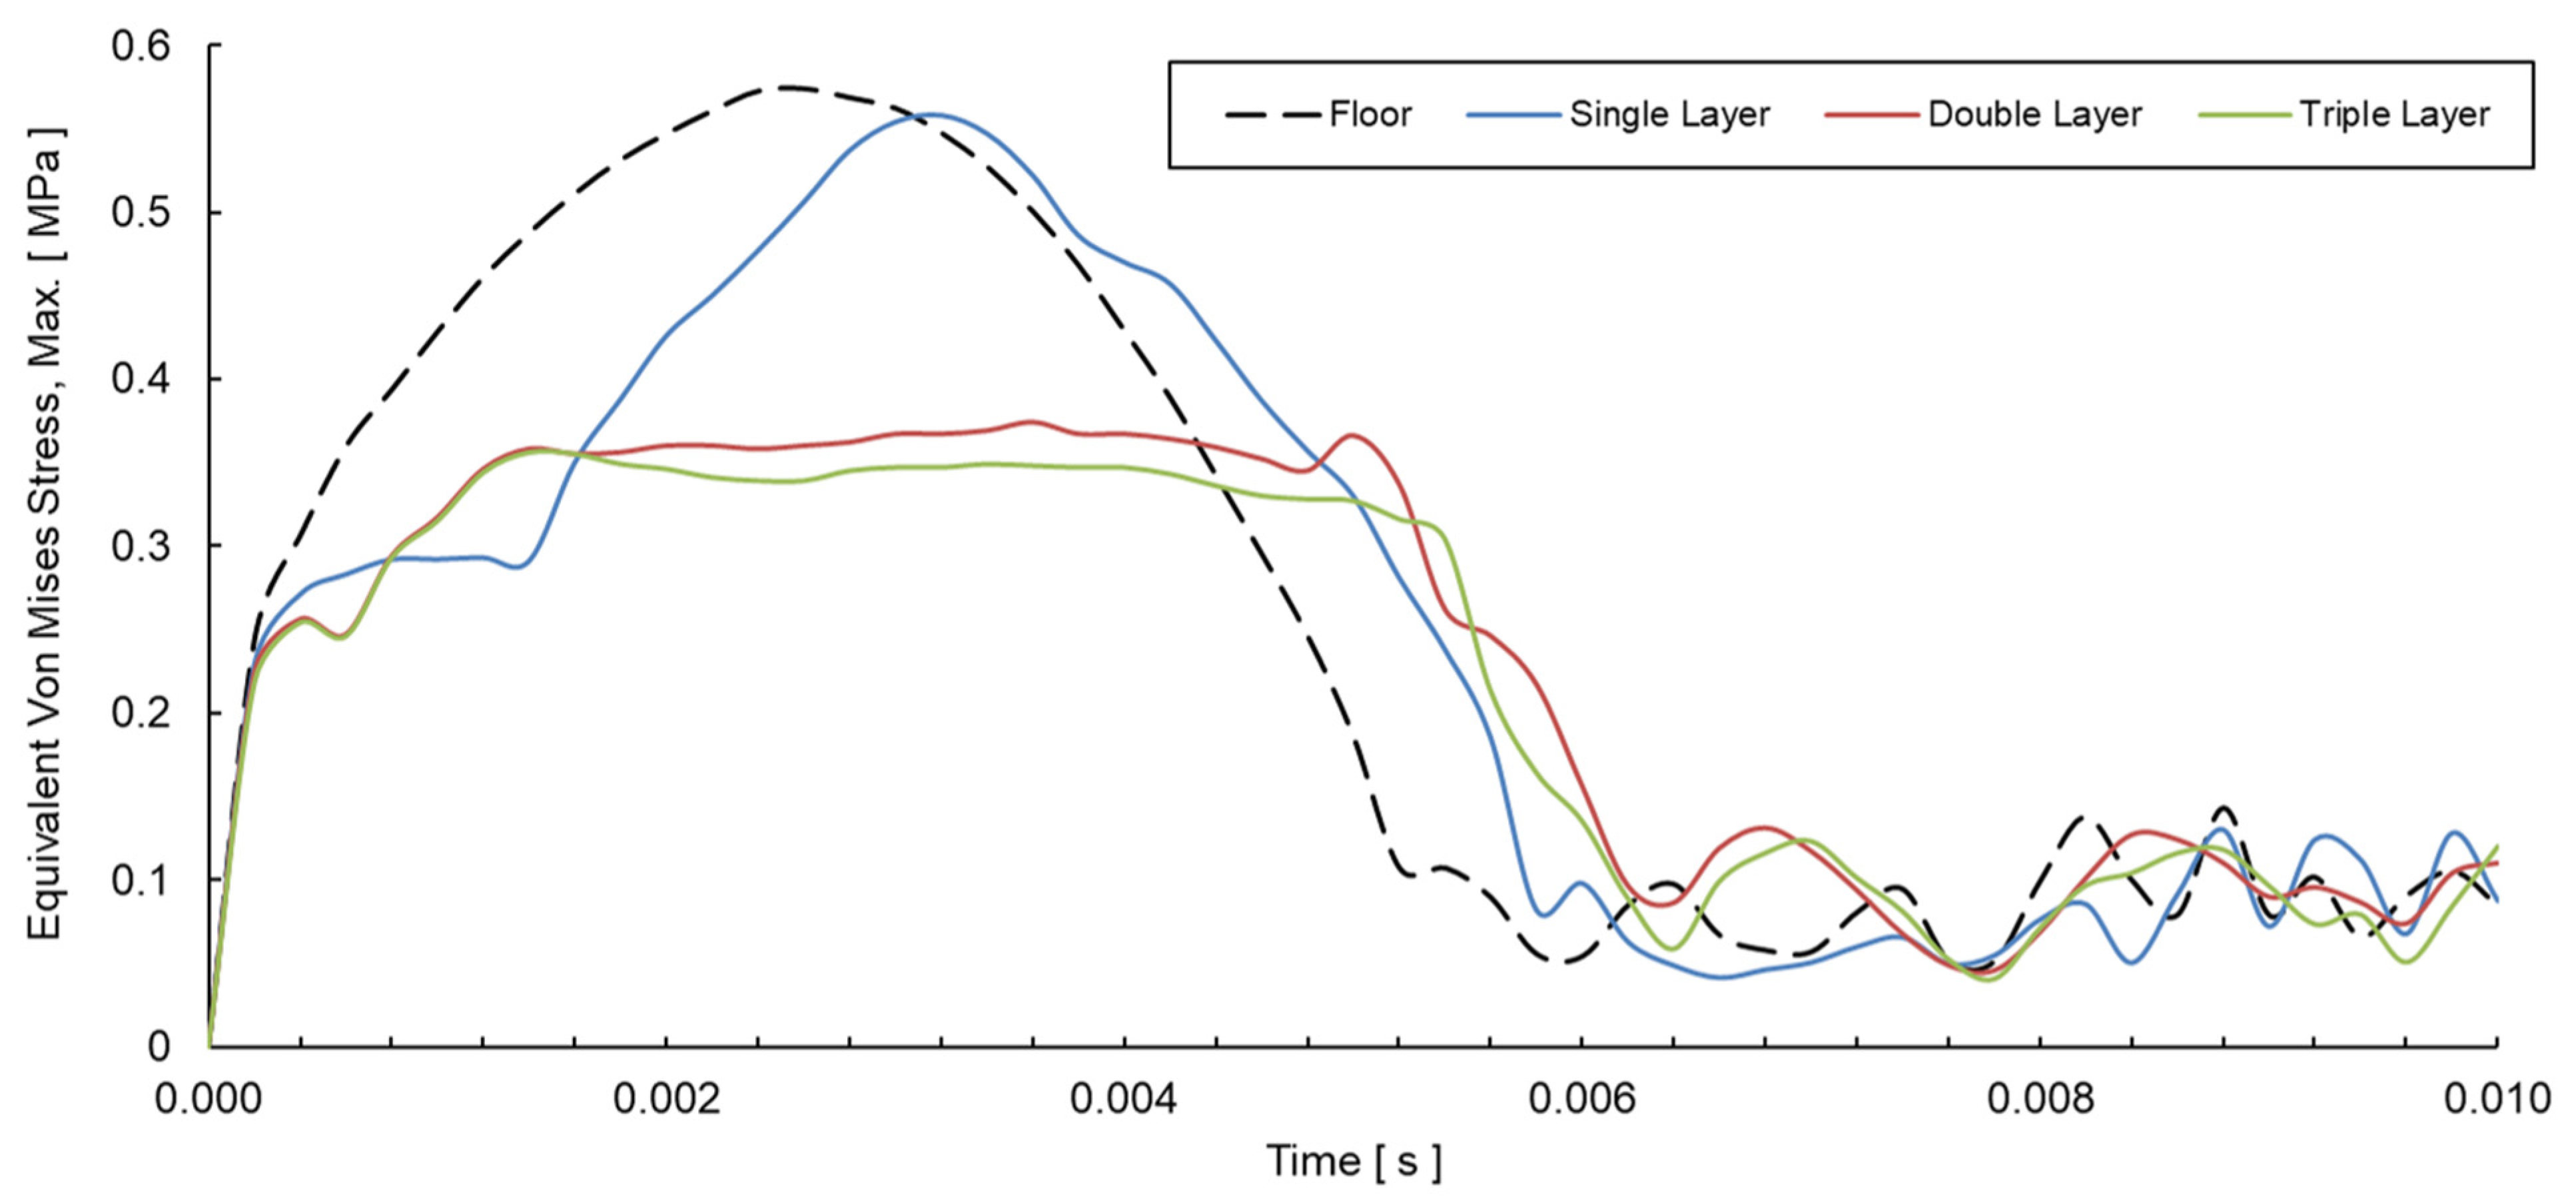
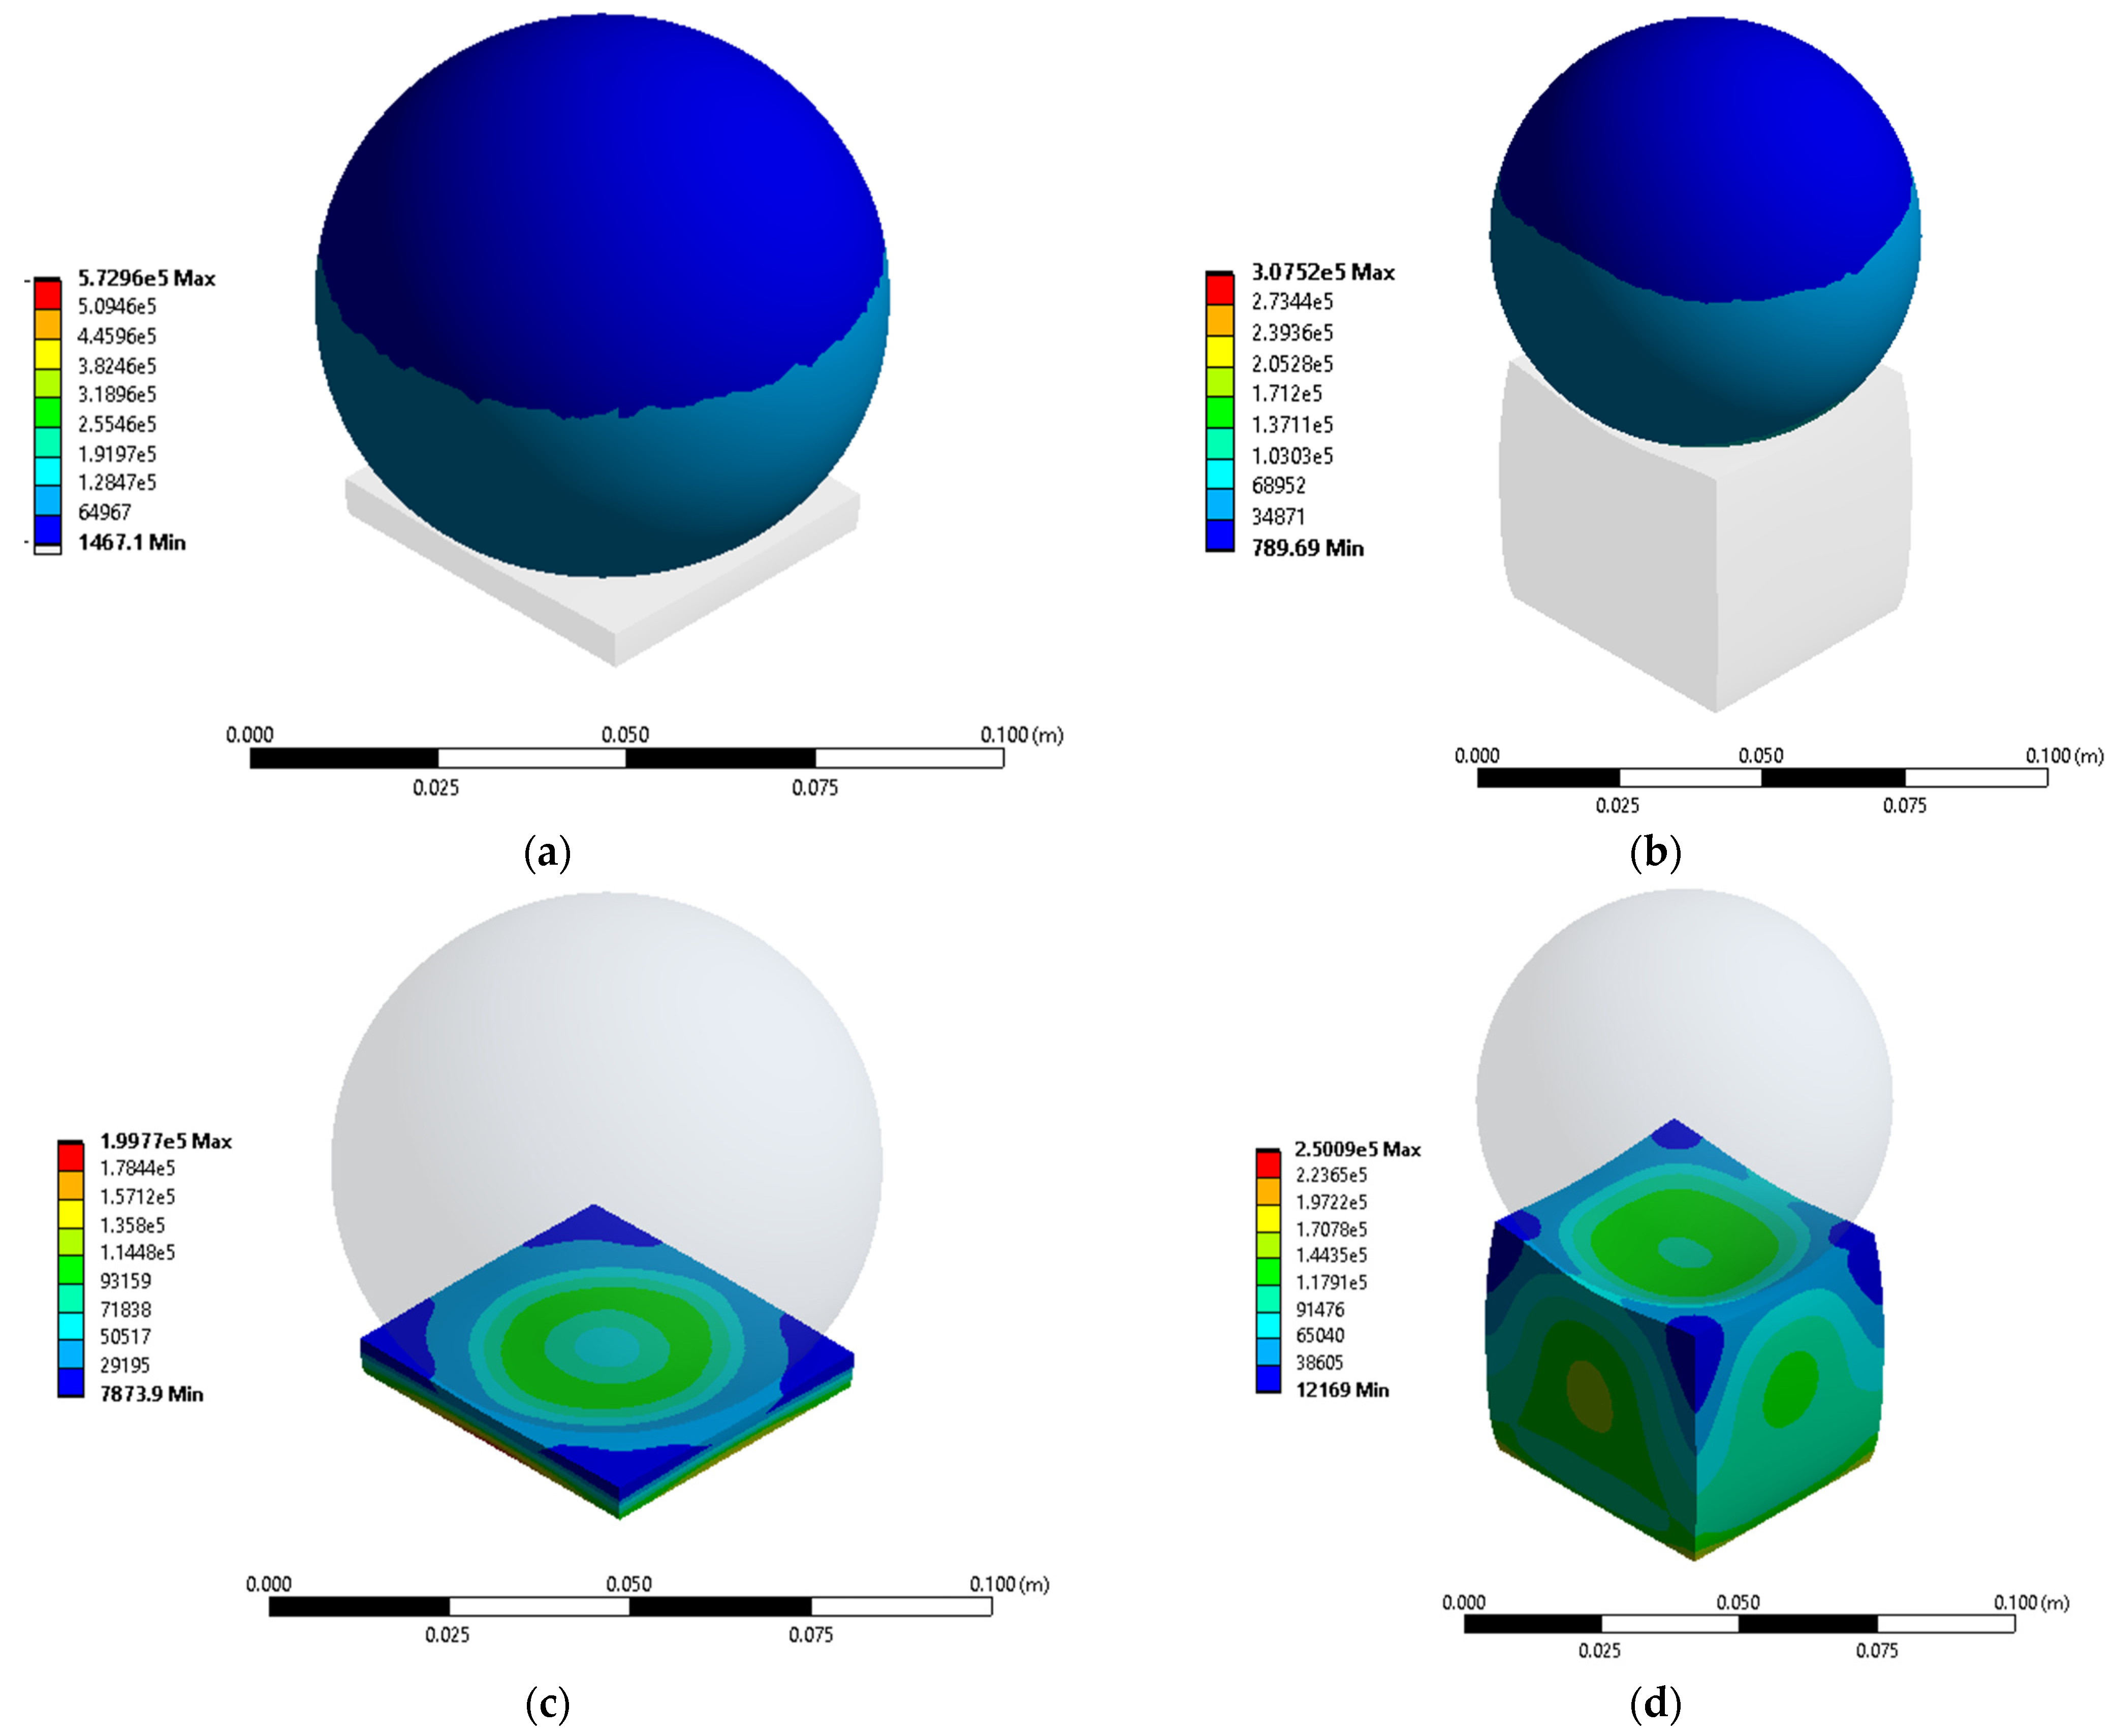
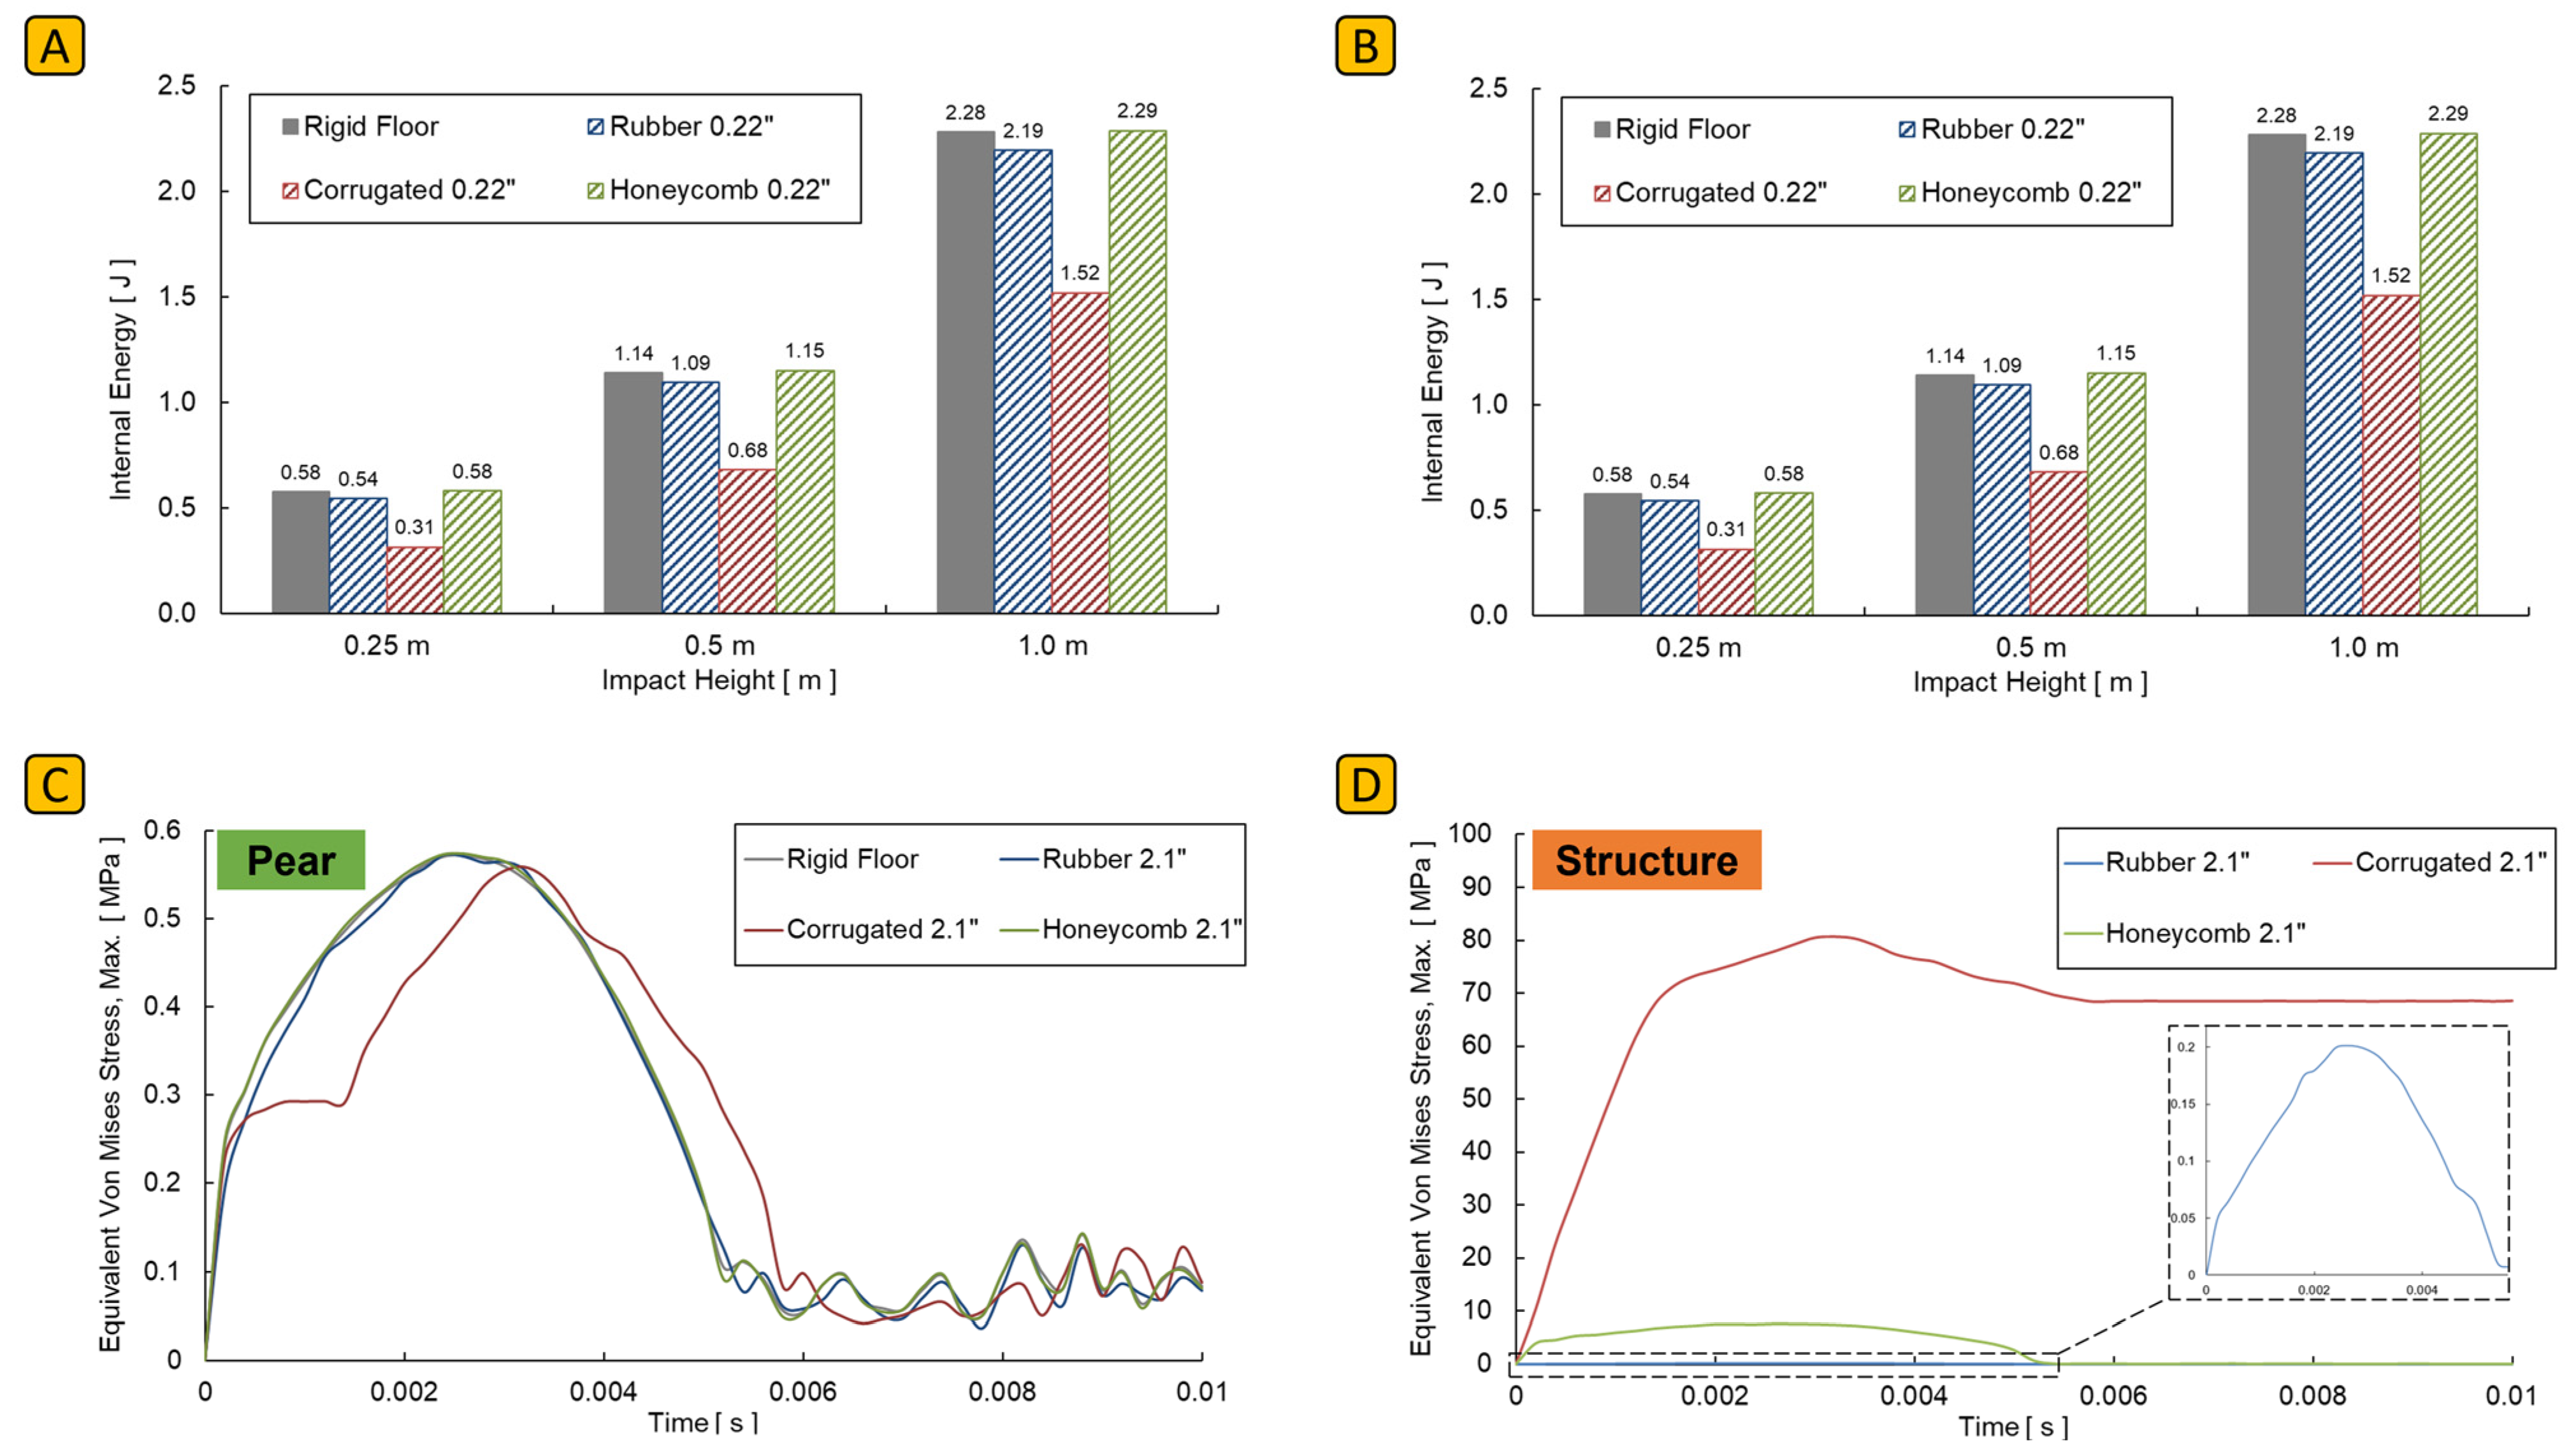
3.2. Conventional Packaging—Corrugated Cardboard
3.3. Rubber
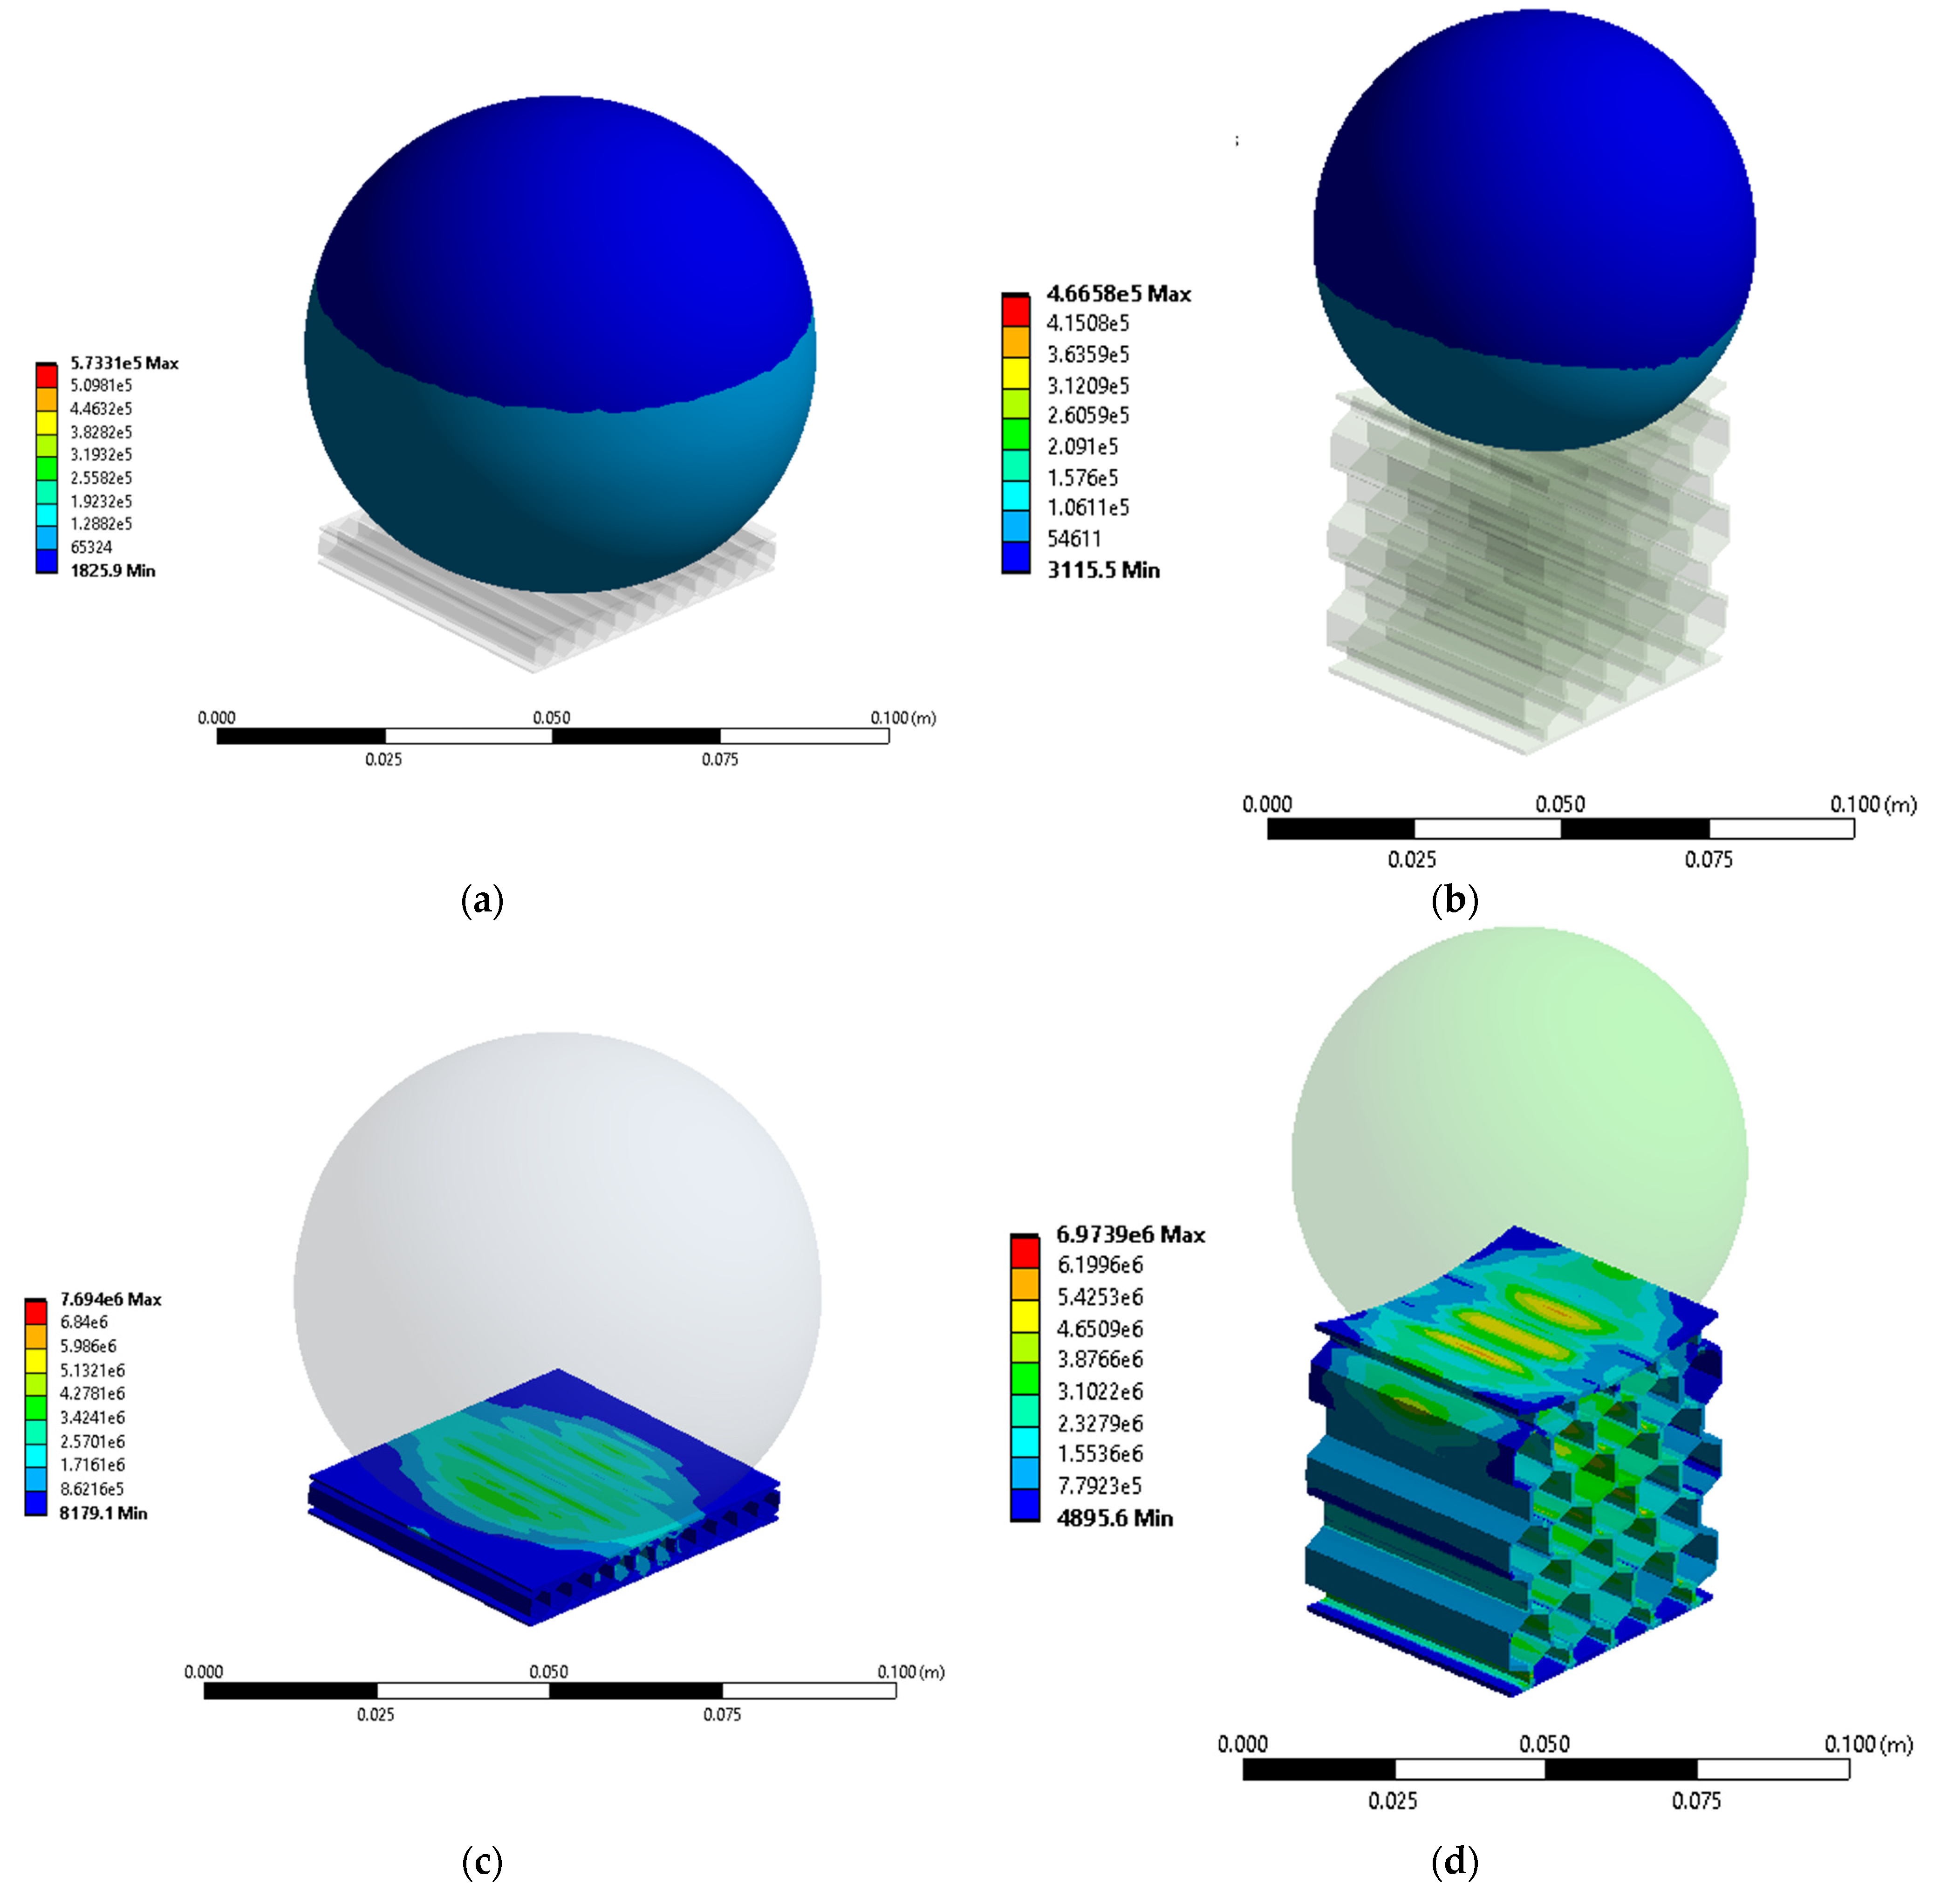
3.4. Honeycomb
3.5. Bruising Susceptibility
3.6 Response Surface Methodology (RSM)
4. Conclusions
- Conventional corrugated cardboard packaging is very prone to plastic and permanent structural for any fruit drop height;
- A double-layer corrugated structure can reduce the maximum pear stress by about 33%, but subsequent layers do not greatly improve the protection against fall damage;
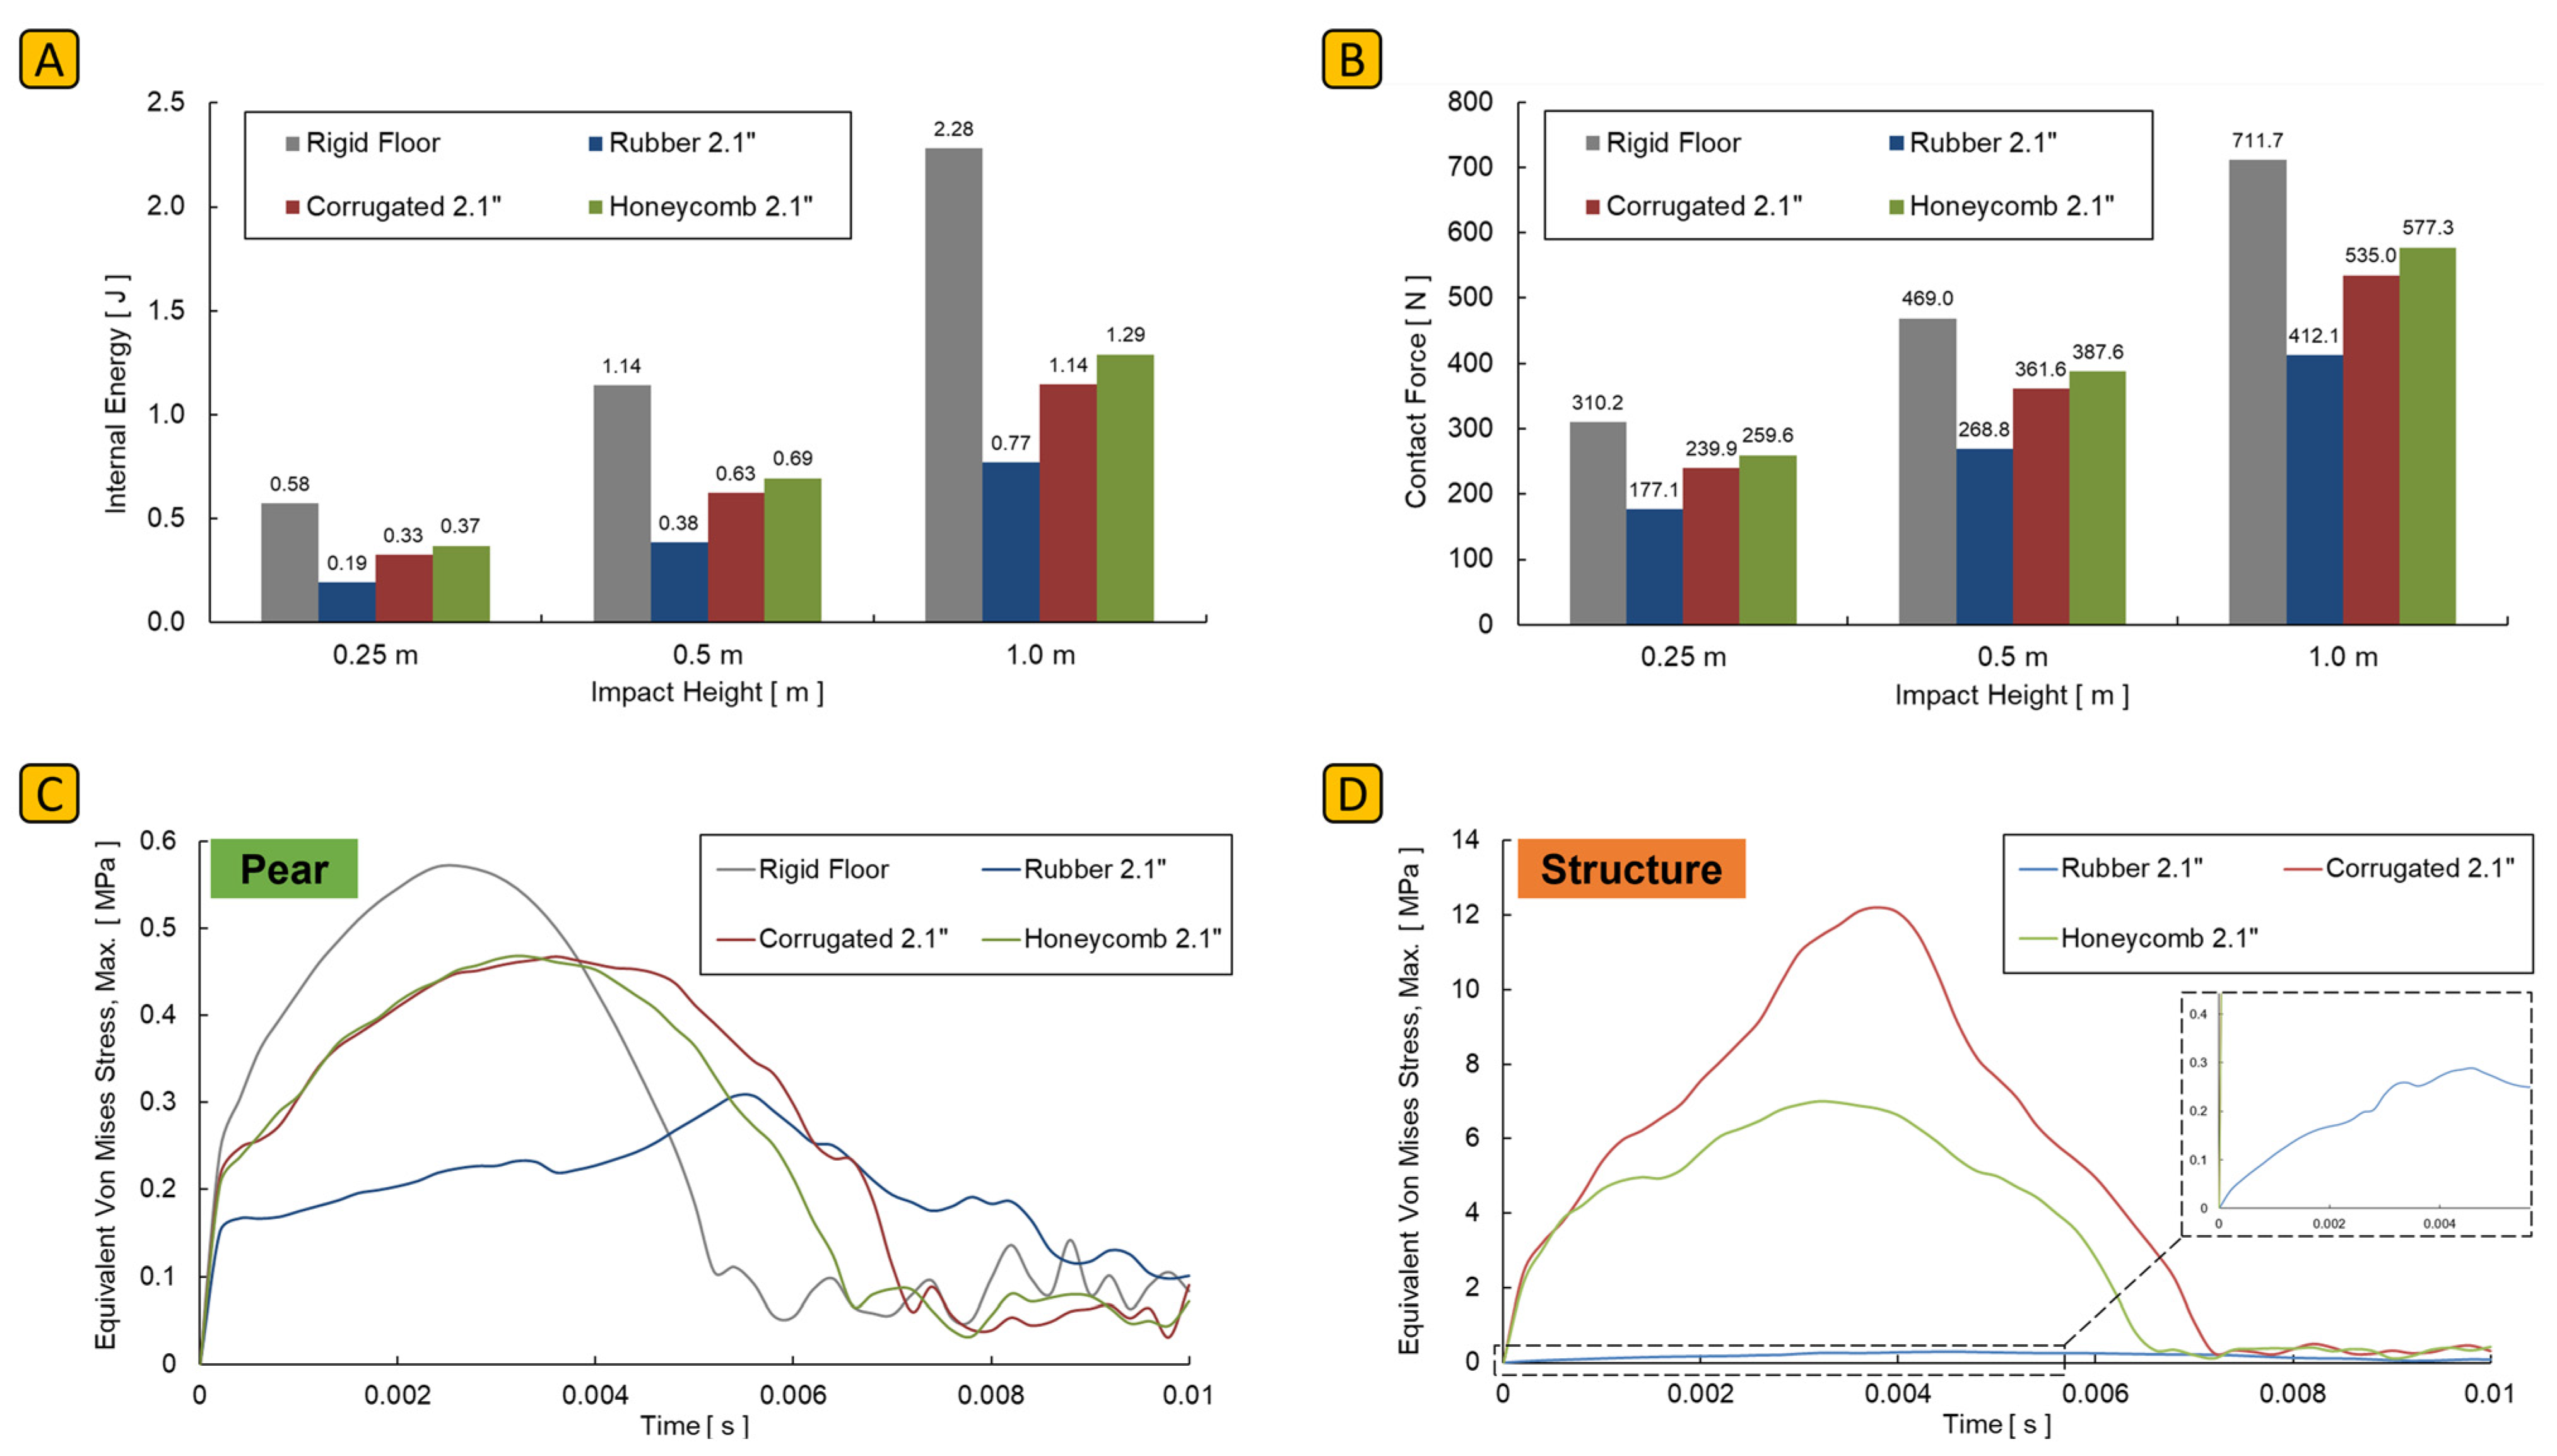
- Vulcanized rubber has a critical height performance limit for cushioning protection; there does not seem to be any benefit of using 0.22″ thickness rubber packaging;
- For 2.1″ packaging size, vulcanized rubber performed the best at all heights with minimal bruising susceptibility, while 0.22″ size corrugated cardboard performed the best at 0.25 m;
- 3D-printed material could potentially lead to multi-use protective packaging that does not get damaged, but the rigidity of ABS materials is currently not suitable for fruit drop protection;
- FEA-simulated bruise susceptibility values were compared with RSM-predicted values where relative error did not exceed 24%, which supports the adoption of the theoretical model as an effective tool for decision-making in agriculture and the post-harvest sector.
Author Contributions
Funding
Institutional Review Board Statement
Informed Consent Statement
Data Availability Statement
Acknowledgments
Conflicts of Interest
References
- Al-Dairi, M.; Pathare, P.B.; Al-Yahyai, R.; Opara, U.L. Mechanical Damage of Fresh Produce in Postharvest Transportation: Current Status and Future Prospects. Trends Food Sci. Technol. 2022, 124, 195–207. [Google Scholar] [CrossRef]
- Expert Group. A Study of Waste in the Cold Food Chain and Opportunities for Improvement; Expert Group: Brighton, VA, Australia, 2020. [Google Scholar]
- Ma, L.; Zheng, Y.; Sang, Z.; Ge, Y.; Bai, C.; Fu, A.; Wang, Q.; Watkins, C.B.; Zuo, J. Multi-Omics Analysis Reveals the Mechanism of Calcium-Reduced Quality Deterioration in Mechanically Injured Green Pepper Fruit. Postharvest Biol. Technol. 2023, 204, 112437. [Google Scholar] [CrossRef]
- Satitmunnaithum, J.; Kitazawa, H.; Arofatullah, N.A.; Widiastuti, A.; Kharisma, A.D.; Yamane, K.; Tanabata, S.; Sato, T. Microbial Population Size and Strawberry Fruit Firmness after Drop Shock-Induced Mechanical Damage. Postharvest Biol. Technol. 2022, 192, 112008. [Google Scholar] [CrossRef]
- Pathare, P.B.; Al-Dairi, M. Bruise Susceptibility and Impact on Quality Parameters of Pears During Storage. Front. Sustain. Food Syst. 2021, 5, 658132. [Google Scholar] [CrossRef]
- Hussein, Z.; Fawole, O.A.; Opara, U.O. Effects of Bruising and Storage Duration on Physiological Response and Quality Attributes of Pomegranate Fruit. Sci. Hortic. 2020, 267, 109306. [Google Scholar] [CrossRef]
- Hussein, Z.; Fawole, O.A.; Opara, U.L. Investigating Bruise Susceptibility of Pomegranate Cultivars during Postharvest Handling. Afr. J. Rural Dev. 2017, 2, 33–39. [Google Scholar]
- Opara, U.L.; Pathare, P.B. Bruise Damage Measurement and Analysis of Fresh Horticultural Produce—A Review. Postharvest Biol. Technol. 2014, 91, 9–24. [Google Scholar] [CrossRef]
- Körzendörfer, A. Vibrations and Ultrasound in Food Processing–Sources of Vibrations, Adverse Effects, and Beneficial Applications–An Overview. J. Food Eng. 2022, 324, 110875. [Google Scholar] [CrossRef]
- Ngo, T.D.; Kashani, A.; Imbalzano, G.; Nguyen, K.T.Q.; Hui, D. Additive Manufacturing (3D Printing): A Review of Materials, Methods, Applications and Challenges. Compos. B Eng. 2018, 143, 172–196. [Google Scholar] [CrossRef]
- Cornaggia, A.; Gajewski, T.; Knitter-Piątkowska, A.; Garbowski, T. Influence of Humidity and Temperature on Mechanical Properties of Corrugated Board—Numerical Investigation. Bioresources 2023, 18, 7490–7509. [Google Scholar] [CrossRef]
- Najafi, M.; Ahmadi, H.; Liaghat, G.H. Evaluation of the Mechanical Properties of Fully Integrated 3D Printed Polymeric Sandwich Structures with Auxetic Cores: Experimental and Numerical Assessment. Int. J. Adv. Manuf. Technol. 2022, 122, 4079–4098. [Google Scholar] [CrossRef]
- Zulkifli, N.; Hashim, N.; Harith, H.H.; Shukery, M.F.M. Finite Element Modelling for Fruit Stress Analysis—A Review. Trends Food Sci. Technol. 2020, 97, 29–37. [Google Scholar] [CrossRef]
- Fadiji, T.; Coetzee, J.; Berry, T.M.; Ambaw, A.; Opara, U.L. The Efficacy of Finite Element Analysis (FEA) as a Design Tool for Food Packaging: A Review. J. Food Eng. 2018, 4, 20–40. [Google Scholar] [CrossRef]
- Celik, H.K. Determination of Bruise Susceptibility of Pears (Ankara Variety) to Impact Load by Means of FEM-Based Explicit Dynamics Simulation. Postharvest Biol. Technol. 2017, 128, 83–97. [Google Scholar] [CrossRef]
- Hussein, Z.; Fawole, O.A.; Opara, U.L. Bruise Damage Susceptibility of Pomegranates (Punica Granatum, L.) and Impact on Fruit Physiological Response during Short Term Storage. Sci. Hortic. 2019, 246, 664–674. [Google Scholar] [CrossRef]
- Van Zeebroeck, M.; Darius, P.; De Ketelaere, B.; Ramon, H.; Tijskens, E. The Effect of Fruit Properties on the Bruise Susceptibility of Tomatoes. Postharvest Biol. Technol. 2007, 45, 168–175. [Google Scholar] [CrossRef]
- Yousefi, S.; Farsi, H.; Kheiralipour, K. Drop Test of Pear Fruit: Experimental Measurement and Finite Element Modelling. Biosyst. Eng. 2016, 147, 17–25. [Google Scholar] [CrossRef]
- Du, D.; Wang, B.; Wang, J.; Yao, F.; Hong, X. Prediction of Bruise Susceptibility of Harvested Kiwifruit (Actinidia Chinensis) Using Finite Element Method. Postharvest Biol. Technol. 2019, 152, 36–44. [Google Scholar] [CrossRef]
- Nikara, S.; Ahmadi, E.; Nia, A.A. Finite Element Simulation of the Micromechanical Changes of the Tissue and Cells of Potato Response to Impact Test during Storage by Scanning Electron Microscopy. Postharvest Biol. Technol. 2020, 164, 111153. [Google Scholar] [CrossRef]
- Zhao, J.; Sugirbay, A.; Chen, Y.; Zhang, S.; Liu, F.; Bu, L.; Chen, Y.; Wang, Z.; Chen, J. FEM Explicit Dynamics Simulation and NIR Hyperspectral Reflectance Imaging for Determination of Impact Bruises of Lycium Barbarum L. Postharvest Biol. Technol. 2019, 155, 102–110. [Google Scholar] [CrossRef]
- Guan, X.; Li, T.; Zhou, F. Determination of Bruise Susceptibility of Fresh Corn to Impact Load by Means of Finite Element Method Simulation. Postharvest Biol. Technol. 2023, 198, 112227. [Google Scholar] [CrossRef]
- Lin, M.; Fawole, O.A.; Saeys, W.; Wu, D.; Wang, J.; Opara, U.L.; Nicolai, B.; Chen, K. Mechanical Damages and Packaging Methods along the Fresh Fruit Supply Chain: A Review. Crit. Rev. Food Sci. Nutr. 2022, 63, 10283–10302. [Google Scholar] [CrossRef] [PubMed]
- Celik, H.K.; Ustun, H.; Erkan, M.; Rennie, A.E.W.; Akinci, I. Effects of Bruising of ‘Pink Lady’Apple under Impact Loading in Drop Test on Firmness, Colour and Gas Exchange of Fruit during Long Term Storage. Postharvest Biol. Technol. 2021, 179, 111561. [Google Scholar] [CrossRef]
- Lewis, R.; Yoxall, A.; Canty, L.A.; Romo, E.R. Development of Engineering Design Tools to Help Reduce Apple Bruising. J. Food Eng. 2007, 83, 356–365. [Google Scholar] [CrossRef]
- Ashby, M. Material Property Data for Engineering Materials—ANSYS Granta Edupack 2021; ANSYS: Canonsburg, CA, USA, 2021. [Google Scholar]
- Lee, I.T.; Shi, Y.; Afsar, A.M.; Ochi, Y.; Bae, S.I.; Song, J.I. Low Velocity Impact Behavior of Aluminum Honeycomb Structures. Adv. Compos. Mater. 2010, 19, 19–39. [Google Scholar] [CrossRef]
- Silva, N.; Molina-Besch, K. Replacing Plastic with Corrugated Cardboard: A Carbon Footprint Analysis of Disposable Packaging in a B2B Global Supply Chain—A Case Study. Resour. Conserv. Recycl. 2023, 191, 106871. [Google Scholar] [CrossRef]
- Hou, J.; Zhu, Z.; Hu, W.; He, Z.; Sun, Q.; Yue, X. Analysis of Damage Caused by Drop Impacts for Mulberry Fruits: An Dropping Experiment and Numerical Simulation. J. Food Process Eng. 2023, 46, e14316. [Google Scholar] [CrossRef]
- Ma, Y.; Markine, V.L.; Mashal, A.A.; Ren, M. Effect of Wheel-Rail Interface Parameters on Contact Stability in Explicit Finite Element Analysis. Proc. Inst. Mech. Eng. F J. Rail Rapid Transit. 2018, 232, 1879–1894. [Google Scholar] [CrossRef]
- Gruyters, W.; Verboven, P.; Diels, E.; Rogge, S.; Smeets, B.; Ramon, H.; Defraeye, T.; Nicolaï, B.M. Modelling Cooling of Packaged Fruit Using 3D Shape Models. Food Bioprocess Technol. 2018, 11, 2008–2020. [Google Scholar] [CrossRef]
- Pathare, P.B.; Opara, U.L.; Vigneault, C.; Delele, M.A.; Al-Said, F.A.-J. Design of Packaging Vents for Cooling Fresh Horticultural Produce. Food Bioprocess Technol. 2012, 5, 2031–2045. [Google Scholar] [CrossRef]
- Xin, D.; Ning, D.; Wang, K.; Han, Y. Development of on Line Automatic Separation Device for Apple and Sleeve. AIP Conf. Proc. 2018, 1955, 40081. [Google Scholar] [CrossRef]
- Ni, X.; Jiang, H.; Wang, L.; Shi, W. Kinetics Simulation of the Crucial Points on a Fruit Grading and Packing Line. In Proceedings of the 2018 ASABE Annual International Meeting, Dearborn, MI, USA, 31 July 2018; p. 1. [Google Scholar]
- Djilali Hammou, A.; Minh Duong, P.T.; Abbès, B.; Makhlouf, M.; Guo, Y.-Q. Finite-Element Simulation with a Homogenization Model and Experimental Study of Free Drop Tests of Corrugated Cardboard Packaging. Mech. Ind. 2012, 13, 175–184. [Google Scholar] [CrossRef]
- Lien, C.C.; Ting, C.H. Assessing Guava Maturity by Statistical Analyses of Dropped Fruit Impact Responses. Postharvest Biol. Technol. 2014, 95, 20–27. [Google Scholar] [CrossRef]
- Xu, R.; Takeda, F.; Krewer, G.; Li, C. Measure of Mechanical Impacts in Commercial Blueberry Packing Lines and Potential Damage to Blueberry Fruit. Postharvest Biol. Technol. 2015, 110, 103–113. [Google Scholar] [CrossRef]
- Stropek, Z.; Gołacki, K. Bruise Susceptibility and Energy Dissipation Analysis in Pears under Impact Loading Conditions. Postharvest Biol. Technol. 2020, 163, 111120. [Google Scholar] [CrossRef]
- Komarnicki, P.; Stopa, R.; Szyjewicz, D.; Młotek, M. Evaluation of Bruise Resistance of Pears to Impact Load. Postharvest Biol. Technol. 2016, 114, 36–44. [Google Scholar] [CrossRef]


| Material | ) | Poisson’s Ratio | ) |
|---|---|---|---|
| Pear Fruit (Ankara) [15] | 3.248 | 0.427 | 1032 |
| Poplar Wood [15] | 8400 | 0.318 | 4000 |
| ABS (3D-printed) [12] | 1900 | 0.350 | 940 |
| Cardboard [26] | 656 | 0.251 | 800 |
| Rubber [26] | Mooney—Rivlin parameters | 1000 | |
| S. I | Surface Type | Packaging Thickness | Time at Pear | |||
|---|---|---|---|---|---|---|
| 1 | Rigid Floor | 0.25 m | 3.20 | 6.40 | 3.20 | |
| 2 | 0.5 m | 3.00 | 5.80 | 2.80 | ||
| 3 | 1.0 m | 2.60 | 5.40 | 2.80 | ||
| 4 | Rubber (Vulcanized) | 0.22″ | 0.25 m | 3.20 | 6.40 | 3.20 |
| 5 | 0.5 m | 3.00 | 6.00 | 3.00 | ||
| 6 | 1.0 m | 2.40 | 5.40 | 3.00 | ||
| 7 | 2.1″ | 0.25 m | 5.80 | e* | e* | |
| 8 | 0.5 m | 5.60 | e* | e* | ||
| 9 | 1.0 m | 5.60 | e* | e* | ||
| 10 | Corrugated (Cardboard) | 0.22″ | 0.25 m | 3.80 | 7.40 | 3.60 |
| 11 | 0.5 m | 3.40 | 7.00 | 3.60 | ||
| 12 | 1.0 m | 3.20 | 6.20 | 3.00 | ||
| 13 | 2.1″ | 0.25 m | 4.20 | 8.00 | 3.80 | |
| 14 | 0.5 m | 3.80 | 7.60 | 3.80 | ||
| 15 | 1.0 m | 3.60 | 7.00 | 3.40 | ||
| 16 | Honeycomb (ABS) | 0.22″ | 0.25 m | 3.20 | 6.20 | 3.00 |
| 17 | 0.5 m | 3.00 | 6.00 | 3.00 | ||
| 18 | 1.0 m | 2.60 | 5.40 | 2.80 | ||
| 19 | 2.1″ | 0.25 m | 3.80 | 7.60 | 3.80 | |
| 20 | 0.5 m | 3.40 | 7.00 | 3.60 | ||
| 21 | 1.0 m | 3.20 | 6.60 | 3.40 | ||
| S. I | Surface Type | Drop Height | Percentage of Bruising Whole Fruit Volume | Bruise | |||||||
|---|---|---|---|---|---|---|---|---|---|---|---|
| 1 | Rigid Floor | 0.25 m | 0.577 | 0.575 | 310.16 | 0.411 | 2.6% | 5.75 × 10⁻⁶ | 6.03 | 9.99 × 10⁻⁶ | |
| 2 | 0.5 m | 1.155 | 1.14 | 469.03 | 0.485 | 6.2% | 1.38 × 10⁻⁵ | 14.45 | 1.21 × 10⁻⁵ | ||
| 3 | 1.0 m | 2.310 | 2.28 | 711.69 | 0.572 | 14.2% | 3.13 × 10⁻⁵ | 32.92 | 1.37 × 10⁻⁵ | ||
| 4 | Rubber (Vulcanized) | 0.22″ | 0.25 m | 0.577 | 0.544 | 305.7 | 0.398 | 2.4% | 5.31 × 10⁻⁶ | 5.58 | 9.77 × 10⁻⁶ |
| 5 | 0.5 m | 1.155 | 1.095 | 464.6 | 0.478 | 6.1% | 1.34 × 10⁻⁵ | 14.05 | 1.22 × 10⁻⁵ | ||
| 6 | 1.0 m | 2.310 | 2.192 | 707.8 | 0.573 | 13.7% | 3.01 × 10⁻⁵ | 31.62 | 1.37 × 10⁻⁵ | ||
| 7 | 2.1″ | 0.25 m | 0.577 | 0.192 | 177.1 | 0.203 | 0% | 0 | 0 | 0 | |
| 8 | 0.5 m | 1.155 | 0.385 | 268.8 | 0.246 | 0% | 0 | 0.00 | 0 | ||
| 9 | 1.0 m | 2.310 | 0.771 | 412.1 | 0.308 | 0.29% | 6.36 × 10⁻⁷ | 0.67 | 8.25 × 10⁻⁷ | ||
| 10 | Corrugated (Cardboard) | 0.22″ | 0.25 m | 0.577 | 0.314 | 258.9 | 0.280 | 0% | 0 | 0 | 0 |
| 11 | 0.5 m | 1.155 | 0.680 | 408.6 | 0.356 | 2.3% | 4.99 × 10⁻⁶ | 5.24 | 7.34 × 10⁻⁶ | ||
| 12 | 1.0 m | 2.310 | 1.518 | 640.2 | 0.558 | 8.9% | 1.97 × 10⁻⁵ | 20.69 | 1.30 × 10⁻⁵ | ||
| 13 | 2.1″ | 0.25 m | 0.577 | 0.326 | 239.9 | 0.355 | 0.8% | 1.85 × 10⁻⁶ | 1.94 | 5.66 × 10⁻⁶ | |
| 14 | 0.5 m | 1.155 | 0.625 | 361.6 | 0.412 | 3.1% | 6.87 × 10⁻⁶ | 7.22 | 1.10 × 10⁻⁵ | ||
| 15 | 1.0 m | 2.310 | 1.145 | 535.0 | 0.467 | 6.8% | 1.50 × 10⁻⁵ | 15.77 | 1.31 × 10⁻⁵ | ||
| 16 | Honeycomb (ABS) | 0.22″ | 0.25 m | 0.577 | 0.579 | 310.7 | 0.414 | 2.7% | 5.90 × 10⁻⁶ | 6.19 | 1.02 × 10⁻⁵ |
| 17 | 0.5 m | 1.155 | 1.150 | 469.5 | 0.487 | 6.3% | 1.39 × 10⁻⁵ | 14.55 | 1.20 × 10⁻⁵ | ||
| 18 | 1.0 m | 2.310 | 2.286 | 710.8 | 0.573 | 14.4% | 3.17 × 10⁻⁵ | 33.30 | 1.39 × 10⁻⁵ | ||
| 19 | 2.1″ | 0.25 m | 0.577 | 0.370 | 259.6 | 0.346 | 1.1% | 2.37 × 10⁻⁶ | 2.49 | 6.40 × 10⁻⁶ | |
| 20 | 0.5 m | 1.549 | 0.694 | 387.6 | 0.400 | 3.5% | 7.71 × 10⁻⁶ | 8.10 | 1.11 × 10⁻⁵ | ||
| 21 | 1.0 m | 2.310 | 1.290 | 577.3 | 0.469 | 7.8% | 1.72 × 10⁻⁵ | 18.03 | 1.33 × 10⁻⁵ | ||
| Bio-Yield Limit: 0.3 MPa | Maximum | Minimum | |||||||||
| Predicted BS | Simulated BS | Relative Error (%) |
|---|---|---|
| 1.04 × 10⁻⁵ | 9.99 × 10⁻⁶ | 4 |
| 1.15 × 10⁻⁵ | 1.21 × 10⁻⁵ | 5 |
| 1.39 × 10⁻⁵ | 1.37 × 10⁻⁵ | 1 |
| Rubber | Cardboard | ABS | |||||||
|---|---|---|---|---|---|---|---|---|---|
| Packaging Size | Relative Error (%) | Relative Error (%) | Relative Error (%) | ||||||
| 0.22″ | 1.2 × 10⁻⁵ | 9.8 × 10⁻⁶ | 24 | 5.3 × 10⁻⁶ | 0 | 5.3 × 10⁻⁶ | 9.40 × 10⁻⁶ | 1.02 × 10⁻⁵ | 8 |
| 1.3 × 10⁻⁵ | 1.2 × 10⁻⁵ | 3 | 7.7 × 10⁻⁶ | 7.3 × 10⁻⁶ | 5 | 1.12 × 10⁻⁵ | 1.20 × 10⁻⁵ | 7 | |
| 1.3 × 10⁻⁵ | 1.4 × 10⁻⁵ | 2 | 1.3 × 10⁻⁵ | 1.3 × 10⁻⁵ | 3 | 1.47 × 10⁻⁵ | 1.39 × 10⁻⁵ | 6 | |
| 2.1″ | 3 × 10⁻⁷ | 0 | 3 × 10⁻⁷ | 6.7 × 10⁻⁶ | 5.7 × 10⁻⁶ | 18 | 7.90 × 10⁻⁶ | 6.40 × 10⁻⁶ | 23 |
| 1.3 × 10⁻⁷ | 0 | 1.3 × 10⁻⁷ | 9.1 × 10⁻⁶ | 1.1 × 10⁻⁵ | 17 | 9.68 × 10⁻⁶ | 1.11 × 10⁻⁵ | 13 | |
| 9.9 × 10⁻⁷ | 8.3 × 10⁻⁷ | 20 | 1.4 × 10⁻⁵ | 1.3 × 10⁻⁵ | 7 | 1.32 × 10⁻⁵ | 1.33 × 10⁻⁵ | 1 | |
Disclaimer/Publisher’s Note: The statements, opinions and data contained in all publications are solely those of the individual author(s) and contributor(s) and not of MDPI and/or the editor(s). MDPI and/or the editor(s) disclaim responsibility for any injury to people or property resulting from any ideas, methods, instructions or products referred to in the content. |
© 2024 by the authors. Licensee MDPI, Basel, Switzerland. This article is an open access article distributed under the terms and conditions of the Creative Commons Attribution (CC BY) license (https://creativecommons.org/licenses/by/4.0/).
Share and Cite
Hafizh, M.; Mecheter, A.; Tarlochan, F.; Pathare, P.B. Evaluation of Bruising Susceptibility and Response of Pears under Impact Loading through Finite Element Analysis. Appl. Sci. 2024, 14, 2490. https://doi.org/10.3390/app14062490
Hafizh M, Mecheter A, Tarlochan F, Pathare PB. Evaluation of Bruising Susceptibility and Response of Pears under Impact Loading through Finite Element Analysis. Applied Sciences. 2024; 14(6):2490. https://doi.org/10.3390/app14062490
Chicago/Turabian StyleHafizh, Muhammad, Asma Mecheter, Faris Tarlochan, and Pankaj B. Pathare. 2024. "Evaluation of Bruising Susceptibility and Response of Pears under Impact Loading through Finite Element Analysis" Applied Sciences 14, no. 6: 2490. https://doi.org/10.3390/app14062490
APA StyleHafizh, M., Mecheter, A., Tarlochan, F., & Pathare, P. B. (2024). Evaluation of Bruising Susceptibility and Response of Pears under Impact Loading through Finite Element Analysis. Applied Sciences, 14(6), 2490. https://doi.org/10.3390/app14062490