Article

Mental Workload Assessment Using Machine Learning Techniques Based on EEG and Eye Tracking Data

by
Şeniz Harputlu Aksu
1,
Erman Çakıt
2,* and
Metin Dağdeviren
2
1
The Scientific and Technological Research Council of Türkiye, Ankara 06530, Türkiye
2
Department of Industrial Engineering, Gazi University, Ankara 06570, Türkiye
*
Author to whom correspondence should be addressed.
Appl. Sci. 2024, 14(6), 2282; https://doi.org/10.3390/app14062282
Submission received: 2 February 2024 / Revised: 28 February 2024 / Accepted: 7 March 2024 / Published: 8 March 2024

Abstract

:
The main contribution of this study was the concurrent application of EEG and eye tracking techniques during n-back tasks as part of the methodology for addressing the problem of mental workload classification through machine learning algorithms. The experiments involved 15 university students, consisting of 7 women and 8 men. Throughout the experiments, the researchers utilized the n-back memory task and the NASA-Task Load Index (TLX) subjective rating scale to assess various levels of mental workload. The results indicating the relationship between EEG and eye tracking measures and mental workload are consistent with previous research. Regarding the four-class classification task, mental workload level could be predicted with 76.59% accuracy using 34 selected features. This study makes a significant contribution to the literature by presenting a four-class mental workload estimation model that utilizes different machine learning algorithms.

1. Introduction

Mental workload is a “construct that reflects the relation between the environmental demands imposed on the human operator and the operator’s capabilities to meet those demands” [1]. The elucidation and measurement of mental workload are essential endeavors in the field of cognitive sciences. During an era characterized by a continuous flow of data and an expanding array of cognitive demands, it is crucial to systematically evaluate and comprehend mental workload. According to Sweller [2], in cognitive load theory, it is believed that an individual’s working memory capacity is limited. Therefore, task designers should minimize external cognitive load sources to allow employees to effectively focus their cognitive resources on completing the primary task. If the task requires more mental resources than the available capacity, it will result in mental overload [3]. Mental load is not just a niche pursuit, but a crucial aspect in optimizing cognitive performance, reducing mental fatigue, and protecting against the potential negative consequences of mental overload. In essence, the assessment of mental workload remains a significant component in striving for more comfortable, satisfying, productive, and safe work environments [4].
The importance of the mental workload concept highlights the need for accurate and effective measurement tools. However, measuring mental workload directly and effortlessly is not feasible due to its multidimensional nature and susceptibility to various factors. For mental workload assessment, the eye tracking technique is favored due to its ability to minimize task interruption compared to other physiological methods. Additionally, it can gather multiple types of information about the eye using just one sensor. On the other hand, the EEG method is selected for its effectiveness in capturing real-time temporal information. One potential advantage of utilizing eye movements in the assessment of mental workload is the ability to capture rapid fluctuations in workload that occur within a short timeframe [5]. Eye tracking also offers benefits such as quick device setup, precise and sufficient data collection, and the ability to accommodate slight head movements. Specifically, studies have demonstrated a correlation between pupil response, blink movement, and visual as well as auditory tasks [6,7,8,9,10]. Recent studies have focused on predicting mental workload, primarily approaching it as a classification problem with the objective of estimating the level of mental workload categorically. These studies differ in terms of the task type employed in the experiments, the techniques utilized to obtain input variables for the model, the number of predicted classes, and the algorithms employed to address the problem. Despite these efforts, developing a model that can accurately predict mental workload remains an unresolved issue in the existing literature.
One of the primary objectives of this study is to investigate the correlation between physiological variables and mental workload, and compare it with the existing literature. Another crucial objective is to expand the scope of the problem, which is typically categorized into two or three classes in previous studies, by considering four classes. This will provide a more detailed understanding of workload levels and enable the development of a classification model with the highest possible accuracy. Furthermore, this study stands out due to its unique approach of simultaneously collecting eye tracking and EEG data from participants. Although synchronizing the data from both devices presents challenges during the experiment and analysis process, previous findings have shown that combining physiological methods, which are known to be influenced by fluctuations in mental workload, enhances the performance of the model. Hence, EEG and eye tracking methods were employed together in this study, which is a novel contribution to the literature as no previous studies have tested both n-back tasks while utilizing EEG and eye tracking methods simultaneously.
In this study, we employed EEG and eye tracking as physiological techniques, which were further complemented by the subjective evaluation scale NASA-TLX [11]. Additionally, the raw EEG data were processed using the MATLAB software (version R2021b)-based EEGLAB tool, which not only facilitates the visualization and interpretation of statistical analysis results, but also serves as an exemplary application of this tool in the literature.
In summary, this study has three main objectives:
  • Analyzing the relationship between EEG and eye-related variables with task difficulty level and subjective workload evaluation, and comparing them with similar studies in the literature.
  • Predicting task difficulty level, which is evaluated as the mental workload, using EEG and eye tracking data.
  • Incorporating machine learning algorithms and utilizing the EEGLAB tool to enhance the analysis and interpretation of the results, thereby contributing to the existing literature. This research was carried out in the order shown in Figure 1.
The remaining part of this study is structured in the following manner. The literature review is provided in the subsequent Section 2. The Section 3 outlines the study design and introduces the implementation of machine learning techniques. The comparison of the results obtained from the various machine learning methods is discussed in the Section 4. Lastly, the Section 5 evaluates the findings and provides recommendations for future research endeavors.

2. Related Work

The majority of methods used to measure mental workload are based on theories and follow a deductive approach. This approach begins with a hypothesis or a set of hypotheses which are derived from existing knowledge and theories. The next step is to measure and quantify the factors that are believed to influence mental workload. These factors are then aggregated and used to make a final inference, typically in the form of an index or score. However, it is also possible to use inductive research methodologies in the field of mental workload. This involves starting with the measurement and quantification of the factors that are believed to influence mental workload, and then using data-driven techniques to create computational models that can fit human performance. Machine learning is essential in measuring mental workload due to the complex nature of mental workload itself, the presence of ambiguous and uncertain non-linear factors that influence this concept, and the challenges in aggregating these factors and developing computational models. However, there has been limited progress in applying machine learning techniques to automatically construct mental workload models that incorporate subjective measures.
In contrast to other neuroimaging techniques, EEG exhibits a relatively high temporal resolution. It offers a real-time and unbiased assessment, and its ease of application is attributed to its portable device. Moreover, EEG is considered a safe method for long-term and repeated use due to its non-invasive nature. Notably, it does not necessitate the presence of a skilled operator or involve any medical procedures [12]. EEG indices have demonstrated a remarkable sensitivity to fluctuations in brain activity. Several studies have applied machine learning algorithms using eye tracking and EEG data. In the research conducted by Liu et al. [13], individuals were instructed to perform an n-back memory task in order to assess the workload levels of 21 participants across three distinct scenarios. Simultaneously, the participants’ EEG; fNIRS data; and additional physiological measurements, including heart rate, respiratory rate, and heart rate variability, were recorded. The findings of the study unveiled that the combination of EEG and fNIRS techniques yielded more precise outcomes compared to their individual usage, with an accuracy rate of 65%.
Jusas and Samuvel [14] conducted a study involving nine individuals, where they employed four distinct motor imagery tasks. These tasks required participants to engage in mental processes where they practiced or simulated specific actions. The study solely utilized EEG physiological data, and the highest classification performance achieved was 64% through the implementation of linear discriminant analysis. In their research on seven individuals, Yin and Zhang [15] performed a prediction model for mental workload using binary classification. The study concluded with a comparison of the model’s estimator accuracy performance, which achieved a remarkable 85.7%, against traditional classifiers such as support vector machines and nearest neighbors. The findings demonstrated the superiority of this method over static classifiers. Pei et al. [16] conducted a study involving seven individuals, where they achieved an accuracy performance of 84.3% using the RF algorithm. They established a model by utilizing various EEG attributes obtained from a 64-channel EEG device during a simulation flight mission. Furthermore, the classification performance of the three-level model, which solely utilized band power variables, reached 75.9%. In a study conducted by Wang et al. [17], the hierarchical bayes model’s cross-subject classifier was trained and tested using EEG data from a cohort of eight participants. The findings of the research indicate that the performance of the cross-subject classifier is similar to that of individual-specific classifiers.
In the study conducted by Kaczorowska et al. [18], a group of 29 individuals participated in a number symbol matching test, which consisted of three levels of difficulty. The logistic regression and random forest algorithms were employed to determine the accuracy of the 20-variable model, which was constructed using eye tracking data. The resulting accuracy was found to be 95%. In the research conducted by Sassaroli et al. [19], the fNIRS technique was utilized on three individuals to differentiate various levels of mental workload by analyzing the hemodynamic changes in the prefrontal cortex. To determine the mental workload levels, the K nearest neighbor algorithm was employed, considering the amplitude of oxyhemoglobin and deoxyhemoglobin (k = 3). The study revealed classification success rates ranging from 44% to 72%. Grimes et al. [12] conducted an early study that classified mental workload through n-back tasks, achieving a commendable level of accuracy. By employing the Naive Bayes algorithm, they determined that the two-difficulty level model had an accuracy rate of 99%, while the four-difficulty level model achieved an accuracy rate of 88%. These measurements were obtained using a 32-channel EEG device and involved a sample of eight individuals.
Wu et al. [20] conducted a study on prediction using the eye tracking method. The study involved 32 non-experts and seven experts who were tasked with performing operational tasks at two varying difficulty levels. The researchers used pupil diameter, blink rate, focusing speed, and saccade speed as inputs in their model, while the NASA-TLX score served as the output. The results showed that the accuracy of the model, obtained through the use of ANN, was 97% when tested with the data. A study conducted on the cognitive burden of automobile operators demonstrated that a feed-forward neural network classifier achieved a prediction accuracy of over 90% in determining levels of alertness, drowsiness, and sleep states [21]. In another study, a group of 28 individuals engaged in a computer-based flight mission. During this study, the brain signals of the participants were recorded using a 32-channel EEG device, while eye data were collected using an eye-tracking device operating at a frequency of 256 Hz [22]. The study employed various algorithms such as linear regression, support vector machines, random forests, and artificial neural networks. Among these algorithms, the model that incorporated both eye tracking and EEG variables yielded the highest accuracy rate of 54.2% in the three-category classification task. SVM has been utilized in various studies within the literature to obtain mental workload classification results using eye tracking or EEG data [23,24,25,26,27,28,29,30].
Upon reviewing the pertinent literature, it became evident that both EEG and eye tracking techniques have significant implications in the analysis of mental workload. Nevertheless, it was observed that there exists incongruity in the findings regarding the correlation between the variables in both methods and mental workload. Notably, certain studies have demonstrated an augmentation of eye-related variables with increased mental workload, while others have shown a decline. The current study distinguishes itself from other studies by incorporating machine learning algorithms that have been developed in the past decade (extreme gradient boosting (XGBoost) and light gradient boosting machine (LightGBM)), but have not been previously utilized in studies aiming to estimate mental workload using EEG and eye tracking techniques.

3. Materials and Methods

3.1. N-Back Task

Considering that cognitive load theory was formulated by taking into account the constraints of working memory capacity, it makes sense to choose task categories that specifically focus on working memory for conducting research on manipulating mental workload. N-back tasks are commonly utilized in research literature due to their reliability in assessing working memory capacity and their validity, which has been demonstrated in numerous studies [12,13,31,32,33,34,35,36]. These memory tests were also employed in this particular study due to their established validity in previous research. N-back tasks inherently involve both the storage and manipulation of information, surpassing traditional working memory tasks. The level of “n” in the n-back task is directly related to the “working memory load,” representing the mental demand required for the storage and/or manipulation processes involved [37]. The n-back paradigm is well-established, with strong correlations between difficulty level and cortical activation associated with working memory. Monod and Kapitaniak [38] also suggested that task difficulty, an internal cognitive load factor, directly influences cognitive load. Previous research has shown that task difficulty, determined by the number of items to be remembered, hampers performance in memory tasks and affects psychophysiological measurements, particularly components regulated by the autonomic nervous system [39]. As task difficulty is a crucial determinant of mental workload, it was selected as the target variable in the classification model developed for this study.

3.2. Participants and Experimental Procedure

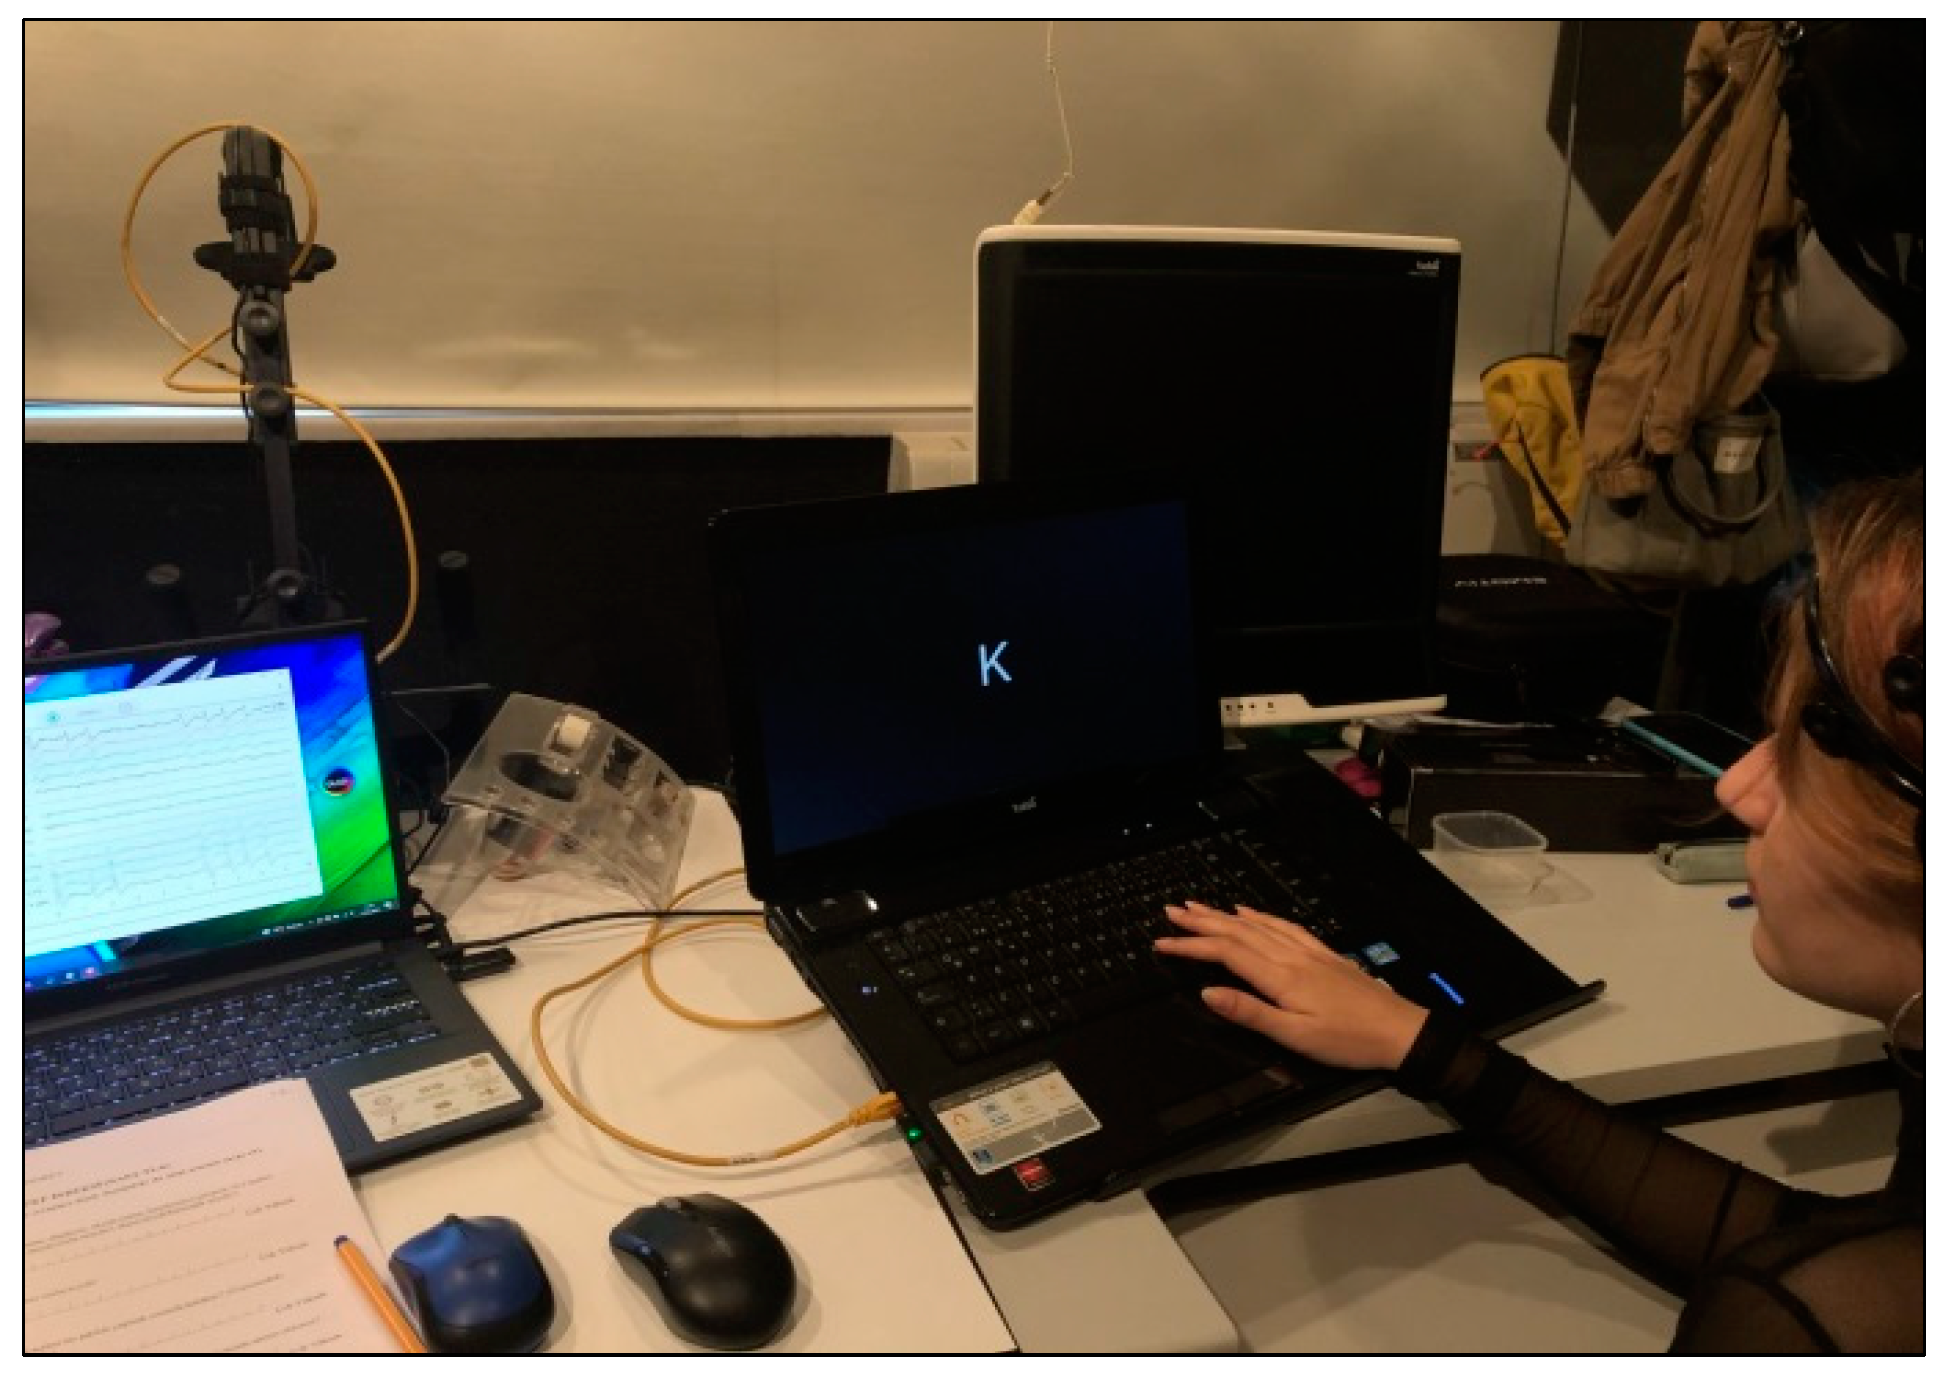
A total of 15 healthy undergraduate students, consisting of 8 males and 7 females, aged between 19 and 25, were chosen to participate in the research study. The average age of the participants was 21.6. The experimental protocol for this study was approved by the Institutional Ethics Committee (2020-483 and 8 September 2020) of Gazi University, Ankara, Türkiye. All participants provided informed consent in accordance with human research ethics guidelines. All experiments took place in the Human Computer Interaction Laboratory, under consistent physical conditions. The laboratory was well-lit with fluorescent lighting and was sound-insulated. Participants were verbally briefed on the study’s purpose and the n-back tests they would be performing, as well as the required actions. Prior to starting the task, written instructions were displayed on the screen, explaining how to perform the task and its difficulty level. Two trial tests were conducted to ensure participants understood the tests: one off-record and one after recording began. The trial test data that were included in the recording were not taken into account during the analysis. Experiments were only initiated after confirming the quality of the EEG signals and eye tracking calibration. Figure 2 depicts a photograph taken during the implementation of the experiment.
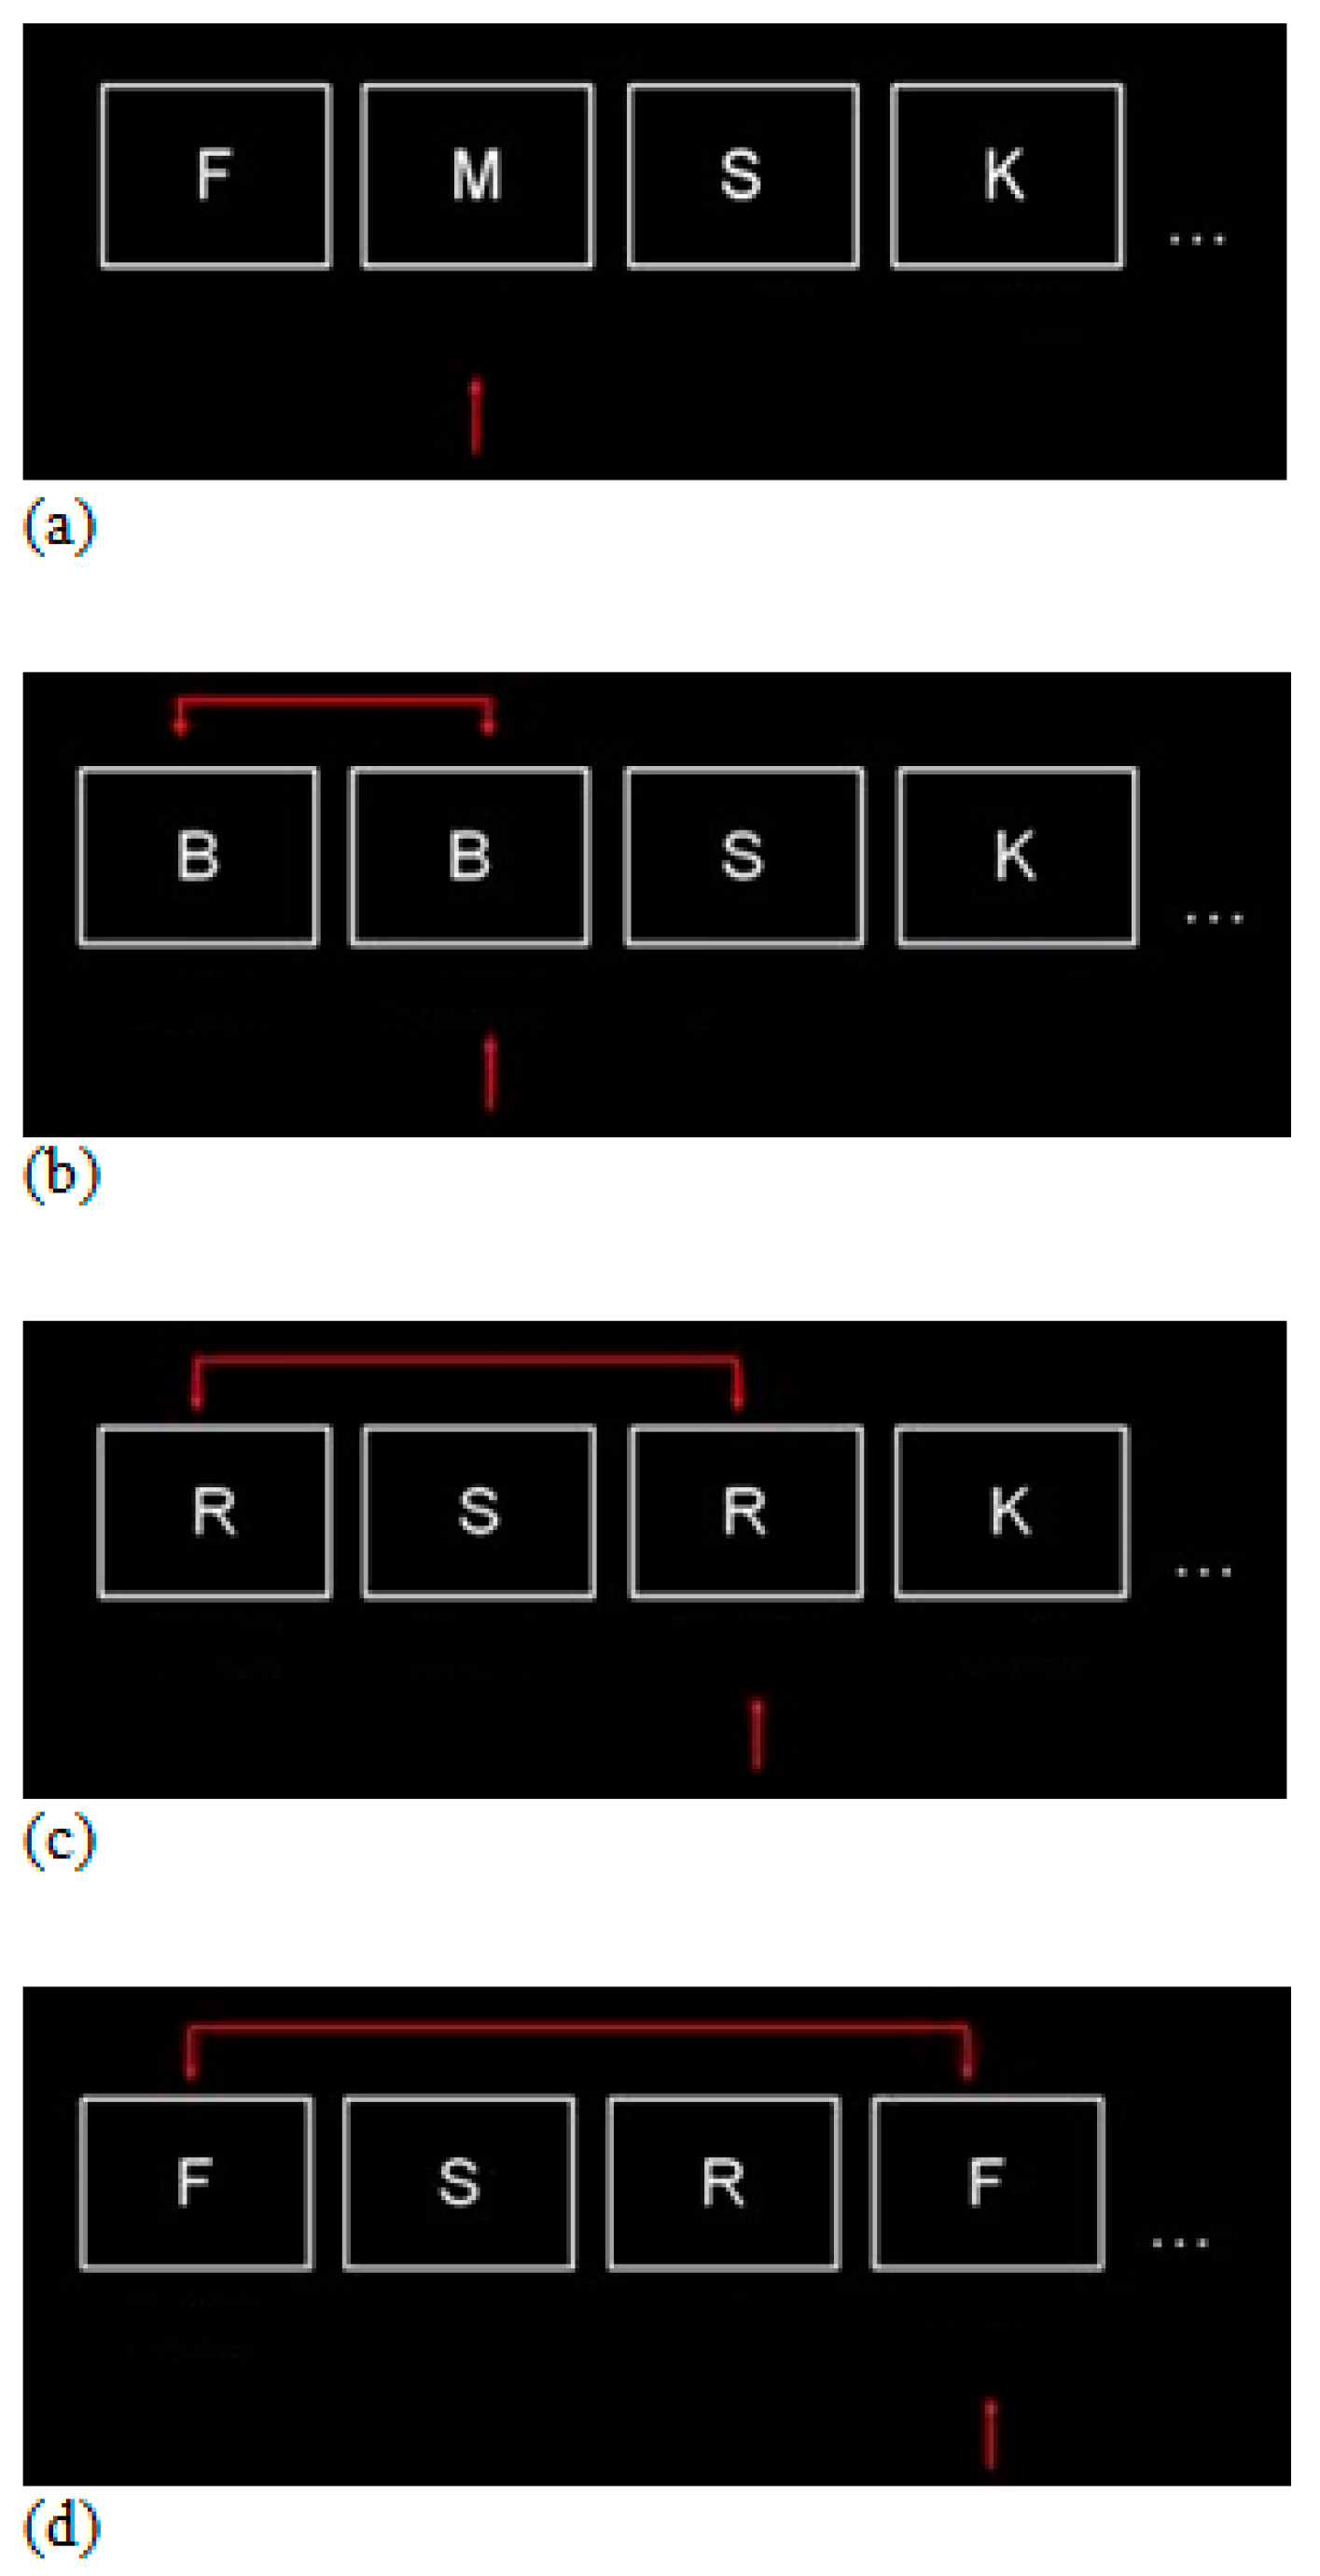
A standard visual n-back task set was utilized with the Inquisit Lab 6 software (version 6.6.1), offering four different difficulty levels (0-back, 1-back, 2-back, 3-back). The task became more challenging as the value of “n” increased. Each difficulty level was repeated three times, resulting in a total of 12 trials per participant. The order of the trials was randomized to prevent any bias caused by knowing the difficulty level in advance. Participants were instructed to press the “M” key when they saw the letter “M” in the 0-back task, and the “L” key if the letter was not “M”. In the 1-back, 2-back, and 3-back difficulty level tests, they were required to press the “M” key if the letter on the screen matched the letter from 1, 2, or 3 positions back, respectively (target/match condition). If the letter did not match (non-target/non-match condition), they were instructed to press the “L” key. The task rules are provided in Figure 3. Each letter was displayed for 500 milliseconds, with a 2000 millisecond interval until the next letter appeared. Therefore, participants had a total response time of 2500 milliseconds.
After each block, participants were asked to subjectively assess their mental workload using the NASA-TLX scale. Additionally, they were asked to prioritize the six sub-dimensions of the NASA-TLX through pairwise comparison tables. Weighted total NASA-TLX scores were calculated based on the weights derived from the 15 pairwise comparisons. The duration of the experiment with one participant was approximately 20 min.

3.3. Data Acquisition and Pre-Processing

3.3.1. EEG Data

The EEG data were captured using the EMOTIV EPOC X device, which has a resolution of 14 bits and a sampling rate of 128 Hertz (Hz). This device was equipped with 14 channels, and the sensor placements adhered to the international 10–20 system. The EMOTIV Pro software (version 2.6.4) conducted real-time frequency analysis on each channel and also allowed for the analysis of recorded data. It visually presented the power in different frequency bands for each selected channel. The power changes of each frequency were displayed in decibels (dB). The power densities obtained for each frequency band of the EEG signals, which were divided into sub-bands using FFT (fast Fourier transform), could be observed in the “Band Power” graph located at the bottom of the screen.
The frequency ranges for different bands in the software were as follows: theta band (4–8 Hz), alpha band (8–12 Hz), gamma band (25–45 Hz), low beta (12–16 Hz), and high beta (16–25 Hz). The variables analyzed in the study were aligned with these band intervals. The “FFT/Band Power” data were transferred to an external environment, allowing access to power data for five frequency bands per channel. Unlike raw EEG data, which had a frequency of 128 Hz, the band power data were transferred with a frequency of 8 Hz. For EEG recordings with a quality measurement above 75%, the average values of band power variables provided by the software were obtained based on stimuli. The variable “AF3.Theta” represented the average theta power from the AF3 channel, while “AF3.HighBeta” represented the average high beta power from the same channel. A total of 70 EEG variables, representing power in five frequency bands (theta, alpha, low beta, high beta, gamma), were used for 14 channels. Additionally, based on previous studies indicating a positive relationship between the theta/alpha power ratio and difficulty level, 14 more variables corresponding to this ratio were included in the analysis for each channel [26,40]. For example, the variable indicating the theta/alpha power ratio for the AF3 channel was labeled as “AF3.ThetaAlpha”. The unit of measurement for EEG variables was given as dB.
The raw EEG signals underwent pre-processing to remove noise using the EEGLAB toolbox [41]. Following the pre-processing, the STUDY functionality of EEGLAB was utilized to investigate the EEG mechanisms across subjects under different task conditions. This approach aimed to complement the statistical findings obtained from SPSS and provide a visual representation of the group analysis of the raw EEG data. The raw EEG data, acquired through EMOTIV Pro 3 software, were converted into a .set file and imported into the program along with the .ced file containing the coordinate data for the 14 electrode channels. Filtering and data pre-processing techniques were applied to eliminate noise from the raw data. The recommended procedure, as suggested by the developers of EEGLAB and employed in various studies [23,26,42,43], was followed.
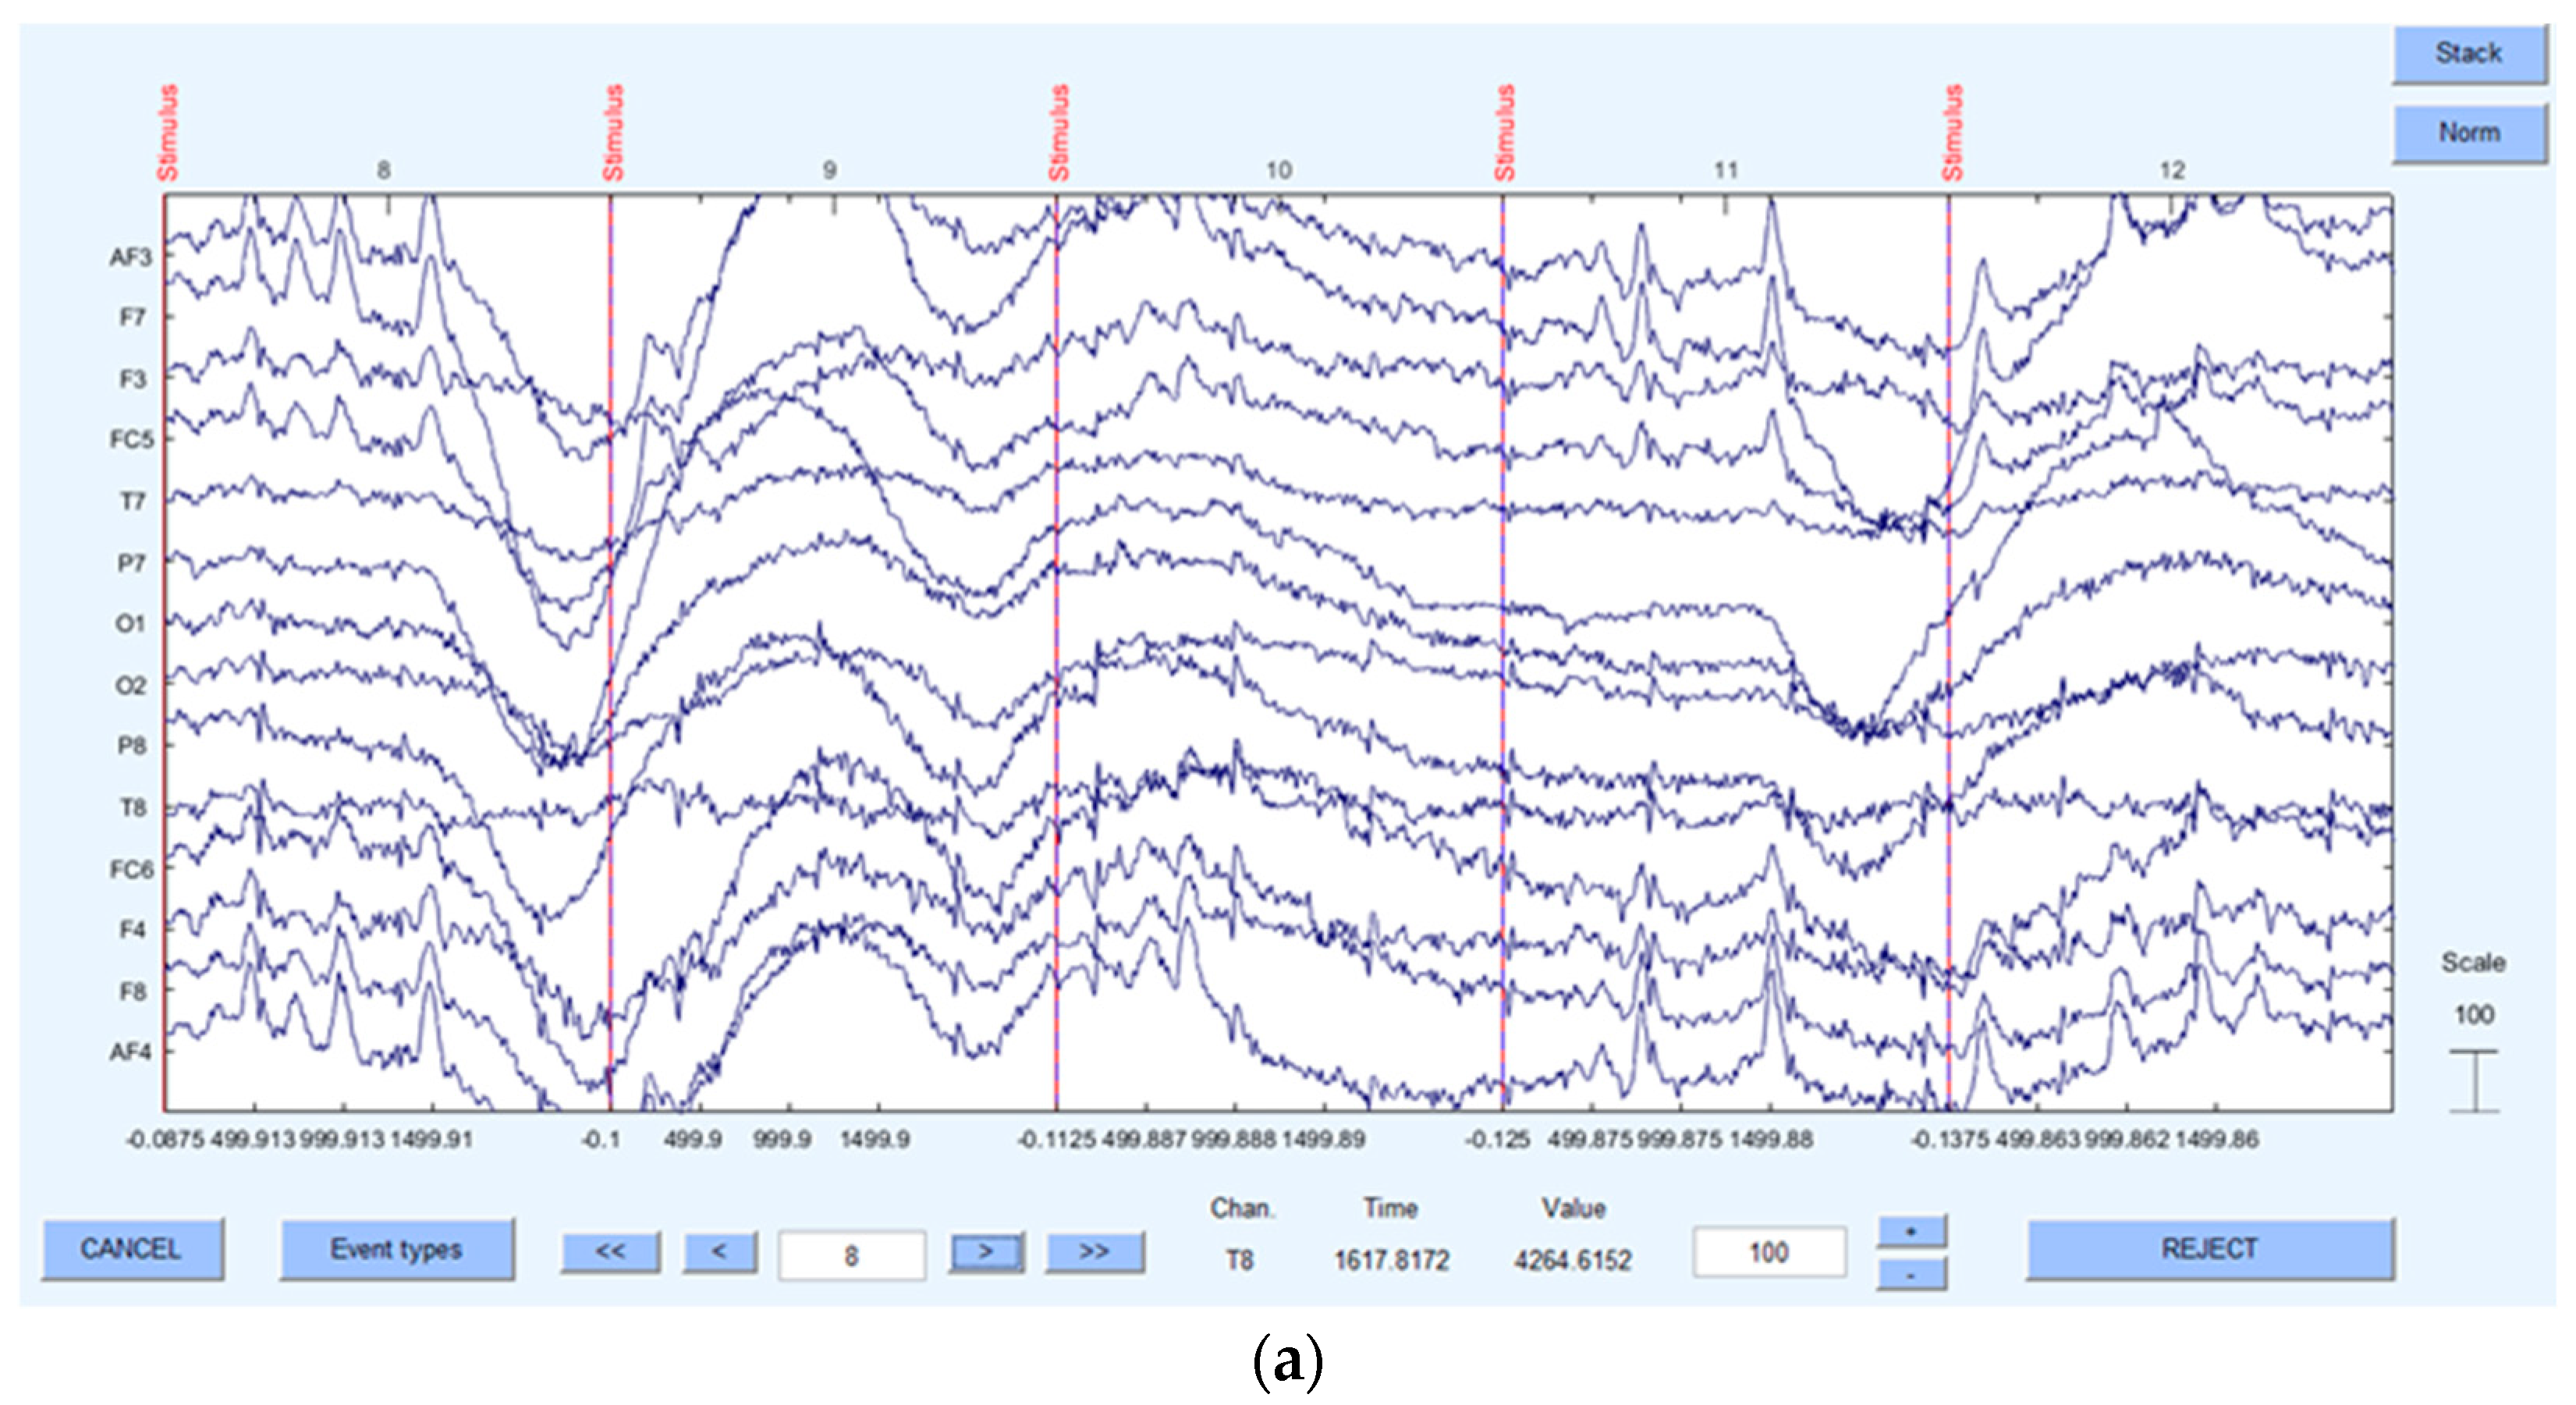
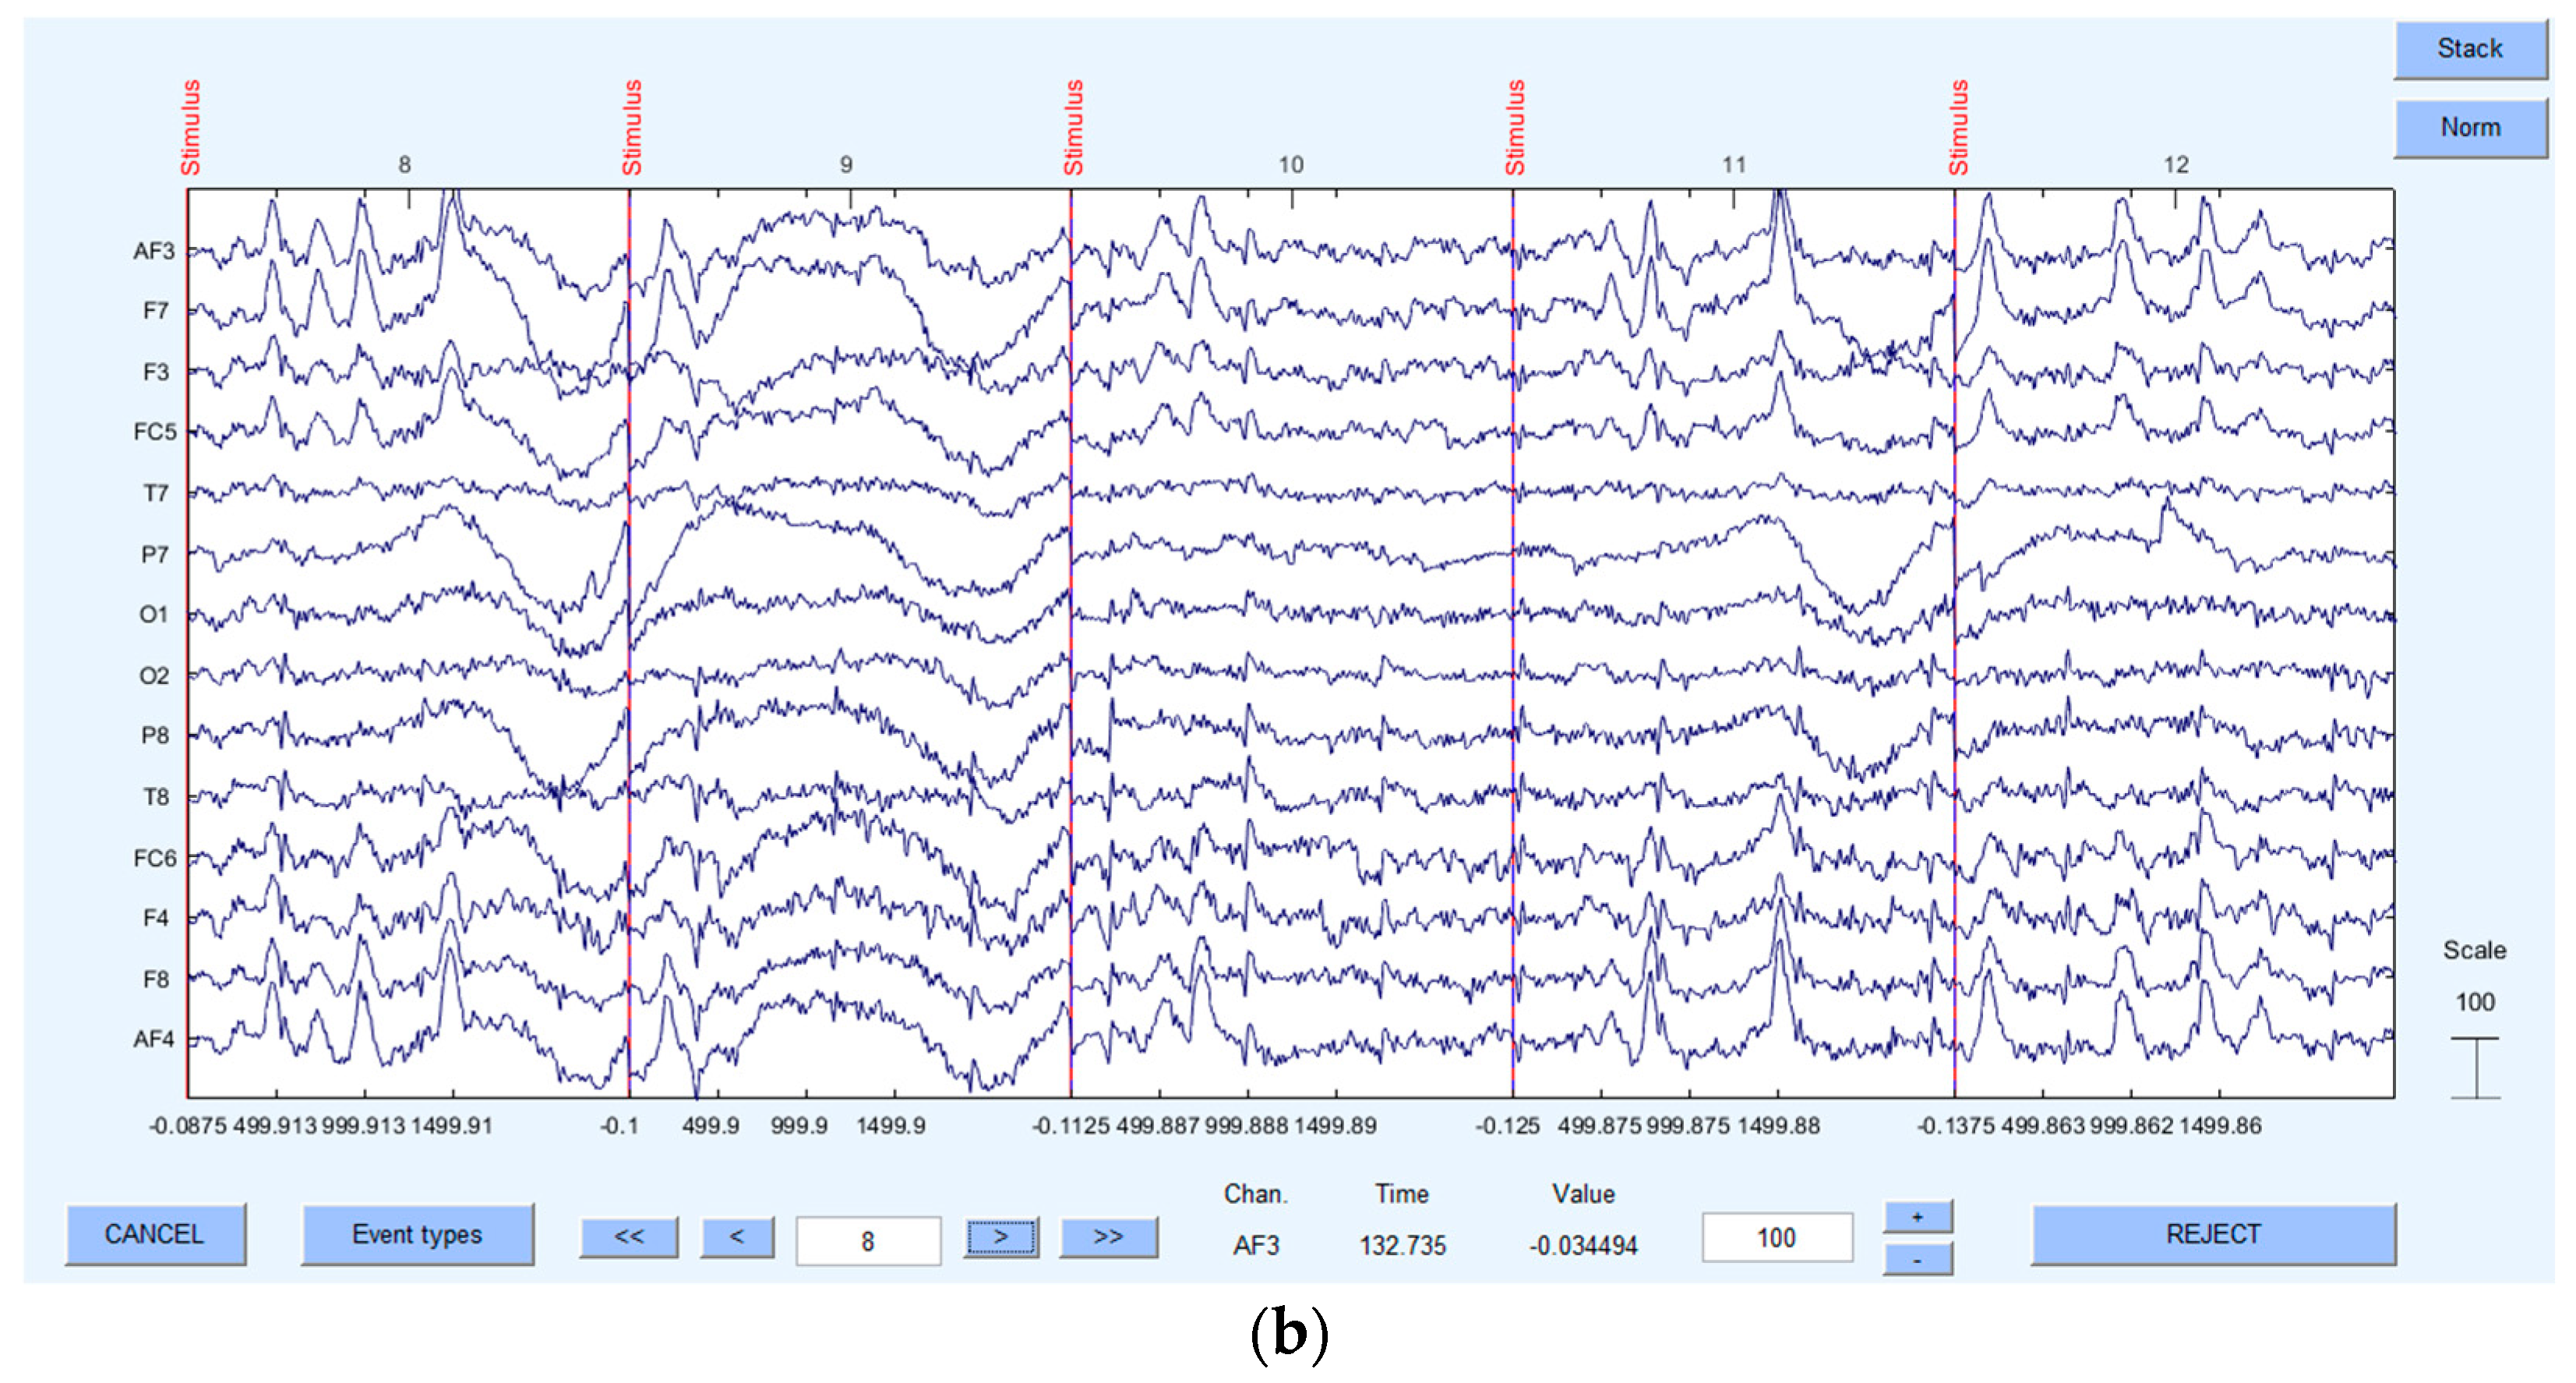
Noise is an undesirable distortion that occurs in the EEG signal, compromising the reliability of the obtained results. In order to eliminate this noise, a filtering process was conducted during the pre-processing stage of the study. A finite impulse response (FIR) filter was utilized to perform band-pass filtering, specifically ranging from 1 to 50 Hz. Additionally, to address the interference caused by line noise in the raw EEG signal [44], another filtering procedure was carried out using the CleanLine plugin in EEGLAB. Subsequently, the “Independent Component Analysis—ICA” technique was employed to separate the data into independent components, enabling the identification and removal of noise. This method was implemented in EEGLAB through the utilization of the “runica” function. Techniques like independent components analysis are valuable in uncovering EEG processes that exhibit dynamic characteristics associated with behavioral changes. It is a commonly employed technique to identify and eliminate noise originating from eye and muscle movements [41]. The ICLabel function was used to assess the attributes of the components, and those components that were determined to be ocular, muscular, or originating from another source with a probability exceeding 90% were discarded. Figure 4 illustrates the signal image before and after the filtering process.

3.3.2. Eye Tracking Data

The Tobii X2-60 device (Tobii Pro AB, Stockholm, Sweden) was used to collect eye tracking data. Tobii Studio software (version 3.4.8) recorded three types of eye events: “fixation”, “saccade”, and “unclassified”. The software can detect fixation and saccade movements, but blink data cannot be directly obtained. As a result, a separate analysis was developed for records classified as “unclassified”. The software allowed for direct measurement of the sizes of the right and left pupils. Additionally, the analysis included variables that were calculated by taking the mean and maximum values of both eyes. Prior to adding the fixation variables to the analysis, records with fixation durations below 80 ms and above 1200 ms were excluded. This exclusion was based on the studies conducted by Wu et al. [20], Borys et al. [23], Borys et al. [42], and Yan et al. [45].
Blinking refers to the action of either fully or partially closing the eye, as stated by Ahlstrom and Friedman-Berg [5]. In a study focused on detecting blinking movements, the center of the pupil was used as a reference point. If the eye was open, the pupil center could be calculated, and a value of 1 was assigned to the relevant variable. Conversely, if the eye was closed, the center point could not be determined, resulting in a value of 0 for the variable, as explained by Naveed et al. [46]. Following this methodology, the Tobii Studio software provided variables for the right pupil (“PupilRight”) and left pupil (“PupilLeft”). If calculations could be performed using these variables, it was assumed that the eye was open. On the other hand, if there were no data available for either variable, it indicated that the eye was closed. To represent the open and closed states of the eye, a variable named “BlinkValid” was introduced, with values of 1 and 0 assigned, respectively.
A blink typically lasts between 100–300 ms, with blinks lasting over 500 ms considered as drowsiness [47]. In this study, the device used had a frequency of 60 Hz, meaning that the duration of a recording line was 1/60 s. To classify situations as blinking for durations of 100 ms and above, the “BlinkValid” variable, indicating the number of records where the eye remained closed, was required to be at least six. Additionally, recordings identified as fixation by the Tobii Studio software were excluded from the blink analysis, as blinks occur between two fixation movements. Using Excel Visual Basic for Applications (VBA), records meeting the specified conditions were identified and assigned a “BlinkIndex” value, representing the number of blinks. The durations of the blink recordings were calculated by multiplying the duration of a recording (1/60 s) by the number of recordings in each blink event, and these values were stored in the “BlinkDuration” variable. The number of records identified as “blink” were also counted for each stimulus, and the total durations were determined on a stimulus basis.
There were 27 variables related to eye tracking, including the number of fixations and saccades. These variables also included the sum, mean, standard deviation, maximum, and minimum of fixation durations and saccade durations. Additionally, the mean, maximum, and standard deviation of saccadic amplitude were measured. The mean, maximum, and standard deviation of pupil diameter were recorded for both the right and left eyes separately, as well as the average of both. The number of blinks, as well as the sum and mean of blink durations, were also taken into account. Fixations below 80 ms and above 1200 ms were excluded, while blink durations were considered between 100 and 500 ms.

3.4. Datasets for Analysis

Two distinct sets of data were examined. The initial two objectives of the study focused on analyzing the first dataset, which comprised 2700 stimulus-based samples (15 subjects × 12 sessions × 15 stimuli). This dataset aimed to investigate changes in EEG and eye-related variables during tests of varying difficulty levels and to develop machine learning algorithms for predicting mental workload levels. The reason for considering the dataset on a stimulus basis was that the mental processes of visual perception, recall, matching, and reaction occurred within a 2500-millisecond timeframe after each stimulus was presented on the screen. Statistical analysis was conducted using SPSS 21.0, while Python 3.8 was utilized to establish classification models.
The second dataset aimed to explore changes in band power across different brain regions under various task conditions and to visualize the statistical findings. It consisted of 180 set extension files of raw EEG data obtained through EEG device software (version 2.6.4). These files were converted into set extension files using MATLAB for each participant’s session and underwent data pre-processing with EEGLAB. The dimensions of the files for the 0-back task were 4800 × 14; for the 1-back task, 5120 × 14; for the 2-back task, 5440 × 14; and for the 3-back task, 5760 × 14. The number of observations varied based on the number of stimuli in each task. As the EEG device had 14 channels, the columns in the dataset corresponded to the electrodes.

3.5. Brief Overview of Machine Learning Algorithms

In this section, we present the eight ML techniques employed in our study, namely, “k-nearest neighbors, random forests, artificial neural network, support vector machine, gradient boosting machines (GBM), extreme gradient boosting (XGBoost), and light gradient boosting machine (LightGBM).”

3.5.1. K-Nearest Neighbors (KNN)

The k-nearest neighbor (k-NN) algorithm is widely used in pattern recognition or classification tasks. Its approach involves analyzing the k-nearest training samples in the problem space to ascertain the class of a new, unlabeled data point. The k-NN algorithm operates under the assumption that points with similar features are likely to belong to the same class. KNN is categorized as an instance-based learning method as it depends on the specific instances or examples in the training dataset to classify new data points [48].

3.5.2. Random Forests

The random forest (RF) technique, introduced by Breiman [49] in 2001, offers a wide range of applications, including regression, classification, and variable selection, as highlighted by Genuer et al. [50]. By employing ensemble learning, RF combines multiple trees into a single algorithm, as explained by Cun et al. [51]. The prediction for a new observation is then determined by aggregating the predicted values from each individual tree in the forest. The key parameters for RF algorithms are the number of trees, the minimum number of observations in the terminal node, and the number of suitable features for splitting. In the existing literature, comprehensive mathematical explanations for RFs can be found [49].

3.5.3. Artificial Neural Networks (ANNs)

Artificial neural network (ANNs) is a mathematical technique that utilizes the principles of the human brain’s nervous system to analyze data and make predictions [52,53,54,55]. These networks are capable of efficiently processing large and intricate datasets [56,57]. The complexity of a neural network is greatly influenced by the number of hidden layers it possesses. Typically, a neural network architecture consists of an input layer to receive initial data, one or more hidden layers to process the data, and an output layer to generate the final prediction or output [58]. To ensure accurate predictions, it is crucial to select the appropriate design for the neural network [59]. For further explanations on ANN, there are additional resources available in the literature [58,60,61].

3.5.4. Support Vector Machine (SVM)

The objective of pattern classification is to develop a model that surpasses the performance of existing models on the training data. Traditional training methods in machine learning aim to find models that accurately classify each input–output pair within their respective class. However, if the model is overly tailored to the training data, it may start memorizing the data instead of learning to generalize, resulting in a decline in its ability to correctly classify future data [62]. The support vector machine (SVM) is a supervised machine learning technique that has been widely utilized in the machine learning community since the late 1990s [63]. SVM is a powerful tool that can be applied to both classification and regression problems. It is particularly well-suited for binary classification problems. In SVM, the decision boundary is determined by selecting a hyperplane that effectively separates the classes. The hyperplane is chosen in a manner that maximizes the distance or margin between the support vectors, which are the data points closest to the decision boundary.

3.5.5. Gradient Boosting Machines (GBM)

Friedman [64] introduced gradient boosting machines (GBMs) as an alternative method for implementing supervised machine learning techniques. The “gbm” model consists of three primary tuning parameters: “ntree” for the maximum number of trees, “tree depth” for the maximum number of interactions between independent values, and “learning rate” [65].

3.5.6. Extreme Gradient Boosting (XGBoost)

The XGBoost technique also follows the fundamental principles of the gradient boosting machine algorithm [66]. Achieving the optimal model performance frequently relies on finding the most suitable combination of the different parameters required by XGBoost. The following is how the XGBoost algorithm works: consider a dataset with m features and an n number of instances D S = x i , y i : i = 1 n ,   x i ϵ R m ,   y i ϵ R . By lowering the loss and regularization goal, we should ascertain the ideal mix of functions.
L ϕ = i l ( y i , ϕ x i ) + k Ω f k   ˙
where l represents the loss function and f k represents the (k-th tree) to solve the above equation, while   Ω is a measure of the model’s complexity; this prevents over-fitting of the model [67].

3.5.7. Light Gradient Boosting Machine (LightGBM)

LightGBM, a gradient-boosting decision tree method, is an open-source implementation that employs a leaf-wise approach to identify optimal splits for maximizing profits [68]. To enhance prediction accuracy, various model parameters, such as the number of leaves, learning rate, maximum depth, and boosting type, need to be fine-tuned [68].

4. Results and Discussion

4.1. Statistical Results

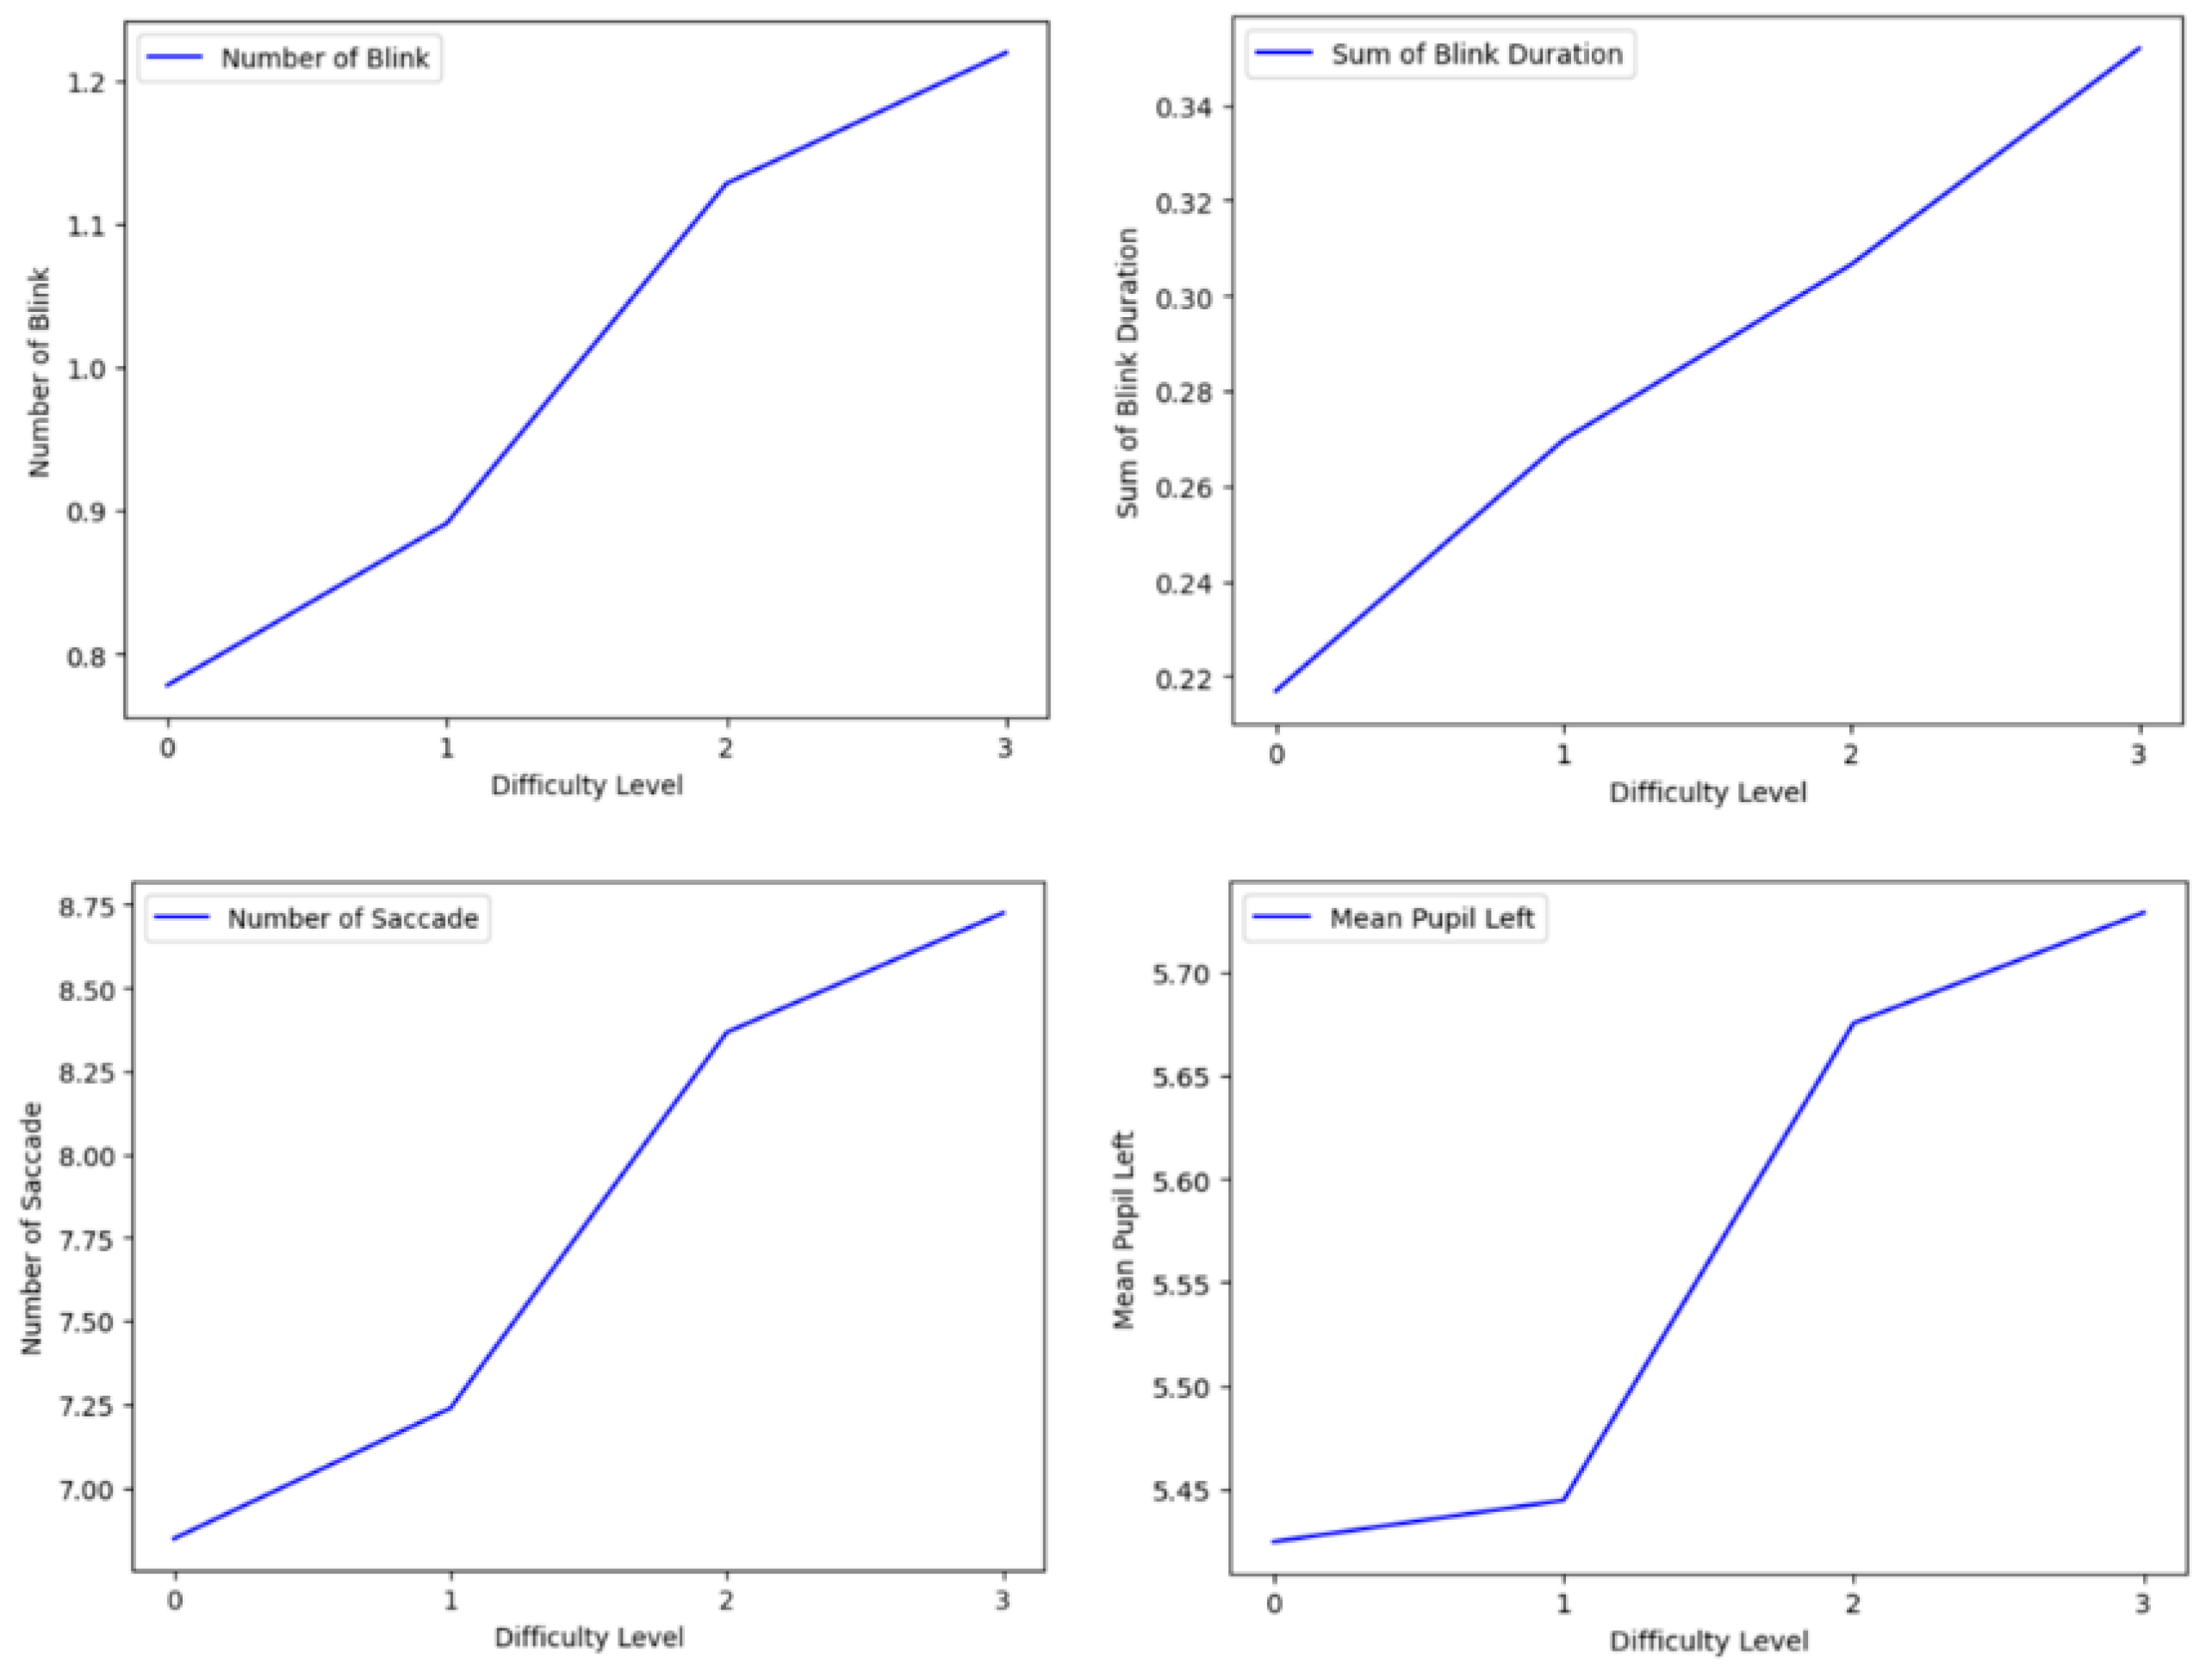
The investigation aimed to determine whether there was a correlation between eye tracking variables and NASA-TLX scores and task difficulty levels. The analysis revealed that the number and total duration of blinks, the number and total duration of saccades, and the mean of the left and right pupil diameter had the highest correlation with the task difficulty level (rho > 0.1, p < 0.01). Similarly, the number and total duration of blinks; the mean, maximum value, and standard deviation of saccade amplitude; and the number and total duration of saccades were found to be the variables most correlated with the weighted NASA-TLX score (rho > 0.1, p < 0.01). All variables, except for fixation duration, exhibited a positive correlation with mental workload. Furthermore, the Kruskal–Wallis (K-W) test demonstrated significant differences in all eye tracking variables based on task difficulty levels. Figure 5 presents graphs illustrating the changes in the mean values of blink, saccade, and pupil-related variables in relation to the difficulty level.
The Spearman correlation test yielded results indicating that the EEG variables associated with theta power from the AF3, AF4, F7, F8, and FC5 channels exhibited the strongest correlation with the level of task difficulty (rho > 0.3, p < 0.01). These findings demonstrate that as the task difficulty increased, theta power in the prefrontal, frontal, and frontal central regions also increased. Additionally, the correlation coefficients for variables related to theta/alpha power ratios were slightly higher in these same brain regions. Furthermore, it was observed that the level of task difficulty had a negative correlation with the alpha power measured in the O1, O2, T7, and P7 channels, while it had a positive correlation with the alpha power measured in the F7 and F8 channels. Specifically, as the task difficulty increased, the alpha power in the frontal regions increased, whereas the alpha power in the temporal, parietal, and occipital regions decreased.
The decrease in low beta power is a noticeable trend across various brain regions as the task difficulty increases. A significant correlation was found between the weighted NASA-TLX total score and 75 EEG variables, with a confidence level of 99%. The EEG variables that exhibited the strongest correlation with the weighted NASA-TLX total score were theta power from AF4 and F8, as well as theta/alpha power from AF3, AF4, and F8 (correlation coefficient > 0.3, p < 0.01). Essentially, as the perceived mental workload intensified, there was an increase in prefrontal and frontal theta power. Conversely, as the perceived workload increases, there is a decrease in low beta power in the prefrontal, frontal, parietal, and occipital brain regions (rho > 0.2, p < 0.01). The K-W test was employed to assess whether there were significant differences in EEG variables across different difficulty levels. The results revealed that there were indeed differences in difficulty levels at a confidence level of 99% for 49 EEG variables. Upon examining the rank values of these variables, it was observed that 34 out of the 49 variables exhibited a smooth increase or decrease in accordance with the change in task difficulty. This suggests that these variables may play a role in decomposing mental workload into four levels. In more challenging task conditions (2-back and 3-back), the prefrontal, frontal, and central regions displayed higher theta power, while the temporal, parietal, and occipital regions exhibited lower alpha power. Additionally, beta power was lower in almost all brain regions.

4.2. EEGLAB Study Results

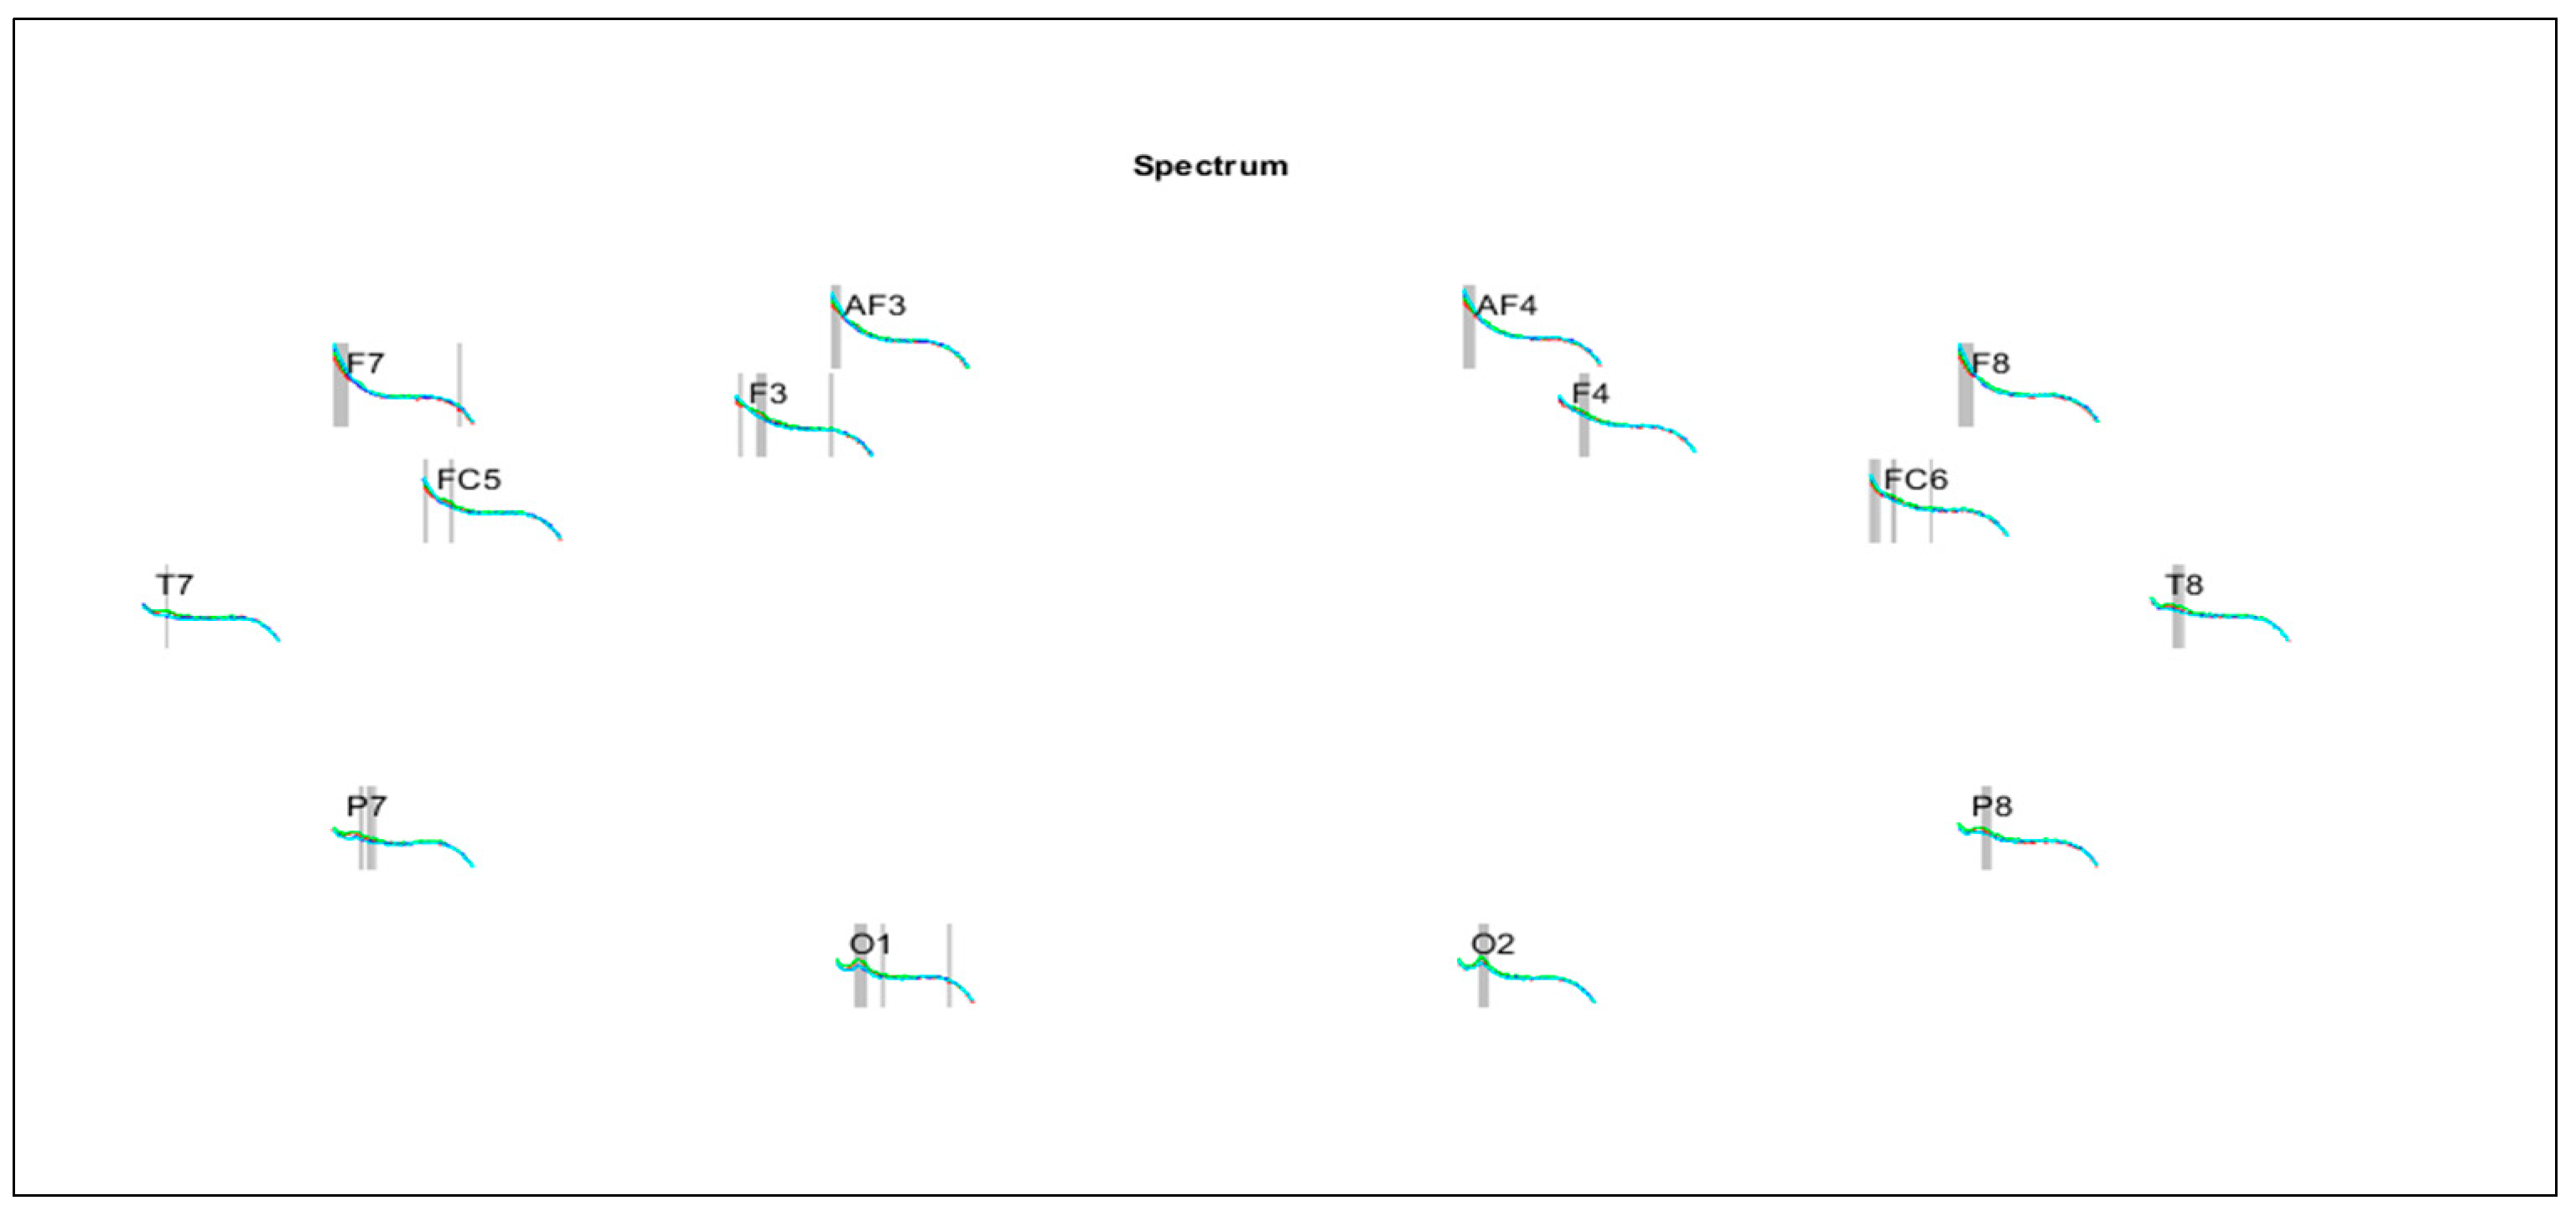
The band power data provided by the EEG device software were supported through the processing and visual analysis of the raw EEG data. By utilizing the EEGLAB STUDY tool, changes in EEG signals under different task conditions were examined graphically. Figure 6 presents the frequency ranges that exhibited significant differences in band power based on task conditions on a channel basis. The power spectra graphs illustrate the frequency range of 4–45 Hz. Notably, there was a substantial power change, particularly in the low-frequency theta band, in channels AF3, AF4, F7, F8, FC5, and FC6, which corresponded to the prefrontal, frontal, and central regions. Additionally, a significant power change was observed in channels O1, O2, P7, P8, T7, and T8, representing the temporal, parietal, and occipital regions, particularly in the alpha band.

4.3. Classification Results

Different algorithms such as kNN, SVM, ANN, RF, GBM, LightGBM, and XGBoost were utilized for modeling purposes. Table 1 presents the classification performance measures of 111-variable, 4-class classification models performed by using various algorithms. The values provided represent the average of five distinct performance outcomes achieved through five-fold cross validation. Among the models evaluated, the LightGBM algorithm stood out, with the highest accuracy performance of 71.96%. Nevertheless, XGBoost, SVM, and GBM also showcased commendable results.
The performance of models using only EEG or only eye variables was investigated using the LightGBM algorithm. The findings revealed that the model incorporating both EEG and eye variables yielded superior results, as anticipated, compared to the models that utilized them separately. Notably, the model solely based on eye variables exhibited better performance (accuracy: 65.67%) than the model solely based on EEG variables (accuracy: 56.15%).
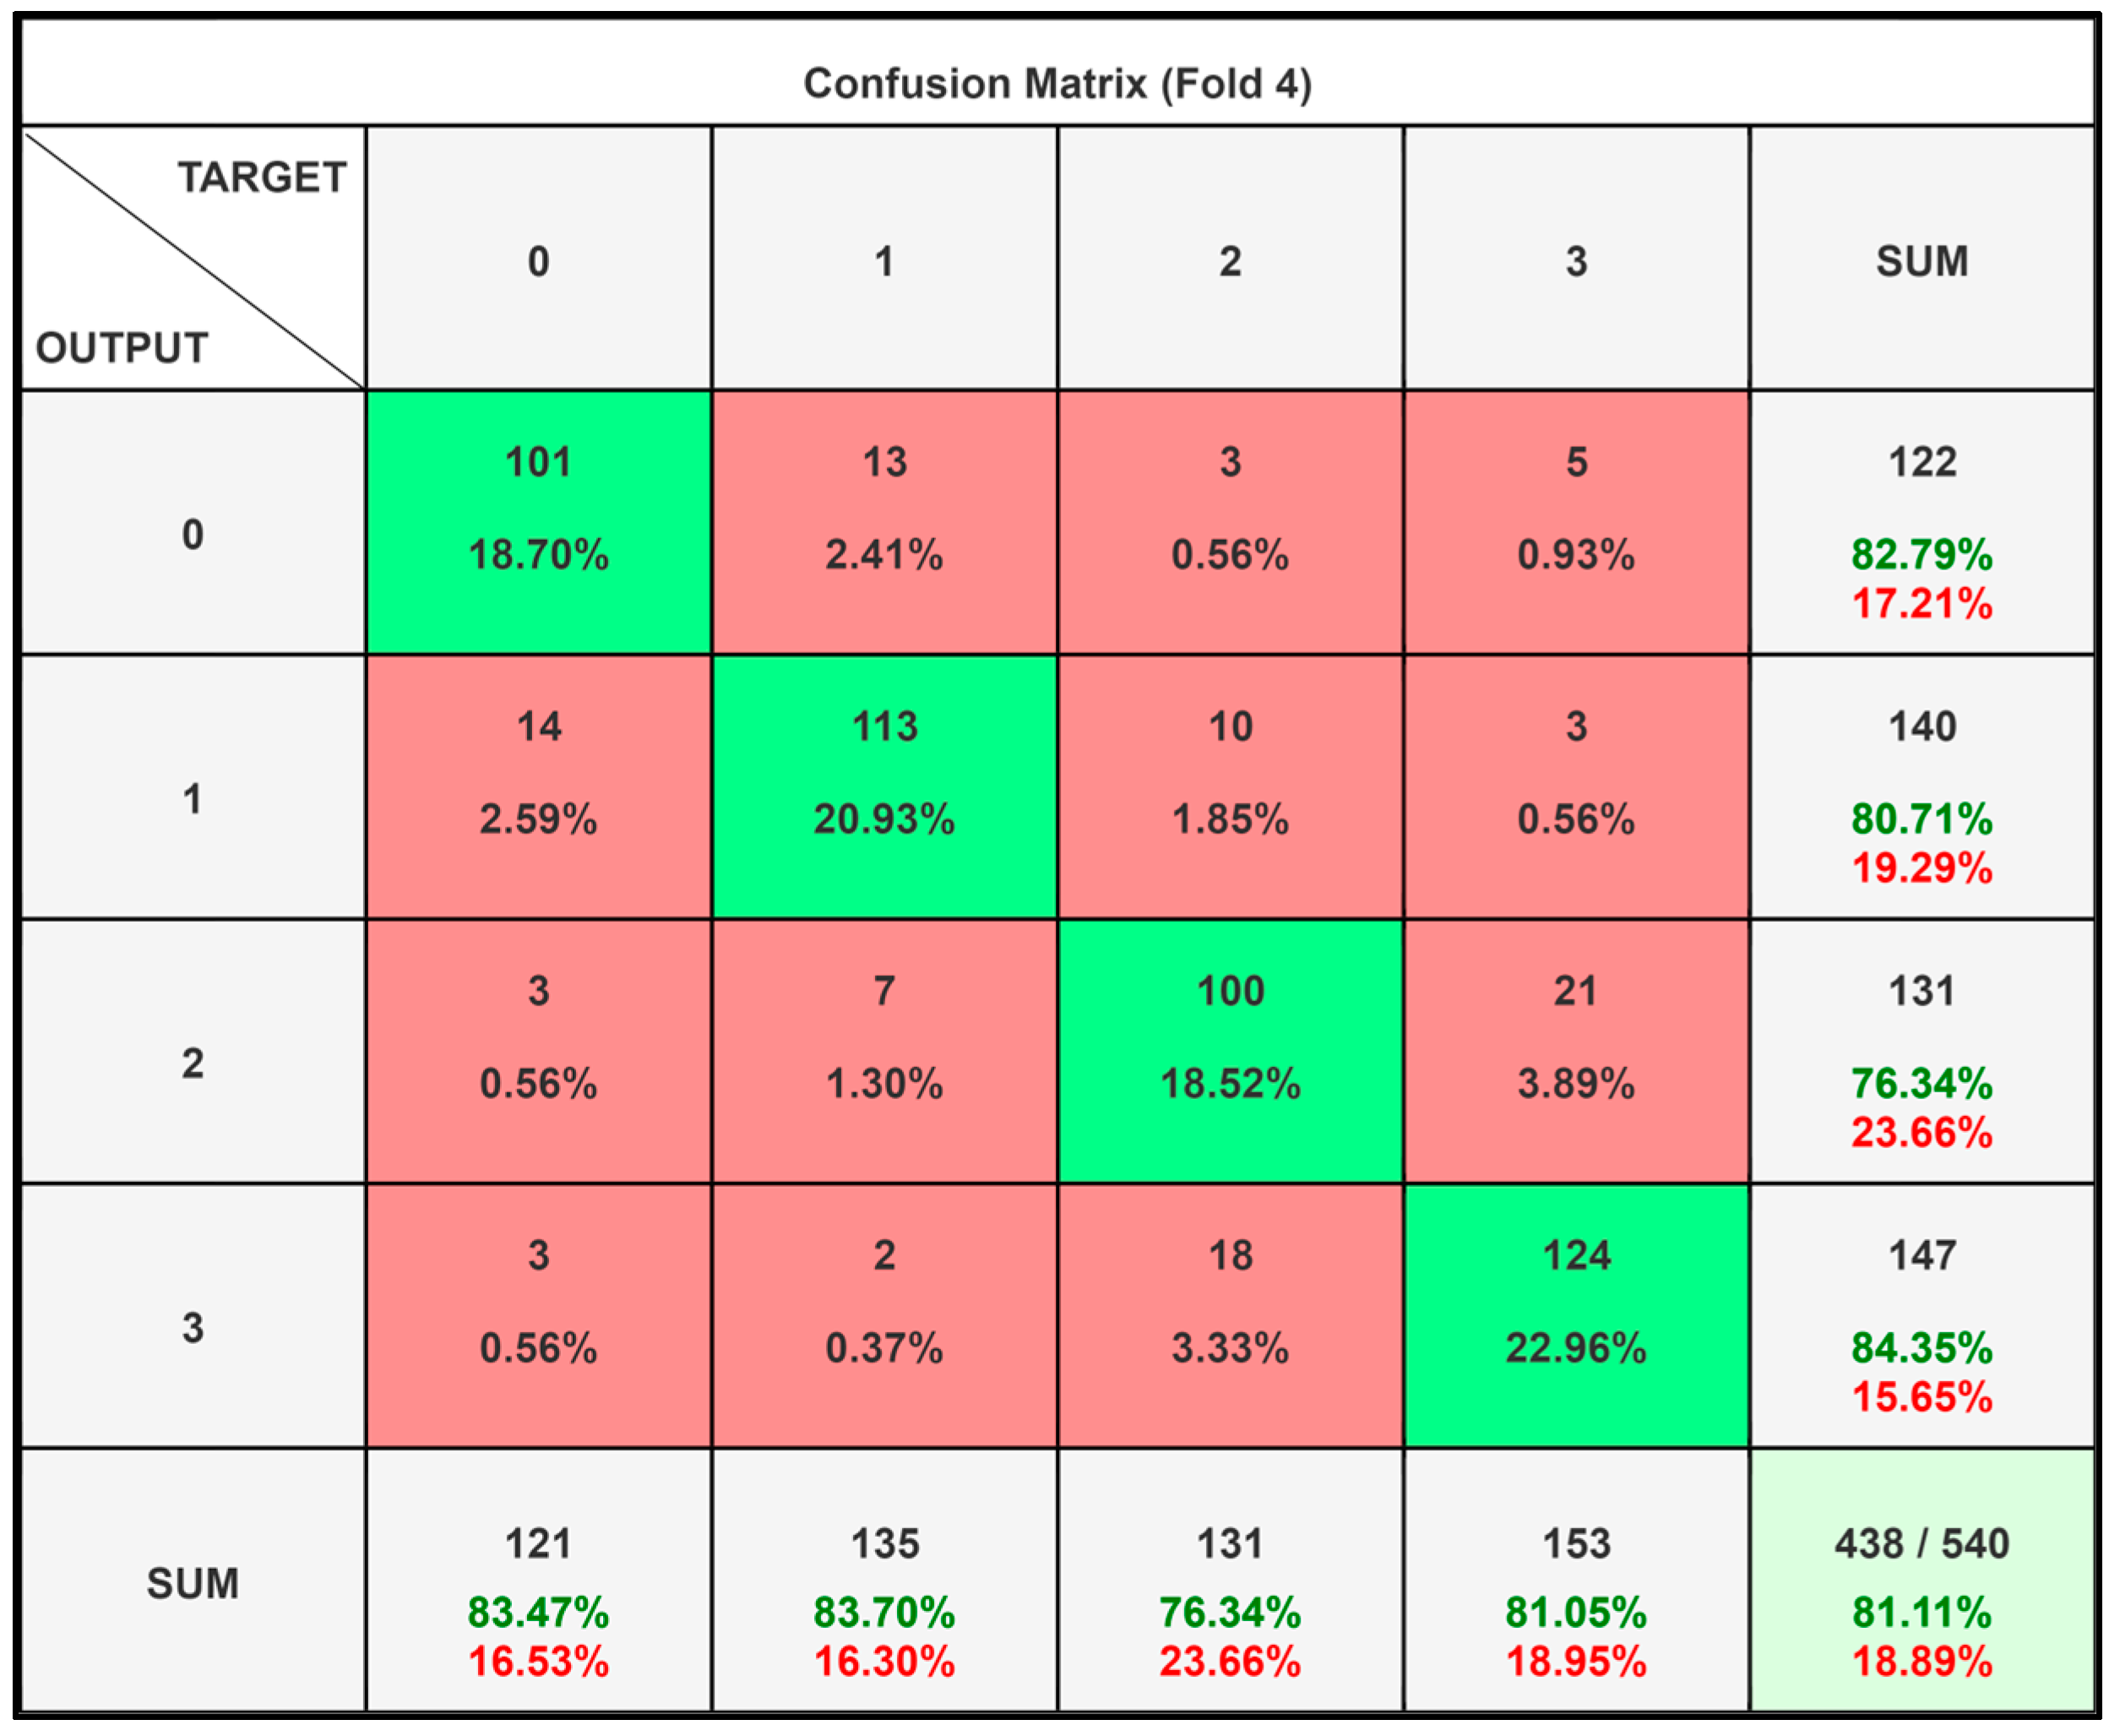
Upon examining the classification performances of the five models obtained through cross-validation, it was observed that the model mostly made incorrect predictions for observations belonging to the 1-coded class. Additionally, the misclassification predictions were predominantly observed between classes 0–1 and 2–3. To investigate the impact of reducing the complexity of the problem by reducing the number of classes, the problem was also analyzed as a three-class and two-class scenario. Initially, the observations related to the class coded 1, which had the lowest sensitivity value, were removed from the dataset. The aim was to classify the mental workload as low–medium–high by considering only the observations for the 0-back, 2-back, and 3-back tasks. The accuracy of the three-class model, which included all variables, was determined to be 80.49%. In the two-class model, where only observations for the 0-back and 3-back tasks were considered, an accuracy performance of 89.63% was achieved. Notably, both the three-class and two-class models exhibited strong classifier characteristics, as indicated by Kappa and MCC values exceeding 0.70.
We performed a dimension reduction procedure to improve both the classification performance and the comprehensibility of the model. In this study, the recursive feature elimination with cross validation (RFECV) method was employed for dimension reduction due to its superior reliability in feature selection and ability to identify the optimal stopping point. The RFECV method determined the optimal stopping point, leading to the selection of 34 features for the four-class model. Using the identical approach, the three-class model identified 91 variables, while the two-class model identified 110 variables. Out of the 34 variables chosen for the four-class model, it was observed that 20 of them were derived from EEG data, while the remaining 14 variables were obtained through the eye tracking method.
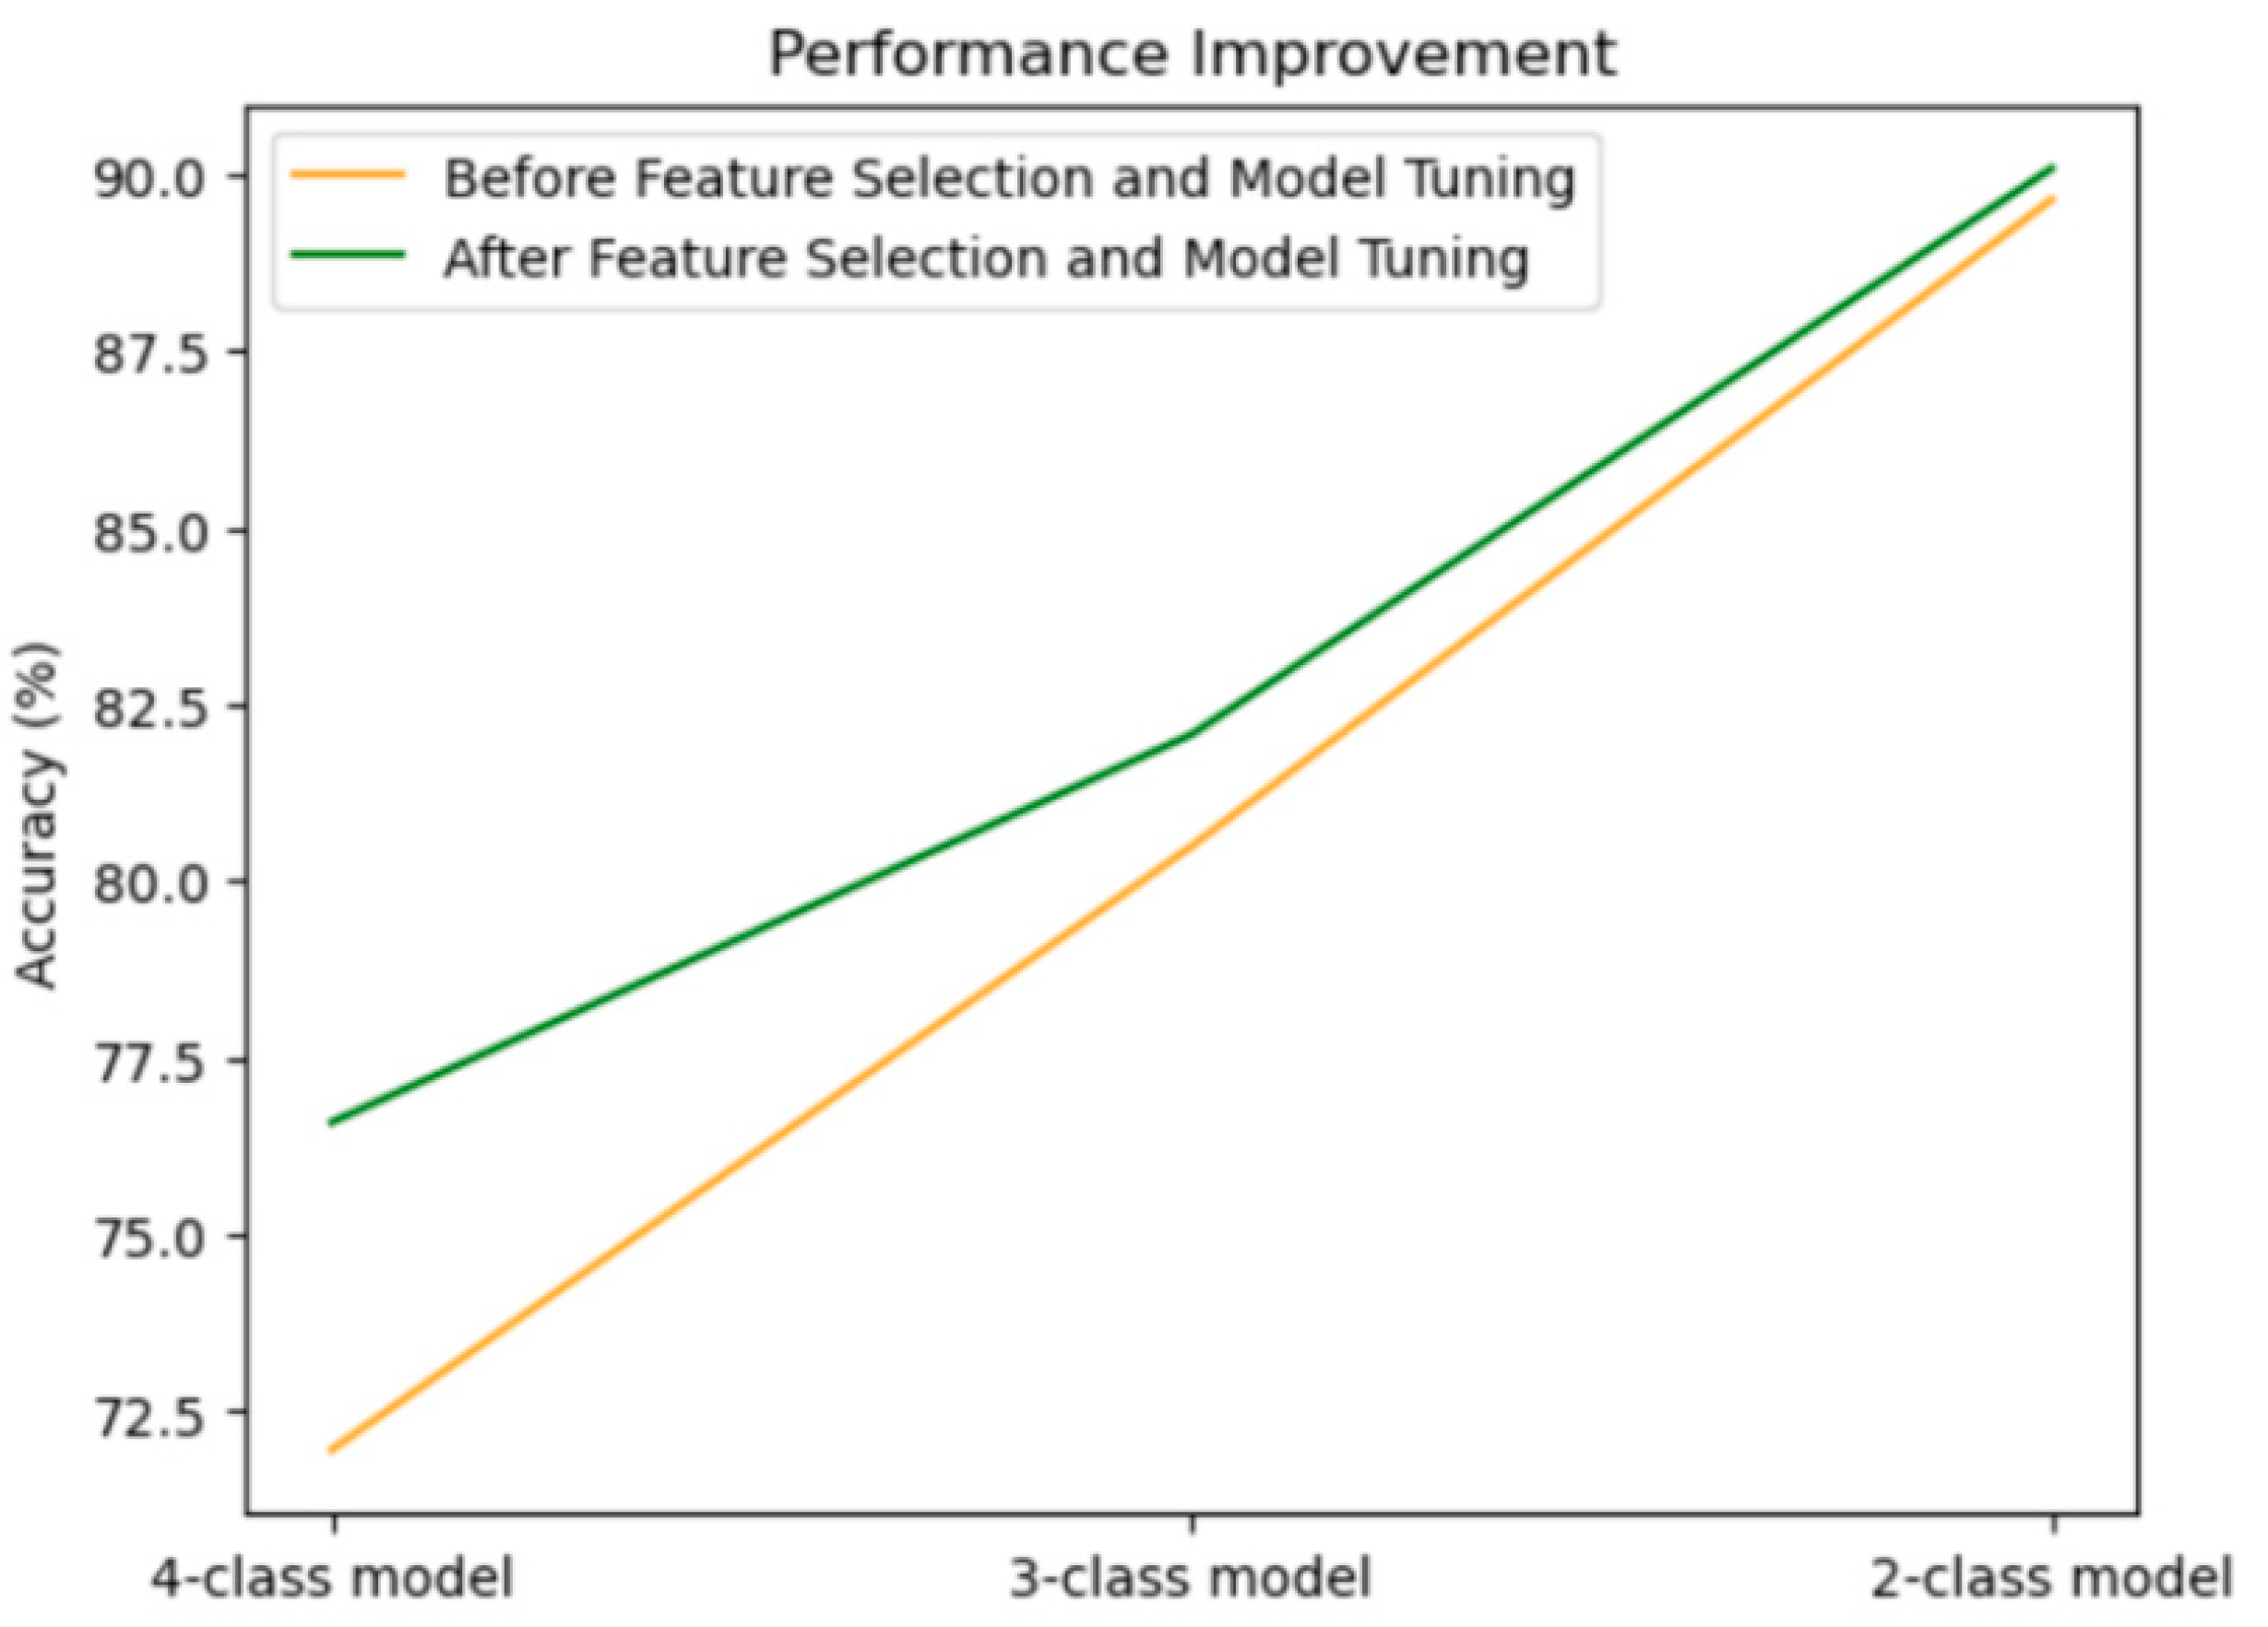
The classification performance exhibited a noticeable shift after implementing dimension reduction and adjusting hyper-parameters, as depicted in Figure 7. It was noted that the accuracy performance experienced a more significant change when a larger number of variables was eliminated, particularly in the four-class model. Through five-fold cross validation, the average accuracy performance of the LightGBM algorithm achieved a commendable 76.59% in the 34-variable model. At fold 4, the LightGBM achieved a maximum accuracy of 81.11%. Figure 8 depicts the confusion matrix of the maximum accuracy performance score, serving as a sample illustration.
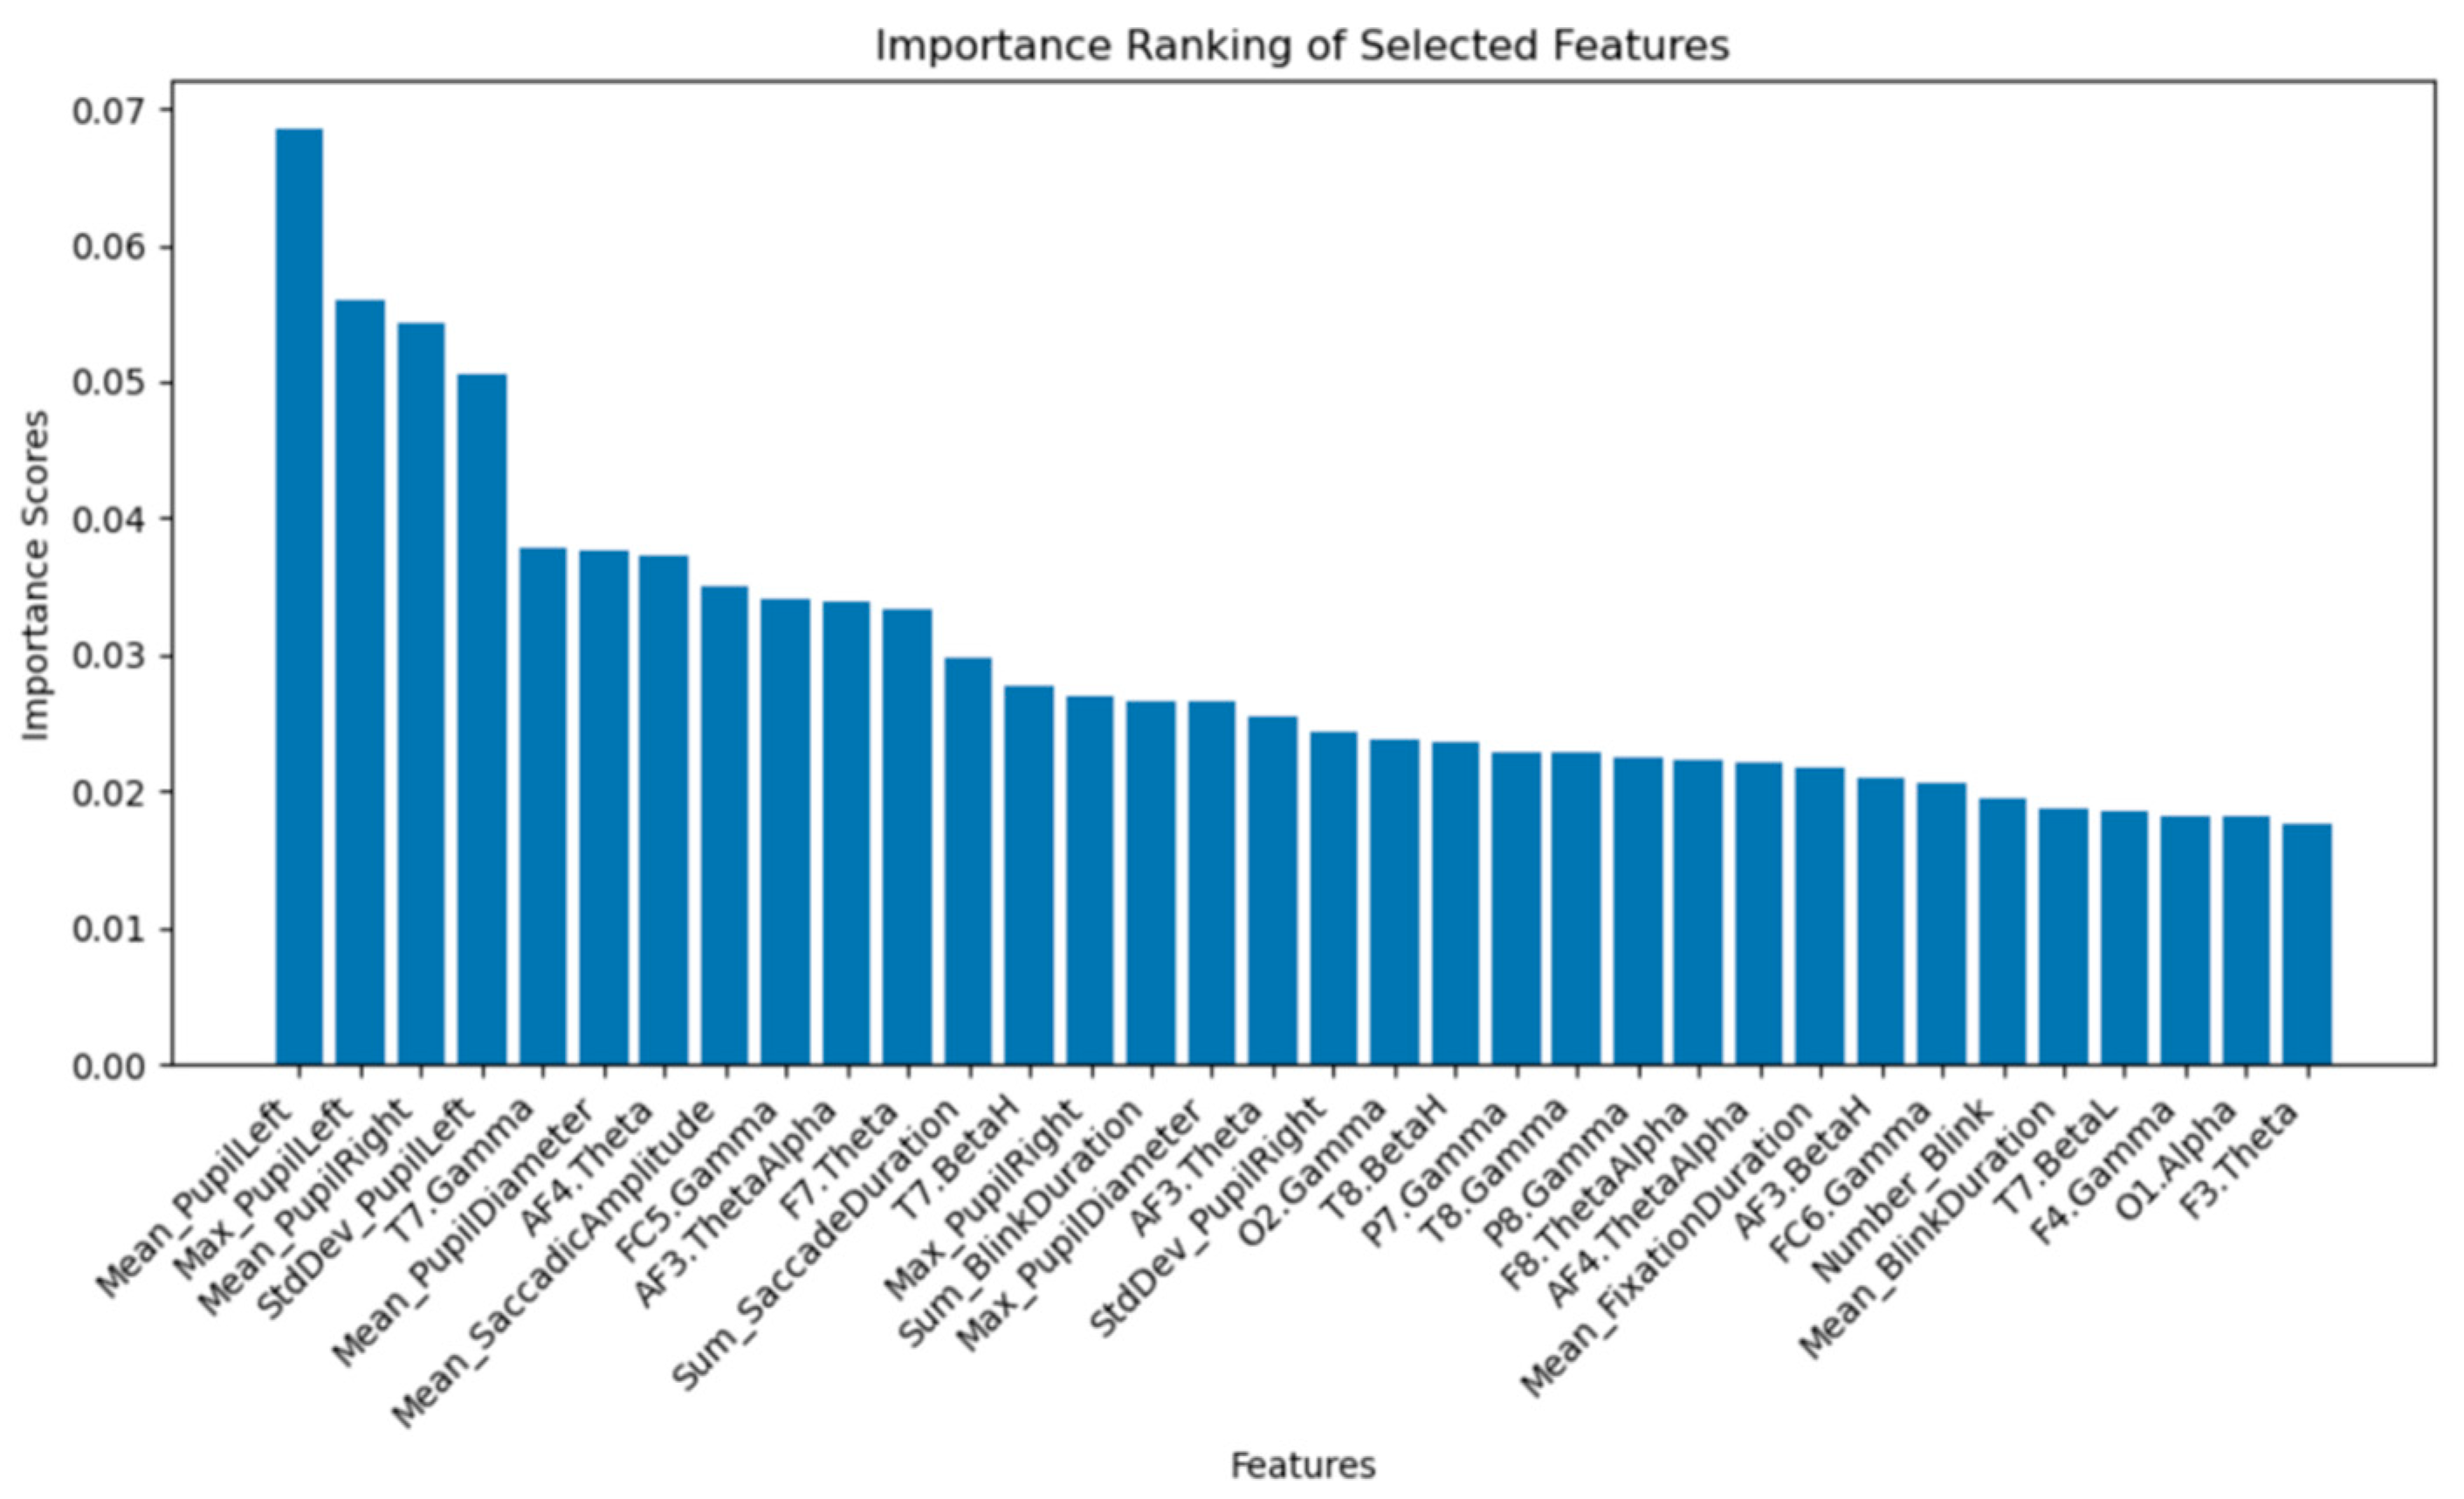
The LightGBM algorithm demonstrated superior prediction accuracy compared to other machine learning methods in the preceding section. The impact of the input parameters on the determination of the output parameter was assessed through a sensitivity analysis utilizing the LightGBM technique. The LightGBM algorithm determined the importance ranking of the 34 features, as presented in Figure 9. The key variables that significantly contributed to the performance of the four-class model, as determined by the LightGBM algorithm, included right and left pupil diameter; variables associated with blink, saccade, and saccadic amplitude; prefrontal and frontal theta and theta/alpha; occipital alpha; and temporal, parietal, and occipital gamma power.
High accuracy rates were obtained in the analysis of mental workload classification using recently developed algorithms such as LightGBM, XGBoost, and GBM. These algorithms are not commonly used in studies on this subject in the literature. The study demonstrated the extent to which performance improvement can be achieved through dimension reduction and hyper-parameter tuning. Furthermore, it was observed that reducing the number of classes led to significantly better classification performance. As expected, the three-class and two-class models performed better. Feature selection, hyper-parameter tuning, and early stopping methods were applied only to the focal model, while the other algorithms were initially used for comparison purposes. In the four-class classification model, which utilized both EEG and eye variables as input, an accuracy performance of 76.59% was achieved after dimension reduction, hyper-parameter adjustment, and early stopping. The analysis revealed that the models made the most errors in classifying observations related to the 1-back task. Therefore, three-class models excluding the data class obtained during the 1-back task were studied. These models achieved an accuracy rate of approximately 80% after early stopping. The two-class classification model, which aimed to predict low and high mental workload, achieved an accuracy rate of approximately 90%.

4.4. Comparison with Previous Studies

The comparison summary of nineteen machine learning algorithm applications for mental workload assessment, as well as the current study, is outlined in Table 2. This includes details on author names, publication years, participant numbers, class numbers, measurement tools, methodologies, and accuracy rates. The performance results of the current study surpass those of several other studies [14,15,22,25,26], as shown in Table 2. Conversely, it has been observed that certain studies [12,18] have achieved better results than this study. Upon examining EEG studies with superior outcomes, it is evident that the device used in those studies had a higher number of channels, which differs from the current study. When eye tracking studies that yield better results are examined, higher participant numbers are noteworthy. Although the number of participants used in this study is sufficient for the reliability of the analyses, increasing the number of participants is deemed crucial for obtaining even more dependable data to be incorporated into the analysis.

5. Conclusions

By combining EEG and eye tracking methods within an experimental context, along with the NASA-TLX scale and performance-based approaches, this study presented an innovative research design. The data were collected during n-back tasks. Through the simultaneous recording of EEG and eye data, this study successfully developed mental workload prediction models with the help of machine learning algorithms. The main contributions of this study are: (i) two distinct physiological techniques were employed concurrently alongside the n-back memory task; (ii) unlike other studies that focused on two- or three-class problems, we approached the prediction of mental workload level as a four-class problem; (iii) we successfully implemented machine learning algorithms that were developed at a later stage, and these particular algorithms demonstrated the highest classification performance; (iv) we have made a valuable contribution to the existing literature by exploring the correlation between EEG and eye-related variables in relation to task difficulty level and subjective workload assessment; and (v) we presented an application example to the literature by conducting the EEGLAB STUDY, which processed raw EEG data and analyzed the change in band power in different parts of the brain, under different task conditions. In future studies, the scope of the model can be expanded to encompass the classification of more demanding tasks associated with mental workload. Furthermore, the models can be evaluated by testing them with a diverse group of participants or by using data collected under varying task conditions. Despite the fact that the number of participants used in this study is enough to ensure the reliability of the analyses, it is important to consider increasing the number of participants to obtain more reliable data for the analysis. To deal with a large dataset, deep learning algorithms can be used to identify highly complex patterns in large datasets. Using the concepts and techniques covered in this paper, a real-time state monitoring system that takes into account participant emotions, weariness, stress, and other factors in addition to mental workload may be developed.

Author Contributions

Conceptualization, Ş.H.A., E.Ç. and M.D.; methodology, Ş.H.A.; validation, Ş.H.A. and E.Ç.; formal analysis, Ş.H.A.; investigation, Ş.H.A.; resources, Ş.H.A.; data curation, Ş.H.A.; writing—original draft preparation, Ş.H.A.; writing—review and editing, E.Ç. and M.D.; visualization, Ş.H.A. and E.Ç.; supervision, E.Ç. and M.D. All authors have read and agreed to the published version of the manuscript.

Funding

This study was financially supported by Grant No. 6483 from the Scientific Research Projects Unit at Gazi University, Ankara, Türkiye.

Institutional Review Board Statement

The study was conducted in accordance with the Declaration of Helsinki and approved by the Institutional Ethics Committee of Gazi University (2020-483 and 8 September 2020) for studies involving humans.

Informed Consent Statement

Informed consent was obtained from all subjects involved in the study.

Data Availability Statement

The raw data supporting the conclusions of this article will be made available by the authors on request.

Acknowledgments

The Middle East Technical University Human–Computer Interaction Research and Application Laboratory generously provided the eye tracking device. Our sincere gratitude goes to these institutions and all the volunteers who actively participated in this research.

Conflicts of Interest

The authors declare no conflicts of interest.

References

  1. Parasuraman, R.; Hancock, P.A. Adaptive control of mental workload. In Stress, Workload, and Fatigue; Hancock, P.A., Desmond, P.A., Eds.; Lawrence Erlbau: Mahwah, NJ, USA, 2001; pp. 305–333. [Google Scholar]
  2. Sweller, J. Cognitive load during problem solving: Effects on learning. Cogn. Sci. 1988, 12, 257–285. [Google Scholar] [CrossRef]
  3. Bommer, S.C.; Fendley, M. A theoretical framework for evaluating mental workload resources in human systems design for manufacturing operations. Int. J. Ind. Ergon. 2018, 63, 7–17. [Google Scholar] [CrossRef]
  4. Rubio, S.; Diaz, E.; Martin, J.; Puente, J.M. Evaluation of Subjective Mental Workload: A Comparison of SWAT, NASA-TLX, and Workload Profile Methods. Appl. Psychol. 2004, 53, 61–86. [Google Scholar] [CrossRef]
  5. Ahlstrom, U.; Friedman-Berg, F.J. Using eye movement activity as a correlate of cognitive workload. Int. J. Ind. Ergon. 2006, 36, 623–636. [Google Scholar] [CrossRef]
  6. Benedetto, S.; Pedrotti, M.; Minin, L.; Baccino, T.; Re, A.; Montanari, R. Driver workload and eye blink duration. Transp. Res. Part F Traffic Psychol. Behav. 2011, 14, 199–208. [Google Scholar] [CrossRef]
  7. Gao, Q.; Wang, Y.; Song, F.; Li, Z.; Dong, X. Mental workload measurement for emergency operating procedures in digital nuclear power plants. Ergonomics 2013, 56, 1070–1085. [Google Scholar] [CrossRef] [PubMed]
  8. Reiner, M.; Gelfeld, T.M. Estimating mental workload through event-related fluctuations of pupil area during a task in a virtual world. Int. J. Psychophysiol. 2014, 93, 38–44. [Google Scholar] [CrossRef]
  9. Wanyan, X.; Zhuang, D.; Lin, Y.; Xiao, X.; Song, J.-W. Influence of mental workload on detecting information varieties revealed by mismatch negativity during flight simulation. Int. J. Ind. Ergon. 2018, 64, 1–7. [Google Scholar] [CrossRef]
  10. Radhakrishnan, V.; Louw, T.; Gonçalves, R.C.; Torrao, G.; Lenné, M.G.; Merat, N. Using pupillometry and gaze-based metrics for understanding drivers’ mental workload during automated driving. Transp. Res. Part F Traffic Psychol. Behav. 2023, 94, 254–267. [Google Scholar] [CrossRef]
  11. Hart, S.G.; Staveland, L.E. Development of NASA-TLX (Task Load Index): Results of empirical and theoretical research. Adv. Psychol. 1988, 52, 139–183. [Google Scholar]
  12. Grimes, D.; Tan, D.S.; Hudson, S.E.; Shenoy, P.; Rao, R.P. Feasibility and pragmatics of classifying working memory load with an electroencephalograph. In Proceedings of the CHI ′08: CHI Conference on Human Factors in Computing Systems, Florence, Italy, 5–10 April 2008; pp. 835–844. [Google Scholar]
  13. Liu, Y.; Ayaz, H.; Shewokis, P.A. Multisubject “Learning” for Mental Workload Classification Using Concurrent EEG, fNIRS, and Physiological Measures. Front. Hum. Neurosci. 2017, 11, 389. [Google Scholar] [CrossRef]
  14. Jusas, V.; Samuvel, S.G. Classification of Motor Imagery Using a Combination of User-Specific Band and Subject-Specific Band for Brain-Computer Interface. Appl. Sci. 2019, 9, 4990. [Google Scholar] [CrossRef]
  15. Yin, Z.; Zhang, J. Cross-session classification of mental workload levels using EEG and an adaptive deep learning model. Biomed. Signal Process. Control. 2017, 33, 30–47. [Google Scholar] [CrossRef]
  16. Pei, Z.; Wang, H.; Bezerianos, A.; Li, J. EEG-Based Multiclass Workload Identification Using Feature Fusion and Selection. IEEE Trans. Instrum. Meas. 2020, 70, 1–8. [Google Scholar] [CrossRef]
  17. Wang, Z.; Hope, R.M.; Wang, Z.; Ji, Q.; Gray, W.D. Cross-subject workload classification with a hierarchical Bayes model. NeuroImage 2012, 59, 64–69. [Google Scholar] [CrossRef]
  18. Kaczorowska, M.; Plechawska-Wójcik, M.; Tokovarov, M. Interpretable Machine Learning Models for Three-Way Classification of Cognitive Workload Levels for Eye-Tracking Features. Brain Sci. 2021, 11, 210. [Google Scholar] [CrossRef] [PubMed]
  19. Sassaroli, A.; Zheng, F.; Hirshfield, L.M.; Girouard, A.; Solovey, E.T.; Jacob, R.J.K.; Fantini, S. Discrimination of Mental Workload Levels in Human Subjects with Functional Near-Infrared Spectroscopy. J. Innov. Opt. Health Sci. 2008, 1, 227–237. [Google Scholar] [CrossRef]
  20. Wu, Y.; Liu, Z.; Jia, M.; Tran, C.C.; Yan, S. Using Artificial Neural Networks for Predicting Mental Workload in Nuclear Power Plants Based on Eye Tracking. Nucl. Technol. 2019, 206, 94–106. [Google Scholar] [CrossRef]
  21. Subasi, A. Automatic recognition of alertness level from EEG by using neural network and wavelet coefficients. Expert Syst. Appl. 2005, 28, 701–711. [Google Scholar] [CrossRef]
  22. Li, Q.; Ng, K.K.; Yu, S.C.; Yiu, C.Y.; Lyu, M. Recognising situation awareness associated with different workloads using EEG and eye-tracking features in air traffic control tasks. Knowl. Based Syst. 2023, 260, 110179. [Google Scholar] [CrossRef]
  23. Borys, M.; Plechawska-Wójcik, M.; Wawrzyk, M.; Wesołowska. Classifying cognitive workload using eye activity and EEG features in arithmetic tasks. In Proceedings of the Information and Software Technologies: 23rd International Conference, ICIST 2017, Druskininkai, Lithuania, 12–14 October 2017; Springer International Publishing: Cham, Switzerland, 2018; pp. 90–105. [Google Scholar]
  24. Kaczorowska, M.; Wawrzyk, M.; Plechawska-Wójcik, M. Binary Classification of Cognitive Workload Levels with Oculog-raphy Features. In Proceedings of the Computer Information Systems and Industrial Management: 19th International Conference, CISIM 2020, Bialystok, Poland, 16–18 October 2020; Proceedings 19. Springer International Publishing: Cham, Switzerland, 2020; pp. 243–254. [Google Scholar]
  25. Qu, H.; Shan, Y.; Liu, Y.; Pang, L.; Fan, Z.; Zhang, J.; Wanyan, X. Mental workload classification method based on EEG independent component features. Appl. Sci. 2020, 10, 3036. [Google Scholar] [CrossRef]
  26. Lim, W.; Sourina, O.; Wang, L. STEW: Simultaneous task EEG workload dataset. IEEE Trans. Neural Syst. Rehabil. Eng. 2018, 26, 2106–2114. [Google Scholar] [CrossRef]
  27. Karacan, S.; Saraoğlu, H.M.; Kabay, S.C.; Akdağ, G.; Keskinkılıç, C.; Tosun, M. EEG-based mental workload estimation of multiple sclerosis patients. Signal Image Video Process. 2023, 17, 3293–3301. [Google Scholar] [CrossRef]
  28. Zhou, Y.; Xu, Z.; Niu, Y.; Wang, P.; Wen, X.; Wu, X.; Zhang, D. Cross-Task Cognitive Workload Recognition Based on EEG and Domain Adaptation. IEEE Trans. Neural Syst. Rehabil. Eng. 2022, 30, 50–60. [Google Scholar] [CrossRef] [PubMed]
  29. Plechawska-Wójcik, M.; Tokovarov, M.; Kaczorowska, M.; Zapała, D. A Three-Class Classification of Cognitive Workload Based on EEG Spectral Data. Appl. Sci. 2019, 9, 5340. [Google Scholar] [CrossRef]
  30. Le, A.S.; Aoki, H.; Murase, F.; Ishida, K. A Novel Method for Classifying Driver Mental Workload Under Naturalistic Conditions with Information from Near-Infrared Spectroscopy. Front. Hum. Neurosci. 2018, 12, 431. [Google Scholar] [CrossRef]
  31. Herff, C.; Heger, D.; Fortmann, O.; Hennrich, J.; Putze, F.; Schultz, T. Mental workload during n-back task—Quantified in the prefrontal cortex using fNIRS. Front. Hum. Neurosci. 2014, 7, 935. [Google Scholar] [CrossRef] [PubMed]
  32. Ke, Y.; Qi, H.; Zhang, L.; Chen, S.; Jiao, X.; Zhou, P.; Zhao, X.; Wan, B.; Ming, D. Towards an effective cross-task mental workload recognition model using electroencephalography based on feature selection and support vector machine regression. Int. J. Psychophysiol. 2015, 98, 157–166. [Google Scholar] [CrossRef] [PubMed]
  33. Tjolleng, A.; Jung, K.; Hong, W.; Lee, W.; Lee, B.; You, H.; Son, H.; Park, S. Classification of a Driver’s cognitive workload levels using artificial neural network on ECG signals. Appl. Ergon. 2017, 59, 326–332. [Google Scholar] [CrossRef]
  34. Harputlu Aksu, Ş.; Çakıt, E. A machine learning approach to classify mental workload based on eye tracking data. J. Fac. Eng. Archit. Gazi Univ. 2023, 38, 1027–1040. [Google Scholar]
  35. Aksu, Ş.H.; Çakıt, E.; Dağdeviren, M. Investigating the Relationship Between EEG Features and N-Back Task Difficulty Levels with NASA-TLX Scores Among Undergraduate Students. In Proceedings of the Intelligent Human Systems Integration (IHSI 2023): Integrating People and Intelligent Systems, 69, New York, NY, USA, 22–24 February 2023; pp. 115–123. [Google Scholar]
  36. Aksu, Ş.H.; Çakıt, E. Classifying mental workload using EEG data: A machine learning approach. In Proceedings of the International Conference on Applied Human Factors and Ergonomics (AHFE), New York, NY, USA, 24–28 July 2022; pp. 65–72. [Google Scholar]
  37. Oztürk, A. Transfer and Maintenance Effects of N-Back Working Memory Training in Interpreting Students: A Behavioural and Optical Brain Imaging Study. Ph.D. Thesis, Middle East Technical University, Informatics Institute, Ankara, Turkey, 2018. [Google Scholar]
  38. Monod, H.; Kapitaniak, B. Ergonomie; Masson Publishing: Paris, France, 1999. [Google Scholar]
  39. Galy, E.; Cariou, M.; Mélan, C. What is the relationship between mental workload factors and cognitive load types? Int. J. Psychophysiol. 2012, 83, 269–275. [Google Scholar] [CrossRef]
  40. Guan, K.; Chai, X.; Zhang, Z.; Li, Q.; Niu, H. Evaluation of mental workload in working memory tasks with different information types based on EEG. In Proceedings of the 2021 43rd Annual International Conference of the IEEE Engineering in Medicine & Biology Society (EMBC), Virtual, 1–5 November 2021; pp. 5682–5685. [Google Scholar]
  41. Delorme, A.; Makeig, S. EEGLAB: An Open Source Toolbox for Analysis of Single-Trial EEG Dynamics Including Independent Component Analysis. J. Neurosci. Methods 2004, 134, 9–21. [Google Scholar] [CrossRef] [PubMed]
  42. Borys, M.; Tokovarov, M.; Wawrzyk, M.; Wesołowska, K.; Plechawska-Wójcik, M.; Dmytruk, R.; Kaczorowska, M. An analysis of eye-tracking and electroencephalography data for cognitive load measurement during arithmetic tasks. In Proceedings of the 2017 10th International Symposium on Advanced Topics in Electrical Engineering (ATEE), Bucharest, Romania, 23–25 March 2017; pp. 287–292. [Google Scholar]
  43. Sareen, E.; Singh, L.; Varkey, B.; Achary, K.; Gupta, A. EEG dataset of individuals with intellectual and developmental disorder and healthy controls under rest and music stimuli. Data Brief 2020, 30, 105488. [Google Scholar] [CrossRef]
  44. Rashid, A.; Qureshi, I.M. Eliminating Electroencephalogram Artefacts Using Independent Component Analysis. Int. J. Appl. Math. Electron. Comput. 2015, 3, 48–52. [Google Scholar] [CrossRef]
  45. Yan, S.; Wei, Y.; Tran, C.C. Evaluation and prediction mental workload in user interface of maritime operations using eye response. Int. J. Ind. Ergon. 2019, 71, 117–127. [Google Scholar] [CrossRef]
  46. Naveed, S.; Sikander, B.; Khiyal, M. Eye Tracking System with Blink Detection. J. Comput. 2012, 4, 50–60. [Google Scholar]
  47. Johns, M. The amplitude velocity ratio of blinks: A new method for monitoring drowsiness. Sleep 2003, 26, A51–A52. [Google Scholar]
  48. Raikwal, J.S.; Saxena, K. Performance Evaluation of SVM and K-Nearest Neighbor Algorithm over Medical Data set. Int. J. Comput. Appl. 2012, 50, 35–39. [Google Scholar] [CrossRef]
  49. Breiman, L. Random forests. Mach. Learn. 2001, 45, 5–32. [Google Scholar] [CrossRef]
  50. Genuer, R.; Poggi, J.-M.; Tuleau-Malot, C. Variable selection using random forests. Pattern Recognit. Lett. 2010, 31, 2225–2236. [Google Scholar] [CrossRef]
  51. Cun, W.; Mo, R.; Chu, J.; Yu, S.; Zhang, H.; Fan, H.; Chen, Y.; Wang, M.; Wang, H.; Chen, C. Sitting posture detection and recognition of aircraft passengers using machine learning. Artif. Intell. Eng. Des. Anal. Manuf. 2021, 35, 284–294. [Google Scholar] [CrossRef]
  52. Rucco, M.; Giannini, F.; Lupinetti, K.; Monti, M. A methodology for part classification with supervised machine learning. Artif. Intell. Eng. Des. Anal. Manuf. 2018, 33, 100–113. [Google Scholar] [CrossRef]
  53. Çakıt, E.; Dağdeviren, M. Comparative analysis of machine learning algorithms for predicting standard time in a manufacturing environment. AI EDAM 2023, 37, e2. [Google Scholar] [CrossRef]
  54. Çakıt, E.; Durgun, B.; Cetik, O. A Neural Network Approach for Assessing the Relationship between Grip Strength and Hand Anthropometry. Neural Netw. World 2015, 25, 603–622. [Google Scholar] [CrossRef]
  55. Çakıt, E.; Karwowski, W. Soft computing applications in the field of human factors and ergonomics: A review of the past decade of research. Appl. Ergon. 2024, 114, 104132. [Google Scholar] [CrossRef] [PubMed]
  56. Noori, B. Classification of Customer Reviews Using Machine Learning Algorithms. Appl. Artif. Intell. 2021, 35, 567–588. [Google Scholar] [CrossRef]
  57. Çakıt, E.; Karwowski, W.; Bozkurt, H.; Ahram, T.; Thompson, W.; Mikusinski, P.; Lee, G. Investigating the relationship between adverse events and infrastructure development in an active war theater using soft computing techniques. Appl. Soft Comput. 2014, 25, 204–214. [Google Scholar] [CrossRef]
  58. Haykin, S. Neural Networks: A Comprehensive Foundation, 2nd ed.; Prentice Hall Inc.: Upper Saddle River, NJ, USA, 1999. [Google Scholar]
  59. Sheela, K.G.; Deepa, S.N. Performance analysis of modeling framework for prediction in wind farms employing artificial neural networks. Soft Comput. 2013, 18, 607–615. [Google Scholar] [CrossRef]
  60. Zurada, J. Introduction to Artificial Neural Systems; West Publishing Company: St. Paul, MN, USA, 1992; Volume 8. [Google Scholar]
  61. Fausett, L. Fundamentals of Neural Networks; Pearson: London, UK, 1994. [Google Scholar]
  62. Cervantes, J.; Garcia-Lamont, F.; Rodríguez-Mazahua, L.; Lopez, A. A comprehensive survey on support vector machine classification: Applications, challenges and trends. Neurocomputing 2020, 408, 189–215. [Google Scholar] [CrossRef]
  63. Brereton, R.G.; Lloyd, G.R. Support Vector Machines for classification and regression. Analyst 2009, 135, 230–267. [Google Scholar] [CrossRef]
  64. Friedman, J.H. Greedy function approximation: A gradient boosting machine. Ann. Stat. 2001, 29, 1189–1232. [Google Scholar] [CrossRef]
  65. Kuhn, M.; Johnson, K. Applied Predictive Modeling; Springer: New York, NY, USA, 2013; Volume 26, p. 13. [Google Scholar]
  66. Chen, T.; Guestrin, C. Xgboost: A scalable tree boosting system. In Proceedings of the 22nd Acm Sigkdd International Conference on Knowledge Discovery and Data Mining, San Francisco, CA, USA, 13–17 August 2016; pp. 785–794. [Google Scholar]
  67. Çakıt, E.; Dağdeviren, M. Predicting the percentage of student placement: A comparative study of machine learning algorithms. Educ. Inf. Technol. 2022, 27, 997–1022. [Google Scholar] [CrossRef]
  68. Ke, G.; Meng, Q.; Finley, T.; Wang, T.; Chen, W.; Ma, W.; Ye, Q.; Liu, T.Y. LightGBM: A highly efficient gradient boosting decision tree. Adv. Neural Inf. Process. Syst. 2017, 30, 3146–3154. [Google Scholar]
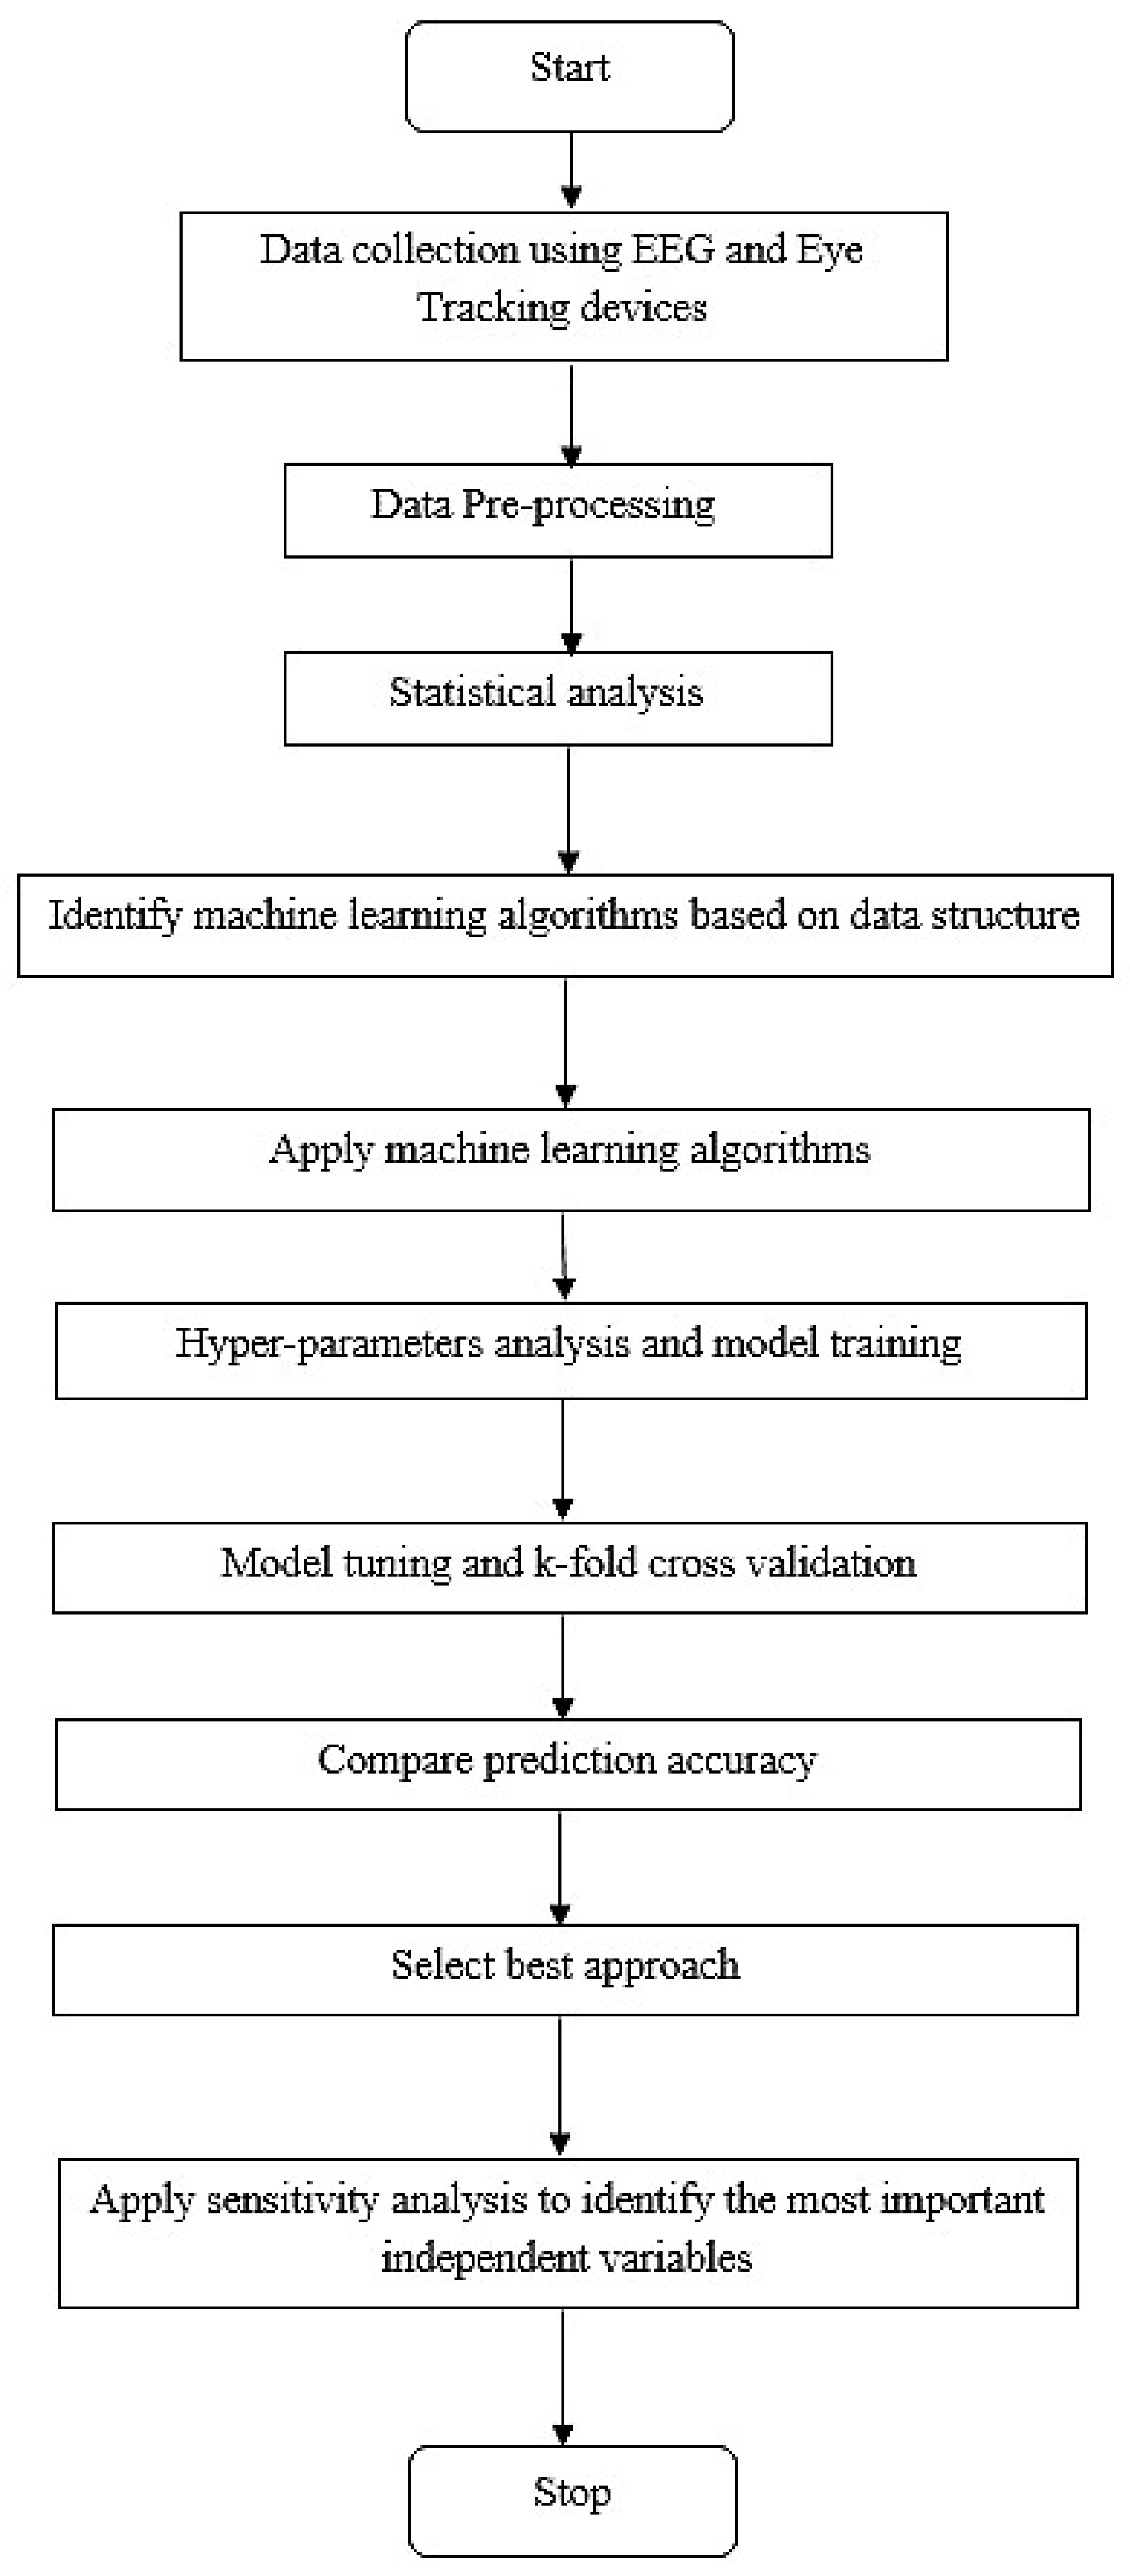
Figure 1. Machine learning flow diagram used in this study.
Applsci 14 02282 g001
Figure 2. An image captured during the experiment.
Applsci 14 02282 g002
Figure 3. N-back task levels: (a) 0-back, (b) 1-back, (c) 2-back, (d) 3-back.
Applsci 14 02282 g003
Figure 4. EEG signal comparison: (a) before pre-processing; (b) after pre-processing.
Applsci 14 02282 g004aApplsci 14 02282 g004b
Figure 5. Change in eye tracking variables according to difficulty level.
Applsci 14 02282 g005
Figure 6. Significant frequencies in band power depending on task difficulty.
Applsci 14 02282 g006
Figure 7. Performance change after dimension reduction and hyper-parameter tuning.
Applsci 14 02282 g007
Figure 8. Light GBM confusion matrix (the maximum accuracy performance).
Applsci 14 02282 g008
Figure 9. Importance ranking of the 34 features selected by the LightGBM algorithm.
Applsci 14 02282 g009
Table 1. Performance results of four-class models.
ModelAccuracy (%)KappaMatthews Correlation Coefficient (MCC)AUC
KNN54.850.400.400.80
SVM62.150.490.500.85
ANN59.000.450.450.82
RF61.440.490.490.85
GBM61.930.490.490.85
XGBoost70.220.600.600.91
LightGBM71.960.630.630.92
Table 2. Performance comparison with previous studies.
Authors, YearNumber of ParticipantsNumber of ClassesMeasurement
Tool
MethodAccuracy
Subasi [21] 303EEGANN87–98%
Grimes et al. [12] 82–4EEGNB88–99%
Sassaroli et al. [19] 33fNIRSKNN (k = 3)44–72%
Wang et al. [17] 83EEGANN, NB30–84%
Borys et al. [23] 132–3EEG + Eye trackingDT, LDA, LR, SVM, KNN73–90%
Liu et al. [13]213EEG + fNIRSLDA, NB65%
Yin and Zhang [15]72EEGDL85.7%
Le et al. [30]53fNIRSDT, LDA, LR, SVM, KNN81.3–95.4%
Lim et al. [26]483EEGSVM69%
Jusas and Samuvel [14]94EEGLDA64%
Plechawska-Wojcik et al. [29]113EEGSVM, DT, KNN, RF70.4–91.5%
Wu et al. [20]392Eye trackingANN97%
Kaczorowska et al. [24]262Eye trackingSVM, KNN, RF97%
Qu et al. [25]103EEGSVM79.8%
Kaczorowska et al. [18]293Eye trackingLR, RF97%
Pei et al. [16]73EEGRF75.9–84.3%
Zhou et al. [28]457EEGKNN, SVM, LDA, ANN56%
Li et al. [22]282–3EEG +Eye tracking SVM, RF, ANN54.2–82.7%
Şaşmaz et al. [27] 453EEGSVM, RF, LDA, ANN83.4%
Current study152–3–4EEG + Eye trackingKNN, SVM, ANN, RF, GBM, XGBoost, LightGBM76–90%
EEG: electroencephalography; fNIRS: functional near-infrared spectroscopy; KNN: k-nearest neighbors; NB: naive bayes DT: decision trees; SVM: support vector machines; RF: random forest; ANN: artificial neural network; DL: deep learning; LDA: linear discriminant analysis; LR: logistic regression.
Disclaimer/Publisher’s Note: The statements, opinions and data contained in all publications are solely those of the individual author(s) and contributor(s) and not of MDPI and/or the editor(s). MDPI and/or the editor(s) disclaim responsibility for any injury to people or property resulting from any ideas, methods, instructions or products referred to in the content.