Article

A Semantically Aware Multi-View 3D Reconstruction Method for Urban Applications

1
Key Laboratory of Infrared System Detection and Imaging Technologies, Shanghai Institute of Technical Physics, Chinese Academy of Sciences, Shanghai 200083, China
2
University of Chinese Academy of Sciences, Beijing 100049, China
3
Shanghai Institute of Technical Physics, Chinese Academy of Sciences, Shanghai 200083, China
*
Author to whom correspondence should be addressed.
Appl. Sci. 2024, 14(5), 2218; https://doi.org/10.3390/app14052218
Submission received: 29 December 2023 / Revised: 24 February 2024 / Accepted: 4 March 2024 / Published: 6 March 2024

Abstract

:
The task of 3D reconstruction of urban targets holds pivotal importance for various applications, including autonomous driving, digital twin technology, and urban planning and development. The intricate nature of urban landscapes presents substantial challenges in attaining 3D reconstructions with high precision. In this paper, we propose a semantically aware multi-view 3D reconstruction method for urban applications which incorporates semantic information into the technical 3D reconstruction. Our research primarily focuses on two major components: sparse reconstruction and dense reconstruction. For the sparse reconstruction process, we present a semantic consistency-based error filtering approach for feature matching. To address the challenge of errors introduced by the presence of numerous dynamic objects in an urban scene, which affects the Structure-from-Motion (SfM) process, we propose a computation strategy based on dynamic–static separation to effectively eliminate mismatches. For the dense reconstruction process, we present a semantic-based Semi-Global Matching (sSGM) method. This method leverages semantic consistency to assess depth continuity, thereby enhancing the cost function during depth estimation. The improved sSGM method not only significantly enhances the accuracy of reconstructing the edges of the targets but also yields a dense point cloud containing semantic information. Through validation using architectural datasets, the proposed method was found to increase the reconstruction accuracy by 32.79% compared to the original SGM, and by 63.06% compared to the PatchMatch method. Therefore, the proposed reconstruction method holds significant potential in urban applications.

1. Introduction

With advancements in fields such as autonomous driving [1], digital twins [2,3], cultural heritage preservation [4], and humanities research and education [5], the importance of 3D reconstruction has become increasingly paramount. There are numerous methods for 3D reconstruction, including active reconstruction techniques like LiDAR, synthetic aperture radar (SAR), Time-of-Flight (TOF), and structured light cameras, as well as passive reconstruction methods based on vision cameras [6,7,8,9,10]. Compared to active reconstruction methods such as LiDAR and TOF, visual 3D reconstruction offers several advantages including ease of use, richness of information, and cost-effectiveness. Consequently, visual 3D reconstruction is a widely applied technique in various fields [11].
Traditional 3D reconstruction techniques yield various geometric models such as depth maps, point clouds, voxels, and meshes [12]. However, as the complexity of applications increases, purely geometric models are often insufficient to meet the advanced requirements of various domains. Consequently, the acquisition of corresponding 3D semantic models has become increasingly critical [13]. Such 3D semantic models are typically obtained either by mapping semantically segmented 2D images onto 3D point clouds or by directly performing semantic segmentation on 3D point clouds [14,15,16]. A 3D semantic model can label each point or surface in a scene with its corresponding object category, thereby providing information of a higher dimensionality [17].
Croce proposed a semi-automatic semantic reconstruction method based on deep learning for reconstructing ancient buildings [18]. Similarly, for cultural heritage preservation, Li and colleagues were the first to employ CityGML for semantic modeling of ancient buildings in the Forbidden City [19]. Huang introduced a semantic-based method for 3D change detection at construction sites, which correctly identifies changes with different characteristics, including both geometric and semantic alterations [20]. In certain scenarios, incorporating semantic information to enhance reconstruction accuracy is an important research direction. Wang proposed a semantic-and-primitive-guided method for 3D reconstruction of indoor scenes by reconstructing indoor scenes from an incomplete and noisy point cloud [21]. Christian and colleagues proposed a concept wherein semantic segmentation and dense 3D reconstruction mutually reinforce each other. This approach enables the inference of surfaces that are not directly observable [22]. Performing semantic reconstruction concurrently with 3D reconstruction could leverage prior knowledge (such as walls being smooth planes that are perpendicular to the ground) to enhance reconstruction accuracy [23]. The incorporation of semantic information can enhance the accuracy of mesh reconstruction in individual models [24].
Urban 3D reconstruction faces numerous challenges. Firstly, urban environments are not purely static; they contain a multitude of moving objects, such as cars, people, and animals [25]. Whether in SfM or SLAM (Simultaneous Localization and Mapping), these variable factors present in a scene can significantly impact the accuracy of a camera’s extrinsic parameter estimation [1,26]. Secondly, urban scenes are exceedingly complex, as they are characterized by various forms of obstruction from different objects [20]. Therefore, achieving high-quality urban 3D semantic reconstruction remains a challenging task.
To address these issues, we propose a semantically aware multi-view 3D reconstruction approach for urban scenes. Three-dimensional semantic reconstruction adds semantic information to traditional 3D reconstruction results, thus providing richer information for complex automated tasks. Our work includes the following key aspects: Firstly, we present a semantic consistency-based error filtering approach for feature matching. Secondly, during the sparse reconstruction process, we propose SfM with semantic-based static and dynamic separation. Semantic information is used to distinguish static and dynamic objects in a scene and to exclude semantically inconsistent feature matching and feature points of dynamic targets, thereby improving the camera’s external parameter calculation accuracy and sparse point cloud reconstruction accuracy. Thirdly, we propose an sSGM algorithm that performs semantic optimization on its cost aggregation function, thus enabling it to perceive the continuity of depth in a scene through semantic information, improving the reconstruction accuracy of object edges in the scene. Finally, we validate our method using architectural datasets and compare it with the original SGM and PatchMatch methods, and the validation proves that our proposed method has significant potential in 3D reconstruction.

2. Materials and Methods

In the field of 3D semantic reconstruction, the ultimate goal is to achieve target point clouds enriched with semantic information. There are primarily two methodologies to acquire such 3D semantic data: one method involves semantic segmentation of point clouds, and the other method entails mapping semantic segmentation from 2D images onto 3D point clouds. In this study, we adopted the latter approach. Our main workflow encompasses three key stages: the acquisition of semantics from 2D images, followed by sparse and then dense reconstruction based on these semantics. Incorporating semantic information during the reconstruction process not only enhances the precision of the reconstruction but also yields dense point clouds with high-level semantic information. Considering the unique aspects of urban targets, we developed a comprehensive 3D semantic reconstruction technique specifically designed for complex urban settings. The detailed process of this technique is illustrated in Figure 1.
The main idea of our proposal is to semantically optimize the two steps of multi-view 3D reconstruction, sparse reconstruction and dense reconstruction, as illustrated in Figure 1. In the sparse reconstruction process, we propose semantic consistency-based feature matching and dynamic object separation algorithms to achieve semantic-based SfM. In the dense reconstruction process, we propose the sSGM reconstruction method to implement semantic-based MVS. Combined together, the semantic SfM and the semantic MVS constitute our proposed semantic-based 3D reconstruction pipeline.
In our implementation, the SfM module utilizes the OpenMVG platform [27], while for semantic dense reconstruction, OpenMVS is employed [28].

2.1. Preparation of Complex Urban Semantic 3D Reconstruction Data

We selected a dataset collected at Tsinghua University, which includes scenes of several buildings at Tsinghua University (Tsinghua University’s Old Gate, Tsinghua Xuetang, and Tsinghua Life Sciences Building). This dataset not only contains multi-angle images but also includes the true values of the buildings, which were obtained using a LMS-Z420i laser scanner (Riegl, Horn, Austria) manufactured by Riegl in Horn, Austria. The accuracy of the laser scanner within 10 m was 2 mm, with a scanning angle interval of 0.0057 degrees. These images were captured under natural conditions; therefore, they include elements beyond the architecture itself. Particularly, the images of Tsinghua University’s Old Gate, which is located by the roadside, contain a large number of pedestrians, bicycles, and cars. Therefore, this dataset can serve as a typical case example of a complex urban environment. The dataset was sourced from the National Laboratory of Pattern Recognition at the Institute of Automation, Chinese Academy of Sciences [29].

2.2. Image Semantic Segmentation

We utilized the Cityscapes dataset as the training dataset for semantic training (Table 1). Cityscapes is an open-source dataset featuring street scenes from 50 different cities, with pixel-level and instance-level annotations. The dataset comprises 5000 finely annotated images and 20,000 coarsely annotated images [30]. It categorizes urban scenes into 8 groups and 30 categories. Owing to its detailed classification, accurate annotations, and ample data volume, this dataset was the preferred choice for our semantic training. The urban semantic recognition capabilities acquired through training with this dataset served as the foundation for our semantic 3D reconstruction of complex urban scenes.
The Cityscapes dataset comprises 30 categories, but the majority of training applications are aimed at providing perception capabilities for autonomous driving. Consequently, in most semantic segmentation competitions, the categories are reclassified into 19 types, with the categories marked with a “+” considered invalid. Among these 19 categories, greater emphasis is placed on factors affecting driving. For instance, cars are divided into as many as 8 different types, and roads are categorized into road and sidewalk. These detailed classifications are critical for autonomous driving and road perception but are overly specific for 3D reconstruction. The three categories “ground+·dynamic+·static+” in the “void” group of the original dataset include all other targets that cannot be specifically classified. In previous semantic segmentation competitions and most applications, these three categories were often not considered. However, in the 3D reconstruction process, these three categories are important parts that cannot be ignored. Therefore, we reclassified the semantic segmentation categories. The specific classifications are shown in Table 2.
Based on the classification criteria of the groups outlined in Table 1, we added static and dynamic categories which were renamed as dynamic-other and static-other. These categories were used to accommodate other objects in urban scenes that do not fit into the previously defined eight categories. Additionally, we included surfaces outside of roads into the flat category and made appropriate integrations to several other categories. These adjustments, made without violating the original classification principles, enabled us to easily determine whether objects within a category were moving or stationary, while also fulfilling the category number requirements for 3D semantic reconstruction.

2.3. Static and Dynamic Separation-Based SfM

The method of SfM typically involves extracting feature points from images, solving the external parameters between cameras through feature matching, and computing sparse point clouds. This method poses no problem for fixed scenes, but in urban 3D reconstruction, the presence of numerous continuously moving objects, such as cars, people, animals, and vegetation swaying in the wind, presents challenges. Feature points extracted from these dynamic objects possess unstable characteristics which can introduce errors when solving for the camera’s external parameters.
In earlier works, scholars utilized the frame difference and optical flow methods to obtain information on moving objects in order to optimize the effects of 3D reconstruction. However, the frame difference method is only applicable to cameras with fixed positions, and the optical flow method is limited to sequential images and thus presents certain limitations. With the development of deep learning, some scholars proposed the image masking method [31]. Although image masking can eliminate dynamic targets in a scene, it impacts the extraction of feature points. Therefore, we proposed an SfM based on the separation of dynamic and static elements. Initially, we used high-level semantic information to intelligently determine the attributes of image feature points to enhance the overall accuracy of SfM by filtering out unstable feature points. Then, before proceeding with the SfM calculations, we assessed the semantic consistency of the feature point matching results, thus further improving the precision of feature point matching.
We performed semantic segmentation on the reconstructed multi-view images using deep learning to obtain the corresponding semantic images as follows:
S e m I m g i = s e g m e n t a t i o n ( R G B i )
In this formula, i = 1,2 , , N , with N being the total number of images used for reconstruction. We calculated the SIFT feature points for each image and input the semantic attributes of the features during the calculation process:
s F e a t i , D e s c i = S I F T ( g r a y i )
The obtained feature information is as follows:
s F e a t i , = f i 1 , f i 2 , , f i k , , f i n ,   D e s c i = [ d i 1 , d i 2 , , d i k , , d i n ]
In the formula, f i k is the information of the k-th feature point of image i , and d i k is the 128-th dimensional descriptor of the k-th feature point of image i , where:
f i k = [ x ,   y , s c a l e , o r i e n t a t i o n , s e m a n t i c ]
The last item of f i k is the semantic attribute of the feature point.
Figure 2 shows the principles of semantic SfM. The first is feature matching based on semantic consistency. During the feature matching process, feature point pairs are evaluated to determine whether they belong to the same semantic category, thereby reducing mismatches. The second approach is to use semantic information to separate dynamic target feature points and reduce the impact of unstable feature points in the scene on calculations.

2.4. Semantic-Based SGM

The traditional SGM algorithm encompasses several steps: initialization, computation of matching costs, cost aggregation, disparity calculation, and disparity fuse, as shown in Figure 3. Among these, the computation of matching costs and cost aggregation are the core components of the SGM algorithm [32].

2.4.1. Computation of Matching Costs

Several methods exist for computing matching costs in SGM. The original study employed a matching-cost computation based on Mutual Information (MI) [32]. Mutual Information is a correlation measure that is insensitive to variations in image brightness and contrast. However, due to its complex nature and the need for iterative computation, it is inefficient. Therefore, in practical applications, a simpler method like the census transform is often used, followed by calculation of the Hamming distance (the number of corresponding bits that differ between two-bit strings).
This study utilized weighted zero-mean normalized cross correlation (WZNCC) as a consistency measure [33], which is derived from the ZNCC by applying a weighting calculation to each pixel. The formula for the ZNCC calculation is as follows:
Z N C C x , x = i ( I x + i I ¯ ( x ) ) ( I x + i I ¯ ( x ) ) i ( I x + i I ¯ ( x ) ) 2 i ( I x + i I ¯ ( x ) ) 2
The WZNCC with the inclusion of weighting factors is defined as follows:
W Z N C C x , x = i w ( x + i ) w ( x + i ) ( I x + i I ¯ ( x ) ) ( I x + i I ¯ ( x ) ) i w 2 ( x + i ) ( I x + i I ¯ ( x ) ) 2 i w 2 x + i ( I x + i I ¯ ( x ) ) 2
The weight w in this context is composed of three components: color, distance, and orientation.
w ( x + i ) = w c ( x + i ) × w s ( x + i ) × w r ( x + i )
Considering the weights in the left image, the three weight components include the color weight component, which is defined as follows:
w c ( x + i ) = e x p ( j R , G , B ( c j ( x + i ) c j ( x ) ) 2 max i j R , G , B ( c j ( x + i ) c j ( x ) ) 2 )
The distance component is defined as follows:
w s ( x + i ) = e x p ( s ( x + i ) S ( x ) t / 2 )
The orientation component is defined as follows:
w r ( x + i ) = e x p ( r ( ψ ( x + i ) , ψ ( x ) ) σ r )

2.4.2. Cost Aggregation

Cost aggregation employs a global stereo matching algorithm which involves finding the optimal disparity for each pixel such that the overall energy is minimized. The energy equation is as follows:
n e r g y X , P = i ˙ D a t a C o s t i , x i + j = n e i g h b o r i S m o o t h C o s t x i , x j
This is a two-dimensional optimization problem. To enhance optimization efficiency, SGM (Semi-Global Matching) is used to convert the problem into an approximation of two-dimensional optimality using one-dimensional path aggregation. This approach not only improves efficiency but also ensures effectiveness. The SGM energy equation is as follows:
E D = x b C x b , D x b + x N P 1 T D x b D x N = 1 + x N P 2 T D x b D x N > 1
In Formula (13), C x b , D x b represents the matching cost based on WZNCC, and the second and third terms are the smoothing terms. Since we expect the disparity of pixels to be continuous, if the disparity of the current pixel differs slightly from its neighboring pixels (equal to 1 pixel), we assign a smaller penalty P 1 . If it is greater than one pixel, a larger penalty P 2 is assigned. Through the implementation of these two penalty terms, we aim to ensure that the global disparity is as consecutive as possible. This approach is a common method in machine learning that is known as regularization constraints.
Depth in real-world scenes is not completely consecutive and there are numerous abrupt depth changes. As a result, there is a need for a certain level of tolerance toward situations where the disparity exceeds one pixel. Therefore, P 2 needs to be dynamically adjusted to account for discontinuity in disparity. Consequently, the formula for the optimized P 2 chosen in the openMVS is as follows:
P 2 = P 2 × ( 1 + α × e ( ( I x b I x N ) 2 / ( 2 × β 2 ) ) )
where I x b and I x N represent the brightness values of adjacent pixels. In this equation, the value of P 2 is 4, the value of α is 14, and the value of β is 38 [28,32]. The purpose of implementing this formula is to determine whether two pixels are discontinuous parts based on the difference in brightness values. If it is actually a foreground–background relationship, then we reduce the penalty intensity of P 2 for cases where the disparity exceeds one pixel. However, this method cannot completely determine whether the disparity is continuous. Therefore, we incorporate a semantic term and calculate the final value of P 2 using a weighted computation as follows:
P 2 = P 2 × [ 0.8 × γ × T S x b = S x N + 0.2 × ( 1 + α × e ( ( I x b I x N ) 2 / ( 2 × β 2 ) ) ) ]
In the above equation, the value of γ is 48, and the other parameters are the same as in Equation (10). The weights of the grayscale criterion and the semantic criterion are 0.8 and 0.2, which are summarized through the experiments. Our purpose is to set an accurate P 2 penalty term for the path pointed by the red arrow in Figure 4 through semantics, and then to obtain the accurate disparity of the pixel. Compared with using only the grayscale criterion to calculate the penalty term P 2 and judging the continuity of depth, using semantic weighted Formula (15) can calculate a more accurate disparity.
In the specific solution process, the idea of path cost aggregation in SGM is as follows: the matching cost under all disparities for a pixel is aggregated over all possible paths around the pixel in a one-dimensional manner to obtain the path cost value under each path. The calculation is as follows:
L r i x b , d = C x b , d + min L r x b r i , d , L r i x b r i , d 1 + P 1 , L r i x b r i , d + 1 + P 1 , L r i x b r i , i + P 2 m i n k ( L r x b r i , k )
Then, by summing up the path cost values from all paths, the aggregated matching cost value for that pixel is obtained. Thus, the final cost value (the sum of all paths) is calculated as follows:
S x b , d = r i L r i x b , d

3. Results and Discussion

We first reorganized the categories in the Cityscapes dataset and employed three sets of semantic segmentation networks for training. We selected the network set with the highest segmentation accuracy to validate accuracy based on the reconstructed dataset. Upon achieving sufficient accuracy for semantic reconstruction, we performed semantic optimization for both sparse and dense reconstruction.

3.1. Semantic Segmentation for Complex Urban Scenes

We opted to utilize the MMSegmentation platform to train our semantic segmentation models [34]. This platform has benchmarked models and datasets that it supports, significantly easing our model selection process. We analyzed the performance of all semantic segmentation networks supported by the platform using the Cityscapes dataset. We identified the top three semantic segmentation networks in terms of accuracy, including DeeplabV3+, Ocrnet, and Mask2Former. These networks were then trained using our new classification scheme, after which we compared the accuracy of the various networks.
In 2017, Chen conducted a study on atrous convolutions for image semantic segmentation (DeepLab V3) and employed atrous convolutions to expand the receptive field [35]. This approach facilitated target segmentation on various scales by concatenating atrous convolutions with different dilation rates. In 2018, Chen proposed an architecture for image semantic segmentation by incorporating atrous separable convolutions within an encoder–decoder structure (DeepLab V3+) [35]. This model aimed to integrate the best aspects of spatial pyramid pooling and the encoder–decoder framework, thereby creating a faster and more efficient overall model.
In the OCRNet (Object-Contextual Representations Network), a novel approach to constructing contextual information for semantic segmentation tasks is proposed which focuses on new object contextual information. By utilizing features corresponding to the object classes to describe pixels, this method transforms the pixel classification challenge into an object region classification problem, thereby explicitly enhancing object information [36]. The High-Resolution Net (HRNet) is a specialized Convolutional Neural Network designed to retain high-resolution inputs throughout the network, thus enhancing the accuracy of pixel-level segmentation. Its primary goal is to improve semantic segmentation in high-resolution images while effectively managing the balance among multiple classes. This design ensures detailed and precise segmentation, which is particularly important in complex scenarios with diverse object categories [37].
Mask2Former is composed of a backbone feature extractor, a pixel decoder, and a transformer decoder. The backbone feature extractor is typically a transformer model, such as Swin. The pixel decoder is a deconvolution network that gradually restores the feature map resolution to the original image size through deconvolution operations. Finally, the transformer decoder is used to manipulate image features to process object queries [38,39]. The equipment information used is shown in Table 3.
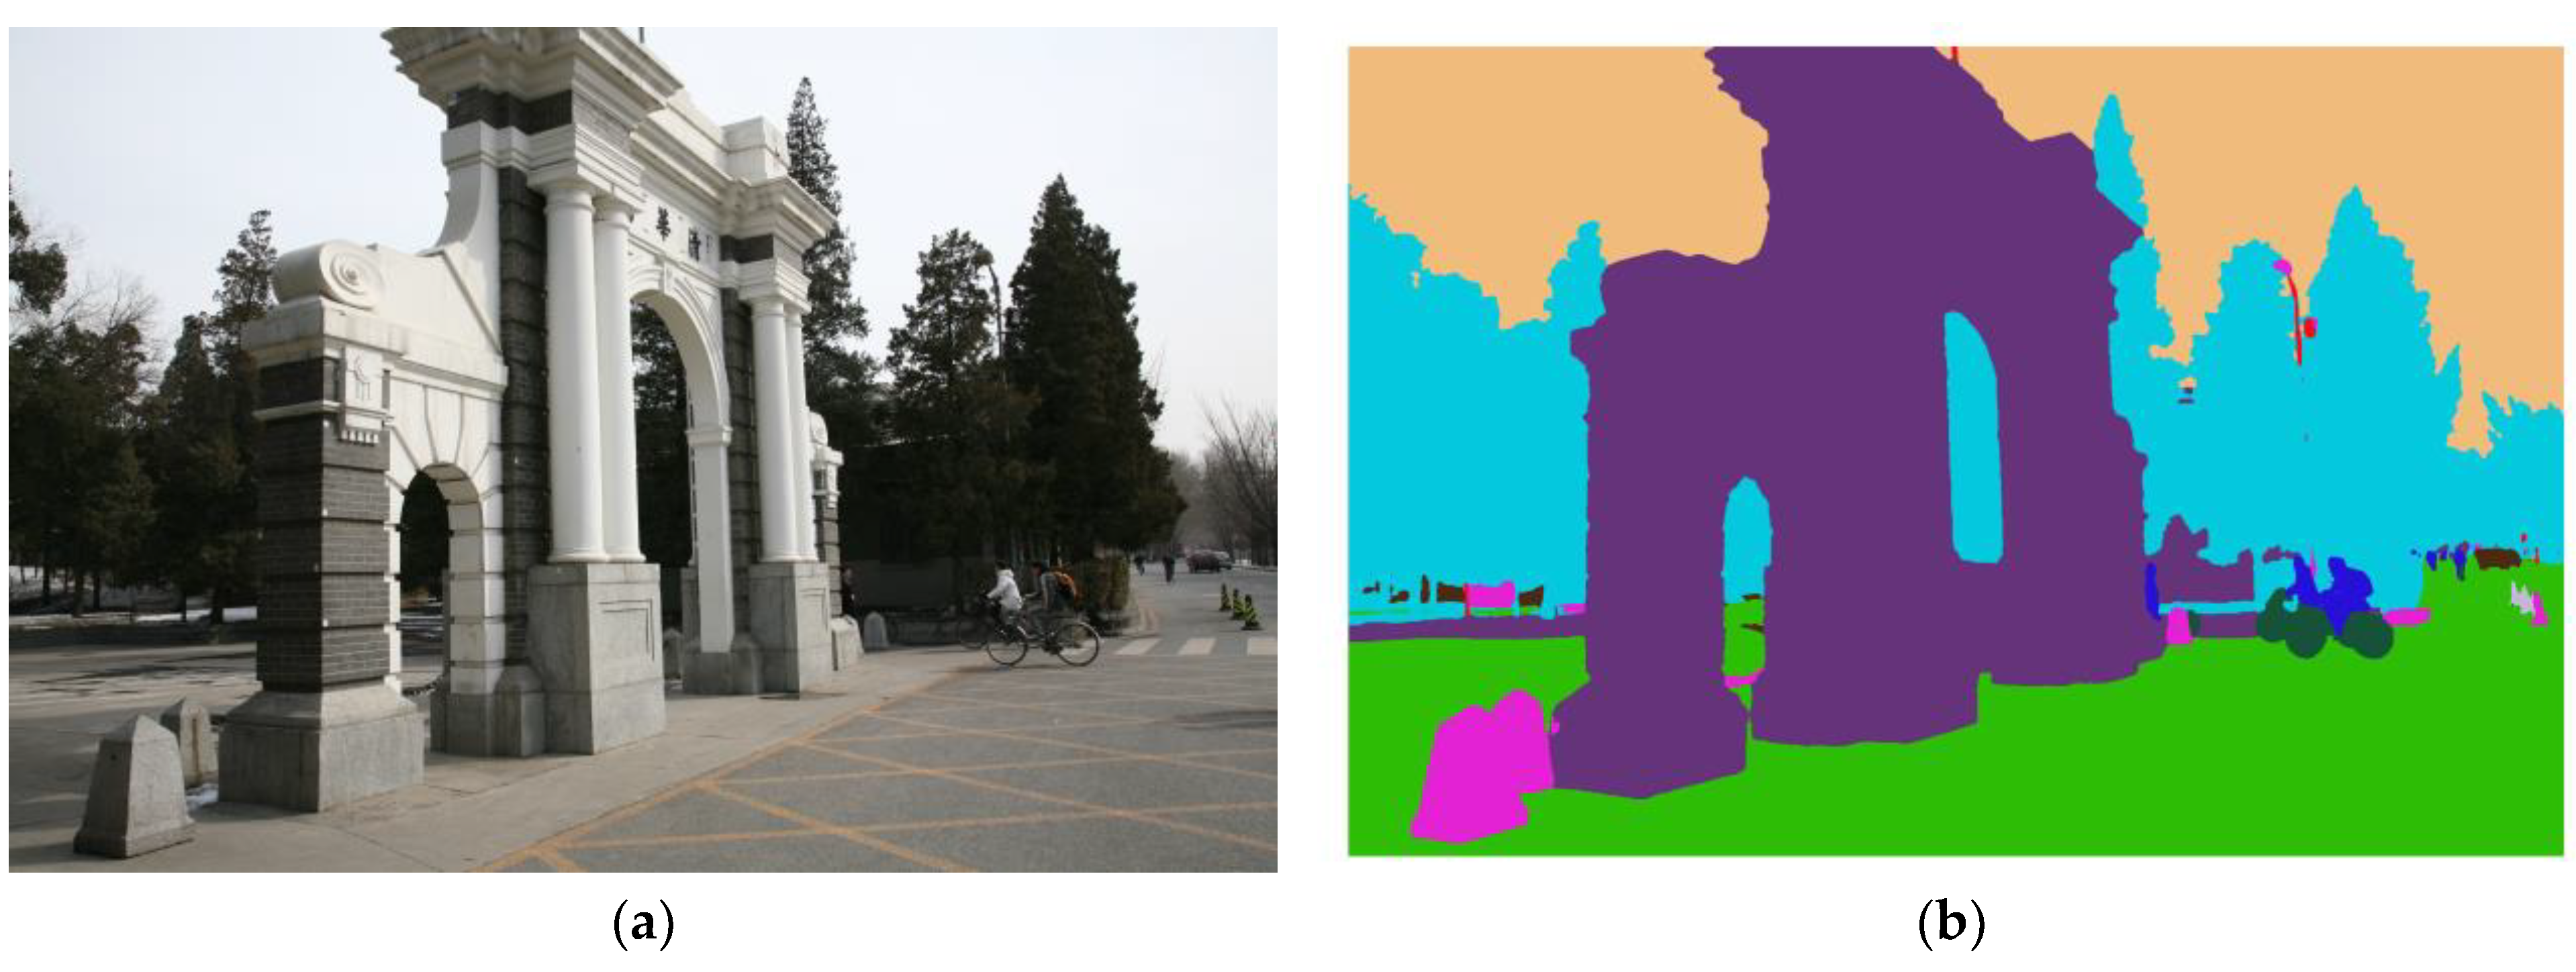
The specific configurations for several networks are described below. We set the network batch size of OCR_hr48 to four and that of the other two networks to two. The number of training iterations was set to 100 epochs. Considering that both our reconstructed data and the Cityscape dataset images are not square, the image input for our segmentation network was set to 512 × 1024. During the training process, an SGD optimizer was used. Taking Mask2Former as an example, the semantic segmentation results of 3D reconstructed data are shown Figure 5 below.
Pixel accuracy ( P A ) is a metric that quantifies the proportion of correctly classified pixels in an image segmentation output relative to the total number of pixels. The formula is as follows:
P A = i = 0 k p i i i = 0 k j = 0 k p i j
where k denotes the number of target classes, and p i j refers to the number of pixels of class i predicted as class j . Another critical metric in the field of semantic segmentation is intersection over union (IoU). The IoU metric is based on the calculation that involves taking the intersection and the union of the predicted segmentation results and the actual segmentation results, followed by computing the ratio of the intersection to the union:
I o U = p i i j = 0 k p i j + j = 0 k p j i p i i
A lower IoU value signifies a closer approximation of the predicted segmentation to the actual segmentation, thus indicating higher accuracy and effectiveness of the model.
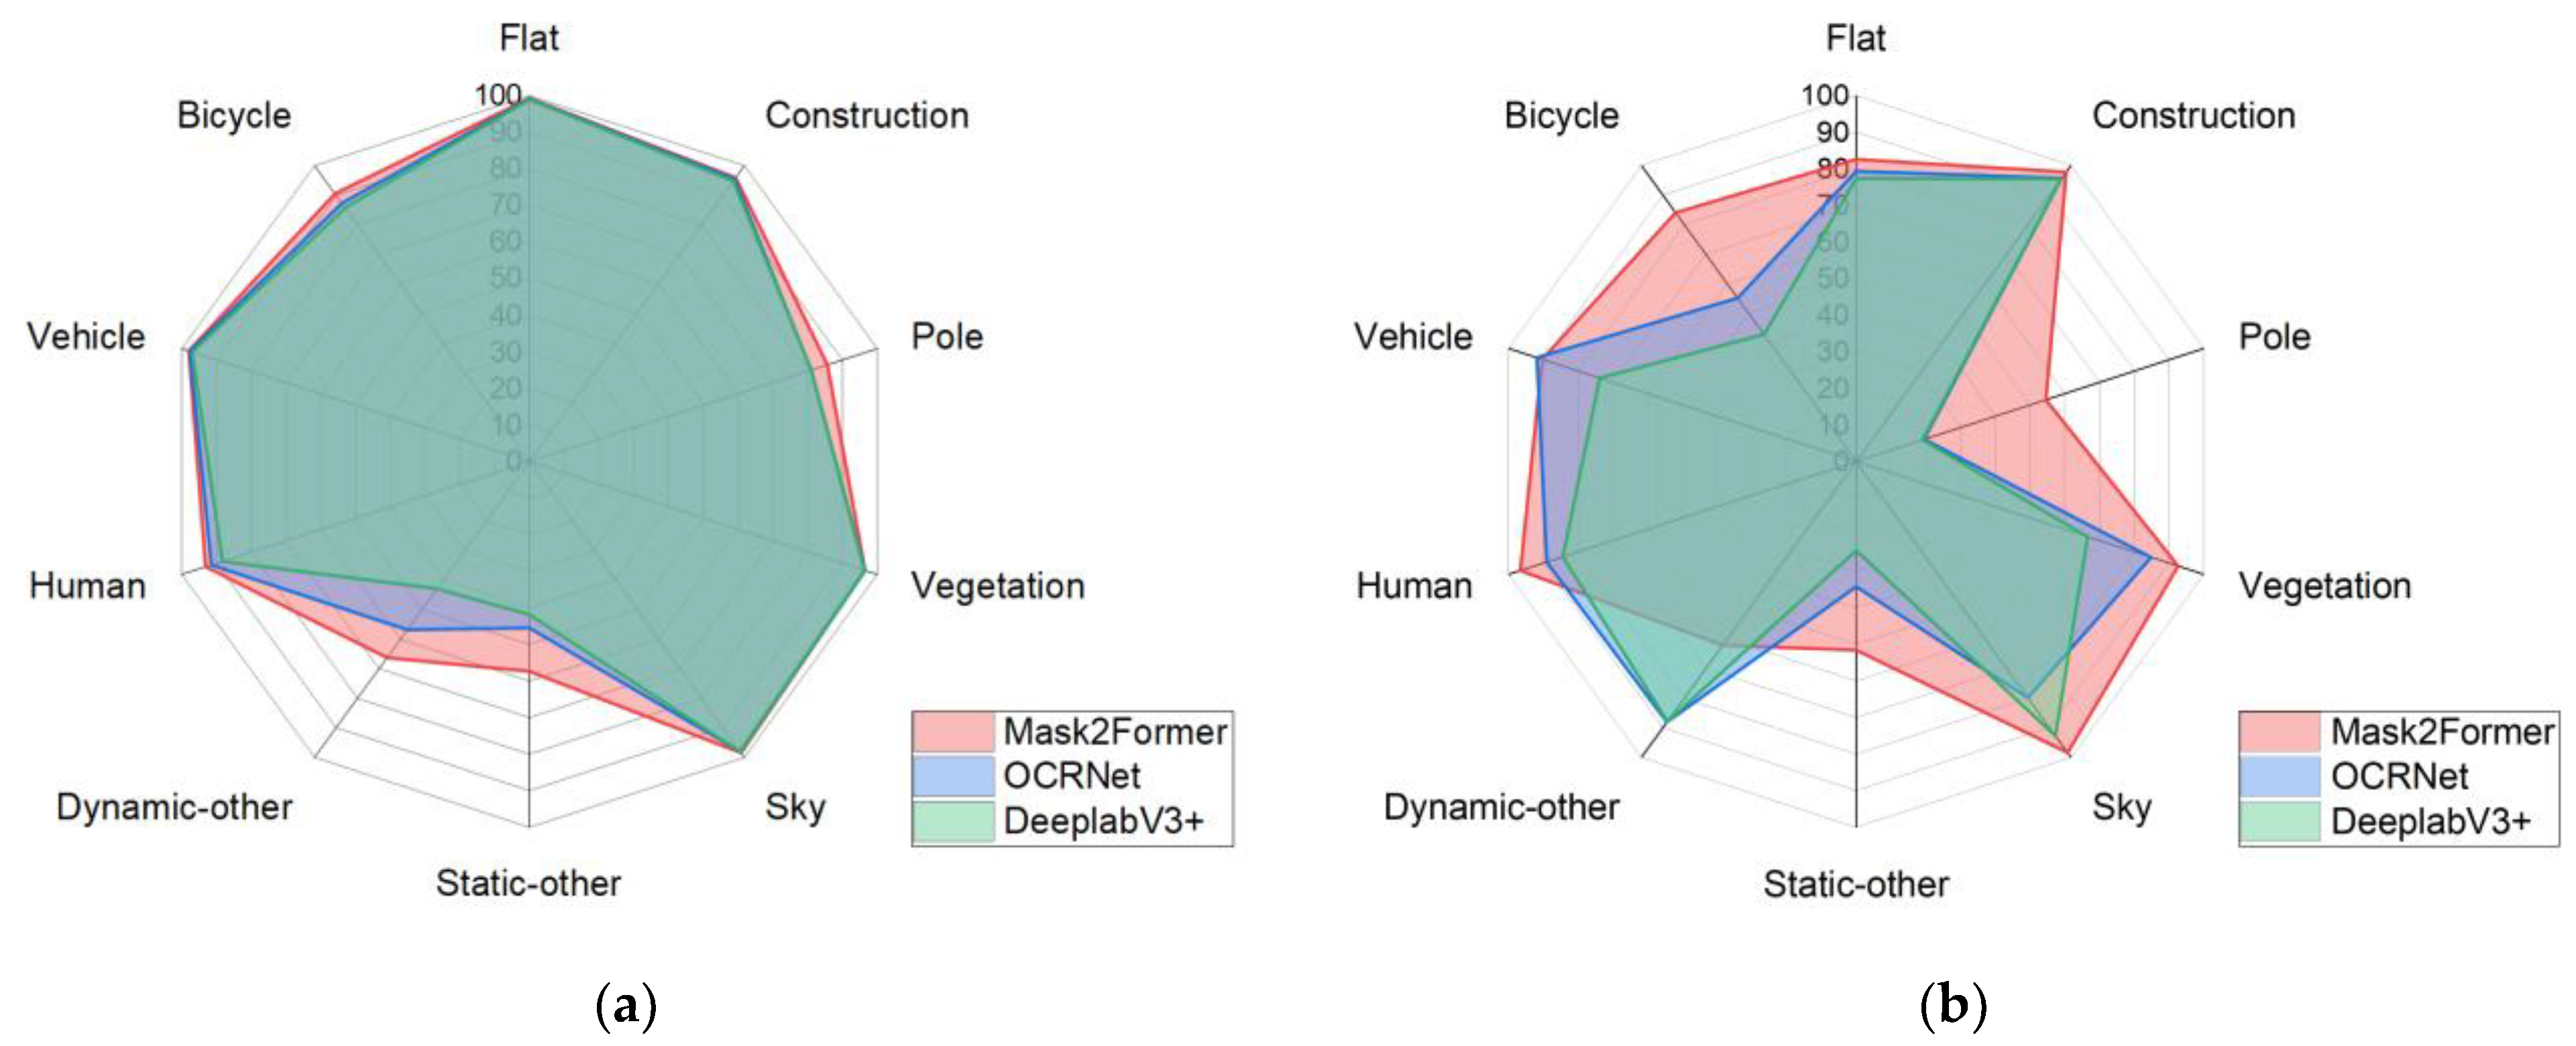
To validate the segmentation accuracy of the training results based on the Cityscape dataset and the reconstructed dataset, we annotated 10% of the reconstructed dataset and created a validation dataset for verification. We compared the semantic segmentation accuracy of the three best semantic segmentation networks using the reconstructed dataset. The results are shown in Figure 6.
Figure 6 shows the validation accuracy when the networks were trained internally on the Cityscape dataset and the validation accuracy when trained on the reconstructed dataset. Since the dynamic-other and static-other classes inherently occupy a small proportion of the scenes, and static targets do not significantly affect our reconstruction, the segmentation accuracy is overall acceptable. In this comparison, we examined the Mask2Former, OCRNet, and DeepLabV3+ networks, which are three types of semantic segmentation networks. Among them, Mask2Former achieved the best accuracy performance, and thus, we used the training results of Mask2Former to segment the reconstructed images. The specific validation accuracy of Mask2Former on the reconstructed dataset is shown in Table 4.
As can be seen from Table 4, the segmentation accuracy for buildings and people, which are our primary concerns, reached over 95%, and the accuracy for cars and bicycles also exceeded 85%. These segmentation results met the requirements for our subsequent semantic reconstruction.

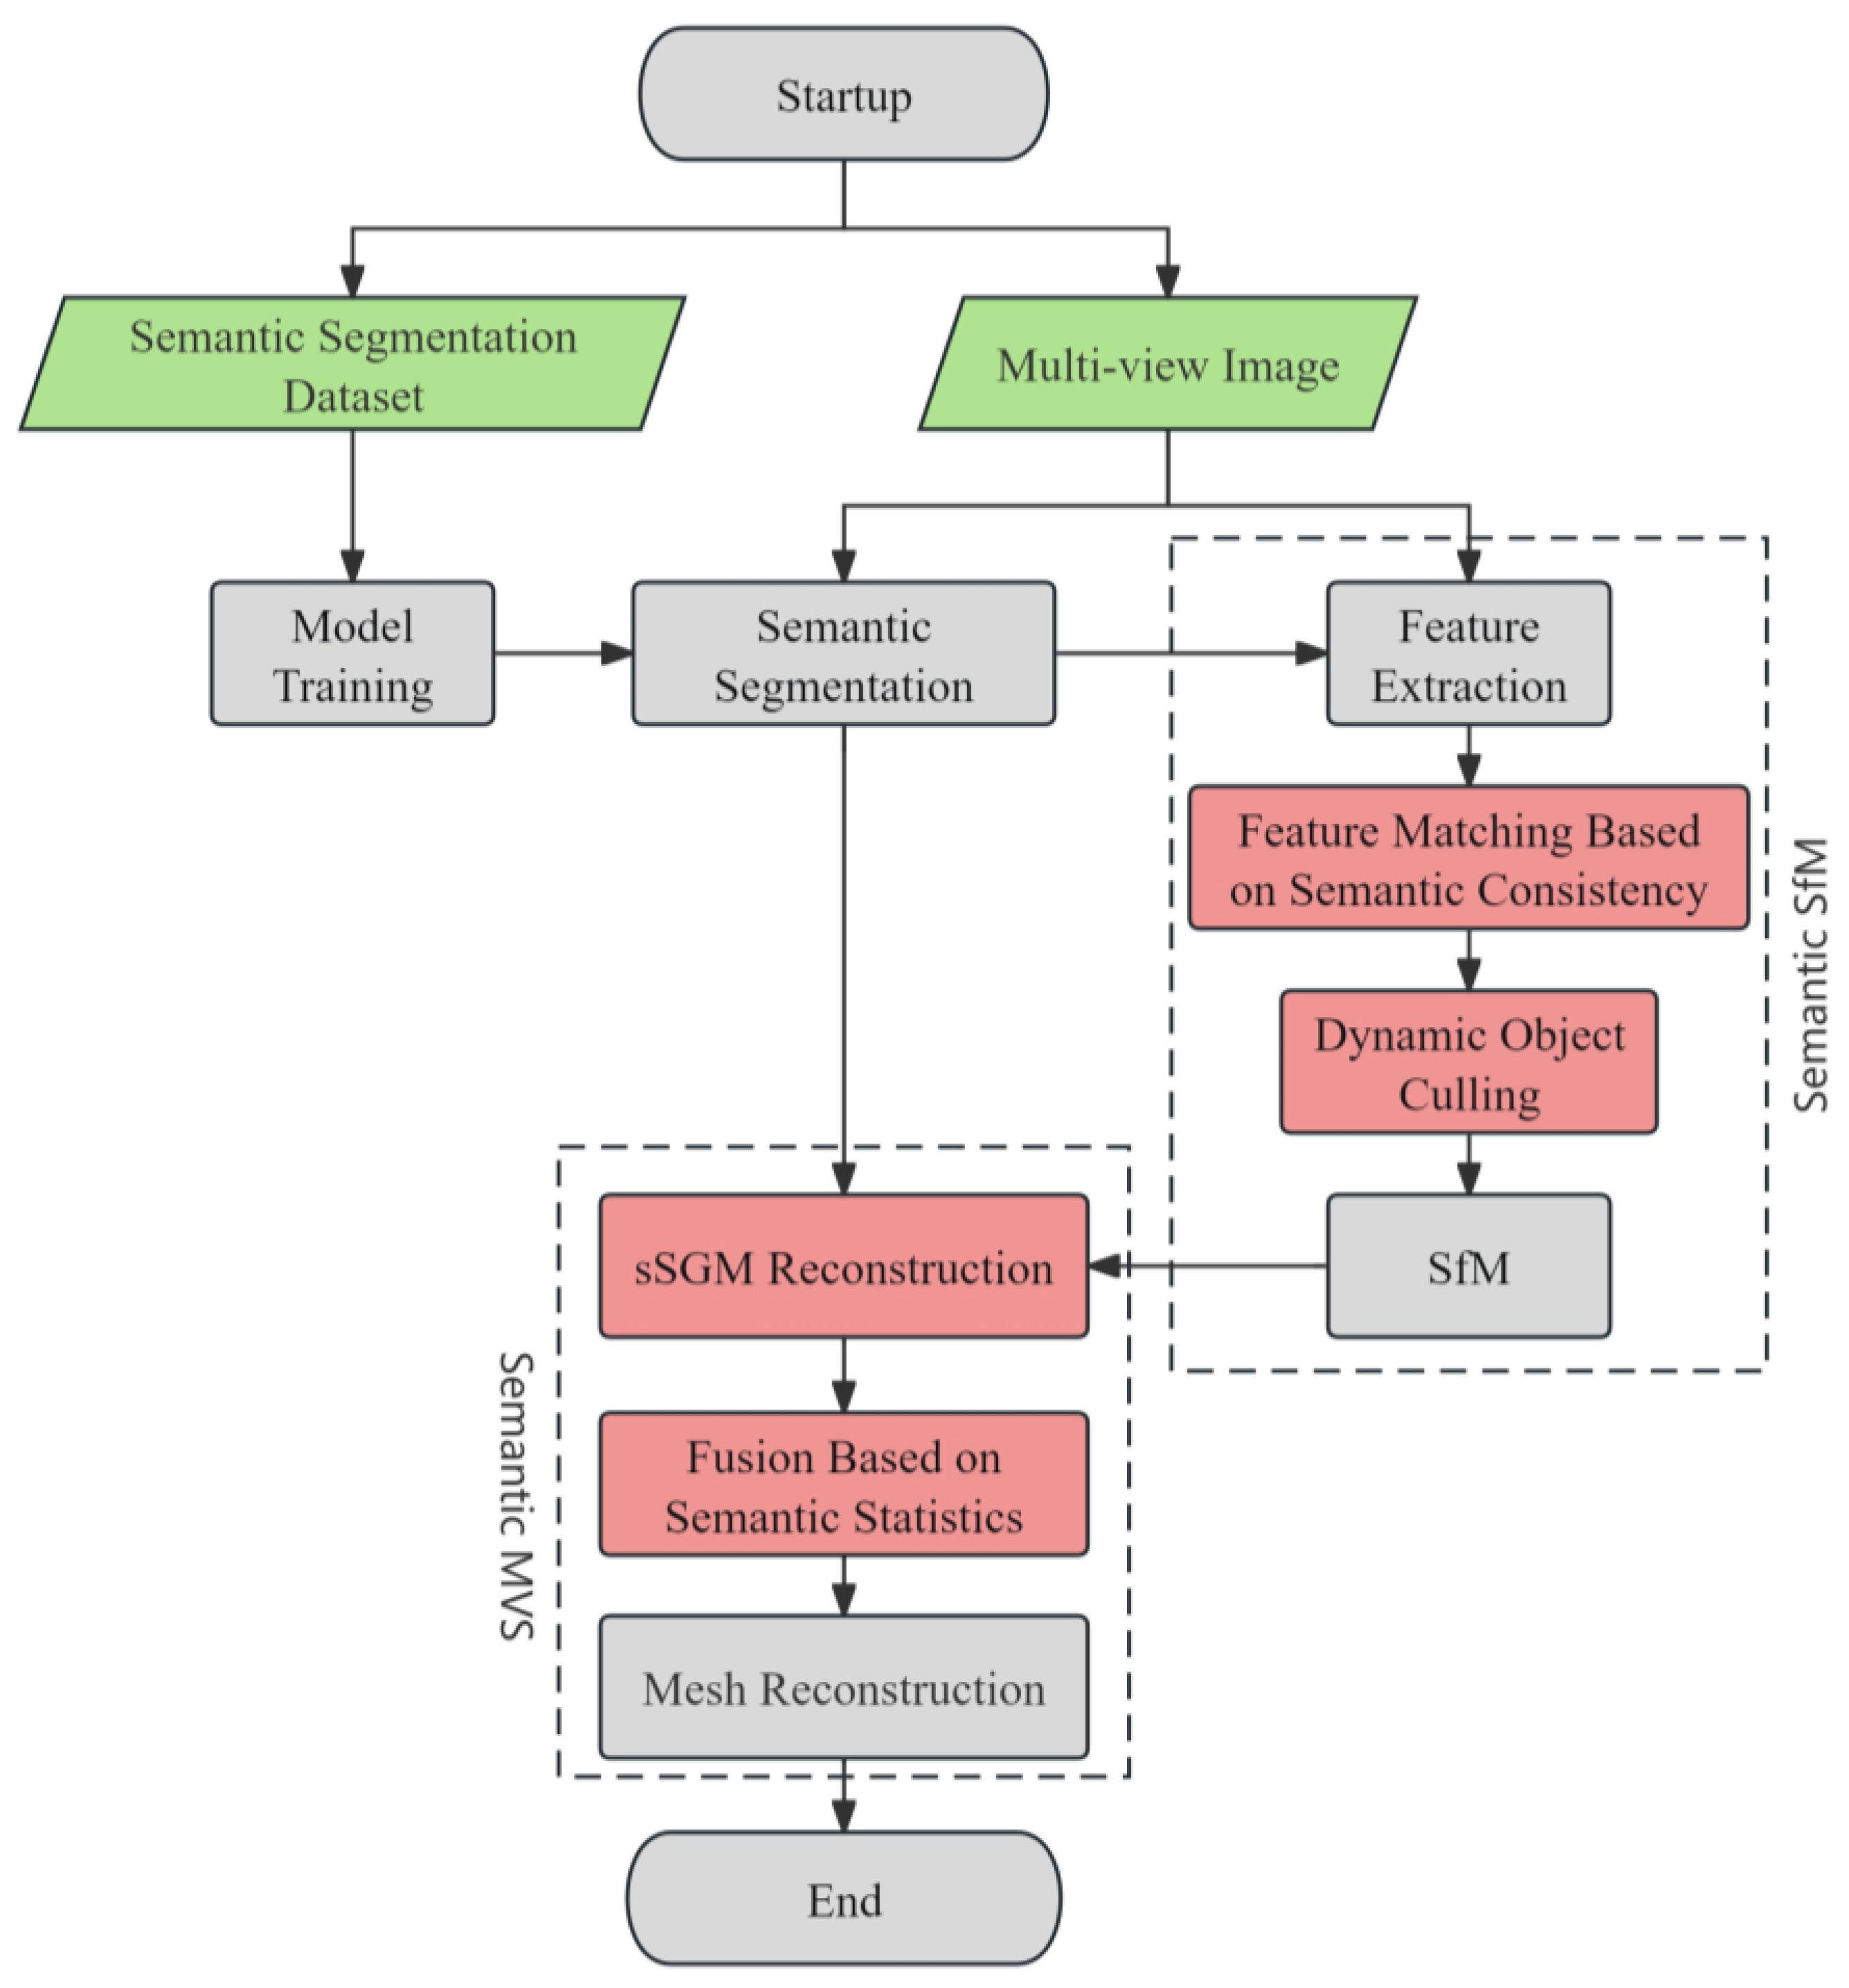
3.2. SfM Based on Dynamic and Static Separation

The traditional Structure-from-Motion (SfM) 3D reconstruction process encompasses several components: feature extraction, feature matching, incremental or global reconstruction, and bundle adjustment. The entire process inputs multi-angle images of a target and outputs the target’s sparse point cloud along with the external parameters of the cameras, including their positions and orientations. The external parameters between cameras, which are crucial for subsequent dense reconstruction, significantly influence the final accuracy of the reconstruction. In our approach, alongside the input of multi-view images, we also input the semantic segmentation results corresponding to each image. By utilizing semantic information, we assessed objects within the reconstructed environment while eliminating the dynamic parts of the scene. These dynamic elements correspond to unstable landmark points in the final sparse point cloud.
For SfM based on semantic motion separation, we implemented it through secondary development using the open-source 3D reconstruction library OpenMVG. As the dataset’s image acquisition followed a chronological sequence, we adopted an incremental reconstruction strategy. Utilizing a pre-trained urban semantic segmentation model, we performed semantic segmentation on the reconstructed dataset. By inputting the semantic attributes of feature points during feature extraction, we integrated semantic information into the 3D reconstruction pipeline. We rewrote all relevant functions in OpenMVG, including feature point data formats, feature matching, and SfM, to enable the library to support semantic SfM.
Firstly, we added a control switch in the CmakeLists.txt of the OpenMVG library, which allowed us to choose whether the compiled executable supports semantics. Secondly, we rewrote the relevant code of “Regions”. The “Regions” data structure is a generic container used to store image descriptions. Regions contain features and descriptors. We rewrote everything related to features, including feature point extraction, saving, and reading. After the feature extraction process had been improved, semantic information was added while obtaining the four attributes x, y, scale, and orientation of the feature points. Then, during the feature matching process, we filtered out mismatches based on semantic consistency. Finally, in the calculation process of SfM, we added the operation of dynamic and static separation.
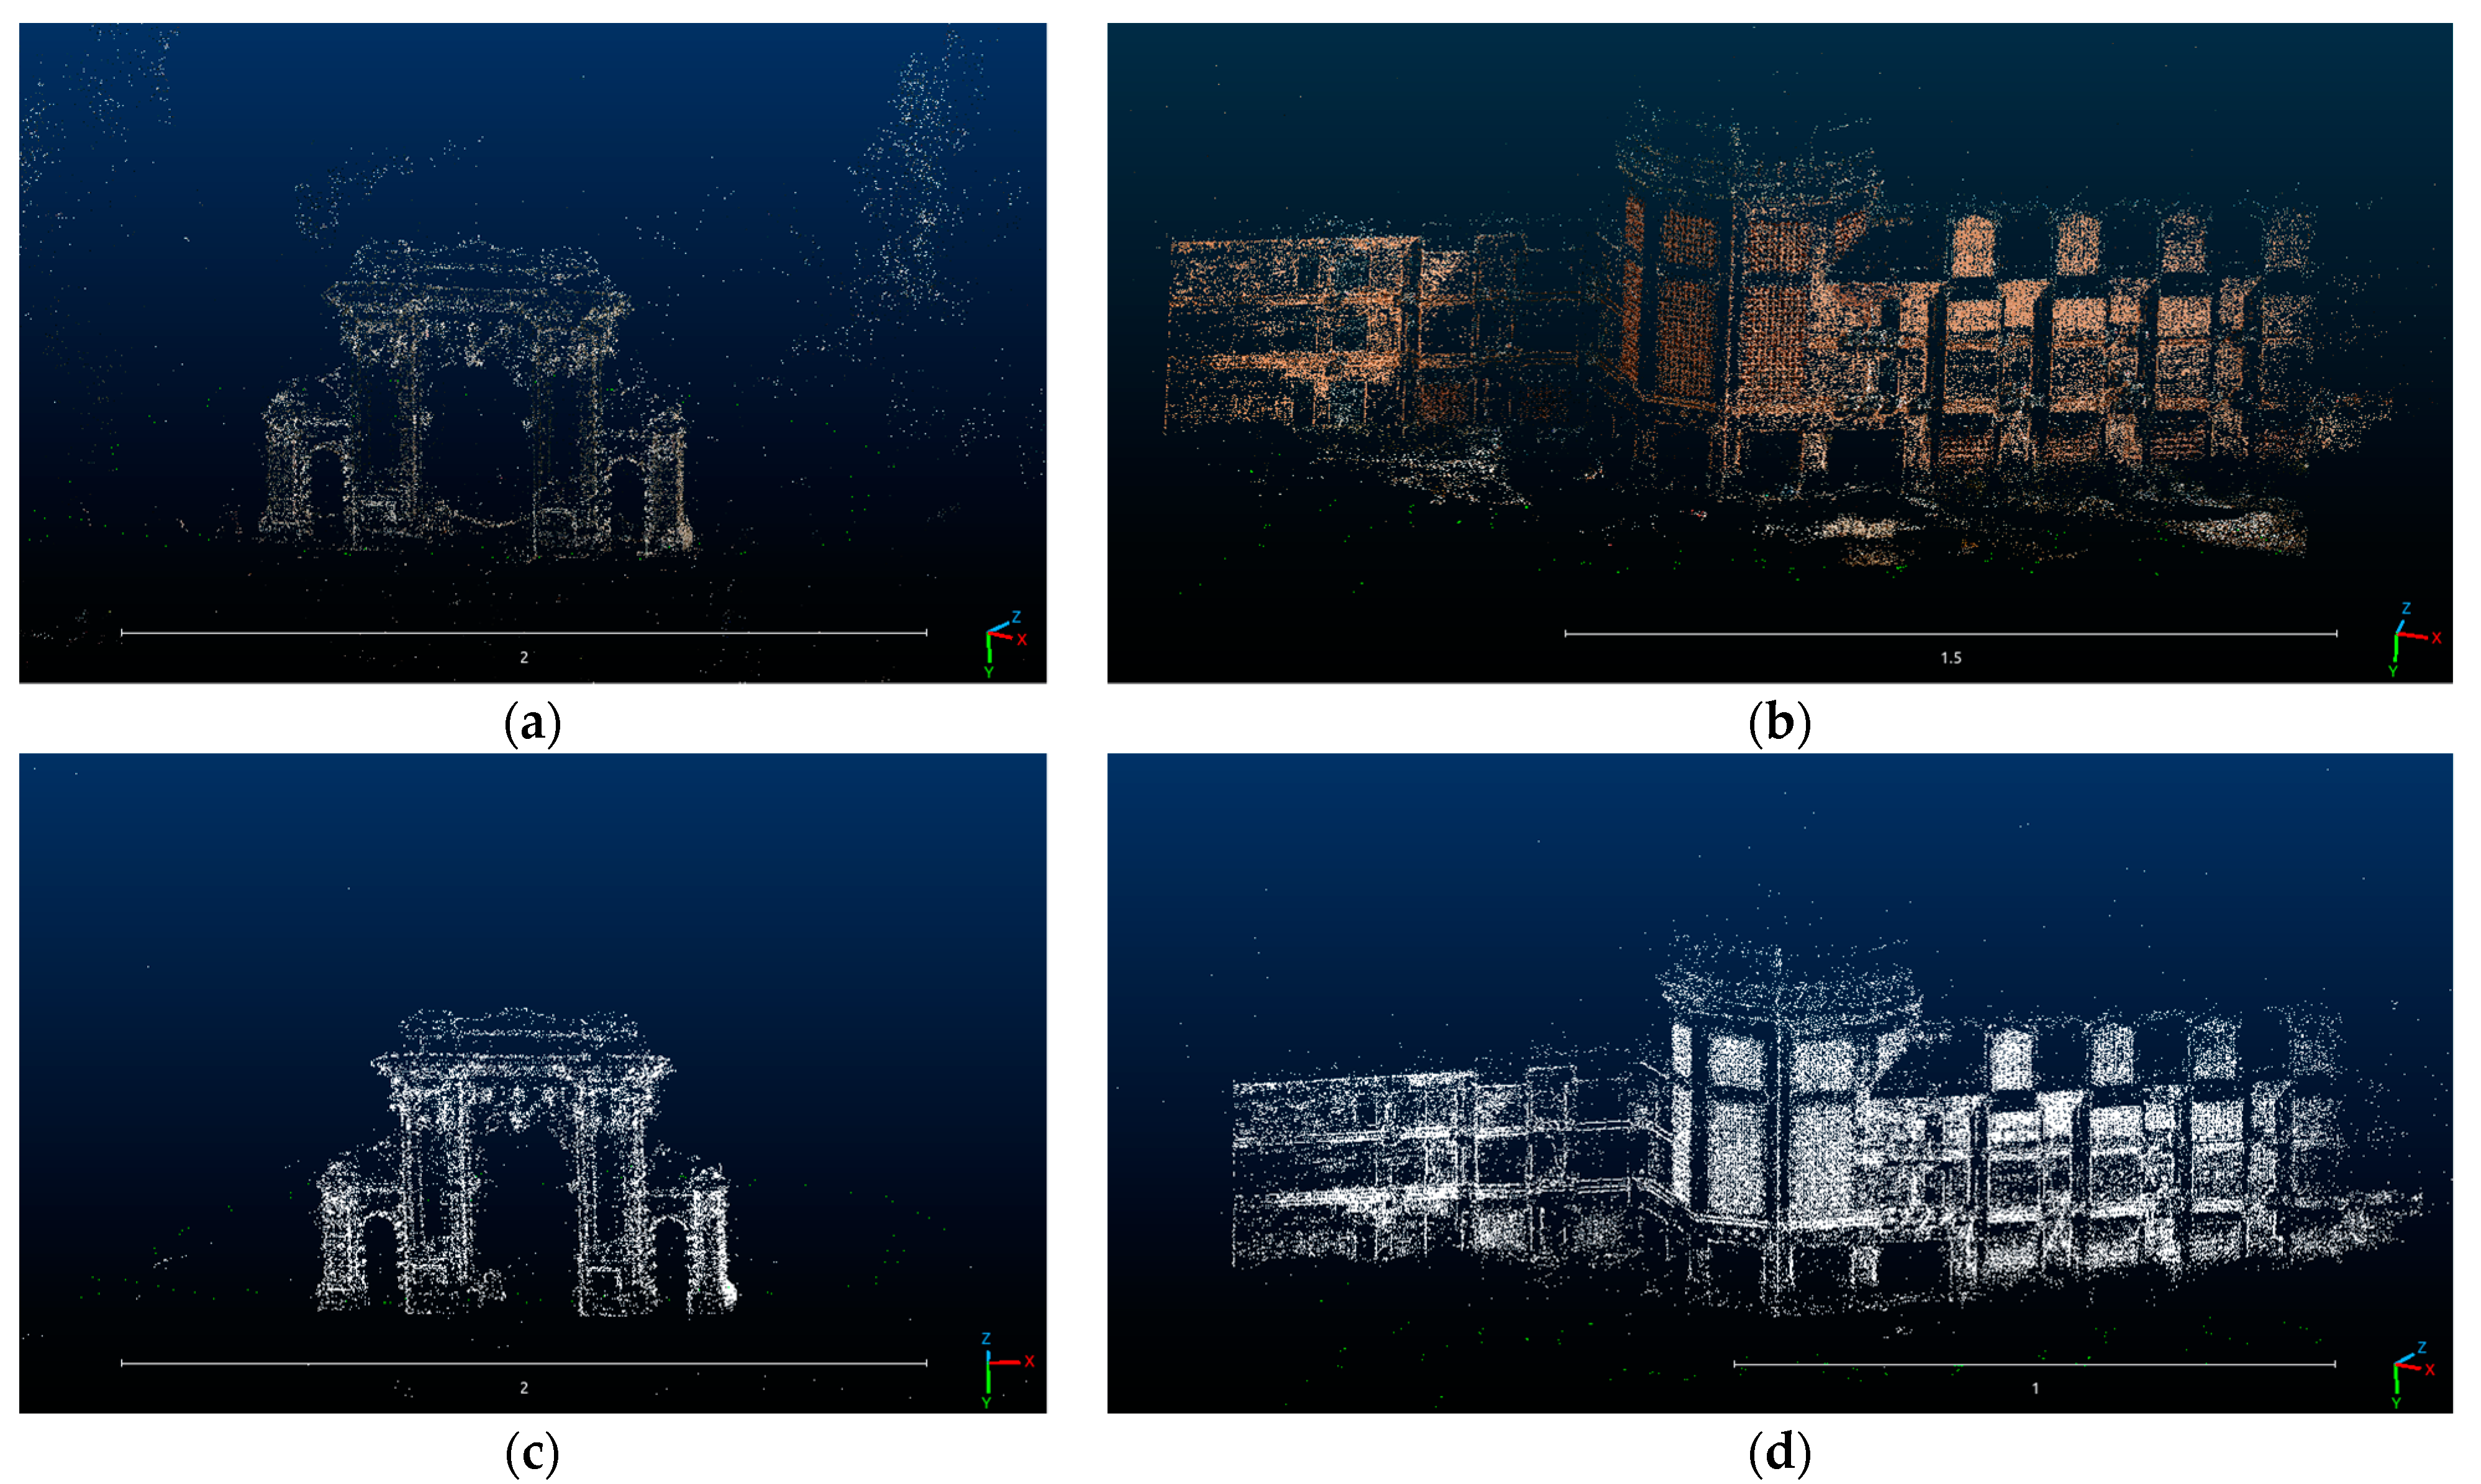
In our semantic classification, we categorized objects based on common urban elements, primarily distinguishing between dynamic and static objects. In urban environments, common moving objects include cars, pedestrians, and bicycles, among others. These objects move at different speeds and can have varying impacts. Due to the inability to synchronize multi-view image acquisition, dynamic objects may exhibit real-space displacements in adjacent multi-view images. These dynamic object feature points introduce errors during feature matching, SfM reconstruction, and bundle adjustment processes. By incorporating semantics, we can filter stable feature points for computation, which aids in enhancing the accuracy of external parameters from the camera calculations. We validated our method by using both the original and semantically optimized approaches on the Tsinghua University architectural dataset. The resulting sparse point cloud reconstruction is shown in Figure 7.
We compared the accuracy of the reconstructed sparse point clouds with the ground truth (mesh model) by calculating the distance from the point clouds to the mesh, which allowed us to assess the accuracy of the Structure-from-Motion (SfM) reconstruction. With the semantically enhanced SfM, we could directly output point clouds of architectural targets based on semantic information, but the point clouds output by the original openMVG required the target architecture to be manually cropped. We used the CloudCompare 2.12.0 software for progress comparison. The results are shown in Figure 8.
Due to the limited quantity of point clouds for the Tsinghua University’s Old Gate, we magnified the display of the gate’s sparse point clouds. We used different colors to represent the magnitude of the points’ errors. As shown in the figure, in the color transitions from blue to green to red, blue indicates smaller errors and red indicates larger errors. The assignment of colors was based on relative error values. Due to the large structure of the Tsinghua Life Sciences Building, the overall relative error is small, resulting in most points being displayed in blue. For a fair comparison, we calculated the alignment accuracy of each point cloud with the true model. We compared the reconstruction precision under the condition of ensuring the same possible alignment accuracy. The results of the accuracy evaluation are shown in Table 5.
As shown in Table 5, the semantic-based SfM demonstrates higher precision, even under conditions of equal or slightly lower alignment accuracy. This increase in precision is particularly evident in more complex scenes. Given that the gate is located by the roadside, where there is a higher volume of pedestrians and vehicular traffic, the scene contains more dynamic objects. Therefore, the enhancement in Sigma is more pronounced after incorporating semantic optimization in this scenario.
To further examine the significance of our static–dynamic separation process, we analyzed the proportions of various objects in the final sparse point cloud. This helped us determine the extent to which dynamic feature points, without semantic integration, contributed to the final point cloud computation. After feature extraction, we applied a matching filter based on the fundamental matrix. We then performed semantic filtering on the matched feature point pairs, which included inconsistencies in semantic attributes of the left and right feature points or those belonging to dynamic objects. The results are presented in Table 6.
We conducted a statistical analysis of the feature matches between all pairs of images, wherein the most significant source of error was found to be the sky, followed by the impact caused by people and vehicles. The influence of rapidly moving people and vehicles is not significant; rather, points that remain stationary for short periods or move slowly within the scene are more likely to cause errors. We compared the number of landmarks generated by the semantic SfM and the original method. Among these, landmarks belonging to dynamic objects and those with inconsistent semantic attributes accounted for approximately 6.5% of the total.
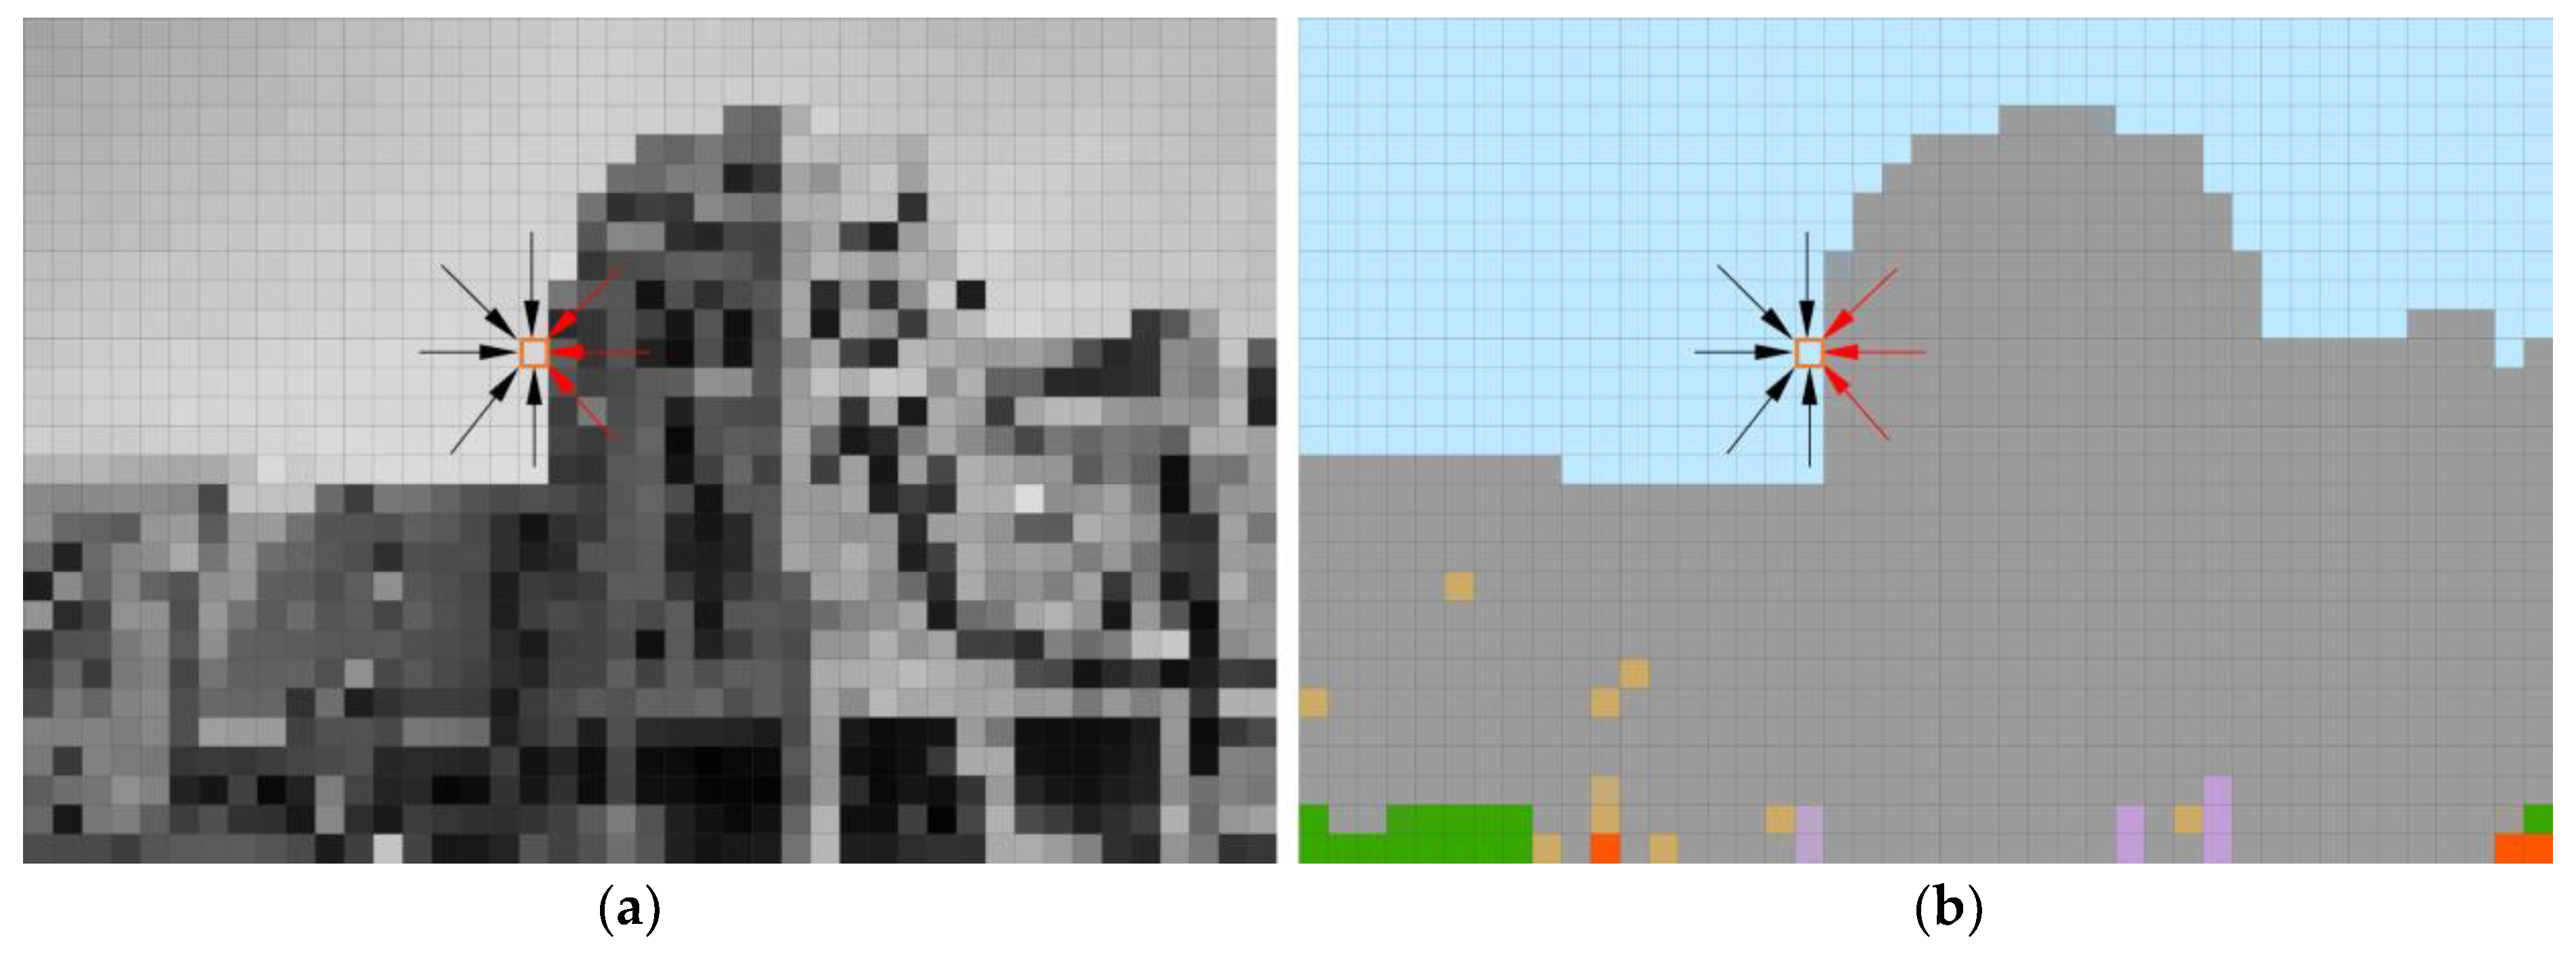
To intuitively demonstrate the positive value of adding semantic information into the feature matching process, we selected two images from the Tsinghua University‘s Old Gate dataset for detailed analysis and demonstration. The results are shown in Figure 9.
Figure 9a shows the error of semantic inconsistency in feature point matching. These points may be matched together due to similar grayscale features, but they are actually mismatches. The result after semantic segmentation is no longer displayed in pixels but is divided into area blocks based on the essential attributes in the scene. This kind of high-dimensional information that goes beyond two dimensions is no longer affected by the gray value of a single pixel, so it is easy to find semantically inconsistent matching errors. Figure 9b shows the impact of dynamic targets on feature matching. It can be seen that slow-moving objects in the scene or people who are stationary for a short period of time are more likely to form false matches. These people or objects are not completely static, and this mismatch has a negative impact on the SfM. Since our data were not collected synchronously, this mismatch would be more likely to be encountered in adjacent frames. Figure 9c shows the matching results after eliminating the first two error-introduction items. It can be seen that although there are some individual mismatches, all feature point pairs matched, as a whole, are basically correct.

3.3. Semantic-Based SGM

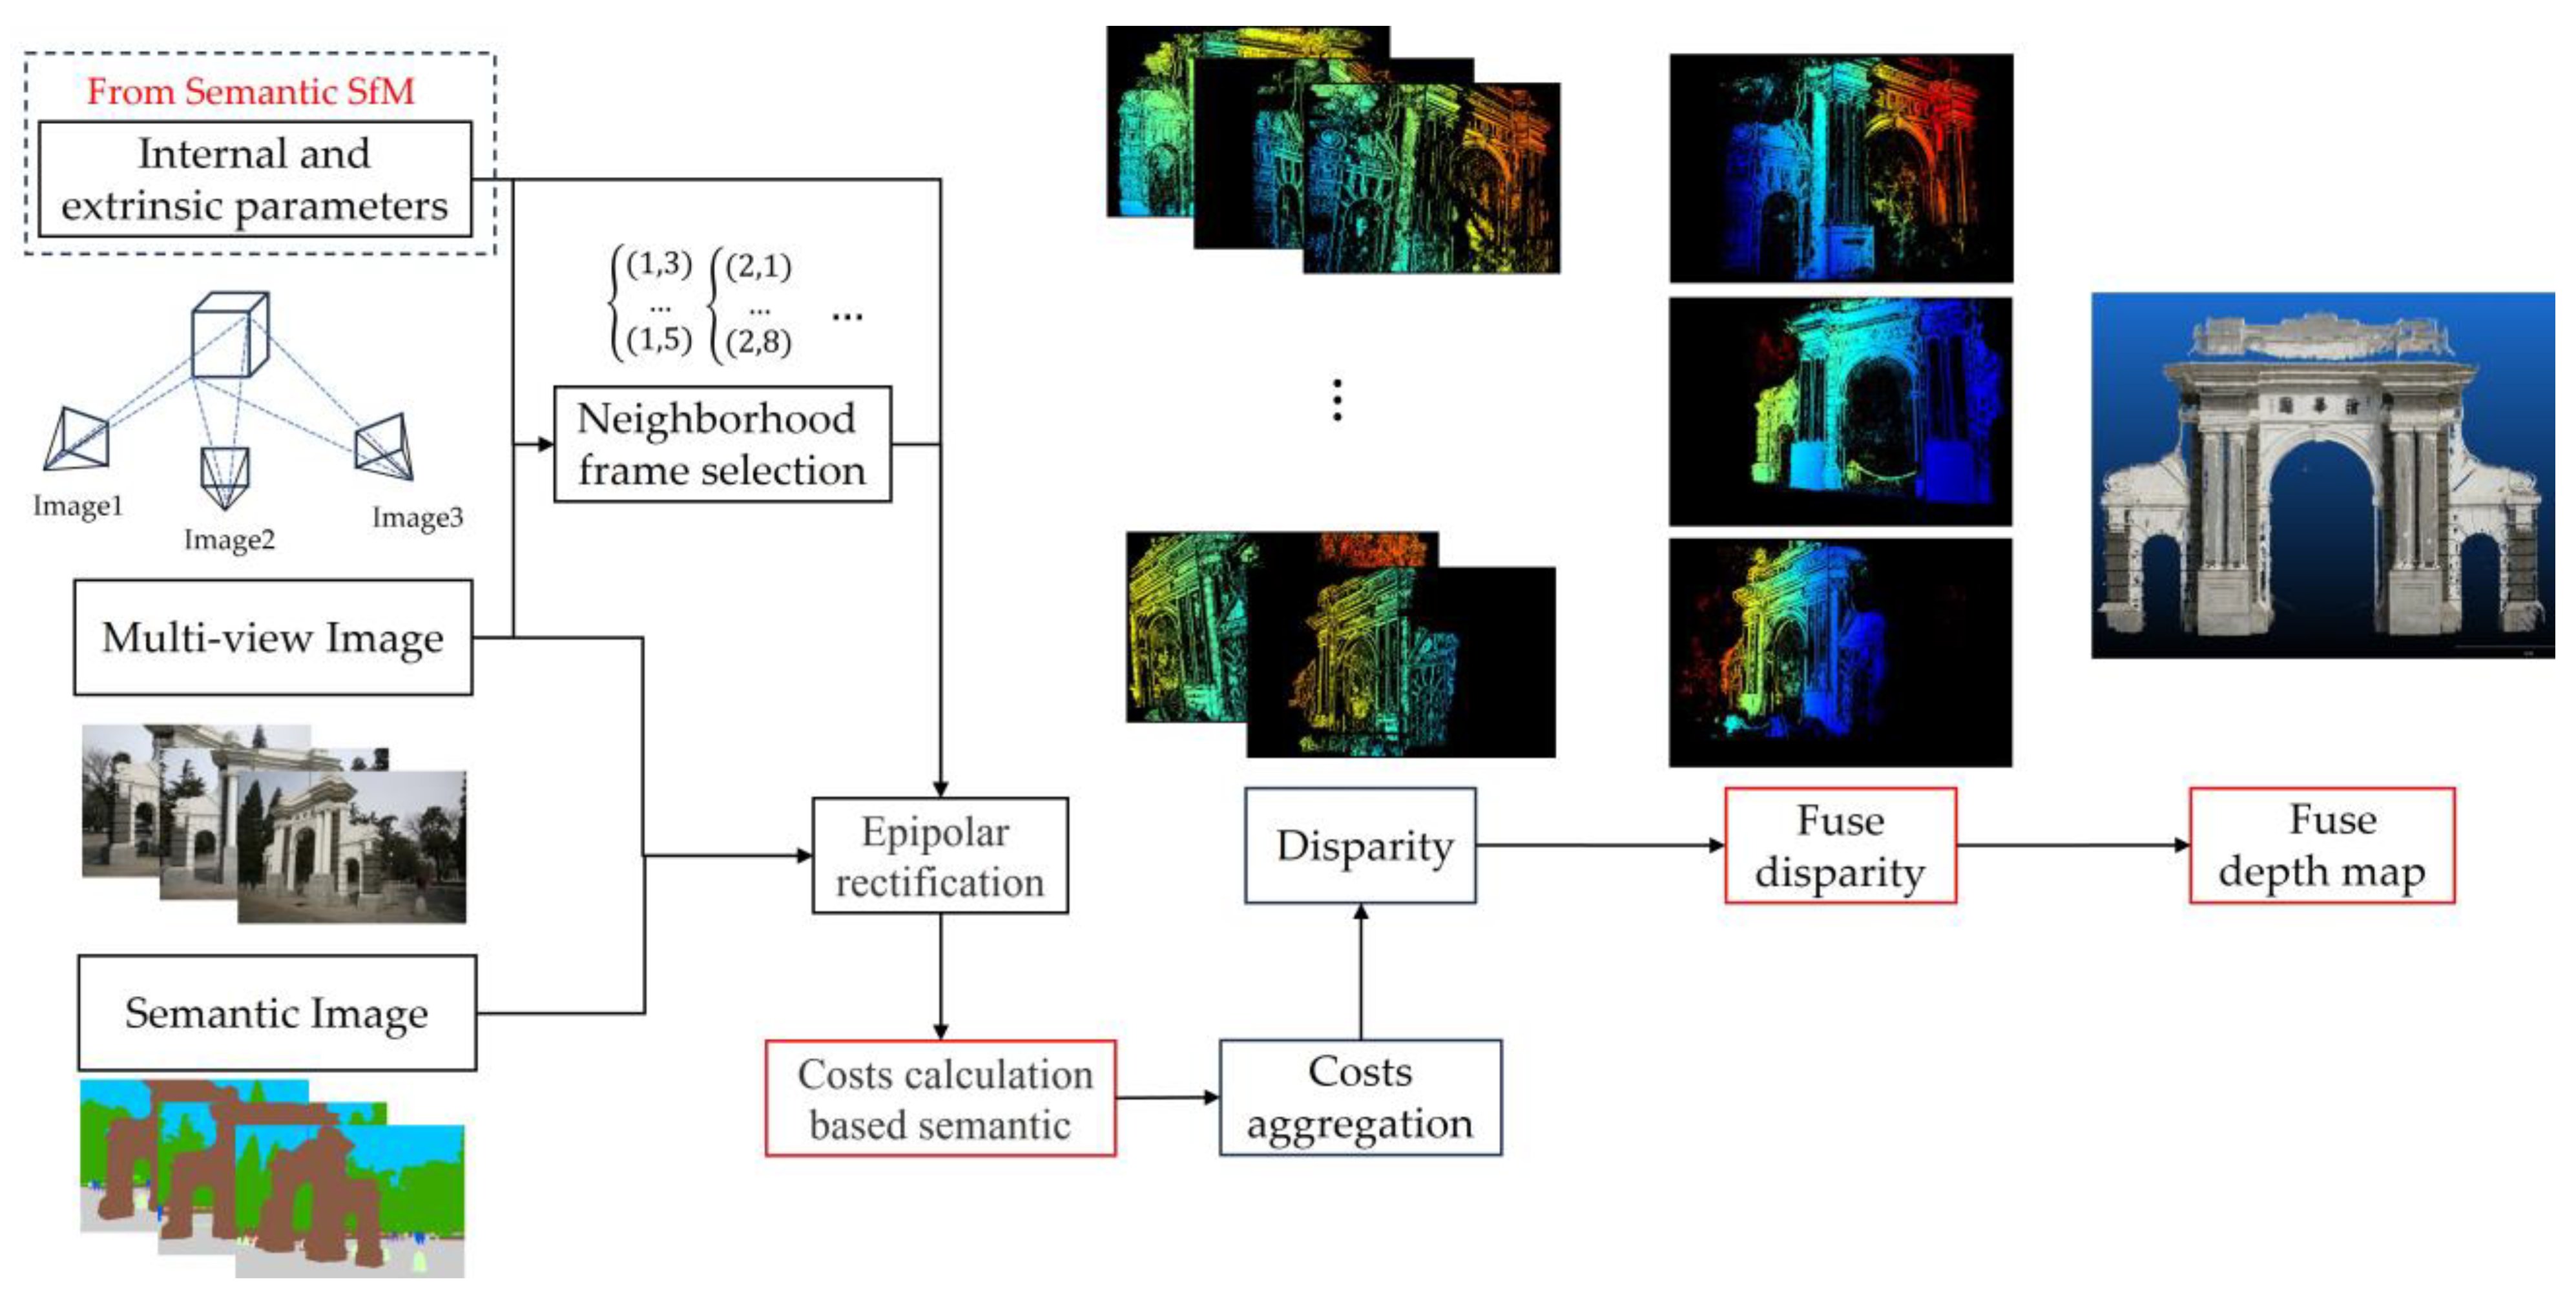
The dense reconstruction of point clouds can be approached using various methods, such as PatchMatch and SGM. We opted for the SGM method for semantic optimization. The specific computation process of SGM includes the following steps:
  • Initialization: select the best neighborhood frames for each image based on three criteria—the angle of co-visibility points between two images, the area covered, and the scale similarity.
  • Depth map initialization: initialize a coarse depth map for each image using the Delaunay triangulation method based on sparse point clouds.
  • Perform epipolar rectification on the image pairs and calculate the matching cost per pixel by row using the WZNCC consistency measure.
  • Aggregate the one-dimensional path costs from various directions to approximate the calculation of the optimal two-dimensional disparity.
  • After cost aggregation, find the disparity value with the minimum cost for each pixel.
  • Fuse the three depth maps generated from the three sets of image pairs involved in the calculation for each image.
  • Perform a semantically based fusion on the corresponding dense point clouds calculated for all images.
We performed dense reconstruction of Tsinghua University’s Old Gate and Life Sciences Building following the steps outlined above, and we compared the results of the original method with those reconstructed using the semantic SGM method. After obtaining the disparity maps of pairwise images reconstructed by means of semantic SGM, in step f, we selected three sets of depth maps reconstructed from adjacent images for each image to be fused. During this process, we fused the images based on the semantic consistency across different images. The result is shown in the Figure 10.
In step g, it is not sufficient to simply combine the dense point clouds reconstructed from all images, as points from different images may correspond to the same point in real three-dimensional space. Thus, it is necessary to evaluate points that are redundantly present. During the fusion process, there are instances where the same point possesses different semantic attributes in different images. We performed a weighted statistical analysis of the semantics of such a point across various depth maps, and we assigned the attribute with the highest weight to the final, fused dense point cloud of the scene. The resulting target dense point cloud is shown in Figure 7.
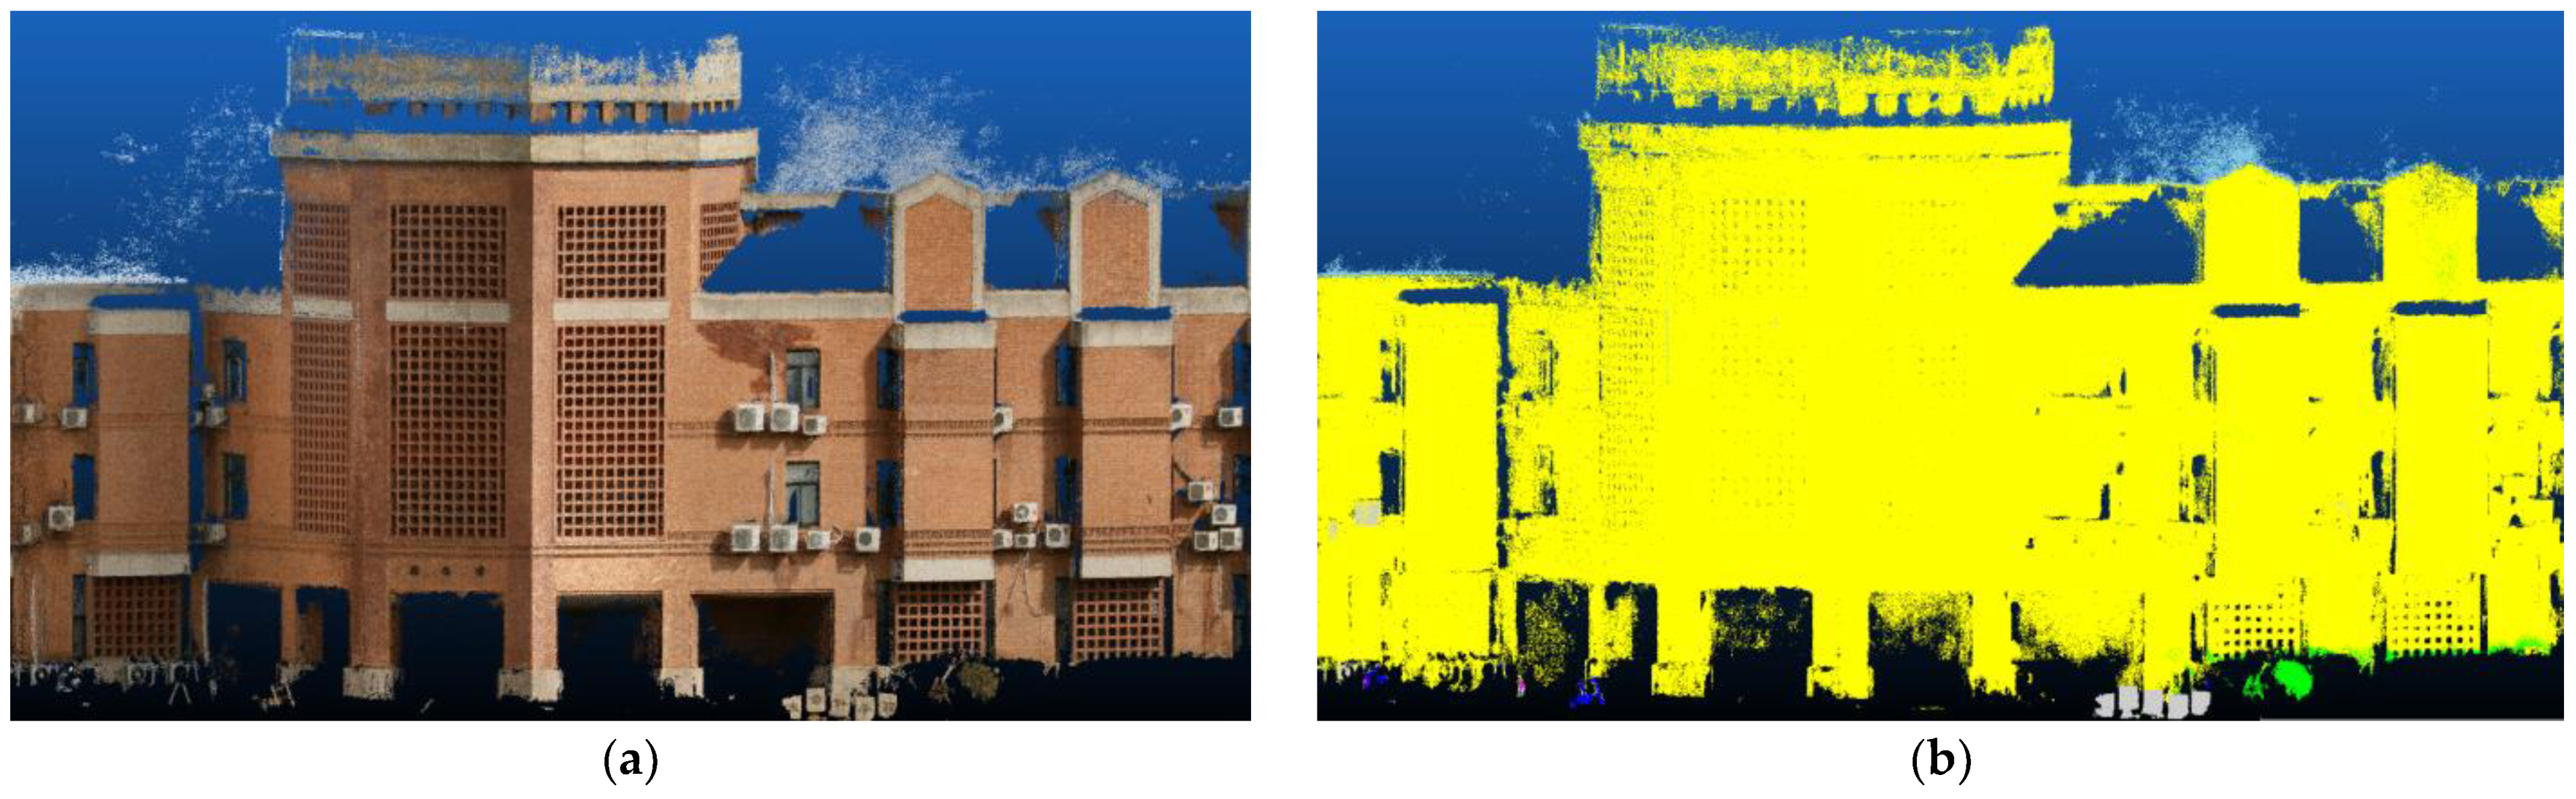
The dense point cloud after semantic reconstruction not only possesses coordinates in the XYZ space but also carries semantic properties. We assigned colors based on these semantic attributes: vegetation is colored green, people are magenta, vehicles are blue, buildings are yellow, the sky is blue, and static clutter in the scene is gray. It is evident that the results obtained from our semantic SGM reconstruction exhibit less noise around the edges of objects, such as the edges of building rooftops. Moreover, dense reconstruction based on semantics yields dense point clouds containing semantic information, which is extremely important for scene perception.
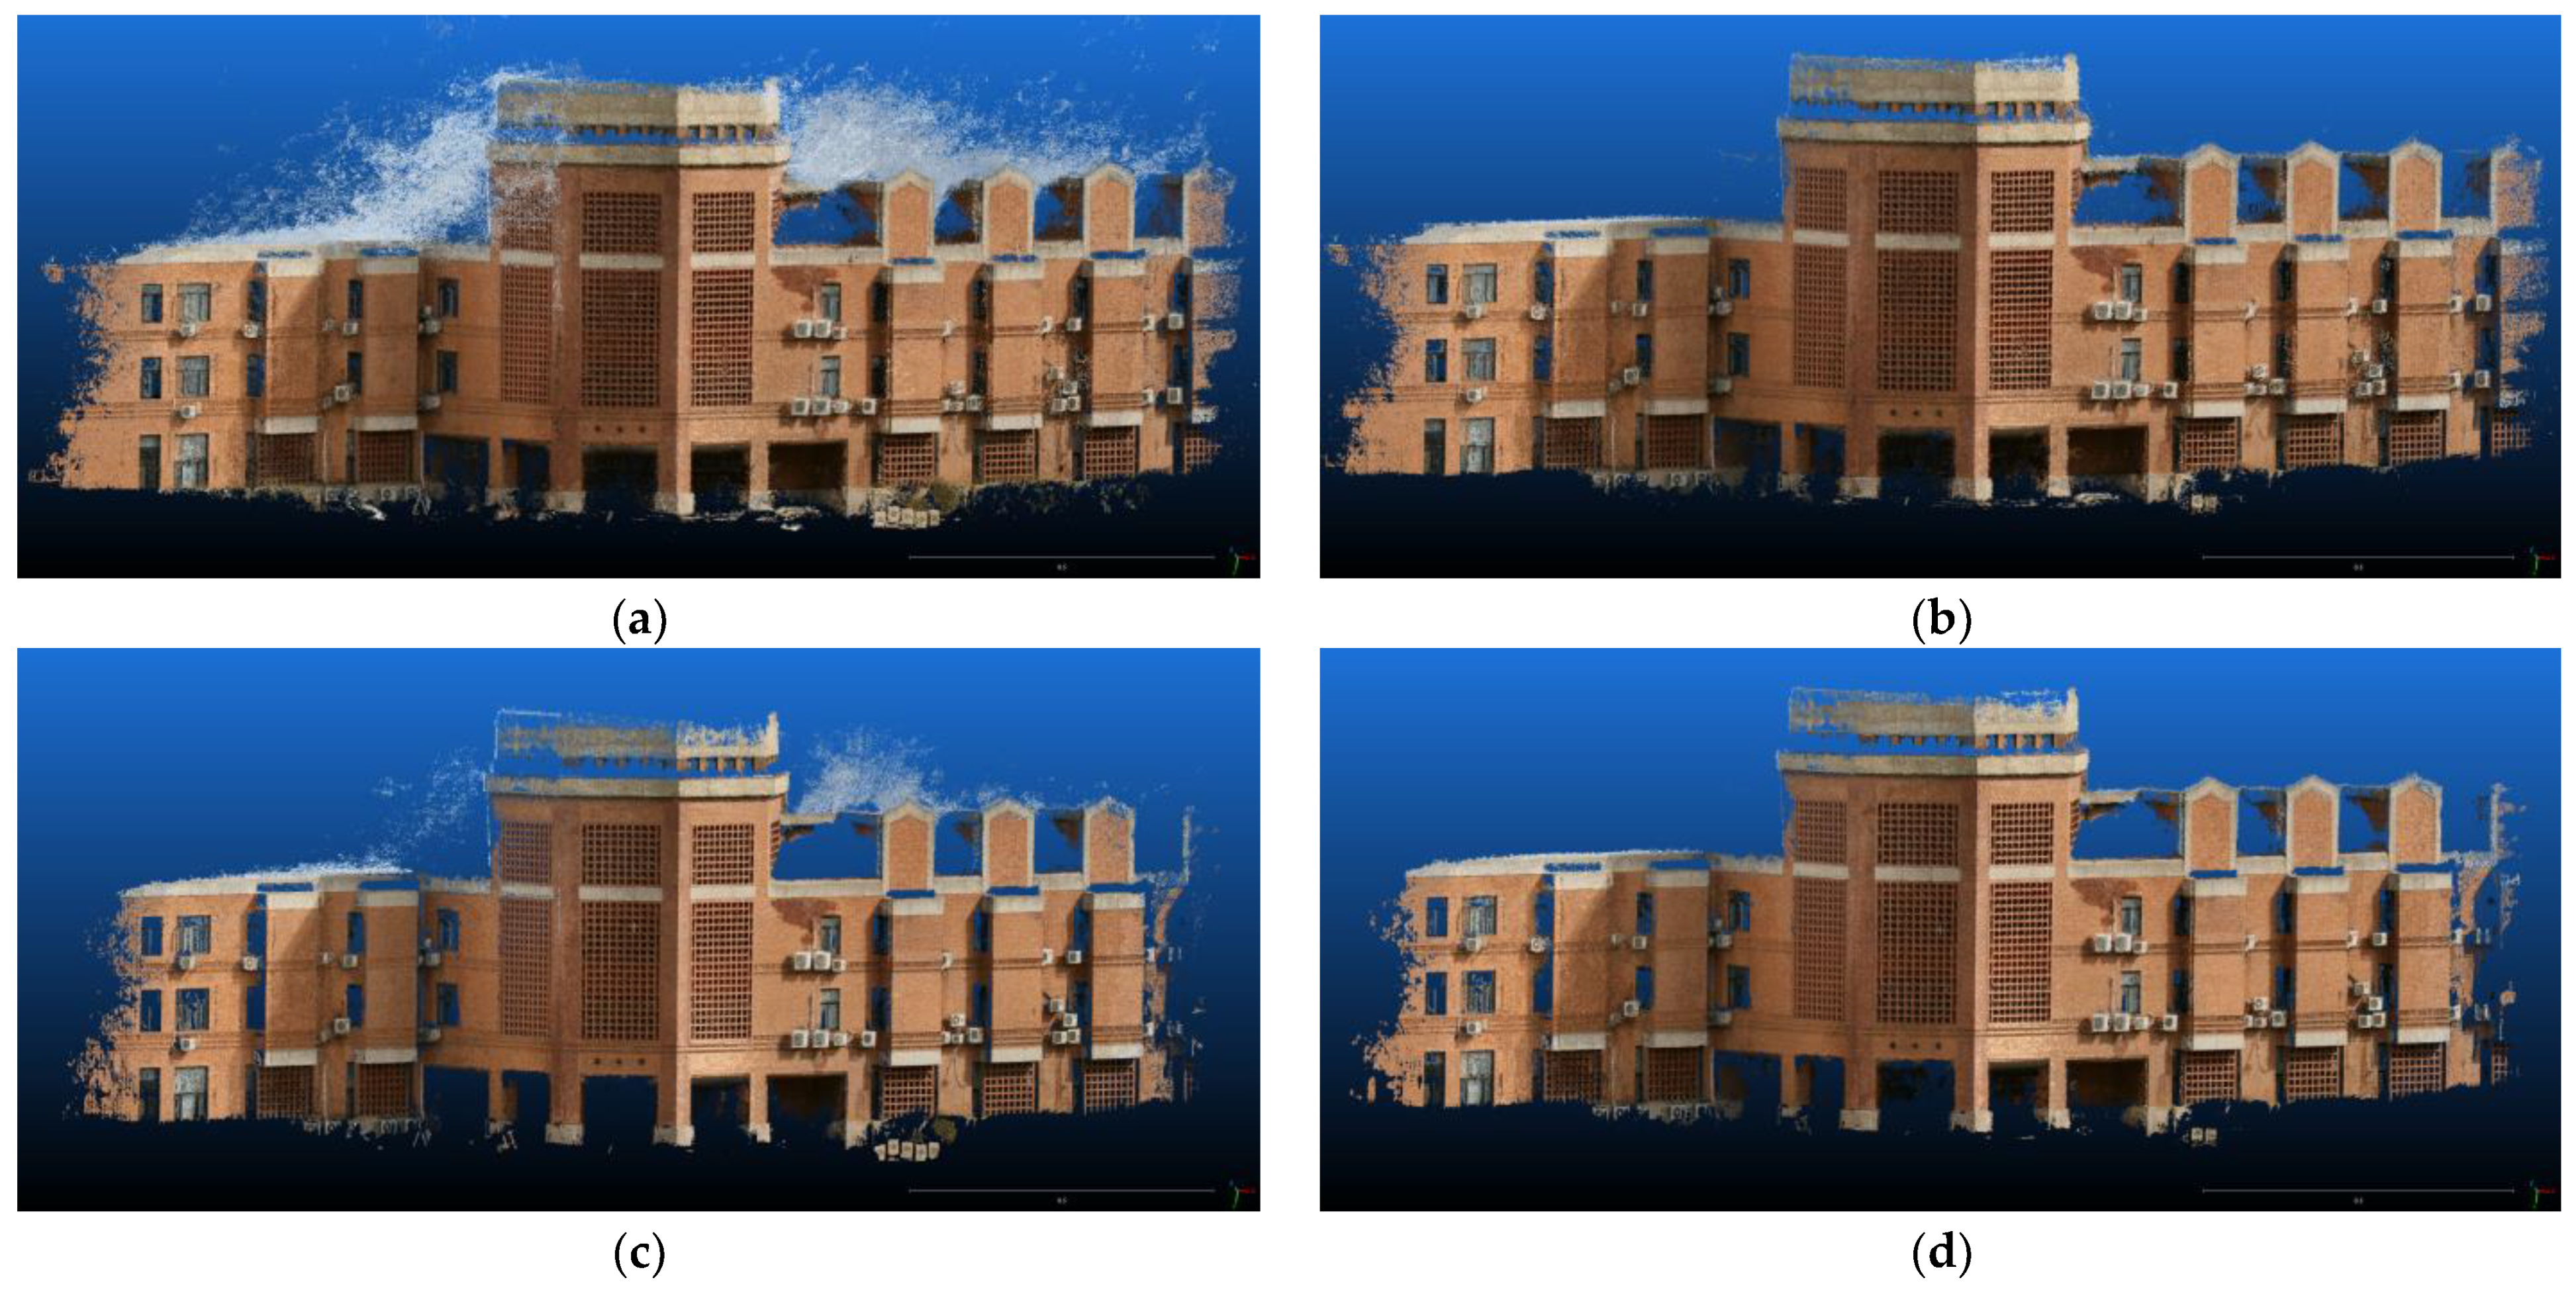
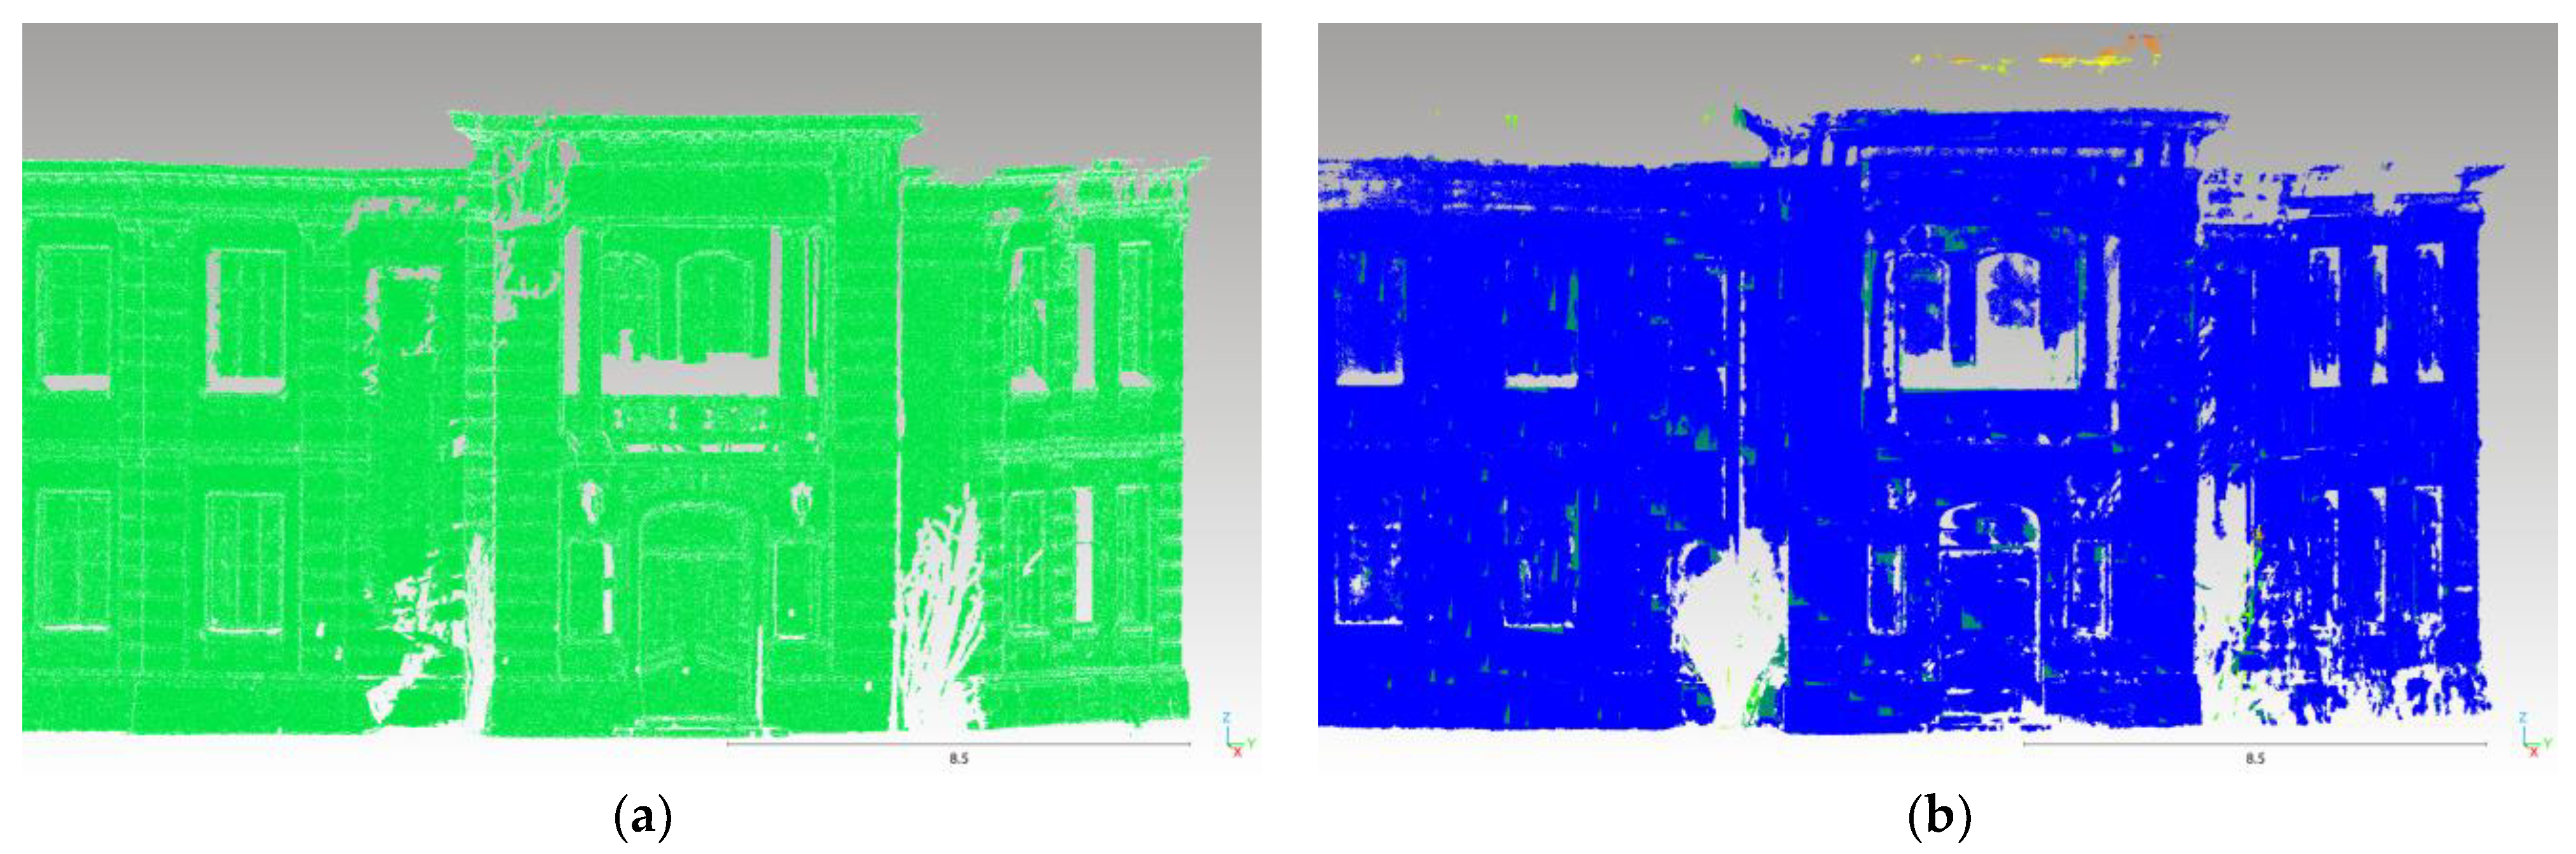
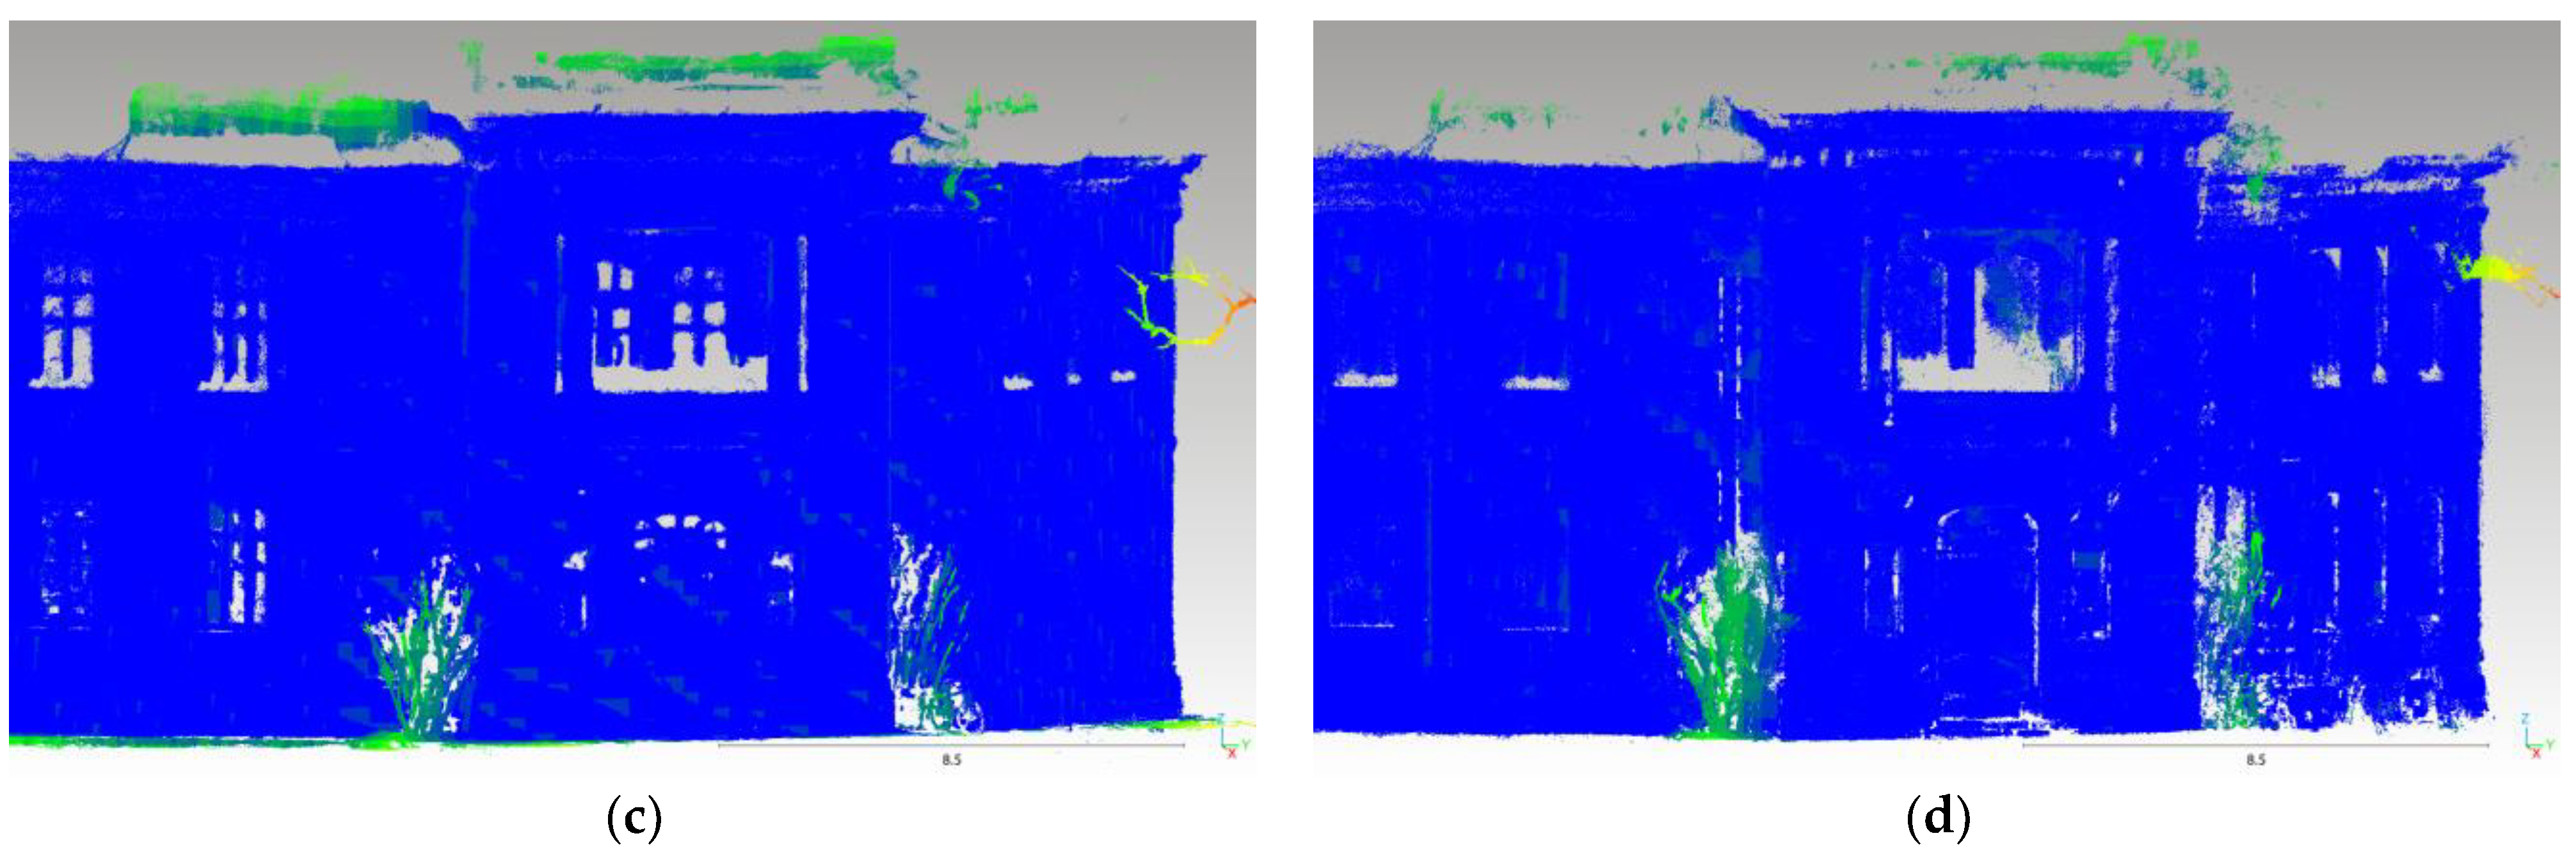
After fusing a dense point cloud from all views, one can choose whether to optimize the dense point cloud using one of three options: REMOVE_SPECKLES, FILL_GAP, and ADJUST_FILTER. To assess the effectiveness of our semantic optimization, we conducted a comparison of the results before and after optimization. The comparison results for the reconstruction of the Tsinghua Life Sciences Building are shown in Figure 11.
The above figure shows the reconstruction results for the Tsinghua Life Sciences Building. The first row of images presents the results obtained without filtering, while the second row displays the outcomes after filtering. The left side depicts the results obtained using the original method, and the right side shows the results after semantic optimization. It is evident that using the original SGM reconstruction method introduces a substantial amount of noise, particularly in areas of depth discontinuity, such as the edges of the building. Even after filtering the dense point cloud, the noise level remains significantly higher compared to that obtained using the sSGM method. In the collected multi-view images, the building is adjacent to the sky. During computation, it becomes challenging to accurately identify the positions of disparity discontinuities when using the original SGM method, especially when calculating the one-dimensional path costs transitioning from the building to the sky. This is due to the lack of distinct features in the sky region. Hence, the subsequent cost aggregation process is prone to computing some incorrect disparities.
Next, we conducted a quantitative statistical analysis to evaluate the reconstruction accuracy. Ultimately, the dense point cloud obtained from the reconstruction was aligned with the true-value grid using the Iterative Closest Point (ICP) algorithm, and the distance between the point cloud and the grid was calculated. The calculation process was consistent with that used for sparse point clouds, and the results are presented in Table 7.
We aligned the reconstructed dense cloud point with the ground-truth grid and compared the reconstruction accuracy while ensuring the same alignment accuracy. As shown in Table 7, we compared three sets of reconstructed data, and the results all show that the dense point clouds obtained using sSGM have a higher accuracy, which is mainly manifested as a smaller max. distance, a smaller average distance, and a lower Sigma value. There are two reasons for the smaller maximum distance. One is that sSGM has semantic perception capabilities and can judge depth continuity based on semantic consistency, which greatly improves the reconstruction accuracy of the edge areas of objects. The second reason is that we can perform directional output according to the semantic attributes contained in the reconstructed dense point clouds, thereby excluding some outliers and errors. A lower Sigma value indicates that the sSGM method can improve the overall accuracy. We also compared this method with the current mainstream PatchMatch method, and the results are shown in Figure 12.
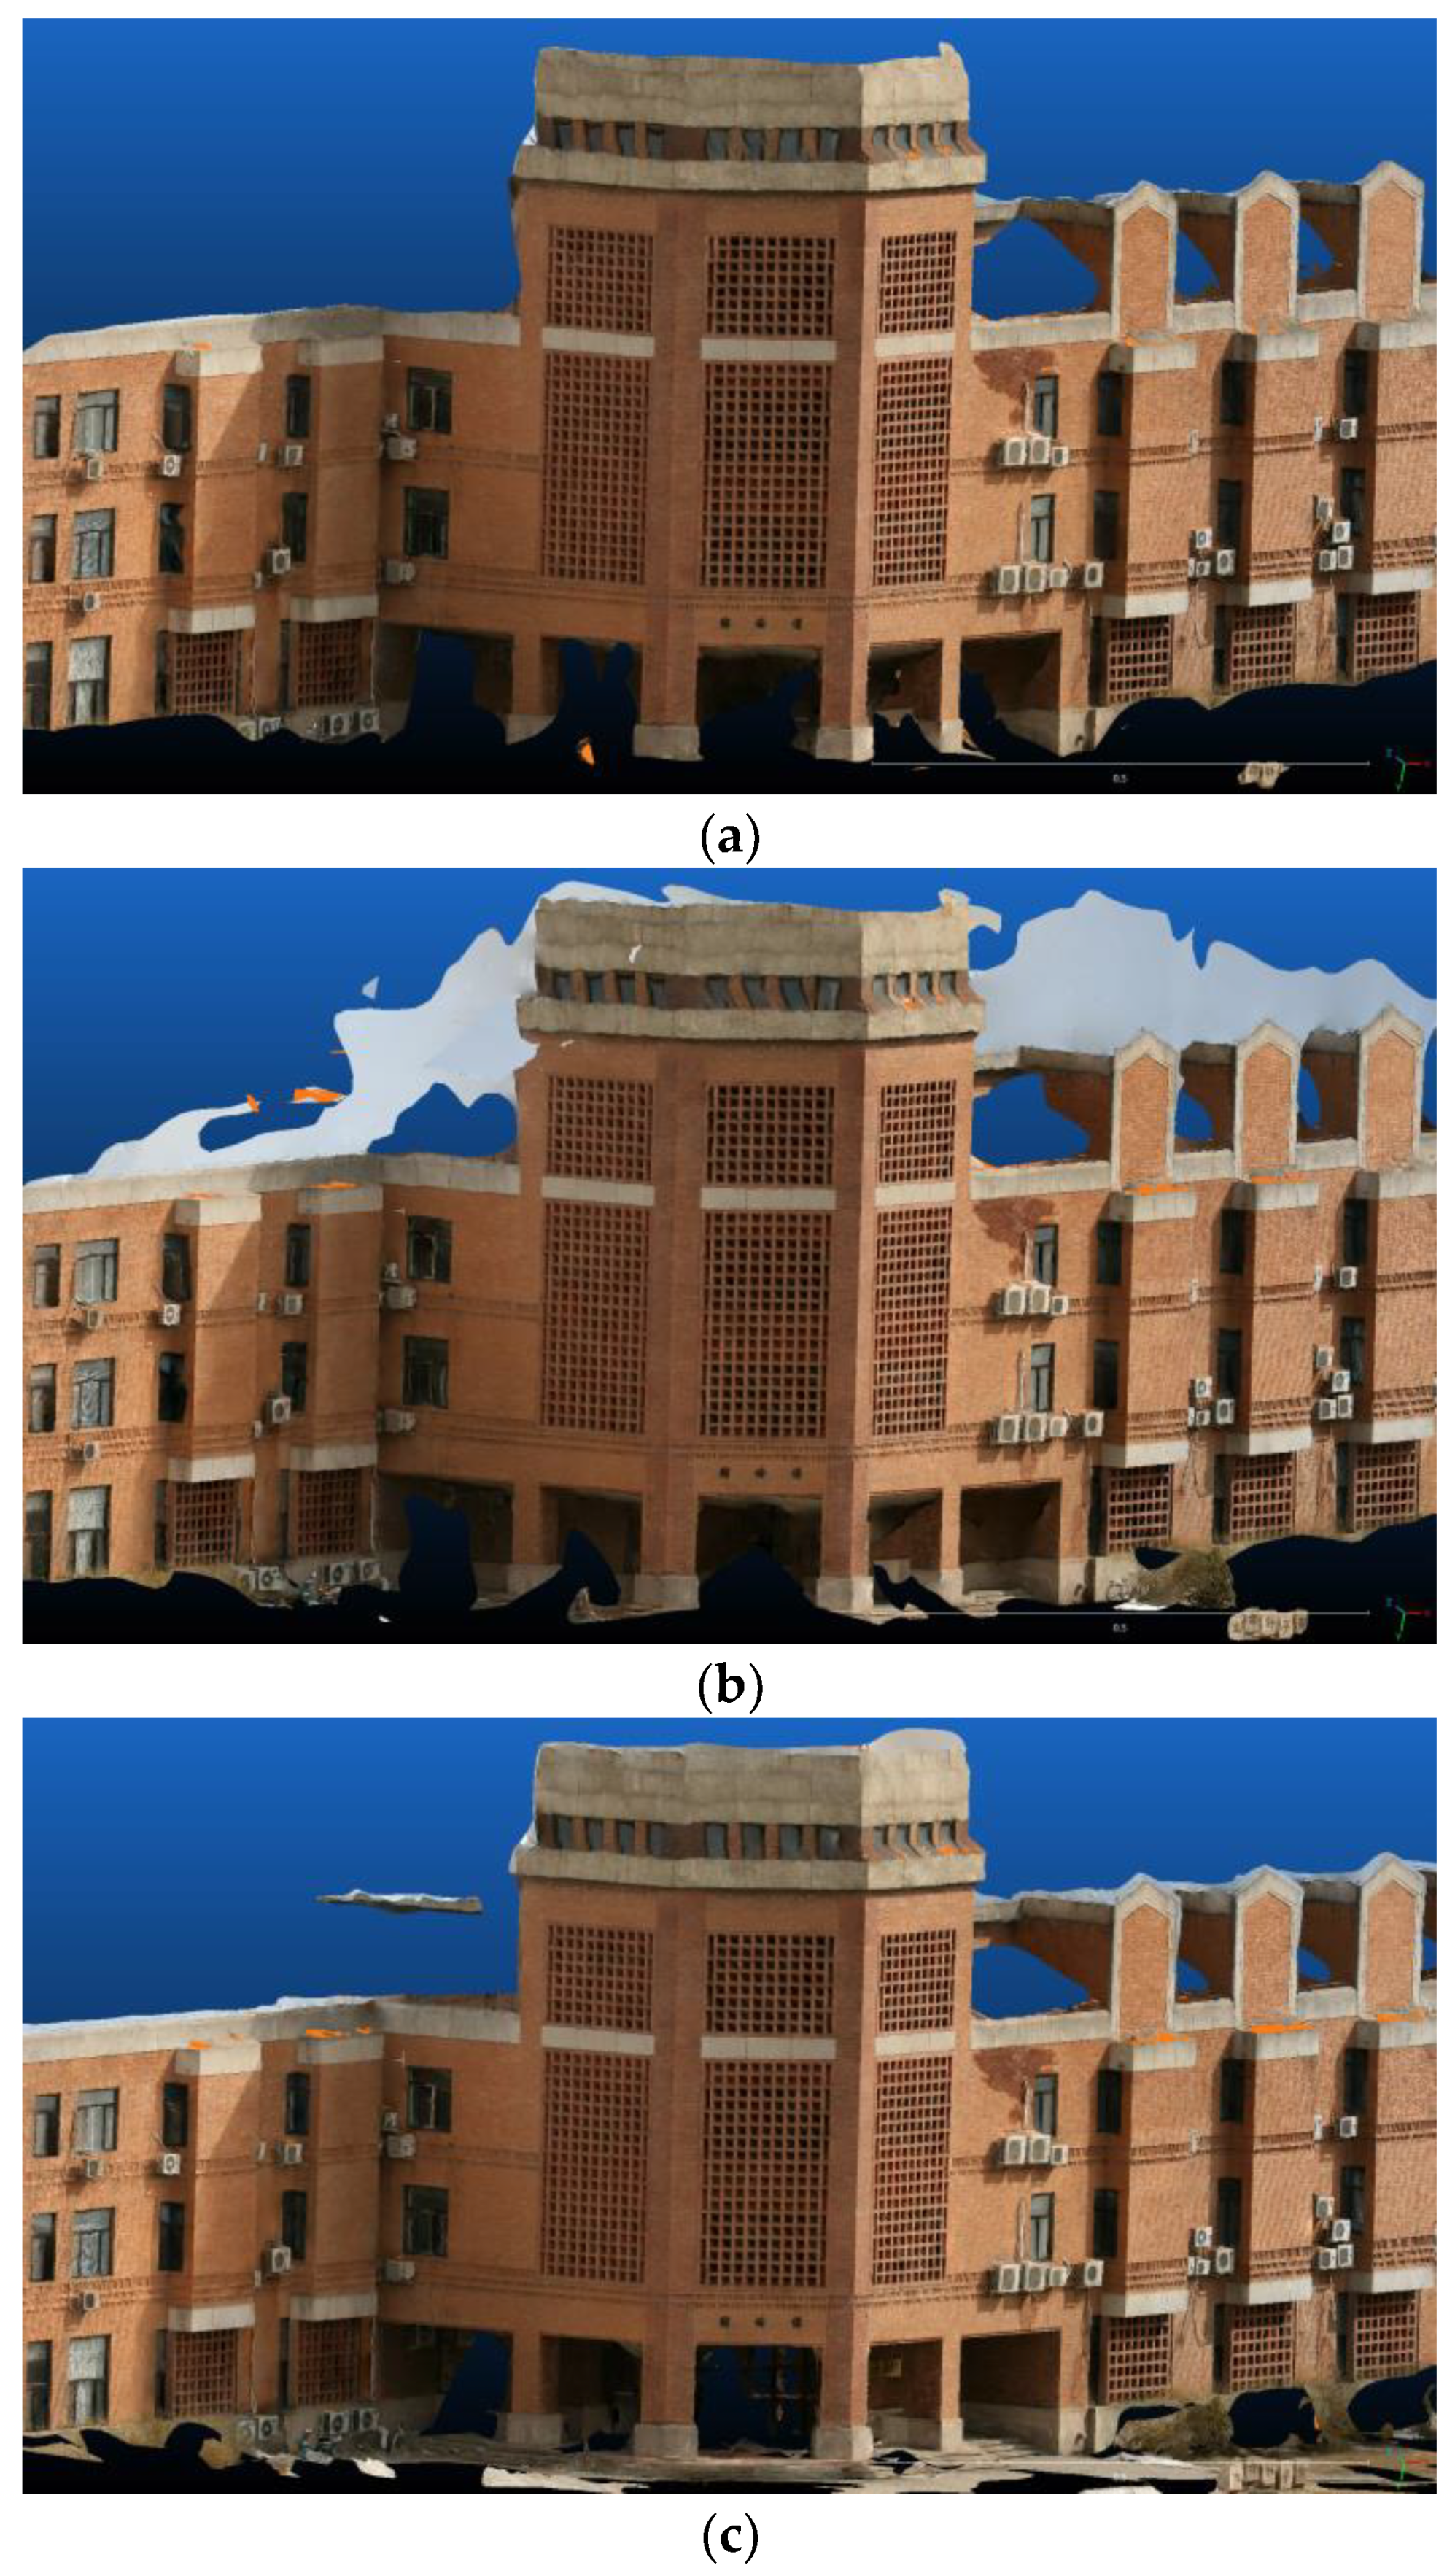
Figure 12 shows the reconstruction results of Tsinghua Xuetang as an example. We compared the sSGM method to the original SGM and PatchMatch methods. It is evident that in the point clouds obtained using the SGM and PatchMatch methods, the trees and building sides on both sides of the door are mixed together. However, the point cloud reconstructed by using the sSGM method can well separate the trees and building sides. Moreover, for the eaves of the building, the reconstruction error of the sSGM method is also smaller. We calculated the statistics related to the reconstruction accuracy of the three methods for the three datasets by performing an error analysis of the three models and averaging the results. The results are shown in Table 8.
As can be seen from Table 8, after adding semantics to the SGM method, the reconstruction accuracy is greatly improved, and the reconstruction results are better than the reconstruction results of the mainstream method PatchMatch. The max. distance may be affected by gross errors, so we compared the average distance. The accuracy of sSGM is 32.79% higher than the original SGM method, and 63.06% higher than the PatchMatch method. This is mainly reflected in the smaller distance error from the ground-truth mesh. The error caused by outliers is smaller. Our experimental results are therefore consistent with our theoretical design. After obtaining the dense point clouds, we performed a mesh reconstruction operation.
Figure 13 shows the results of mesh reconstruction from dense point clouds generated by three methods. We can find that compared to the original SGM method and the PatchMatch method, the point clouds obtained by the sSGM method have better results in the mesh reconstruction process. Buildings can be completely and independently reconstructed using the sSGM method. The original SGM method is insensitive to the location of depth mutations and inaccurately reconstructs a part of the sky at the edge of the building. The sSGM method that we proposed can well judge the depth continuity of adjacent pixels through the semantically optimized penalty term, so it can obtain high reconstruction accuracy at the edge of the building.
During the mesh reconstruction process, the point clouds obtained by sSGM can avoid simply connecting all points. Both the SGM method and the PatchMatch method inevitably reconstruct the building and other objects (such as bicycles, bushes, etc.) into a mesh as a whole. Thanks to the semantic information that we incorporated into the reconstruction process, the dense point clouds obtained by the sSGM method can improve the accuracy of subsequent mesh reconstruction.

4. Conclusions

In this study, we addressed the limitations present in the traditional multi-view 3D reconstruction process by proposing a semantic-based optimization method. Our approach was experimentally validated using a dataset comprising complex urban scenarios, which demonstrated the superiority of our semantic optimization. Initially, we selected a dataset comprising urban architectural objects. To acquire a semantic segmentation model for the city, we trained the model using the open-source Cityscapes dataset. As the original dataset’s focus differs from our areas of interest, we adjusted its categories by reducing the original 19 categories to 10. Our aim was twofold: firstly, we identified and separated dynamic targets in an urban environment that could significantly affect reconstruction accuracy, and secondly, we distinguished architecturally significant buildings needing detailed reconstruction from other elements in the setting. To ensure the precision of semantic segmentation, we compared three state-of-the-art (sota) methods, including DeepLab V3+, OCRNet, and Mask2former, for training and conducting validations using both the Cityscapes dataset and the reconstructed dataset. Ultimately, we chose the Mask2former network, which exhibits the highest accuracy. It achieved a pixel accuracy of 88% in the validation test using the Cityscapes dataset and 85% in the validation test using the reconstructed dataset, thus meeting the requirements for subsequent semantic reconstruction tasks. Following the acquisition of semantic maps corresponding to the images, we optimized the SfM process by segregating static and dynamic elements, while excluding dynamic targets (such as people and vehicles) and semantically inconsistent feature matches. This semantic optimization process generally enhanced the SfM’s accuracy. In the reconstruction results of the two scenarios, the overall accuracy improved by 49%. After obtaining more stable camera external parameters, we applied semantic optimization to the dense point cloud reconstruction. We semantically enhanced the classic SGM algorithm for dense reconstruction by semantically weighting a penalty term during cost computation. This improvement allowed for a better identification of depth discontinuities within the scenes. The sSGM method significantly improves the reconstruction accuracy of object boundaries. Through comparison with the ground-truth data from LiDAR scanning, it is evident that our semantically optimized sSGM reconstruction achieves an overall increase of 32.79% in accuracy compared to the original SGM reconstruction. Compared to the other mainstream algorithm PatchMatch, our method’s accuracy is 63.06% higher.
The performance of the method proposed in this paper depends on the number of categories included in semantic segmentation. A finer semantic segmentation enables a higher accuracy in reconstruction. Another factor that restricts the performance of our method is the influence of different individuals of the same category after semantic segmentation. In future work, we will attempt to classify more detailed semantic segmentation or instance segmentation.

Author Contributions

Conceptualization, R.W. and H.D.; methodology, R.W.; software, D.W.; validation, C.Z. and X.A.; formal analysis, X.A.; investigation, X.A.; resources, H.P.; data curation, R.W.; writing—original draft preparation, R.W.; writing—review and editing, H.D.; visualization, C.Z.; supervision, H.P.; project administration, R.W.; funding acquisition, H.P. All authors have read and agreed to the published version of the manuscript.

Funding

This research was funded by the Innovation Program CX-387 of the Shanghai Institute of Technical Physics.

Data Availability Statement

Data are contained within the article.

Acknowledgments

We are grateful to all anonymous reviewers for their constructive comments regarding this study.

Conflicts of Interest

The authors declare no conflicts of interest.

References

  1. Zhang, H.; Venkatramani, S.; Paz, D.; Li, Q.; Xiang, H.; Christensen, H.I. Probabilistic Semantic Mapping for Autonomous Driving in Urban Environments. Sensors 2023, 23, 6504. [Google Scholar] [CrossRef] [PubMed]
  2. Koulalis, I.; Dourvas, N.; Triantafyllidis, T.; Ioannidis, K.; Vrochidis, S.; Kompatsiaris, I. A survey for image based methods in construction: From images to digital twins. In Proceedings of the 19th International Conference on Content-Based Multimedia Indexing, Graz, Austria, 14–16 September 2022; pp. 103–110. [Google Scholar]
  3. Wang, X.; Bao, C.; Sun, Z.; Wang, X. Research on the application of digital twin in aerospace manufacturing based on 3D point cloud. In Proceedings of the 2022 International Conference on Electronics and Devices, Computational Science (ICEDCS), Marseille, France, 20–22 September 2022; pp. 308–313. [Google Scholar]
  4. De Marco, R.; Galasso, F. Digital survey and 3D virtual reconstruction for mapping historical phases and urban integration of the fortified gates in the city of Pavia, Italy. In Defensive Architecture of the Mediterranean: Vol. XV; Pisa University Press: Pisa, Italy, 2023. [Google Scholar]
  5. Muenster, S. Digital 3D Technologies for Humanities Research and Education: An Overview. Appl. Sci. 2022, 12, 2426. [Google Scholar] [CrossRef]
  6. Ren, R.; Fu, H.; Xue, H.; Sun, Z.; Ding, K.; Wang, P. Towards a Fully Automated 3D Reconstruction System Based on LiDAR and GNSS in Challenging Scenarios. Remote Sens. 2021, 13, 1981. [Google Scholar] [CrossRef]
  7. Guo, Z.; Liu, H.; Pang, L.; Fang, L.; Dou, W. DBSCAN-based point cloud extraction for Tomographic synthetic aperture radar (TomoSAR) three-dimensional (3D) building reconstruction. Int. J. Remote Sens. 2021, 42, 2327–2349. [Google Scholar] [CrossRef]
  8. Mele, A.; Vitiello, A.; Bonano, M.; Miano, A.; Lanari, R.; Acampora, G.; Prota, A. On the joint exploitation of satellite DInSAR measurements and DBSCAN-Based techniques for preliminary identification and ranking of critical constructions in a built environment. Remote Sens. 2022, 14, 1872. [Google Scholar] [CrossRef]
  9. Jung, S.; Lee, Y.-S.; Lee, Y.; Lee, K. 3D Reconstruction Using 3D Registration-Based ToF-Stereo Fusion. Sensors 2022, 22, 8369. [Google Scholar] [CrossRef] [PubMed]
  10. Zhao, L.; Wang, H.; Zhu, Y.; Song, M. A review of 3D reconstruction from high-resolution urban satellite images. Int. J. Remote Sens. 2023, 44, 713–748. [Google Scholar] [CrossRef]
  11. Jin, Y.; Jiang, D.; Cai, M. 3d reconstruction using deep learning: A survey. Commun. Inf. Syst. 2020, 20, 389–413. [Google Scholar] [CrossRef]
  12. Samavati, T.; Soryani, M. Deep learning-based 3D reconstruction: A survey. Artif. Intell. Rev. 2023, 56, 9175–9219. [Google Scholar] [CrossRef]
  13. Murtiyoso, A.; Pellis, E.; Grussenmeyer, P.; Landes, T.; Masiero, A. Towards semantic photogrammetry: Generating semantically rich point clouds from architectural close-range photogrammetry. Sensors 2022, 22, 966. [Google Scholar] [CrossRef]
  14. Li, X.; Liu, S.; Kim, K.; De Mello, S.; Jampani, V.; Yang, M.-H.; Kautz, J. Self-supervised single-view 3d reconstruction via semantic consistency. In Proceedings of the Computer Vision–ECCV 2020: 16th European Conference, Glasgow, UK, 23–28 August 2020; pp. 677–693. [Google Scholar]
  15. Hou, J.; Dai, A.; Nießner, M. 3d-sis: 3D semantic instance segmentation of rgb-d scans. In Proceedings of the IEEE/CVF Conference on Computer Vision and Pattern Recognition, Long Beach, CA, USA, 15–20 June 2019; pp. 4421–4430. [Google Scholar]
  16. Rong, M.; Shen, S. 3D Semantic Segmentation of Aerial Photogrammetry Models Based on Orthographic Projection. IEEE Trans. Circuits Syst. Video Technol. 2023, 33, 7425–7437. [Google Scholar] [CrossRef]
  17. Menini, D.; Kumar, S.; Oswald, M.R.; Sandström, E.; Sminchisescu, C.; Gool, L.V. A Real-Time Online Learning Framework for Joint 3D Reconstruction and Semantic Segmentation of Indoor Scenes. IEEE Robot. Autom. Lett. 2022, 7, 1332–1339. [Google Scholar] [CrossRef]
  18. Croce, V.; Caroti, G.; De Luca, L.; Jacquot, K.; Piemonte, A.; Véron, P. From the semantic point cloud to heritage-building information modeling: A semiautomatic approach exploiting machine learning. Remote Sens. 2021, 13, 461. [Google Scholar] [CrossRef]
  19. Li, L.; Tang, L.; Zhu, H.; Zhang, H.; Yang, F.; Qin, W. Semantic 3D modeling based on CityGML for ancient Chinese-style architectural roofs of digital heritage. ISPRS Int. J. Geo-Inf. 2017, 6, 132. [Google Scholar] [CrossRef]
  20. Huang, R.; Xu, Y.; Hoegner, L.; Stilla, U. Semantics-aided 3D change detection on construction sites using UAV-based photogrammetric point clouds. Autom. Constr. 2022, 134, 104057. [Google Scholar] [CrossRef]
  21. Wang, T.; Wang, Q.; Ai, H.; Zhang, L. Semantics-and-Primitives-Guided Indoor 3D Reconstruction from Point Clouds. Remote Sens. 2022, 14, 4820. [Google Scholar] [CrossRef]
  22. Häne, C.; Zach, C.; Cohen, A.; Pollefeys, M. Dense Semantic 3D Reconstruction. IEEE Trans. Pattern Anal. Mach. Intell. 2017, 39, 1730–1743. [Google Scholar] [CrossRef]
  23. Blaha, M.; Vogel, C.; Richard, A.; Wegner, J.D.; Pock, T.; Schindler, K. Large-scale semantic 3d reconstruction: An adaptive multi-resolution model for multi-class volumetric labeling. In Proceedings of the IEEE Conference on Computer Vision and Pattern Recognition, Las Vegas, NV, USA, 27–30 June 2016; pp. 3176–3184. [Google Scholar]
  24. Xu, W.; Zeng, Y.; Yin, C. 3D City Reconstruction: A Novel Method for Semantic Segmentation and Building Monomer Construction Using Oblique Photography. Appl. Sci. 2023, 13, 8795. [Google Scholar] [CrossRef]
  25. Zhou, B.; Zhao, H.; Puig, X.; Fidler, S.; Barriuso, A.; Torralba, A. Scene parsing through ade20k dataset. In Proceedings of the IEEE Conference on Computer Vision and Pattern Recognition, Honolulu, HI, USA, 21–26 July 2017; pp. 633–641. [Google Scholar]
  26. Reddy, N.D.; Singhal, P.; Chari, V.; Krishna, K.M. Dynamic body vslam with semantic constraints. In Proceedings of the 2015 IEEE/RSJ International Conference on Intelligent Robots and Systems (IROS), Hamburg, Germany, 28 September–3 October 2015; pp. 1897–1904. [Google Scholar]
  27. Moulon, P.; Monasse, P.; Perrot, R.; Marlet, R. OpenMVG: Open multiple view geometry. In Proceedings of the International Workshop on Reproducible Research in Pattern Recognition, Cancún, Mexico, 4 December 2016; pp. 60–74. [Google Scholar]
  28. Cernea, D. OpenMVS: Multi-View Stereo Reconstruction Library. Available online: https://github.com/cdcseacave/openMVS (accessed on 28 December 2023).
  29. Group, M.V.R. 3D Reconstruction Dataset. Available online: http://vision.ia.ac.cn/data (accessed on 28 December 2023).
  30. Cordts, M.; Omran, M.; Ramos, S.; Rehfeld, T.; Enzweiler, M.; Benenson, R.; Franke, U.; Roth, S.; Schiele, B. The cityscapes dataset for semantic urban scene understanding. In Proceedings of the IEEE Conference on Computer Vision and Pattern Recognition, Las Vegas, NV, USA, 27–30 June 2016; pp. 3213–3223. [Google Scholar]
  31. Schönberger, J.L.; Frahm, J.M. Structure-from-Motion Revisited. In Proceedings of the 2016 IEEE Conference on Computer Vision and Pattern Recognition (CVPR), Las Vegas, NV, USA, 27–30 June 2016; pp. 4104–4113. [Google Scholar]
  32. Hirschmuller, H. Stereo Processing by Semiglobal Matching and Mutual Information. IEEE Trans. Pattern Anal. Mach. Intell. 2008, 30, 328–341. [Google Scholar] [CrossRef]
  33. Wan, Y.; Miao, Z.; Wu, Q.M.J.; Wang, X.; Tang, Z.; Wang, Z. A Quasi-Dense Matching Approach and its Calibration Application with Internet Photos. IEEE Trans. Cybern. 2015, 45, 370–383. [Google Scholar] [CrossRef]
  34. Contributors, M. MMSegmentation: Openmmlab Semantic Segmentation Toolbox and Benchmark. Available online: https://github.com/open-mmlab/mmsegmentation (accessed on 28 December 2023).
  35. Chen, L.-C.; Zhu, Y.; Papandreou, G.; Schroff, F.; Adam, H. Encoder-decoder with atrous separable convolution for semantic image segmentation. In Proceedings of the European Conference on Computer Vision (ECCV), Munich, Germany, 8–14 September 2018; pp. 801–818. [Google Scholar]
  36. Yuan, Y.; Chen, X.; Wang, J. Object-contextual representations for semantic segmentation. In Proceedings of the Computer Vision–ECCV 2020: 16th European Conference, Glasgow, UK, 23–28 August 2020; pp. 173–190. [Google Scholar]
  37. Li, P.; Wang, M.; Zhou, D.; Lei, W. A pose measurement method of a non-cooperative spacecraft based on point cloud feature. In Proceedings of the 2020 Chinese Control and Decision Conference (CCDC), Hefei, China, 22–24 August 2020; pp. 4977–4982. [Google Scholar]
  38. Cheng, B.; Schwing, A.; Kirillov, A. Per-pixel classification is not all you need for semantic segmentation. Adv. Neural Inf. Process. Syst. 2021, 34, 17864–17875. [Google Scholar]
  39. Cheng, B.; Misra, I.; Schwing, A.G.; Kirillov, A.; Girdhar, R. Masked-attention mask transformer for universal image segmentation. In Proceedings of the IEEE/CVF Conference on Computer Vision and Pattern Recognition, New Orleans, LA, USA, 18–24 June 2022; pp. 1290–1299. [Google Scholar]
Figure 1. The flowchart of semantic-based 3D reconstruction.
Applsci 14 02218 g001
Figure 2. Feature matching filtering based on semantic consistency. The purple points represent the feature points of dynamic targets in the scene.
Applsci 14 02218 g002
Figure 3. General overview of the semantic-based SGM.
Applsci 14 02218 g003
Figure 4. Cost aggregation of 8 paths: (a) grayscale-based cost and (b) semantic-based cost; gray pixels represent buildings, green pixels represent vegetation, purple pixels represent people, yellow pixels represent static-other, red pixels represent bicycles, and blue pixels represent sky.
Applsci 14 02218 g004
Figure 5. Three-dimensional reconstruction data and semantic segmentation results: (a) Tsinghua University’s Old Gate, and (b) semantic segmentation results using Mask2Former.
Applsci 14 02218 g005
Figure 6. Comparison of the accuracy of three semantic segmentation networks: (a) validation accuracy using the Cityscape dataset, and (b) validation accuracy using the 3D reconstructed dataset.
Applsci 14 02218 g006
Figure 7. Sparse point cloud reconstruction results: (a) the sparse point cloud of the Old Gate reconstructed using the original SfM; (b) the sparse point cloud of the Tsinghua Life Sciences Building reconstructed using the original SfM; (c) the sparse point cloud of the Old Gate reconstructed using semantic SfM based on static and dynamic separation; and (d) the sparse point cloud of the Life Sciences Building reconstructed using semantic SfM based on static and dynamic separation.
Applsci 14 02218 g007
Figure 8. Visualization of sparse point cloud accuracy evaluation results: (a) Tsinghua University’s Old Gate and (b) Tsinghua Life Sciences Building. In the color transitions from blue to green to red, blue indicates smaller errors and red indicates larger errors. The assignment of colors was based on relative error values.
Applsci 14 02218 g008
Figure 9. Semantic-based feature matching: (a) semantically inconsistent mismatched point pairs; (b) feature point matching pairs of dynamic targets in the scene; and (c) feature point matching results after semantic optimization.
Applsci 14 02218 g009
Figure 10. Dense point cloud reconstruction results: (a) the dense point cloud of the Tsinghua Life Sciences Building reconstructed using the original SGM; and (b) the dense point cloud of the Life Sciences Building reconstructed using sSGM based on semantics. Yellow points represent buildings, green points represent vegetation, gray points represent static-other, dark blue points represent bicycles, and light blue points represent sky.
Applsci 14 02218 g010
Figure 11. Comparison of results of dense reconstruction of Tsinghua Life Sciences Building: (a) reconstruction results using the original SGM method and without post-processing; (b) reconstruction results using the semantic-based sSGM method and without post-processing; (c) reconstruction results using the original SGM method and with filtering; and (d) reconstruction results using the semantic-based sSGM method and with filtering.
Applsci 14 02218 g011
Figure 12. Comparison of results of dense reconstruction of Tsinghua Xuetang: (a) ground truth; (b) reconstruction results using the sSGM method; (c) reconstruction results using the original SGM method; and (d) reconstruction results using the PatchMatch method. The transition from blue to green and then to red signifies a gradation of error from minimal to maximal.
Applsci 14 02218 g012aApplsci 14 02218 g012b
Figure 13. Comparison of results of mesh reconstruction of Tsinghua Life Sciences Building: (a) reconstruction results using the sSGM method; (b) reconstruction results using the original SGM method; and (c) reconstruction results using the PatchMatch method.
Applsci 14 02218 g013
Table 1. Classification of the Cityscapes dataset.
GroupClasses
flatroad · sidewalk · parking+ · rail track+
humanperson · rider
vehiclecar · truck · bus · on rails · motorcycle · bicycle · caravan+ · trailer+
constructionbuilding · wall · fence · guard rail+ · bridge+ · tunnel+
objectpole · pole group+ · traffic sign · traffic light
naturevegetation · terrain
skysky
voidground+ · dynamic+ · static+
Table 2. Redefined semantic segmentation classes.
Old ClassesNew Classes
road · sidewalk · parking+ · rail track+ · ground+ flat
person · riderhuman
car · truck · bus · on rails · caravan+ · trailer+vehicle
motorcycle · bicyclecycle
building · wall · fence · guard rail+ · bridge+ · tunnel+construction
pole · pole group+ · traffic sign · traffic lightobject
vegetation · terrainnature
Skysky
dynamicdynamic-other
staticstatic-other
Table 3. Experimental platform configuration.
NameConfiguration
OSUbuntu 20.04
GPUNVIDIA TITAN RTX (Santa Clara, CA, USA)
CPUIntel i9-10900k (Santa Clara, CA, USA)
CUDACuda 11.3 (NVIDIA, Santa Clara, CA, USA)
RAM32 G
Deep Learning FrameworkPytorch 1.12
Python3.8
Table 4. Semantic segmentation accuracy of the Mask2Former network when validated on the 3D reconstructed dataset.
ClassIoUAcc
flat78.1382.55
construction91.0597.79
pole25.2954.55
vegetation88.9692.62
sky97.4198.39
human90.9796.61
vehicle55.7390.34
bicycle72.1284.01
static-other42.2951.56
dynamic-other30.6862.11
Table 5. Sparse reconstruction accuracy comparison.
Old GateLife Sciences Building
SfMSem-SfMSfMSem-SfM
Alignment accuracy (RMS)0.0880.150.120.11
Max. distance3.1881.739377.846463
Average distance0.1638560.090.43650.1995
Sigma0.3002480.123.34723.146
Max. error0.04940420.0481.6112.07
Table 6. Semantic statistical analysis of feature points.
CategoryOld GateLife Sciences Building
Sky36101909
Human254863
Vehicle30830
Cycle1514442
Dynamic-other5953501
Sum feature point284,2522,324,635
Instability point in landmark6.59%6.91%
Table 7. Dense reconstruction accuracy comparison.
Old GateLife Sciences BuildingXuetang
SGMsSGMSGMsSGMSGMsSGM
Alignment accuracy (RMS)0.110.120.0980.0980.0780.11
Max. distance28.56.6610.0049.923.82.48
Average distance0.0850.0840.0770.0240.0210.016
Sigma0.4350.120.6460.1730.110.08
Max. error0.180.0480.2280.220.150.144
Table 8. Comparison of dense reconstruction accuracy of different methods.
SGMsSGMPatchMatch
Max. distance14.1016.35316.843
Average distance0.0610.0410.111
Sigma0.3970.1240.629
Max. error0.1860.1370.205
Disclaimer/Publisher’s Note: The statements, opinions and data contained in all publications are solely those of the individual author(s) and contributor(s) and not of MDPI and/or the editor(s). MDPI and/or the editor(s) disclaim responsibility for any injury to people or property resulting from any ideas, methods, instructions or products referred to in the content.

