Abstract
A high temperature is the key factor limiting the safe development of deep mine tunnels. By confronting the phenomenon of serious heat exchange between airflow and the surrounding rocks in the tunnel excavation area, a conceptual model of coupled cooling of auxiliary ventilation and partial thermal insulation is proposed. The performance of a coupled cooling system was investigated and optimized by using the scale model test with a 1:10 geometric scale and the orthogonal test. The results suggest that the average temperatures of the work zone and its central point decrease by 1.5 °C and 3.3 °C, respectively, while partial insulation layers are used. According to the sensitivity analysis for a single factor, as the ventilation duct outlet (VDO) moves away from the working face (WF), the temperature gradually increases, leading to a local high temperature area. When the ventilation duct height is arranged in the middle of the insulation layer, the cooling effect is optimal and the highest average temperature difference is 4.4 °C. The thermal equilibrium temperature can be further decreased by lengthening and thickening the insulation layer. In addition, the range analysis shows that the ventilation velocity has a greater impact on the thermal environment of the tunnel working area than the ventilation duct location and insulation layer length. The coupled cooling method can save on cooling capacity and effectively alleviate the high-temperature problems of the tunnel excavation area.
1. Introduction
With the expansion of national infrastructure and the deepening of natural resource exploitation, there are high-temperature phenomena in the construction of railroads [1] and deep mine [2] tunnels with abnormal geothermal properties. Significant harm is caused to workers’ health when they operate in high-temperature environments, and this will result in rising heart rates [3] and body temperature [4] and increase the incidence of various diseases [5]. The maximum allowable working temperature in Germany, South Africa, China, the United States, Poland, and several other nations is usually set at around 30 °C [6]. However, in many underground space projects, the rock and ambient temperatures have exceeded the specified values, such as in the Dongguashan copper mine [7], the Meihuajing coal mine [8], and the Gaoligongshan tunnel [9].
In mine tunnels, ventilation and insulation are two common methods for reducing heat hazards [10]. Ventilation is not only responsible for decreasing the temperature, but it is also a necessary method to transfer contaminants and dust inside the tunnel. There is a complicated heat and mass transfer issue that develops in a tunnel with auxiliary ventilation as a result of the newly introduced airflow that transfers heat to the surrounding rock and the air inside the tunnel. A large number of scholars conducted extensive research about the laws of ventilation and cooling. Wang [11] investigated the influence of various ventilating parameters with the control of heat hazards due to concrete hydration during construction and obtained the optimal ventilation rate and time that can meet the cooling requirements of the WF. Xu et al. [12] took into account the impacts of groundwater flow and buoyancy on tunnel ventilation heat transfer laws in order to make tunnel thermal environment prediction more accurate. Sun et al. [13] studied how complex heat transfer affected the air temperature of subway tunnels by building a numerical model, and their findings revealed that the air temperature was positively and linearly related to the internal heat source and ambient temperature. Wang et al. [14] constructed a scale model tunnel and considered the temperature distribution under natural ventilation in a closed tunnel, and then they proposed a temperature correction prediction model including factors such as blockage and heat release rate.
However, there is a limit to ventilation and cooling. If the temperature cannot meet the requirements, the project must increase the air volume or use mechanical refrigeration. Therefore, various cooling systems were created and used in tunnel cooling [15,16]. Zhang et al. [17] analyzed the effects of ice cubes and spray refrigeration on the environmental regulation of deep tunnels through field monitoring and numerical simulation. Pretorius et al. [18] proposed a wisdom model based on data information and utilized it for mine cooling control, which promoted a 55% improvement in the cooling load. Guo et al. [19] developed a cooling system that exploits return airflow from a deep well as its cooling source and conducted field tests, determining that the system for cooling can lower the airflow temperature by 8 to 12 °C at WF, providing a basis for the cooling method in deep mines. Although these methods can be good for lowering the temperature inside a tunnel, the cooling capacity may be significantly wasted and affect the thermal comfort of the workers.
For thermal insulation, it is a common practice to spray special concrete or to set up a thermal insulation layer (TIL). Wang et al. [20] analyzed how the materials of thermal insulation affect heat transfer by building a mathematical model, and based on that, they found the optimum thickness for the insulating layer according to the economic cost and insulating effect. Liu et al. [21] demonstrated the beneficial effects of the insulating layer covered on the building surface in underground tunnels by developing a mathematical model. Kang et al. [22] investigated the tunnel temperature distribution both with and without an insulating layer, and their research came to the conclusion that an insulation layer improves the effect of heat insulation in high-temperature tunnels noticeably, but the insulating effect drops sharply with the increase in the rock temperature. Chen et al. [23] studied the impact of non-water-reactive polymers for high-geothermal tunnel insulation. The findings demonstrated that the temperature of the surrounding rock increased with thermal conductivity and polymer thickness. Zhang et al. [24] applied field experiments and numerical simulations to determine the response characteristics of a thermal environment for a wall rock that has an air layer structure. Even though using an insulation layer has a significant cooling effect on the tunnel, it is obviously not economical to follow the tunnel excavation and lay the whole tunnel. Furthermore, many tunnels extend several hundred meters or even thousands of meters in actual projects. It was found in previous studies that the heat exchange between the palisades and airflow in a tunnel operation area is small due to the low airflow velocity [25]. On the contrary, the heat exchange is strong and rapid in the excavation area owing to more intense airflow and temperature changes in the surrounding rock [26]. As a result, using a technical method that combines ventilation and thermal insulation is a possible solution for coupled cooling and to deal with the prominent heat hazards in an excavation area. And the establishment of partial insulation can effectively lower the cost of the initial construction.
Based on the actual condition of the project, a conceptual model of a coupled cooling system for auxiliary ventilation and partial thermal insulation (PTI) is proposed. As shown in Figure 1a, a movable TIL is set within 6 m of the WF to avoid direct heat transfer between the airflow and high-temperature rock as well as to better realize the PTI effect. There are pulleys arranged at the bottom of the PTI unit. When workers are working, the movable TIL is near the WF at the same time as them. As the operations, such as drilling and loading explosives, are concluded, the PTI unit returns to the safe area together with the workers and waits for the stage after blasting. A heat exchange layer is set up outside the thermal insulation, and cold water is delivered to the inside of the insulation through the constant temperature water unit to further reduce the temperature. On the one hand, the PTI can avoid the wastage generated by the overall installation of insulation and reuse movable TIL, and on the other, it can enhance ventilation and cooling effects, preserve the airflow cooling capacity, and promote the decline in the cooling limit.
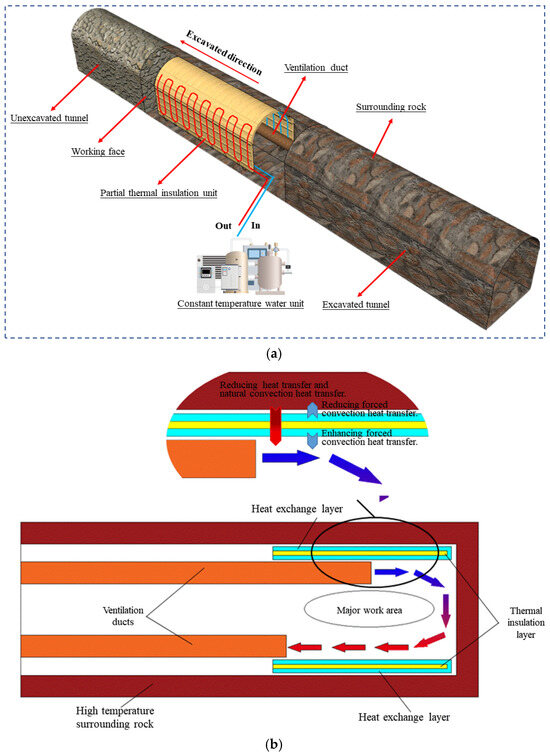
Figure 1.
A schematic diagram of a coupled cooling system for auxiliary ventilation and PTI. (a) The partial thermal insulation (PTI) scheme. (b) A conceptual model of a coupled cooling system for ventilation and PTI.
In this study, the principle of coupled cooling is analyzed. To comprehensively explore the thermal performance of a coupled cooling system in a tunnel, a scale model test platform was constructed. With local insulation layers used in the working area of a high-temperature mine tunnel, the variation law of ambient temperature under pivotal factors was investigated, including the ventilation volume, the length and thickness of the insulation layer, ventilation duct height, and the distance between the VDO and WF. And then the orthogonal test was used to investigate the experiment and assess the impacts of different factors on the tunnel’s thermal environment. This research provides a theoretical foundation and technical guidance to improve the cooling effect of deep mine tunnels in an effective and economical manner as well as enhance the thermal comfort levels of workers.
2. Conceptual Model and Test Method
2.1. Conceptual Model of Coupled Cooling System
The heat exchange forms of the underground heading face are mainly heat conduction and heat convection. The heat transfer between a human body, mechanical equipment, and palisades is inevitable, but it has less impact on the ambient temperature than the heat dissipation of the high temperature of surrounding rocks. The main heat transfer processes include heat conduction and natural convection heat transfer of the air between the high-temperature rock and WF; forced convection heat transfer between the high-temperature surrounding rock and airflow; and forced convection heat transfer between cold airflow and the air in the work area. The environment temperature could be lowered by controlling heat damage. It is necessary to reduce the heat released by , , and while increasing the heat exchanged by to take full advantage of the cooling capacity of the cold airflow. In order to achieve this goal, a conceptual model of a coupled cooling system for ventilation and PTI in a mine heading roadway was proposed, as presented in Figure 1b.
The coupled cooling concept model works as follows: The ventilation device delivers low-temperature airflow to the WF to realize the cooling function of . In the PTI part, the insulation layer using low-thermal conductivity materials is arranged between the VDO and the surrounding rock. The TIL can reduce and . Simultaneously, the PTI layers prevent the airflow from coming into direct contact with the nearby hot rock, thereby weakening . The heat exchange layer with cold water delivery is attached to the interior and exterior surfaces of the PTI layers. On the one hand, the heat exchange layer can exchange heat with the high-temperature rock surface to weaken the effects of and , and on the other hand, it can provide cooling capacity to the airflow and conduct forced convection heat transfer to promote the cooling effect of .
2.2. Scaling Theory
To reasonably explore the influence of each parameter on the coupling cooling effect of ventilation and PTI, a scale model test platform was built. The heat exchange between the airflow and the high-temperature rock near the WF was studied in the coupled cooling experiments. Because of the large influence that pressure has on airflow, the Reynolds number and Archimedes number were primarily considered [8,27]. When analyzing the heat transfer of airflow, the Prandtl number was almost constant [28,29]. Furthermore, the impacts of thermal conductivity, buoyancy, inertia force, and convective heat transfer coefficient on the flow and temperature fields were taken into account [30]. Table 1 displays the key parameters used for the scaled model tests.

Table 1.
Scale model test parameters.
2.3. Physics Test Platform
In the scale model test platform, the axial fan is used to supply air. The ventilation duct is connected to the tunnel through the reducer, and the duct diameter is adjusted to 0.05 m. The tunnel is a traditional arch, 1 m long, 0.3 m wide, 0.28 m high, and 0.18 m high on both sides of the surrounding rock. The temperature rises by regulating an electric heating belt, which uniformly wraps around the outside of the tunnel model. The temperature controller is connected to the surrounding rock to monitor and adjust the temperature range. Insulation cotton is wrapped around the outermost of the tunnel model to prevent heat from dissipating too quickly. In addition, a 1 m virtual tunnel is established to minimize the impact of the boundary conditions. Regarding the monitoring component, thermocouples are arranged in the tunnel’s working area and linked to the Keysight DAQ970A data acquisition system for temperature monitoring. The air velocity of the ventilation duct is adjusted using the Fluke 923 anemometer. Figure 2a depicts the layout of the test platform. The distribution of each temperature monitoring location is shown in Figure 2b. Monitoring stations 101 to 108 are 0.2 m above the floor, whereas stations 109 to 118 are 0.1 m above the floor. The sensors were calibrated before the experiment. And the data scan interval for all monitoring locations is 1 s.
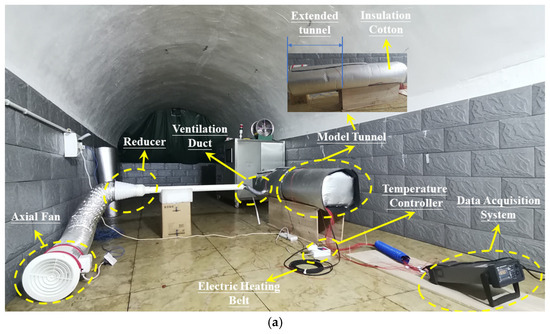
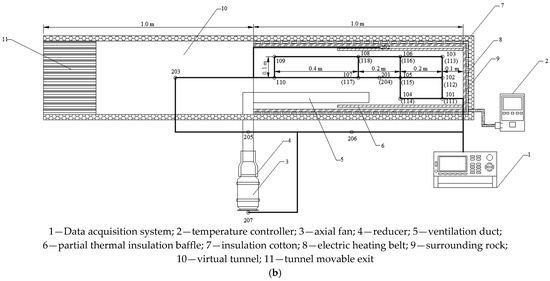
Figure 2.
Physics test for coupled cooling of ventilation and PTI. (a) Test platform. (b) Distribution of temperature monitoring locations on test platform.
2.4. Test Processes
There are two main aspects of the test. The first aspect is the comparison of the cooling limits of ventilation with and without thermal insulation to determine the efficiency of PTI. The second aspect is the test of each layout in the coupled cooling device to clarify the effect of each parameter on PTI performance. During the experiments, the ambient average temperature was 16.5 °C, and the surrounding rock temperature was maintained at 40 °C. Every group had basic temperatures that were similar as much as feasible. When heating the surrounding rock, the experiment can begin once the sensor in the tunnel with the slowest temperature rise meets the requirements. Figure 3 depicts the test process, and Table 2 contains a list of the experimental variables.
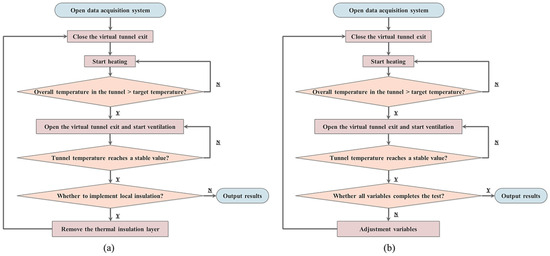
Figure 3.
The test processes. (a) The comparison of the cooling limit of ventilation with and without thermal insulation; (b) The test of each layout in the coupled cooling device of ventilation and partial thermal insulation. Y—yes, N—no.
Table 2.
Test variables.
3. Result and Discussion
3.1. The Effect of the Presence or Absence of PTI
In a tunnel with auxiliary ventilation, the airflow in the vicinity of the WF is particularly complicated. The low-temperature airflow blown out of the ventilation duct flows to the tunnel outlet after passing over the WF. Due to the relatively high airflow velocity on both sides of the tunnel, there is a significant heat convection between the wall rock and the wind flow [25], and the temperature of the newly pressed airflow increases sharply in this part. However, the PTI layer can avoid the high ambient temperature caused by this phenomenon. In the test, the ventilation and cooling conditions of the working area with or without PTI layers were tested. The inlet air temperature was 16.5 °C, the air velocity at VDO was 7.5 m/s, the air duct was suspended at a height of 0.025 m, and the average temperature of the working area (ATWA) was obtained from the average temperature of sensors 101 to 108 and 111 to 118. As shown in Figure 4, the ATWA varied as the ventilation time increased.
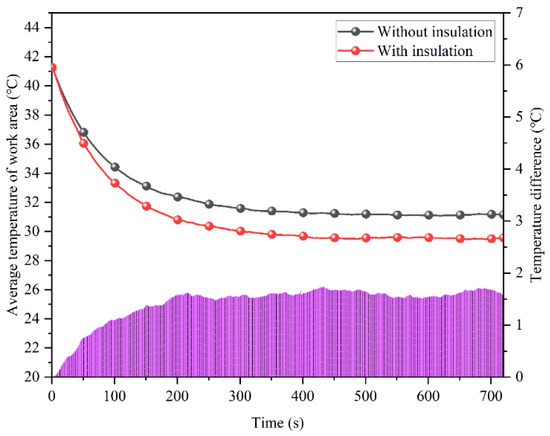
Figure 4.
The ATWA changes with the ventilation time.
After a period of ventilation, the temperature of the working space, with or without a TIL, approached a stable value. It is obvious that the tunnel with the PTI layer had a lower ultimate stable temperature. From the temperature difference represented by the striped area at the bottom of the picture, the temperature difference in the tunnel with and without insulation increased gradually at the beginning of auxiliary ventilation and finally reached a plateau at 1.5 °C. The low-temperature airflow was ejected from the ventilation ducts to cool the internal air of tunnel. With continuous cooling, the temperature difference gradually decreased, so the cooling rate decreased and eventually converged to a thermal equilibrium state. In partially insulated tunnels, the insulation layer isolates the airflow from the high-temperature rock in the area with the highest airflow velocity. Since there is a phenomenon where the surrounding rock is unable to transfer heat directly to the airflow, which prompts the airflow to have enough cooling capacity to exchange heat with the air inside the tunnel, the internal environment can stabilize at a much lower temperature.
3.2. The Temperature Field Distribution
Some temperature monitoring locations in the test were selected to analyze the partial insulation tunnel temperature field distribution. Figure 5a shows that the cooling effect of PTI on the final temperatures of the upper monitoring locations was more obvious, while in the lower monitoring location, only the temperature of sensor 115 had a drop of 2.3 °C. The temperatures of sensors 111 and 118 dropped faster when there was insulation, but their respective equilibrium temperatures were the same in both cases. This is because the ventilation duct was arranged at a low level, so that the cooling capacity of the airflow was sufficient to cool the lower location, and the temperatures of sensors 111 and 118 reached the current limit value. If the temperature is to be further reduced, other ventilation parameters can only be changed. When thermal equilibrium was reached, the temperature of monitors 108 and 118 were the highest because the monitoring locations were arranged on a plane perpendicular to the air outlet direction, and these were followed by monitoring locations 105 and 115. Monitoring locations 101 and 111 are located directly in front of the VDO of auxiliary ventilation, so their temperatures decreased most obviously, and their final temperatures were the lowest values under the same conditions. After adding a movable TIL, the cooling capacity of airflow can be preserved to reduce the cooling limit value of the upper monitoring locations. It is worth noting that a local vortex zone will appear in the center of the workspace during the process of auxiliary ventilation [31,32]. It is challenging to cool down and renew the air in the vortex zone without increasing the air volume, where monitoring locations 105 and 115 are situated. However, due to the effect of PTI, the heat exchange between the ventilation airflow and the air in the vortex zone is enhanced, and the temperature at the vortex position is significantly lowered. The average temperature of the 105 and 115 sensors dropped by 3.3 °C, while the temperatures of the sensors fell from 33.5 °C to 29.2 °C and from 31.3 °C to 29.0 °C, respectively.
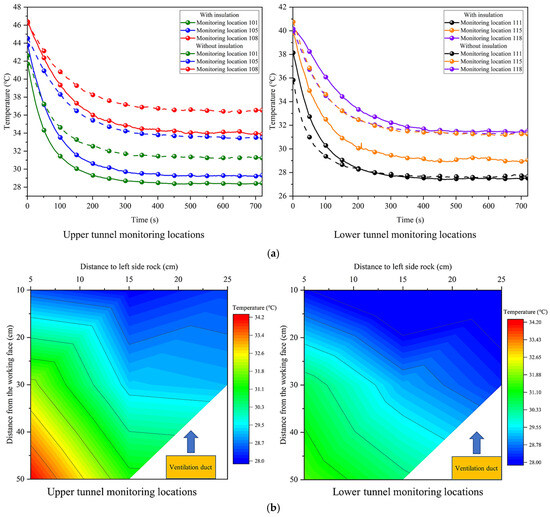
Figure 5.
The temperature field with partial insulation in the tunnel. (a) The temperatures of the monitoring locations in the workspace changes with the ventilation time. (b) The temperature distributions in the working area with insulation.
To better illustrate the temperature distribution, the stable temperature values of the monitoring locations were plotted as cloud maps. Figure 5b represents the temperature cloud maps of the working zone. The upper section has a significantly higher temperature than the lower section. Three factors contribute to this phenomenon. First, the shape of the tunnel is arched, meaning the rock above has a greater heat dissipation area than the rock below. Secondly, since the partial insulation layers are in the form of baffles, the heat that fails to be emitted from the surrounding rock on both sides will be emitted from above through the gap between the PTI layer and the wall of the mine tunnel. Finally, the lower temperature can be reduced even more because the ventilation duct is set at a low level. Due to the presence of the vortex zone, the temperature is higher in the center of the working area than it is at the end closest to the VDO when viewed from a longitudinal perspective.
4. Sensitivity Analysis for Single Factor
In the above research, it can be found that the temperature of the tunnel’s working environment has a close relationship with the parameters of the auxiliary ventilation and PTI. Therefore, many scenarios were tested to investigate the thermal performance of the coupled cooling system.
4.1. The Effect of Ventilation Volume
The primary factor influencing the effects of cooling and ventilation is the velocity of ventilation. Without changing the size of the ventilation duct, increasing the air volume represents an increase in the air velocity. In this section, ventilation velocities of 7.5 m/s, 8.5 m/s, 9.5 m/s, and 10.5 m/s were tested, while the other test parameters remained the same as in the previous section (the air outlet is 0.5 m away from the WF, the height of the ventilation duct is 0.025 m, the insulation layer length is 0.6 m, and the thickness is 0.01 m). Figure 6a depicts the change in the ATWA at different ventilation rates.
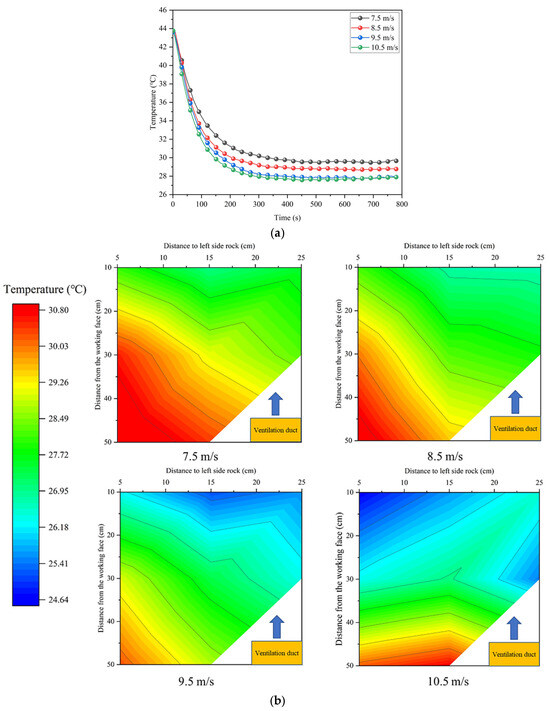
Figure 6.
The effect of the ventilation volume. (a) The ATWA under different ventilation velocities. (b) The temperature distribution at 0.1 m from the floor under different air velocities.
With the gradual increase in the ventilation volume, the average temperature in the tunnel drops faster and eventually reaches a lower temperature in thermal equilibrium. The increase in the air velocity will bring about greater heat exchange, and the ATWA decreases from 29.5 °C to 27.6 °C as the ventilation velocity rises from 7.5 m/s to 10.5 m/s. However, the large ventilation volume will also carry more cold volume for heat exchange. The temperature difference between the curves in Figure 6a decreases with the increasing ventilation volume, and the reduction in ATWA is only 0.2 °C when the velocity changes from 9.5 m/s to 10.5 m/s, respectively. There is still a limit to improving the thermal environment by altering the ventilation volume in mine tunnels. The temperature distribution at 0.1 m from the floor is shown in Figure 6b. It can be found that the area with a high temperature decreases significantly when the ventilation volume rises in the range of 7.5 m/s to 9.5 m/s. As the air velocity increases, the temperature in the region with a faster airflow falls. Furthermore, a large amount of air is pushed into the tunnel, which drives the vortex area back and raises the temperature in the back area of the working field. Therefore, blindly increasing the air volume will not necessarily bring a better cooling effect, but it will multiply the ventilation load and have an impact on the dust removal situation at the WF.
4.2. The Effect of VDO Distance from WF
The temperature distribution in the working area under different VDO positions at 0.1 m from the floor is depicted in Figure 7a. As the ventilation duct gradually recedes from the WF, the cooling effect decreases. When the VDO is 0.6 m away from the WF, the incoming airflow is fully developed, and the vortex region is stabilized in the middle of the tunnel, forming a local high-temperature region.
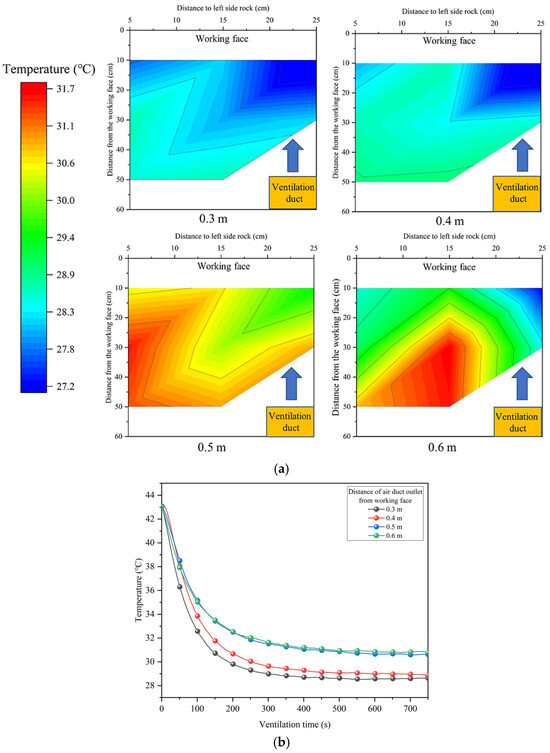
Figure 7.
The effect of the VDO distance from the WF. (a) The temperature distribution of the working area at 0.1 m from the floor. (b) The ATWA under different ventilation VDO positions.
The final stabilized temperature is higher as the air supply outlet is placed away from the WF. In Figure 7b, when the distance is 0.3 m, the ATWA is the lowest, which is 28.5 °C. The temperature drops significantly as the VDO advances from 0.5 m to 0.4 m, with a temperature difference of 1.7 °C. While the distances are 0.5 m and 0.6 m, the variation trends over time as well as the final stability values of the average temperature are extremely similar, and the difference is only 0.2 °C. Therefore, reducing the distance between the VDO and the WF would improve the cooling effect. It should be noted that the proximity of the duct to the WF will reduce the work area. As a result, the duct position will be constrained by the amount of space available for tunnel construction.
4.3. The Effect of VDO Height
The height of the auxiliary ventilation duct directly affects the position of airflow diffusion. In this section, the ventilation airflow velocity was adjusted to 8.5 m/s, the air outlet was 0.4 m away from the WF, the insulation layer length was 0.6 m and its thickness was 0.01 m, the thickness of the insulation layer was 0.01 m, and the ventilation duct heights were changed to 0.025 m, 0.075 m, 0.105 m, and 0.150 m for research. The cooling effects of different ventilation duct heights are shown in Figure 8a.
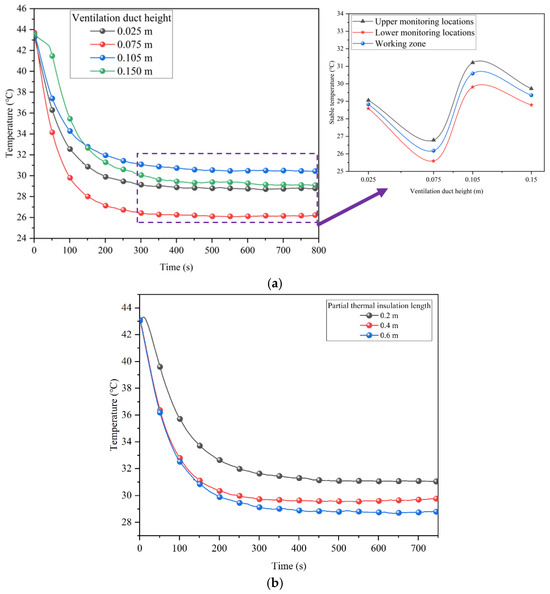
Figure 8.
The changes in the ATWA. (a) The ATWA under different ventilation duct heights. (b) The ATWA under different insulation lengths.
The cooling effects vary with the changes in the ventilation duct arrangement height. The final stable temperature shows a fluctuating trend with a rise in the auxiliary ventilation duct height, and this law applies to the temperature distribution of any section in the working area. When the height is 0.075 m, the cooling effect is the most obvious, and the ATWA at this time is 26.2 °C, which is 4.4 °C lower than the highest temperature in the same group of experiments. This is because the duct is located in the center of the PTI layer and has a certain distance from both the top and bottom plates of the surrounding rock. When the pipe is at 0.15 m, the average temperature drops slowly at first, then quickly after ventilation. This is due to the upper surrounding rock in the front having a high heat transfer and cooling consumption (50 s) and the proximity of the air supply outlet to the tunnel vault. Because of the low-speed airflow near the vault and the insulation layers on the side wall, the heat transferred from the rock can be reduced. Additionally, the airflow can supplement the cold capacity in a timely manner, meaning that the ATWA is lower when the ventilation pipe is 0.150 m high than when it is 0.105 m high. Further, when the air duct is arranged in the middle position, the airflow can be fully developed after shooting in, and the mixing between the cool airflow and the original air within the tunnel will be more uniform, which could allow the air duct to make full use of the cooling capacity. In general, the height of the air inlet pipe in an excavation project is usually arranged between 0.5 m and 1.5 m. According to the scale model test conversion, a better ventilation and cooling effect can be achieved at a position of 0.75 m. The actual project should be adjusted according to the process needs and the area of personnel activities.
4.4. The Effect of Partial TIL Length
The length of the PTI layer directly affects the heat exchange area of mining tunnels. In this section, the length of the insulation layer was adjusted to 0.2 m, 0.4 m, and 0.6 m for testing, and the other test conditions remained constant. Figure 8b depicts the ATWA in the tunnel under different insulation lengths. The figure illustrates that, as the PTI layer length is shortened from 0.6 m to 0.2 m, the final steady temperature in the tunnel rises from 28.8 °C to 31.1 °C. However, it can be found that the drop rate of the temperature in the early stage of ventilation does not differ much when the lengths are 0.6 m and 0.4 m. When the insulation layer length is 0.2 m, the cooling rate slows down at the beginning of ventilation due to the larger heat exchange area in the working space. If the PTI layer is too short, the coupled cooling effect will be weakened, and if it is too long, the cost and difficulty of moving will increase. As a result, the insulation layer length should be reduced as much as possible in order to achieve precise thermal insulation while ensuring enhanced ventilation and cooling effects are achieved.
4.5. The Effect of Partial TIL Thickness
One important factor influencing the cooling effect is the thickness of the insulation layer. In this section, the insulation effect was studied when the PTI layer thicknesses were 0.01 m and 0.02 m. According to the similarity criterion, it is equivalent to using insulation layers with 0.1 and 0.2 m thicknesses in engineering practice. The work area of the tunnel is limited during the excavation process. In the case of thermal insulation baffles on both sides, the thickness of 0.2 m is already the limit that can be occupied. The ATWA with a PTI layer with different thicknesses is shown in Figure 9a.
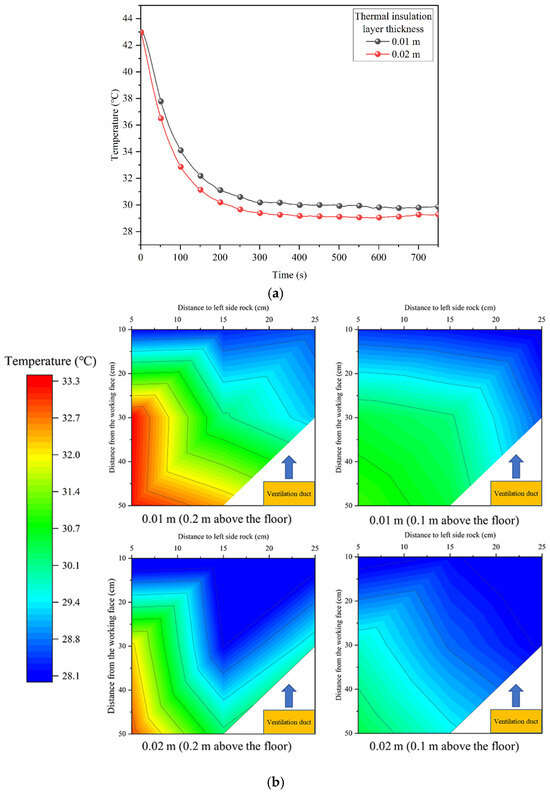
Figure 9.
The effect of the TIL thickness. (a) The ATWA under different TIL thicknesses. (b) The temperature distributions of sections 0.1 m and 0.2 m above the floor.
When the insulation layer thickness is increased from 0.01 m to 0.02 m, the stable temperature of the working area in the tunnel decreases by 0.8 °C. As shown in Figure 9b, when the insulation layers of different thicknesses are arranged, the cross-section temperature distributions at 0.1 m and 0.2 m above the tunnel floor are drawn, respectively. In the tunnel with a thicker TIL, the low-temperature area covers a larger area, and the temperature of each monitoring location is closer, which means that increasing the thickness of the insulation layer can make the temperature distribution in the tunnel more uniform. By comparing the temperature changes in the same section after thickening the PTI layer, it can be concluded that the main temperature improvement area is in the center of the tunnel. Although the thickness of the insulation is doubled, the temperature reduction is very limited. If it is not necessary for the project, the method of thickening the PTI layer to improve the cooling effect should be used as little as possible.
5. Orthogonal Test
The orthogonal test method was used to conduct this study to identify the influence law of each factor on the test evaluation index. In this research, a five-factor, sixteen-level orthogonal (U16*(45)) test was proposed to evaluate the effects of the ventilation volume, ventilation duct height, distance from the VDO to the WF, insulation layer length, and insulation layer thickness. In the experiments, the level of each factor was adjusted by the virtual level method, and the orthogonal test was obtained, as shown in Table 3. The ATWA in the tunnel was selected as an indicator to evaluate the effect of each factor on the coupled cooling of ventilation and PTI.
Table 3.
U16*(45) orthogonal test.
There is a range, which is the maximum difference between the results of the four sets of experiments on each influencing factor. The method of range analysis was used to characterize the sensitivity of each influencing factor to the variation in the thermal environment in the working area. The sensitivity of each index factor is given in Table 4, and Figure 10 shows the degree of influence of different factors on the coupled cooling of ventilation and PTI in the tunnel.
Table 4.
Orthogonal test range calculation of ATWA.
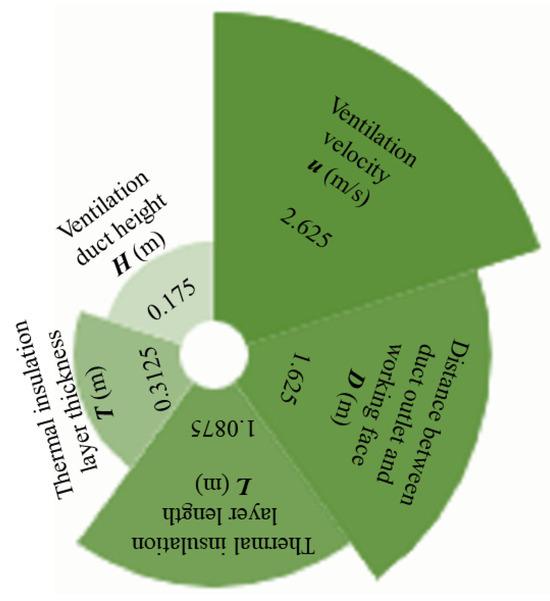
Figure 10.
The degree of influence of different factors on the coupled cooling of ventilation and PTI.
The results show that the significance of each factor on the ATWA is ventilation u > D > L > T > H. In the process of the coupled cooling of ventilation and PTI, ventilation is the most important factor of the cooling effect. Therefore, adjusting the location of the ventilation ducts and the outlet ventilation volume is the most efficient method to regulate the thermal environment in a tunnel. The main purpose of the movable TIL is to prevent strong convective heat exchange between the airflow and the high-temperature surrounding rock, so the length of the insulation layer, which is directly related to the thermal dissipation area of the working space in a mine tunnel, is also reflected as a significant factor. According to the results of the range analysis, the best coupled cooling effect will be achieved at u = 10.5 m/s, D = 0.4 m, H = 0.075 m, L = 0.6 m, and T = 0.02 m. When establishing a coupled cooling system of ventilation and PTI, the design can be prioritized according to the sensitivity of each factor.
6. Conclusions
A conceptual model of the coupled cooling system for auxiliary ventilation and PTI to control heat hazards was proposed. Based on a similar principle, a scale model test platform of tunnel ventilation and cooling was established. The thermal performance of the coupled cooling of ventilation and PTI in a tunnel WF was studied using this platform. The result shows that the coupled cooling system can effectively reduce the temperature in the vicinity of the WF. After the application of insulation, the temperature of the vortex area was lowered by up to 4.5 °C, and the ATWA was reduced by 1.5 °C. Simultaneously, the problem of elevated temperatures in the area away from the VDO improved.
Increasing the ventilation volume, as well as the length and thickness of the PTI layers, can decrease the thermal equilibrium temperature of the workspace. As the distance between the VDO and the WF decreases from 0.6 m to 0.3 m, there is a gradual disappearance of the local high-temperature area, and the ATWA reduces from 30.9 °C to 28.5 °C. The best cooling effect was achieved when the ventilation duct suspension height was in the center of the insulation layer. The environmental temperature of the tunnel was significantly impacted by the ventilation velocity, the distance from the VDO to the WF, and the length of the PTI layer. Furthermore, the ventilation velocity of 10.5 m/s, the distance between the VDO and WF of 0.4 m, the insulation layer length of 0.6 m and thickness of 0.02 m, and the ventilation duct height of 0.075 m are the optimal ventilation and PTI parameters.
Author Contributions
Conceptualization, Y.X.; Investigation, Z.L. and J.W.; Resources, Z.L. and G.L.; Writing—original draft, Q.J. and J.W.; Investigation, Z.L. and G.L.; Formal analysis, Y.X. and X.Z. All authors have read and agreed to the published version of the manuscript.
Funding
This research was supported by the National Natural Science Foundation of China (52274247), the Hong Kong Scholars Scheme (XJ2023039), the Natural Science Foundation of Hunan Province (2022JJ30050), the NHC Key Laboratory for Engineering Control of Dust Hazard (KLECDH2023020101), the State Key Laboratory of Safety and Health for Metal Mines (2022-JSKSSYS-03), the Natural Science Basic Research Program of Shaanxi Province-Outstanding Youth Science Foundation Project (2021JC-48), and the Postgraduate Innovative Project of Central South University (2022ZZTS0573).
Data Availability Statement
Data are contained within the article.
Conflicts of Interest
The authors declare that they have no known competing financial interests or personal relationships that could have appeared to influence the work reported in this paper.
Nomenclature
| ATWA | average temperature of the working area |
| PTI | partial thermal insulation |
| TIL | thermal insulation layer |
| VDO | ventilation duct outlet |
| WF | working face |
| heat conduction of the air between high-temperature rock and WF | |
| natural convection heat transfer of the air between high-temperature rock and WF | |
| forced convection heat transfer between high-temperature surrounding rock and airflow | |
| forced convection heat transfer between cold airflow and the air in the work area |
References
- Lin, M.; Zhou, P.; Jiang, Y.F.; Zhou, F.C.; Lin, J.Y.; Wang, Z.J. Numerical investigation on comprehensive control system of cooling and heat insulation for high geothermal tunnel: A case study on the highway tunnel with the highest temperature in China. Int. J. Therm. Sci. 2022, 173, 107385. [Google Scholar] [CrossRef]
- Zhu, S.; Wu, S.; Cheng, J.; Li, S.; Li, M. An underground air-route temperature prediction model for ultra-deep coal mines. Minerals 2015, 5, 527–545. [Google Scholar] [CrossRef]
- Xu, Y.; Li, Z.J.; Chen, Y.; Jia, M.T.; Zhang, M.S.; Li, R.R. Synergetic mining of geothermal energy in deep mines: An innovative method for heat hazard control. Appl. Therm. Eng. 2022, 210, 118398. [Google Scholar] [CrossRef]
- Zheng, G.Z.; Li, K.; Bu, W.T.; Wang, Y.J. Fuzzy comprehensive evaluation of human physiological state in indoor high temperature environments. Build. Environ. 2019, 150, 108–118. [Google Scholar] [CrossRef]
- Fan, B.W.; Shi, P.; Wan, Z.J.; Zhang, Y.; Xiong, L.C.; Hu, S.B.; Gou, H. Simulation Study on the Disaster-Causing Mechanism of Geothermal Water in Deep High-Temperature Heat-Damaged Mines. Minerals 2022, 12, 1355. [Google Scholar] [CrossRef]
- Jian, C.G. Research on Geothermal Prediction and Cooling Technology for Deep Mine Mining; China University of Mining and Technology Press: Xuzhou, China, 2013. (In Chinese) [Google Scholar]
- Yao, D.C. Research on optimization of ventilation and cooling technology scheme in Dongguashan copper mine. Min. Technol. 2012, 12, 44–45. (In Chinese) [Google Scholar] [CrossRef]
- Wang, X.; Chen, Z.H. Design and research on the ground centralized cooling system of Meihuajing coal mine. Min. Process. Equip. 2022, 50, 57–61. (In Chinese) [Google Scholar] [CrossRef]
- Zhang, Y.H.; Tao, L.L.; Ye, X.Q.; Zhou, X.H.; Fang, Y.; Fan, L.; Liu, X.R.; Yang, Z.X. Temperature reduction for extra-long railway tunnel with high geotemperature by longitudinal ventilation. Tunn. Undergr. Space Technol. 2022, 99, 103381. [Google Scholar] [CrossRef]
- Wen, X.Y.; Fu, J.X.; Zheng, W.F. Research on New Solid Waste Heat Insulation Material for Deep Mining. Minerals 2023, 13, 838. [Google Scholar] [CrossRef]
- Wang, Y.P. Case study on ventilation and cooling control technology of multi heat source coupling in long distance subsea tunnel construction. Case Stud. Therm. Eng. 2021, 26, 101061. [Google Scholar] [CrossRef]
- Xu, Y.; Li, Z.J.; Wang, J.J.; Chen, Y.; Li, R.R.; Wang, Q.L.; Jia, M.T. Ventilation and heat exchange characteristics in high geotemperature tunnels considering buoyancy-driven flow and groundwater flow. Int. J. Therm. Sci. 2022, 173, 107400. [Google Scholar] [CrossRef]
- Sun, T.T.; Luo, Z.W.; Chay, T. An analytical model to predict the temperature in subway-tunnels by coupling thermal mass and ventilation. J. Build. Eng. 2021, 44, 102564. [Google Scholar] [CrossRef]
- Wang, Z.H.; Han, J.Q.; Wang, J.; Geng, P.Q.; Weng, M.C.; Liu, F. Temperature distribution in a blocked tunnel with one closed portal under natural ventilation. Tunn. Undergr. Space Technol. 2021, 109, 103752. [Google Scholar] [CrossRef]
- Chang, Z.Y.; Ji, J.W.; Wang, K.Y.; Ni, L.; Li, N.N. Heat absorption control equation and its application of cool-wall cooling system in mines. J. Cent. South Univ. 2021, 28, 2735–2751. [Google Scholar] [CrossRef]
- Han, Q.Y.; Zhang, Y.; Li, K.Q.; Zou, S.H. Computational evaluation of cooling system under deep hot and humid coal mine in China: A thermal comfort study. Tunn. Undergr. Space Technol. 2019, 90, 394–403. [Google Scholar] [CrossRef]
- Zhang, H.; Hao, Z.H.; Zhang, G.; Tao, Y.C.; Wang, L. The cooling effect of high geothermal tunnel construction environment: A case of ice and spray method in an extra-long tunnel. Int. J. Therm. Sci. 2022, 178, 107606. [Google Scholar] [CrossRef]
- Pretorius, J.G.; Mathews, M.J.; Mare, P.; Kleingeld, M.; van Rensburg, J. Implementing a DIKW model on a deep mine cooling system. Int. J. Min. Sci. Technol. 2019, 29, 319–326. [Google Scholar] [CrossRef]
- Guo, P.Y.; Chen, C. Field experimental study on the cooling effect of mine cooling system acquiring cold source from return air. Int. J. Min. Sci. Technol. 2013, 23, 453–456. [Google Scholar] [CrossRef]
- Wang, Y.J.; Wang, C.C.; Gao, S.; Zheng, X.F.; Darkwa, J. The impact of thermal insulation on cooling energy consumption and optimal insulation thickness for underground tunnel. Sustain. Energy Technol. 2021, 47, 101495. [Google Scholar] [CrossRef]
- Liu, W.V.; Apel, D.B.; Bindiganavile, V.S.; Szymanski, J.K. Analytical and numerical modeling for the effects of thermal insulation in underground tunnels. Int. J. Min. Sci. Technol. 2016, 26, 267–276. [Google Scholar] [CrossRef]
- Kang, F.C.; Li, Y.C.; Tang, C.A. Numerical study on airflow temperature field in a high-temperature tunnel with insulation layer. Appl. Therm. Eng. 2020, 179, 115654. [Google Scholar] [CrossRef]
- Chen, Y.; Wang, S.Y.; Guo, C.C.; Lin, C.G.; Zhao, C.Y. Analyses of non-aqueous reactive polymer insulation layer in high geothermal tunnel. J. Rock Mech. Geotech. Eng. 2023, 15, 169–178. [Google Scholar] [CrossRef]
- Zhang, G.Z.; Cao, Z.M.; Wang, W.; Mei, X.S.; Zhao, X.; Shen, S.W.; Na, T.X. Field test and numerical investigation on thermal environment of tunnel with air layer structure. Build. Environ. 2021, 203, 108105. [Google Scholar] [CrossRef]
- Xu, Y.; Li, Z.J.; Liu, H.S.; Jia, M.T.; Wang, Q.L.; Zhang, M.S.; Xu, Y.Y. Modeling of the dynamic behaviors of heat transfer during the construction of roadway using moving mesh. Case Stud. Therm. Eng. 2021, 26, 100958. [Google Scholar] [CrossRef]
- Li, Z.J.; Liu, H.S.; Xu, Y.; Li, R.R.; Jia, M.T.; Zhang, M.S. Numerical analysis on the thermal performance in an excavating roadway with auxiliary ventilation system. Int. J. Environ. Res. Public Health 2021, 18, 1184. [Google Scholar] [CrossRef] [PubMed]
- Kalman, H.; Portnikov, D. Analyzing bulk density and void fraction: A. the effect of Archimedes number. Powder Technol. 2021, 381, 477–487. [Google Scholar] [CrossRef]
- Lee, J.C.; Bang, K.S.; Yu, S.H.; Choi, W.S.; Ko, S. Similarity analysis of thermal-fluid flow for thermal testing using scaled-down model of spent fuel storage cask. Ann. Nucl. Energy 2020, 149, 107791. [Google Scholar] [CrossRef]
- Ocипoвa, B.A. Experimental Research on Heat Transfer; Higher Education Press (Chinese translation): Beijing, China, 1982. (In Chinese) [Google Scholar]
- Paradis, P.Y.; Champliaud, H. New correlations for heat transfer in parallel-plate ducts at low Peclet number. Int. J. Heat Mass Transf. 2021, 178, 121595. [Google Scholar] [CrossRef]
- Liu, G.P. Analysis of roadway back hot and its influencing factors. Min. Saf. Environ. Prot. 2018, 45, 10–14. (In Chinese) [Google Scholar]
- Chen, Q.; Zhang, H.; Zhu, Y.M.; Chen, S.G.; Ran, G.Y. Study on distributions of airflow velocity and convective heat transfer coefficient characterizing duct ventilation in a construction tunnel. Build. Environ. 2021, 188, 107464. [Google Scholar] [CrossRef]
Disclaimer/Publisher’s Note: The statements, opinions and data contained in all publications are solely those of the individual author(s) and contributor(s) and not of MDPI and/or the editor(s). MDPI and/or the editor(s) disclaim responsibility for any injury to people or property resulting from any ideas, methods, instructions or products referred to in the content. |
© 2024 by the authors. Licensee MDPI, Basel, Switzerland. This article is an open access article distributed under the terms and conditions of the Creative Commons Attribution (CC BY) license (https://creativecommons.org/licenses/by/4.0/).