Article

Device Position-Independent Human Activity Recognition with Wearable Sensors Using Deep Neural Networks

by
Sakorn Mekruksavanich
1 and
Anuchit Jitpattanakul
2,3,*
1
Department of Computer Engineering, School of Information and Communication Technology, University of Phayao, Phayao 56000, Thailand
2
Department of Mathematics, Faculty of Applied Science, King Mongkut’s University of Technology North Bangkok, Bangkok 10800, Thailand
3
Intelligent and Nonlinear Dynamic Innovations Research Center, Science and Technology Research Institute, King Mongkut’s University of Technology North Bangkok, Bangkok 10800, Thailand
*
Author to whom correspondence should be addressed.
Appl. Sci. 2024, 14(5), 2107; https://doi.org/10.3390/app14052107
Submission received: 20 January 2024 / Revised: 25 February 2024 / Accepted: 28 February 2024 / Published: 3 March 2024
(This article belongs to the Special Issue Human Activity Recognition (HAR) in Healthcare, 2nd Edition)

Abstract

:
Human activity recognition (HAR) identifies people’s motions and actions in daily life. HAR research has grown with the popularity of internet-connected, wearable sensors that capture human movement data to detect activities. Recent deep learning advances have enabled more HAR research and applications using data from wearable devices. However, prior HAR research often focused on a few sensor locations on the body. Recognizing real-world activities poses challenges when device positioning is uncontrolled or initial user training data are unavailable. This research analyzes the feasibility of deep learning models for both position-dependent and position-independent HAR. We introduce an advanced residual deep learning model called Att-ResBiGRU, which excels at accurate position-dependent HAR and delivers excellent performance for position-independent HAR. We evaluate this model using three public HAR datasets: Opportunity, PAMAP2, and REALWORLD16. Comparisons are made to previously published deep learning architectures for addressing HAR challenges. The proposed Att-ResBiGRU model outperforms existing techniques in accuracy, cross-entropy loss, and F1-score across all three datasets. We assess the model using k-fold cross-validation. The Att-ResBiGRU achieves F1-scores of 86.69%, 96.23%, and 96.44% on the PAMAP2, REALWORLD16, and Opportunity datasets, surpassing state-of-the-art models across all datasets. Our experiments and analysis demonstrate the exceptional performance of the Att-ResBiGRU model for HAR applications.

1. Introduction

Recently, significant advances in sensing technologies have enabled the creation of intelligent systems capable of supporting various applications that can be useful in daily life. Such applications include those for assisted-living smart homes [1], healthcare monitoring [2], and security surveillance [3]. These systems aim to develop enhanced artificial intelligence that promptly recognizes people’s everyday activities, like walking or jogging. This technology can improve the quality of life for those in poor health by closely tracking their movements. For example, elderly, disabled, or diabetic individuals often need to follow strict daily physical activity regimens as part of their medical care. Thus, healthcare providers can use these intelligent systems to monitor patient behaviors, identifying actions like ambulation, stair climbing, and reclining. Moreover, even healthy individuals can utilize the systems proactively. Studying the activities of healthy people could aid early disease detection in some cases [4]. The systems could also improve well-being by providing insights into daily activity patterns. This research explicitly examines human activity recognition (HAR), which accurately determines a person’s activity using sensors embedded in wearable devices worn on the body.
HAR analyzes people’s movements using technology and sensors. Automatically identifying physical activities has become vital in ubiquitous computing, interpersonal communication, and behavioral analysis research. Extensively applying HAR can enhance human safety and well-being. In hospitals, patients can wear devices that detect mobility, heart rate, and sleep quality, enabling remote monitoring without constant expert oversight. Such tools also facilitate tracking elderly and young patients. HAR-powered smart home solutions provide energy savings and personalized comfort by recognizing whether individuals are present and adapting lights or temperature accordingly. Some personal safety gadgets can automatically notify emergency responders or designated contacts when required. Additionally, many other applications need automated coordination based on identifying user activities.
Technological advances have enabled the creation of wearable devices with sensing, processing, and communication capabilities that are more compact, affordable, and power-efficient. Sensors embedded in these wearables, commonly leveraged for Internet of Things (IoT) applications, can rapidly capture various body motions and recognize human behaviors. In particular, inertial measurement unit (IMU) sensors containing accelerometers and gyroscopes have improved drastically in recent years, simplifying the tracking and detection of human movements. Undoubtedly, sensor-based HAR furnishes a highly versatile and cost-effective approach for continual monitoring while better addressing privacy concerns.
HAR is not a new research field, with over a decade of discussions. Consequently, numerous published studies have focused on developing activity recognition systems. Earlier systems relied on machine learning approaches, which yielded some success. However, these machine learning methods depended heavily on manual feature engineering techniques [5,6]. As such, they were time-intensive and laborious, necessitating substantial human input. Additionally, they failed to guarantee generalization to novel, unseen scenarios [7,8]. Due to these drawbacks, the field has witnessed a progressive shift from machine learning to deep learning techniques, creating many new research opportunities. A key advantage of deep learning is its layered data processing architecture, which enables models to learn from raw, unprocessed input data without complex preprocessing. This facilitates the analysis of multimodal sensor data [9]. A primary reason for the prevalence of deep learning in HAR is that machine learning algorithms depend greatly on human input and preprocessing of data before implementation [10]. In contrast, deep learning models can autonomously extract knowledge and insights directly from sensor data gathered by devices [11] without manual effort or domain expertise.
Currently, many sensor-based HAR systems require wearable devices to be placed in fixed positions on the body [12,13,14]. These systems are referred to in research as position-specific HARs. However, people often move their wearable gadgets to different on-body locations. This decreases recognition accuracy since sensor readings for the same motion can vary substantially across body placement sites. As such, the primary challenge for sensor-based HAR platforms is developing position-independent solutions that work reliably, regardless of a device’s location [15].
The key objective of this research is to develop a position-independent HAR system using deep learning techniques. To accomplish this goal, we introduce Att-ResBiGRU, a novel deep residual neural network designed to efficiently categorize human activities irrespective of device placement on the body. The model is trained end-to-end within a deep learning framework, eliminating the need for manual feature engineering.
This research introduces several advancements contributing to position-independent HAR:
  • Introduction of Att-ResBiGRU: We propose a novel deep learning architecture called Att-ResBiGRU. This innovative model combines convolutional layers for feature extraction, residual bidirectional gated recurrent unit (GRU) modules for capturing temporal dependencies, and attention mechanisms for focusing on crucial information. This combination enables highly accurate recognition of activities, regardless of the device’s position.
  • State-of-the-art performance: Extensive testing on benchmark datasets (PAMAP2, Opportunity, and REALWORLD16) demonstrates that our proposed model achieves the best results reported for position-independent HAR. It achieves F1-scores of 86.69%, 96.44%, and 96.23% on these datasets.
  • Robustness against position variations: We compare our model against existing position-dependent and -independent methods using various real-world scenarios to validate its robustness to sensor position changes. Att-ResBiGRU effectively addresses the challenges associated with position independence.
  • Impact of model components: Through ablation studies, we analyze the influence of incorporating residual learning and attention blocks on the model’s performance compared to baseline recurrent models. This quantifies the specific contributions of each component to the overall accuracy.
  • Simplified deployment: This work establishes a highly reliable single model for classifying complex activities, regardless of a device’s position. This simplifies deployment by eliminating the need for complex position-dependent models.
The remainder of this paper is structured as follows. Section 2 provides a review of recent related works in HAR research. Section 3 presents an in-depth description of the proposed Att-ResBiGRU model. Section 4 details the experimental outcomes and results. Section 5 discusses the conclusions drawn from the research findings. Finally, Section 6 concludes this paper by considering challenging avenues for future work.

2. Related Works

This section reviews relevant research in sensor-based HAR. The specific topics covered include position-specific and position-independent HAR systems, deep learning techniques applied in HAR, and the publicly available datasets for developing and evaluating HAR models.

2.1. Activity Recognition Constrained to Fixed Device Locations

HAR researchers have introduced innovative methods for activity identification using peripheral sensors. To collect accelerometer data, participants were instructed by Kwapisz et al. [16] to carry a smartphone in the front pocket of their trousers. They trained an activity recognition model with the data, producing 43 features and achieving an accuracy exceeding 90%. They omitted domain-specific frequency features despite proposing novel characteristics like the duration between peaks and binned distribution. Bieber et al. [17] improved activity identification by combining accelerometer and sound sensor data. They attached the smartphone to the trouser pocket, using the ambient noise as supplementary information about the user’s surroundings. However, challenges arose as the microphone introduced noise, and no solution was found. Kwon et al. [18] employed a smartphone in a specific pocket position for unsupervised learning methodologies in activity recognition. This approach addressed the issue of label generation. Although the approach demonstrated a 90% accuracy rate, it did not cover routine daily activities like ascending and descending stairs.
Harasimowicz et al. [19] classified eight user activities using smartphone accelerometers, including sitting, strolling, running, lying, ascending, descending, standing, and turning. They explored the impact of window size on identification, achieving a 98.56% accuracy with the KNN algorithm. However, the study focused solely on data from a smartphone in a trouser pocket, neglecting smartphone orientation issues. Ustev et al. [20] introduced a human activity recognition algorithm utilizing magnetic field, accelerometer, and gyroscope sensors in smartphones. They transformed the smartphone’s coordinate system to the Earth’s magnetic coordinate system to mitigate device orientation issues. Shoaib et al. [21] identified intricate human activities using wrist-worn motion sensors on smartphones and smartwatches. While effective, their approach was constrained by the position and orientation of the devices.
Each study maintained a fixed smartphone position for activity recognition, yielding high accuracy. However, in practical scenarios, users seldom confine their wearable devices to a single location.

2.2. Position-Independent Activity Recognition

When faced with an unfamiliar or undisclosed position, the placement of sensors on an individual’s body is rarely fixed in practical scenarios. As a result, these algorithms encounter challenges in achieving significant accuracies. Hence, it becomes crucial to develop HAR models that are not reliant on specific positions and can adapt to various sensor locations, taking into account individual behaviors in real time [22].
The challenge becomes more complex when considering the placement of the smartphone. Henpraserttae et al. [23] conducted experiments involving six daily tasks with a smartphone positioned in three different ways. Models were created for each position using features insensitive to the device’s location. However, certain positions exhibited inaccuracies in activity recognition. Grokop et al. [24] explored the variability in smartphone positions by combining data from the accelerometer, ambient light sensor (ALS), proximity sensor, and camera intensity. This combination allowed them to accurately classify movement conditions and device locations, achieving respective accuracies of 66.8% and 92.6%. Adding more sensors to a smartphone could enhance precision but at the cost of increased resource consumption. Notably, their study should have covered ascending and descending stairs, analogous to walking.
Coskun et al. [25] introduced an innovative method for categorizing position and activity using only an accelerometer. To improve position recognition accuracy, they incorporated angular acceleration, achieving an 85% accuracy in activity recognition. Miao et al. [26] positioned smartphones in various pockets and used light and proximity sensors to determine pocket placement. They then collected raw data and extracted position-insensitive features for model training. The decision tree with the highest effectiveness in recognition and classification was selected, conserving smartphone resources and boosting recognition accuracy to 89.6%. However, their approach needed to account for hand and purse weight. Gu et al. [27] investigated user-independent movement detection using smartphone sensors, exploring positions such as holding with or without swaying motion and placement in trouser pockets during activity recognition.

2.3. Deep Learning Approaches for HAR

Advanced deep learning models like convolutional neural networks (CNNs) and recurrent neural networks (RNNs) have demonstrated remarkable effectiveness in various recognition tasks, including HAR. These models leverage hierarchical representations from raw sensor data, enabling them to extract relevant features autonomously and understand intricate temporal dependencies within sequences of activities. Researchers have developed deep learning frameworks for HAR [28,29,30,31,32,33], achieving accuracy and robustness across diverse user groups and environments.
Shi et al. [28] constructed a dataset from body movement sensors using the Boulic kinematic model. They proposed a deep convolutional generative adversarial network (DCGAN) and a pre-trained deep CNN architecture, VGG-16, for identifying three distinct categories of walking actions based on velocity. Although this approach effectively broadens the training set to prevent overfitting, it is limited to three categories of walking activities (fast walking and extremely fast walking). Ravi et al. [29] introduced CNN models with three distinct regularizations, achieving high accuracy in classifying four datasets—ActivMiles, WISDM v1.1, Daphnet FoG, and Skoda. Their focus on sensor orientation invariant and discriminative features maintained consistent accuracy for real-time classification with low power consumption. However, accuracy and computational durations were comparable to previous state-of-the-art approaches. Hammerla et al. [30] examined three datasets—Opportunity, PAMAP2, and Dolphin Gait—developing five deep models for each. They achieved high accuracy but failed to demonstrate consistent success across all benchmark HAR datasets, and their recommendations were limited to a few deep models. Xu et al. [31] utilized Inception, GoggLeNet, and GRU on three datasets, achieving enhanced generalizability. However, they did not address the issue of class imbalance in data relevant to practical HAR applications. Bhattacharya et al. [32] introduced Ensem-HAR, a stacking meta-model consisting of random forest and various deep learning models. Although the approach outperformed other works, the cumulative training time of four distinct models made it unsuitable for real-time HAR implementations.

3. Proposed Methodology

This section outlines a position-independent HAR framework to fulfill this study’s goal. The position-independent HAR framework developed in this research investigates the activities of individuals using wearable devices. It employs deep learning algorithms on sensor data collected from these devices to achieve position-independent HAR.

3.1. Data Acquisition

This study aimed to develop a HAR model that effectively deals with real-life situations where people often carry their wearable electronics in different positions. To explore position-independent HAR, three publicly accessible multi-position HAR datasets—Opportunity, PAMAP2, and REALWORLD16—were selected. Several factors support the choice of these datasets: (i) The data are gathered from diverse locations, as shown in Figure 1; (ii) The datasets are sufficiently large to support the application of deep learning algorithms; and (iii) The covered activities are diverse, including both small-scale activities (like gestures in the Opportunity dataset) and everyday daily activities.

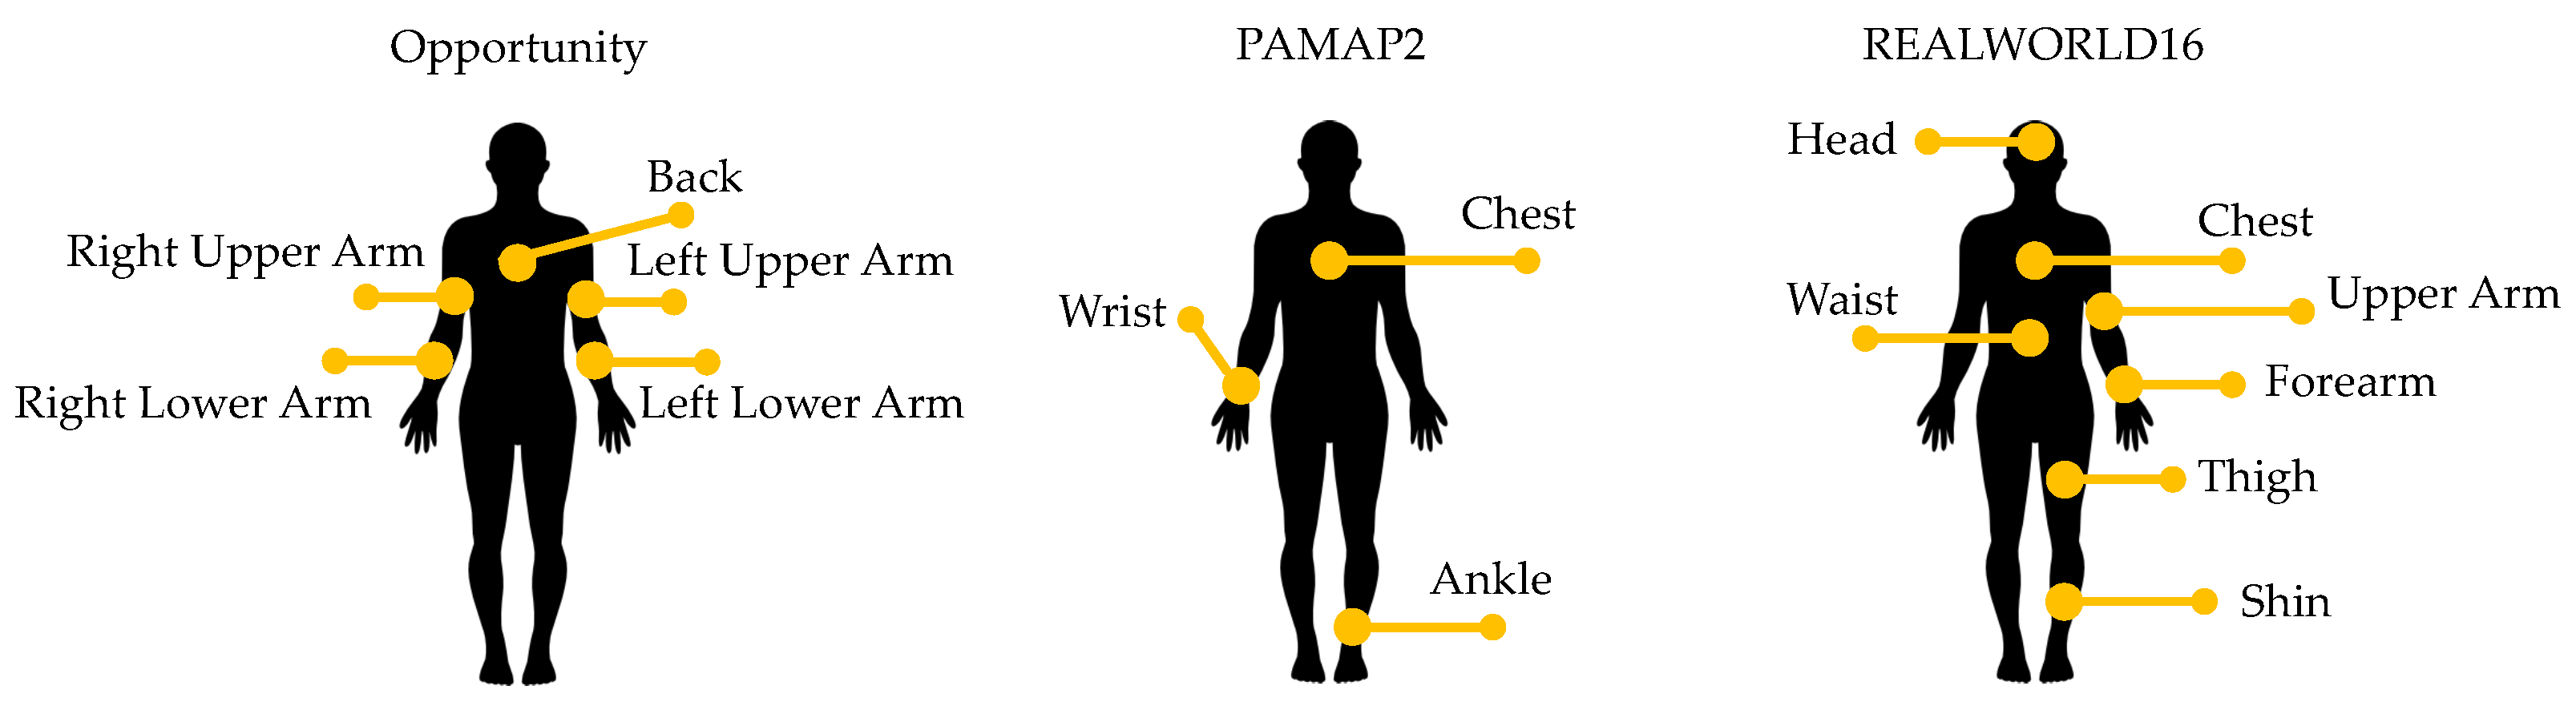
3.1.1. Opportunity Dataset

In their investigation, Roggen et al. [34] introduced the Opportunity dataset for activity recognition, comprising 72 sensors capturing naturalistic activities in a sensor-rich setting. This dataset incorporates diverse sensors, including those embedded in objects, worn on the body, and placed in the environment. HAR research categorizes data from body-worn sensors, specifically targeting four types of movements and seventeen microactivities. For upper-body monitoring, five IMUs were strategically placed: on the back of the torso (Back), the left upper arm (LUA), the left lower arm (LLA), the right upper arm (RUA), and the right lower arm (RLA). Additionally, two sensors were attached to the user’s footwear. The study involved 12 subjects, utilizing 15 interconnected sensor systems with 72 sensors across ten modalities. These sensors seamlessly integrate into the subject’s surroundings, objects, and attire, making the dataset valuable for assessing various activity recognition approaches. Due to its unique attributes, the Opportunity dataset is exceptionally suitable for assessing various action identification methodologies.
Initially framed as an 18-category multi-classification challenge, the Opportunity dataset was streamlined to 17 categories by excluding the null class, an extra label. Table 1 shows a comprehensive list of these categories. From the Opportunity dataset, we collected 90 samples for each window, employing 3-second intervals with a sampling rate of 30 Hz.

3.1.2. PAMAP2 Dataset

Reiss and Stricker [35] introduced the PAMAP2 physical activity monitoring dataset, containing recordings from nine participants, encompassing both male and female subjects. These participants were instructed to engage in eighteen diverse lifestyle activities, ranging from leisure pursuits to household tasks, such as climbing and descending stairs, ironing, vacuum cleaning, lying, standing, walking, driving a car, performing Nordic walks, and more. Household activities included lying, sitting, standing, ascending, and descending stairs.
Over ten hours, the participants’ activity data were collected using three IMUs positioned on the dominant wrist, thorax, and ankle. Each IMU operated at a sampling rate of 100 Hz, while a heart rate sensor collected data at a rate of 9 Hz. Additionally, a thermometer was utilized. A summary of the results obtained from training models on the PAMAP2 dataset is presented in Table 1. In the PAMAP2 dataset, the sensor information underwent sampling within fixed-width sliding intervals lasting 3 s, devoid of overlap. This approach yielded 300 readings per window, given that the data were captured at 100 Hz.

3.1.3. REALWORLD16 Dataset

The HAR process starts with collecting sensor data recorded by peripheral devices. To implement this approach, the REALWORLD16 dataset [36] was chosen as the standardized public HAR dataset. The dataset includes data from acceleration, GPS, gyroscope, light, magnetic field, and sound-level sensors sampled at 50 Hz. Activities such as ascending and descending stairs, jumping, lying, standing, sitting, running, and walking were performed in real-world conditions. Fifteen subjects of diverse ages and genders—average age 31.9 ± 12.4, height 173.1 ± 6.9, weight 74.1 ± 13.8; eight males and seven females—engaged in each activity for ten minutes, except for jumping, which was repeated for approximately 1.7 min.
Wearable sensors were attached to each subject’s waist, forearm, head, chin, chest, and thigh to capture signals from various body positions. A video camera was used to document every movement, aiding the subsequent analysis. A detailed summary of the distinctive features of each REALWORLD16 dataset is presented in Table 1. The REALWORLD sensor data underwent sampling using fixed-width sliding windows lasting 3 s without overlap. This process led to 150 readings per window, as the recording was conducted at 50 Hz.

3.2. Data Preprocessing

3.2.1. Data Denoising

The raw data collected from the sensors might contain unwanted system measurement noise or unexpected disturbances caused by the individual’s active movements during the experiments. This noise can compromise the valuable information embedded in the signal. Hence, it was crucial to mitigate the impact of noise to extract meaningful insights from the signal for subsequent analysis. Commonly utilized filtration techniques include mean, low-pass, Wavelet, and Gaussian filters [37,38]. In our study, we opted for an average smoothing filter for signal denoising. This entailed applying the filter across all three dimensions along the accelerometer and gyroscope sensors.

3.2.2. Data Normalization

Data obtained from various sensors frequently display uneven scales, and the existence of outlying samples in the data can result in extended training durations and potential challenges in reaching convergence. To mitigate the impact of variations in the values of each channel, min-max normalization was implemented for each feature, projecting their values into the [0, 1] interval.
As expressed in Equation (1), the initial sensor data undergo normalization prior to processing, bringing them within the range of 0 to 1. This method addresses the challenge in model learning by standardizing the entire range of data values. This standardization facilitates faster convergence of gradient descents.
x i n o r m = x i x i m i n x i m a x x i m i n , i = 1 , 2 , 3 , .
where x i n o r m represents the normalized data, n represents the number of channels, and x i m a x and x i m i n are the maximum and minimum values of the i-th channel, respectively.

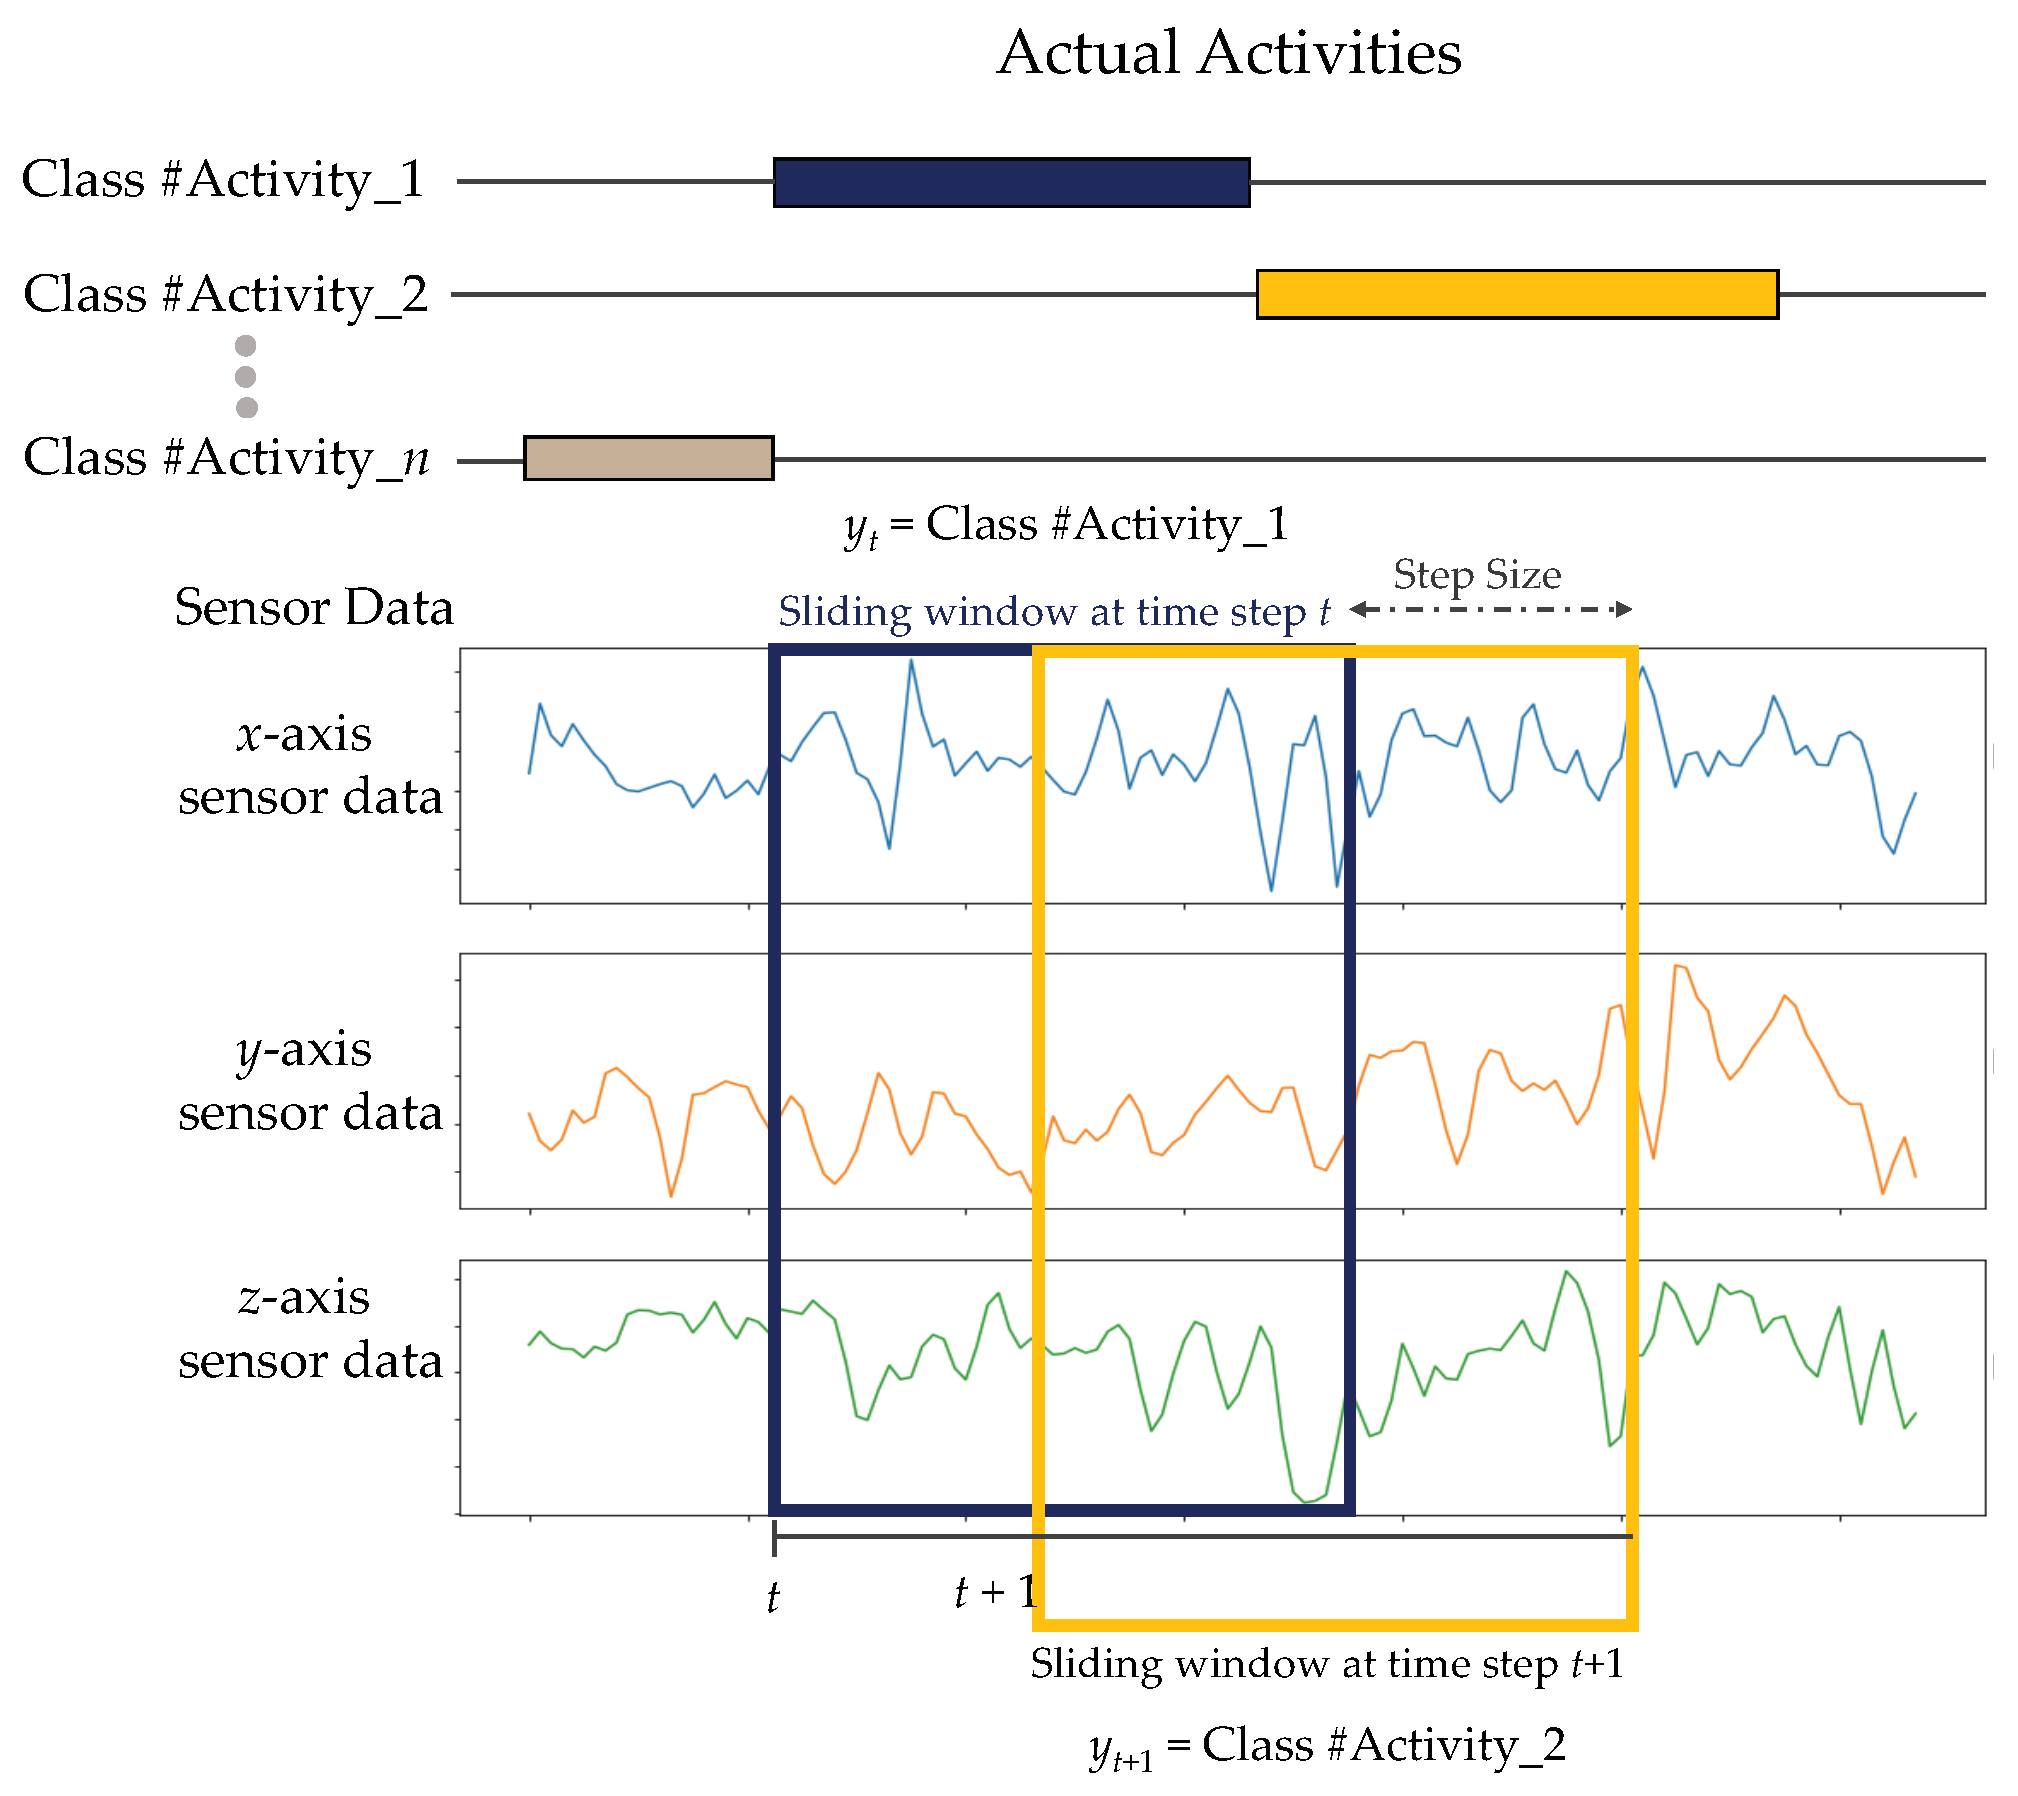
3.2.3. Data Segmentation

Considering the substantial amount of signal data captured by wearable sensors, it becomes impractical to input them into the HAR model simultaneously. Therefore, a crucial step is to conduct sliding-window segmentation before providing data to the model. This technique is widely employed in HAR to segment data and identify periodic and static activities, making it a popular method for this purpose [39]. The sensor signals are partitioned into fixed-length windows, employing a strategic approach to ensure comprehensive coverage of adjacent windows. This maximizes the number of training data samples and captures the smooth transition between different activities.
The sample data that are segmented by a sliding window with size N is a size of K × N . The sample W t is denoted as:
W t = [ a t 1 a t 2 a t K ] R K × N
We represent the signal data for sensor k at window time t as column vector a t k = ( a t 1 k , a t 2 k , , a t N k ) T . The transpose operation is denoted by T. K stands for the number of sensors and N represents the length of the sliding window. In Equation (2), K denotes the count of sensor channels supplying input time-series data streams. Each sensor mode serves as one feature dimension for the dataset. For instance, a triaxial accelerometer embedded in wearable devices would supply K = 3 input acceleration features, representing the x-, y-, and z-axes. Likewise, a sensor consisting of nine IMUs, each with 3-axis gyroscope, accelerometer, and magnetometer data, would encompass K = 9 overall features (three for each modality). To effectively leverage the relationships between windows and streamline the training process, the window data are segmented into sequences of windows, as shown in Figure 2, as follows:
S = ( W 1 , y 1 ) , ( W 2 , y 2 ) , , ( W T , y T )
where T represents the length of the window sequence and y t signifies the corresponding activity label for window W t . When windows encompass multiple activity classes, the window label is determined based on the most prevalent activity among the sample data.

3.3. The Proposed Att-ResBiGRU Model

The initial phase of sensor-based HAR involves gathering activity data through intelligent wearable devices. Subsequently, these data undergo preprocessing before being recognized as processed sensor data. Current identification methods are time-consuming and need help distinguishing similar activities, such as ascending and descending stairs.
To address these issues, we propose a novel architecture named Att-ResBiGRU. The model’s network structure, depicted in Figure 3, consists of three key components: convolution, ResBiGRU, and attention blocks. The convolution block, the first component, is responsible for extracting spatial features from the preprocessed data. Adjusting the convolution stride efficiently reduces the time-series length, accelerating the recognition process. Furthermore, the improved ResBiGRU network is employed to extract time-series features from the data processed by the convolution block. The ResBiGRU component enhances the model’s capability to capture long-term dependencies in time-series data by combining the strengths of a bidirectional GRU (BiGRU) neural network and incorporating residual connections. This integration enhances the model’s grasp of complex temporal patterns, thus improving recognition accuracy.
We also introduce an attention mechanism to optimize the final recognition features’ efficiency. This mechanism calculates weights for the feature information generated by the ResBiGRU network, enabling the model to prioritize the most informative parts of the input data. By emphasizing critical features, the attention mechanism bolsters the model’s ability to differentiate between various activities, ultimately enhancing activity recognition accuracy.
The classification process of behavior information utilizes a fully connected layer and the SoftMax function. The outcome of this classification process is the recognition result, predicting the specific activity being performed. In the subsequent sections, we thoroughly explain each component, elucidating their functions and contributions within our proposed model.

3.3.1. Convolution Block

CNNs excel at extracting features from tensor data, making them particularly well suited for tasks like image analysis and behavioral recognition. This investigation employs the one-dimensional CNN (1D-CNN) for effective feature extraction. For the provided data, Figure 3 visually presents the representation of the time series on the vertical axis and the multi-axis channel features gathered by various sensors on the horizontal axis.
The 2D convolution is recognized for its localized nature, which can pose challenges when dealing with many sensors. This is due to the potential disruption of sensor channel integrity caused by local convolution. Conversely, the 1D convolution operates on behavioral units and processes all sensor channels concurrently. Consequently, when designing the model for spatial feature extraction, the 1D convolution is favored over the traditional 2D convolution. Utilizing the 1D convolution serves the purpose of feature extraction. The features obtained are considered spatial characteristics within an image, comprising sensor measurement samples. This perspective implies a spatial distribution connection among the samples instead of a time-series relationship.
For the computation of the 1D convolution, the input data undergo convolution with each filter and are subsequently activated through a non-linear activation function. This process is computed as follows:
X j = f ( i = 1 n ( W i · x j + b i ) )
The output data that are activated, represented by X j , are determined through a multi-step process. First, the raw input data, denoted as x j , interact with the weightings, W i , associated with the ith filter. This interaction involves convolving, or mathematically combining, the two elements. Next, a bias value, b i , is added to the convolved result. After that, a non-linear transformation function, f, is applied to the combined data. This non-linear function further alters the data. The passage indicates multiple filters, represented by the variable n.
This work utilizes a specialized activation function called the Smish function [40] in its convolutional layer. Compared to the commonly used Relu activation function [41], the Smish function is better suited for handling negative input values, an issue that frequently comes up when processing sensor data. The Smish activation brings additional benefits over Relu, given the characteristics of sensor feeds. The authors defined the Smish function through the following mathematical approach:
s m i s h ( x ) = x · t a n h ( l n ( 1 + s i g m o i d ( x ) ) )
The pooling layer downsamples the data after activation using the same padding to maintain a consistent output size. Within the convolution blocks, adjusting the stride parameter of the pooling filters shortens the time-series data length by altering how much the filters downsample, as follows:
l e n o u t = l e n i n p u t s
The length of the input time series is denoted as l e n i n p u t , the pooled kernel step size is represented as s, and the length of the pooled time series is denoted as l e n o u t .
Fluctuations in the neural network layer input distributions during training can cause gradient explosion or vanishing, known as the intermediate covariate shift problem [42]. To address this, Ioffe et al. [43] proposed batch normalization (BN). BN standardizes the batch data before each layer to stabilize training. It smooths gradient descent convergence, accelerating overall training. BN calculates the mean and variance of the input batches and then transforms them into standardized values for the next layer, as follows:
x i , k ^ = x i , k μ k σ k 2 + ε
where x i , k represents the k-dimensional component of x i in the training set {x}, μ k represents the mean of the k-dimensional component of all samples in the training set, and σ k 2 + ε represents the standard deviation of the k-dimensional component of all samples in the training set.
As shown in Figure 3, each convolution block contains Conv1D, BN, Smish activation, and max-pooling layers. These represent the core building blocks. In our proposed Att-ResBiGRU model, we utilize a four-layer architectural approach to stack these convolution blocks for the entire network. The detailed hyperparameters of the convolution blocks are shown in Table A6 in Appendix A.

3.3.2. Residual BiGRU Block

Accurate recognition of human activities necessitates more than relying on convolution blocks for spatial pattern extraction, as human behaviors unfold over time in an ordered sequence. Models designed for sequential data, like RNNs, are better suited for processing behavioral time-series inputs. However, as the length of the input time series grows, RNNs face challenges with gradients fading during backpropagation and losing information from earlier time steps.
As initially proposed by Hochreiter et al. [44], long short-term memory (LSTM) networks are a type of gated recurrent neural network able to retain long-range dependencies in sequence data. Unlike standard recurrent networks, LSTMs leverage internal gating mechanisms to store information over an extended time. This unique architecture enables LSTMs to model lengthy temporal contexts more effectively. However, human behavior exhibits complex bidirectional dynamics influenced by past and future actions.
Although LSTM shows promise as an alternative to RNNs for addressing the vanishing gradient problem, the memory cells in this architecture contribute to increased memory usage. In 2014, Cho et al. [45] introduced a new RNN-based model called the GRU network. GRU is a simplified version of LSTM that lacks a separate memory cell [46]. In a GRU network, update and reset gates are utilized to control the extent of modification for each hidden state. This means they determine which knowledge is essential for transmission to the next state and which is not. The BiGRU network, a two-way GRU network that considers both forward and backward information, enhances the extraction of time-series features compared to the GRU network by incorporating bidirectional dependencies. Consequently, a BiGRU network is appropriate for extracting time-series features from behavioral data.
While the BiLSTM network exhibits proficiency in deriving features from time-series data, its capability to capture spatial features diminishes. Moreover, during the training phase, the issue of gradient disappearance becomes more pronounced as the number of layered layers increases. ResNet, a residual network, was introduced by the Microsoft Research team in 2015 as a solution to the issue of gradient disappearance [47]. The 152-layer network in question won the ILSVRC championship in 2015. Each block comprising the residual is denoted as follows:
x i + 1 = x i + F ( x i , W i )
The residual blocks are composed of two components: the direct mapping ( x i ) and the residual portion ( F ( x i , W i ) ).
The encoder module of the Transformer model is similarly modified to accommodate the envisioned framework. Our inquiry presents an alternative framework that capitalizes on the advantages of the residual design utilizing the BiGRU network. Normalization techniques can be implemented within the BiGRU network. When considering recurrent neural networks, layer normalization (LN) is found to be more advantageous compared to BN [48]. LN is subjected to a similar computation process as BN and can be expressed as follows:
x ^ i = x i E ( x i ) v a r ( x i )
where x i denotes the input vector in the i-th dimension and x ^ i represents the output subsequent to layer normalization.
This research presents ResBiGRU, a novel integration of a residual structure and layer normalization in a BiGRU network (see Figure 4). Detailed below is an explanation of the recursive feature information y:
x t f ( i + 1 ) = L N ( x t f ( i ) + G ( x t f ( i ) , W i ) )
x t b ( i + 1 ) = L N ( x t b ( i ) + G ( x t b ( i ) , W i ) )
y t = c o n c a t ( x t f , x t b )
Layer normalization is referred to as L N in this specific context. In contrast, the management of input states within the GRU network is denoted as G. The variable t in x t f ( i + 1 ) represents the t-th moment in the time series. In contrast, f and b denote the forward and reverse phases. Furthermore, the value ( i + 1 ) denotes the quantity of layered layers. Denoted as y t , the encoded information at time t is merged from the corresponding values of f and b.
The ResBiGRU component extracts features from the time-series data following the convolutional blocks. This component incorporates the advantages of BiGRUs, which can analyze data in both directions with residual connections. These connections help the model learn long-term dependencies within the data, allowing it to better understand complex temporal patterns and ultimately improve recognition accuracy.

3.3.3. Attention Block

The utilization of the attention mechanism is prevalent across multiple domains within the realm of deep learning. In addition to capturing positional relationships among data, models that depend on this mechanism can also evaluate the significance of particular data features based on their intrinsic properties [49]. When implementing RNNs in activity recognition, conventional methods frequently employ the final feature information ( C = y t ) or the mean of the feature information ( C = 1 T t = 1 T y t ). These traditional methods need to account for the unique importance of various feature data in the context of behavior recognition, thus emphasizing a substantial shortcoming. By implementing the attention mechanism that Raffel and Ellis originally suggested [50], the precision of behavior prediction is improved. The calculation method for feature information C is as follows:
e t = f ( y t ) , α t = e x p ( e t ) i = 1 T e x p ( r t ) , C = t 1 T α t y t
In this context, the fully connected layer is pivotal in facilitating the backpropagation-based acquisition of the expression function f. Throughout the training, the weight α t remains constant, whereas the feature information C gradually gains greater representational significance as its significance evolves.

3.4. Evaluation Metrics

Assessing the effectiveness of recognition involves employing a confusion matrix, a distinct element that effectively illustrates the efficiency of deep learning models. The mathematical portrayal of a confusion matrix in a multiclass scenario is delineated below. In this representation, the rows denote instances in a predicted class, whereas the columns signify cases in the actual class.
C = c 11 c 12 c 13 c 1 n c 21 c 22 c 23 c 2 n c 31 c 32 c 33 c 3 n c n 1 c n 2 c n 3 c n n
The components of confusion corresponding to each class are as follows:
  • True positive: T P ( C i ) = C i i ;
  • False positive: F P ( C i ) = l = 1 n c l i T P ( C i ) ;
  • False negative: F N ( C i ) = l = 1 n c i l T P ( C i ) ;
  • True negative: T N ( C i ) = l = 1 n k = 1 n c l k T P ( C i ) F P ( C i ) F N ( C i ) .
The mathematical expressions for these assessment metrics are formulated as follows:
A c c u r a c y = 1 | C l a s s | × i = 1 | C l a s s | T P i + T N i T P i + F P i + T N i + F N i
P r e c i s i o n = 1 | C l a s s | × i = 1 | C l a s s | T P i T P i + F P i
R e c a l l = 1 | C l a s s | × i = 1 | C l a s s | T P i T P i + F N i
F 1 - s c o r e = 2 × P r e c i s i o n × R e c a l l P r e c i s i o n + R e c a l l
The datasets employed in this study exhibit an imbalance in their distribution. In tackling the challenge of uneven class representation in the data, we adopted the F1-score as an evaluation metric to identify the optimal parameter combination for the model, as recommended in [51]. As indicated in [52], this metric measures the model’s accuracy, particularly in imbalanced dataset scenarios.

4. Experiments and Results

This section delineates the experimental configuration employed to implement the deep learning models utilized in this study.

4.1. Experimental Setup

The investigations utilized in this research were performed on the Google Colab Pro+ platform [53]. In order to streamline the process of training deep learning models, a Tesla V100-SXM2-16GB GPU module was utilized. A range of foundational deep learning models, including the proposed Att-ResBiGRU model, were executed utilizing the Python library in conjunction with the Tensorflow backend (version 3.9.1) and CUDA (version 8.0.6). The GPU was utilized to accelerate the training and evaluation of deep learning models. The examinations were conducted utilizing the following Python libraries:
  • In order to read, manipulate, and comprehend the sensor data, the data management tools Numpy and Pandas were implemented.
  • In order to visually represent and illustrate the results of data exploration and model evaluation, Matplotlib and Seaborn were employed.
  • The Scikit-learn (Sklearn) library was utilized in sampling and data generation studies.
  • TensorFlow, Keras, and TensorBoard were utilized to implement and train the deep learning models for model construction.

4.2. Experimental Results of Position-Dependent HAR

We evaluated the proposed methodology for various on-body positions in this particular instance. Evaluating position-dependent HAR was paramount. The relevant tables, specifically Table 2, Table 3 and Table 4, present the F1-scores and accuracies of the Att-ResBiGRU model as suggested. The on-body positions from the three HAR datasets—Opportunity, PAMAP2, and REALWORLD16—are presented in these tables.
The findings presented in Table 2 enable the following significant observations to be drawn:
  • The model demonstrated commendable effectiveness when identifying position-dependent human activities on the Opportunity dataset. Accuracy scores spanned from 84.76% to 89.06% across the five sensor positions.
  • The F1-score of 85.69% and accuracy of 89.06% for the back position indicate that it produced the most valuable signals for activity recognition on the Opportunity dataset.
  • The effectiveness of the left lower arm (LLA) position was the lowest, with an accuracy of 84.76% and an F1-score of 79.84%. This finding implies that the left lower arm motion may not be as indicative of the actions designated in the Opportunity dataset.
  • The sensor’s efficacy generally declined as the position transitioned from the upper body (e.g., back, right upper arm) to the lower body (e.g., left upper arm, left lower arm). This is consistent with the hypothesis that signals from the upper body are more discriminatory for numerous prevalent activities.
  • The LLA position exhibited the smallest standard deviation in performance variation between trials, with approximately 0.7% for accuracy and 1.2% for the F1-score. Other positions showed a more significant variance, indicating greater inconsistency between studies.
The outcomes illustrate the model’s capacity to attain commendable performance in the HAR domain, with the performance varying according to the sensor positions. Significantly, variations in the efficacy of each sensor position for activity recognition can be observed. The most informative signals were obtained from the back and upper-arm positions in the provided dataset.
The following are the principal findings presented in Table 3:
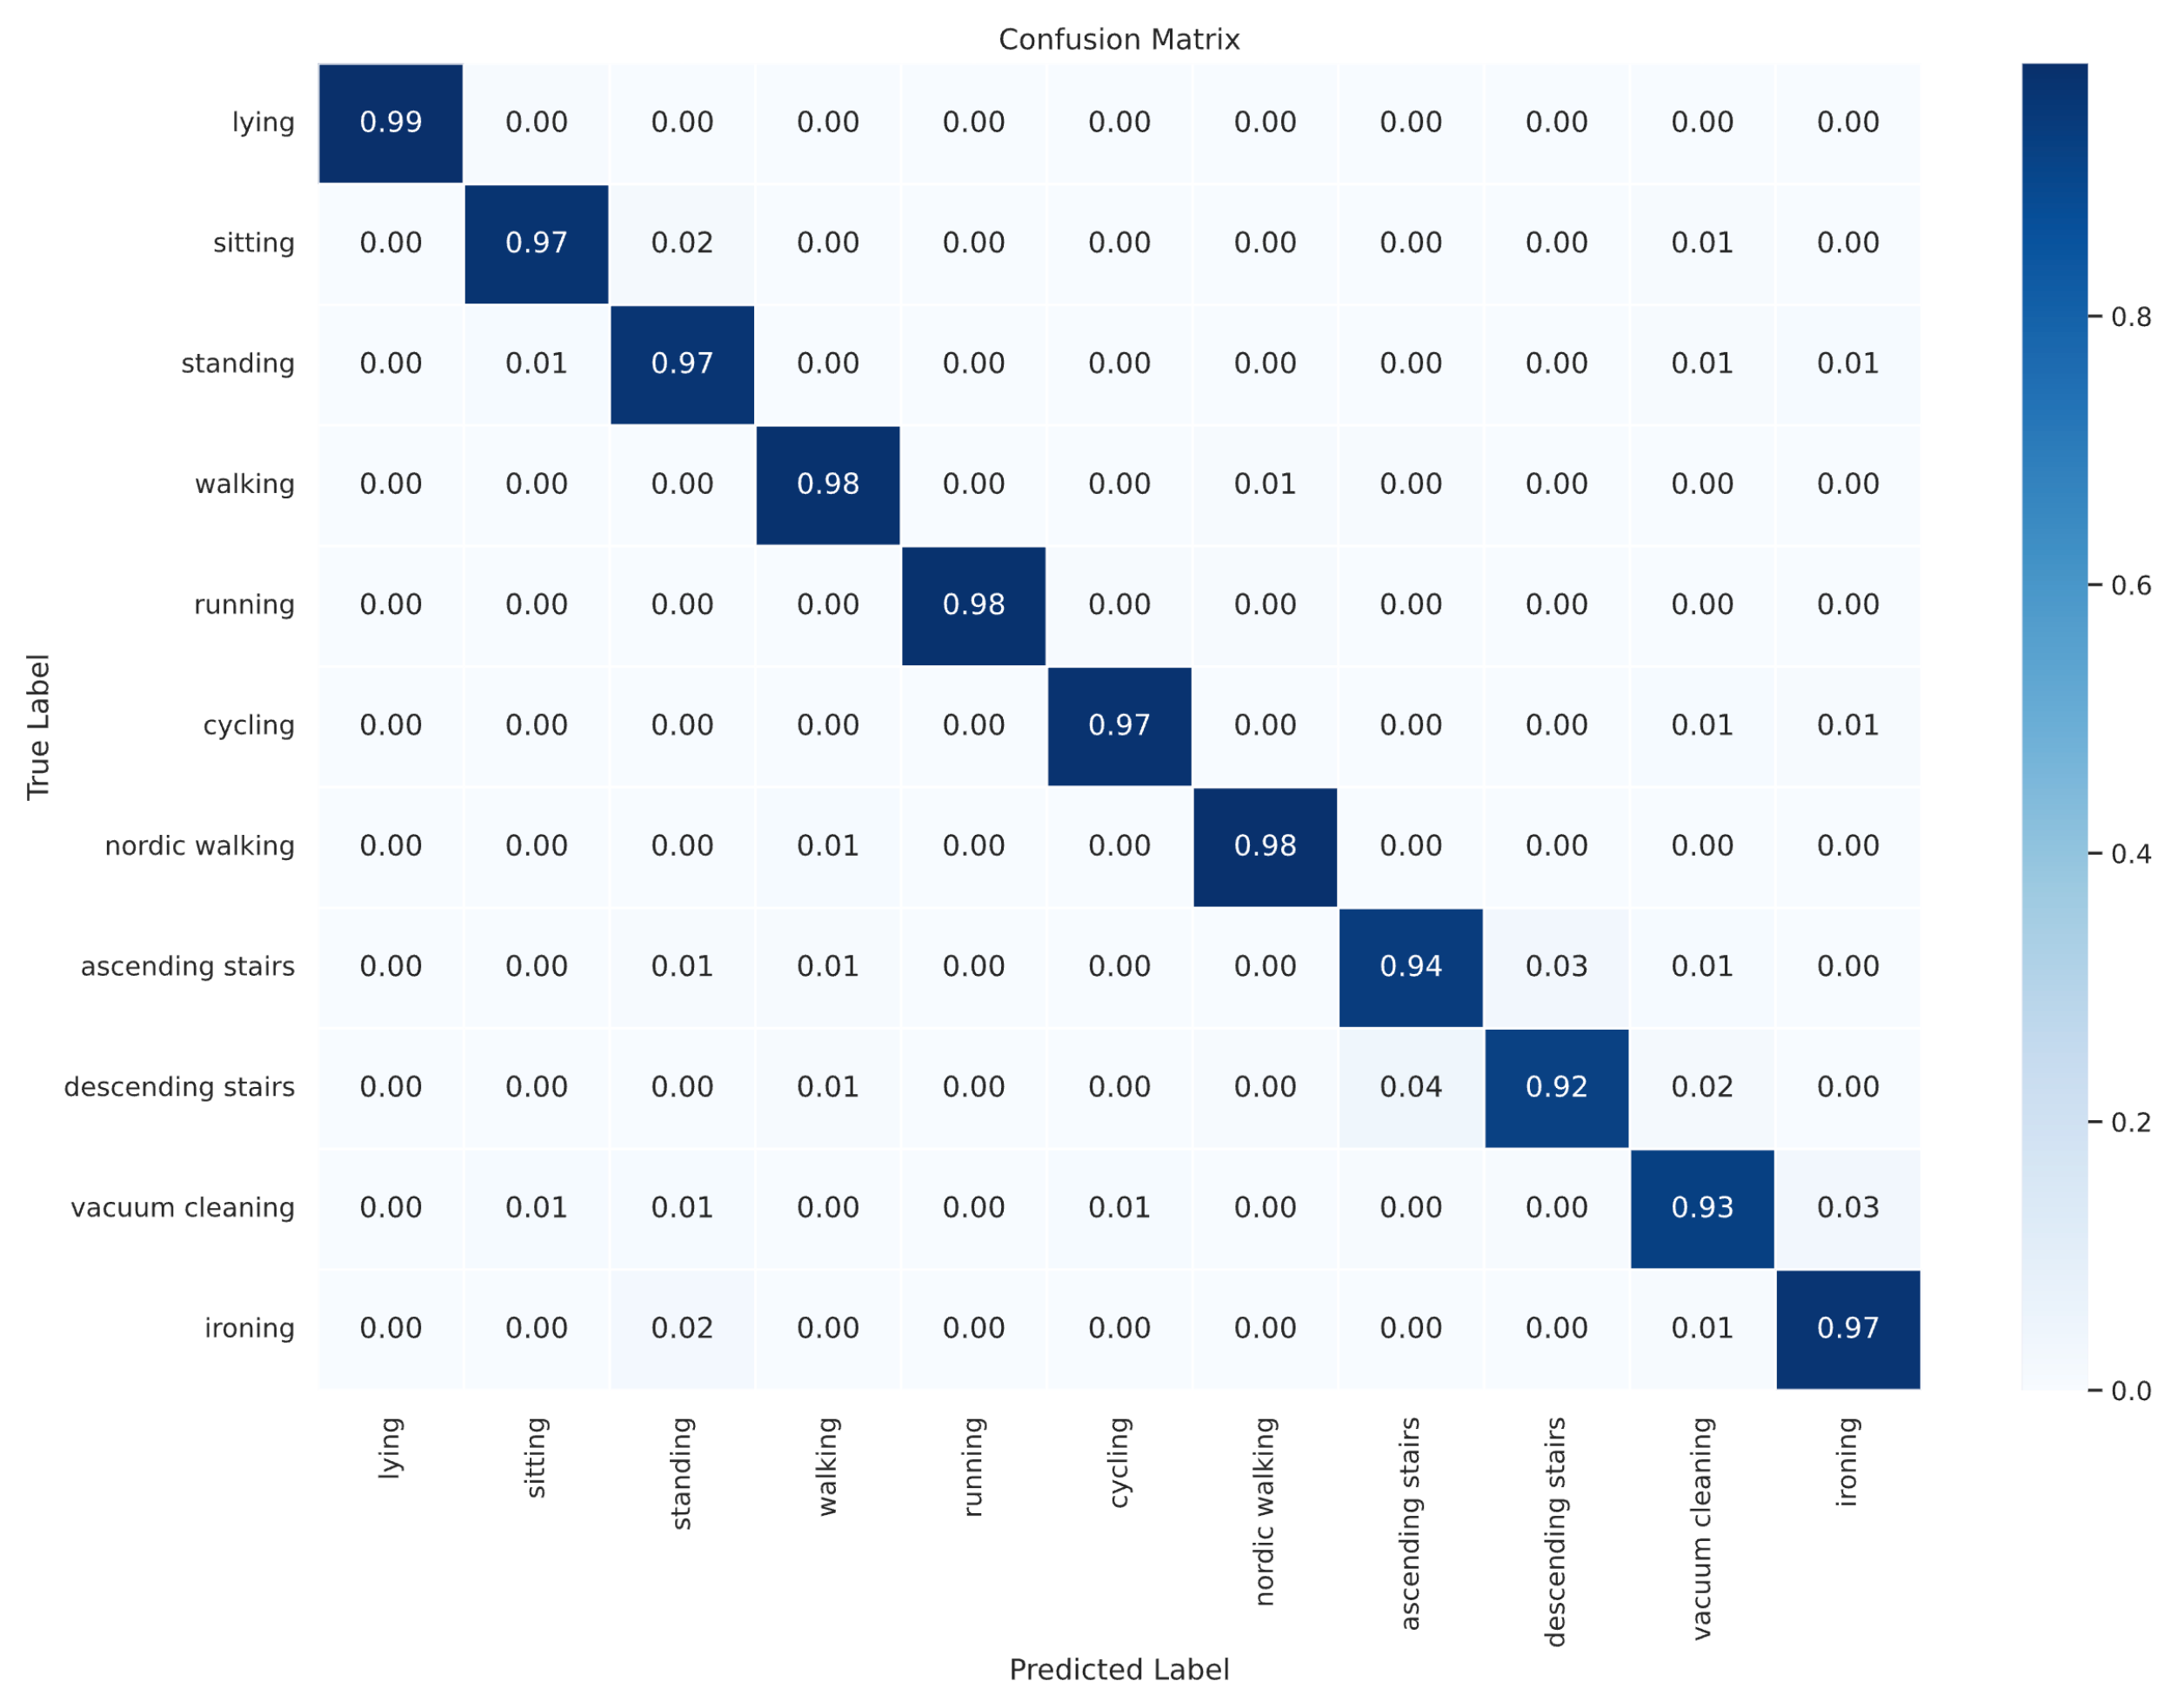
  • The model attained exceptionally high F1-scores and accuracies across all three sensor positions on the PAMAP2 dataset, with the accuracy varying from 97.11% to 97.59%.
  • The torso position exhibited superior performance, achieving an accuracy of 97.59% and an F1-score of 97.46%. This finding implies that the signals produced by upper-body motion were the most valuable for activity recognition in this dataset.
  • The effectiveness of the hand (97.12% accuracy) and ankle (97.25% accuracy) positions was comparable, indicating similar information provided by wrist and ankle movements for action recognition on PAMAP2.
  • The mean values of accuracy and F1-score standard deviations for each trial were below 0.3% and 0.26%, respectively, indicating that the model’s effectiveness remained consistent across numerous iterations.
  • All loss values were below 0.13, indicating that the model accurately represented the training data.
The Att-ResBiGRU model consistently exhibited outstanding HAR performance, particularly across different positions, when evaluated on the PAMAP2 dataset. The thoracic position yielded the most critical signals. The model’s robust generalization, observed across many test trials, was substantiated by the minimal deviations.
The key conclusions from the results presented in Table 4 are as follows:
  • The model achieved high F1-score ratings and accuracies ranging from 94.74% to 98.59% across all seven sensor positions on the REALWORLD16 dataset. Notably, the F1-score was 98.52%, and the quadriceps position achieved the highest accuracy of 98.59%, suggesting that thigh motion provided the most valuable signals for activity recognition in this dataset.
  • Conversely, the accuracy and F1-score for the forearm position were the lowest, at 94.74% and 94.75%, respectively, indicating that forearm motion was the least indicative of the activities.
  • Upper-body positions, including the chest, upper arm, and abdomen, consistently performed well, with accuracies above 97%. This finding supports the notion that the movement of the upper body provides valuable information regarding numerous everyday activities.
  • Notably, the standard deviations for the accuracies and F1-scores were less than 0.5% across all positions, suggesting minimal variance between trials and indicating the consistent effectiveness of the model.
  • Generally, the low loss values indicate that the model effectively aligned with the training data across different positions.
To sum up, the model exhibited robust position-dependent HAR on the REALWORLD16 dataset, with the most distinct signals arising from the motion of the thigh. The low variance in performance emphasizes the model’s reliable generalization.

4.3. Experimental Findings of Position-Independent HAR

The model developed in this study demonstrated potent interpretation for position-independent HAR across multiple datasets, as shown in Table 5. Specifically, it achieved high accuracies and F1-scores, regardless of the on-body sensor position. The F1-scores ranged from 90.27% on the Opportunity dataset to 96.61% on the PAMAP2 dataset. The highest scores were observed on the PAMAP2 dataset, indicating it provides the most useful aggregated signals for position-independent HAR. In contrast, performance was lowest on the Opportunity dataset, indicating greater variability in informative signals across positions.
Nevertheless, there was a slight variance between trials on all datasets, with accuracy and F1-score standard deviations under 0.3%. This points to consistent model performance across multiple test runs. Although loss values were relatively modest, they were slightly higher than those observed under position dependence. Some decline is expected when aggregating signals across various positions. Given its uniformity, the model successfully enabled position-independent HAR by aggregating multi-position signals, especially on PAMAP2. The results demonstrate the viability of machine learning for both position-dependent and position-independent sensor-based HAR.

5. Discussion

This section examines the experimental results presented in Section 4. Specifically, it contrasts the performance of the Att-ResBiGRU model in this work with baseline deep learning approaches. Two contexts are analyzed: position-dependent HAR, where the sensor location is fixed, and position-independent HAR, where the sensor position varies.

5.1. Comparison Results with Baseline Deep Learning Models on Position-Dependent HAR

To evaluate the proposed Att-ResBiGRU model, five baseline deep learning models (CNN, LSTM, bidirectional LSTM (BiLSTM), GRU, and BiGRU) were trained and tested using 5-fold cross-validation on three datasets: Opportunity, PAMAP2, and REALWORLD16. These models identify human activities based on wearable sensor data from various on-body locations specific to each dataset. For PAMAP2, this includes the hand, chest, ankle, and right upper arm. REALWORLD16 uses the back, right upper/lower arm, and left upper/lower arm. The other dataset utilizes the chest, forearm, head, shin, thigh, upper arm, and waist. Two separate experiments were conducted to evaluate the efficacy of the suggested Att-ResBiGRU model: position-dependent activity recognition, where the sensor location was specified, and position-independent recognition, where the position varied.
Compared to the CNN, LSTM, BiLSTM, GRU, and BiGRU models, the proposed Att-ResBiGRU model achieved superior F1-scores across all sensor locations and datasets, as shown in Figure 5. The most significant performance gains were observed on the Opportunity dataset, with F1-scores over 5% higher than the next most satisfactory model. On the PAMAP2 and REALWORLD16 datasets, Att-ResBiGRU showed modest but meaningful improvements of around 2% in the F1-score over alternative models. CNN could have performed better overall, highlighting the limitations of solely using convolutional layers for sequential sensor data classification. The close scores between BiGRU and Att-ResBiGRU demonstrate the advantages of bidirectional architectures over standard LSTM and GRU for human activity recognition. However, the additional residual connections and attention mechanisms in Att-ResBiGRU led to a significant performance boost compared to BiGRU, especially on the Opportunity dataset.
The results demonstrate significant improvements in performance using the Att-ResBiGRU model compared to standard deep learning models for position-based HAR on various datasets. Incorporating residual connections and attention components substantially enhances the modeling of sequential sensor information.

5.2. Comparison Results with Baseline Deep Learning Models on Position-Independent HAR

The preceding section concentrated on HAR, which relies on position information. The proposed Att-ResBiGRU was evaluated against five fundamental deep neural networks (CNN, LSTM, BiLSTM, GRU, and BiGRU), demonstrating superior performance. In this part, we assess the position-independent proficiency of Att-ResBiGRU by comparing it with established recurrent and convolutional baseline architectures. The evaluation used the Opportunity, PAMAP2, and REALWORLD16 datasets, employing consistent experimental protocols.
Examining the outcomes of the position-independent human activity recognition comparison presented in Figure 6 across the Opportunity, PAMAP2, and REALWORLD16 benchmark datasets revealed several noteworthy observations. Initially, our proposed Att-ResBiGRU framework consistently attained the highest average F1-scores, reaching 86.69%, 96.44%, and 96.23% on the dataset compilations. This underscores its advanced generalization capabilities.
Specifically, when confronted with the intricate activities in the Opportunity dataset, the performance of the proposed model surpassed that of RNN variants such as LSTM and GRU by over 15% while also outperforming the CNN baseline by nearly 10% in terms of the F1-score. The incorporation of residual bidirectionality and attention mechanisms demonstrably enhances disambiguation fidelity.
These advantages become even more evident when assessing the daily activity datasets of PAMAP2 and REALWORLD16. On PAMAP2, we surpassed the performance of BiGRU by 2.56%, and on REALWORLD16, we surpassed alternative fusion approaches by more than 1.95% in terms of the F1-score, substantiating our model’s efficacy in recognizing sequential daily living motions.

5.3. Comparison Results with State-of-the-Art Models

To underscore the importance and dependability of the proposed Att-ResBiGRU in both position-dependent and position-independent HAR, this research conducted a comparison of performance using the same benchmark HAR datasets employed in this study, namely the PAMAP2 and REALWORLD16 datasets, against state-of-the-art studies.
When scrutinizing the outcomes of position-dependent HAR on the PAMAP2 dataset, as presented in Table 6, several noteworthy observations can be made regarding the performance of our Att-ResBiGRU model compared to earlier state-of-the-art approaches. Most notably, our model achieved superior F1-scores across all three positions of wearable devices—wrist, chest, and ankle. Specifically, we obtained a 96.95% F1-score for the hand, 97.46% F1-score for the chest, and 97.17% F1-score for the ankle.
This signifies a noteworthy improvement of over 3% in absolute terms compared to the best-performing random forest (RF), support vector machine (SVM), and decision tree (DT) [22] models for the hand position. Similarly, enhancements of nearly 1% were observed compared to previous works [22] utilizing chest and ankle sensors.
Examining the outcomes of HAR based on sensor positions in the REALWORLD16 dataset, as displayed in Table 7, revealed consistent enhancements in performance through the application of our proposed Att-ResBiGRU methodology when compared to prior state-of-the-art approaches [54,55] across all seven sensor locations.
Notably, we attained F1-scores exceeding 96% on the chest, upper-arm, and waist positions, surpassing 94% on the wrist/forearm, and exceeding 97% on the head and shin positions using the proposed Att-ResBiGRU model. This signifies substantial improvements in F1-scores ranging from 3% to 13% in absolute terms when compared to the previously top-performing two-stream CNN [54] and random forest (RF) model [55].
In position-independent HAR, our examination involved assessing the effectiveness of Att-ResBiGRU by comparing it with currently established leading techniques outlined in [54,55,56]. We opted for this comparison because the authors provided evaluations on the identical PAMAP2 and REALWORLD16 datasets. The comparative analysis is presented in Table 8, showcasing the superior results achieved by Att-ResBiGRU compared to previous studies’ findings.
Examining the outcomes presented in Table 8, which compares the performance of our proposed Att-ResBiGRU model with existing cutting-edge techniques in position-independent human activity recognition on the PAMAP2 and REALWORLD16 benchmark datasets, revealed highly promising advancements in performance.
On the PAMAP2 dataset, our methodology achieved an F1-score of 96.44%, surpassing all baseline methods such as RF, SVM, k-nearest neighbors (KNN), Bayes Net (NB), and DT, which exhibited F1-scores ranging from 78% to 91%. Similarly, on the REALWORLD16 dataset, we attained a 96.23% F1-score, outperforming previous works utilizing CNN, LSTM, and multi-layer perceptron (MLP) architectures that reported F1-scores between 88% and 90%. Notably, a multi-stream CNN architecture achieved an F1-score of 90%, a mark we surpassed through our comprehensive management of positional independence.

5.4. Effects of Complex Activities on Position-Independent HAR

The effectiveness of systems in recognizing human activities without relying on position information may need to be improved when dealing with intricate and dynamic real-world activities. To assess the capacity of our Att-ResBiGRU model to handle more complex real-world activities, we conducted a multi-label evaluation encompassing locomotive movements and activities of daily living on the Opportunity, PAMAP2, and REALWORLD16 datasets.
Upon scrutinizing the confusion matrices for the Opportunity and PAMAP2 datasets, we observed robust performance in accurately classifying a significant portion of complex ambulation, gesture, and daily living activities using our Att-ResBiGRU model. The misclassifications tended to concentrate along the main diagonals. Overall accuracy levels exceeded 90% for Opportunity and 96% for PAMAP2 across diverse activity sets, as illustrated in Figure 7 and Figure 8, respectively. Additionally, the accuracy information of the confusion matrix of REALWORLD16 dataset is shown in Figure 9.
Nevertheless, certain instances posed challenges in accurately distinguishing between subtle sequential pairs of activities, particularly those involving intricate limb or joint movements and swift transitions. To illustrate, about 4% of instances representing the “Open door 1” activity in the Opportunity dataset were incorrectly classified as the similar “Close door 1” activity, introducing difficulties in discerning the completion of complex interactions.
Moreover, in the case of PAMAP2, there was a 12.3% rate of confusion between “Ascending stairs” and “Descending stairs.” Predictably, activities with more consistent signals, such as Cycling, were easier to discern compared to these transient multi-stage sequences. This underscores the potential to incorporate additional positional constraints and environmental triggers to improve the detection of activity commencement and conclusion.

5.5. Ablation Studies

In the realm of neural networks, researchers often use ablation studies to understand how different parts of a model contribute to its overall performance [57]. This technique involves systematically removing or modifying components and observing the resulting impact. Following this approach, we conducted three ablation studies on our proposed Att-ResBiGRU model. In each case, we altered specific blocks or layers to assess their influence on the model’s accuracy [58,59]. By analyzing the results of these studies, we identified the configuration that yielded the best recognition performance, thus optimizing our model’s effectiveness.
In analyzing model variations, the F1-score serves as a crucial metric. This safeguards against inflated evaluation scores from merely selecting the predominant class within imbalanced datasets. Instead, it furnishes precise insights into the model’s proficiency in handling diverse class activities [12].

5.5.1. Impact of Convolution Blocks

To understand how adding convolution blocks affected our model’s performance, we conducted ablation experiments on the three datasets (Opportunity, PAMAP2, and REALWORLD16) using wearable sensor data.
We compared our proposed model with and without convolution blocks. The model without them served as the baseline. As shown in Table 9, the baseline model performed the worst, possibly due to difficulties capturing spatial relationships between data points. Conversely, the model with convolution blocks achieved significantly better results. The F1-score improved across all three datasets: Opportunity (from 86.56% to 86.69%), PAMAP2 (from 95.13% to 96.44%), and REALWORLD16 (from 95.80% to 96.23%). These findings demonstrate the positive impact of incorporating convolution blocks in our model for activity recognition tasks.

5.5.2. Impact of the ResBiGRU Block

We conducted another ablation experiment to further assess the convolutional block’s ability to capture spatial features. We compared our full model with a modified version that lacked the residual BiGRU block. This modified version served as the baseline.
Table 10 summarizes the results. The model with the residual BiGRU block achieved significantly better performance, demonstrating the effectiveness of this block in processing temporal information. The F1-score improvements were substantial across all datasets: Opportunity (1.66%), PAMAP2 (1.55%), and REALWORLD16 (2.07%). These findings highlight the importance of the residual BiGRU block in enhancing the model’s ability to recognize activities from time-series data.

5.5.3. Effect of the Attention Block

Our proposed Att-ResBiGRU model incorporates an attention mechanism that directs focus toward crucial aspects of the learned spatial-temporal features before classification. This mechanism is vital in achieving position invariance by selectively reweighting signals and suppressing noise.
We conducted an ablation experiment to verify the attention block’s significance. We created a modified version of the model that lacked the attention block while keeping the convolutional and residual BiGRU modules intact. This modified model served as the baseline for comparison.
We evaluated both models on all three benchmark datasets. As shown in Table 11, the Att-ResBiGRU model with the attention block achieved superior performance across all datasets. The F1-score improvements were 0.38% for Opportunity, 1.37% for PAMAP2, and 1.00% for REALWORLD16. These results demonstrate the effectiveness of the attention mechanism in enhancing the model’s recognition accuracy.
Our Att-ResBiGRU model efficiently extracts informative features from wearable sensor data by combining convolutional blocks, a residual BiGRU block, and an attention mechanism. This combination effectively captures spatial relationships, temporal dependencies, and crucial aspects of the data, leading to superior performance in activity recognition tasks.

5.6. Complexity Analysis

To assess the resource requirements of our proposed model, we conducted a complexity analysis inspired by the approach presented in [60] for HAR. This analysis evaluated the memory usage, average prediction time, and number of parameters that can be adjusted during training. All models, including the baseline versions, were tested on the same benchmark datasets (Opportunity, PAMAP2, and REALWORLD16).

5.6.1. Memory Consumption

We compared the memory usage of our Att-ResBiGRU model with several baseline architectures (CNN, LSTM, BiLSTM, GRU, and BiGRU) during prediction on the test datasets. We employed the compute unified device architecture (CUDA) profiling tools to measure memory consumption. Figure 10 shows the results. Our model required an average of 3MB of RAM, which was used to store the encoder features, temporal hidden states, classifier weights, and outputs. This was lower than the baseline CNN, which consumed 4.27 MB, on average, for shorter sequences. However, the standalone BiGRU model did not capture spatial information through convolutions and used slightly less memory (3.60 MB, on average). Overall, Att-ResBiGRU offered a good balance between accuracy and memory efficiency.

5.6.2. Prediction Time

To delve deeper into the models’ resource usage, we compared their prediction speeds. We measured the average time each model took to process a set of samples from the test data. This average time represents the mean prediction time.
Figure 11 illustrates the average time in milliseconds each model took to process a single data window across the three datasets (Opportunity, PAMAP2, and REALWORLD16). The BiGRU models were the slowest, requiring 0.32–0.78 ms per window for all datasets. This is likely due to their sequential processing nature, where each step relies on the previous output. In contrast, convolutional layers, like those used in Att-ResBiGRU, can operate in parallel, leading to faster processing. Consequently, Att-ResBiGRU achieved faster prediction times, averaging 0.54 ms, 0.58 ms, and 0.27 ms for Opportunity, PAMAP2, and REALWORLD16, respectively.

5.6.3. Trainable Parameters

After examining memory usage and prediction speed, we now turn to the third metric of model complexity: the number of trainable parameters. In deep learning models, each adjustable weight during training counts as a trainable parameter. Generally, a higher number of parameters allows a model to capture more intricate data patterns but also increases the risk of overfitting on limited training data.
Figure 12 displays the number of trainable parameters for the various deep learning models used in this study (CNN, LSTM, BiLSTM, GRU, BiGRU, and our proposed Att-ResBiGRU). These values were obtained from model summaries across the benchmark HAR datasets (Opportunity, PAMAP2, and REALWORLD16). As expected, based on their complexity, the baseline models showed varying parameter counts. The GRU emerged as the simplest model, with around 130,000 parameters for each dataset. Conversely, the CNN boasted the highest parameter count, signifying its greater complexity. Our proposed Att-ResBiGRU fell between these extremes, exhibiting a moderate parameter count of approximately 250,000 across all datasets. Att-ResBiGRU maintained a lower parameter count compared to CNN, BiLSTM, and BiGRU.

5.7. Interpretation of the Proposed Model

Deep learning models, often considered black boxes, require explanation techniques like LIME to understand their decision-making processes. LIME helps us analyze how the model arrives at specific predictions and how different features contribute to those outcomes [61]. Building trust in deep learning models for HAR necessitates examining how they classify individual data points across various categories. This approach can reduce the number of features considered, potentially leading to faster training times and improved accuracy by focusing on the most influential elements. To establish clinical trust in deep learning approaches for activity prediction, it is crucial to understand the role of motion features captured by sensors like accelerometers, gyroscopes, and magnetometers. Explainable AI (XAI) can be valuable in exploring how these features contribute to the model’s classification decisions.
To enhance our model’s understandability and transparency, we leveraged a technique called Grad-CAM (Gradient-weighted Class Activation Mapping) [62]. This technique helps us visualize and pinpoint the specific regions within the sensor data that significantly influence the model’s predictions.
For time-series data, Grad-CAM identified the most crucial moments within the sequence that influenced the network’s classification decision. Figure 13 showcases an example sequence, with a colormap highlighting these critical regions [63]. In this study, we extracted and normalized the activation features generated by Grad-CAM to a range between 0 and 1. Figure 13 displays the Grad-CAM activations for randomly chosen segments on the Opportunity, PAMAP2, and REALWORLD16 datasets using our proposed Att-ResBiGRU models. Lighter colors indicate higher activation values, signifying a more significant impact on the prediction. The results for each dataset (Opportunity, PAMAP2, and REALWORLD16) are presented in rows 1, 2, and 3, respectively.

6. Conclusions, Limitations, and Future Work

This study investigates the potential of deep learning models for recognizing human activities, regardless of the user’s position. We propose a novel deep residual network, Att-ResBiGRU, to achieve high accuracy in activity identification. This network incorporates three key components:
  • Convolutional blocks: These blocks extract spatial features from the sensor data. Each block uses a 1D convolutional layer to capture patterns, followed by batch normalization for stability and pooling to reduce data size while preserving key information.
  • ResBiGRU block: This block captures temporal features by considering both past and future data points in the sequence. This bidirectional approach effectively models the dependencies and dynamics within the data.
  • Attention mechanism: This mechanism assigns greater importance to informative features, enhancing the model’s ability to distinguish between similar activities and improving recognition accuracy.
We evaluated Att-ResBiGRU on three public datasets, achieving overall F1-scores of 86.69%, 96.44%, and 96.23% for position-independent HAR on Opportunity, PAMAP2, and REALWORLD16, respectively. Ablation experiments confirmed the effectiveness of each component, demonstrating the model’s superior ability to differentiate between similar actions.
Furthermore, our proposed model outperformed existing state-of-the-art techniques, showcasing its exceptional performance in position-independent HAR. Notably, Att-ResBiGRU surpassed the current leading method, establishing itself as a robust single classifier for this task. We also investigated the model’s practical utility in situations without regard to position or subject, an area with considerable promise that has yet to see much research.

6.1. Limitations

Although our experiments showcased promising results for position-independent activity recognition using affordable wearable sensors, there are challenges to consider when deploying this deep learning model in real-world settings:
  • Computational limitations: The Att-ResBiGRU model requires up to 4MB of memory, exceeding the capabilities of low-power wearable devices like smartwatches. To address this, model compression and quantization techniques are necessary for deployment on resource-constrained devices.
  • Sensor drift: Sensor performance can degrade over time, leading to changes in signal distribution and potentially impacting the model’s accuracy. Implementing mechanisms for recalibration or adaptive input normalization would enhance robustness.
  • Battery life: Continuous sensor data collection for long-term activity tracking rapidly depletes battery life. Optimizing duty-cycling strategies is crucial to enable more extended monitoring periods.
  • Privacy concerns: Transmitting raw, multi-dimensional sensor data raises privacy concerns, as it could reveal sensitive information about daily activities or underlying health conditions. Federated learning and selective feature-sharing approaches could mitigate these concerns and encourage user adoption

6.2. Future Work

Although our research lays the groundwork, further efforts are needed to achieve higher accuracy in position-independent HAR. Here are some promising avenues for future exploration:
  • Expanding data sources: Although this work focused on inertial sensors from wearable devices, future studies could incorporate data from environmental sensors like pressure, humidity, and even CCTV frames. This multi-modal approach could enhance the model’s ability to recognize activities by leveraging contextual information beyond the user’s body.
  • Cross-domain generalizability: By incorporating data from diverse sources, we can assess the model’s ability to adapt and perform well in different environments. This could lead to more robust and generalizable solutions.
  • User-centered design: Future studies should involve qualitative user experience studies to ensure user acceptance and comfort. Gathering feedback from relevant patient populations and clinical experts will be crucial in informing the design of unobtrusive and user-friendly systems.
These future directions hold the potential to significantly improve the accuracy, usability, and real-world applicability of position-independent HAR systems.

Author Contributions

Conceptualization, S.M. and A.J.; methodology, S.M.; software, A.J.; validation, A.J.; formal analysis, S.M.; investigation, S.M.; resources, A.J.; data curation, A.J.; writing—original draft preparation, S.M.; writing—review and editing, A.J.; visualization, S.M.; supervision, A.J.; project administration, A.J.; funding acquisition, S.M. and A.J. All authors have read and agreed to the published version of the manuscript.

Funding

This research was funded by the Thailand Science Research and Innovation Fund; the University of Phayao (Grant No. FF67-UoE-Sakorn); and King Mongkut’s University of Technology North Bangkok under Contract No. KMUTNB-67-KNOW-12.

Institutional Review Board Statement

Not applicable.

Informed Consent Statement

Not applicable.

Data Availability Statement

All data are presented in the main text.

Conflicts of Interest

The authors declare no conflicts of interest.

Appendix A

Table A1. A summary of the hyperparameters for the CNN network used in this work.
StageHyperparametersValues
Architecture1D ConvolutionKernel Size5
Stride1
Filters64
Dropout 0.25
Max Pooling 2
Flatten -
TrainingLoss Function Cross-entropy
Optimizer Adam
Batch Size 64
Number of Epochs 200
Table A2. A summary of the hyperparameters for the LSTM network used in this work.
StageHyperparametersValues
ArchitectureLSTM Unit128
Dropout0.25
Dense128
TrainingLoss FunctionCross-entropy
OptimizerAdam
Batch Size64
Number of Epochs200
Table A3. A summary of the hyperparameters for the BiLSTM network used in this work.
StageHyperparametersValues
ArchitectureBiLSTM Unit128
Dropout0.25
Dense128
TrainingLoss FunctionCross-entropy
OptimizerAdam
Batch Size64
Number of Epochs200
Table A4. A summary of the hyperparameters for the GRU network used in this work.
StageHyperparametersValues
ArchitectureGRU Unit128
Dropout0.25
Dense128
TrainingLoss FunctionCross-entropy
OptimizerAdam
Batch Size64
Number of Epochs200
Table A5. A summary of the hyperparameters for the BiGRU network used in this work.
StageHyperparametersValues
ArchitectureBiGRU Unit128
Dropout0.25
Dense128
TrainingLoss FunctionCross-entropy
OptimizerAdam
Batch Size64
Number of Epochs200
Table A6. A summary of the hyperparameters for the Att-ResBiGRU network used in this work.
StageHyperparametersValues
Architecture(Convolution Block)
1D ConvolutionKernel Size5
Stride1
Filters256
Batch Normalization -
Activation Smish
Max Pooling 2
Dropout 0.25
1D ConvolutionKernel Size5
Stride1
Filters128
Batch Normalization -
Activation Smish
Max Pooling 2
Dropout 0.25
1D ConvolutionKernel Size5
Stride1
Filters64
Batch Normalization -
Activation Smish
Max Pooling 2
Dropout 0.25
1D ConvolutionKernel Size5
Stride1
Filters32
Batch Normalization -
Activation Smish
Max Pooling 2
Dropout 0.25
(Residual BiGRU Block)
ResBiGRU_1Neural128
ResBiGRU_2Neural64
(Attention Block)
Dropout 0.25
Dense 128
Activation SoftMax
TrainingLoss Function Cross-entropy
Optimizer Adam
Batch Size 64
Number of Epochs 200

References

  1. Mekruksavanich, S.; Jitpattanakul, A. LSTM Networks Using Smartphone Data for Sensor-Based Human Activity Recognition in Smart Homes. Sensors 2021, 21, 1636. [Google Scholar] [CrossRef]
  2. Diraco, G.; Rescio, G.; Caroppo, A.; Manni, A.; Leone, A. Human Action Recognition in Smart Living Services and Applications: Context Awareness, Data Availability, Personalization, and Privacy. Sensors 2023, 23, 6040. [Google Scholar] [CrossRef] [PubMed]
  3. Maity, S.; Abdel-Mottaleb, M.; Asfour, S.S. Multimodal Low Resolution Face and Frontal Gait Recognition from Surveillance Video. Electronics 2021, 10, 1013. [Google Scholar] [CrossRef]
  4. Khalid, A.M.; Khafaga, D.S.; Aldakheel, E.A.; Hosny, K.M. Human Activity Recognition Using Hybrid Coronavirus Disease Optimization Algorithm for Internet of Medical Things. Sensors 2023, 23, 5862. [Google Scholar] [CrossRef] [PubMed]
  5. Stisen, A.; Blunck, H.; Bhattacharya, S.; Prentow, T.S.; Kjærgaard, M.B.; Dey, A.; Sonne, T.; Jensen, M.M. Smart Devices Are Different: Assessing and MitigatingMobile Sensing Heterogeneities for Activity Recognition. In Proceedings of the 13th ACM Conference on Embedded Networked Sensor Systems (SenSys’15), Seoul, Republic of Korea, 1–4 November 2015; Association for Computing Machinery: New York, NY, USA, 2015; pp. 127–140. [Google Scholar] [CrossRef]
  6. Nweke, H.F.; Teh, Y.W.; Al-garadi, M.A.; Alo, U.R. Deep learning algorithms for human activity recognition using mobile and wearable sensor networks: State of the art and research challenges. Expert Syst. Appl. 2018, 105, 233–261. [Google Scholar] [CrossRef]
  7. Ha, S.; Yun, J.M.; Choi, S. Multi-modal Convolutional Neural Networks for Activity Recognition. In Proceedings of the 2015 IEEE International Conference on Systems, Man, and Cybernetics, Hong Kong, China, 9–12 October 2015; pp. 3017–3022. [Google Scholar] [CrossRef]
  8. Zebin, T.; Scully, P.J.; Ozanyan, K.B. Human activity recognition with inertial sensors using a deep learning approach. In Proceedings of the 2016 IEEE SENSORS, Orlando, FL, USA, 30 October–3 November 2016; pp. 1–3. [Google Scholar] [CrossRef]
  9. Chen, K.; Zhang, D.; Yao, L.; Guo, B.; Yu, Z.; Liu, Y. Deep Learning for Sensor-Based Human Activity Recognition: Overview, Challenges, and Opportunities. ACM Comput. Surv. 2021, 54, 77. [Google Scholar] [CrossRef]
  10. Fedorov, I.; Adams, R.P.; Mattina, M.; Whatmough, P.N. SpArSe: Sparse Architecture Search for CNNs on Resource-Constrained Microcontrollers. In Proceedings of the 33rd International Conference on Neural Information Processing Systems, Vancouver, BC, Canada, 8–14 December 2019; Curran Associates Inc.: Red Hook, NY, USA, 2019. [Google Scholar]
  11. Zhang, Y.; Suda, N.; Lai, L.; Chandra, V. Hello Edge: Keyword Spotting on Microcontrollers. arXiv 2018, arXiv:1711.07128. Available online: http://xxx.lanl.gov/abs/1711.07128 (accessed on 5 January 2024).
  12. Ojiako, K.; Farrahi, K. MLPs Are All You Need for Human Activity Recognition. Appl. Sci. 2023, 13, 11154. [Google Scholar] [CrossRef]
  13. Anguita, D.; Ghio, A.; Oneto, L.; Parra, X.; Reyes-Ortiz, J.L. A Public Domain Dataset for Human Activity Recognition using Smartphones. In Proceedings of the European Symposium on Artificial Neural Networks, Bruges, Belgium, 24–26 April 2013; pp. 437–442. [Google Scholar]
  14. Ronald, M.; Poulose, A.; Han, D.S. iSPLInception: An Inception-ResNet Deep Learning Architecture for Human Activity Recognition. IEEE Access 2021, 9, 68985–69001. [Google Scholar] [CrossRef]
  15. Shi, D.; Wang, R.; Wu, Y.; Mo, X.; Wei, J. A novel orientation- and location-independent activity recognition method. Pers. Ubiquitous Comput. 2017, 21, 427–441. [Google Scholar] [CrossRef]
  16. Kwapisz, J.R.; Weiss, G.M.; Moore, S.A. Activity Recognition Using Cell Phone Accelerometers. SIGKDD Explor. Newsl. 2011, 12, 74–82. [Google Scholar] [CrossRef]
  17. Bieber, G.; Luthardt, A.; Peter, C.; Urban, B. The Hearing Trousers Pocket: Activity Recognition by Alternative Sensors. In Proceedings of the 4th International Conference on PErvasive Technologies Related to Assistive Environments (PETRA’11), Crete, Greece, 25–27 May 2011; Association for Computing Machinery: New York, NY, USA, 2011. [Google Scholar] [CrossRef]
  18. Kwon, Y.; Kang, K.; Bae, C. Unsupervised learning for human activity recognition using smartphone sensors. Expert Syst. Appl. 2014, 41, 6067–6074. [Google Scholar] [CrossRef]
  19. Harasimowicz, A.; Dziubich, T.; Brzeski, A. Accelerometer-based Human Activity Recognition and the Impact of the Sample Size. In Proceedings of the Advances in Neural Networks, Fuzzy Systems and Artificial Intelligence, Gdansk, Poland, 15–17 May 2014. [Google Scholar]
  20. Ustev, Y.E.; Durmaz Incel, O.; Ersoy, C. User, Device and Orientation Independent Human Activity Recognition on Mobile Phones: Challenges and a Proposal. In Proceedings of the Proceedings of the 2013 ACM Conference on Pervasive and Ubiquitous Computing Adjunct Publication (UbiComp’13 Adjunct), Zurich, Switzerland, 8–12 September 2013; Association for Computing Machinery: New York, NY, USA, 2013; pp. 1427–1436. [Google Scholar] [CrossRef]
  21. Shoaib, M.; Bosch, S.; Incel, O.D.; Scholten, H.; Havinga, P.J.M. Complex Human Activity Recognition Using Smartphone and Wrist-Worn Motion Sensors. Sensors 2016, 16, 426. [Google Scholar] [CrossRef]
  22. Qamar, N.; Siddiqui, N.; ul Haq, M.E.; Awais Azam, M.; Naeem, U. An Approach towards Position-Independent Human Activity Recognition Model based on Wearable Accelerometer Sensor. Procedia Comput. Sci. 2020, 177, 196–203. [Google Scholar] [CrossRef]
  23. Henpraserttae, A.; Thiemjarus, S.; Marukatat, S. Accurate Activity Recognition Using a Mobile Phone Regardless of Device Orientation and Location. In Proceedings of the 2011 International Conference on Body Sensor Networks, Dallas, TX, USA, 23–25 May 2011; pp. 41–46. [Google Scholar] [CrossRef]
  24. Grokop, L.H.; Sarah, A.; Brunner, C.; Narayanan, V.; Nanda, S. Activity and Device Position Recognition in Mobile Devices. In Proceedings of the 13th International Conference on Ubiquitous Computing (UbiComp ’11), Beijing China, 17–21 September 2011; Association for Computing Machinery: New York, NY, USA, 2011; pp. 591–592. [Google Scholar] [CrossRef]
  25. Coskun, D.; Incel, O.D.; Ozgovde, A. Phone position/placement detection using accelerometer: Impact on activity recognition. In Proceedings of the 2015 IEEE Tenth International Conference on Intelligent Sensors, Sensor Networks and Information Processing (ISSNIP), Singapore, 7–9 April 2015; pp. 1–6. [Google Scholar] [CrossRef]
  26. Miao, F.; He, Y.; Liu, J.; Li, Y.; Ayoola, I. Identifying typical physical activity on smartphone with varying positions and orientations. Biomed. Eng. Online 2015, 14, 32. [Google Scholar] [CrossRef]
  27. Gu, F.; Kealy, A.; Khoshelham, K.; Shang, J. User-Independent Motion State Recognition Using Smartphone Sensors. Sensors 2015, 15, 30636–30652. [Google Scholar] [CrossRef] [PubMed]
  28. Shi, X.; Li, Y.; Zhou, F.; Liu, L. Human Activity Recognition Based on Deep Learning Method. In Proceedings of the 2018 International Conference on Radar (RADAR), Brisbane, QLD, Australia, 27–31 August 2018; pp. 1–5. [Google Scholar] [CrossRef]
  29. Ravi, D.; Wong, C.; Lo, B.; Yang, G.Z. Deep learning for human activity recognition: A resource efficient implementation on low-power devices. In Proceedings of the 2016 IEEE 13th International Conference on Wearable and Implantable Body Sensor Networks (BSN), San Francisco, CA, USA, 14–17 June 2016; pp. 71–76. [Google Scholar] [CrossRef]
  30. Hammerla, N.Y.; Halloran, S.; Plötz, T. Deep, Convolutional, and Recurrent Models for Human Activity Recognition Using Wearables. In Proceedings of the Twenty-Fifth International Joint Conference on Artificial Intelligence (IJCAI’16), New York, NY, USA, 9–15 July 2016; AAAI Press: Palo Alto, CA, USA, 2016; pp. 1533–1540. [Google Scholar]
  31. Xu, C.; Chai, D.; He, J.; Zhang, X.; Duan, S. InnoHAR: A Deep Neural Network for Complex Human Activity Recognition. IEEE Access 2019, 7, 9893–9902. [Google Scholar] [CrossRef]
  32. Bhattacharya, D.; Sharma, D.; Kim, W.; Ijaz, M.F.; Singh, P.K. Ensem-HAR: An Ensemble Deep Learning Model for Smartphone Sensor-Based Human Activity Recognition for Measurement of Elderly Health Monitoring. Biosensors 2022, 12, 393. [Google Scholar] [CrossRef]
  33. Mekruksavanich, S.; Phaphan, W.; Hnoohom, N.; Jitpattanakul, A. Attention-Based Hybrid Deep Learning Network for Human Activity Recognition Using WiFi Channel State Information. Appl. Sci. 2023, 13, 8884. [Google Scholar] [CrossRef]
  34. Roggen, D.; Calatroni, A.; Rossi, M.; Holleczek, T.; Förster, K.; Tröster, G.; Lukowicz, P.; Bannach, D.; Pirkl, G.; Ferscha, A.; et al. Collecting complex activity datasets in highly rich networked sensor environments. In Proceedings of the 2010 Seventh International Conference on Networked Sensing Systems (INSS), Kassel, Germany, 15–18 June 2010; pp. 233–240. [Google Scholar] [CrossRef]
  35. Reiss, A.; Stricker, D. Introducing a New Benchmarked Dataset for Activity Monitoring. In Proceedings of the 2012 16th International Symposium on Wearable Computers, Newcastle, UK, 18–22 June 2012; pp. 108–109. [Google Scholar] [CrossRef]
  36. Sztyler, T.; Stuckenschmidt, H. On-body localization of wearable devices: An investigation of position-aware activity recognition. In Proceedings of the 2016 IEEE International Conference on Pervasive Computing and Communications (PerCom), Sydney, NSW, Australia, 14–19 March 2016; pp. 1–9. [Google Scholar] [CrossRef]
  37. Rong, L.; Zhou, J.; Liu, M.; Hou, X. A Wearable Acceleration Sensor System for Gait Recognition. In Proceedings of the 2007 2nd IEEE Conference on Industrial Electronics and Applications, Harbin, China, 23–25 May 2007; pp. 2654–2659. [Google Scholar] [CrossRef]
  38. Mostayed, A.; Kim, S.; Mazumder, M.M.G.; Park, S.J. Foot Step Based Person Identification Using Histogram Similarity and Wavelet Decomposition. In Proceedings of the 2008 International Conference on Information Security and Assurance (isa 2008), Busan, Republic of Korea, 24–26 April 2008; pp. 307–311. [Google Scholar] [CrossRef]
  39. Banos, O.; Galvez, J.M.; Damas, M.; Pomares, H.; Rojas, I. Window Size Impact in Human Activity Recognition. Sensors 2014, 14, 6474–6499. [Google Scholar] [CrossRef]
  40. Wang, X.; Ren, H.; Wang, A. Smish: A Novel Activation Function for Deep Learning Methods. Electronics 2022, 11, 540. [Google Scholar] [CrossRef]
  41. Glorot, X.; Bordes, A.; Bengio, Y. Deep Sparse Rectifier Neural Networks. In Proceedings of the Fourteenth International Conference on Artificial Intelligence and Statistics, Ft. Lauderdale, FL, USA, 11–13 April 2011; Gordon, G., Dunson, D., Dudík, M., Eds.; PMLR: Fort Lauderdale, FL, USA, 2011; Volume 15, pp. 315–323. [Google Scholar]
  42. Shimodaira, H. Improving predictive inference under covariate shift by weighting the log-likelihood function. J. Stat. Plan. Inference 2000, 90, 227–244. [Google Scholar] [CrossRef]
  43. Ioffe, S.; Szegedy, C. Batch Normalization: Accelerating Deep Network Training by Reducing Internal Covariate Shift. In Proceedings of the 32nd International Conference on International Conference on Machine Learning (ICML’15), Lille, France, 6–11 July 2015; Volume 37, pp. 448–456. [Google Scholar]
  44. Hochreiter, S. The Vanishing Gradient Problem during Learning Recurrent Neural Nets and Problem Solutions. Int. J. Uncertain. Fuzziness Knowl.-Based Syst. 1998, 6, 107–116. [Google Scholar] [CrossRef]
  45. Cho, K.; van Merriënboer, B.; Bahdanau, D.; Bengio, Y. On the Properties of Neural Machine Translation: Encoder–Decoder Approaches. In Proceedings of the SSST-8, Eighth Workshop on Syntax, Semantics and Structure in Statistical Translation, Doha, Qatar, 25 October 2014; Wu, D., Carpuat, M., Carreras, X., Vecchi, E.M., Eds.; Association for Computational Linguistics: Doha, Qatar, 2014; pp. 103–111. [Google Scholar] [CrossRef]
  46. Chung, J.; Gulcehre, C.; Cho, K.; Bengio, Y. Empirical evaluation of gated recurrent neural networks on sequence modeling. In Proceedings of the NIPS 2014 Workshop on Deep Learning, Montreal, QC, Canada, 13 December 2014. [Google Scholar]
  47. He, K.; Zhang, X.; Ren, S.; Sun, J. Deep Residual Learning for Image Recognition. In Proceedings of the 2016 IEEE Conference on Computer Vision and Pattern Recognition (CVPR), Las Vegas, NV, USA, 27–30 June 2016; pp. 770–778. [Google Scholar] [CrossRef]
  48. Asuroglu, T.; Acici, K.; Erdas, C.B.; Ogul, H. Texture of Activities: Exploiting Local Binary Patterns for Accelerometer Data Analysis. In Proceedings of the 2016 12th International Conference on Signal-Image Technology & Internet-Based Systems (SITIS), Naples, Italy, 28 November–1 December 2016; pp. 135–138. [Google Scholar] [CrossRef]
  49. Luong, T.; Pham, H.; Manning, C.D. Effective Approaches to Attention-based Neural Machine Translation. In Proceedings of the 2015 Conference on Empirical Methods in Natural Language Processing, Lisbon, Portugal, 17–21 September 2015; Màrquez, L., Callison-Burch, C., Su, J., Eds.; Association for Computational Linguistics: Lisbon, Portugal, 2015; pp. 1412–1421. [Google Scholar] [CrossRef]
  50. Raffel, C.; Ellis, D.P.W. Feed-Forward Networks with Attention Can Solve Some Long-Term Memory Problems. arXiv 2015, arXiv:1512.08756. Available online: http://xxx.lanl.gov/abs/1512.08756 (accessed on 5 January 2024).
  51. Gutierrez Maestro, E.; De Almeida, T.R.; Schaffernicht, E.; Martinez Mozos, O. Wearable-Based Intelligent Emotion Monitoring in Older Adults during Daily Life Activities. Appl. Sci. 2023, 13, 5637. [Google Scholar] [CrossRef]
  52. Agac, S.; Durmaz Incel, O. On the Use of a Convolutional Block Attention Module in Deep Learning-Based Human Activity Recognition with Motion Sensors. Diagnostics 2023, 13, 1861. [Google Scholar] [CrossRef]
  53. Bisong, E. Building Machine Learning and Deep Learning Models on Google Cloud Platform: A Comprehensive Guide for Beginners; Springer: Berlin/Heidelberg, Germany, 2019. [Google Scholar] [CrossRef]
  54. Lawal, I.A.; Bano, S. Deep Human Activity Recognition With Localisation of Wearable Sensors. IEEE Access 2020, 8, 155060–155070. [Google Scholar] [CrossRef]
  55. Sztyler, T.; Stuckenschmidt, H.; Petrich, W. Position-aware activity recognition with wearable devices. Pervasive Mob. Comput. 2017, 38, 281–295. [Google Scholar] [CrossRef]
  56. Gao, Z.; Liu, D.; Huang, K.; Huang, Y. Context-Aware Human Activity and Smartphone Position-Mining with Motion Sensors. Remote Sens. 2019, 11, 12531. [Google Scholar] [CrossRef]
  57. Montaha, S.; Azam, S.; Rafid, A.K.M.R.H.; Ghosh, P.; Hasan, M.Z.; Jonkman, M.; De Boer, F. BreastNet18: A High Accuracy Fine-Tuned VGG16 Model Evaluated Using Ablation Study for Diagnosing Breast Cancer from Enhanced Mammography Images. Biology 2021, 10, 1347. [Google Scholar] [CrossRef] [PubMed]
  58. de Vente, C.; Boulogne, L.H.; Venkadesh, K.V.; Sital, C.; Lessmann, N.; Jacobs, C.; Sánchez, C.I.; van Ginneken, B. Improving Automated COVID-19 Grading with Convolutional Neural Networks in Computed Tomography Scans: An Ablation Study. arXiv 2020, arXiv:2009.09725. Available online: http://xxx.lanl.gov/abs/2009.09725 (accessed on 5 January 2024).
  59. Meyes, R.; Lu, M.; de Puiseau, C.W.; Meisen, T. Ablation Studies in Artificial Neural Networks. arXiv 2019, arXiv:1901.08644. Available online: http://xxx.lanl.gov/abs/1901.08644 (accessed on 5 January 2024).
  60. Angerbauer, S.; Palmanshofer, A.; Selinger, S.; Kurz, M. Comparing Human Activity Recognition Models Based on Complexity and Resource Usage. Appl. Sci. 2021, 11, 8473. [Google Scholar] [CrossRef]
  61. Islam, M.S.; Hussain, I.; Rahman, M.M.; Park, S.J.; Hossain, M.A. Explainable Artificial Intelligence Model for Stroke Prediction Using EEG Signal. Sensors 2022, 22, 9859. [Google Scholar] [CrossRef]
  62. Selvaraju, R.R.; Cogswell, M.; Das, A.; Vedantam, R.; Parikh, D.; Batra, D. Grad-CAM: Visual Explanations from Deep Networks via Gradient-Based Localization. In Proceedings of the 2017 IEEE International Conference on Computer Vision (ICCV), Venice, Italy, 22–29 October 2017; pp. 618–626. [Google Scholar] [CrossRef]
  63. Choi, H.; Jung, C.; Kang, T.; Kim, H.J.; Kwak, I.Y. Explainable Time-Series Prediction Using a Residual Network and Gradient-Based Methods. IEEE Access 2022, 10, 108469–108482. [Google Scholar] [CrossRef]
Figure 1. Positions of wearable sensors in the Opportunity, PAMAP2, and REALWORLD16 datasets.
Applsci 14 02107 g001
Figure 2. Illustration of fixed-length sliding-window technique used in this work.
Applsci 14 02107 g002
Figure 3. Detailed architecture of the proposed Att-ResBiGRU model.
Applsci 14 02107 g003
Figure 4. The structure of the ResBiGRU.
Applsci 14 02107 g004
Figure 5. Comparison results of five deep learning models and the proposed Att-ResBiGRU model in position-dependent HAR: (a) Opportunity, (b) PAMAP2, and (c) REALWORLD16 datasets.
Applsci 14 02107 g005
Figure 6. Comparison results of five baseline deep learning models and the proposed Att-ResBiGRU model in position-independent HAR.
Applsci 14 02107 g006
Figure 7. Confusion matrix for the proposed Att-ResBiGRU model from the Opportunity dataset.
Applsci 14 02107 g007
Figure 8. Confusion matrix for the proposed Att-ResBiGRU model from the PAMAP2 dataset.
Applsci 14 02107 g008
Figure 9. Confusion matrix for the proposed Att-ResBiGRU model from the REALWORLD16 dataset.
Applsci 14 02107 g009
Figure 10. Memory consumption in megabytes of deep learning models used in this work.
Applsci 14 02107 g010
Figure 11. Mean prediction time in milliseconds of deep learning models used in this work.
Applsci 14 02107 g011
Figure 12. Number of trainable parameters of deep learning models used in this work.
Applsci 14 02107 g012
Figure 13. Visualization of the Grad-CAM method.
Applsci 14 02107 g013
Table 1. Summary of the three multi-position HAR datasets used in this work.
DatasetNumber of SubjectsSensorsPositionsActivities
Opportunity12Accelerometer
Gyroscope
Magnetometer
Left lower arm,
Left upper arm,
Right upper arm,
Right lower arm,
Back of the torso
Open door 1, Open door 2, Close door 1, Close door 2,
Open and close fridge, Open and close dishwasher,
Open drawer 1, Close drawer 1, Open drawer 2, Close drawer 2,
Open drawer 3, Close drawer 3, Clean table, Drink from cup,
Toggle switch
PAMAP29Accelerometer
Gyroscope
Magnetometer
Wrist,
Chest,
Ankle
Lying, Sitting, Standing, Walking, Running, Cycling, Nordic walking,
Ironing, Vacuum cleaning, Ascending and descending stairs
REALWORLD1615Accelerometer
Gyroscope
Magnetometer
Head, Chest,
Upper arm, Forearm
Waist, Thigh, Shin
Climbing stairs (down and up), Jumping, Lying, Standing, Sitting,
Running, Walking
Table 2. Accuracies and F1-scores of the proposed Att-ResBiGRU model for position-dependent HAR across all five positions on the Opportunity dataset.
PositionRecognition Effectiveness
Accuracy (Mean ± std.)Loss (Mean ± std.)F1-Score (Mean ± std.)
Back89.06% (±1.15%)0.52 (±0.07)85.69% (±1.76%)
RUA88.72% (±1.25%)0.53 (±0.10)84.90% (±1.45%)
RLA88.14% (±1.12%)0.53 (±0.08)83.99% (±1.58%)
LUA86.79% (±0.78%)0.60 (±0.05)82.56% (±1.00%)
LLA84.76% (±0.72%)0.66 (±0.02)79.84% (±1.20%)
Table 3. Accuracies and F1-scores of the proposed Att-ResBiGRU model for position-dependent HAR across all three positions on the PAMAP2 dataset.
PositionRecognition Effectiveness
Accuracy (Mean ± std.)Loss (Mean ± std.)F1-Score (Mean ± std.)
Hand97.12% (±0.18%)0.12 (±0.01)96.95% (±0.16%)
Chest97.59% (±0.23%)0.10 (±0.01)97.46% (±0.25%)
Ankle97.25% (±0.11%)0.11 (±0.01)97.17% (±0.13%)
Table 4. Accuracies and F1-scores of the proposed Att-ResBiGRU model for position-dependent HAR across all seven positions on the REALWORLD16 dataset.
PositionRecognition Effectiveness
Accuracy (Mean ± std.)Loss (Mean ± std.)F1-Score (Mean ± std.)
Chest98.08% (±0.49%)0.09 (±0.02)98.12% (±0.37%)
Forearm94.74% (±0.31%)0.24 (±0.02)94.75% (±0.33%)
Head96.62% (±0.21%)0.17 (±0.01)96.70% (±0.20%)
Shin97.89% (±0.17%)0.10 (±0.01)97.90% (±0.07%)
Thigh98.59% (±0.26%)0.07 (±0.01)98.52% (±0.31%)
Upper arm96.96% (±0.44%)0.14 (±0.01)96.93% (±0.46%)
Waist98.01% (±0.29%)0.09 (±0.01)97.93% (±0.33%)
Table 5. Accuracies and F1-scores of the proposed Att-ResBiGRU model for position-independent HAR across the three HAR datasets.
DatasetRecognition Effectiveness
Accuracy (Mean ± std.)Loss (Mean ± std.)F1-Score (Mean ± std.)
Opportunity90.27% (±0.23%)0.34 (±0.01)86.69% (±0.30%)
PAMAP296.61% (±0.26%)0.12 (±0.01)96.44% (±0.25%)
REALWORLD1696.11% (±0.17%)0.14 (±0.01)96.23% (±0.19%)
Table 6. Comparison results with state of the art in position-dependent HAR using sensor data from the PAMAP2 dataset.
ClassifierF1-Score(%)
HandChestAnkle
RF [22]93.50%96.20%94.40%
SVM [22]90.60%94.10%92.50%
K-NN [22]77.30%80.40%75.70%
BN [22]78.50%83.70%78.80%
DT [22]82.60%87.70%86.60%
Att-ResBiGRU96.95%97.46%97.17%
Table 7. Comparison results with state of the art in position-dependent HAR using sensor data from the REALWORLD16 dataset.
ClassifierF1-Score(%)
ChestForearmHeadShinThighUpper ArmWaist
Two-stream CNN [54]76%79%78%88%52%75%86%
RF [55]84%80%79%87%86%83%86%
Att-ResBiGRU98.12%94.75%96.70%97.90%98.52%96.93%97.93%
Table 8. Comparison results with state of the art in position-dependent HAR using sensor data from the PAMAP2 dataset.
DatasetClassifierF1-Score (%)
PAMAP2RF [22]91.70%
SVM-SMO  [22]78.41%
K-NN  [22]90.61%
BN  [22]78.39%
DT  [22]80.87%
Att-ResBiGRU96.44%
REALWORLD16MLP [56]89.10%
CNN [56]88.55%
LSTM [56]89.32%
RF [55]84.00%
Two-stream CNN [54]90.00%
Att-ResBiGRU96.23%
Table 9. Impact of convolution blocks.
ModelPerformance
OpportunityPAMAP2REALWORLD16
AccuracyF1-ScoreAccuracyF1-ScoreAccuracyF1-Score
Att-ResBiGRU without convolution blocks89.34%
(±0.45%)
86.56%
(±0.61%)
95.34%
(±0.16%)
95.13%
(±0.22%)
95.80%
(±0.21%)
95.80%
(±0.19%)
Att-ResBiGRU with convolution blocks90.27%
(±0.23%)
86.69%
(±0.30%)
96.61%
(±0.26%)
96.44%
(±0.25%)
96.11%
(±0.17%)
96.23%
(±0.19%)
Table 10. Impact of the ResBiGRU block.
ModelPerformance
OpportunityPAMAP2REALWORLD16
AccuracyF1-ScoreAccuracyF1-ScoreAccuracyF1-Score
Att-ResBiGRU without the ResBiGRU block89.13%
(±1.12%)
85.00%
(±1.37%)
94.04%
(±0.15%)
94.89%
(±0.13%)
94.03%
(±0.15%)
94.16%
(±0.15%)
Att-ResBiGRU with the ResBiGRU block90.27%
(±0.23%)
86.69%
(±0.30%)
96.61%
(±0.26%)
96.44%
(±0.25%)
96.11%
(±0.17%)
96.23%
(±0.19%)
Table 11. Impact of the attention block.
ModelPerformance
OpportunityPAMAP2REALWORLD16
AccuracyF1-ScoreAccuracyF1-ScoreAccuracyF1-Score
Att-ResBiGRU without the attention block89.95%
(±0.26%)
86.31%
(±0.28%)
95.25%
(±0.15%)
95.07%
(±0.16%)
95.14%
(±0.25%)
95.23%
(±0.25%)
Att-ResBiGRU with the attention block90.27%
(±0.23%)
86.69%
(±0.30%)
96.61%
(±0.26%)
96.44%
(±0.25%)
96.11%
(±0.17%)
96.23%
(±0.19%)
Disclaimer/Publisher’s Note: The statements, opinions and data contained in all publications are solely those of the individual author(s) and contributor(s) and not of MDPI and/or the editor(s). MDPI and/or the editor(s) disclaim responsibility for any injury to people or property resulting from any ideas, methods, instructions or products referred to in the content.

