Article

Research on Chinese Fire Station Optimal Location Model Based on Fire Risk Statistics: Case Study in Shanghai

Shanghai Fire Research Institute of MEM, Shanghai 200032, China
*
Author to whom correspondence should be addressed.
Appl. Sci. 2024, 14(5), 2052; https://doi.org/10.3390/app14052052
Submission received: 5 January 2024 / Revised: 27 February 2024 / Accepted: 28 February 2024 / Published: 29 February 2024
(This article belongs to the Special Issue Advanced Methodology and Analysis in Fire Protection Science)

Abstract

:
With the rapid development of urbanization in China, the gap between urban and rural areas is decreasing. The traditional approach of constructing fire stations based on urban built-up areas is no longer suitable for the needs of modern fire rescue. Therefore, a comprehensive fire station location model is proposed based on fire risk assessment. This method divides the protected area units based on the urban road network. By evaluating different regions based on spatial position, land attributes, population density, floor area ratio, and fire incident indicators, the fire rescue risk levels and categorize regions into four risk levels are assessed. Corresponding response times were determined, and an objective model was developed to maximize the coverage area for fire response. The Baidu API was utilized to accurately calculate driving distances and times, and Gurobi optimization software was used to solve the model. Taking Shanghai as an example, the fire station location and layout from two perspectives—re-planning based on overall station placement and re-planning based on existing stations—were analyzed. The results suggest that constructing around 150 fire stations in Shanghai would effectively meet the fire rescue needs, which aligns with the actual situation in Shanghai and demonstrates the strong applicability of this model. This approach enables the meeting of new demand for fire station construction due to the significant increase in the coverage area while effectively utilizing firefighting resources.

1. Introduction

The rapid urban development and bustling social activities accompanying economic growth have brought along a plethora of risks, leading to various types of disasters, such as traffic accidents, industrial accidents, and fire incidents [1]. The fire service is one of the foremost important emergency response services relying on fire stations [2]. The location of fire stations directly determines arrival times, which are crucial to the efficiency of emergency responses for fire suppression and personnel rescue operations.
Locating fire stations in geographical space is a multi-dimensional problem that typically involves a number of factors regarding improving access and service coverage [3,4]. For the former purpose, referring to the ease of travel distance/time from fire stations to risk sites, a P-Center model [5,6,7] was proposed to maximize access to places requesting services. For the latter purpose, referring to the maximum distance or service area of a fire station with a minimum number of facility points, other models including Location Set Covering Problem (LSCP) [8] and Maximum Covering Location Problem (MCLP) are used widely. For example, the MCLP model [9], focusing on the rational layout of P facility points under the conditions where the number of service facilities and the coverage radius are predetermined, has been used in the planning of fire stations in Istanbul [10,11,12], California [13,14], and Belgium [15].
However, considering the expansion and development of cities, the applicability of these models is basically unitary. In China, most fire stations are sited in urban built-up areas, accounting for only a small portion of the country’s land area. For example, Shanghai is the city with the highest urbanization rate in China, reaching 89.3% in 2022 [16]. Although the built-up area of Shanghai has increased to 1242 km2 in the past 30 years, it still only accounted for less than 20% of the total in 2022. Figure 1 illustrates the distribution of fire stations and the extent of the built-up area in Shanghai in 2022. The thick lines represent the four major ring roads of Shanghai while the black lines are the administrative divisions for streets and towns. The red areas signify the built-up regions. The number of fire stations in Shanghai is up to 152 in general. However, more than 70% of fire stations are located in built-up areas. In suburban areas, the placement of fire stations aligns with administrative divisions, with one fire station constructed for each town or street.
Figure 2 further presents the number of incidents at all fire stations in Shanghai in 2022. Figure 2a shows the distribution of jurisdictional areas and annual incidents for all fire stations in 2022. The red points represent the fire stations in the built-up areas while the black points represent those in suburban areas. The fire station with the most annual incidents, such as Qingning, reached 1600 incidents. Other stations that exceeded 1000 incidents are all located in built-up areas. In contrast, suburban fire stations have significantly larger jurisdictional areas, exceeding 50 km2 compared to those in built-up areas. The largest jurisdiction is Dishuihu station, covering over 350 km2. Figure 2b specifically presents the counts of fire stations for different incident ranges. The annual incidents for most fire stations in built-up areas consistently exceeded 500 cases. One-third of the incidents counted in the 48 suburban fire stations also surpassed 300 cases. Moreover, the jurisdictions of these fire stations tend to be extensive, exceeding 50 km2. Additionally, the incident counts for some fire stations within the core urban area were lower than 200, which were notably dispersed due to the densely concentrated placement, resulting in a significant waste of firefighting resources. This may be because fire stations in the core urban area must meet the standard requirement of a 5 min response time. The current distribution of fire stations in Shanghai is largely dependent on administrative divisions and traditional standards, which is not rational.
The MCLP model is used to ensure that every region has the right corresponding fire and rescue protection [17,18]. The P-Center [19] and LSCP [20] aim to identify the minimum distance costs and number of facilities. There is still a significant lack of a model that optimizes both urban and rural coverage while considering the cost-effectiveness of site distribution. The regional grading standards for response times provide the foundation for developing a site distribution model based on risk grades. Hierarchical analyses and Bayesian network models are used widely, relying on available data like geospatial [21] and building [22] information. In China, according to the “Urban Fire Station Construction Standards” [23], the direct response time required is 5 min, which is the same as that in the United States, followed by the NFPA 1710 principle [24]. In both the UK and Hong Kong, response times for the highest risk level, which is determined by factors such as population density, land development density, and building characteristics, should not exceed 5 min [25]. This would avoid wastage of firefighting resources and cover all areas as reasonably as possible [26] and is a feasible solution to build a new model.
Therefore, this work proposes to develop the traditional MCLP model for the risk classifications of respective areas. A hierarchical method of the model relying on fire response times was proposed and the usage of the model in Shanghai was verified. This approach enabled the meeting of new demand for fire station construction due to the significant increase in coverage areas while effectively utilizing firefighting resources.

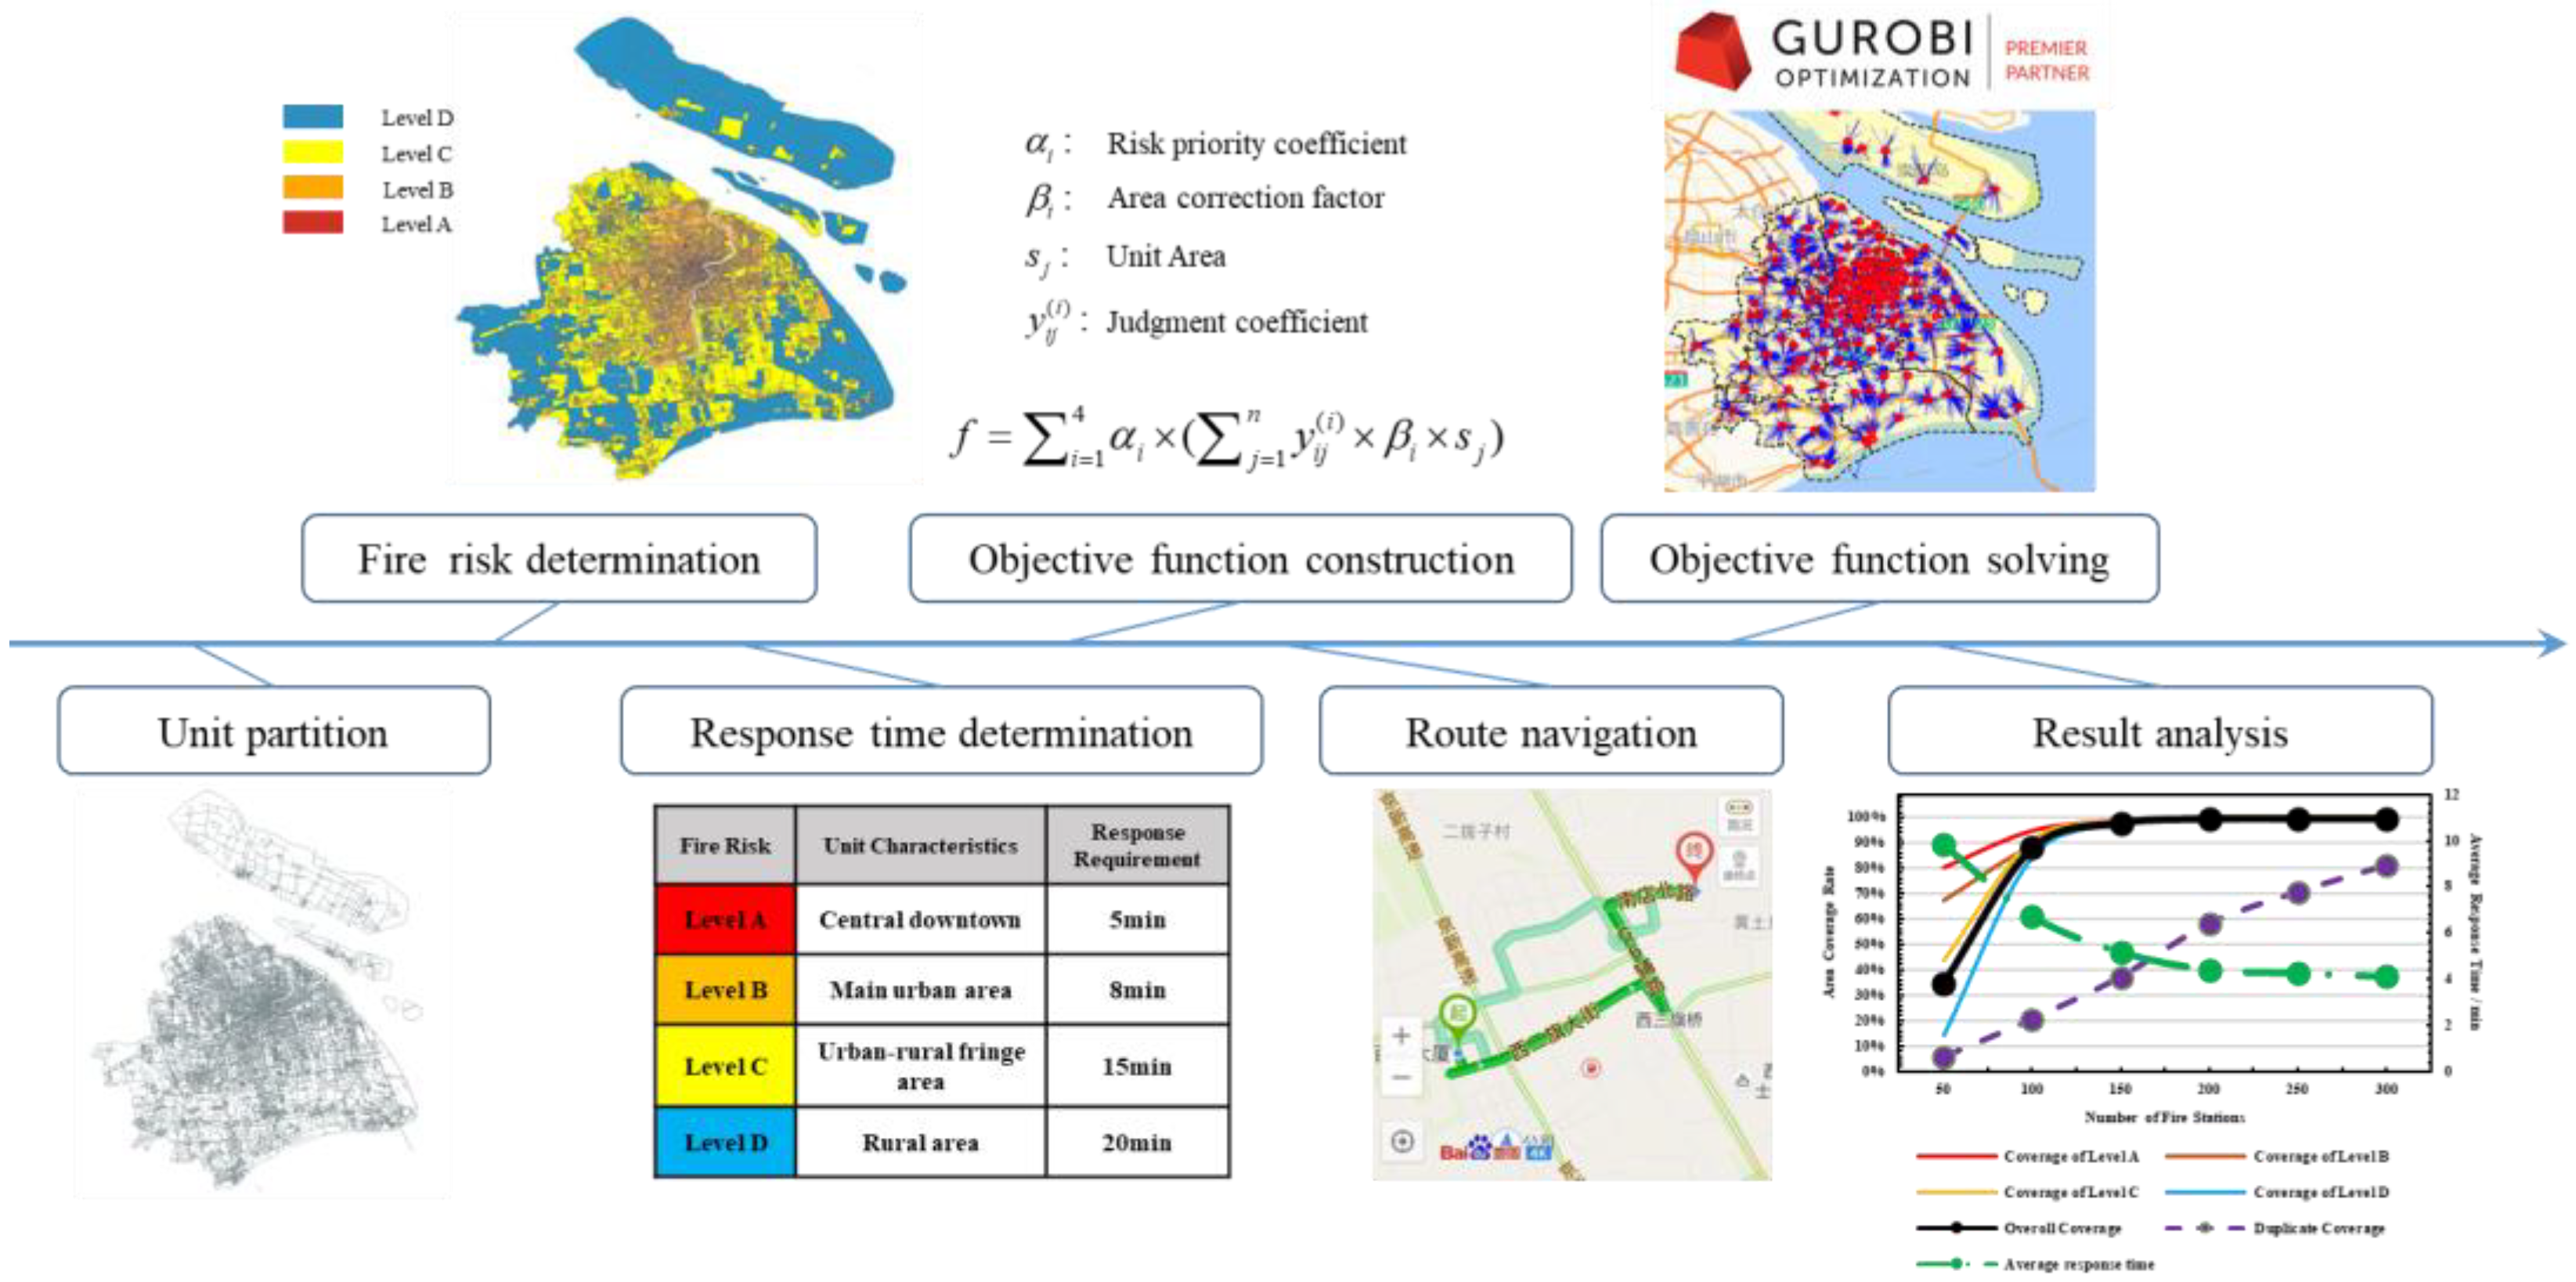
2. Optimization Siting Model

Taking the practical circumstances, the comprehensive fire station location model was based on risk assessment across urban and rural areas. The framework of the optimization siting model is shown in Figure 3, including the risk classification method, revised site planning model, and results analysis, which are provided in the following subsections.

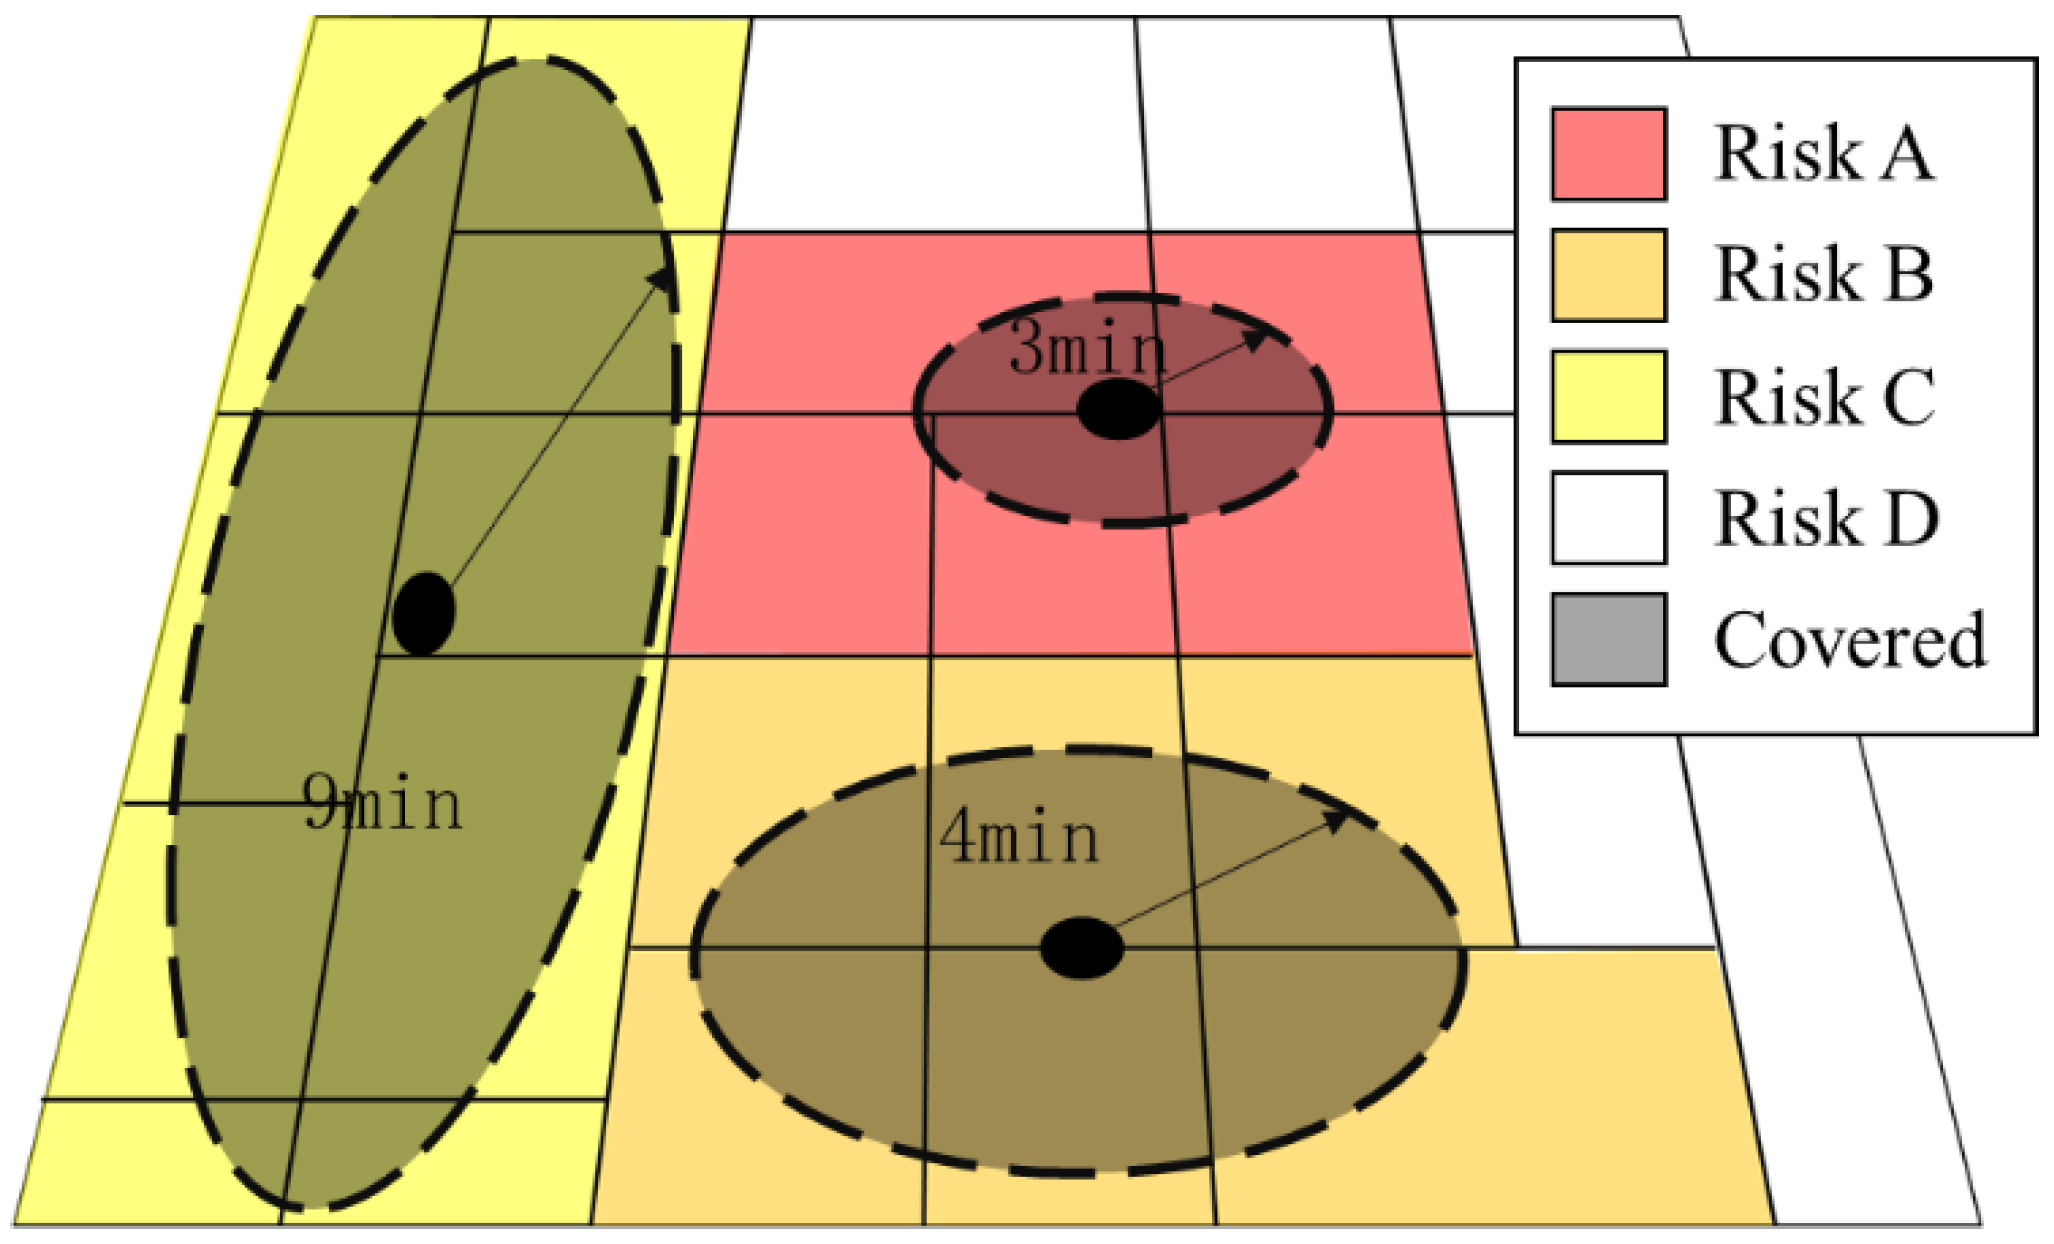
2.1. Risk Classification Method

The risk classification method basically relied on the scoring system proposed by Lau et al. [27]. A two-level indicator system was constructed by using the fuzzy analytic hierarchy process [28]. Temporal, spatial, and personnel-related factors were considered. Six key factors were ultimately characterized, including spatial location (A1), land attributes (A2), population density (A3), building volume ratio (A4), GDP density (A5), and incident density (A6). Table 1 illustrates the detailed risk assessment indicator system including the calculation method and score counts. The scoring model depended on expert ratings, correlating with the probability of triggering risks. The most significant factors were population density and incident density, accounting for 0.27 and 0.21, while the impact of GDP density was minimal, contributing only 0.1. The proportions of land attributes, building volume ratio, and spatial location were 0.15, 0.15, and 0.12, respectively. The model calculation method was scientifically formulated. Taking spatial location as an example, it assigned 100 to the central urban area, 60 to the main urban area, and 30 to other regions. For land attributes, commercial service land was assigned 100, office land 80, and residential land 60. Other factors were scored on a scale from 0 to 100 based on the proportion relative to the maximum value.
The fire safety risk score ( R ) can be calculated by the factors ( A i ) and score count ( α i ) as
R = α i A i
A comprehensive score was assigned to each region and the regions were classified into four risk classifications: A (extremely high risk), B (high risk), C (moderate risk), and D (low risk), according to their scores. The specified risk classifications of Shanghai will be illustrated in Section 3.1.
According to the risk classification, different fire response and time requirements were reasonably proposed, as shown in Table 2. The time taken for vehicles to travel and reach a scene was considered as the fire response time [3]. For the A-level area, the travel and response time were required to be 4 and 5 min, respectively. For B- through D-level areas, the travel time gradually extended from 7 to 19 min, and the response time increased from 8 to 20 min.

2.2. Revised Site Planning Model

The risk classifications method was then applied to the traditional MCLP model. The objective function was defined as a weighted function of the protected area of fire stations under four different risk scenarios as follows:
M a x i m i z e r R i I y i ( r ) × β r × s i
In the equation, I is the set of protected units and R is the set of fire risk classifications:
R = A , B , C , D
i and r are the counts of the site, β represents the area correction factor, and s represents the area of the protected units.
Each site y should meet
y i ( r ) j J a i j x i 0 i I
y i ( r ) 0,1 ( i I )
y i ( r ) = 1 ,   M i n i m u m   r e s p o n s e   t i m e   m e e t s   t h e   r e q u i r e m e n t 0 ,   M i n i m u m   r e s p o n s e   t i m e   d o e s   n o t   m e e t   t h e   r e q u i r e m e n t
J is the set of candidate sites for fire stations proposed by the risk classifications method and j is the count of the site. x i is the count function of the candidate point, as follows:
x i = 1 ,   t h e   s u p p l y   p o i n t   i s   c a n d i d a t e   p o i n t   j 0 ,   t h e   s u p p l y   p o i n t   i s   n o n c a n d i d a t e   p o i n t   j
α i j is the count function of the covered demand point, as follows:
α i j = 1 ,   D e m a n d   p o i n t   i   i s   n o t   c o v e r e d   b y   c a n d i d a t e   p o i n t   j   0 ,   D e m a n d   p o i n t   i   i s   c o v e r e d   b y   c a n d i d a t e   p o i n t   j
In particular, β i represents the area correction factor. Since the objective function of this model represented the weighted area of the protected regions, and the response time varied for different classifications of risk, the area that could be covered by fire stations also differed in regions with different risks, as shown in Figure 4. To achieve equal coverage by fire stations, it was necessary to adjust the area of high-risk protected regions. The values of the area correction coefficients for different classifications of risk were inversely proportional to the square of the response time, as shown in Table 3.

3. Results and Discussion

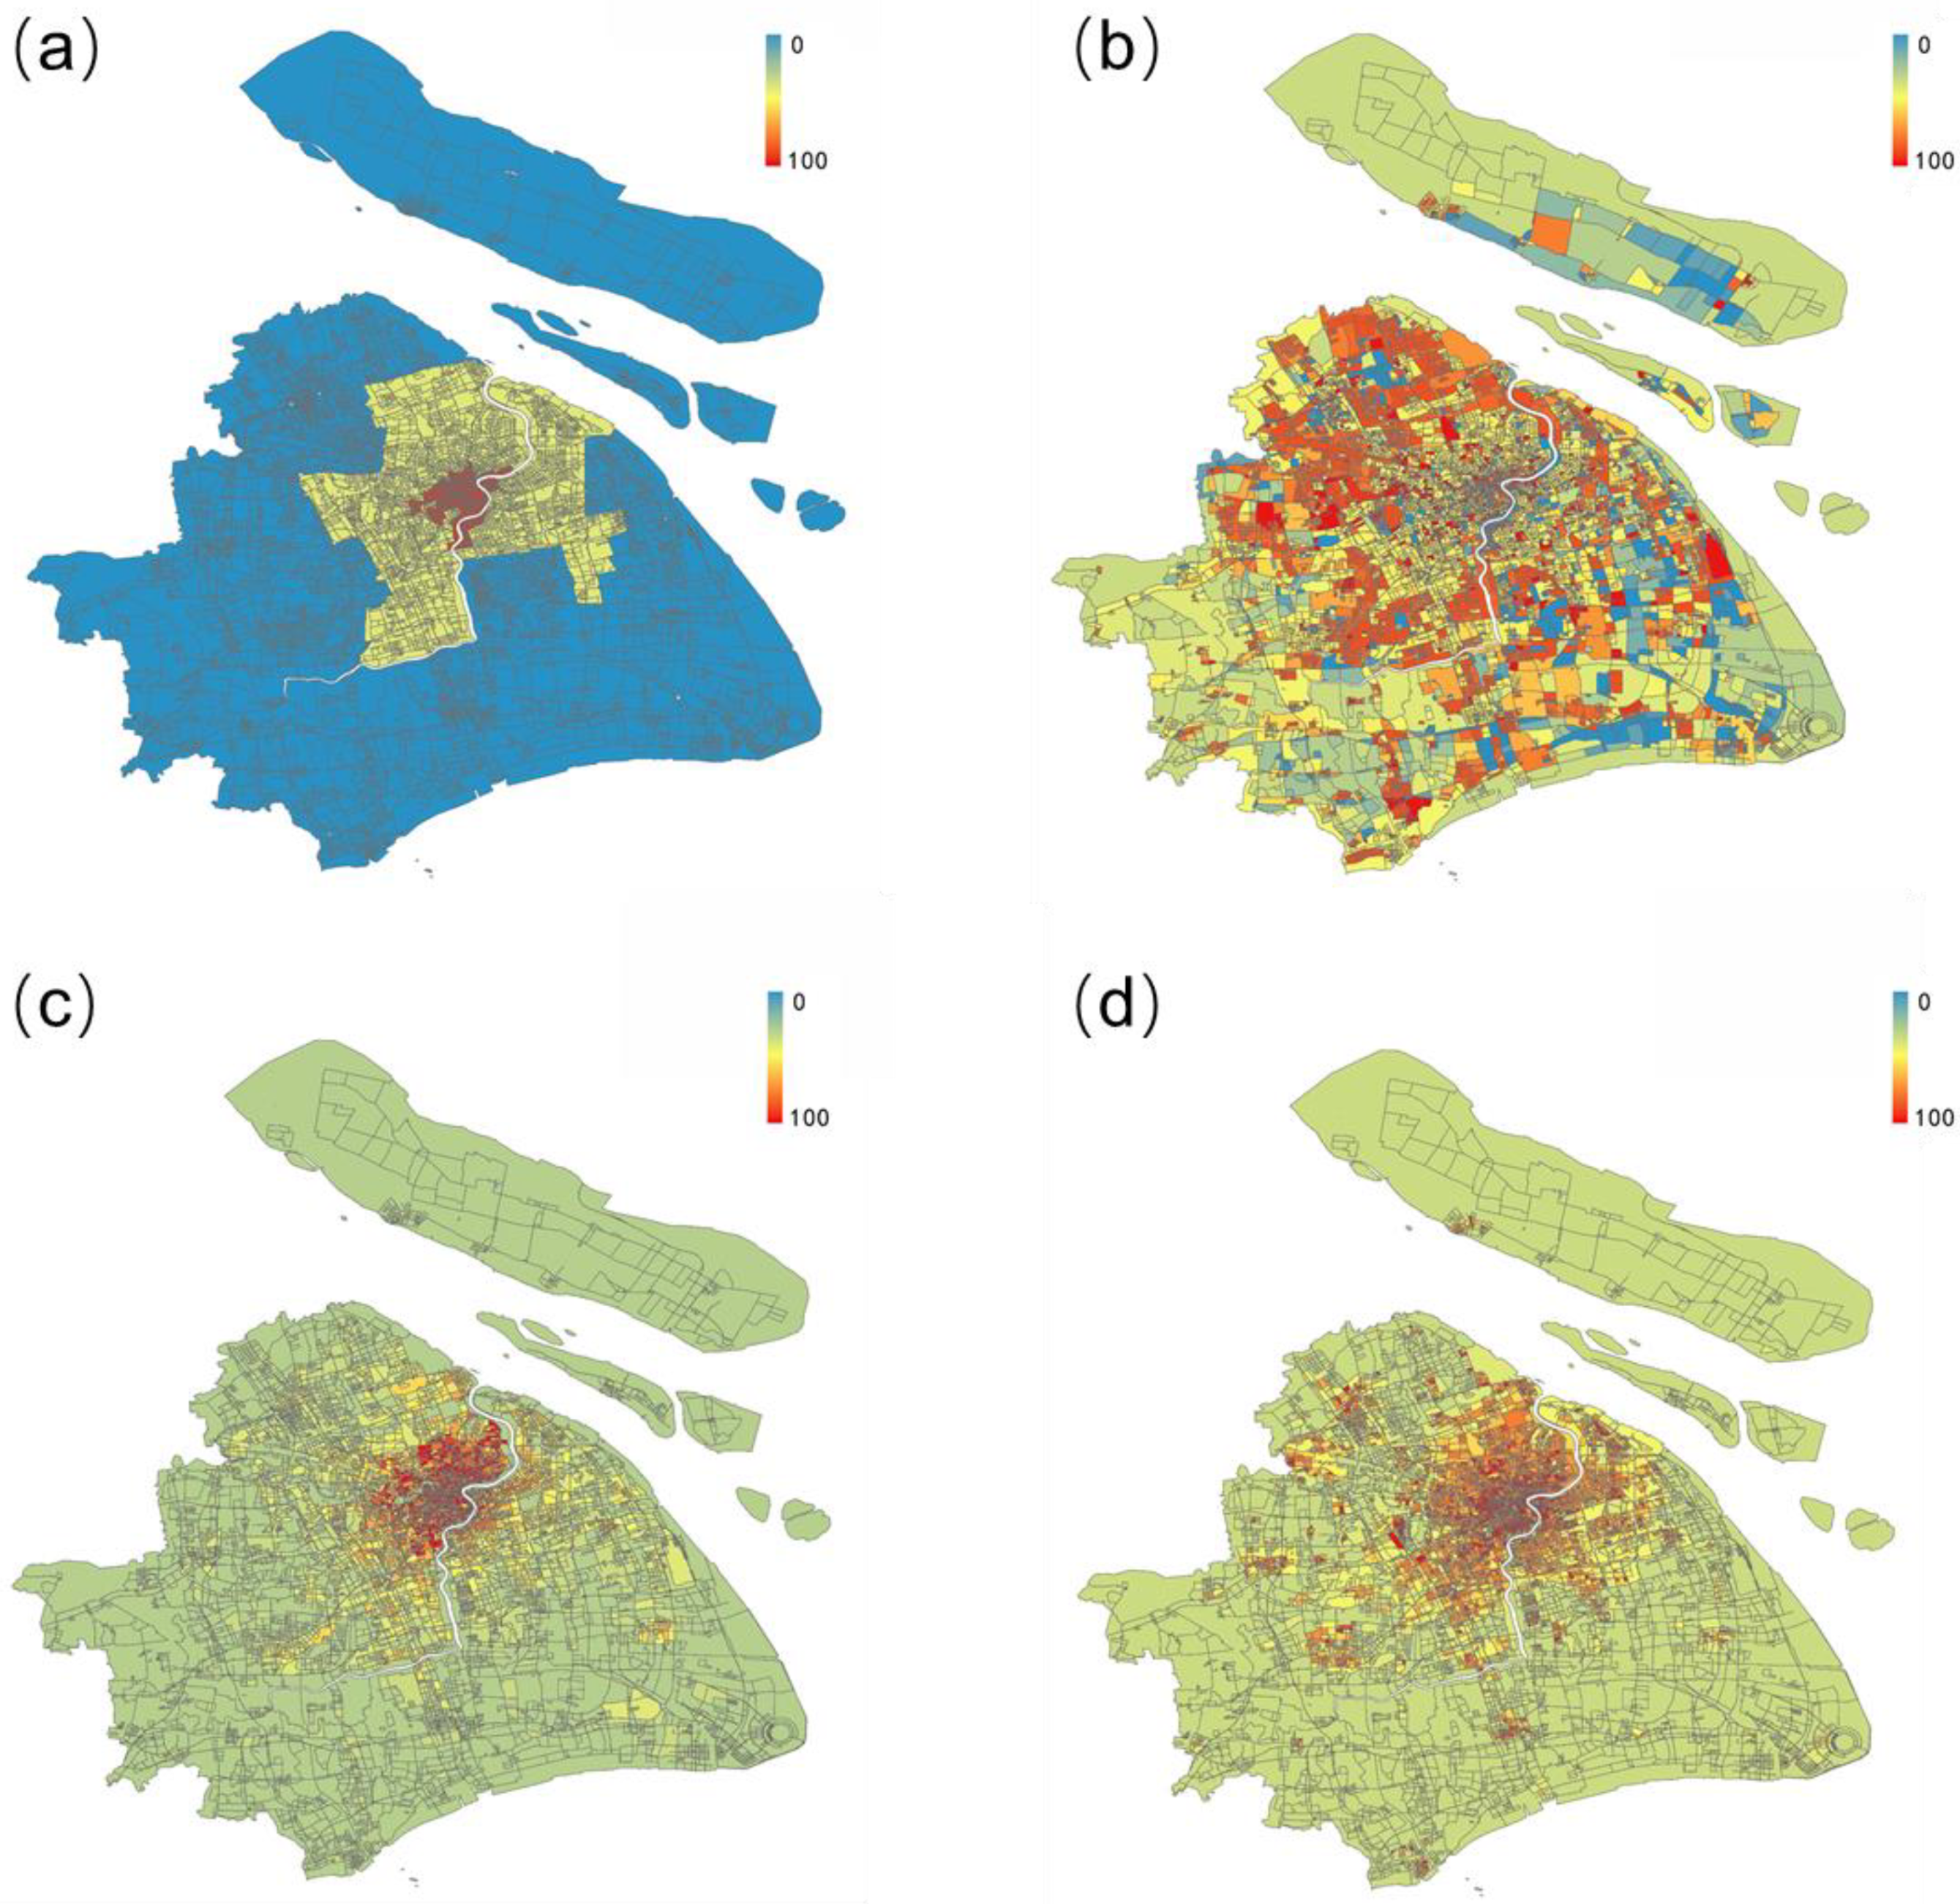
3.1. Risk Distribution
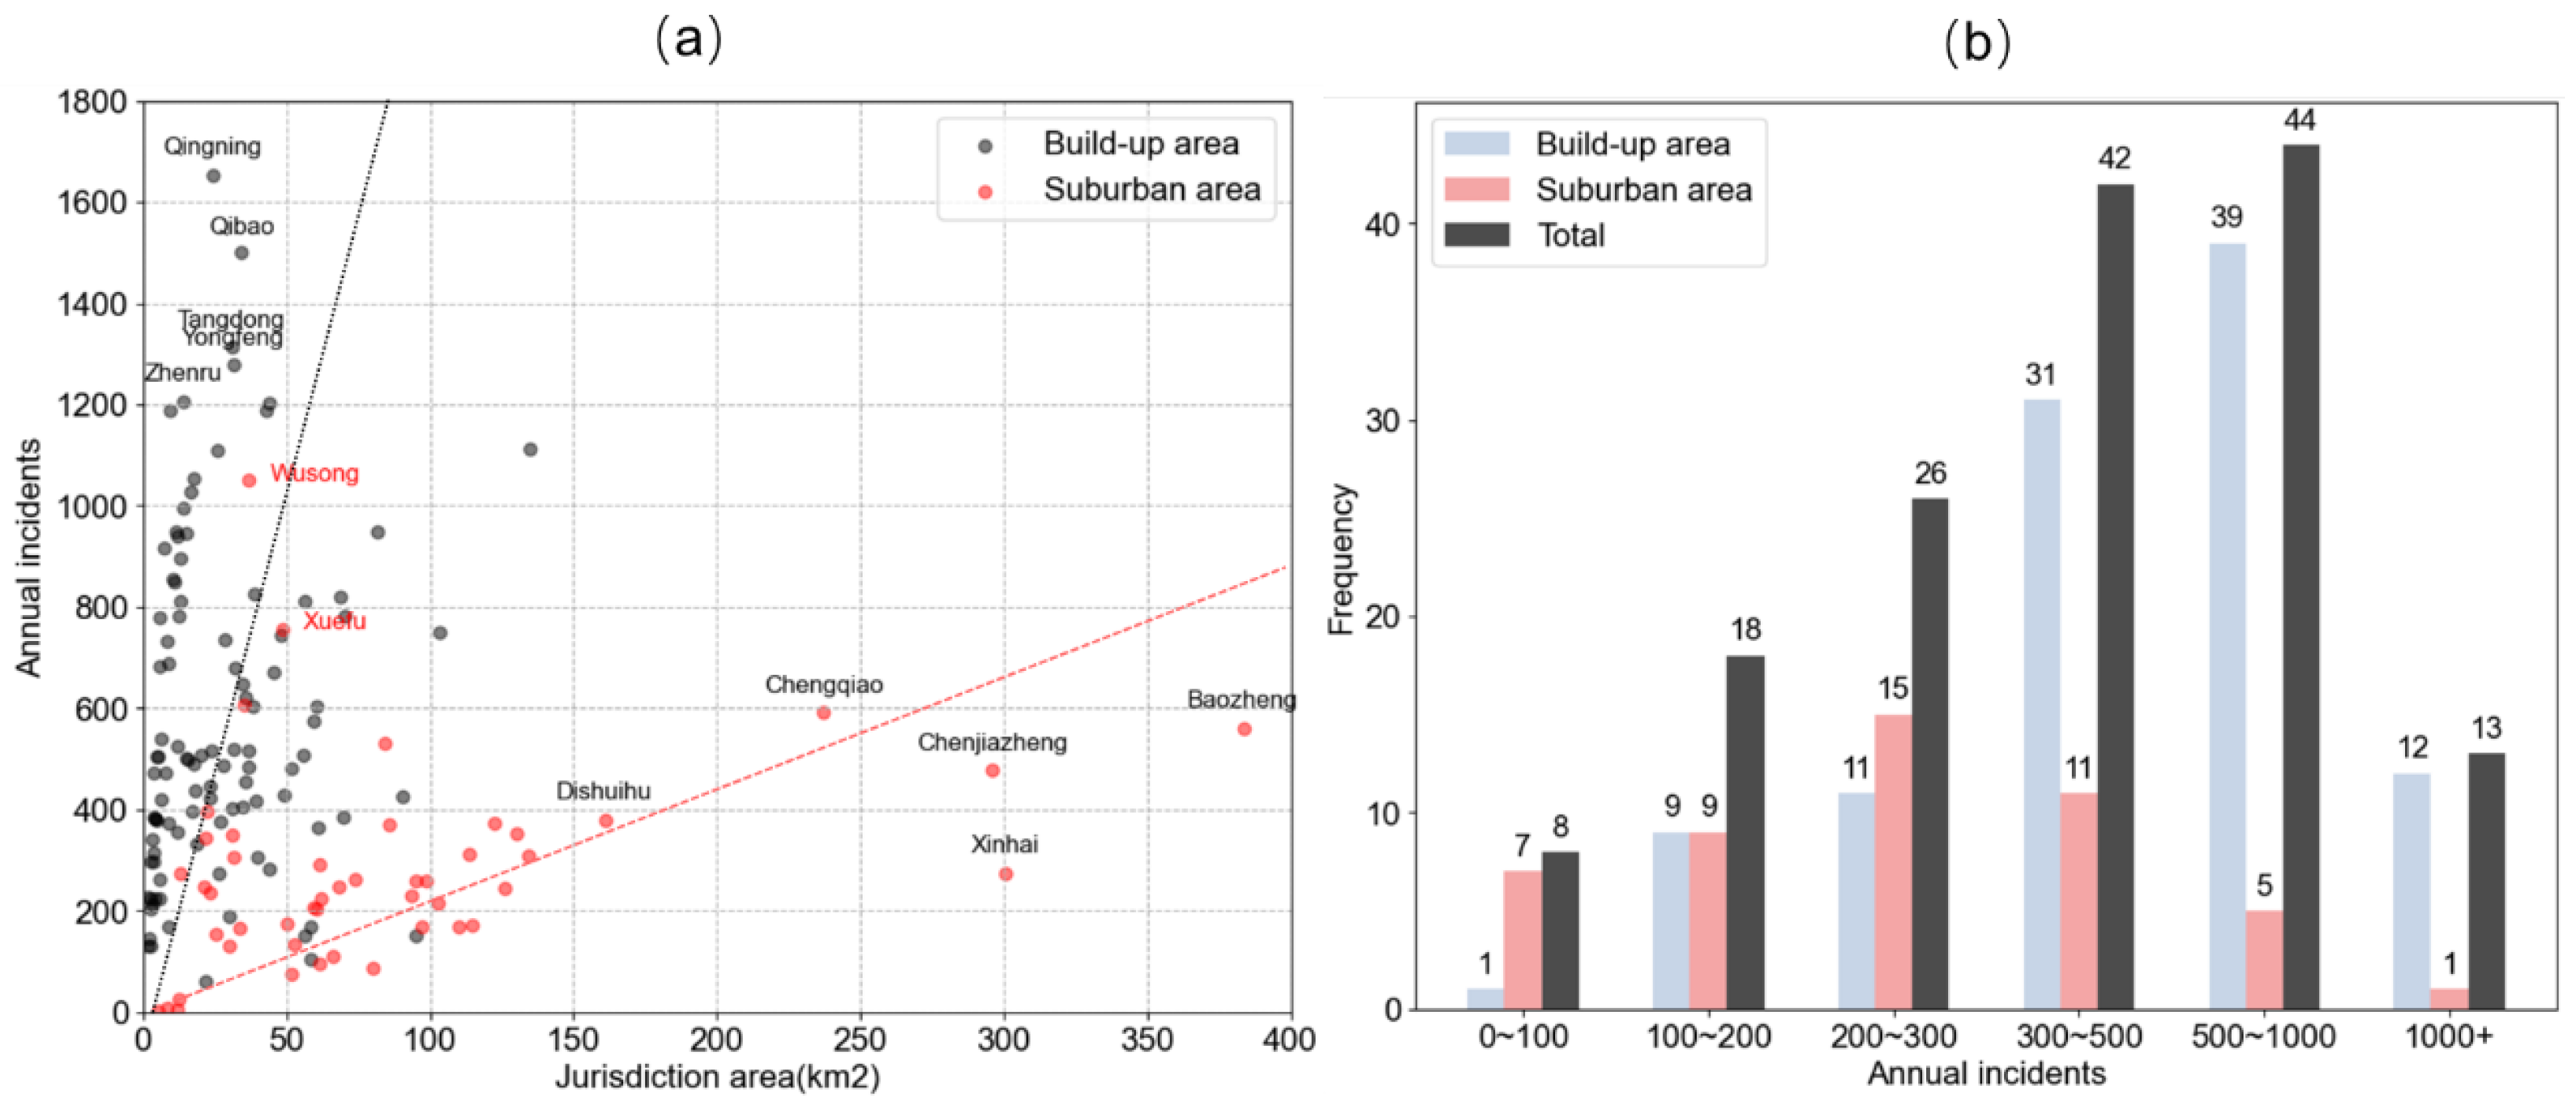
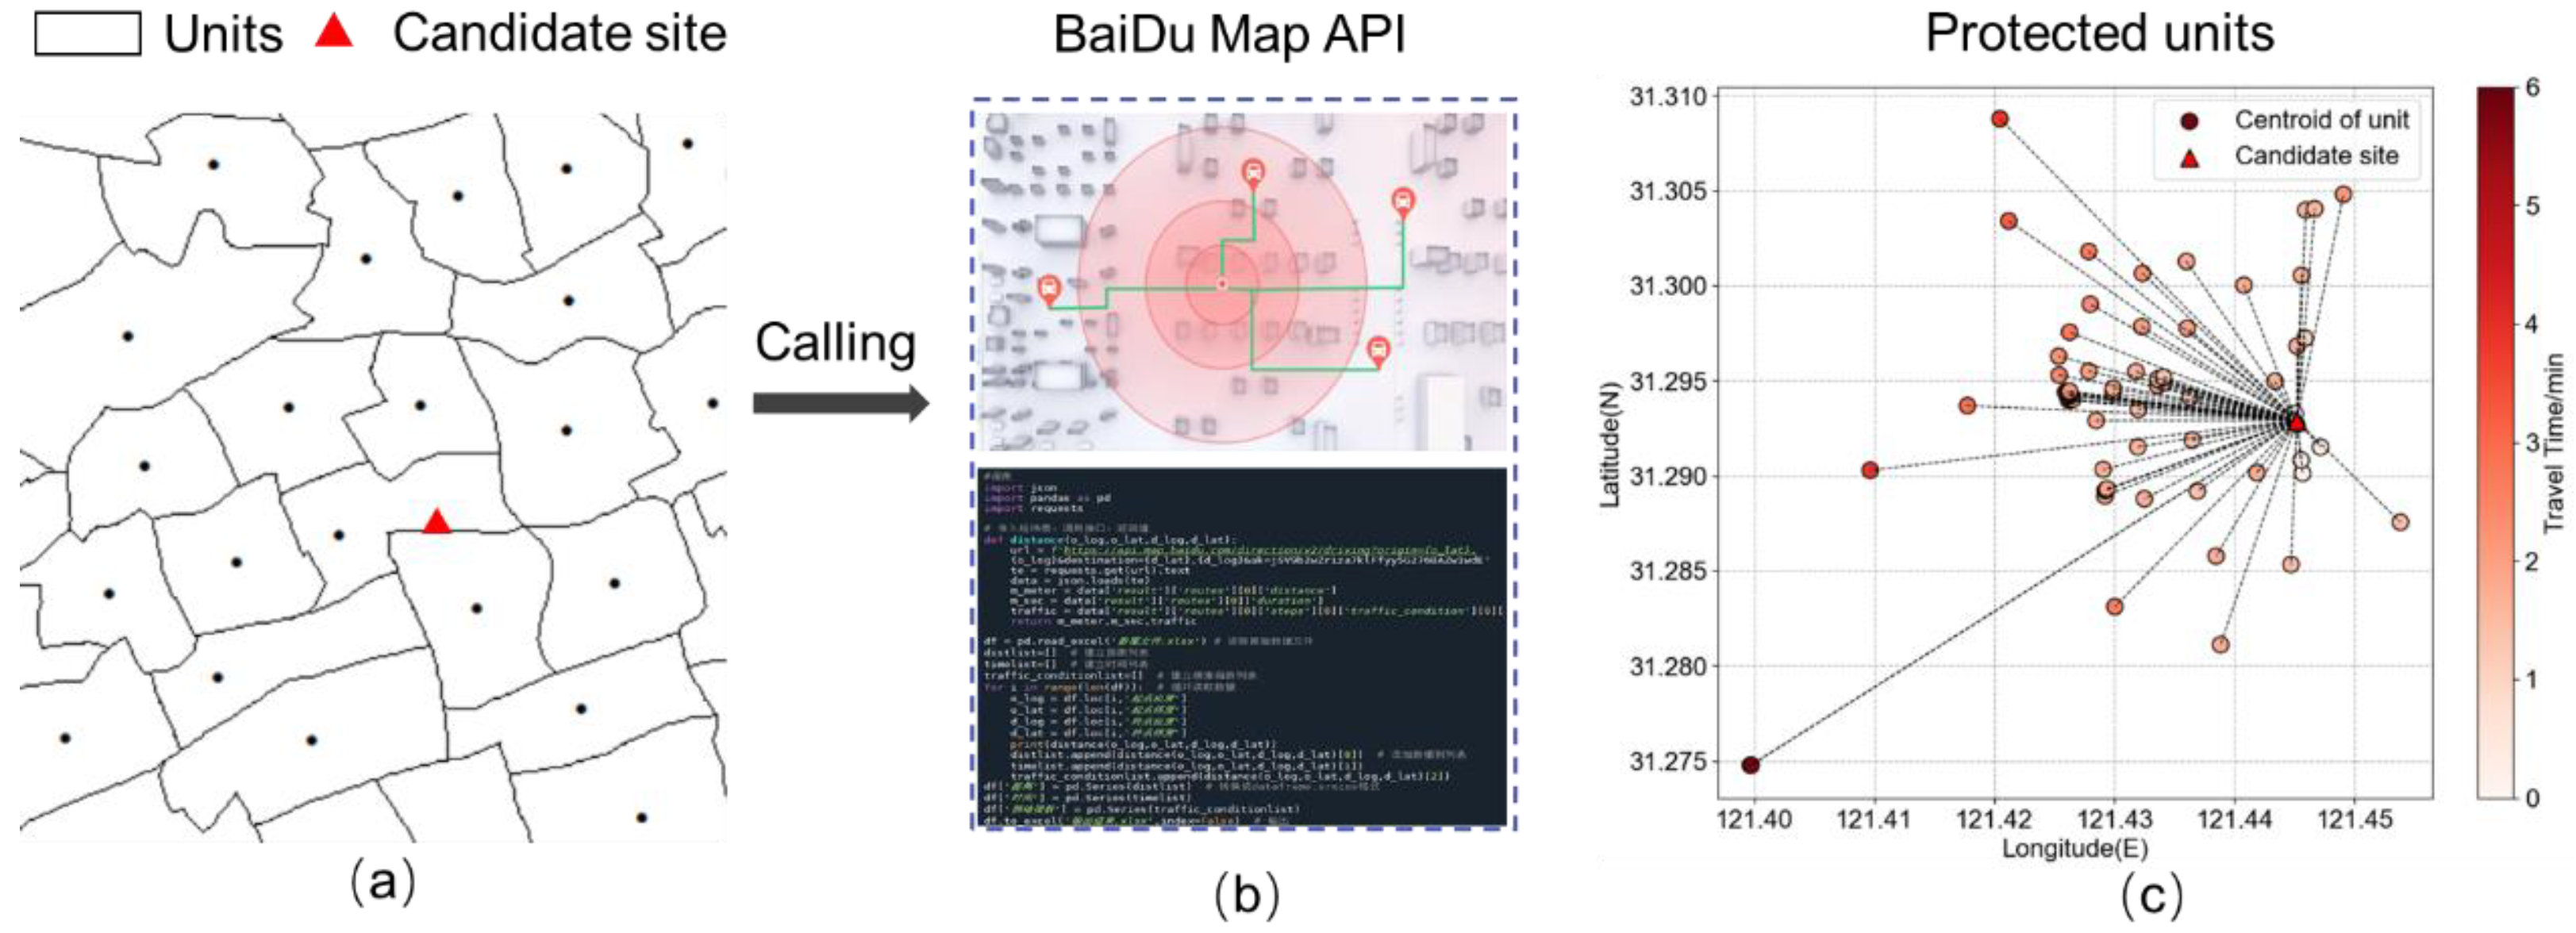
The risk assessment indicator system comprised six subsystems for spatial location, land attributes, population density, plot ratio, GDP density, and fire incident density. According to the method of calculation for each factor, the scores of all research units could be obtained. Spatial location, population density, and GDP density were obtained from the Shanghai Statistical Yearbook [29]. Land attributes and building volume ratios were derived from the publicly available National Spatial Geographical Information Database [30]. Incident density was provided by the Command Center of Shanghai Fire and Rescue Department. The research object considered the entire administrative division space of Shanghai. The area units were divided based on the urban road network, up to 19,140 units.
Figure 5a illustrates the scores of the factors across the entire spatial units; the detailed scores of all factors can be found in Appendix A. Taking fire incident density as an example, the risk score exhibited distinct spatial characteristics. The highest scores, up to 100 points, were concentrated in the core urban area within the inner ring road. This area also corresponded to the highest GDP and population density risk scores. In contrast, the risk scores were much lower along the outer ring and suburban areas, with the minimum score being only 20 points. This also resulted in the risk classification following a similar trend. Figure 5b further shows the specified risk classification of all the research units in Shanghai, divided into levels A, B, C, or D according to the composite score based on the preset proportions (Table 1) of all parameters. Level A was qualified for scoring over 73.62 points, with only three units in the core area of Shanghai. Most of the areas within the outer ring region were classified as level B, with scores ranging from 46.23 to 73.62 points. The other suburban areas outside the outer ring were all below 46.23 or 36.27 points, categorizing them as level C or D.

3.2. Travel Time

As mentioned in Section 2.1, the candidate sites were selected from the central regions that met both risk classification and response time criteria. Constrained by the segmentation of the map, a total of 5000 candidate points were randomly selected along urban roads. These candidate points were placed as close as possible to road intersections to ensure efficient emergency responses. The routing API interface of Baidu Maps was utilized to obtain more realistic travel routes and times for fire and rescue operations. A code that could retrieve real travel routes and times between each protected unit and candidate fire station point was programmed. As illustrated in Figure 6, for each candidate site, the program based on Baidu Map API could swiftly determine the travel time of the units with different risk classifications based on street distribution. It is important to note that the central points in Figure 6c were simplified as the estimated travel time for the entire unit, serving as the foundation for site selection evaluation.

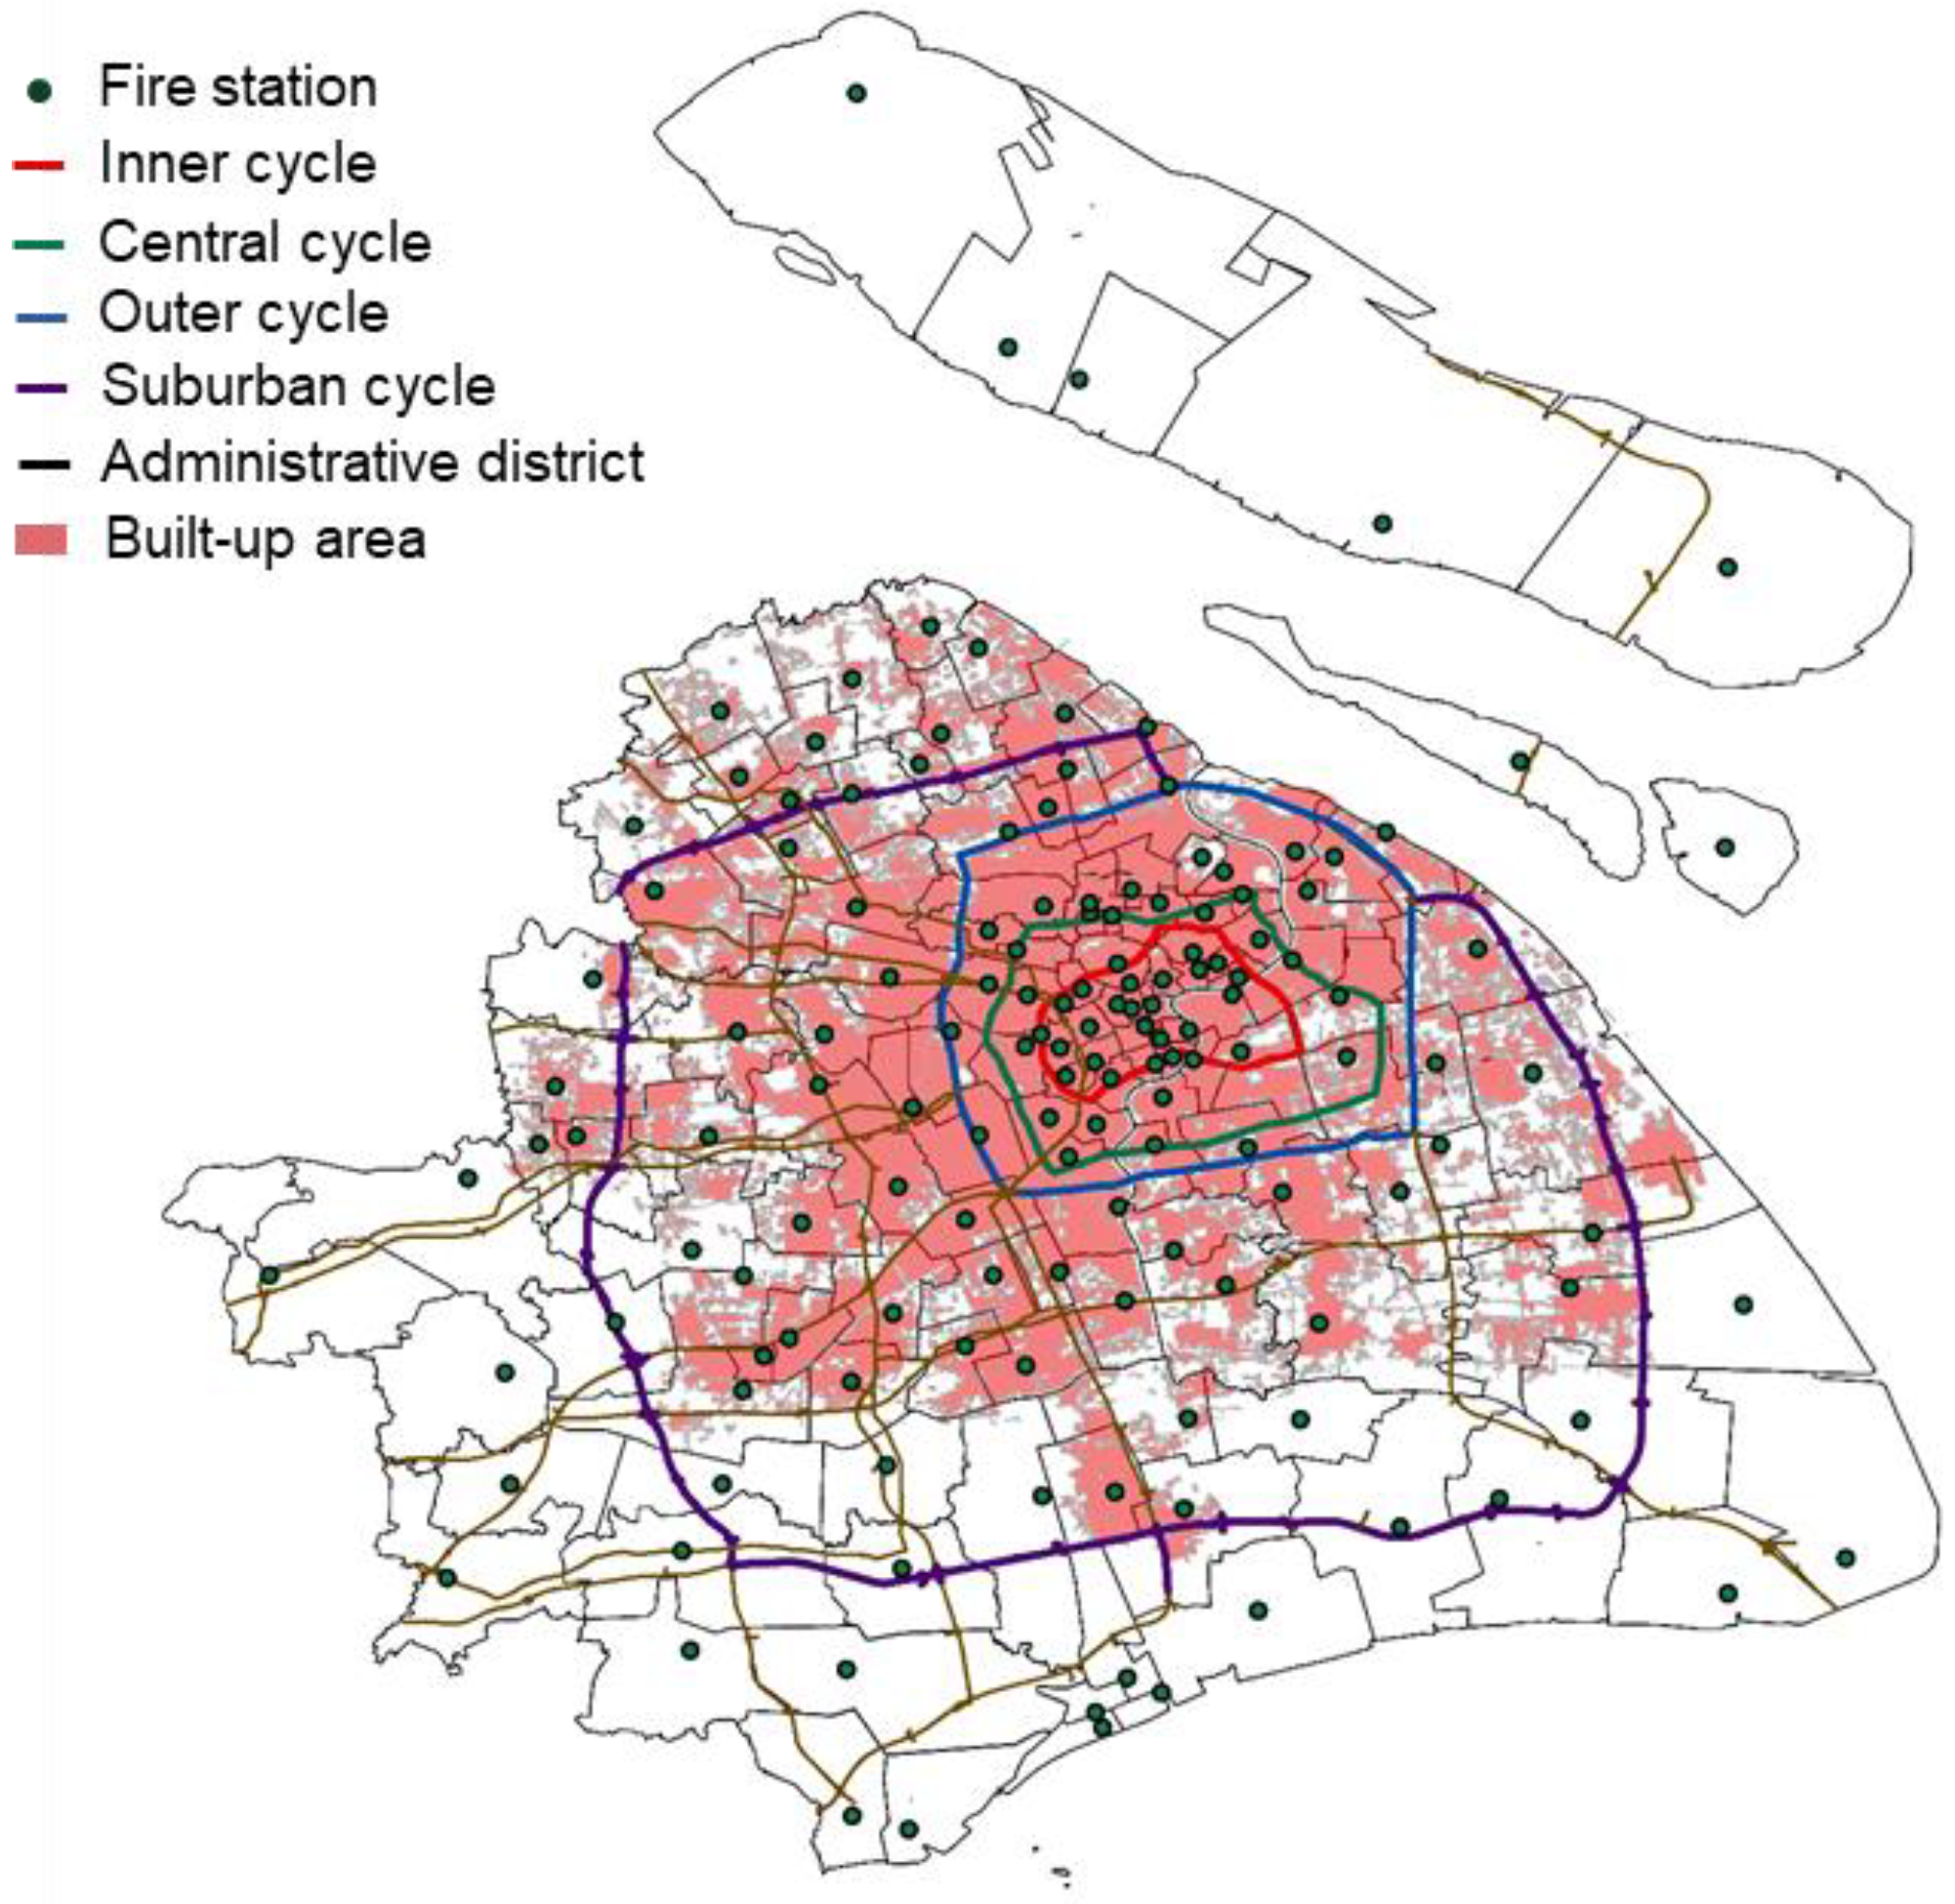
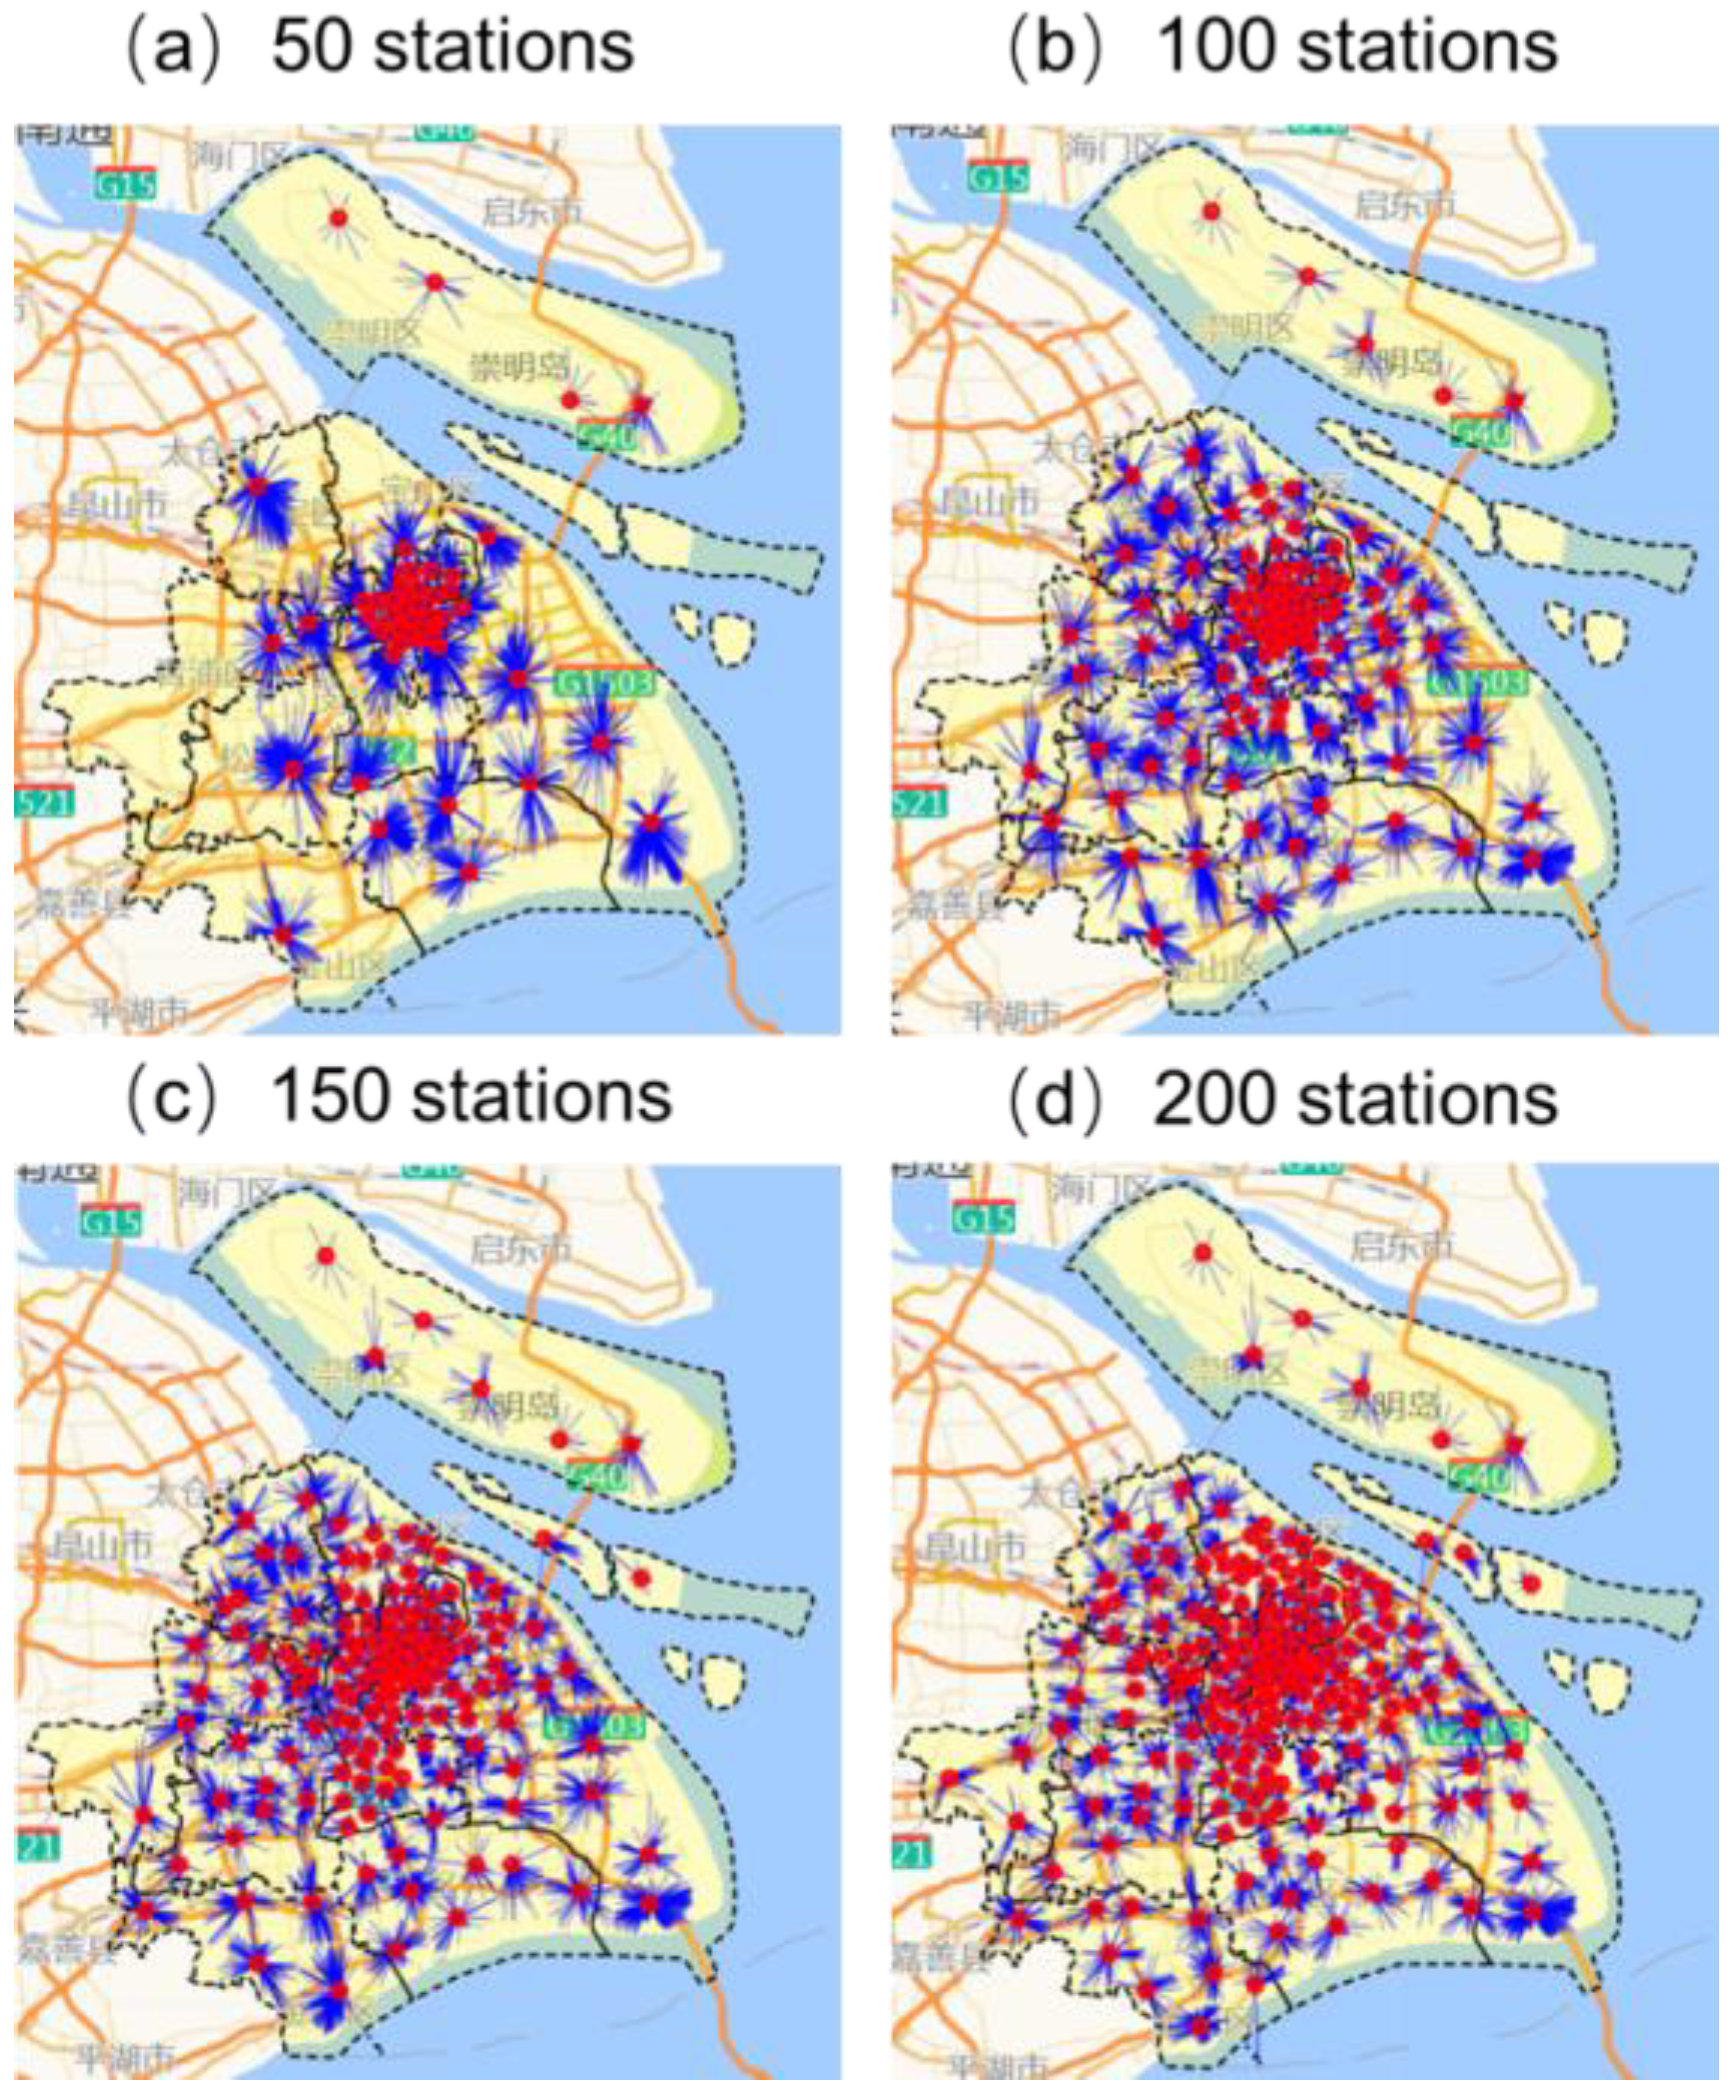
3.3. Optimized Site Selection

According to Section 3.1 and Section 3.2, the risk distribution and actual travel distances needed to be calculated. The number of calculations for travel distance was around 95.7 million for 19,140 protected units and 5000 candidate fire station points, which was massive. Gurobi 9.1.2 [31] academic version was used to solve the category of a typical integer linear programming problem, which was easy to obtain.
In this study, the optimal siting for fire stations was determined for six different scenarios by employing the methods mentioned in Section 3.2. The optimization object was set as 50, 100, 150, 200, 250, and 300 stations. Figure 7 illustrates the layout and coverage area of the various objective fire stations calculated by Gurobi. The points represent the optimized locations of fire stations for the specified quantity targets. The purple solid lines indicate the connections between the fire stations and the centers of the protected areas. The coverage area expanded with the increase in the number of constructed stations. All administrative districts could not be covered by only 50 stations, due to which certain areas in Chongming and Pudong were left.
Figure 8 further shows the response coverage rate and average response time for six different scenarios calculated by the model. Figure 8a illustrates the response coverage rate of four levels of risk units and overall and cross-response coverage rates. The response coverage rate of four risk classifications is the percentage of units that met the travel time requirements in Table 2 for all areas. The average response coverage rate is the average of four response coverage rates. The cross-response rate is the percentage of repeated cross-sections of all units. The model prioritized covering areas with A-classification risk, followed by B, C, and D-level areas when a certain number of stations was given. As the number of stations increased from 50 to 100, the response coverage rate for B- and C-level areas rapidly rose, with slight increases in A- and D-level areas. When the number of stations reached 100, the overall response coverage rate was already close to 90%. With more than 150 stations, the response coverage rate approached 100% and the marginal effect decreased significantly. The cross-response coverage rate continued to increase as the number of stations increased, showing the serious wastage of the existing fire stations. Also, increasing the number of stations from 0 to 150 led to a decrease in the average travel time, as shown in Figure 8b. However, when the number of stations exceeded 150, the rate of decline slowed down and essentially remained unchanged. Therefore, it can be concluded that the re-planning of fire station siting in Shanghai should include around 150 stations.

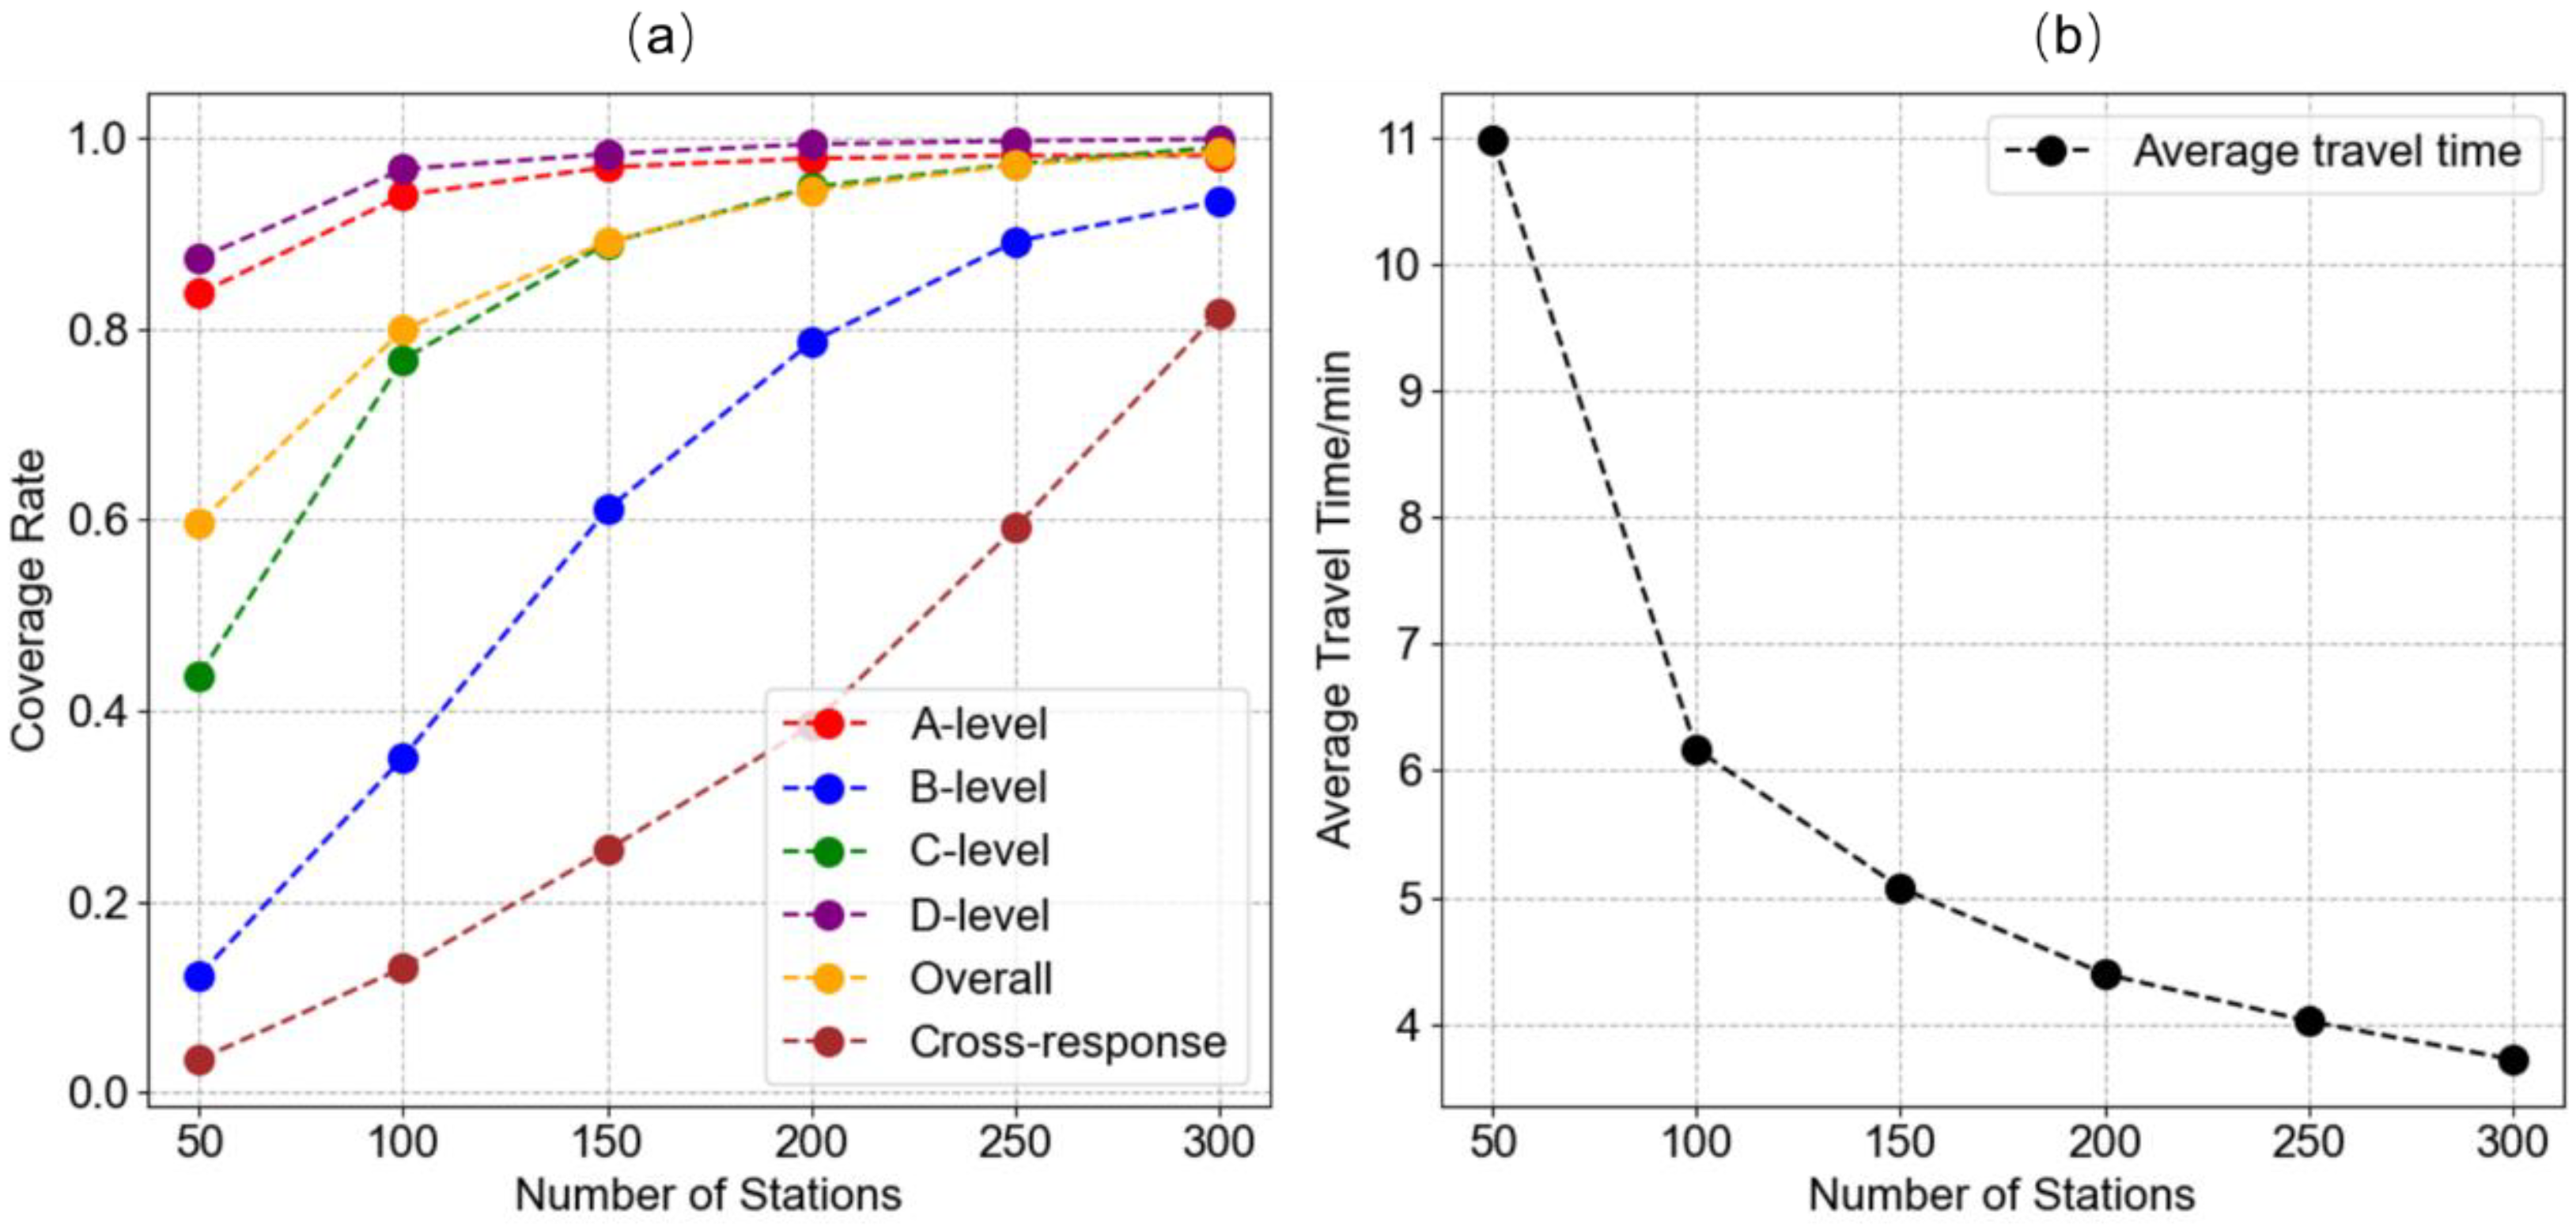
3.4. Evaluation and Discussion

A comparative analysis was also conducted on the workload of the existing 152 fire stations and the 150 optimal fire station locations obtained in this study. In our former research, we obtained the distribution of all incidents in Shanghai in 2022. Based on the sites of 150 stations in the model, the counts of incidents in protected units of each station could be measured. Figure 9 shows the annual incidents in different jurisdictions and the counts of fire stations for different incident ranges after the re-planning. Compared to Figure 2, the number of incidents exceeding 1000 throughout the year was reduced to 0. Additionally, the number of fire stations in areas with less than 200 incidents per year was reduced to 19. Most fire station jurisdictions encompassed an area below 50 km2. There were no coverage areas with excessively small or extremely large areas, resulting in a more balanced distribution of fire resources.
To assess the level of uniformity in the incident distribution of the station placement scheme, the unevenness ( U ) of the station deployment load was defined as
U = i = 1 N ( x i x ¯ ) 2 n
where x i is the annual number of incidents in the jurisdiction of fire station i and x ¯ is the average annual number of incidents in the fire station’s jurisdiction.
The unevenness (U) represents the degree of unevenness in the fire station deployment load, where a higher U value indicates a higher level of imbalance and less optimal fire station placement. The unevenness of the existing fire station deployment in Shanghai was U = 327.1, while the unevenness of the proposed scheme with 150 fire stations was U = 200.3. This indicates a significant improvement in the level of imbalance in fire station deployment.
It should be noted that this paper was intended to apply a risk assessment-based model for fire station planning. Given the urbanization characteristics of Shanghai, the risk assessment system only selected typical parameters for which there are accurate and available data. Factors such as topography and spatial roads could be considered to develop a more comprehensive model in different regions.

4. Conclusions

This study proposed a comprehensive fire station location model based on risk assessment and the traditional MCLP model. The developed model was utilized and evaluated by taking Shanghai as an example. The spatial location, land attributes, population density, building volume ratio, and incident density of Shanghai were collected to build a four-level risk classification system. Risk classification parameters were added as tuning parameters to optimize the objectives of the MCLP model. Baidu Map API and Gurobi 9.1.2 were used to calculate coverage areas and site layout.
Based on the four-level risk classifications system, 5000 candidate fire station points were determined and 50, 100, 150, 200, 250, and 300 stations were then selected to assess the possibility of constructing fire stations. The results show that increasing the number of stations from 0 to 150 will lead to a decrease in average travel times. However, when the number of stations exceeds 150, the rate of decline slows down and essentially remains unchanged. The overall response coverage rate is already close to 90% when the number of stations reaches 100. The re-planning of fire station siting in Shanghai should be around 150. With the re-planning of existing fire stations, there were no coverage areas with excessively small areas, resulting in a more balanced distribution of fire resources. The objective model with risk assessment will provide guiding principles to maximize the coverage of response areas for various needs and scenarios.

Author Contributions

Conceptualization, Q.H.; methodology, Q.H., L.X., Y.Y. and P.D.; software, Q.H., M.L., and P.D.; validation, Q.H., L.X., Y.Y. and P.D.; formal analysis, Q.H., L.X., Y.Y. and P.D.; investigation, Q.H., P.D. and M.L.; resources, L.X. and Y.Y.; data curation, M.L.; writing—original draft preparation, Q.H.; writing—review and editing, P.D.; visualization, Q.H. and P.D.; supervision, Q.H. and P.D.; project administration, Q.H., L.X., Y.Y. and P.D.; funding acquisition, Q.H. and P.D. All authors have read and agreed to the published version of the manuscript.

Funding

This work was funded by the National Fire and Rescue Administration Technology Plan Project (2020XFLR40, 2022XFLR32) and the Shanghai Sailing Program (22YF1452400).

Institutional Review Board Statement

Not applicable.

Informed Consent Statement

Not applicable.

Data Availability Statement

Our self-built dataset will be made publicly available after publication.

Acknowledgments

We are thankful for the data support from the Command Center of Shanghai Fire and Rescue Department.

Conflicts of Interest

The authors declare no conflicts of interest.

Appendix A

Figure A1 illustrates the detailed scores of all factors according to the calculation method mentioned in Section 3.1 across all spatial units. It should be noted that the GDP density (A5) could only be obtained at the district or county level, which was considered to be equivalent to that in specified units.
Figure A1. The scores of (a) spatial location (A1), (b) land attributes (A2), (c) population density (A3), and (d) building volume ratio (A4) in Shanghai.
Applsci 14 02052 g0a1

References

  1. Denney, D. Risk and Society; Sage: New York, NY, USA, 2005. [Google Scholar]
  2. Ailani, R.S.; Bhatt, J.D. Analysis of Fire Station Infrastructure using GIS and Planning Proposal: A Case of Surat City. Int. J. Mod. Dev. Eng. Sci. 2022, 1, 28–29. [Google Scholar]
  3. Yao, J.; Zhang, X.; Murray, A.T. Location optimization of urban fire stations: Access and service coverage. Comput. Environ. Urban. Syst. 2019, 73, 184–190. [Google Scholar] [CrossRef]
  4. Celik Turkoglu, D.; Erol Genevois, M. A comparative survey of service facility location problems. Ann. Oper. Res. 2020, 292, 399–468. [Google Scholar] [CrossRef]
  5. Reilly, J.M.; Mirchandani, P.B. Development and application of a fire station placement model. Fire Technol. 1985, 21, 181–198. [Google Scholar] [CrossRef]
  6. Hakimi, S.L. Optimum locations of switching centers and the absolute centers and medians of a graph. Oper. Res. 1964, 12, 450–459. [Google Scholar] [CrossRef]
  7. Farahani, R.Z.; Asgari, N.; Heidari, N.; Hosseininia, M.; Goh, M. Covering problems in facility location: A review. Comput. Ind. Eng. 2012, 62, 368–407. [Google Scholar] [CrossRef]
  8. Toregas, C.; ReVelle, C. Optimal Location under Time or Distance Constraints; Papers of the Regional Science Association; Springer: Berlin/Heidelberg, Germany, 1972; Volume 28, pp. 131–143. [Google Scholar]
  9. Church, R.; ReVelle, C. The Maximal Covering Location Problem; Papers of the Regional Science Association; Springer: Berlin/Heidelberg, Germany, 1974; Volume 32, pp. 101–118. [Google Scholar]
  10. Çatay, B. Siting new fire stations in Istanbul: A risk-based optimization approach. OR Insight 2011, 24, 77–89. [Google Scholar] [CrossRef]
  11. Aktaş, E.; Özaydın, Ö.; Bozkaya, B.; Ülengin, F.; Önsel, Ş. Optimizing fire station locations for the Istanbul metropolitan municipality. Interfaces 2013, 43, 240–255. [Google Scholar] [CrossRef]
  12. Nyimbili, P.H.; Erden, T. GIS-based fuzzy multi-criteria approach for optimal site selection of fire stations in Istanbul, Turkey. Socioecon. Plann Sci. 2020, 71, 100860. [Google Scholar] [CrossRef]
  13. Murray, A.T.; Tong, D.; Grubesic, T.H. Spatial optimization: Expanding emergency services to address regional growth and development. In Studies in Applied Geography and Spatial Analysis: Addressing Real World Issues; Edward Elgar Publishing: Cheltenham, UK, 2012; p. 109. [Google Scholar]
  14. Murray, A.T. Optimising the spatial location of urban fire stations. Fire Saf. J. 2013, 62, 64–71. [Google Scholar] [CrossRef]
  15. Chevalier, P.; Thomas, I.; Geraets, D.; Goetghebeur, E.; Janssens, O.; Peeters, D.; Plastria, F. Locating fire stations: An integrated approach for Belgium. Socioecon. Plann Sci. 2012, 46, 173–182. [Google Scholar] [CrossRef]
  16. Wu, C.; Li, C.; Ouyang, L.; Xiao, H.; Wu, J.; Zhuang, M.; Bi, X.; Li, J.; Wang, C.; Song, C.; et al. Spatiotemporal evolution of urbanization and its implications to urban planning of the megacity, Shanghai, China. Landsc. Ecol. 2023, 38, 1105–1124. [Google Scholar] [CrossRef]
  17. Ming, J.; Richard, J.-P.P.; Qin, R.; Zhu, J. Distributionally robust optimization for fire station location under uncertainties. Sci. Rep. 2022, 12, 5394. [Google Scholar] [CrossRef]
  18. Jia, H.; Ordonez, F.; Dessouky, M.M. Solution approaches for facility location of medical supplies for large-scale emergencies. Comput. Ind. Eng. 2007, 52, 257–276. [Google Scholar] [CrossRef]
  19. Wan Jusoh, W.N.; Tharima, A.F.; Ghani, W.; Mohamad Lukman, N.H.; Visvasathan, S.; Shamsudin, M.H.; Mahmud Zuhudi, N.Z.; Mohd Nur, N. Initial assessment of fire response time between different categories of fire stations in Malaysia. Fire 2022, 6, 6. [Google Scholar] [CrossRef]
  20. Martín-Fernández, S.; Martínez-Falero, E.; Peribáñez, J.R.; Ezquerra, A. GIS-based simulated annealing algorithm for the optimum location of fire stations in the madrid region, Spain: Monitoring the collapse index. Appl. Sci. 2021, 11, 8414. [Google Scholar] [CrossRef]
  21. Anderson-Bell, J.; Schillaci, C.; Lipani, A. Predicting non-residential building fire risk using geospatial information and convolutional neural networks. Remote Sens. Appl. 2021, 21, 100470. [Google Scholar] [CrossRef]
  22. Silva, D.; Rodrigues, H.; Ferreira, T.M. Assessment and Mitigation of the Fire Vulnerability and Risk in the Historic City Centre of Aveiro, Portugal. Fire 2022, 5, 173. [Google Scholar] [CrossRef]
  23. Available online: https://www.mohurd.gov.cn/file/old/2017/20171017/W020171017021316.pdf (accessed on 1 January 2024).
  24. National Fire Protection Association (NFPA). NFPA 1710, Standard for the Organization and Deployment of Fire Suppression Operations, Emergency Medical Operations, and Special Operations to the Public by Career Fire Departments. Available online: https://www.nfpa.org/codes-and-standards/nfpa-1710-standard-development/1710?l=124 (accessed on 1 January 2024).
  25. Zolekar, R.B. Integrative approach of RS and GIS in characterization of land suitability for agriculture: A case study of Darna catchment. Arab. J. Geosci. 2018, 11, 780. [Google Scholar] [CrossRef]
  26. Dong, X.; Li, Y.; Pan, Y.; Huang, Y.; Cheng, X. Study on urban fire station planning based on fire risk assessment and GIS technology. Procedia Eng. 2018, 211, 124–130. [Google Scholar] [CrossRef]
  27. Lau, C.K.; Lai, K.K.; Lee, Y.P.; Du, J. Fire risk assessment with scoring system, using the support vector machine approach. Fire Saf. J. 2015, 78, 188–195. [Google Scholar] [CrossRef]
  28. Wang, Y.; Hou, L.; Li, M.; Zheng, R. A novel fire risk assessment approach for large-scale commercial and high-rise buildings based on fuzzy analytic hierarchy process (Fahp) and coupling revision. Int. J. Environ. Res. Public Health 2021, 18, 7187. [Google Scholar] [CrossRef] [PubMed]
  29. Available online: https://tjj.sh.gov.cn/tjnj/20230206/804acea250d44d2187f2e37d2e5d36ba.html (accessed on 1 January 2024).
  30. Chenyang, L.; Xinchun, W.; Chunzhen, H.; Xuan, W.; Zhaoyu, K.; Xiaolei, L. China national digital geological map (public version at 1, 200 000 Scale) spatial database. Geol. China 2019, 46, 1–10. [Google Scholar]
  31. Bixby, B. The gurobi optimizer. Transp. Res. Part B 2007, 41, 159–178. [Google Scholar]
Figure 1. The distribution of fire stations and the extent of the built-up area in Shanghai, 2022.
Applsci 14 02052 g001
Figure 2. (a) The distribution of jurisdictional areas and annual incidents for all fire stations in 2022 and (b) the counts of fire stations for different incident ranges.
Applsci 14 02052 g002
Figure 3. The framework of the optimization siting model based on fire risk classification.
Applsci 14 02052 g003
Figure 4. Impact of different response time requirements on coverage area for different risk zones.
Applsci 14 02052 g004
Figure 5. (a) The scores of the fire incident density and (b) 4-level risk classification in Shanghai.
Applsci 14 02052 g005
Figure 6. The schematic of (a) the units and candidate site, (b) the program using Baidu Map API to calculate the travel time of the protected units and (c) the results of one selected protected units.
Applsci 14 02052 g006
Figure 7. The layout and coverage area of the various objective fire stations.
Applsci 14 02052 g007
Figure 8. (a) Response coverage rate and (b) average travel time at different numbers of fire stations.
Applsci 14 02052 g008
Figure 9. (a) The annual incidents in different jurisdictions and (b) the counts of fire stations for different incident ranges after the re-planning.
Applsci 14 02052 g009
Table 1. The risk assessment indicator system.
Factors
( A i )
Indicator NameMethod of CalculationScore Count
( α i )
A1Spatial locationAssigning a value of 100 to the central urban area, a value of 60 to the main urban area, and a value of 30 to other regions.0.12
A2Land attributesCurrent land use attributes (residential land assigned a value of 60, administrative office land assigned a value of 80, commercial service land assigned a value of 100, etc.).0.15
A3Population densityPopulation within the jurisdiction divided by the total area of the region (in square kilometers).0.27
A4Building volume ratioTotal area of above-ground buildings divided by total area of the region (in square kilometers).0.15
A5GDP densityTotal GDP of the region (in hundred million CNY) divided by the total area of the region (in square kilometers).0.10
A6Incident densityFire incident density within the region over 12 months.0.21
Table 2. Travel and response times for different risk classifications.
Risk ClassificationTravel Time
(min)
Risk Classification
(min)
A54
B87
C1514
D2019
Table 3. Area correction coefficients for different risk classifications.
Risk ClassificationsTravel Time
(min)
Area ProportionRisk Classifications
A41622.56
B7497.37
C141961.84
D193611.00
Disclaimer/Publisher’s Note: The statements, opinions and data contained in all publications are solely those of the individual author(s) and contributor(s) and not of MDPI and/or the editor(s). MDPI and/or the editor(s) disclaim responsibility for any injury to people or property resulting from any ideas, methods, instructions or products referred to in the content.

